Embed Size (px)
Citation preview
Amman Stock Exchange Weekly Report - Week Ended July 2nd 2009
StockMarketHighlightsThis Week
Last Week
WTD Change
YTD Change
GeneralIndex(Weighted) 5,981.72 5,853.70 2.19% (4.19%)
GeneralIndex(FreeFloat) 2,742.26 2,716.36 0.95% (0.59%)
This Week
Last Week
WTD Change
ValueTraded(JDmillions) 183.7 177.2 3.67%
VolumeTraded(millions) 106.2 100.3 5.88%
TheWeek’sTopGainersandLosers
Company Current Close
Last Close
% Change
UnionLandDevelopmentCorp(ULDC) 1.65 1.41 17.02%
JordanPhosphateMines(JOPH) 21.60 19.25 12.21%
InternationalforMedicalInvest(ICMI) 1.48 1.33 11.28%
TheIndustrialCommercial&Agricul(ICAG) 0.80 0.72 11.11%
Al-TahdithforRealEstateInvest(THDI) 0.98 0.89 10.11%
FirstJordanInvestment(FRST) 0.43 0.51 (15.69%)
WinterValleyTourismInvestment(WIVA) 1.05 1.27 (17.32%)
FutureArabInvestment(FUTR) 0.57 0.69 (17.39%)
ArabRealEstateDevelopment(ARED) 0.72 0.90 (20.00%)
JordanCentral(JOCE) 2.23 2.85 (21.75%)
TheWeek’sMostActiveStocksinNumberof SharesTraded*Company Volume of Shares
UnitedArabInvestors(UAIC) 10,183,867
AlTajamouatforCateringandHousing(JNTH) 7,351,054
TaameerJordanHoldings(TAMR) 7,142,196
CapitalBankof Jordan(EXFB) 6,786,660
DarwishAl-Khalili&Sons(DKHS) 4,879,429
TheWeek’sMostActiveStocksinValueof SharesTraded*Company Value of Shares (JD)
AlTajamouatforCateringandHousing(JNTH) 16,628,673
ArabBank(ARBK) 11,540,011
SpecialisedInvestmentCompounds(SPIC) 10,951,665
CapitalBankof Jordan(EXFB) 10,931,610
Jordan Petroleum Refinery (JOPT) 8,012,406*excludingblockdeals
1
MARKET WATCH
Market Performance
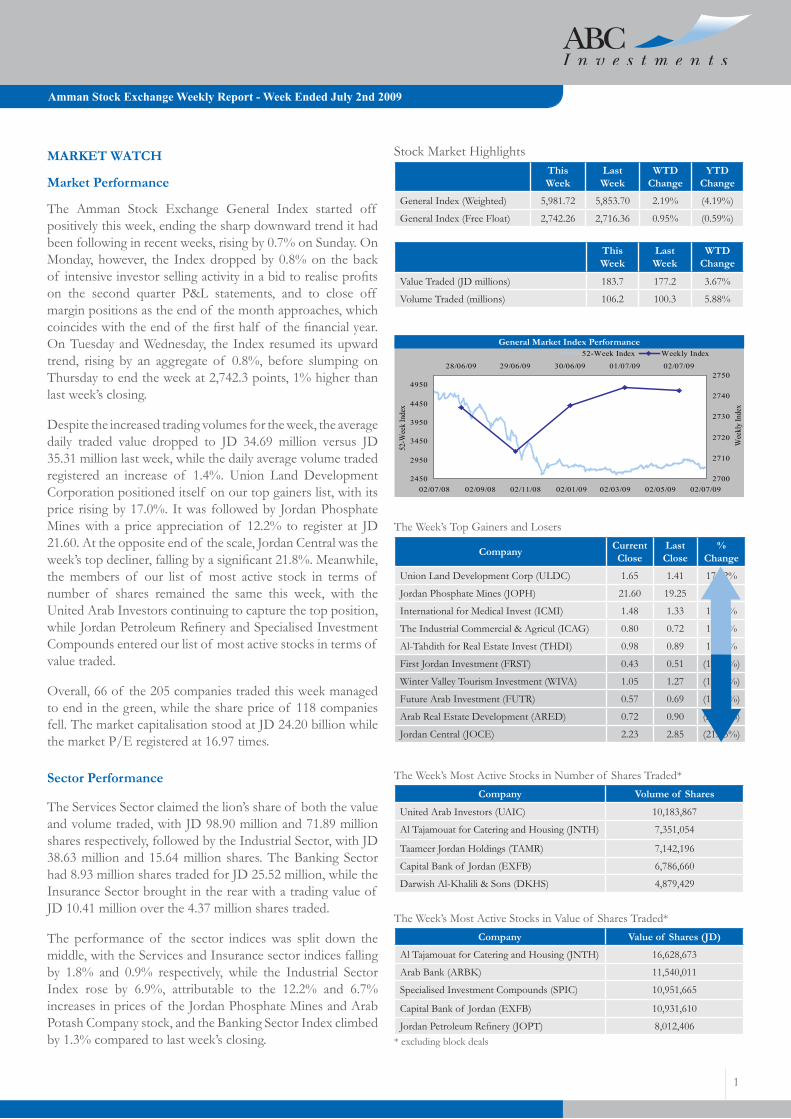
The Amman Stock Exchange General Index started off positivelythisweek,endingthesharpdownwardtrendithadbeenfollowinginrecentweeks,risingby0.7%onSunday.OnMonday,however, the Indexdroppedby0.8%on thebackof intensive investor selling activity in a bid to realise profits on the second quarter P&L statements, and to close off marginpositionsastheendof themonthapproaches,whichcoincides with the end of the first half of the financial year. OnTuesdayandWednesday, the Index resumed itsupwardtrend, rising by an aggregate of 0.8%, before slumping onThursdaytoendtheweekat2,742.3points,1%higherthanlastweek’sclosing.Despitetheincreasedtradingvolumesfortheweek,theaveragedaily traded value dropped to JD 34.69 million versus JD35.31millionlastweek,whilethedailyaveragevolumetradedregistered an increase of 1.4%. Union Land DevelopmentCorporationpositioneditself onourtopgainerslist,withitspricerisingby17.0%.ItwasfollowedbyJordanPhosphateMineswith aprice appreciationof 12.2% to register at JD21.60.Attheoppositeendof thescale,JordanCentralwastheweek’s top decliner, falling by a significant 21.8%. Meanwhile, the members of our list of most active stock in terms of number of shares remained the same this week, with theUnitedArabInvestorscontinuingtocapturethetopposition,while Jordan Petroleum Refinery and Specialised Investment Compoundsenteredourlistof mostactivestocksintermsof valuetraded.
Overall,66of the205companiestradedthisweekmanagedtoendinthegreen,whilethesharepriceof 118companiesfell.ThemarketcapitalisationstoodatJD24.20billionwhilethemarketP/Eregisteredat16.97times.
Sector Performance
TheServicesSectorclaimedthelion’sshareof boththevalueandvolumetraded,withJD98.90millionand71.89millionsharesrespectively,followedbytheIndustrialSector,withJD38.63millionand15.64million shares.TheBankingSectorhad8.93millionsharestradedforJD25.52million,whiletheInsuranceSectorbroughtintherearwithatradingvalueof JD10.41millionoverthe4.37millionsharestraded.
The performance of the sector indices was split down themiddle,withtheServicesandInsurancesectorindicesfallingby 1.8% and 0.9% respectively, while the Industrial SectorIndex rose by 6.9%, attributable to the 12.2% and 6.7%increasesinpricesof theJordanPhosphateMinesandArabPotashCompanystock,andtheBankingSectorIndexclimbedby1.3%comparedtolastweek’sclosing.
2450
2950
3450
3950
4450
4950
02/07/08 02/09/08 02/11/08 02/01/09 02/03/09 02/05/09 02/07/09
52-W
eek
Inde
x
2700
2710
2720
2730
2740
275028/06/09 29/06/09 30/06/09 01/07/09 02/07/09
Wee
kly
Inde
x
52-Week Index Weekly IndexGeneral Market Index Performance
Amman Stock Exchange Weekly Report - Week Ended July 2nd 2009
Block Trades
Blocktradeshavemadeacomebackthisweek,withtenblockdealsof anaggregatevalueof JD10.21millionexecutedover5.37millionshares,thelargestof whichwereonthestockof AhliaEnterprises(ABLA),whereby1.35millionsharesweretradedforJD3.00million.Al-TajamouatforCateringandHousing(JNTH)hadthreeblocktradesexecutedonitsstockthisweekforatotalvalueof JD2.19millionoveronemillionshares.RoyalJordanian(RJAL)andSpecialisedInvestmentCompounds(SPIC)eachhadoneblockdeal,tothevaluesof JD1.29millionandJD1.01million,respectively,whileArab Corp (ARED) had 1.5 million shares traded at a price of JD 0.78per share. The remaining twodealswereon theArabGerman Insurance(AGICC) and Darkom (DRKM), comprising 259.83 thousand shares and300.00thousandshares,respectively.
CORPORATE NEWS
The Arab Bank (ARBK) reassured its investors that the loans andcredit facilities granted to the Saudi Goseibi Group and Saad Groupweregrantedinaccordancewithapprovedcredittermsandbackedbycollateralsandguarantees,andthereforetheindebtednessof theGroupsshould not effect the Bank’s financial position and share price.
TheJordanAhliBank(JONB)isleadingaJD32millionsyndicatedloan,signedalongwiththeJordanKuwaitBank(JOKB),CairoAmmanBank(CABK),andJordanCommercialBank(JOCB),infavourof JordanAlAbyadFertilizersandChemicalsCompany.Thisloanwillbeutilisedforestablishmentof anindustrialcomplexfortheproductionof fertilisersandchemicals.
TheMinistryof IndustryandTradedapprovedthedecreaseof NationalSteelIndustry’s(NAST)paid-upcapitalfrom4millionshares/JDto2millionshares/JD.
MACROECONOMIC NEWS
The Kingdom’s trade deficit declined by 35% during the first four months of 2009toreachJD1.45billioncomparedtoJD2.23billionoverthesameperiodlastyear,primarilyasaresultof thedropinoilpricesovertheperiod,whiletheexport-to-importratioreached52%overthesameperiod,comparedto41.9%in2008.
Total credit facilities granted by licensed banks during the first five monthsof 2009reachedJD13.04billioncomparedtoJD12.87billionattheendof thepreviousmonth.Thisriseinfacilitiesduringthemonthof Mayoffsetthedeclinewitnessedsincethestartof theyearfrom1.4%to0.01%.
Excess reservesof licensedbanksheld at theCentralBank, includingovernightwindowdeposits,reachedJD3.33billionasof Sundayof thisweek,whilerequiredreservesreachedJD1.02billion.
The Central Bank of Jordan announced the issuance of three-yeartreasurybondstothevalueof JD50million.
•
•
•
•
•
•
•
Main Sector Trading Information
Sector Volume Value (JD)
Banking 8,925,418 25,520,996
Insurance 4,365,546 10,408,638
Services 71,891,360 98,898,888
Industrial 15,641,772 38,633,884
New Sector Classification Indices
Index This Week
Last Week
% Change
Banks 3,886.7 3,868.6 0.5%
Insurance 3,061.1 3,101.6 (1.3%)
FinancialServices 4,504.6 4,773.7 (5.6%)
RealEstate 3,974.8 4,054.2 (2.0%)
Financial 3,404.9 3,439.6 (1.0%)
HealthCareServices 787.6 750.3 5.0%
EducationalServices 2,644.1 2,640.8 0.1%
Hotels&Tourism 1,909.7 1,912.6 (0.2%)
Transportation 820.3 827.5 (0.9%)
Tech.&Communications 1,768.7 1,790.8 (1.2%)
Media 2,592.1 2,523.4 2.7%
Utilities&Energy 4,520.6 4,324.4 4.5%
CommercialServices 1,548.3 1,597.3 (3.1%)
Services 2,051.8 2,019.8 1.6%
Pharm.&MedicalIndustries 1,946.9 1,968.6 (1.1%)
ChemicalIndustries 1,435.9 1,426.2 0.7%
Paper&CartonIndustries 748.0 756.0 (1.1%)
Printing&Packaging 1,538.8 1,513.9 1.6%
Food&Beverage 1,825.7 1,829.7 (0.2%)
Tobacco 1,969.5 1,998.9 (1.5%)
Mining&Extract.Industries 5,158.4 4,841.7 6.5%
Engineering&Construction 2,241.7 2,337.9 (4.1%)
ElectricIndustries 5,603.8 5,627.4 (0.4%)
Textiles,Leather&Clothing 1,956.8 1,938.9 0.9%
Glass&CeramicIndustries 1,222.4 1,198.3 2.0%
Industries 2,960.8 2,850.6 3.9%
General Index 2,742.3 2,716.4 1.0%
2
Key International Indicators
Prices of Key Commodities
Commodity Price
BrentOil $70.9
Gold $937.4
Silver $13.7Source:Al-GhadNewspaper;Reuters
Main Currencies against the US Dollar
Currency Price
Euro 1.412
PoundSterling 1.648
JapaneseYen/USDollar 96.6
SwissFranc 0.92Source:Al-GhadNewspaper;Reuters
Amman Stock Exchange Weekly Report - Week Ended July 2nd 2009
Demandforsteelhasstabilisedinthelocalmarketforthefourthconsecutiveweek,whiledemandforcementdroppedby20%.
TheAgriculturalProductionIndexdeclinedby1.5%during2008comparedto2007,attributabletothe6.8%and28.9%respective drops in output from fruitful trees and field crops.
TheMinisterof PlanningandInternationalCorporationannouncedthattheUnitedStateshasapprovedanadditionalUSD150millioneconomicgranttobeofferedtotheKingdom.
TheMinisterof TradeandIndustryandhisCanadianCounterpartsignedonefreetradeagreementandthreecollaborationagreementstoincreaseinvestment,employmentandenvironmentalcooperationbetweenthetwocountries.
TheU.S.Trans-GlobaloilcompanyhasaddressedtheNationalResourceAuthorityof itsdesiretocompletetheconcessionagreementof oilexploitingintheDeadSeaareaindependentlyafterProcity’sannouncementof unwillingnesstocontinuetheexploitingoperationsinthearea.TheAuthority,inresponse,hasrequestedthatTrans-GlobalsubmitaUSD2millionfinancial guarantee in order to commence with the oil exploiting.
TheNationalElectricPowerCompanysignedaJD9millionagreementwithKorean“HySungCompany”,wherethelatterwillsupplytheCompanywithelectricalequipmentfortheManara,Samra,andEastAmmanelectricitygeneratingstations.
Jordan signed a JD 37 million loan guarantee agreement with the Kuwait Fund to finance the third phase expansion project of theSamraelectricitygeneratingstation.
The British “PSP” architectural company announced a JD 2 million joint venture project with Jordanian TechtonicArchitectural Solution Company to build the first factory of its kind in the Middle East for architectural systems.
His Majesty the King has declared the Ajloun area a new development zone area with an aim to benefit from its environmental, agriculturalandtouristicfeatures.Aplanwassetsuggestingestablishingtwentyfourtouristicprojectsthatwillhelpdevelopthearea.
TheAqabaSpecialEconomicZoneAuthority(ASEZA)isexpectingtodeliver,duringaperiodof threemonths,the2,100dunumsof landsurroundingthemainporttoAl-MaabarInternationalCompanyinordertocommencetheimplementationof thenewportdevelopmentproject.
EmaarInternationalJordanhascompleteddesigningthesecondphaseresidentialunitsof Al-SamarahDeadSeaResort.ThewholeprojectisexpectedtocostJD354million,whilethesecondphasewillconsistsof apartmentswithineightlow-risebuildings,accompaniedbyhotels,retailstores,andotherentertainmentfacilities.
TheSenateendorsedtherecommendationtoreducethe“culturetax”onmediaandnewspaperadvertisementrevenuesfrom5%to1%.
The Prime Minister confirmed that the Government will distribute 50% of the funds of investors involved in the fraudulent activityof brokeragecompaniesdealingininternationalboursesbytheendof July2009.
•
•
•
•
•
•
•
•
•
•
•
•
•
3
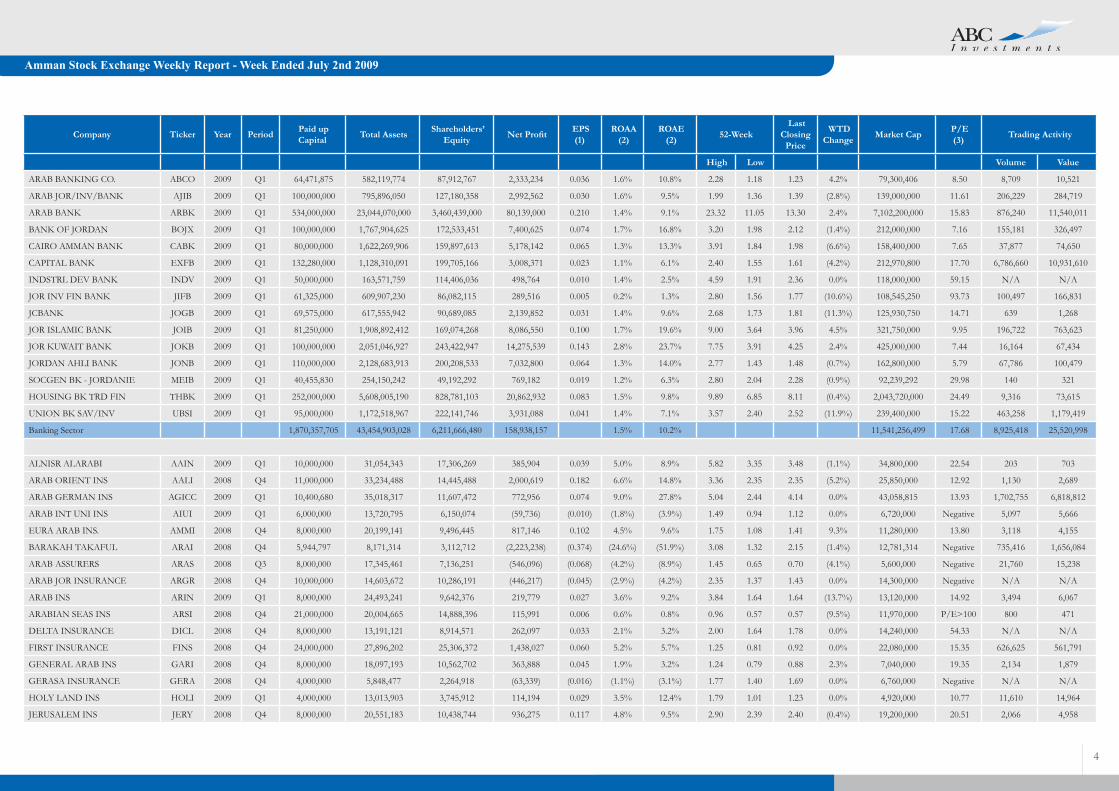
Amman Stock Exchange Weekly Report - Week Ended July 2nd 2009
Company Ticker Year Period Paid up Capital Total Assets Shareholders’
Equity Net Profit EPS(1)
ROAA (2)
ROAE (2) 52-Week
Last Closing
Price
WTD Change Market Cap P/E
(3) Trading Activity
High Low Volume Value
ARAB BANKING CO. ABCO 2009 Q1 64,471,875 582,119,774 87,912,767 2,333,234 0.036 1.6% 10.8% 2.28 1.18 1.23 4.2% 79,300,406 8.50 8,709 10,521
ARAB JOR/INV/BANK AJIB 2009 Q1 100,000,000 795,896,050 127,180,358 2,992,562 0.030 1.6% 9.5% 1.99 1.36 1.39 (2.8%) 139,000,000 11.61 206,229 284,719
ARAB BANK ARBK 2009 Q1 534,000,000 23,044,070,000 3,460,439,000 80,139,000 0.210 1.4% 9.1% 23.32 11.05 13.30 2.4% 7,102,200,000 15.83 876,240 11,540,011
BANK OF JORDAN BOJX 2009 Q1 100,000,000 1,767,904,625 172,533,451 7,400,625 0.074 1.7% 16.8% 3.20 1.98 2.12 (1.4%) 212,000,000 7.16 155,181 326,497
CAIRO AMMAN BANK CABK 2009 Q1 80,000,000 1,622,269,906 159,897,613 5,178,142 0.065 1.3% 13.3% 3.91 1.84 1.98 (6.6%) 158,400,000 7.65 37,877 74,650
CAPITAL BANK EXFB 2009 Q1 132,280,000 1,128,310,091 199,705,166 3,008,371 0.023 1.1% 6.1% 2.40 1.55 1.61 (4.2%) 212,970,800 17.70 6,786,660 10,931,610
INDSTRL DEV BANK INDV 2009 Q1 50,000,000 163,571,759 114,406,036 498,764 0.010 1.4% 2.5% 4.59 1.91 2.36 0.0% 118,000,000 59.15 N/A N/A
JOR INV FIN BANK JIFB 2009 Q1 61,325,000 609,907,230 86,082,115 289,516 0.005 0.2% 1.3% 2.80 1.56 1.77 (10.6%) 108,545,250 93.73 100,497 166,831
JCBANK JOGB 2009 Q1 69,575,000 617,555,942 90,689,085 2,139,852 0.031 1.4% 9.6% 2.68 1.73 1.81 (11.3%) 125,930,750 14.71 639 1,268
JOR ISLAMIC BANK JOIB 2009 Q1 81,250,000 1,908,892,412 169,074,268 8,086,550 0.100 1.7% 19.6% 9.00 3.64 3.96 4.5% 321,750,000 9.95 196,722 763,623
JOR KUWAIT BANK JOKB 2009 Q1 100,000,000 2,051,046,927 243,422,947 14,275,539 0.143 2.8% 23.7% 7.75 3.91 4.25 2.4% 425,000,000 7.44 16,164 67,434
JORDAN AHLI BANK JONB 2009 Q1 110,000,000 2,128,683,913 200,208,533 7,032,800 0.064 1.3% 14.0% 2.77 1.43 1.48 (0.7%) 162,800,000 5.79 67,786 100,479
SOCGEN BK - JORDANIE MEIB 2009 Q1 40,455,830 254,150,242 49,192,292 769,182 0.019 1.2% 6.3% 2.80 2.04 2.28 (0.9%) 92,239,292 29.98 140 321
HOUSING BK TRD FIN THBK 2009 Q1 252,000,000 5,608,005,190 828,781,103 20,862,932 0.083 1.5% 9.8% 9.89 6.85 8.11 (0.4%) 2,043,720,000 24.49 9,316 73,615
UNION BK SAV/INV UBSI 2009 Q1 95,000,000 1,172,518,967 222,141,746 3,931,088 0.041 1.4% 7.1% 3.57 2.40 2.52 (11.9%) 239,400,000 15.22 463,258 1,179,419
Banking Sector 1,870,357,705 43,454,903,028 6,211,666,480 158,938,157 1.5% 10.2% 11,541,256,499 17.68 8,925,418 25,520,998
ALNISR ALARABI AAIN 2009 Q1 10,000,000 31,054,343 17,306,269 385,904 0.039 5.0% 8.9% 5.82 3.35 3.48 (1.1%) 34,800,000 22.54 203 703
ARAB ORIENT INS AALI 2008 Q4 11,000,000 33,234,488 14,445,488 2,000,619 0.182 6.6% 14.8% 3.36 2.35 2.35 (5.2%) 25,850,000 12.92 1,130 2,689
ARAB GERMAN INS AGICC 2009 Q1 10,400,680 35,018,317 11,607,472 772,956 0.074 9.0% 27.8% 5.04 2.44 4.14 0.0% 43,058,815 13.93 1,702,755 6,818,812
ARAB INT UNI INS AIUI 2009 Q1 6,000,000 13,720,795 6,150,074 (59,736) (0.010) (1.8%) (3.9%) 1.49 0.94 1.12 0.0% 6,720,000 Negative 5,097 5,666
EURA ARAB INS. AMMI 2008 Q4 8,000,000 20,199,141 9,496,445 817,146 0.102 4.5% 9.6% 1.75 1.08 1.41 9.3% 11,280,000 13.80 3,118 4,155
BARAKAH TAKAFUL ARAI 2008 Q4 5,944,797 8,171,314 3,112,712 (2,223,238) (0.374) (24.6%) (51.9%) 3.08 1.32 2.15 (1.4%) 12,781,314 Negative 735,416 1,656,084
ARAB ASSURERS ARAS 2008 Q3 8,000,000 17,345,461 7,136,251 (546,096) (0.068) (4.2%) (8.9%) 1.45 0.65 0.70 (4.1%) 5,600,000 Negative 21,760 15,238
ARAB JOR INSURANCE ARGR 2008 Q4 10,000,000 14,603,672 10,286,191 (446,217) (0.045) (2.9%) (4.2%) 2.35 1.37 1.43 0.0% 14,300,000 Negative N/A N/A
ARAB INS ARIN 2009 Q1 8,000,000 24,493,241 9,642,376 219,779 0.027 3.6% 9.2% 3.84 1.64 1.64 (13.7%) 13,120,000 14.92 3,494 6,067
ARABIAN SEAS INS ARSI 2008 Q4 21,000,000 20,004,665 14,888,396 115,991 0.006 0.6% 0.8% 0.96 0.57 0.57 (9.5%) 11,970,000 P/E>100 800 471
DELTA INSURANCE DICL 2008 Q4 8,000,000 13,191,121 8,914,571 262,097 0.033 2.1% 3.2% 2.00 1.64 1.78 0.0% 14,240,000 54.33 N/A N/A
FIRST INSURANCE FINS 2008 Q4 24,000,000 27,896,202 25,306,372 1,438,027 0.060 5.2% 5.7% 1.25 0.81 0.92 0.0% 22,080,000 15.35 626,625 561,791
GENERAL ARAB INS GARI 2008 Q4 8,000,000 18,097,193 10,562,702 363,888 0.045 1.9% 3.2% 1.24 0.79 0.88 2.3% 7,040,000 19.35 2,134 1,879
GERASA INSURANCE GERA 2008 Q4 4,000,000 5,848,477 2,264,918 (63,339) (0.016) (1.1%) (3.1%) 1.77 1.40 1.69 0.0% 6,760,000 Negative N/A N/A
HOLY LAND INS HOLI 2009 Q1 4,000,000 13,013,903 3,745,912 114,194 0.029 3.5% 12.4% 1.79 1.01 1.23 0.0% 4,920,000 10.77 11,610 14,964
JERUSALEM INS JERY 2008 Q4 8,000,000 20,551,183 10,438,744 936,275 0.117 4.8% 9.5% 2.90 2.39 2.40 (0.4%) 19,200,000 20.51 2,066 4,958
4

Amman Stock Exchange Weekly Report - Week Ended July 2nd 2009
Company Ticker Year Period Paid up Capital Total Assets Shareholders’
Equity Net Profit EPS(1)
ROAA (2)
ROAE (2) 52-Week
Last Closing
Price
WTD Change Market Cap P/E
(3) Trading Activity
High Low Volume Value
JOR INT INSUR CO JIJC 2008 Q4 16,500,000 31,600,824 20,848,193 657,269 0.040 2.1% 3.2% 1.70 0.72 0.74 (6.3%) 12,210,000 18.58 694,684 517,826
JOR FRENCH INS JOFR 2008 Q4 9,100,000 20,765,245 7,026,640 (27,162) (0.003) (0.1%) (0.5%) 1.71 0.78 1.10 (3.5%) 10,010,000 Negative 331,598 379,972
JORDAN INSURANCE JOIN 2009 Q1 30,000,000 69,378,978 42,608,201 1,611,900 0.054 9.6% 15.5% 3.90 2.23 2.97 (1.0%) 89,100,000 13.82 3,405 9,987
MED GULF-JORDAN MDGF 2008 Q4 10,000,000 16,764,138 10,267,661 171,931 0.017 1.1% 1.7% 2.90 1.39 1.74 3.6% 17,400,000 P/E>100 136,332 232,254
MIDDLE EAST INS MEIN 2009 Q1 18,000,000 60,458,816 32,352,821 (86,665) (0.005) (0.6%) (1.1%) 3.15 1.90 2.11 (0.5%) 37,980,000 Negative 7,524 14,536
NATIONAL INSURANCE NAAI 2009 Q1 8,000,000 12,352,273 7,339,478 1,984 0.000 0.1% 0.1% 1.45 1.01 1.27 0.0% 10,160,000 P/E>100 N/A N/A
OASIS INSURANCE OASI 2008 Q4 25,000,000 5,083,515 986,357 (3,155,945) (0.126) (67.1%) (2,458.9%) 0.65 0.19 0.20 0.0% 5,000,000 Negative N/A N/A
PHILADELPHIA INS PHIN 2008 Q4 4,000,000 8,166,587 4,305,903 (244,465) (0.061) (3.0%) (5.5%) 1.40 1.13 1.40 0.0% 5,600,000 Negative N/A N/A
ISLAMIC INSUR CO TIIC 2009 Q1 10,000,000 24,187,042 15,717,592 (723,688) (0.072) (12.1%) (18.5%) 5.61 2.05 2.05 0.0% 20,500,000 Negative 75,455 160,209
UNITED INSURANCE UNIN 2009 Q1 8,000,000 19,809,393 12,777,470 394,354 0.049 8.0% 12.3% 1.80 1.03 1.14 0.9% 9,120,000 5.78 340 377
YARMOUK INS YINS 2008 Q4 7,462,108 13,733,406 8,875,801 (107,215) (0.014) (0.8%) (1.3%) 2.13 0.95 0.95 0.0% 7,089,003 Negative N/A N/A
Insurance Sector Total 300,407,585 598,743,733 328,411,010 2,580,548 1.7% 3.2% 477,889,131 11.04 4,365,546 10,408,638
AL-AMIN FOR INV AAFI 2009 Q1 10,000,000 18,553,512 17,125,138 (38,610) (0.004) (0.8%) (0.8%) 7.25 1.71 2.10 7.7% 21,000,000 Negative 468,073 967,212
AL-AHLIA ENTERPRISES ABLA 2009 Q1 37,062,209 61,219,442 35,179,161 (497,089) (0.013) (3.3%) (5.6%) 3.20 0.94 2.08 (10.7%) 77,089,395 Negative 2,417,412 5,246,683
AL-BELAD MED SRV ABMS 2009 Q1 16,500,000 24,345,165 18,667,159 89,851 0.005 1.5% 1.9% 1.44 0.95 1.13 4.6% 18,645,000 51.88 3,575 3,879
COMPRHNSVE MUTLP TRAN ABUS 2008 Q4 20,000,000 33,436,850 14,462,690 (3,604,119) (0.180) (10.8%) (22.2%) 2.34 0.45 0.70 2.9% 14,000,000 Negative 162,876 112,842
ARAB EAST INVST. AEIV 2009 Q1 47,000,000 124,543,198 98,481,565 3,682,461 0.078 11.9% 15.0% 3.82 1.27 1.29 (5.1%) 60,630,000 4.12 1,083,632 1,422,739
ARAB FINANCIAL INVEST AFIN 2009 Q1 15,000,000 54,813,190 34,130,588 1,898,843 0.127 15.9% 22.9% 5.86 2.37 2.76 0.0% 41,400,000 5.45 129,185 353,773
ARAB INT INV EDU AIEI 2009 Q1 40,500,000 85,483,442 52,136,868 (1,317,794) (0.033) (6.1%) (9.8%) 4.38 2.70 2.90 2.1% 117,450,000 Negative 488 1,434
ISRA EDU AIFE 2008 Q4 15,000,000 32,717,621 20,415,180 3,000,143 0.200 8.9% 15.5% 3.40 2.06 2.31 (1.7%) 34,650,000 11.55 2,100 4,876
ARAB INTL HOTEL AIHO 2009 Q1 25,000,000 74,732,541 59,902,848 933,566 0.037 5.2% 6.3% 2.85 2.11 2.28 1.3% 57,000,000 15.26 4,021 9,030
AL SHARQ INV AIPC 2008 Q4 16,000,000 21,225,152 19,818,380 1,900,192 0.119 9.1% 9.7% 2.65 1.57 2.65 0.0% 42,400,000 22.31 N/A N/A
JOR INV.&TRSM ALFA 2008 Q4 7,500,000 9,920,245 7,306,424 381,078 0.051 4.2% 5.4% 2.04 1.17 1.37 (14.9%) 10,275,000 26.96 15,089 21,719
AMLAK FINANCE/ JORDAN AMLK 2008 Q4 60,000,000 61,637,632 61,300,273 1,300,273 0.022 2.1% 2.1% 1.00 0.74 0.85 0.0% 51,000,000 39.22 N/A N/A
AMAD REAL ESTATE INV. AMAD 2009 Q1 6,600,000 11,162,623 9,975,205 75,142 0.011 2.7% 2.9% 2.27 1.03 1.44 2.9% 9,504,000 31.62 13,227 18,177
AL-AMAL INV. AMAL 2009 Q1 15,000,000 21,995,572 18,382,599 1,125,609 0.075 21.8% 25.6% 2.74 1.17 1.70 0.0% 25,500,000 5.66 1,892,166 3,268,018
AMMAN FOR DEV.& INV AMDI 2008 Q4 7,000,000 11,089,256 (2,388,129) (1,210,146) (0.173) (10.6%) 67.9% N/A N/A 6.68 0.0% 46,760,000 Negative N/A N/A
AMOUN INT’L INVESTMENT AMON 2009 Q1 12,031,108 12,790,940 12,403,903 280,656 0.023 9.1% 9.2% 1.45 0.76 1.41 3.7% 16,963,862 15.11 1,568,335 2,061,710
AMWAL INVEST AMWL 2009 Q1 42,500,000 66,745,329 62,752,203 4,377,508 0.103 23.0% 27.8% 3.45 1.20 1.20 (9.8%) 51,000,000 2.91 3,486,468 4,493,745
AMWAJ PROPERTIES AMWJ 2008 Q4 14,000,000 36,518,971 13,893,125 (106,875) (0.008) (0.3%) (0.8%) 2.12 0.94 1.10 0.0% 15,400,000 Negative 3,755 4,006
ARD ANNOMOW ARDN 2008 Q4 500,000 317,419 452,042 (47,958) (0.096) (15.1%) (10.6%) 3.45 1.22 2.03 0.0% 1,015,000 Negative N/A N/A
ARAB REAL EST ARED 2009 Q1 40,000,000 114,845,853 46,980,563 (3,889,252) (0.097) (13.7%) (35.6%) 2.94 0.72 0.72 (20.0%) 28,800,000 Negative 3,087,570 2,413,013
AWTAD INVESTMENTS AWTD 2008 Q4 1,000,000 898,164 206,505 (288,601) (0.289) (27.0%) (49.8%) 3.08 0.70 1.29 (5.1%) 1,290,000 Negative 216,550 285,785
5
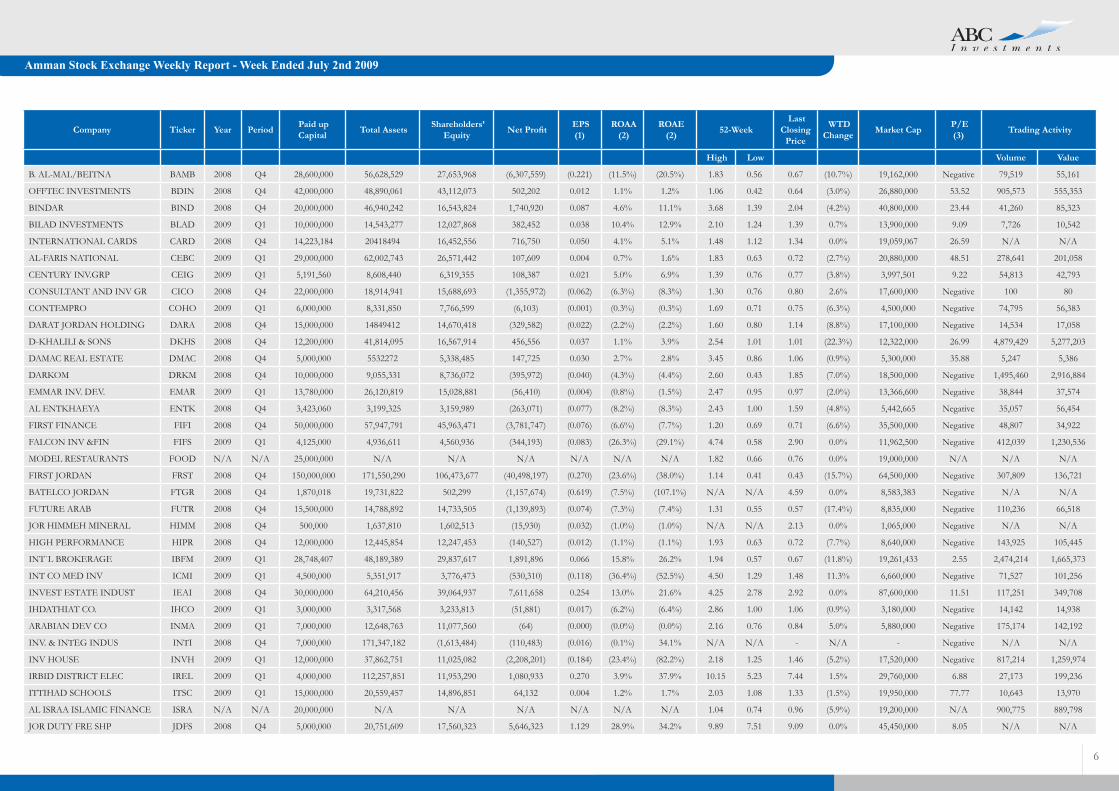
Amman Stock Exchange Weekly Report - Week Ended July 2nd 2009
Company Ticker Year Period Paid up Capital Total Assets Shareholders’
Equity Net Profit EPS(1)
ROAA (2)
ROAE (2) 52-Week
Last Closing
Price
WTD Change Market Cap P/E
(3) Trading Activity
High Low Volume Value
B. AL-MAL/BEITNA BAMB 2008 Q4 28,600,000 56,628,529 27,653,968 (6,307,559) (0.221) (11.5%) (20.5%) 1.83 0.56 0.67 (10.7%) 19,162,000 Negative 79,519 55,161
OFFTEC INVESTMENTS BDIN 2008 Q4 42,000,000 48,890,061 43,112,073 502,202 0.012 1.1% 1.2% 1.06 0.42 0.64 (3.0%) 26,880,000 53.52 905,573 555,353
BINDAR BIND 2008 Q4 20,000,000 46,940,242 16,543,824 1,740,920 0.087 4.6% 11.1% 3.68 1.39 2.04 (4.2%) 40,800,000 23.44 41,260 85,323
BILAD INVESTMENTS BLAD 2009 Q1 10,000,000 14,543,277 12,027,868 382,452 0.038 10.4% 12.9% 2.10 1.24 1.39 0.7% 13,900,000 9.09 7,726 10,542
INTERNATIONAL CARDS CARD 2008 Q4 14,223,184 20418494 16,452,556 716,750 0.050 4.1% 5.1% 1.48 1.12 1.34 0.0% 19,059,067 26.59 N/A N/A
AL-FARIS NATIONAL CEBC 2009 Q1 29,000,000 62,002,743 26,571,442 107,609 0.004 0.7% 1.6% 1.83 0.63 0.72 (2.7%) 20,880,000 48.51 278,641 201,058
CENTURY INV.GRP CEIG 2009 Q1 5,191,560 8,608,440 6,319,355 108,387 0.021 5.0% 6.9% 1.39 0.76 0.77 (3.8%) 3,997,501 9.22 54,813 42,793
CONSULTANT AND INV GR CICO 2008 Q4 22,000,000 18,914,941 15,688,693 (1,355,972) (0.062) (6.3%) (8.3%) 1.30 0.76 0.80 2.6% 17,600,000 Negative 100 80
CONTEMPRO COHO 2009 Q1 6,000,000 8,331,850 7,766,599 (6,103) (0.001) (0.3%) (0.3%) 1.69 0.71 0.75 (6.3%) 4,500,000 Negative 74,795 56,383
DARAT JORDAN HOLDING DARA 2008 Q4 15,000,000 14849412 14,670,418 (329,582) (0.022) (2.2%) (2.2%) 1.60 0.80 1.14 (8.8%) 17,100,000 Negative 14,534 17,058
D-KHALILI & SONS DKHS 2008 Q4 12,200,000 41,814,095 16,567,914 456,556 0.037 1.1% 3.9% 2.54 1.01 1.01 (22.3%) 12,322,000 26.99 4,879,429 5,277,203
DAMAC REAL ESTATE DMAC 2008 Q4 5,000,000 5532272 5,338,485 147,725 0.030 2.7% 2.8% 3.45 0.86 1.06 (0.9%) 5,300,000 35.88 5,247 5,386
DARKOM DRKM 2008 Q4 10,000,000 9,055,331 8,736,072 (395,972) (0.040) (4.3%) (4.4%) 2.60 0.43 1.85 (7.0%) 18,500,000 Negative 1,495,460 2,916,884
EMMAR INV. DEV. EMAR 2009 Q1 13,780,000 26,120,819 15,028,881 (56,410) (0.004) (0.8%) (1.5%) 2.47 0.95 0.97 (2.0%) 13,366,600 Negative 38,844 37,574
AL ENTKHAEYA ENTK 2008 Q4 3,423,060 3,199,325 3,159,989 (263,071) (0.077) (8.2%) (8.3%) 2.43 1.00 1.59 (4.8%) 5,442,665 Negative 35,057 56,454
FIRST FINANCE FIFI 2008 Q4 50,000,000 57,947,791 45,963,471 (3,781,747) (0.076) (6.6%) (7.7%) 1.20 0.69 0.71 (6.6%) 35,500,000 Negative 48,807 34,922
FALCON INV &FIN FIFS 2009 Q1 4,125,000 4,936,611 4,560,936 (344,193) (0.083) (26.3%) (29.1%) 4.74 0.58 2.90 0.0% 11,962,500 Negative 412,039 1,230,536
MODEL RESTAURANTS FOOD N/A N/A 25,000,000 N/A N/A N/A N/A N/A N/A 1.82 0.66 0.76 0.0% 19,000,000 N/A N/A N/A
FIRST JORDAN FRST 2008 Q4 150,000,000 171,550,290 106,473,677 (40,498,197) (0.270) (23.6%) (38.0%) 1.14 0.41 0.43 (15.7%) 64,500,000 Negative 307,809 136,721
BATELCO JORDAN FTGR 2008 Q4 1,870,018 19,731,822 502,299 (1,157,674) (0.619) (7.5%) (107.1%) N/A N/A 4.59 0.0% 8,583,383 Negative N/A N/A
FUTURE ARAB FUTR 2008 Q4 15,500,000 14,788,892 14,733,505 (1,139,893) (0.074) (7.3%) (7.4%) 1.31 0.55 0.57 (17.4%) 8,835,000 Negative 110,236 66,518
JOR HIMMEH MINERAL HIMM 2008 Q4 500,000 1,637,810 1,602,513 (15,930) (0.032) (1.0%) (1.0%) N/A N/A 2.13 0.0% 1,065,000 Negative N/A N/A
HIGH PERFORMANCE HIPR 2008 Q4 12,000,000 12,445,854 12,247,453 (140,527) (0.012) (1.1%) (1.1%) 1.93 0.63 0.72 (7.7%) 8,640,000 Negative 143,925 105,445
INT`L BROKERAGE IBFM 2009 Q1 28,748,407 48,189,389 29,837,617 1,891,896 0.066 15.8% 26.2% 1.94 0.57 0.67 (11.8%) 19,261,433 2.55 2,474,214 1,665,373
INT CO MED INV ICMI 2009 Q1 4,500,000 5,351,917 3,776,473 (530,310) (0.118) (36.4%) (52.5%) 4.50 1.29 1.48 11.3% 6,660,000 Negative 71,527 101,256
INVEST ESTATE INDUST IEAI 2008 Q4 30,000,000 64,210,456 39,064,937 7,611,658 0.254 13.0% 21.6% 4.25 2.78 2.92 0.0% 87,600,000 11.51 117,251 349,708
IHDATHIAT CO. IHCO 2009 Q1 3,000,000 3,317,568 3,233,813 (51,881) (0.017) (6.2%) (6.4%) 2.86 1.00 1.06 (0.9%) 3,180,000 Negative 14,142 14,938
ARABIAN DEV CO INMA 2009 Q1 7,000,000 12,648,763 11,077,560 (64) (0.000) (0.0%) (0.0%) 2.16 0.76 0.84 5.0% 5,880,000 Negative 175,174 142,192
INV. & INTEG INDUS INTI 2008 Q4 7,000,000 171,347,182 (1,613,484) (110,483) (0.016) (0.1%) 34.1% N/A N/A - N/A - Negative N/A N/A
INV HOUSE INVH 2009 Q1 12,000,000 37,862,751 11,025,082 (2,208,201) (0.184) (23.4%) (82.2%) 2.18 1.25 1.46 (5.2%) 17,520,000 Negative 817,214 1,259,974
IRBID DISTRICT ELEC IREL 2009 Q1 4,000,000 112,257,851 11,953,290 1,080,933 0.270 3.9% 37.9% 10.15 5.23 7.44 1.5% 29,760,000 6.88 27,173 199,236
ITTIHAD SCHOOLS ITSC 2009 Q1 15,000,000 20,559,457 14,896,851 64,132 0.004 1.2% 1.7% 2.03 1.08 1.33 (1.5%) 19,950,000 77.77 10,643 13,970
AL ISRAA ISLAMIC FINANCE ISRA N/A N/A 20,000,000 N/A N/A N/A N/A N/A N/A 1.04 0.74 0.96 (5.9%) 19,200,000 N/A 900,775 889,798
JOR DUTY FRE SHP JDFS 2008 Q4 5,000,000 20,751,609 17,560,323 5,646,323 1.129 28.9% 34.2% 9.89 7.51 9.09 0.0% 45,450,000 8.05 N/A N/A
6
Amman Stock Exchange Weekly Report - Week Ended July 2nd 2009
Company Ticker Year Period Paid up Capital Total Assets Shareholders’
Equity Net Profit EPS(1)
ROAA (2)
ROAE (2) 52-Week
Last Closing
Price
WTD Change Market Cap P/E
(3) Trading Activity
High Low Volume Value
DIMENSIONS JEDI 2008 Q4 10,000,000 9,725,258 9,340,582 (659,418) (0.066) (6.8%) (7.1%) 1.74 0.72 1.16 (12.1%) 11,600,000 Negative 75,535 97,781
JORDAN EXPAT .INV JEIH 2009 Q1 16,125,000 19,581,388 15,767,179 (1,753,150) (0.109) (34.7%) (42.1%) 2.29 0.60 0.73 (1.4%) 11,771,250 Negative 50,716 37,094
JORDAN EXPRESS JETT 2009 Q1 10,800,000 21,835,703 17,891,916 78,181 0.007 1.4% 1.7% 2.45 1.93 2.08 (0.5%) 22,464,000 71.83 3,909 8,136
INTERNATIONAL INV. JIIG 2008 Q4 10,000,000 11,355,767 9,338,504 (238,680) (0.024) (2.0%) (2.5%) 1.51 0.83 0.93 (2.1%) 9,300,000 Negative 146,001 132,166
JORDAN INTL TRAD JITC 2008 Q4 3,400,000 7,324,193 4,188,350 422,413 0.124 6.4% 10.1% 4.12 2.09 2.49 3.3% 8,466,000 20.04 121 279
JOR LOAN GRNT.CO JLGC 2009 Q1 10,000,000 23,397,105 14,622,198 (52,665) (0.005) (0.9%) (1.4%) 1.28 0.60 0.74 (2.6%) 7,400,000 Negative 8,456 6,167
AL JAMIL FOR GNRL INVST JMIL 2009 Q1 1,023,000 1,023,000 1,893,005 (10,370) (0.010) (2.6%) (2.8%) 5.92 1.83 4.36 1.4% 4,460,280 Negative 225,033 969,762
JOR MORTGAGE REFIN JMRC 2009 Q1 5,000,000 222,687,121 7,445,202 380,306 0.076 0.6% 20.1% N/A N/A - N/A - - N/A N/A
TAJCATERINGHOUSING JNTH 2009 Q1 10,000,000 14,855,113 10,032,189 (7,687) (0.001) (0.2%) (0.3%) 4.15 1.30 2.15 (10.4%) 21,500,000 Negative 7,351,054 16,628,673
JORDAN CENTRAL JOCE 2009 Q1 4,500,000 12,193,047 5,545,378 (207,490) (0.046) (5.7%) (14.7%) 4.78 2.23 2.23 (21.8%) 10,035,000 Negative 494,461 1,263,562
JOR ELECTRIC PWR JOEP 2009 Q1 70,000,000 456,478,944 100,139,663 (72,855) (0.001) (0.1%) (0.3%) 7.63 2.73 3.25 (6.9%) 227,500,000 Negative 419,250 1,358,669
JOR HOTEL TOURS JOHT 2008 Q4 10,000,000 28,770,605 23,739,694 4,528,649 0.453 15.7% 20.4% 8.90 5.51 8.36 0.0% 83,600,000 18.46 N/A N/A
JOR INV TRUST JOIT 2009 Q1 29,513,889 59,630,042 38,223,268 (2,004,937) (0.068) (13.2%) (20.6%) 2.88 1.18 1.24 (6.1%) 36,597,222 Negative 6,488 7,884
RESOURCES INVEST JOMA 2008 Q4 11,000,000 12,586,832 12,467,471 1,443,982 0.131 12.2% 12.3% 2.17 0.73 1.35 (15.1%) 14,850,000 10.28 159,268 227,501
JORDAN CONSULTING JOMC 2008 Q4 1,400,000 4,497,167 1,878,125 208,284 0.149 5.5% 11.7% 2.01 1.38 1.52 0.0% 2,128,000 10.22 N/A N/A
JOR PRESS/ PUBLISH JOPP 2009 Q1 4,500,000 19,072,989 11,271,318 (303,433) (0.067) (6.4%) (10.6%) 4.03 1.86 1.96 0.5% 8,820,000 Negative 1,624 3,118
JOR TRADE FAC JOTF 2009 Q1 16,500,000 32,110,529 17,885,913 631,603 0.038 7.5% 13.8% 2.29 1.39 1.52 4.8% 25,080,000 9.93 30 46
JOR PROJ TOUR DEV JPTD 2008 Q4 21,500,000 69,427,856 35,533,315 3,854,889 0.179 6.1% 11.5% 8.90 4.50 6.08 0.0% 130,720,000 33.91 N/A N/A
JO REALESTATE JRCD 2009 Q1 30,000,000 41,993,792 36,783,302 (103,819) (0.003) (1.0%) (1.1%) 1.71 0.84 0.88 (1.1%) 26,400,000 Negative 209,261 180,107
JORDAN TELECOM JTEL 2009 Q1 250,000,000 682,550,048 441,776,039 25,053,080 0.100 14.8% 23.4% 6.50 4.36 4.95 (1.0%) 1,237,500,000 12.35 114,307 568,551
KAFA`A INVESTMENTS KAFA 2008 Q4 4,000,000 3,876,508 3,758,889 34,619 0.009 0.9% 0.9% 3.29 1.06 1.76 (11.6%) 7,040,000 P/E>100 101,827 197,121
COMPRHNSVE LEASING LEAS N/A N/A 5,000,000 N/A N/A N/A N/A N/A N/A 1.78 1.22 1.34 (5.0%) 6,700,000 N/A 40,337 52,237
AL-DAWLIYAH H&M MALL 2009 Q1 43,200,000 71,338,609 57,076,504 354,308 0.008 2.0% 2.5% 1.70 1.12 1.28 0.8% 55,296,000 39.02 1,843 2,278
AL-AMEER FOR DEV MANE 2008 Q4 5,000,000 5,131,865 5,000,000 (68,135) (0.014) (1.3%) (1.4%) 1.23 0.88 0.90 2.3% 4,500,000 Negative 340 300
AFAQ INVEST REAL DEV MANR 2008 Q4 80,000,000 101,762,270 93,376,380 8,052,733 0.101 8.0% 9.0% 4.50 4.50 4.50 0.0% 360,000,000 44.71 N/A N/A
MEDITER. TOURISM MDTR 2008 Q4 45,000,000 52,864,413 49,762,159 3,140,401 0.070 6.0% 6.3% 2.30 1.67 1.90 (2.1%) 85,500,000 27.23 11,874 22,345
MIDDLE EAST DIV MEDI 2008 Q4 2,000,000 3,327,291 1,982,179 (195,258) (0.098) (5.8%) (9.4%) 10.20 5.76 8.89 (5.8%) 17,780,000 Negative 136,724 1,225,395
METHAQ MEET 2008 Q4 12,962,894 16,538,261 12,338,499 (938,591) (0.072) (6.7%) (9.3%) 2.06 0.86 1.08 (2.7%) 13,999,926 Negative 2,449,649 2,584,488
TAJ TOURIST PROJ MERM 2009 Q1 40,000,000 76,962,412 48,291,080 (62,367) (0.002) (0.3%) (0.5%) 1.83 0.60 0.72 (4.0%) 28,800,000 Negative 496,620 361,441
MASAFAT TRANSPORT MSFT 2008 Q4 17,000,000 23,199,154 17,325,234 881,911 0.052 4.6% 5.8% 1.56 0.69 0.71 (9.0%) 12,070,000 13.69 371,189 266,132
JORDAN MASAKEN MSKN N/A N/A 18,000,000 N/A N/A N/A N/A N/A N/A 0.80 0.56 0.58 (13.4%) 10,440,000 N/A 226,212 138,549
TRANSPORT BARTER NAQL 2009 Q1 12,100,000 22,969,822 16,554,078 543,286 0.045 9.1% 13.3% 2.96 1.03 1.27 6.7% 15,367,000 7.07 219,461 265,024
NOPAR FOR TRADING NOTI 2008 Q4 500,000 489,440 489,340 8,466 0.017 1.7% 1.7% 2.55 0.99 1.03 (1.0%) 515,000 60.83 3,025 3,147
NATL PORTFOLIO NPSC 2009 Q1 15,000,000 24,707,103 15,722,741 (385,409) (0.026) (6.1%) (9.7%) 4.93 1.04 1.27 8.5% 19,050,000 Negative 90,786 111,392
7
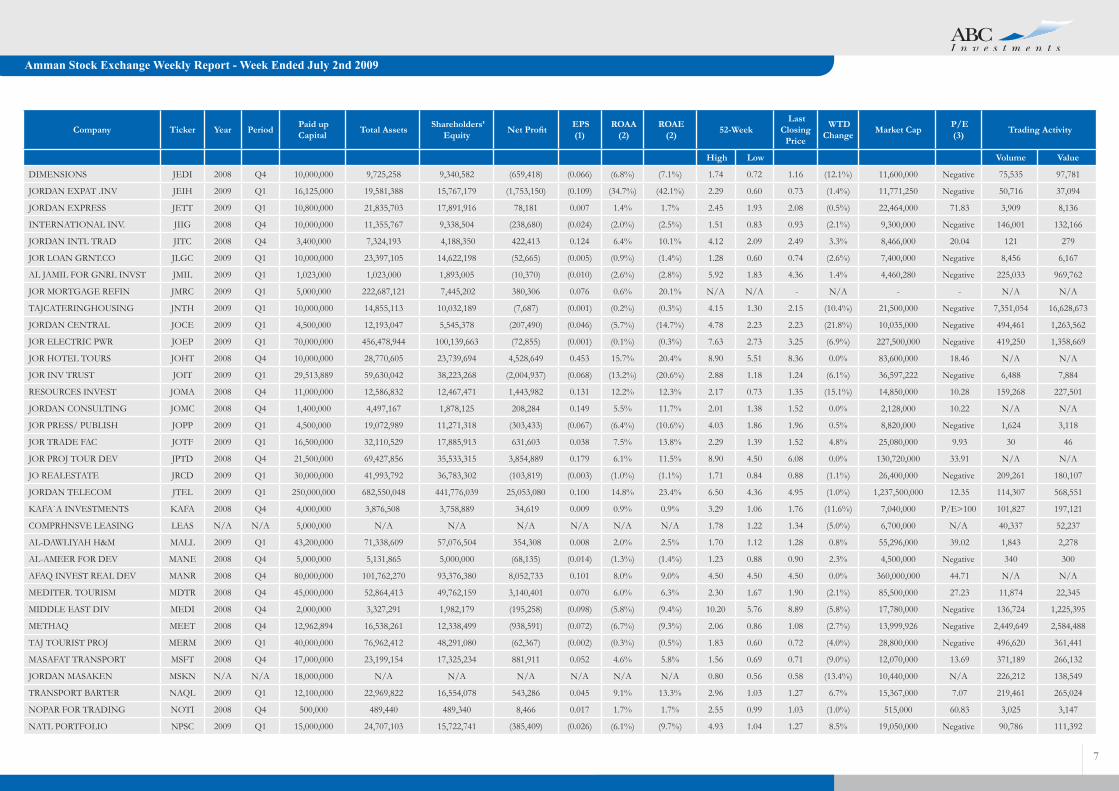
Amman Stock Exchange Weekly Report - Week Ended July 2nd 2009
Company Ticker Year Period Paid up Capital Total Assets Shareholders’
Equity Net Profit EPS(1)
ROAA (2)
ROAE (2) 52-Week
Last Closing
Price
WTD Change Market Cap P/E
(3) Trading Activity
High Low Volume Value
PETRA EDUCATION PEDC 2009 Q1 16,000,000 27,292,487 19,811,176 1,696,058 0.106 25.1% 33.6% 3.25 2.86 3.19 4.9% 51,040,000 7.52 714 2,278
REAL ESTATE & INV PORT PETT 2008 Q4 15,000,000 9,850,770 9,780,393 (1,509,241) (0.101) (14.1%) (14.3%) 1.45 0.90 1.00 4.2% 15,000,000 Negative 18,482 18,003
PHILADELPHIA UNI PIEC 2008 Q4 15,000,000 26,177,214 19,457,183 3,202,956 0.214 12.7% 16.7% 4.00 3.05 3.30 (4.1%) 49,500,000 15.45 3,145 10,293
PALACES PRED 2008 Q4 4,000,000 7,016,325 3,809,613 (108,625) (0.027) (1.9%) (2.8%) 6.21 1.47 1.47 (10.4%) 5,880,000 Negative 40,911 62,574
J. PRESS FOUNDAT PRES 2009 Q1 7,500,000 36,579,795 27,470,289 948,119 0.126 10.1% 12.3% 21.20 12.92 13.80 3.0% 103,500,000 27.29 3,822 51,663
PROFESSIONAL PROF 2008 Q4 55,000,000 52,138,260 50,979,551 (4,192,693) (0.076) (8.0%) (8.2%) 1.26 0.59 0.65 (4.4%) 35,750,000 Negative 54,307 35,756
EAST REAL ESTATE REAL 2009 Q1 9,996,082 39,853,196 30,281,657 1,451,957 0.145 14.9% 19.4% 8.50 2.07 2.15 (11.5%) 21,491,576 3.70 118,136 255,431
REAL ESTATE DV REDV 2009 Q1 91,500,000 195,241,635 122,107,855 (1,365,848) (0.015) (2.8%) (4.4%) 1.59 0.54 0.55 (1.8%) 50,325,000 Negative 608,971 343,706
REAL ESTATE INV REIN 2009 Q1 70,000,000 90,010,870 70,153,167 57,499 0.001 0.3% 0.3% 1.40 0.60 0.75 (6.3%) 52,500,000 P/E>100 23,548 18,068
AL RAKAEZ RICS 2008 Q4 10,000,000 9,939,517 9,801,901 (103,317) (0.010) (1.0%) (1.0%) 1.14 0.48 0.78 4.0% 7,800,000 Negative 157,856 124,750
ROYAL JORDANIAN RJAL 2009 Q1 84,373,000 384,535,000 69,347,000 (8,570,000) (0.102) (9.0%) (46.6%) 3.50 1.55 1.67 (1.8%) 140,902,910 Negative 623,248 1,056,283
RUM TOURIST TRAN RUMM 2008 Q4 7,000,000 13,019,525 7,823,224 319,427 0.046 2.5% 4.4% 2.33 0.77 0.78 (4.9%) 5,460,000 17.09 24,221 19,104
AL-SALEM FOR INV SALM 2008 Q4 500,000 927,060 913,575 197,526 0.395 20.9% 24.2% 8.01 5.37 8.00 0.0% 4,000,000 20.25 25,459 203,917
SABAEK INVESTMENTS SABK 2008 Q4 8,000,000 6,932,359 6,817,652 (1,143,239) (0.143) (17.4%) (17.5%) 1.40 0.49 0.64 (13.5%) 5,120,000 Negative 30,769 20,738
AL-SANABEL INT`L SANA 2008 Q4 20,000,000 21,702,305 21,529,483 128,313 0.006 0.6% 0.6% 1.20 0.62 0.74 (6.3%) 14,800,000 P/E>100 48,032 36,094
SOUTH ELECTRONICS SECO 2008 Q4 50,000,000 69,184,396 38,702,103 49,093 0.001 0.1% 0.1% 1.37 0.40 0.47 (4.1%) 23,500,000 P/E>100 833,269 397,306
SHARECO BROKERAGE SHBC 2008 Q4 12,000,000 21,183,606 13,969,769 1,175,287 0.098 5.3% 8.4% 1.92 0.67 0.69 0.0% 8,280,000 7.05 2,001,541 1,385,239
SHIPPING LINE SHIP 2009 Q1 12,075,000 29,239,555 16,850,983 1,443,253 0.120 20.0% 34.5% 2.64 1.41 1.80 5.9% 21,735,000 3.76 10,606 18,677
SPEC.INV JOR SIJC 2009 Q1 4,500,000 12,529,705 7,543,763 153,232 0.034 5.0% 8.3% 4.47 2.52 3.35 6.3% 15,075,000 24.60 42,196 132,181
SALAM INT TRN TD SITT 2009 Q1 13,200,000 68,924,203 19,590,774 1,044,941 0.079 6.1% 21.0% 2.46 1.48 1.60 1.9% 21,120,000 5.05 3,874 6,156
SPCZ.INVST.COMD SPIC 2009 Q1 25,760,000 73,980,115 29,073,575 630,341 0.024 3.4% 9.0% 11.07 3.81 6.00 4.0% 154,560,000 61.30 1,949,332 10,951,665
SPCZ.TRDG&INVST SPTI 2009 Q1 3,075,000 3,585,641 3,002,141 (373,734) (0.122) (38.1%) (45.1%) 2.15 0.80 1.15 7.5% 3,536,250 Negative 168,921 189,681
SURA DEV.& INVESTMENT SURA 2008 Q4 11,500,000 11708510 11,454,744 (45,256) (0.004) (0.4%) (0.4%) 0.96 0.61 0.64 (5.9%) 7,360,000 Negative 183,993 121,212
TAAMEER JOR HLDGS TAMR 2008 Q4 211,982,573 340,456,793 182,721,786 3,953,938 0.019 1.3% 2.1% 2.27 0.57 0.59 (9.2%) 125,069,718 31.63 7,142,196 4,412,685
AL-TAHDITH THDI 2008 Q4 2,000,000 2,629,732 1,921,984 (94,310) (0.047) (3.9%) (4.8%) 2.04 0.58 0.98 10.1% 1,960,000 Negative 42,431 39,621
TUHAMA INVESTMENTS THMA 2008 Q4 9,000,000 9,761,512 8,382,471 182,471 0.020 1.9% 2.1% 2.44 0.87 0.87 (10.3%) 7,830,000 42.91 1,126,229 1,035,341
TRUST INT`L TRANSPORT TRTR 2008 Q4 3,434,750 4,370,715 2,772,837 171,593 0.050 3.9% 6.6% 3.00 3.00 3.00 0.0% 10,304,250 60.05 N/A N/A
UNI ARAB INVEST UAIC 2008 Q4 147,500,000 355,151,104 215,956,463 5,473,092 0.037 1.6% 2.5% 2.80 0.74 0.76 (10.6%) 112,100,000 20.48 10,183,867 7,973,798
UN FOR FINCL INV UCFI 2009 Q1 5,000,000 16,378,960 11,988,337 326,505 0.065 7.7% 11.2% 7.16 3.22 3.42 (5.3%) 17,100,000 13.09 471,823 1,667,613
UNITED GROUP HOLDING UGHI N/A N/A 50,000,000 N/A N/A N/A N/A N/A N/A 1.09 0.57 0.57 (9.5%) 28,500,000 N/A 1,158,353 697,196
UNION INV UINV 2009 Q1 50,000,000 82,120,232 58,057,936 (182,992) (0.004) (0.9%) (1.2%) 1.69 0.57 1.62 8.7% 81,000,000 Negative 688,562 1,086,948
UNION LAND DEV ULDC 2009 Q1 45,000,000 82,290,579 56,510,550 739,141 0.016 3.6% 5.3% 1.91 0.71 1.65 17.0% 74,250,000 25.11 1,503,759 2,377,990
ARAB INV. UNION UNAI 2008 Q4 3,000,000 2,753,406 2,744,310 (81,393) (0.027) (2.9%) (2.9%) 1.68 0.68 0.87 (3.3%) 2,610,000 Negative 2,307 2,009
UNIFIED CO UNIF 2009 Q1 6,511,057 17,255,024 7,533,511 (114,123) (0.018) (2.6%) (6.0%) 1.33 0.65 0.68 (2.9%) 4,427,519 Negative 103,356 69,501
8

Amman Stock Exchange Weekly Report - Week Ended July 2nd 2009
Company Ticker Year Period Paid up Capital Total Assets Shareholders’
Equity Net Profit EPS(1)
ROAA (2)
ROAE (2) 52-Week
Last Closing
Price
WTD Change Market Cap P/E
(3) Trading Activity
High Low Volume Value
AL SHAMEKHA REAL VFED 2009 Q1 1,200,000 2,642,415 2,341,085 215,857 0.180 31.3% 34.9% 3.19 1.99 2.10 0.0% 2,520,000 2.92 N/A N/A
WINTER VALLEY TOUR WIVA 2008 Q4 5,000,000 5,658,411 5,490,740 212,680 0.043 5.9% 6.1% 1.68 0.59 1.05 (17.3%) 5,250,000 24.68 978,545 1,133,762
ZAHRAT ALURDON ZAHI 2009 Q1 500,000 396,865 392,865 20,665 0.041 20.4% 20.9% 3.45 1.86 1.89 0.0% 945,000 11.43 350 662
ZARA INVESTMENTS ZARA 2008 Q4 125,000,000 255,579,679 131,673,954 11,739,502 0.094 4.9% 9.3% 2.17 1.39 1.58 0.6% 197,500,000 16.82 950 1,501
ZARQA EDUC ZEIC 2009 Q1 8,475,000 20,001,371 14,506,907 934,751 0.110 19.6% 26.6% 3.69 2.26 2.58 1.2% 21,865,500 5.85 1,425 3,665
Services Sector Total 3,124,461,791 6,607,640,455 3,614,825,744 30,944,925 1.8% 3.2% 5,441,846,806 15.16 71,891,356 98,898,892
ARAB ALUM IND AALU 2009 Q1 6,750,000 16,033,553 11,803,124 373,974 0.055 9.0% 12.6% 1.85 1.28 1.28 (11.1%) 8,640,000 5.78 10,406 14,098
PREMIER ACDT 2009 Q1 1,330,008 7,564,382 4,095,335 (31,489) (0.024) (1.7%) (3.1%) 8.00 3.01 3.60 0.3% 4,788,029 Negative 340 1,208
ARAB ELECT IND AEIN 2009 Q1 6,000,000 10,120,056 6,908,421 70,782 0.012 2.8% 4.1% 1.46 0.62 0.69 0.0% 4,140,000 14.62 36,133 24,617
AFIA INT CO-JORDAN AICG 2008 Q4 8,000,000 6,046,322 2,806,947 6,403 0.001 0.1% 0.2% N/A N/A 2.46 0.0% 19,680,000 P/E>100 N/A N/A
ARAB INT’L FOOD AIFF 2009 Q1 10,500,000 27,603,955 27,121,716 (20,050) (0.002) (0.3%) (0.3%) 5.90 4.13 4.13 0.0% 43,365,000 Negative N/A N/A
AL-JANUOB FLT MF AJFM 2008 Q4 1,886,150 3,825,159 2,545,640 249,290 0.132 7.0% 11.4% 3.24 2.61 2.95 0.0% 5,564,143 22.32 N/A N/A
AMANA AGRICULT. AMAN 2008 Q4 7,000,000 6,226,902 3,699,493 (594,911) (0.085) (9.7%) (15.4%) 0.66 0.40 0.43 0.0% 3,010,000 Negative N/A N/A
ARAB INVEST PROJ APCT 2008 Q4 20,000,000 44,007,938 19,204,000 (2,297,042) (0.115) (9.2%) (19.4%) 1.31 0.45 0.46 (2.1%) 9,200,000 Negative 514,344 245,952
ARAB PHARMA CHEM APHC 2009 Q1 5,000,000 7,600,015 7,218,692 82,809 0.017 4.4% 4.6% 2.16 1.32 1.99 2.6% 9,950,000 30.04 5 10
ARAB POTASH CO APOT 2009 Q1 83,318,000 803,205,000 677,037,000 35,106,000 0.421 16.8% 21.3% 80.99 25.60 37.55 6.7% 3,128,590,900 22.28 40,159 1,522,864
AL-QUDS READY MIX AQRM 2008 Q4 14,000,000 17,502,463 13,427,330 (1,930,184) (0.138) (10.6%) (13.4%) 1.54 0.59 0.67 (9.5%) 9,380,000 Negative 1,104,421 785,618
ARAB ENGINEERING IND. AREN 2008 Q4 1,816,990 12,678,510 2,135,699 325,213 0.179 2.6% 20.3% N/A N/A 1.80 0.0% 3,270,582 10.06 N/A N/A
ARAB WEAVER UNION ARWU N/A N/A 12,000,000 N/A N/A N/A N/A N/A N/A 1.67 1.60 1.67 0.0% 20,040,000 N/A N/A N/A
ARAB STEEL PIPES ASPMM 2009 Q1 9,000,000 18,521,792 13,578,233 330,414 0.037 7.0% 9.1% 2.98 1.61 2.40 3.9% 21,600,000 16.34 2,562,907 6,150,076
COMPLAND DEV&INV ATTA 2009 Q1 12,000,000 15,256,543 12,151,662 (134,197) (0.011) (3.6%) (4.4%) 1.40 0.62 0.72 (7.7%) 8,640,000 Negative 140,520 103,947
BATON FOR BLOCKS BLOK 2008 Q4 12,000,000 12,320,150 11,962,314 636,368 0.053 4.7% 5.2% 1.40 0.64 0.70 0.0% 8,400,000 13.20 262,026 176,211
JORDAN CLOTHING CJCC 2008 Q4 3,000,000 7,368,337 4,235,247 236,260 0.079 3.4% 5.7% 2.75 1.04 1.04 (15.4%) 3,120,000 13.21 41,398 47,115
DAR ALDAWA DV/IV DADI 2009 Q1 20,000,000 70,157,223 51,162,722 171,220 0.009 1.0% 1.3% 4.83 3.12 3.70 (2.6%) 74,000,000 P/E>100 11,730 42,352
EKBAL PRINT CO. EKPC 2009 Q1 5,000,000 7,865,239 6,229,280 (50,424) (0.010) (2.5%) (3.2%) 1.41 0.73 0.74 (3.9%) 3,700,000 Negative 6,696 4,917
EL-ZAY READY WR ELZA 2009 Q1 12,491,948 19,656,528 9,269,627 (185,546) (0.015) (3.7%) (7.9%) 0.76 0.32 0.33 0.0% 4,122,343 Negative 141,620 45,544
AL-FATIHOUN AL ARAB FATI 2008 Q4 10,000,000 10,036,539 9,974,327 80,276 0.008 0.8% 0.8% 1.15 0.49 0.72 (5.3%) 7,200,000 89.69 753,409 553,658
FIRST NAT VEG OIL FNVO 2008 Q4 4,500,000 6,706,206 3,039,122 (124,356) (0.028) (1.8%) (4.0%) 1.41 0.55 0.58 1.8% 2,610,000 Negative 12,190 6,907
GENERAL INVESTMENT GENI 2008 Q4 10,000,000 27,354,793 24,894,014 1,964,563 0.196 6.9% 7.6% 6.30 3.80 4.09 (2.6%) 40,900,000 20.82 10 41
GENERAL MINING GENM 2008 Q4 1,500,000 2,772,469 2,434,558 135,179 0.090 4.8% 5.5% 7.79 5.70 6.10 0.0% 9,150,000 67.69 5 30
LIGHT CONCRETE GLCI 2008 Q4 8,500,000 18,591,908 7,661,557 (1,074,566) (0.126) (7.5%) (13.1%) 1.54 0.67 0.68 (2.9%) 5,780,000 Negative 23,865 16,005
HAYAT PHAR. IND. HPIC 2008 Q4 9,500,000 12,509,830 10,702,195 232,780 0.025 1.8% 2.1% 1.42 0.94 1.35 3.8% 12,825,000 55.09 100 135
INDSTRAL/COMM/AGR ICAG 2008 Q4 5,000,000 8,099,743 5,823,960 (1,348,500) (0.270) (14.3%) (20.8%) 1.51 0.55 0.80 11.1% 4,000,000 Negative 689,025 518,518
9
Amman Stock Exchange Weekly Report - Week Ended July 2nd 2009
Company Ticker Year Period Paid up Capital Total Assets Shareholders’
Equity Net Profit EPS(1)
ROAA (2)
ROAE (2) 52-Week
Last Closing
Price
WTD Change Market Cap P/E
(3) Trading Activity
High Low Volume Value
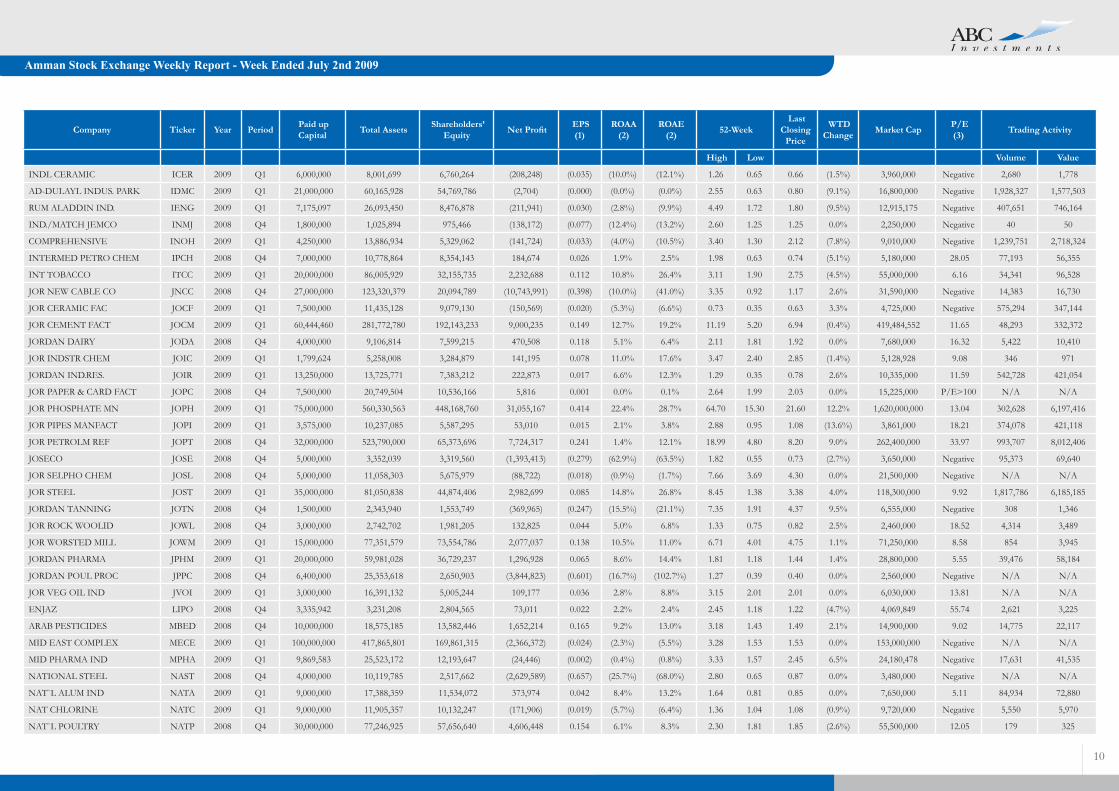
INDL CERAMIC ICER 2009 Q1 6,000,000 8,001,699 6,760,264 (208,248) (0.035) (10.0%) (12.1%) 1.26 0.65 0.66 (1.5%) 3,960,000 Negative 2,680 1,778
AD-DULAYL INDUS. PARK IDMC 2009 Q1 21,000,000 60,165,928 54,769,786 (2,704) (0.000) (0.0%) (0.0%) 2.55 0.63 0.80 (9.1%) 16,800,000 Negative 1,928,327 1,577,503
RUM ALADDIN IND. IENG 2009 Q1 7,175,097 26,093,450 8,476,878 (211,941) (0.030) (2.8%) (9.9%) 4.49 1.72 1.80 (9.5%) 12,915,175 Negative 407,651 746,164
IND./MATCH JEMCO INMJ 2008 Q4 1,800,000 1,025,894 975,466 (138,172) (0.077) (12.4%) (13.2%) 2.60 1.25 1.25 0.0% 2,250,000 Negative 40 50
COMPREHENSIVE INOH 2009 Q1 4,250,000 13,886,934 5,329,062 (141,724) (0.033) (4.0%) (10.5%) 3.40 1.30 2.12 (7.8%) 9,010,000 Negative 1,239,751 2,718,324
INTERMED PETRO CHEM IPCH 2008 Q4 7,000,000 10,778,864 8,354,143 184,674 0.026 1.9% 2.5% 1.98 0.63 0.74 (5.1%) 5,180,000 28.05 77,193 56,355
INT TOBACCO ITCC 2009 Q1 20,000,000 86,005,929 32,155,735 2,232,688 0.112 10.8% 26.4% 3.11 1.90 2.75 (4.5%) 55,000,000 6.16 34,341 96,528
JOR NEW CABLE CO JNCC 2008 Q4 27,000,000 123,320,379 20,094,789 (10,743,991) (0.398) (10.0%) (41.0%) 3.35 0.92 1.17 2.6% 31,590,000 Negative 14,383 16,730
JOR CERAMIC FAC JOCF 2009 Q1 7,500,000 11,435,128 9,079,130 (150,569) (0.020) (5.3%) (6.6%) 0.73 0.35 0.63 3.3% 4,725,000 Negative 575,294 347,144
JOR CEMENT FACT JOCM 2009 Q1 60,444,460 281,772,780 192,143,233 9,000,235 0.149 12.7% 19.2% 11.19 5.20 6.94 (0.4%) 419,484,552 11.65 48,293 332,372
JORDAN DAIRY JODA 2008 Q4 4,000,000 9,106,814 7,599,215 470,508 0.118 5.1% 6.4% 2.11 1.81 1.92 0.0% 7,680,000 16.32 5,422 10,410
JOR INDSTR CHEM JOIC 2009 Q1 1,799,624 5,258,008 3,284,879 141,195 0.078 11.0% 17.6% 3.47 2.40 2.85 (1.4%) 5,128,928 9.08 346 971
JORDAN IND.RES. JOIR 2009 Q1 13,250,000 13,725,771 7,383,212 222,873 0.017 6.6% 12.3% 1.29 0.35 0.78 2.6% 10,335,000 11.59 542,728 421,054
JOR PAPER & CARD FACT JOPC 2008 Q4 7,500,000 20,749,504 10,536,166 5,816 0.001 0.0% 0.1% 2.64 1.99 2.03 0.0% 15,225,000 P/E>100 N/A N/A
JOR PHOSPHATE MN JOPH 2009 Q1 75,000,000 560,330,563 448,168,760 31,055,167 0.414 22.4% 28.7% 64.70 15.30 21.60 12.2% 1,620,000,000 13.04 302,628 6,197,416
JOR PIPES MANFACT JOPI 2009 Q1 3,575,000 10,237,085 5,587,295 53,010 0.015 2.1% 3.8% 2.88 0.95 1.08 (13.6%) 3,861,000 18.21 374,078 421,118
JOR PETROLM REF JOPT 2008 Q4 32,000,000 523,790,000 65,373,696 7,724,317 0.241 1.4% 12.1% 18.99 4.80 8.20 9.0% 262,400,000 33.97 993,707 8,012,406
JOSECO JOSE 2008 Q4 5,000,000 3,352,039 3,319,560 (1,393,413) (0.279) (62.9%) (63.5%) 1.82 0.55 0.73 (2.7%) 3,650,000 Negative 95,373 69,640
JOR SELPHO CHEM JOSL 2008 Q4 5,000,000 11,058,303 5,675,979 (88,722) (0.018) (0.9%) (1.7%) 7.66 3.69 4.30 0.0% 21,500,000 Negative N/A N/A
JOR STEEL JOST 2009 Q1 35,000,000 81,050,838 44,874,406 2,982,699 0.085 14.8% 26.8% 8.45 1.38 3.38 4.0% 118,300,000 9.92 1,817,786 6,185,185
JORDAN TANNING JOTN 2008 Q4 1,500,000 2,343,940 1,553,749 (369,965) (0.247) (15.5%) (21.1%) 7.35 1.91 4.37 9.5% 6,555,000 Negative 308 1,346
JOR ROCK WOOLID JOWL 2008 Q4 3,000,000 2,742,702 1,981,205 132,825 0.044 5.0% 6.8% 1.33 0.75 0.82 2.5% 2,460,000 18.52 4,314 3,489
JOR WORSTED MILL JOWM 2009 Q1 15,000,000 77,351,579 73,554,786 2,077,037 0.138 10.5% 11.0% 6.71 4.01 4.75 1.1% 71,250,000 8.58 854 3,945
JORDAN PHARMA JPHM 2009 Q1 20,000,000 59,981,028 36,729,237 1,296,928 0.065 8.6% 14.4% 1.81 1.18 1.44 1.4% 28,800,000 5.55 39,476 58,184
JORDAN POUL PROC JPPC 2008 Q4 6,400,000 25,353,618 2,650,903 (3,844,823) (0.601) (16.7%) (102.7%) 1.27 0.39 0.40 0.0% 2,560,000 Negative N/A N/A
JOR VEG OIL IND JVOI 2009 Q1 3,000,000 16,391,132 5,005,244 109,177 0.036 2.8% 8.8% 3.15 2.01 2.01 0.0% 6,030,000 13.81 N/A N/A
ENJAZ LIPO 2008 Q4 3,335,942 3,231,208 2,804,565 73,011 0.022 2.2% 2.4% 2.45 1.18 1.22 (4.7%) 4,069,849 55.74 2,621 3,225
ARAB PESTICIDES MBED 2008 Q4 10,000,000 18,575,185 13,582,446 1,652,214 0.165 9.2% 13.0% 3.18 1.43 1.49 2.1% 14,900,000 9.02 14,775 22,117
MID EAST COMPLEX MECE 2009 Q1 100,000,000 417,865,801 169,861,315 (2,366,372) (0.024) (2.3%) (5.5%) 3.28 1.53 1.53 0.0% 153,000,000 Negative N/A N/A
MID PHARMA IND MPHA 2009 Q1 9,869,583 25,523,172 12,193,647 (24,446) (0.002) (0.4%) (0.8%) 3.33 1.57 2.45 6.5% 24,180,478 Negative 17,631 41,535
NATIONAL STEEL NAST 2008 Q4 4,000,000 10,119,785 2,517,662 (2,629,589) (0.657) (25.7%) (68.0%) 2.80 0.65 0.87 0.0% 3,480,000 Negative N/A N/A
NAT`L ALUM IND NATA 2009 Q1 9,000,000 17,388,359 11,534,072 373,974 0.042 8.4% 13.2% 1.64 0.81 0.85 0.0% 7,650,000 5.11 84,934 72,880
NAT CHLORINE NATC 2009 Q1 9,000,000 11,905,357 10,132,247 (171,906) (0.019) (5.7%) (6.4%) 1.36 1.04 1.08 (0.9%) 9,720,000 Negative 5,550 5,970
NAT`L POULTRY NATP 2008 Q4 30,000,000 77,246,925 57,656,640 4,606,448 0.154 6.1% 8.3% 2.30 1.81 1.85 (2.6%) 55,500,000 12.05 179 325
10
Amman Stock Exchange Weekly Report - Week Ended July 2nd 2009
Company Ticker Year Period Paid up Capital Total Assets Shareholders’
Equity Net Profit EPS(1)
ROAA (2)
ROAE (2) 52-Week
Last Closing
Price
WTD Change Market Cap P/E
(3) Trading Activity
High Low Volume Value
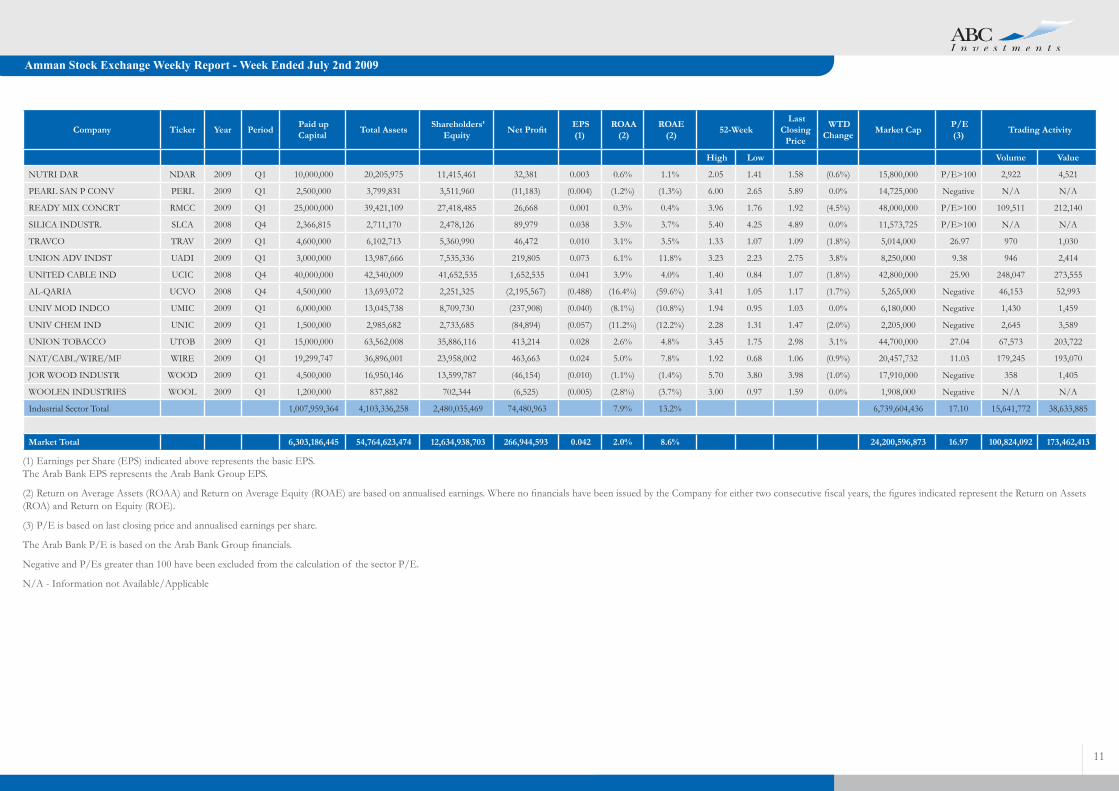
NUTRI DAR NDAR 2009 Q1 10,000,000 20,205,975 11,415,461 32,381 0.003 0.6% 1.1% 2.05 1.41 1.58 (0.6%) 15,800,000 P/E>100 2,922 4,521
PEARL SAN P CONV PERL 2009 Q1 2,500,000 3,799,831 3,511,960 (11,183) (0.004) (1.2%) (1.3%) 6.00 2.65 5.89 0.0% 14,725,000 Negative N/A N/A
READY MIX CONCRT RMCC 2009 Q1 25,000,000 39,421,109 27,418,485 26,668 0.001 0.3% 0.4% 3.96 1.76 1.92 (4.5%) 48,000,000 P/E>100 109,511 212,140
SILICA INDUSTR. SLCA 2008 Q4 2,366,815 2,711,170 2,478,126 89,979 0.038 3.5% 3.7% 5.40 4.25 4.89 0.0% 11,573,725 P/E>100 N/A N/A
TRAVCO TRAV 2009 Q1 4,600,000 6,102,713 5,360,990 46,472 0.010 3.1% 3.5% 1.33 1.07 1.09 (1.8%) 5,014,000 26.97 970 1,030
UNION ADV INDST UADI 2009 Q1 3,000,000 13,987,666 7,535,336 219,805 0.073 6.1% 11.8% 3.23 2.23 2.75 3.8% 8,250,000 9.38 946 2,414
UNITED CABLE IND UCIC 2008 Q4 40,000,000 42,340,009 41,652,535 1,652,535 0.041 3.9% 4.0% 1.40 0.84 1.07 (1.8%) 42,800,000 25.90 248,047 273,555
AL-QARIA UCVO 2008 Q4 4,500,000 13,693,072 2,251,325 (2,195,567) (0.488) (16.4%) (59.6%) 3.41 1.05 1.17 (1.7%) 5,265,000 Negative 46,153 52,993
UNIV MOD INDCO UMIC 2009 Q1 6,000,000 13,045,738 8,709,730 (237,908) (0.040) (8.1%) (10.8%) 1.94 0.95 1.03 0.0% 6,180,000 Negative 1,430 1,459
UNIV CHEM IND UNIC 2009 Q1 1,500,000 2,985,682 2,733,685 (84,894) (0.057) (11.2%) (12.2%) 2.28 1.31 1.47 (2.0%) 2,205,000 Negative 2,645 3,589
UNION TOBACCO UTOB 2009 Q1 15,000,000 63,562,008 35,886,116 413,214 0.028 2.6% 4.8% 3.45 1.75 2.98 3.1% 44,700,000 27.04 67,573 203,722
NAT/CABL/WIRE/MF WIRE 2009 Q1 19,299,747 36,896,001 23,958,002 463,663 0.024 5.0% 7.8% 1.92 0.68 1.06 (0.9%) 20,457,732 11.03 179,245 193,070
JOR WOOD INDUSTR WOOD 2009 Q1 4,500,000 16,950,146 13,599,787 (46,154) (0.010) (1.1%) (1.4%) 5.70 3.80 3.98 (1.0%) 17,910,000 Negative 358 1,405
WOOLEN INDUSTRIES WOOL 2009 Q1 1,200,000 837,882 702,344 (6,525) (0.005) (2.8%) (3.7%) 3.00 0.97 1.59 0.0% 1,908,000 Negative N/A N/A
Industrial Sector Total 1,007,959,364 4,103,336,258 2,480,035,469 74,480,963 7.9% 13.2% 6,739,604,436 17.10 15,641,772 38,633,885
Market Total 6,303,186,445 54,764,623,474 12,634,938,703 266,944,593 0.042 2.0% 8.6% 24,200,596,873 16.97 100,824,092 173,462,413
(1) Earnings per Share (EPS) indicated above represents the basic EPS.The Arab Bank EPS represents the Arab Bank Group EPS.
(2) Return on Average Assets (ROAA) and Return on Average Equity (ROAE) are based on annualised earnings. Where no financials have been issued by the Company for either two consecutive fiscal years, the figures indicated represent the Return on Assets (ROA) and Return on Equity (ROE).
(3) P/E is based on last closing price and annualised earnings per share.
The Arab Bank P/E is based on the Arab Bank Group financials.
Negative and P/Es greater than 100 have been excluded from the calculation of the sector P/E.
N/A - Information not Available/Applicable
11
Disclaimer
This document has been issued by ABC Investments for informational purposes only. The informationcontainedherein isbasedonsourceswebelievetobereliable,but itsaccuracy isnotguaranteedandsuchinformationmaybe incompleteor condensed.Thisdocument isnot, and shouldnot,be construedas anofferorthesolicitationof anoffertobuyorsellanysecurity.ABCInvestmentsacceptsnoliabilityforanylossordamageof anykindarisingfromtheuseof alloranypartof thisdocument.ABCInvestmentshasnoobligationtoupdate,modifyoramendthisreportortootherwisenotifyareaderthereof intheeventthatanymatterstatedhereinchangesorsubsequentlybecomesinaccurate.Thisdocumentmaynotbereproducedorcirculatedwithoutthewrittenconsentof ABCInvestments.
Research Department
TanyaKhammash,CVAHeadof [email protected]
BrokerageTel.+96265629300(ext.340-360)