Embed Size (px)
Citation preview

GEO-3900
Master’s Thesis in
GEOLOGY/GEOPHYSICS
3D seismic data indicate potential glide planes for submarine sliding: The mid-Norwegian margin Nyegga
area
Håkon Andre Eilertsen
May 2010
Faculty of Science
Department of Geology
University of Tromsø


GEO-3900
Master’s Thesis in Geology/Geophysics
3D seismic data indicate potential glide planes for submarine sliding: The mid-Norwegian margin Nyegga
area
Håkon Andre Eilertsen
May 2010


i
Foreword
Arbeidet med denne masteroppgaven har ikke alltid vært like enkelt og jeg må
innrømme at jeg ofte har sett ut vinduet på kontoret en godværsdag og ønsket at jeg var alle
andre plasser enn på skolen. Men det å skrive oppgave har også vært utfordrende, lærerikt og
interessant og en meget nyttig erfaring.
Jeg må få takke min hovedveileder professor Jurgen Mienert for all hans hjelp og
veiledning underveis og ikke minst for at jeg fikk skrive oppgave for ham. Jeg vil også takke
min med-veileder amanuensis Stefan Bunz for gode råd og ideer. Det har vært fint å kunne
komme innom kontorene deres når jeg har sittet fast.
Alle de flotte og trivelige folkene jeg har studert med må absolutt takkes både for det
sosiale samværet og for det faglige. Runar må takkes for fine diskusjoner ang. Ras og teknisk
hjelp, Linn, Kristina og Tom Arne takkes også for å ha delt gledene og sorgene med
oppgaveskriving. Folka på kontoret, Birgit, Morten, Petter og Sandra har vært flotte kolleger.
Kenneth og Kristian fra ”klassen” må også takkes for mange fine ekskursjoner og kollokvier
og mye annen moro. Alle de andre på Brakka og omegn takkes for kaffepauser, fester,
fotballtreninger og generelt supert sosialt miljø, ingen nevnt, ingen glemt! Alle mine andre
venner i Tromsø, både nye og gamle takkes også for fem flotte år i byen med mange gode
opplevelser.
Sist men ikke minst takker jeg foreldrene mine på Svalbard og besteforeldrene mine
på Skjervøy for støtte og oppmuntring underveis.
Tromsø mai 2010
Håkon Andre Eilertsen

ii
Abstract
The Nyegga study area of this thesis is located at the north-eastern escarpment of the
Holocene giant Storegga Slide. It lies on the southern part of the Vøring plateau on the mid-
Norwegian continental margin at approximately 700-1000m water depth. The area has been
known to be prone for submarine sliding and is therefore an excellent location for studying
morphological features to infer slide mechanisms and development. A major effect of
submarine slides is seen on the seafloor of the Nyegga area, as the Storegga Slide sidewall
marks a clear transition from undisturbed marine sediments to the disrupted, chaotic
morphology in the slide scar. Two other slides termed the T and U slides have been
discovered in the study area. All three slides lie within the Plio-Pleistocene Naust Formation;
both the T and U slides are likely of middle Pleistocene age, at 200 and 400 Ka respectively.
The three slides have been investigated using 3D seismic data provided by Statoil
(ST0408 cube). It allowed for mapping of the top and bottom horizons of the slides and
utilizing a volumetric approach for visualization and interpretation of the sliding processes
and directions. The identified kinematic indicators, which include slide blocks, ridges and
head-/sidewalls, suggest a similar north-south direction of material transport for all three
slides. For the Storegga Slide it refers to the post-sliding after the major east-west directed
slide event at 8180 cal years BP. 27 depression, fault-like features interpreted to be crown
cracks distributed amongst the slides were identified and their areal extensions quantified. The
presence of crown cracks and other morphological features suggest retrogressive slide
developments though alternatives are possible. Failure within the study area was initiated
because of a retrogression of slide material that occurred down-slope where excess pore
pressure may have decreased along layers that provided zones of weakness. A number of
glide planes have been observed for each slide, all of them occurring in marine deposits
representing zones of weakness. Today’s areas of spreading and crown cracks at Nyegga may
be a geohazard and a risk for nearby pipelines and installations on the seabed.

iii
Contents
Foreword ..................................................................................................................................... i
Abstract ...................................................................................................................................... ii
Contents iii
1. Introduction ........................................................................................................................ 1
1.1 Objectives .................................................................................................................... 1
1.2 Structure of the thesis .................................................................................................. 1
1.3 Submarine sliding ............................................................................................................. 2
1.4 Submarine sliding in the study area ................................................................................. 4
1.5 Submarine sliding – how and why ................................................................................... 8
1.5.1 Submarine sediment stability .................................................................................... 8
1.5.2 Triggering mechanisms for submarine sliding ........................................................ 10
1.6 Features and post-failure development of submarine slides .......................................... 12
1.6.1 Features of submarine slides ................................................................................... 12
1.6.2 Post-failure development of submarine slides ........................................................ 14
2. Geology of the Nyegga area ................................................................................................. 17
2.1 Regional geology ............................................................................................................ 17
2.1.1 Tectonic buildup ...................................................................................................... 17
2.1.2. Stratigraphy and sedimentation .............................................................................. 20
2.2 Oceanography of the Mid-Norwegian margin ............................................................... 27
2.3 Triggering mechanisms for submarine sliding in the study area.................................... 29
2.3.1 Earthquakes as triggering mechanisms in the study area ........................................ 30
2.3.2 Gas Hydrates as triggering mechanisms in the study area ...................................... 32
3. Data and Methods ................................................................................................................. 34
3.1 Data description .............................................................................................................. 34
3D Seismic cube ST0408 from StatoilHydro ................................................................... 34
3.2 3D Seismics .................................................................................................................... 36
3.2.1 Vertical resolution .............................................................................................. 37
3.2.2 Horizontal resolution .......................................................................................... 38
3.3 The Seismic interpretation tool (Petrel) ..................................................................... 41
3.3.1 Interpretation of 3D Seismic data ....................................................................... 41
3.4 Mapping and quantification of depression, fault-like features ....................................... 44
4. Results .............................................................................................................................. 45
4.1 Seismic stratigraphy and identification of slides ....................................................... 45

iv
4.1.1 Seismic stratigraphy ........................................................................................... 45
4.1.2 Identification of submarine slides ...................................................................... 46
4.2 Descriptions of the slides from ST0408 .................................................................... 50
4.2.1 The northern escarpment of the Storegga Slide ...................................................... 50
4.3.3 Slide U ..................................................................................................................... 67
4.3 Depression fault-like features .................................................................................... 76
4.3.1Depression fault-like features of the Storegga Slide ................................................ 76
4.3.2Depression fault-like features of Slide T .................................................................. 78
4.3.3Depression, fault-like features of Slide U ................................................................ 80
4.4 Areas of large amplitude anomalies ............................................................................... 82
5. Discussion ........................................................................................................................ 87
5.1 Correlation of slides ....................................................................................................... 87
5.2 Kinematic indicators ...................................................................................................... 91
5.2.1 Kinematic indicators of the Storegga Slide ............................................................. 92
5.2.1.1 The intact block on the seafloor ........................................................................... 93
5.2.2 Kinematic indicators of Slide T .............................................................................. 95
5.2.3 Kinematic indicators of Slide U .............................................................................. 98
5.2.4 Comparisons between kinematic indicators of the slides ...................................... 100
5.3 Crown cracks ................................................................................................................ 101
5.3.1 Crown cracks of the Storegga Slide ...................................................................... 102
5.3.2 Crown cracks of Slide T ........................................................................................ 104
5.3.3 Crown cracks of Slide U ....................................................................................... 105
5.4 Mechanisms and timing of sliding ............................................................................... 107
5.4.1 Mechanisms and timing of sliding at the northern Storegga Slide escarpment .... 108
5.4.2 Mechanisms and timing of sliding for Slide T ...................................................... 112
5.4.3 Mechanisms and timing of sliding for Slide U...................................................... 115
5.5Possible triggering mechanisms for submarine sliding ................................................. 120
5.5.1 Possible excess pore pressure ................................................................................ 120
5.5.2 Overpressurised layers and the presence of fluids ................................................ 121
5.5.3 Earthquakes as a trigger for retrogressive slide development ............................... 123
5.6 The evolution of “small-scale” submarine sliding in the Nyegga area ........................ 125
5.7 Future outlook .............................................................................................................. 126
6. Conclusions ........................................................................................................................ 127
References .............................................................................................................................. 129
Appendix ................................................................................................................................... A

1
1. Introduction
1.1 Objectives
The main objective of this thesis is to identify and map submarine slides in the Nyegga
area on the mid-Norwegian continental margin and carry out a geohazard study. This is
accomplished through the mapping of glide planes and the top surfaces of the submarine
slides. 3D seismic data will allow for a volumetric approach towards visualization and
interpretation of the slides. The goal is to identify several slides and interpret their similarities
and differences with regards to slide mechanisms and development.
1.2 Structure of the thesis
This thesis is divided into 6 chapters:
1) Introduction: This chapter gives the objectives and structure of the thesis, as well as
an introduction to submarine sliding.
2) Geology of the Nyegga area: A chapter which gives an overview of the development
of the study area of Nyegga, as well as an outline of potential triggering mechanisms
for submarine sliding in the area.
3) Data and methods: A chapter which gives the details of the dataset as well as an
introduction to the seismic method and the interpretation tools used in this thesis.
4) Results: The chapter where results of the seismic interpretation is presented.
Submarine slides and various features connected to them are identified and visualized
5) Discussion: The identifed features of chapter 4 are discussed in terms of what they
indicate for slide development, movement and mechanisms. Potential triggering
mechanisms are also reviewed.
6) Conclusions: A short summation of the most important conclusions of this thesis.

2
1.3 Submarine sliding
Submarine slides occur on active and passive continental margins (e.g. Mienert et al.
2005b). Sliding may take place when material deposited on a continental slope is exposed to
shear stress that exceeds its shear strength, causing failure and the initiation of downslope
movement of material. Materials that are involved are rock, soil, mud and mixtures of all
three (Locat and Lee 2002). The mass volume that is set into motion can be enormous when
compared to slides on land. The Holocene Storegga Slide, for instance, affected an area of c.
95 000 km2 and a sediment volume of 2400-3200 km
3 was displaced (Haflidason et al. 2004).
There is an increasing need for better knowledge of marine geohazards because of the
ongoing development towards deeper water hydrocarbon exploration, coastal zone
developments and underwater communication cables. Submarine mass movements are one of
the most important and potentially dangerous marine geohazards in terms of their extent,
frequency and consequences. The second largest gas field on the Norwegian continental shelf,
the Ormen Lange Field, is located in the slide scar of the Storegga Slide. A major program
was funded by oil companies prior to its development in order to evaluate the risks involved.
The seafloor failures are a major threat not only to oil and offshore industries but also to the
marine environment and coastal facilities. There are reports that suggest that the large
tsunamis that struck Lisbon and the Gulf of Cadiz and North Atlantic coasts both in Europe
and Africa in 1755 following an earthquake of about 8,5 probably had a submarine landslide
contribution as well (Gracia et al. 2003).
In contrast to large onshore slides that are easily identifiable features, submarine slides
are features that certainly are more difficult to visually identify. However their effects can be
seen on the seabed morphology and felt regardless of whether the slide itself is actually seen.
The Storegga Slide, for instance, generated a tsunami where its deposits reach onshore
elevations of 10-12 m above sea level of their time in western Norway, 3-6 m in northeast
Scotland and more than 20 m on the Shetland Islands (Bondevik et al. 2004). It can be
imagined that any humans living along these coasts would have noticed and felt the effects of
these waves, but they would not know their origin. Likewise, the Grand Banks slide of 1929
generated turbidity currents that together with the slide itself broke a series of submarine
cables up to nearly 600 km away from the beginning of the slide. This mass movement with a
calculated initial velocity of 25 m/s generated a tsunami that destroyed part of a village and
killed 27 people (Figure 1) (Locat and Lee 2002). In this case as well the slide itself would be
difficult to identify visually, but its effects were felt nonetheless.

3
Figure 1 - A boat towing a house that was washed to sea during the tsunami following the 1929 Grand Banks Slide. From Locat and Lee (2002).
The exploration of submarine slides, their deposits and processes, became possible
with the introduction of new technology. Development of submarine areal mapping in the
1960s dramatically improved the way morphological studies of the seafloor were carried out
and led directly to the discoveries of many previously unknown features on the seafloor. The
coming of the digital age transformed acquisition and processing of seismic data and
improvements in the quality of 2D seismic reflection profiles were rapid through the 1970s
and early 1980s (Cartwright et al. 2005). As a result of the many possibilities inherent in the
new technology submarine sliding has been the focus of a large number of publications and
projects since the early 1980s. For instance: ADFEX (Arctic Delta Failure Experiment, 1989-
1992), GLORIA (1984-1991, sidescan survey of the US Exclusive Economic Zone), STEAM
(Sediment Transport on European Atlantic Margins, 1993-1996), STRATAFORM (1995-
2001) and COSTA (Continental Slope Stability, 2000-2004). Methods employed for the
mapping and characterization of submarine slides include 2D and 3D seismics (e.g. Bugge et
al. 1988 and Bull et al. 2009b), side scan sonar data (e.g. Bulat et al. 2003 and Laberg et al.
2005), Remote Operated Vehicles (ROV) (e.g. Haflidason et al. 2004) and sediment cores
(e.g. Skinner and Bornhold 2003 and Haflidason et al. 2005).
4
1.4 Submarine sliding in the study area
This Master Thesis focuses on an area in the Nyegga area, which comprises the
northern escarpment of the Storegga Slide on the south of the Vøring Plateau between the
Møre and Vøring Basins on the mid-Norwegian continental margin (Figure 2).
Figure 2 - Colored relief map from part of the mid-Norwegian continental margin. The study area in the Nyegga area is outlined in the red rectangle on the northern slide scar of the Storegga Slide. The yellow frame marks area for Solheim et al. (2005a). The Storegga Slide is outlined in darker colors. The total outline of the slide, including distal turbidites, is marked in white in the index
map in the upper right corner. The Ormen Lange field is marked in red inside of the Storegga Slide scar. Modified from Solheim et al. (2005a).
The mid-Norwegian continental margin has long been known as an area where several
large submarine slides have been triggered, and is thus recognized as an excellent location for
their study. Many studies of submarine slides have been carried out, especially in relation to
the development of the Ormen Lange gas field, but also previous to its discovery (e.g. Bugge

5
1983; Bugge et al. 1988; Evans et al. 1996; King et al. 1996; Haflidason et al. 2003a;
Haflidason et al. 2004; Bryn et al. 2005b and Solheim et al. 2005a).
Submarine sliding has been known to exist on the western European Continental
margin south of Norway since the first regional seismic reflection survey was carried out here
in 1965 (Stride et al. 1969). The existence of a steep scarp at the continental margin of
Norway was identified by Holtedahl (1971), who suggested the occurrence of small-scale
sliding in this area; the area was later mapped in more detail by Bugge (1975) and Bugge et
al. (1978). In 1981, a joint cruise was undertaken by IKU (The former name of SINTEF
Petroleum Research) and the Institute of Oceanographic Sciences, U. K., with the R. R. S.
Discovery using long-range side-scan sonar (Gloria), medium-range side-scan sonar and air-
gun reflection seismic. The cruise investigated the continental margin of Norway from 60°
30´ N to 72° 30´ N (Figure 3). The investigation was especially focused in the area of the
Storegga Slide. Details of the nature of the scarp were first published in the 1980s, chiefly in a
series of papers led by Tom Bugge (Bugge 1983; Bugge et al. 1987; Bugge et al. 1988).
Figure 3 - Location of the Storegga Slide as found by Bugge et al. (1988). The slide is indicated by dotted pattern, the black line shows the ship`s track of the long-range side-scan sonar (Gloria)
survey. From Bugge et al. (1988).
Bugge (1983) described a number of other large and small slides that have occurred on
the Norwegian continental margin. Bugge (1983), Bugge et al. (1987) and Bugge et al. (1988)

6
described three slide events related to the Storegga Slide that removed 5 600 km3
of
continental margin sediment from an area of 112 000 km2. The first of these events, called
Slide I, was thought to have occurred 30 000 to 50 000 years ago, the second slide event was
dated to 8 000 to 5 000 BP. The area affected has since been revised by Haflidason et al.,
(2002) to 95 000 km2. The sediment volume removed has been revised to 2400-3200 km
3
(Haflidason et al. 2004).
King et al. (1996) used air gun seismic data with 10 m vertical resolution in order to
image large Quaternary sediment volumes in the North Sea Fan. These sediment volumes
were derived largely through shelf-edge glacial feeding. Four mass-movement events were
identified from these data, characterized by head- and sidewalls taller than 100 m, planar glide
planes covering over 15 000 km2 beneath thick (over 100 m), uneven, transported and
remolded blankets. The oldest slide, the North Sea Fan Slide-1 (NSFS-1), was thought to be
younger than 1 Ma. The Vigra Slide then immediately predated the Møre Slide which
occurred in the Middle Pleistocene while the Tampen Slide was thought to have occurred
between the Holocene and late Middle-Pleistocene. Evans et al. (1996) used seismic data from
a deep-towed boomer along with other seismic data to trace the northern flank of the Storegga
Slide in detail and found a slide event which pre-dated the youngest slide, Slide I, from Bugge
et al. (1987). Evans et al. (1996) also documented the existence of the Vigra, Møre and
Tampen slides on the North Sea Fan, thus confirming the long-term instability of the area.
Solheim et al. (2005a) investigated seven large pre-Holocene slides on the mid-
Norwegian continental margin between 62 and 67°N, (Figure 4). The majority of these slides
are located in the same area as the Storegga Slide and in the North Sea Fan (Figure 4A), with
the largest of the slides being comparable in size with the Storegga Slide. The slides described
range in age from the oldest slide W which is thought to be over 1.7 Ma, to the Holocene
Storegga slide. With the exception of the Sklinnadjupet and the Vigrid Slides, the slides are
all located in the area of the North Sea Fan and the Storegga Slide. This would indicate that
these areas are especially prone to submarine sliding. Other works have also been carried out
in the study area regarding submarine slides, for instance by Bull et al. (2009b) who identified
a smaller slide informally named the South Vøring Slide (SVS) (Figure 4B).
The investigations of Solheim et al. (2005a), along with many other articles, were
published in a special edition of Marine and Petroleum Geology, a thematic set on the Ormen
Lange Project in which a wide variety of topics related to safe development of the area with
regards to hydrocarbons were discussed.

7
Figure 4 - A displays a map of the study area for Solheim et al. (2005a), showing seven pre-Holocene slides. The Storegga Slide is outlined by a red line. Numbers 5-8 indicate locations of
seismic data examples in Solheim et al. (2005). The red rectangle gives the location of the study area. Modified from Solheim et al. (2005a). B displays a location map showing the study area for
Bull et al., (2009b) and the data used therein. SSC: Storegga Slide Complex, SVS: South Vøring Slide. The study area for this thesis is indicated by the red rectangle. Modified from Bull et al. (2009b).
8
1.5 Submarine sliding – how and why
1.5.1 Submarine sediment stability
As mentioned previously, for a slope failure to occur the shear stress it is exposed to
must exceed its shear strength. The infinite slope theory is, mathematically speaking, an
expression of balance between the maximum resisting force (the resisting force of the
sediment just prior to failure) and the shearing force (Løseth 1999). The ratio between these
two forces is called the slope`s factor of safety (FS) and specifies the likelihood for a failure.
This is an estimate of the ratio of the maximum resisting forces to the shearing forces. Where
FS > 1 indicates stability, FS < 1 indicates instability and FS = 1 indicates limit equilibrium.
The shearing force, Fs, is the downslope component of the normal force, the weight of the
sediment.
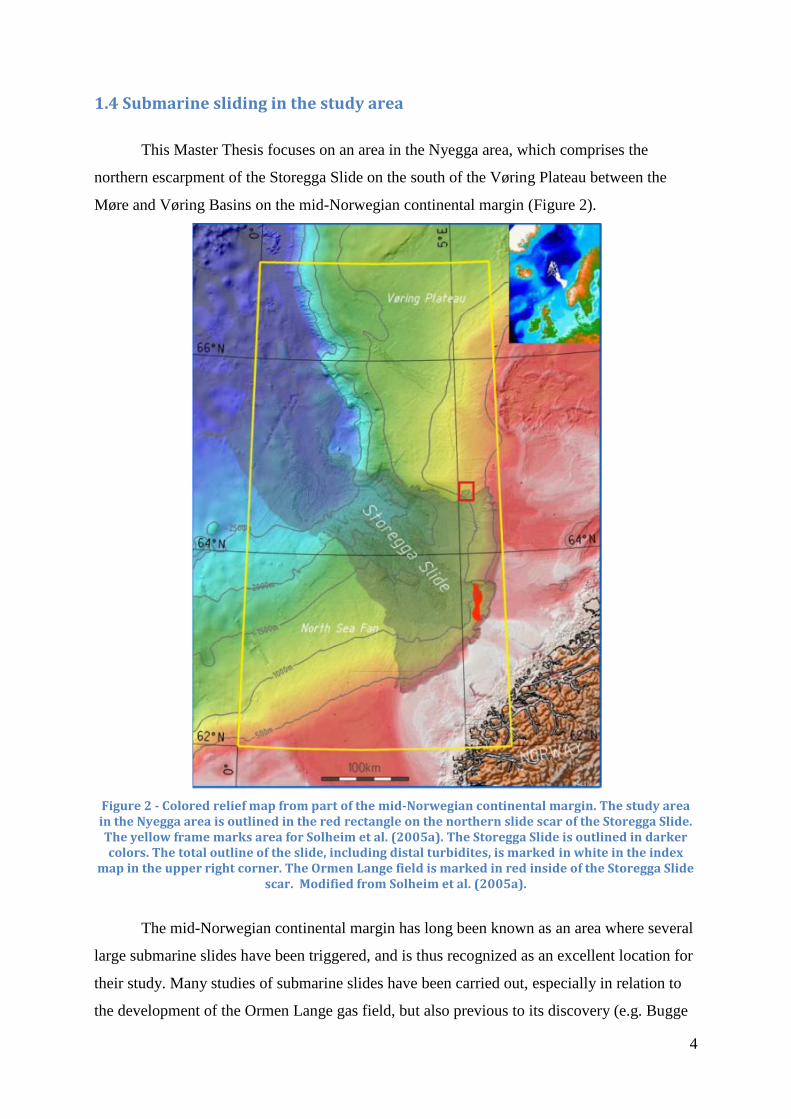
The strength of a sediment derives from four factors; plane friction, interlocking,
effective normal stress and cohesion.
Figure 5 - Demonstration of angle(s) of plane friction. Θ = critical angle at which the upper slab begins to slide, G = weight of the upper slab, FN = normal force, FS = shearing force at the slab
interface, Fr = resisting force. From Løseth 1999.
Imagine a situation where two blocks of sandstone rest upon each other and the lower
slab is tilted more and more until the upper slab begins to move (Figure 5). The weight of the
top slab is divided into G sin θ which acts up slope, and G cos θ acting normal to the slope.
The force acting normal to the slope is resisted by FN which acts in the opposite direction and
is equal in magnitude. The shear force, FS, is balanced by the frictional force, Fr, which acts
upslope at the point of contact between the two blocks. The shear strength, in this case the

9
friction between the two slabs, is dependent upon the coefficient of plane friction (f) and the
weight force acting to press the slabs together. Thereby,
Fr < FNf
where the two sides of the expression are equal at the point in time just prior to failure. At that
moment, the shear force and the natural strength are also just balanced. Once sliding has been
initiated, the friction will be decreased to a new value called the coefficient of sliding friction.
Interlocking of grains is another form of resistance against shear and is a measure of
the internal friction of sediments within the same deposit (Løseth 1999). The angle of internal
friction depends upon grain packing, mineral composition of the grains and the state of their
surface chemistry, and the roundness or angularity of the grains.
The total normal stress σ is given approximately by
σ = σ` + µ
where σ` is effective normal stress (inter particle force per unit area of the shear surface) and
µ is the pore pressure. Total normal stress is defined as the force acting normal to the shear
surface per unit area of the surface. This stress is absorbed by the sediment in two ways. Some
is taken up by grain contact along the shear surface and some is taken up by the pore fluid.
With regards to development of frictional resistance it is the effective normal stress and not
the total stress that is most important.
Sediments are considered to be cohesive if the particles adhere to one another after
wetting and subsequent drying and if some force is required to crumble them following this
(Løseth 1999). If the grains are easily moved as individuals, the sediment is considered to be
non-cohesive. Cementation, electrostatic and electromagnetic attractions, and primary valence
bonding and adhesion are considered to be sources of cohesion. This internal attraction among
grains will act against slope failure and sliding.
There are also several factors which, if subject to change, will decrease stability and
lead to a situation where the gravitational shear stress exceeds the sediments shear strength.
The greater the depositional angle, the greater the gravitational shear stress.
This applies for change in sediment mass as well, although an increase in the mass
could also increase the resisting force. For slopes of low and moderate inclination, the shear
resistance (which is proportional to normal force, FN and increases with the cosine of the slope
angle) grows more rapidly with increasing burial thickness than shear stress does, for steeper
slopes the opposite will be true. Therefore, sediment on a slope above a certain inclination
will become increasingly more unstable with larger burial depth.

10
Pore pressure and more specifically excess pore-fluid pressure is a very important
factor in submarine sediment stability. If, following a period of loading, the sediment lacks
sufficient permeability for the pore fluid to escape, the fluid will, because of its
incompressibility, have to sustain a disproportionate part of the load. It is this pressure that is
called excess pore-fluid pressure and is found in connection with unconsolidated or undrained
sediments. The effect on the sediment in this situation is lower effective and thereby lower
sediment strength (e.g. Løseth 1999 and Sultan et al. 2004a).
1.5.2 Triggering mechanisms for submarine sliding
For a change in the parameters mentioned above to occur, a triggering mechanism is
needed. This is an external stimulus that initiates the process of slope instability (Sultan et al.
2004a). Triggering mechanisms in the marine environment include: (1) high sedimentation
rates that lead to build-up of excess pore pressure (overpressurised layers) and
underconsolidation (weak layers), (2) loading and crust flexing by a static weight like a
grounded ice sheet, (3) fast loading by a dynamic weight such as an upslope landslide, (4)
dissociation of gas hydrates, (5) fluid seepage including seepage of shallow methane gas, (6)
bubble-phase gas charging, (7) presence of diagenetic fronts, (8) oversteepening of the
margin, (9) erosion at the base of the slope, (10) seismic loading due to earthquakes, (11) low
tides and storm-wave loading, (12) sea-level change, (13) volcanic growth and dyke
injection,(14) tectonic compression, (15) diapir and mound formation, (16) biologic processes
and (17) human activities affecting the seafloor (Canals et al. 2004). These triggers can be
considered as short term; in addition causal factors contribute to the instability but do not
initiate failure. The causal factors can be considered to be long-term triggers. In subsea
environments the causal factors might include the slope angle, mass-movement history and
unloading (Sultan et al. 2004a). The activities of humans, such as slope loading, can act as
either triggering mechanisms or causal factors depending on other conditions.
The most significant pre-conditions for COSTA landslides (Figure 6) are rapid
sediment loading effects, seismically active tectonic settings, presence of gas and diagenetic
fronts, and volcanic processes (Canals et al. 2004). Sedimentation effects refer mainly, though
not necessarily, to high sedimentation rates that are able to generate excess pore pressures and
also to climatically driven (Mienert et al. 2005b) or local processes able to form weak layers
like contourites (Laberg et al. 2005). Slope failure is especially common in five environments

11
that can be defined as submarine landslide territory; fjords, active river deltas on the
continental margin, submarine canyon fan-systems, the open continental slope and oceanic
volcanic islands and ridges (Hampton et al. 1996). Among the slides shown which are studied
in the COSTA project, representatives from four of these environments exist (Figure 6); fjords
(Finneidfjord Slide), active river deltas (Adriatic), open continental slope (Storegga,
Trænadjupet, BIG 95, Gebra and Afen slides) and oceanic volcanic islands (Canary). A
common feature for these environments which in some cases is very important for the
initiation of sliding is the presence of an inclined seafloor where the force of gravity drives
sediment and rock downslope. The angle of the seafloor can also be very low (≤1°) and a
submarine slide may still be triggered.
Figure 6 - Location of the instabilities studied in Canals et al., (2004). The Gebra Slide is located off the northern tip of the Antarctic Peninsula. From Canals et al. (2004).

12
1.6 Features and post-failure development of submarine slides
1.6.1 Features of submarine slides
The features characteristic for submarine slides (Figure 7) are a headwall scarp which
marks the upslope limit of the slide, a glide plane which is a surface which the failed material
is translated across and a disrupted or chaotic unit downslope consisting of the failed material.
Figure 7 – A schematic representation of a submarine slide and occurrence of headwall domain, glide plane (basal shear surface) and failed material. Numbers indicate various kinematic indicators discussed in Bull et al., (2009a), 1 is the headwall scarp. From Bull et al. (2009a).
The headwall area is dominated by extensional movement; an important element in the area is
the headwall scarp which represents an extensional failure surface (Figure 7). At headwall
scarps the glide plane ramps up and crosscuts younger strata lying higher up in the
stratigraphy, and intersects the surface (Bull et al. 2009a). Many slides, for instance the
Storegga Slide, develop as retrogressive slides, meaning that the failure spreads upslope thus
creating several headwall scarps (Gauer et al. 2005). The dimensions of slide scarps is
varying, from around 10 m in height and tens of meters across, to the Storegga Slide which
has a 300 km long headwall which is 250 m high (Bryn et al. 2005b). Crown cracks are a
feature often found on headwall scarps (Figure 7), they are elongate depressions or linear
features which occur near the headwall in strata that otherwise are undeformed and
13
undisplaced. Crown cracks are formed as a result of extensional stress as a result of the
downslope removal of material (Bull et al. 2009a).
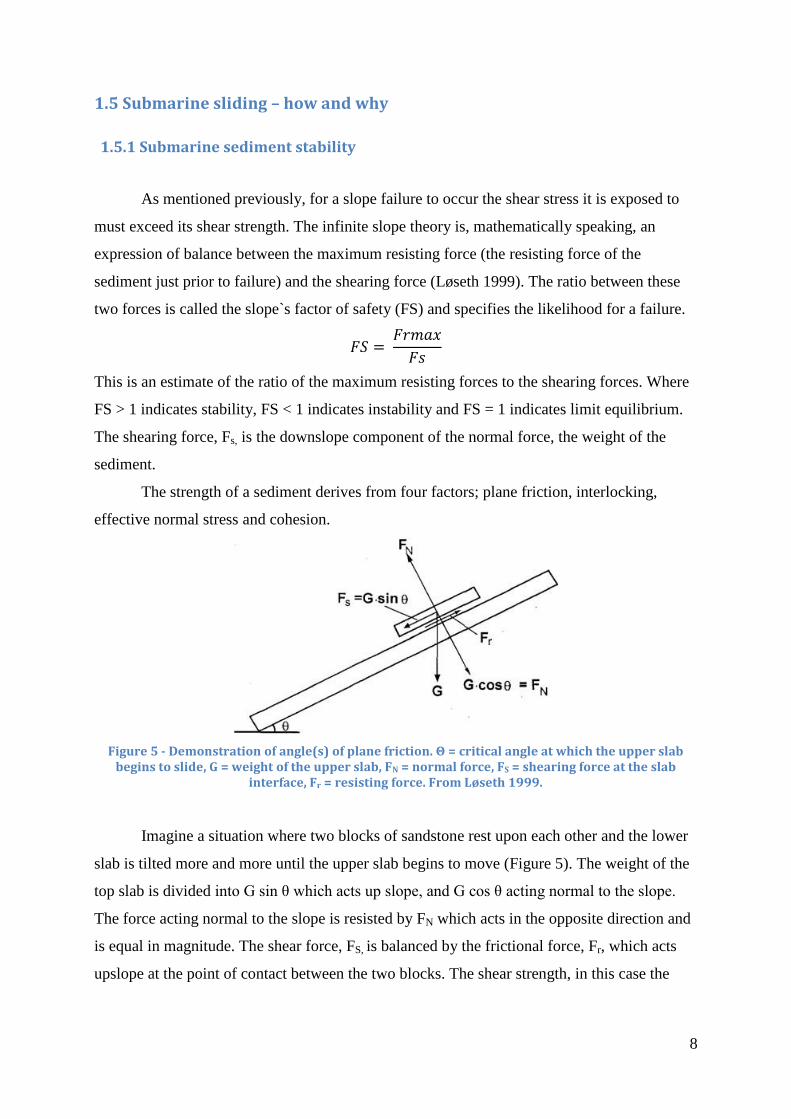
The glide plane (also called basal shear surface and detachment surface) is in most
cases continuous and parallel to bedding but may be influenced by for example faults. The
glide plane of a slide might cut up or down to a different stratigraphic level (Solheim et al.
2005a, Bull et al. 2009a) thus forming ramps and intervening flats. A ramp is a part of the
glide plane where that cuts discordantly across bedding while flats are parts of the glide plane
which are parallel to bedding (Figure 8).
Figure 8 - Seismic section through Møre slide glide plane; note steep discordant nature of ramps. The arrows indicate the direction of translation. From Bull et al. (2009a).
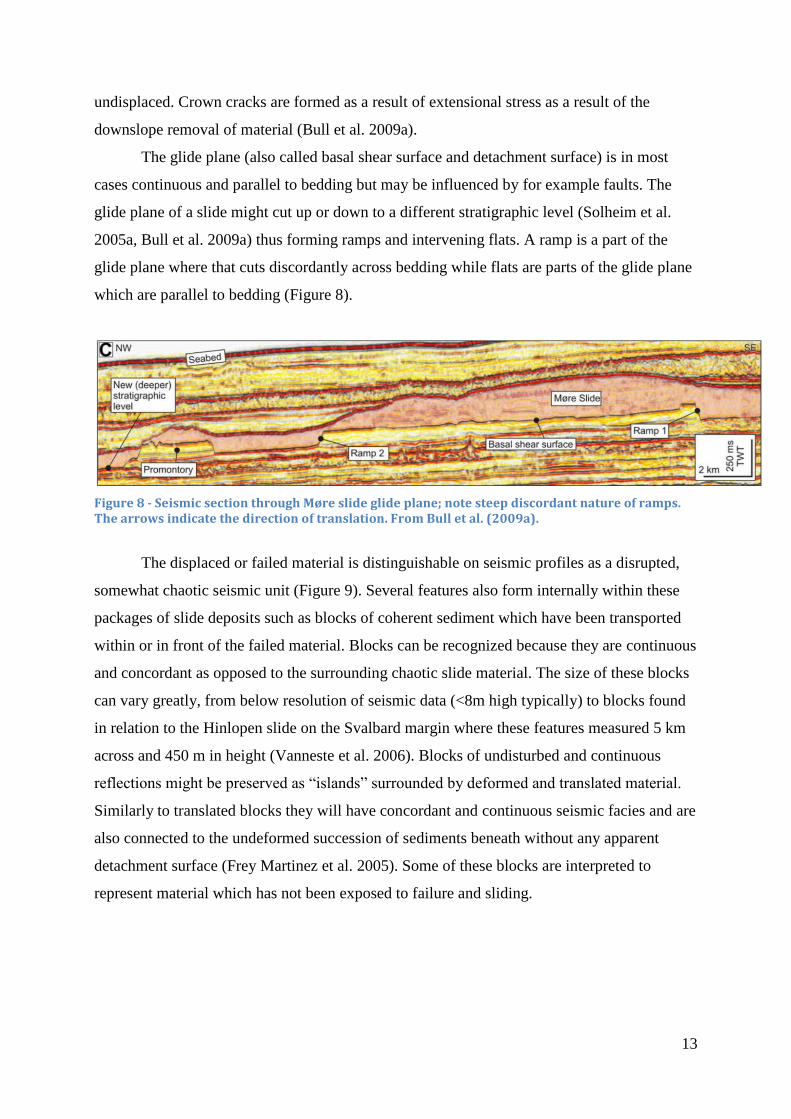
The displaced or failed material is distinguishable on seismic profiles as a disrupted,
somewhat chaotic seismic unit (Figure 9). Several features also form internally within these
packages of slide deposits such as blocks of coherent sediment which have been transported
within or in front of the failed material. Blocks can be recognized because they are continuous
and concordant as opposed to the surrounding chaotic slide material. The size of these blocks
can vary greatly, from below resolution of seismic data (<8m high typically) to blocks found
in relation to the Hinlopen slide on the Svalbard margin where these features measured 5 km
across and 450 m in height (Vanneste et al. 2006). Blocks of undisturbed and continuous
reflections might be preserved as “islands” surrounded by deformed and translated material.
Similarly to translated blocks they will have concordant and continuous seismic facies and are
also connected to the undeformed succession of sediments beneath without any apparent
detachment surface (Frey Martinez et al. 2005). Some of these blocks are interpreted to
represent material which has not been exposed to failure and sliding.

14
Figure 9 - Seismic section through part of the headwall scarp of the Storegga slide showing a series of blocks and intervening grabens. The failed material is indicated in red. Modified from Bull et al. (2009a).
1.6.2 Post-failure development of submarine slides
The post-failure development of a submarine slide typically involves a transition of
material from a solid to a liquefied state (Bryn et al. 2005b, Hampton et al. 1996). The
evolution of a slide can generally be described as happening in three main phases; initial
failure and formation of blocks and slabs, debris flows, and turbidity currents (Bryn et al.
2005b) (Figure 10). These three main phases are all driven by gravity, but in different ways.
The initial sliding is driven only by gravity whereas the debris flows are driven by its fluid
content with laminar flow and the turbidites by turbulent flow.
Figure 10 - Schematic representations of the different stages of slide development from slope failure to turbidite. From Bryn et al. (2005b).

15
The initial sliding phase takes place when the material is exposed to shear stress which
exceeds its shear strength. During the initial phase of sliding the material is more or less
cohesive and moves downslope as blocks and slabs of sediment driven purely by gravity. As
the material moves downslope the water content will increase and eventually debris flows will
form (Bryn et al. 2005b). Debris flows are slurry-like flows of varying grain size,
concentration, velocity and internal dynamics (Leeder, 2006). The matrix of a debris flow
consists of clay-grade fines and water and within this matrix grains of all sizes, from silt- to
boulder size, may be set in motion. Debris flows will usually have a greater runout than the
initial sliding phase and thus carry material further down the slope. The debris flows will
gradually transform along their upper edges by turbulent separation into surge-like turbidity
flows which might overtake the parent flow (Hampton, 1972). In regards to turbidity flows,
movement on a slope occurs as a result of changed density between local fluid and a
surrounding fluid (Leeder, 2006). The component of the weight force acting on the slope due
to the density difference is the driving force of turbidity currents. Density differences will
arise as a result of the mass of suspended slide material the turbidity current contains.
Turbidity currents are capable of carrying failed material large distances down slope and into
basins before losing energy and depositing them.
Mulder et al. (1997) modeled and studied the Nice 1979 slide with the conclusion that
the event resulted from the quick transformation of a slide into a debris flow and later into a
two-component turbidity current (Figure 11).
As a result of in-place stress, sediment properties and local morphology the failed
mass will either travel only a short distance before being deposited, or evolve into a flow
which covers a large area (Hampton et al. 1996). Runout for a submarine slide is defined as
the horizontal distance between the upper edge of the slide headwall and the distalmost point
reached by sediments mobilized during a slide event (Canals et al. 2005). The runout
distances of slides vary greatly; the Storegga slide for instance, has a runout of 770 km, the
Canary slide 600 km, the Trænadjupet slide it is 200 km (Canals et al. 2004 and for the Arctic
Hinlopen slide the runout is at least 300 km (Vanneste et al. 2006).

16
Figure 11 – Interpretative scheme showing the evolution of the 9179 Nice turbidity current and its different aspects through time and space. A: Triggering, B: debris flows, C: formation of dense bottom flow, D: plume formation, E: gravel waves formation, F: sandy turbidite deposition by plume, G: final deposition. Modified from Mulder et al. (1997).

17
2. Geology of the Nyegga area
2.1 Regional geology
The study area of Nyegga lies at the northern slope of the Storegga slide on the mid-
Norwegian continental margin. The mid-Norwegian margin is the area from the northern
parts of the North Sea, at 62ºN, to the steep continental rise in Lofoten at 68ºN. The NE-SW
oriented Cretaceous Vøring and Møre Basins are important features of this area. They are
flanked by palaeo-highs and platforms and the Norwegian mainland. The Faeroe-Shetland
escarpment comprises the boundary between the marginal highs and the basins in the south,
while the Vøring Escarpment provides the boundary to the south (Figure 12 and Figure 13).
The current structure of the margin is a result of multiple rifting events where volcanism and
uplift occurred.
2.1.1 Tectonic buildup
The tectonic activity that developed the present structural makeup of the continental
margin can be traced back to Permian and Carboniferous times (Figure 12 and Figure 13)
(Bukovics and Ziegler 1985). Three main episodes of rifting have been discerned, in
Carboniferous to Permian, in late Mid-Jurassic to Early Cretaceous and in late Cretaceous to
Early Eocene times (Brekke 2000). During Carboniferous to Early Cretaceous times there
was extension related to continental rifting. During the Late Cretaceous and especially the
Tertiary, extensions were more influenced by relative movement along plate boundaries
before and simultaneously with the continental breakup of the North Atlantic. The structural
style of the Mid-Norwegian continental margin is at shallow levels characterized by a
uniform prograding wedge deposited during and after crustal separation between Norway and
Greenland in the Eocene. On the inner shelf this wedge overlies the Trøndelag Platform
which is limited to the West by a complex fault zone which marks the eastern boundary of
the Møre and Vøring Basins. The rotated blocks on the Halten Terrace and development of
small basins over listric normal faults are characteristic for late Jurassic rifting in the Møre
and Vøring Basins, where maximum subsidence occurred in the Cretaceous (Brekke 2000).

18
Figure 12 - Structural map of the Norwegian Sea continental margin. The NH-1 seismic line is displayed in Figure 13. From Eldholm et al. 1989.
The diverging of plates and following continental break-up in late Paleocene-early Eocene
times brought with it extensive volcanic activity. The Vøring and Møre highs were built by
lavas extruded in late Paleocene by an elevated spreading axis. Post break-up, the Vøring and
Møre margins have both subsided by a considerable amount (Bukovics and Ziegler 1985).

19
Figure 13 - Interpreted seismic section across the Vøring margin with main geological and structural elements. From Eldholm et al. (1989). See Figure 12 for location.
In the Cenozoic the main phases of strike-slip movement in the Vøring Basin have
coincided with the Alpine orogenies
Throughout the Cenozoic there have been several episodes of crustal movements on
the Mid-Norwegian continental margin; these have led to the forming of regional highs that
have later been covered by sediments. The Ormen Lange dome and the Helland-Hansen arch
are two of several such highs. They were formed in response to the ongoing seafloor
spreading in the Atlantic and there are varying theories as to how the formation occurred
(Ramberg et al. 2006). One theory is that when seafloor spreading was initiated, the plates on
each side of the spreading ridge were pushed together and folded against areas of bedrock in
Norway and Greenland. Another theory is that these highs are linked to newer movement
along Jurassic structures deeper in the crust and have affected the younger layers on top. It
appears as though these highs have been elevated in several periods in the time between 70
and 100 Ma. These periods of elevation seem to vary for each high, and their shape also
varies. These differences in age and shape imply that the highs have possibly been formed by
different geological processes (Ramberg et al. 2006).

20
2.1.2. Stratigraphy and sedimentation
The two major basins of the Norwegian Sea continental margin, the Vøring and Møre
Basins, have a very thick Cretaceous basin fill. This is because of a high degree of subsidence
in the Cretaceous following the Mid-Jurassic – Early Cretaceous extensional phase (Brekke
2000). On the Vøring margin there have been drilled wells that showed sediments containing
clay and silt with some sand as well (Hjelstuen et al. 1999). On the Møre margin sediments
consist of poorly sorted stacked sandstones organized in coarsening upwards parasequences
separated by marine shales. The Møre Basin contains mudstones which are bioturbated as
well as some sandy turbidites (Swiecicki et al. 1997). In the Paleocene the main depocenter
was located in the western and central Vøring basin. Erosion of the Vøring High and other
emerged areas such as fault blocks were the main source area for the depocenter (Hjelstuen et
al. 1999), these deposits are thinner towards the east and absent on the highs (Figure 13).
On top of the Cretaceous and Paleocene deposits lie Eocene and Oligocene mega
sequences which comprise the Brygge Formation. Following regional uplift during the
Paleocene with marine conditions and subaerial exposure of large areas, the whole margin
underwent subsidence and the ocean transgression flooded the margin and parts of the
mainland. The Brygge Formation was deposited in this period and is dominated by clay at the
present shelf and is ooze-dominated in more distal parts in the Møre and Vøring Basins.
Sediments were mainly deposited in the Møre Basin as well as outer parts of the Vøring
Basin; thicknesses were around 600-1000 m and 500-700 m, respectively (Eidvin et al. 2007).
Eocene sediments are present in both the Møre and Vøring basins, but their absence over
regional highs such as domes, and ridges as a result of erosion of these features, indicate that
these were important source areas. Sediments from the Oligocene mostly occur south of the
Helland-Hansen Arch but are, like the Eocene sediments, not present over topographic highs
(Hjelstuen et al. 1999).
Dalland et al. (1988) divided the Neogene succession off Mid-Norway into the Kai
and Naust formations which are of Miocene to Lower Pliocene and Late Pliocene to recent
age, respectively. The Kai formation, which comprises deposits 23-2.6 Ma old, consists of
clayey ooze deposits which are rich in both siliceous and calcareous microfossils. Glacial
flour, fine grained minerals in the clay, is found in the whole Kai formation and shows the
effects of physical erosion (Forsberg and Locat 2004). The Kai formation has a record
showing basinal, deep-water sedimentation deposited by bottom-currents. This formation is
made up of predominantly deep-water basinal sedimentation which onlaps the near-lying

21
continental slope and domes of Paleogene age in Storegga and Vøring Plateau areas , its
thickest accumulation is on the Vøring Plateau, where up to 1 000 m of drift deposits are
present (Figure 14).
Figure 14 - Thickness map of the Kai Formation showing contouritic drift depocenters. On the Vøring Plateau the drifts are found along the western slopes of the main domes (green) which indicates that these topographic highs influenced current paths. NAC; Norwegian Atlantic Current, N; Naglfar Dome, V; Vema Dome, HH; Helland Hansen Arch, M; Modgunn Arch and O; Ormen Lange. From Bryn et al. (2005b).
The variations in thickness of the Kai Formation can be attributed to the fact that its
deposition and distribution is to a large degree controlled by hemipelagic deposition at great
water depth and erosion and influence from contour currents (Figure 14). The base Neogene,
or base Kai, is represented by a mainly angular submarine erosion surface which separates
Miocene strata from underlying, older, Paleogene strata. It extends from the Trøndelag
22
Platform into the Møre and Vøring Basins (Stoker et al. 2005). The base Kai unconformity
(BKU) lies within a deep-marine succession of contourites that is continuous from the
topmost parts of the Paleogene Brygge Formation and into the Kai Formation (Laberg et al.
2005).
The upper Neogene Naust Formation shows a clear change in the style of
sedimentation from around 4 Ma. The change is given by the initiation of major, seaward
progradation of the Mid-Norwegian margin, and also changes in oceanographic circulation
(Bryn et al. 2005b). The Naust Formation is bounded by the base Naust unconformity (BNU)
and the sea bed. The BNU is inferred to reflect a combination of tectonic modification of
bathymetry and an increase in velocity of the southward moving bottom currents because of a
strengthening of the Norwegian Sea Deep Water (Laberg et al. 2005). The formation is made
up of a series of prograding sediment wedges that stretch westward from the coast of
Norway.

23
The Naust Formation has been subdivided into five different sequences by Rise et al.
(2006), named Naust N, A, U, S and T
in decreasing age (Figure 15). The
nomenclature for the different
sequences has varied, but for this
thesis I will be using the most recent
one suggested by Rise et al. (2006).
The sediments of the Naust Formation
for the most part have a glacigenic
origin; however glaciomarine,
contouritic and hemipelagic deposits
occur intermittently. The seismic
character of the Naust Formation is
markedly different from the underlying
Kai Brygge and Molo formations. The
increase in sedimentation rate during
the last 2.8 Ma when Naust was
deposited compared to previous
formations is significant (Rise et al.
2005). The Mid-Norwegian margin
received large quantities of sediment
from the mainland as well as inner
shelf areas which prograded into a
basin with an inferred water depth of
500-1000m. Supply of sediment into
the Vøring Basin was reduced by the
Helland-Hansen Arch. During
deposition of the Naust Formation the
continental shelf prograded up to 200 km west and left behind a thick sediment package of
about 1-1.5 km depth of sediment on the outer shelf and upper slope (Rise et al. 2005). The
significant increase in the sediment supply to the margin is inferred to be a direct result of
increased erosion because of tectonic uplift of the mainland and the start of glacial times in
Scandinavia. Crystalline bedrock and Ceonozoic sediments were easily eroded in
Figure 15 - Diagram showing the Naust stratigraphic scheme (NDP, unpublished data 2004a) Correlation with previous terminologies and subdivisions in and North of the Storegga Slide is shown. Proposed ages for Naust N, A and U are uncertain. From Rise et al. (2006).

24
Figure 16 - North-south running regional seismic section through the northern part of the Storegga Slide. DF; debris flow, CD; contourite deposits. From Berg et al. 2005. Note that the nomenclature is different from the one used in the present thesis but that a correlation can be seen in Figure 15. From Berg et al. 2005.
early Naust times and also the inner parts of the continental shelf were uplifted and eroded
and a marked truncation of westerly dipping sedimentary rocks indicate that much material
was removed and transported westwards (Rise et al. 2005).
During Naust N time large amounts of sediment were deposited on the mid-
Norwegian margin (around 2.8-1.5 Ma), this period is characterized by glaciations on the
mainland, however glaciers did not reach the shelf on the mid-Norwegian margin until 1.1
Ma. Terrestrial glaciers are inferred to be an important agent for erosion and transportation
for denudation of the uplifted mainland areas (Rise et al. 2006). The margin has had repeated
advances and withdrawals of major ice sheets the last 500 Ka with a period of 100 Ka for
each cycle. Fast ice-streams have transported and deposited thick till deposits to the shelf and
these would build up and eventually be released down slope as debris flows and turbidity
25
currents (Solheim et al. 2005a). In the periods in between shelf edge glaciations, hemipelagic
and contouritic deposition was dominating on the shelf edge. This cyclic deposition has been
identified as an important precondition for the repeated sliding events in the area (Bryn et al.,
2005b; Mienert et al. 2005a; Solheim et al. 2005a). The deposits of the Naust Formation are
at their thickest at the Vøring Plateau and in the North Sea Fan where they have a thickness
of approximately 1500-1750ms TWT (Figure 17). For the Nyegga area the thickness is
varying from around 500-1250ms TWT for the entire Naust Formation. According to Figure
17, Naust W is almost entirely absent, while Naust U&S and Naust R&O have thicknesses of
around 200-500ms TWT. The thickness of the formation on the mid-Norwegian margin as a
whole naturally decreases westwards towards the deeper part of the ocean basin (Rise et al.
2005).

26
Figure 17 - Time thickness maps (two way travel time; TWT) of: (a) Naust Formation: (b) Naust W: (c) Naust U and S: (d) Naust R and O. Note that the sediment thicknesses in the southern area increase towards younger ages. The blue line shows the present-day shelf break. The interpreted seismic line (e) illustrates the shelf to slope development at Haltenbanken through Naust time, west of the Molo Formation (yellow) URU: Upper regional unconformity. From Rise et al. (2005).

27
2.2 Oceanography of the Mid-Norwegian margin
The opening of the Norwegian-Greenland Sea was an important event which led to an
interconnected, Arctic-North Atlantic thermohaline circulation system in the mid-Miocene
through both Northern (Fram Strait) and Southern (Faroe Conduit) Oceanic gateways (Thiede
et al. 1996). Generally speaking, this system of surface circulation consists of warm and
saline Atlantic water moving northwards as the Norwegian Atlantic Current (NAC). It cools
due to heat loss towards the north and sinks to form the Norwegian Sea Deep Water (NSDW)
(Bryn et al. 2005a). The southerly return of the NSDW towards the Atlantic Ocean occurs via
deep-water-passageways such as the Faroe Conduit.
The NAC has two northward-flowing parts close to the Mid-Norwegian margin (Bryn
et al. 2005a). The eastern part flows through the Faroe-Shetland region and over the upper
part of the Storegga Slide area (Figure 18). The western part flows across the Greenland-
Scotland Ridge, between Iceland and the Faroe Islands, and follows the continental slope
north of the Faroe Islands to the Storegga area above the lower escarpments of the Storegga
Slide. It continues northwards along the outer parts of the Vøring Plateau. At about 0.6 Ma a
change in oceanographic conditions took place (Henrich et al. 1994). This time is marked by
the onset of large amplitudes in glacial/interglacial environmental conditions with warm
interglacials and a strong inflow of the NAC. Similar conditions are inferred to be prevalent
also during interglacials and interstadials.
The NAC dominates the upper water column down to the strong termocline which
fluctuates between water depths of 500-700 m. Over this interval the water temperature
decreases from 5-6 to >0ºC (Mienert et al. 2005b). Below the termocline the dominating
water mass is the Norwegian Sea Arctic Intermediate Water (NSAIW). As a result of
atmospheric forcing, the NAC shows a large degree of variability reflected in a wide range of
current speeds and directions. The underlying NSAIW is more stable and uniform. The
direction of flow for the NSAIW follows the bottom topography and has an average speed of
0.5-0.6 m/s.

28
Figure 18 - The Norwegian Atlantic current (red colour) along the margin (From Orvvik and Niile, 2002). WTR: Wyllie Thomason Ridge, FSC: Faroe Shetland Channel, S: Trænadjupet Slide, NB: Norwegian Basin, LB: Lofoten Basin, From Bryn et al. (2005a).
An important oceanographic factor influencing glide plane development and
submarine sliding on the mid-Norwegian continental margin is the distribution of contourite
currents and their related deposits. Mass failure has been a dominant factor in shaping the
margin especially the last 0.5 Ma; however contourite currents have also been prevalent
during this time interval (Bryn et al. 2005a). Infill sediment drifts in the palaeo slide-scars are
important parts of the slope apron. The most important properties of these drifts in relation to
mass wasting are: (1) smoothing of rough seabed created by slide and glacial debris flows,
and the generation of laterally extensive, homogenous layers with sediments that are more

29
compressible than glacial deposits, and (2) the generation of thick sediment bodies with high
water content that develop excess pore pressure as a result of rapid loading by glacial debris-
flow deposits on top of sediment drift bodies.
2.3 Triggering mechanisms for submarine sliding in the study area
Perhaps the most important cause for the Storegga areas tendency to be slide prone is
the fact that it favors drift deposition as it forms a large embayment in the margin (Bryn et al.
2005b). The NAC transports sediments northwards from for example the North Sea Fan area
which tend to be deposited in this area. This is illustrated by the up to 30 m of fine grained
drift deposits accumulated in the Storegga area the last 8 200 years (Bryn et al. 2003). The
marginal highs which surround the area form barriers for deposition towards the northeast
and southwest, these features are also important for the predisposition towards sliding which
exists in the area.
The earliest known slide on the margin occurred at 1.7 Ma (Solheim et al. 2005a),
under Naust N times. All known slides on the mid-Norwegian continental margin have in fact
been triggered during the time of deposition of the Naust Formation. The sliding in the region
is closely linked with its depositional and glacial history and is most likely controlled by the
cycles of glacial and interglacial conditions (Bryn et al. 2005b, Solheim et al. 2005a) that
have been prevalent (Figure 19). Under times of peak glaciation, when ice sheets reached all
the way out to the shelf break, large sediment packages of till and glacial debris were
deposited on the outer shelf and upper parts of the continental slope. Under interglacial
periods marine sediments were deposited on the shelf, mainly hemipelagic and contouritic
deposits. This variation in deposition seems to be the most significant preconditioning
mechanism for sliding in the region with the rapid loading leading to a buildup of excess pore
pressures in the marine sediments (Solheim et al. 2005a). Excess pore pressure occurs when
the length of drainage path increases faster than the time required for consolidation and fluids
are “trapped” within sediments, in this case the contouritic marine clays and oozes of the Kai
and Brygge Formations, the highest overpressure was located in areas close to glacial
depocenters (e.g. Bryn et al. 2005b)
This buildup of excess pore pressure might also be considered as the causal factor for
the sliding, a long-term trigger that needs a “push” in order to result in slope failure. In the
case of the mid-Norwegian margin the suggested triggers are earthquake activity and

30
dissociation of gas hydrates (Bugge et al. 1983, Bugge et al. 1988, Atakan et al. 2004, Bryn et
al. 2005b, Mienert et al. 2005b).
Figure 19 - Conceptual model illustrating the development of the Møre Margin during the last c. 0.5 Ma. The last three gigantic slides seem to be cyclic events occurring after extensive glaciations. Note that weak layers in the fine-grained sediments infilling the slide scars acted as glide planes for younger slides. From Rise et al. (2005).
2.3.1 Earthquakes as triggering mechanisms in the study area
In the Storegga region the isostatic deformation and reactivation of late Jurassic-Early
Cretaceous faults as a result of glacial sediment interglacial loading and isostatic rebound
likely caused increased earthquake activities. Today, there is still a higher earthquake activity
in areas adjacent to Quaternary depocenters than elsewhere on the Norwegian continental
margin (Atakan et al. 2005) (Figure 20).

31
Figure 20 - The approximate location of the Storegga slide (in thin black polygon). Earthquake epicenters (since 1745) are shown as grey circles (data from the Norwegian National Seismic
Network. It should be noted that the majority of the epicentres are from the digital instrumetal period since 1982. Earlier earthquakes (especially historical ones) may have a significant
unceratinties in location. The black box outlines the area where stress transfer analyses are performed for selected faults by Atakan et al. 2005. From Atakan et al, 2005.
According to Atakan et al. (2005) it is reasonable to assume that an earthquake with
enough energy could act as a triggering mechanism for the Storegga slide. Today, the chance
of such an earthquake taking place is small because crustal stresses and earthquake
occurrences heavily influenced the situation directly following deglaciation. The existence of
fault scarps in northern Scandinavia indicates the occurrence of large earthquakes over >M7
as a result of the deglaciation process and the following isostatic rebound (Atakan et al. 2005,
Bungum et al. 2005). Occurrence of earthquakes of this magnitude has not been verified on
the mid-Norwegian margin (Bungum et al. 2005) and there are few structures capable of
generating them. Atakan et al. (2005) concluded that the effect of dynamic loading due to
ground shaking, co-seismic displacement and stress transfer in combination, as a result of a
large earthquake could be a possible triggering mechanism for the Storegga slide.

32
2.3.2 Gas Hydrates as triggering mechanisms in the study area
On continental margins around the world substantial amounts of natural gas are stored
within the pore spaces of the sediments in the form of hydrates. These are ice-like crystalline
solids consisting of gas frozen in cages by molecules of water. These compounds exist only
in areas where the temperature-pressure regimes are within the Gas Hydrate Stability Zone
(GHSZ), meaning high-pressure and low temperature. The supply of water and gas (methane
in most instances) is also a deciding factor in forming hydrates. These factors in reality limit
the occurrence of marine gas hydrates to the upper hundred meters of sediment on continental
margins. In these areas biogenic processes may produce a sufficient amount of methane
(Bunz et al. 2003). Sub-bottom depth of the GHSZ will depend on geothermal gradient,
bottom water temperature, pressure, gas composition, pore water salinity and physical and
chemical properties of the host rock (Bunz et al. 2003).
Concerning this thesis, gas hydrates are important because changes in the GHSZ are
one of the factors that might affect the stability or instability of continental slope areas since
gas hydrates can cement sediments and increase stability. They can also inhibit sediment
compaction and fluid migration to the surface because they decrease permeability of the
sediment. Dissociation of gas-hydrates may therefore lead to slope failure through two
different processes. Previously hydrate-cemented sediments may liquefy and become
underconsolidated. Secondly, gas trapped underneath remaining hydrates might comprise a
weak layer of overpressurised sediments (Bunz et al. 2003).
Gas hydrates have previously been inferred to exist in the study area of Nyegga based
mostly on the presence of BSRs (Bottom Simulating Reflection) (e.g. Bouriak et al. 2000,
Bunz et al. 2003). The BSR normally represents the base of the gas-hydrate stability zone
(BGHSZ) (Bouriak et al., 2000). It is a result of an acoustic impedance contrast between
hydrate-bearing sediments and free gas trapped in sediments below the hydrates. Hydrates
might, however, be present also in the absence of a BSR (Vanneste et al. 2001). Because of
its dependence on pressure-temperature conditions, the BSR will mimic the seafloor and
cross-cut strata. The distribution of the BSR in the area has been studied in numerous
publications (e.g. Bouriak et al. 2000; Bunz et al. 2003; Bunz et al. 2004; Mienert et al.
2005a). The findings of Bunz et al. (2003) in regards to regional distribution of the BSR on
the mid-Norwegian margin is shown on Figure 21. Of course, the identification of a BSR on a
seismic section is not a sufficient proof in and of itself of the presence of gas hydrates. Ivanov

33
et al. (2007) carried out gravity coring on the Vøring Plateau, and confirmed the occurrence
of gas hydrates in the area.
Figure 21 - a) Distribution of the BSR on the mid-Norwegian margin and b) time thickness map of the glacigenic debris flow deposits. Regional differences in seismic character of the BSR and geologic setting lead to a subdivision into four BSR provinces (grey dashed lines). From Bunz et al. (2003).

34
3. Data and Methods
3.1 Data description
3D Seismic cube ST0408 from StatoilHydro
The dataset used for 3D interpretation in the present thesis is the ST0408 seismic cube
from StatoilHydro which covers an area of approximately 350 km2 and has a recording length
of 3.1 s, its approximate location can be seen on Figure 2. The dataset consists of 691 inlines
numbered from 2605 to 3987 skipping every other line so that it jumps from 2605 to 2607
etc. The number of crosslines is 816, numbered 1-816. The bin spacing is 25 m which gives a
good spatial resolution. Zerophase waveform has been used for processing of the data and it
has been recorded with SEG (Society of Exploration Geophysicists) standard reverse polarity.
This means that positive reflections which represent an increase in acoustic impedance are
recorded by a negative number.
The dominating frequencies within the Naust Formation of the dataset have been
investigated on seismic inline 2843 through a spectral analysis. This has been carried out
using the Promax seismic processing program created by Landmark (Figure 22). The analysis
shows a dominating frequency around 35 Hz, while frequencies from 50-75 Hz are also
prevalent (Figure 22B).

35
Figure 22 - A displays seismic inline 2843 in the Promax seismic processing program where the red square marks the area selected for a spectral analysis. B displays the spectral analysis carried
out. The dominating frequency is 35 Hz.

36
3.2 3D Seismics
The main advantage of the 3D Seismic method as opposed to 2D seismics is a three-
dimensional view of targets and an increase in resolution. The resolution of seismic data is a
measure of how close to each other two different units (reflectors/layers) can be and still be
distinguishable as individual units. 3D seismics differ from 2D seismics in two important
respects (Cartwright and Huuse 2005). First the grid spacing was reduced from around one
kilometre which was typical of 2D surveys, to 25 m or less for 3D surveys thereby ensuring
denser sampling in the lateral dimension compared with the vertical one. Second, the 3D
seismic sampling combined with advanced 3D seismic migration algorithms such as 3D dip
move out and 3D migration allows for more accurate positioning of reflections in all
directions which collapses the Fresnel Zone in 3D and allows complex geological structures
to be imaged accurately in three dimensions (Cartwright and Huuse 2005). The definite limit
for the lateral resolution of 3D seismic data at the present point in time is often quoted to be
equal to the bin spacing (normally 12.5-25m) of the data set, however it may be more correct
to consider the limit to be between the bin spacing and the dominant wavelength (in the range
of 20-250 m depending on the target depth).
The resolution of seismic data has both a vertical and a horizontal component and the
resolving power of seismic data is always measured in terms of the seismic wavelength,
which is defined by the quotient of velocity and frequency (Figure 23).
λ = V/F λ = wavelength
V = velocity of acoustic wave
F = frequency of seismic signal
As can be seen from the formula above, seismic resolution is dependent upon the
frequency spectrum, wavelength and velocity of the seismic signal. Seismic velocity will
normally increase with depth as the rocks become progressively older and more compact, in
which sediments show velocities that range from 2000 m/s to above 5000 m/s (Brown 1999).
The dominant frequency will decrease because higher frequencies in the signal will be more
rapidly attenuated and typically range from 50 to 20 Hz. The seismic wavelength typically
varies between 20 to 250 m and will increase with increasing depth, which results in a
reduction of seismic resolution with increasing depth (Brown 1999). Within the boundaries of
the given resolution, the 3D seismic method has proven to be a powerful tool for
investigating both older and deeper submarine slides, as well as younger and shallower ones.

37
Figure 23 - Wavelength, the seismic measuring rod, increases significantly with depth, making resolution poorer. From Brown (1999).
3.2.1 Vertical resolution
Seismic resolution has two components, a vertical and a horizontal one. Vertical
resolution is usually said to be ¼ of the dominant wavelength (λ). When layers in seismic
data are thinner the reflections from the top and bottom of the layer will be so close to each
other that they cannot be distinguished from one another and will be seen as one reflection,
this is called the limit of separability (Brown 1999). ¼ λ is only a theoretical approximation
to the vertical resolution of seismic data because the level of noise is in reality also a deciding
factor, which reduces the actual vertical resolution. Other important issues are the limit of
visibility which depends on the acoustic contrast of the geologic layer of interest relative to
the embedding material, the random and systematic noise in the data, and the phase of the
data or the shape of the seismic wavelet. When this limit is reached, the reflection signal
becomes more or less totally obscured by the noise in the seismic system (Brown 1999).

38
Because the dominating frequency for the Naust Formation in the ST0408 dataset is
known (35Hz), the vertical resolution can be calculated for different intervals. Velocities are
from Plaza Faverola et al. (2009).
1. The Storegga Slide
λ = V/F = 1550 m/s/35 Hz = 44 m 1/4 λ = 42/4 = 11.07 m
2. Slide T
λ = V/F = 1600 m/s/35 Hz = 45 m 1/4λ = 45/4 = 11.43 m
3. Slide U
λ = V/F = 1800 m/s/35 Hz = 51 m 1/4λ = 51/4 = 12.86 m
3.2.2 Horizontal resolution
The Fresnel zone is the area of the reflector surface on which the seismic wavefront
impinges and is thought to be a circular zone from which the seismic reflection is produced
(Figure 24) (Badley 1985). Horizontal resolution of seismic data is determined by the Fresnel
zone in the sense that lateral features present in the seismic data have to be bigger than the
Fresnel zone to be distinguishable. Practically speaking, this means that two features which
both lie within the radius of the Fresnel zone will not be visible on a seismic section.
Horizontal resolution will decrease with depth, increasing velocity and lower frequency. This
entails that a deeper-lying feature needs a larger areal extent to produce the same effect as a
smaller, shallower feature (Badley 1985).
As previously mentioned, one of the big advances when comparing 3D seismics to 2D
seismics is the fact that the Fresnel zone is distinctly reduced. This occurs as a result of
migration of 3D seismic data which is a process where diffractions are collapsed back to their
point of origin. This process reduces the radius of the Fresnel zone and increases the
horizontal resolution. In theory, with perfect migration of the data, the extent of the Fresnel
zone will be around ¼ λ (Yilmaz, 2001).

39
1. The seafloor/the Storegga Slide
Fresnel zone pre-migration: F = v √(t/f) = 1550 m/s x √ (1.255s/35Hz) = 293.51 m
Fresnel zone post-migration: Fm = λ/4 = v/4F = 1550 m/s/4x35Hz = 11.07 m
2. Slide T
Fresnel zone pre-migration: : F = v √(t/f) = 1600 m/s x √ (1.4s/35Hz) = 320 m
Fresnel zone post-migration: Fm = λ/4 = v/4F = 1600 m/s/4x35Hz = 11.43 m
3. Slide U
Fresnel zone pre-migration: : F = v √(t/f) = 1800 m/s x √ (1.618s/35Hz) = 387 m
Fresnel zone post-migration: Fm = λ/4 = v/4F = 1800 m/s/4x35Hz = 12.86 m
Figure 24 - Effect on Fresnel zone size and shape of 2D and 3D migration. From Brown (1999).

40
3.2.3 Seismic artefacts
A seismic artefact is any feature which is present in the seismic data which is caused
by other factors than actual geological features (Bulat, 2005). Survey footprints are one such
feature which has been discovered within the ST0408 3D seismic survey (Figure 25). Survey
footprints are defined as systematic nose that correlates with the acquisition geometry
(Marfurt et al. 1998). Survey footprints can be seen as narrow “lineations” on the seafloor
(Figure 25), minor time shifts. It is clear from studying Figure 25 that these lineations are in
fact systematic noise which correlates perfectly with the acquisition geometry and are
therefore seismic artefacts. These footprints are likely a result of the varying conditions under
which this survey has been acquired, with ebb- and-tide and possible cross-currents having
affected the acquisition geometry negatively, resulting in these artefacts. A velocity artefact
which appears as a ”black hole” on several surfaces is also indicated on Figure 25.
Figure 25 - A time-map of the seafloor of the study area where some of the survey footprints are indicated. The red rectangle indicates a velocity artifact.

41
3.3 The Seismic interpretation tool (Petrel)
For the present thesis the program Petrel 2008 was used for interpretation of the seismic
data. The software contains a variety of different seismic single and multi trace attributes
which can be employed in order to display and/or interpret 3D seismic data. It is possible
through the generation of various attribute cubes to enhance and withdraw essential geologic
information which would not be obtainable through the means of 2D seismic. In the
following text the functions and attributes that have been used for interpreting and visualizing
the ST0408 data set will be presented.
3.3.1 Interpretation of 3D Seismic data
In the Petrel software, the process called “Seismic Interpretation” is used for the
purpose of interpreting seismic horizons. The first step in this process is to create a seismic
horizon and then to set the parameters for further interpretation. An essential part of this step
is to decide which part of the signal is to be interpreted, the trough or the peak, upper or
lower zerocrossing. With the Petrel software the user has the option to choose between
manual and automatic interpretation, for manual interpretation the user chooses freely where
to interpret a horizon, while for automatic interpretation parameters can be chosen which act
as guidelines. If automatic interpretation of horizons is used, there are three functions to
choose from; “guided autotracking”, 2D autotracking and 3D autotracking. An important
parameter when using autotracking is defining to what degree a seismic event is to be
followed. For “good”, continous reflectors such as the sea floor, one can have loose
constraints, whereas for more chaotic events such as failed slide deposits more strict
constraints are suggested. It is possible to choose which part of the signal is to be followed,
the lower zerocrossing, upper zerocrossing, peak of trough (Figure 26).

42
3.3.2 Attributes used for seismic interpretation
3.3.2.1 Volume based attributes
When using volume based attributes various properties and values are extracted from the
signal traces and the result is then displayed as a volume. There are a number of seismic
attributes available in the Petrel software, in the following only the ones that are employed in
the present thesis will be described.
Chaos: The chaotic signal pattern contained within seismic data is a measure of the “lack of
organization” in the dip and azimuth estimation method. Chaos in the signal can be affected
by migration of gas, salt body intrusions, and for seismic classification of chaotic texture.
Dip: This attribute calculates the difference between the dip trend and the instantaneous dip.
By tracking rapid changes in the orientation field, edges and subtle truncations become
visible.
RMS amplitudes: RMS amplitude calculates the square of the seismic amplitude values
within a desired volume interval and is found by dividing the sum of the squared amplitudes
with the number of live samples. Changes in the pattern of seismic amplitude both vertically
as well as horizontally become apparent when using RMS amplitude. Changes might be a
result of changes in lithology or fluid content. The formula is as follows where k is the
number of live samples:
Variance: The variance cube displays the variance in the seismic signal and is a good
indication of the continuity of seismic reflectors. Areas of lower continuity can be good
indications of the presence of for example faults or slide deposits.

43
Figure 26 - The peak, trough, upper- and lower zerocrossing of a seismic signal. The peak is displayed in red, the trough in blue and the zerocrossings are white.
3.3.2.2 Seismic surface attributes
In addition to volume based attributes, it is also possible to generate various surface attributes
at different intervals related to a single horizon, between two horizons or in a constant time-
window.
Isochron maps: These maps might also be called time-thickness maps and calculate the
thickness between two reflectors in either time or meters. These maps are very valuable for
estimating and displaying for example the thickness of slide deposits.
RMS amplitude maps: RMS amplitude maps are a visualization of the RMS volume along a
horizon. By using this method, lateral changes in seismic amplitude can become more
apparent.

44
3.4 Mapping and quantification of depression, fault-like features
For the mapping of the number of depression, fault-like features (DFFs) identified in
relation to the various identified submarine slides, data were collected within seven
parameters. These include size (length, width and height), stratigraphic location (depth below
sea floor of top and bottom of faults) and orientation of the long axis. These parameters are
summarized in table 3.1. The data were collected from a combination of surface maps and
seismic lines. The approximate outlines of DFFs were interpreted from their appearance on
time-maps from the top of the slides and their appearance as faults in seismic profiles. Their
depth and angle were also inferred from their appearance as faults in seismic sections. In
addition variance cubes were utilized to interpret and map these features at depth.
The interpretation has a degree of subjectivity and one of these features may actually
consist of two or more individual features. Nevertheless, I have attempted to accurately
interpret every DFF which is detectable.
Table 3.1– Parameters collected in regards to DFFs.
Parameters Description
Length Length of longest axis in meters
Width Width of surface expression of DFF
Orientation Orientation of DFF
Mean angle The mean angle as measured from seismic data
Depth top Average depth from sea floor to top of DFF as
measured in seismic data
Depth bottom Average depth from sea floor to bottom of DFF
as measured in seismic data
Height Depth bottom subtracted from depth top

45
4. Results
The results are based on the seismic interpretation of the 3D seismic survey ST0408
and have their basis in the tracking of reflectors, their distribution and analysis of various
attribute maps derived from them. The organisation of the chapters that follow allows
discussing the features of the various slides separately. Velocities based on Plaza Faverola et
al. (2009) are used to transfer some seismic sections from the time to the depth domain.
4.1 Seismic stratigraphy and identification of slides
In the following section the stratigraphic framework of the study area will be shown
and slides within the Naust Formation will be identified. The given stratigraphy is based on
the work by Rise et al. (2006).
4.1.1 Seismic stratigraphy
The strong positive reflection at 2.2 s TWT (NE on Figure 27A) marks the top of the
Brygge Formation which dates back to Eocene and Oligocene times (Eidvin et al. 2007). A
negative reflection marking the Opal A/CT transition lies within the Brygge Formation at 2.4
s TWT (NE on Figure 27A). Below the Opal A/CT reflection the Helland Hansen Arch, a
regional high that was formed by episodes of crustal movement (Ramberg et al. 2006), can be
discerned. Above the Brygge Formation lies the Kai Formation which consists of deposits
that are approx. 23-2.6 Ma old (Dalland et al. 1988). Its top is marked by a negative
reflection. The Kai Formation is thicker in the east and becomes thinner and shallower
towards the western part of the investigated area (Figure 27).
The uppermost 600 ms TWT of the seismic profiles consist of the Naust Formation. It
has a higher thickness than the underlying Brygge and Kai Formations due to significant
increase in depositional rates during the last 2.8 Ma (Rise et al. 2006). The four oldest units
(N, A, U and S) all show a somewhat similar prograding wedge-like character (Figure 27).
The wedges of the two lower units cover the whole Helland Hansen arch. During Naust U
times contourite drift (CD) deposition is seen in the study area (Figure 27). The Top Naust U
reflection marks a change from deposition of contourites to deposition of GDFs in the Naust
S unit. Deposition of contourites is resumed adjacent to the Base Naust T reflection which
marks the youngest unit of the Naust Formation (Naust T). This unit occupies the topmost

46
300 ms TWT of the seismic profiles (Figure 27). The Intra Naust T 3 (INT3) is an important
regional reflector, which can be traced from the Nyegga area all the way to the Ormen Lange
dome. The INT3 shows a strong seismic amplitude in the study area due to large changes in
density as well as velocity (Haflidason et al. 2004). The INT3 is also thought to act as a glide
plane for the Storegga Slide, which will be further discussed. The topmost parts of the Naust
T unit contain Weichselian GDFs towards the east and contouritic deposits towards the west
(Rise et al 2006) (Figure 27)
4.1.2 Identification of submarine slides
Three possible submarine slides have been identified within the Neogene deposits of
the Naust Formation in the Nyegga area (Figure 28). These are characterized by chaotic
seismic reflections internally. Underneath these chaotic reflections lies a more laterally
continuous reflector which marks a transition away from chaotic deposits. Upslope the
chaotic masses terminate into a ”wall-like” feature. The two bottommost chaotic packages
also have a reflector lying above them in seismic section which marks a transition towards
more continuous seismic facies. The topmost chaotic package terminates at the seafloor.
Identification of a disturbed and/or chaotic seismic facies unit which represents the
failed masses of sediment underlain by a glide plane and overlain by a surface at the upper
limit of disrupted facies is an important criterion for recognizing submarine slides (Bull et al.
2009a). As such, the three packages of chaotic seismic reflections are most likely submarine
slides as all these features have been identified. The material affected by the slope failure is
transported across the glide plane. The glide plane is normally easy to identify in seismic data
since it forms a reflection which is more laterally continous, bed-parallel and undeformed in
contrast to the slide deposits lying on top. The identification of the glide plane is perhaps the
most critical aspect for correct identification of a mass of slide deposits (Frey Martinez et al.
2005). Upslope, the limit of the slide is marked by a side- or headwall scarp which occurs
where the glide plane surface steepens and cuts through the stratigraphy to intersect the
surface (Bull et al. 2009a). These scarps represent extensional failure surfaces and form in a
way that is similar to extensional faults. Figure 28 shows the slide deposits, headwalls and
glide planes for the three slides identified within the Naust formation.

47
Figure 27 - Interpreted seismic sections from ST0408. A is a seismic intersection along the dip of the margin, B is strike-oriented. The nomenclature of the stratigraphy is based on the work of Rise
et al., (2006).

48
The slide named “slide 1” (Figure 28) most likely corresponds to the Holocene
Storegga Slide given its proximity to the seafloor. “Slide 2” has two identified glide planes in
the study area, the Base Naust T reflector, and a reflector located approx. 10 ms above Base
Naust T. The top reflector of the slide material also lies within the Naust T sequence. For
“slide 3” several reflectors within the Naust A/Naust U sedimentary sequences may have
acted as glide planes as well as the Top Naust N reflector. The Top Naust U reflector is
identified as the top of the slide deposits. Previous studies of submarine slides on the mid-
Norwegian margin have named the slides partly after area and partly after their
seismostratigraphic levels. Therefore, slide 2 will be referred to as Slide T and slide 3 will be
referred to as Slide U in this thesis.
Slide 1 = Storegga Slide
Slide 2 = Slide T
Slide 3 = Slide U

49
Figure 28 - Seismic inline 2905 from seismic survey ST0408 showing the location of glide planes and headwalls of three slides identified in the data, as well as an outline of their respective deposits.

50
4.2 Descriptions of the slides from ST0408
In the following section the three identified slides, the Storegga, T and U Slides,
within the Naust Formation will be further described in terms of identified features. In
addition the internal seismic character of the failed material and the distribution and thickness
of the slide material will be described.
4.2.1 The northern escarpment of the Storegga Slide
The Storegga Slide is easily recognizable on seismic profiles in the ST0408 Survey
(Figure 28) with a clear and defined sidewall which is followed by the onset of disrupted
seafloor morphology. The slide scar in the study area occupies approx. 75 km2. From Figure
2, which displays the location of the study area relative to the Storegga Slide it can be seen
that what is interpreted to be the headwall of the slide (Figure 28) is actually a sidewall. The
sidewall has gradients from 10-40° and is steepest in western areas and gentlest in the east,
with a mean of approx. 30°. The sidewall has heights of 50-120 m, and is highest in the east
and lowest in the west. Figure 29 displays the top surface of the Storegga Slide on a
bathymetric map of the mid-Norwegian continental margin. This gives an indication of the
extent of the slide scar in the study area.
4.2.1.1 The top of the Storegga Slide at the northern escarpment
The top surface of the Storegga Slide is the rough seafloor. The internal structure of
the slide contains a large number of reflections compared to the deeper slides in which
laterally continuous reflectors are rare. From the time-map of the seafloor (Figure 30A), the
impact of the Storegga Slide in the area becomes apparent. The seafloor depth increases by
around 50-150 m from the undisturbed northern area to the slide scar. The steep sidewall of
the Storegga Slide is a major feature on the seafloor and clearly marks the change from
undisturbed sediments to areas covered by slide material. Other prominent features north of
the sidewall are the large number of pockmarks (Weibull 2008) marking the seabed. In the
eastern part of the seafloor several deep (approx. 90 ms) depression features oriented in a
NW-SE direction can be seen.

51
Figure 29 - A time-map of the top surface of the Storegga Slide where the slide scar can be discerned, displayed on a bathymetric map of the seafloor on the mid-Norwegian continental
margin. The green line is an outline of the Storegga Slide.
The seemingly intact block of remnant material (Figure 30A and B) is another
prominent feature at the seafloor in the study area near the northern Storegga escarpment.
This block is approximately 4 km across its longest axis and 1 km across its shortest axis and
has a height of 30-50 m above the surrounding disrupted sea floor. The block does not exhibit
the disturbed chaotic seismic facies which is present both to the southeast and northwest of it.
The internal reflections show high lateral continuity and no apparent signs of displacement as
for example seen in the surrounding deposits. This large block seems to separate two
different “mini-slides” which lie on either side of it. On Figure 30B the glide plane of the
Storegga Slide can be seen to shift between different stratigraphic levels in the east-west
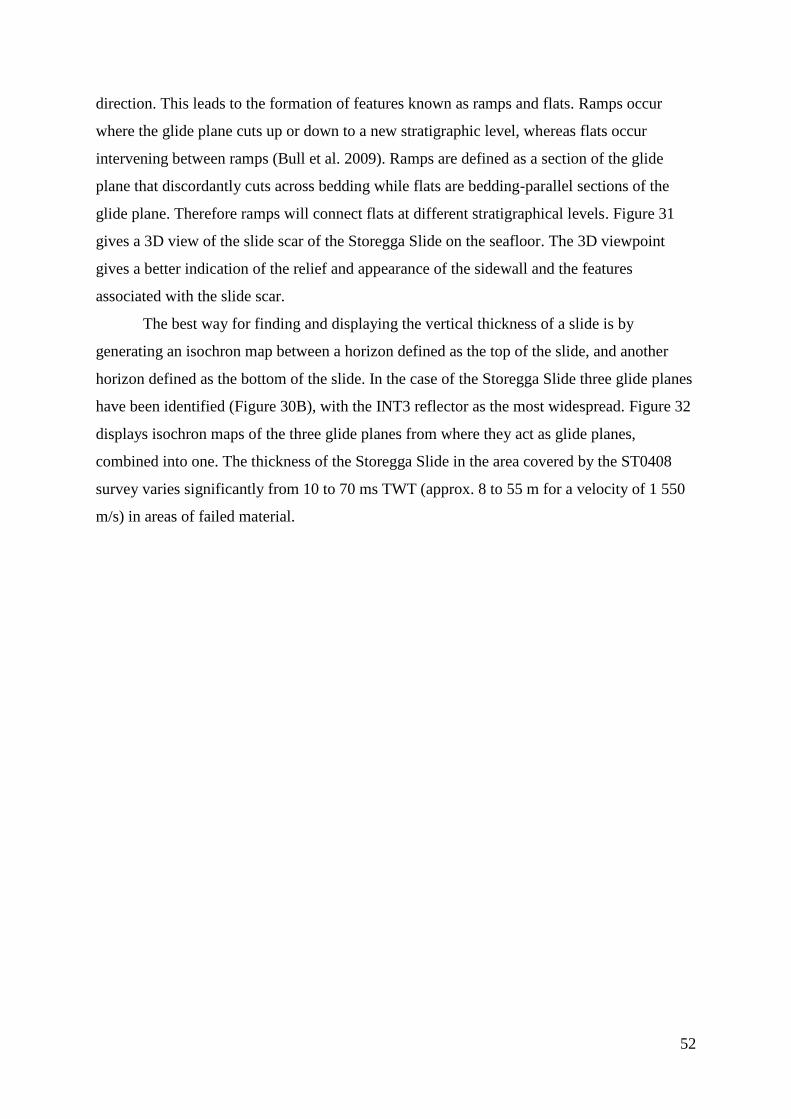
52
direction. This leads to the formation of features known as ramps and flats. Ramps occur
where the glide plane cuts up or down to a new stratigraphic level, whereas flats occur
intervening between ramps (Bull et al. 2009). Ramps are defined as a section of the glide
plane that discordantly cuts across bedding while flats are bedding-parallel sections of the
glide plane. Therefore ramps will connect flats at different stratigraphical levels. Figure 31
gives a 3D view of the slide scar of the Storegga Slide on the seafloor. The 3D viewpoint
gives a better indication of the relief and appearance of the sidewall and the features
associated with the slide scar.
The best way for finding and displaying the vertical thickness of a slide is by
generating an isochron map between a horizon defined as the top of the slide, and another
horizon defined as the bottom of the slide. In the case of the Storegga Slide three glide planes
have been identified (Figure 30B), with the INT3 reflector as the most widespread. Figure 32
displays isochron maps of the three glide planes from where they act as glide planes,
combined into one. The thickness of the Storegga Slide in the area covered by the ST0408
survey varies significantly from 10 to 70 ms TWT (approx. 8 to 55 m for a velocity of 1 550
m/s) in areas of failed material.

53
Figure 30 - A displays a time-map of the seafloor of survey ST0408. The sidedwall is marked by dotted yellow lines,. Note also the large intact block and the pockmarks, most of which are located in the blue rectangles. The red arrow gives the viewpoint location and direction for Figure 31. B displays a random seismic line from survey ST0408 showing the three identified glide planes for the Storegga Slide as well as a remnant block of intact material which has not failed. Also note the ramps and flats. C displays a random seismic line with interpreted blocks inside the slide material location indicated by white line in A.

54
Figure 31 - A 3D view of the Storegga Slide scar. The view point is indicated in Figure 30A. The yellow dotted line indicates the side wall and the blue
rectangle indicates the location of a cluster of pockmarks

55
Figure 32 - Isochron thickness map of the Storegga Slide based on the interval of three different glide planes.
Several block-like features are identified (Figure 30B and C). They occur at the
seafloor and beneath it. The features exhibit a higher degree of internal stratigraphy compared
to the surrounding material. An enlarged chaos attribute map of the seafloor (Figure 33A)
shows several seemingly rectangular blocks and more continous ridge-like features. The
blocks and ridges show a “staircase-like” pattern downslope; something which is especially
noticeable in the eastern part of the sidewall and in the sidewall northwest of the intact block
(Figure 33C). The ridges are also more intact and show a lower degree of deformation here
than elsewhere. Blocks which lie closer to the sidewall area have a similar orientation to it
and are more massive. Blocks that lie further away from the sidewall show an increase in
reorientation and a decrease in size with an increase in distance from the sidewall. It is
important to note that blocks and ridges which lie directly to the east of the intact block have
a different orientation than the other blocks and ridges (Figure 33A). Whereas the vast
majority of these features have their longest axis oriented east-west, the blocks and ridges in
this area are oriented more north-south. The identified blocks have dimensions of up to 40-50
m in height and approx. 100 m in length. The ridges show lengths of approx. 1.5-4 km and
widths of 100-200 m. Areas without any blocks or ridges are also marked (Figure 33A and B)
both in the variance map and on the random seismic line. These areas lie in close proximity to
the sidewall and are characterized by being more uniform and undisturbed than the more

56
chaotic masses that dominate the slide scar. As can be seen (Figure 33B), the seafloor is
much smoother and less chaotic where no blocks and ridges exist.
Figure 33 - A displays a chaos attribute map of the seafloor displaying the Storegga Slide. Areas without or with a low concentration of blocks are marked by yellow dotted lines. The white line gives the location of the random seismic line in C. B displays a random seismic line where areas of blocks and areas without blocks in the slide scar can be seen. C displays a random seismic line down the eastern sidewall where ridges can be distinguished.

57
4.2.1.2 Glide planes of the Storegga Slide at the northern escarpment
Three glide planes have been identified for the Storegga Slide in the study area. They
are displayed on the random seismic line (Figure 30B). The most widespread glide plane for
the Storegga Slide is the INT3 reflector. The other glide planes, called glide planes 2 and 3
(Figure 30B), are also within the Naust T sequence. The INT3 reflector has good lateral
continuity making it easy to track across the entire dataset. Glide plane 2 also has good lateral
continuity. This reflector is only disrupted where it joins the failed slide material, but
elsewhere it can be tracked across the entire dataset. Glide plane 3 shows the same
characteristics as glide plane 2. It can be traced across the whole study area, directly beneath
the INT3 reflector.
The time-map on Figure 34A displays the extent of the three identified glide planes
for the Storegga Slide. From the time-map it is clear that the INT3 is the most widespread
glide plane, followed by glide plane 2 and 3. Glide planes 2 and 3 are more prevalent in the
eastern parts of the investigated area.
Figure 34B displays a variance attribute map of the most widespread glide plane for
the Storegga Slide in the study area, the INT3 reflector. Similarly to the chaos attribute map
of the seafloor (Figure 33A), several long, continuous, ridge-like features can be seen within
the slide material. These ridges are smaller than the ones on the top of the slide, and have
lengths of 0.5-1.5 km and widths of 50-10 m. However, in contrast to the situation at the top
of the slide, smaller, rectangular block-like features are not visible on the glide plane. The
ridges show the same geometry as those on the seafloor; a “staircase-like” pattern downslope,
especially in the eastern sidewall. The highest concentration of ridge-like features is at the
eastern sidewall as well as towards the western parts of the figure. Areas without or with a
low concentration of ridges (Figure 34B) occur mainly towards the southwest of the intact
block.

58
Figure 34 - A displays a time-map of the location and extent of the different glide planes, 1, 2 and 3. B displays a variance map of the main glide plane of the Storegga Slide, the INT3 reflector. A large number of ridge-like features have been identified and the dotted lines indicate areas within the
slide scar where ridges are absent/less abundant. C displays a random seismic line where several ridges are highlighted.

59
4.3.2 Slide T
Slide T is easily recognized both from surface maps (Figure 36A) and from seismic
profiles (Figure 28). It shows a clear and defined sidewall which separates the undisturbed
sediments from the disrupted, chaotic facies of the slide material. The slide scar has an area
of approx 55 km2 in the study area. The sidewall gradient ranges from 5-25° and the height
from 15-35 m. This wall is also highest and gentlest in the east and lower and steeper in the
west. Figure 35 displays the top surface of Slide T and gives an indication of the extent of the
slide scar.
Figure 35 - A time-map of the top surface of Slide T where the slide scar can be identified, displayed on a bathymetric map of the seafloor on the mid-Norwegian continental margin. The green line is an outline of the Storegga Slide.

60
4.3.2.1 The Top of Slide T
The top of Slide T lies within the Naust T sequence ca 90-110 ms TWT below the
seafloor (Figure 36). The reflector that forms the top of the Slide T deposits shows generally
low lateral continuity. Inside the slide scar it is difficult to trace and is often absent. A
horizon located above the top of the slide is displayed on the time-map on Figure 36A). This
horizon was chosen instead of the actual top of the slide which is very difficult to trace. A
clear and defined sidewall is visible which marks a transition from more undisturbed
sediments to areas where slide activity has removed large quantities of material. Indications
of fluid migration in the form of palaeo-pockmarks are also present on this time-map. In the
eastern part of the top of Slide T several deep (approx. 75 ms) depression features oriented in
a NW-SE direction can be seen.
Two different glide planes have been identified (Figure 36B). Figure 37 shows a 3D
view of the Slide T scar. The thickness of Slide T (Figure 38) ranges from approx. 35-70 ms
TWT (approx. 28-56 meters for a velocity = 1 600 m/s. The slide material is thickest in
eastern and central parts of the slide scar, and thinnest in a narrow zone along the eastern
sidewall, as well as in the western parts of the area. This is somewhat similar to the thickness
distribution of the Storegga Slide material along the sidewall (Figure 32).

61
Figure 36 - A displays a time-map showing the top of Slide T. The sidewall is marked by dotted black lines while the blue rectangles indicate areas of high pockmark concentration. The red arrow gives the viewpoint location and direction for B displays a random seismic line from survey ST0408 where the glide planes and the top of Slide T are identified.

62
Figure 37 - A 3D view of the slide scar of Slide T. The black dotted line marks an outline of the sidewall. The view point is indicated in Figure 36

63
Figure 38 - Isochron thickness map of Slide T based on its main glide plane.
Figure 39A displays a variance attribute map from the uppermost part of Slide T.
There is a characteristic pattern of interconnected small “trough and peak” like forms which
cover the majority of the area inside of the slide scar. A similar morphology is described as
“ribbed or fingerprint” by Bull et al. (2009b). The intact block within the Storegga Slide can
also be recognized, likely as a velocity artefact and not as a real feature in the seismic data.
The “ribbed” morphology does not cover the intact block (Figure 39A). Figure 39B shows
the pattern of seismic reflections of Slide T material from areas which lie directly beneath the
intact block. Beneath the block the reflections are stronger and show a clear lateral continuity
compared to those to the southwest of the intact block.
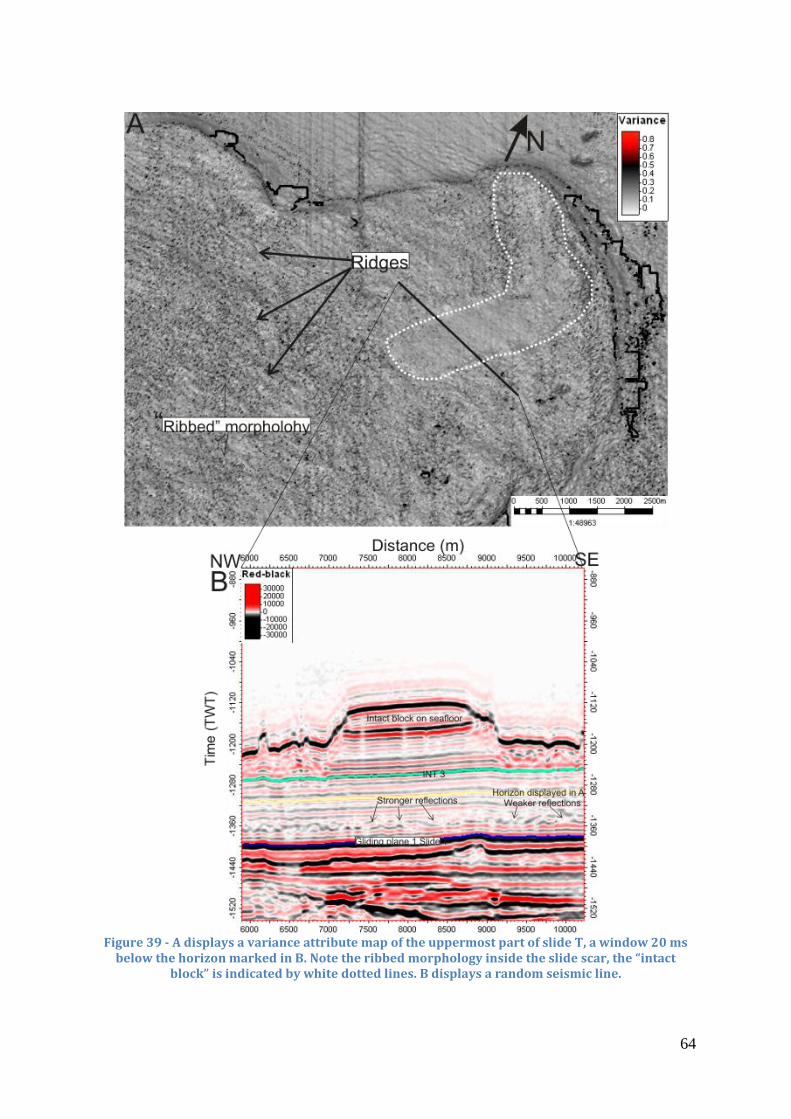
64
Figure 39 - A displays a variance attribute map of the uppermost part of slide T, a window 20 ms
below the horizon marked in B. Note the ribbed morphology inside the slide scar, the “intact block” is indicated by white dotted lines. B displays a random seismic line.

65
Also present on the variance map on Figure 39A are a number of ridge-like features.
These are similar the ones described in relation to the Storegga Slide, although they are more
difficult to identify because they occur in areas of ribbed morphology and therefore are less
visible. Similarly to the ridge-like features of the Storegga Slide, these ridges have their
longest axis oriented approximately east-west and form fairly continuous features. Their
dimensions are difficult to identify, they are estimated to be 0.5-1 km long and 30-60 m wide.
4.3.2.2 Glide planes of Slide T
Figure 40A displays a time-map showing the areal extent of the two identified glide
planes of Slide T in the study area. Glide plane 1 lies deeper in the stratigraphy (Figure 36)
and therefore must be older and it has a larger areal extent than the one named “2”. Glide
plane 1 (Figure 36) is the same reflector that is identified as Base Naust T (Figure 27). It has
good lateral continuity, except for in the eastern parts of the survey. Glide plane 2 also shows
good continuity except for areas with chaotic facies. Upslope from the sidewall, the two glide
plane reflectors converge into one reflector.
On the displayed variance map (Figure 40B) a number of ridges can be seen. These
ridges are oriented with their longest axis in a northwest-southeast direction. Their longest
axis is 1.5-3 km and their widths are approx. 50-100 m. The majority of ridges are
concentrated on the northwestern sidewall area of Slide T. Areas of “blocky” morphology are
another distinct feature on the attribute map. These are zones of poor lateral continuity, which
can also be seen from a random seismic line (Figure 40C). The areas show some similarity to
the “ribbed” morphology of the top of Slide T (Figure 39). The ridge-like features that are
visible on the variance map are also identified on the seismic section. The reflector which
forms glide plane 2 shows a trough and ridge like pattern (Figure 40).

66
Figure 40 - A displays a time-map which shows the extent of the glide planes of Slide T inside the slide scar. B displays a variance attribute map of glide plane 2 for Slide T. Ridge-like features are identified in several areas. B displays a random seismic line where the ridge-like features are identified.

67
4.3.3 Slide U
Slide U differs from the two younger slides. The most marked difference is that this
slide does not have a northern termination in the study area, but extends further north than the
dataset (Figure 42 and Figure 43). The slide scar of Slide U covers an area of approx 210 km2
in the study area. The Storegga and T slides both have more than one glide plane but these do
not shift upwards to such a large degree as Slide Us glide planes. In contrast, Slide U shows
four different glide planes (Figure 42) with relatively large stratigraphic jumps between them.
The identified Slide U glide planes lie in both the Naust N, A and U sedimentary sequences.
The Top Naust N reflector is the deepest identified glide plane for Slide U. Figure 41displays
the extent of the identified slide scar of Slide U on a bathymetric map of the seafloor of the
mid-Norwegian margin.
Figure 41 - A time-map of the top surface of Slide U where the slide scar can be identified, displayed on a bathymetric map of the seafloor on the mid-Norwegian continental margin. The green line is an outline of the Storegga Slide. The black line on the time-map gives an outline of
Slide U.

68
4.3.3.1 The top of Slide U
Figure 44A shows the top reflection of Slide U which is the Top Naust U reflector. It
shows a dipping trend towards the south of the study area. The top reflector shows, good
lateral continuity and it can be traced across the entire area. Several features are recognized,
these include a backwall, a slide scar and pockmarks. The headwall of Slide U has gradients
from approximately 10-30º and heights ranging from 40-100 m.
Figure 44B shows that the headwall feature does not always mark a transition from
undisturbed material to slide material. In the southwest it does so, however towards the east
this feature actually marks a glide plane shift as can be seen from the seismic inline on Figure
44B. The change from slide material to possibly undisturbed deposits that occurs from the
northeast towards the northwest is not marked by a clear headwall. A gradual change occurs
in the seismic characteristics of the deposits from chaotic slide deposits to more continuous
reflectors. The slide is shows to pinch out, and from Figure 42 it can be seen that infilling by
a contourite drift takes place in the slide scar. In the southwest the transition from slide
material to undisturbed deposits is marked by a clear and defined headwall that is similar to
the two younger identified slides (Figure 42A). Also similarly to the two younger slides, the
top surface of Slide U shows a deepening trend towards the south, which parallels to the
bathymetry of the seafloor (Figure 30A).
The internal reflection pattern of Slide U clearly separates it from the younger slides
and also varies distinctly across the study area (Figure 42 and Figure 43). The reflections are
chaotic and discontinuous in the north but become more continuous and massive towards the
south (Figure 43). In the northeast the reflections have low continuity (Figure 43A), while
towards the southeast reflections become more continuous and distinct (Figure 43C). In the
southwest the internal reflections are characterized by block- or ridge-like features which
show high internal coherency (Figure 43B).

69
Figure 42 - A seismic inline displaying how the glide plane of Slide U cuts down to new stratigraphic levels towards the south of the study area. The yellow area in the south of glide plane 1 is the area displayed on the time-slice on Figure 45B.

70
The isochron thickness map (Figure 45A) is composed of four smaller thickness maps
for each of the glide planes of Slide U. The map shows that the thickness of Slide U varies
from approximately 20 ms to 90 ms TWT. The slide thickness is generally largest in areas
which lie close to the headwall and towards the northern part of the study area (Figure 45A).
This map shows that the thickness of slide deposits decreases towards the west in the
northern part of the slide and to the south in the southern part. These observations correlate
with the previous observations that the slide pinches out towards the northwest (Figure 43).
Ridge-like features can be seen on both the time-map and the isochron thickness maps
of the top of Slide A (Figure 44A and Figure 45A). In order to make these features more
visible a variance attribute map of the top of Slide U was created (Figure 45C) where ridge-
like features are identified in the southwestern parts of the sidewall. These features are 2-3
km long and 70-130 m wide. The long, continuous ridges are similar to those identified on
the seafloor of the Storegga Slide (Figure 30A). They also form a “staircase-like” pattern
downslope from the headwall. Similar ridge-like features are also recognized towards the
eastern part of the slide on a dip attribute timeslice (Figure 45B).

71
Figure 43 - A displays a crossline from the northeast in the study area where Slide U has a transparent character. B displays a crossline from southwest in the study area where Slide U is
characterized by high coherence and block-like structures. C displays a crossline from the southeast in the study area where Slide U is characterized by coherent and continuous reflections.

72
Figure 44 - A displays a time-map of the top of Slide U, the top Naust U reflector. The blue rectangle
indicates an area of high concentration of palaeo-pockmarks. The actual headwall of Slide U is indicated by the dotted red line. B displays a seismic inline where the thick black line marks the
location of the "headwall" seen on A.

73
Figure 45 - A displays an isochron thickness map of Slide U comprised of the combined thickness
maps of the four glide planes of Slide U. B displays a dip attribute time-slice with ridge-like features indicated. Location is given in Figure 42. C displays a variance attribute map of the top
surface of Slide U where the black dotted line indicates the location of the headwall.

74
4.3.3.2 Glide planes of Slide U
Four glide planes for Slide U exist within the Naust N, A and U sedimentary
sequences (Figure 42). Figure 46A displays the extent of the various glide planes. It becomes
clear that the most widespread glide plane in the study area is the deepest, glide plane 4.
Glide plane 1, the shallowest one is the second-most widespread glide plane. These glide
planes and their characteristics vary from the glide planes of the Storegga and T slides. Glide
plane shifts do not show the same ramp-and-flat character that is characteristic for the
Storegga Slide. Glide plane jumps are also larger than for the two younger slides. They do not
simply jump to the next reflector immediately above or beneath it, but cover a vertical
distance of 15.20 ms in the seismic data (Figure 42). The glide planes can be traced across the
data set, except the areas where glide planes 1-3 converge with chaotic slide material.
Figure 46B displays a variance attribute map for each of the four glide planes for
Slide U. Several ridge-like features exist in the southwest. All of these are oriented with their
longest axis in a northwest-southeast direction. These features are 2-4 km long and 100-150
m across. The location is similar to the ridges located at the top of the slide. These ridges
exhibit the same staircase-like morphology downslope that can be recognized from the
Storegga and T Slides.

75
Figure 46 - A displays a time-map showing the location and extent of the glide planes of Slide U. B displays a variance attribute map of the glide planes of Slide U. Of note are the indicated ridges.

76
4.3 Depression fault-like features
A number of relatively deep, often northwest-southeast oriented, depression features
are visible on the top surfaces of the three identified slides, Storegga, T and U (Figure 30 and
Figure 36). These features appear as small-scale, high-angle faults or fractures in seismic data
and will be termed depression fault-like features (DFF) in the following section. They all lie
northward of their respective sidewalls (Figure 47A, Figure 48A and Figure 49A) in strata
which otherwise seem to be undisturbed by sliding or failure. In total 27 such features have
been mapped and quantified in terms of size, orientation and location (see table in appendix)
in the three slides of the Naust Formation
4.3.1Depression fault-like features of the Storegga Slide
Figure 47A displays the interpreted DFFs that are visible at the top of the undisturbed
sediments north of the Storegga Slide. 12 such features have been identified and interpreted
in relation to the Storegga Slide. They are concentrated in a cluster in the central to western
part of the survey. All of the identified seabed DFFs are oriented in a northwest-southeast
direction with a mean orientation of 299° (table in the appendix). All the DFFs extend from
the top of the slide down to glide plane 1. The deepest DFF was measured to be 140 ms TWT
(108 m for a velocity = 1 550 m/s), while the shallowest was measured to be 55 ms TWT (42
m for a velocity = 1 550 m/s). In areas where the distance between the glide planes and the
top of the slide (the seafloor for the Storegga Slide) is less, the height of the DFFs is also less
and vice versa . In other words, the height of the DFFs is proportional and equal to the
vertical distance from the glide plane to the top of the slide. The average height of the DFFs
measured in relation to the Storegga Slide is 90 ms (70 m for velocity = 1 550 m/s).
The dimensions of the DFFs in terms of length and width vary. The longest identified
feature is found to be over 16 times longer than the shortest one (9730 m vs. 595 m). The
average length is 2595 m. The widest DFF is approx. 3.75 times wider than the narrowest one
(270 m vs. 70 m) and the average width is 150 m. There does not seem to be any correlation
between length and width, except that the short features are narrower then the longer DFFs.
DFFs 2 and 6 for example, are much shorter than DFF 4, but also much wider (Figure 47A).
In general the longest and widest DFFs lie in the central parts of the area (Figure 47A), just
north of the intact block.

77
Figure 47 - A displays the top of the Storegga Slide (i.e. the seafloor) where twelve DFFs have been interpreted, marked with dotted lines and numbered. B displays DFF 1 in 3D as well as the
associated faults interpreted. The star in the lower left part of B shows north as red and up as green. C displays a random seismic line where the DFFs are seen to be similar to high-angle faults
in seismic data. DFFs 5 and 6 are identified on the seafloor.
The angle of the interpreted faults is high, approximately 70-85 ° (Figure 47C); as is
the case for all faults interpreted to be DFFs of the Storegga Slide. The DFFs of the Storegga
Slide extend from the top of the slide (the seafloor) down to the glide planes of the slide

78
(Figure 47B and C). Figure 47A and Figure 48A show that the DFFs that are visible on top of
the Storegga Slide (Figure 47A), cannot be recognized below the INT3 reflector (Figure
48A).
4.3.2Depression fault-like features of Slide T
In relation to Slide T six DFF features have been mapped and quantified (Figure 47).
Similarly to the DFFs of the Storegga Slide, the ones of Slide T mostly lie in a cluster, but
slightly more to the west-northwest. DFFs related to Slide T have a northwest-southeast
orientation, with a mean orientation of 308°. Also similarly to the Storegga Slide, the DFFs
related to Slide T extend from the top of the slide down to its glide planes.
The TWT depths of the DFFs for Slide T are found to be shallower than for the
Storegga Slide. However, the speed of sound will be higher in the more compacted material
of the DFFs of Slide T and thus the depths will be more similar in terms of meters. The
average depth of the DFFs for Slide T is 76 ms TWT (63 m for a velocity = 1 650 m/s). This
suggests that the DFFs of the Storegga Slide and Slide T have more similar depth-values than
it would appear from seismic data in the time-domain.
The average dimensions of the DFFs for Slide T concerning length and width are
similar to the Storegga DFFs. The longest identified DFF for Slide T is approximately 2.5
times longer than the shortest (3955 m vs. 1610 m) and the mean length is found to be around
2240 m. The widest DFF is found to be 2.6 times wider than the thinnest DFF (192 m vs. 73
m). There does not seem to be any correlation between length and width of the DFFs.
The angles of the DFFs are found to be similar to those found for the Storegga Slide,
approximately 65-90° (Figure 48B).

79
Figure 48 - A displays a horizon right above Slide T where 6 DFFs have been interpreted, marked with black dotted lines and numbered. B displays a random seismic line where the DFFs 1 and 3
on A can be seen. These features are seen to be similar to high-angle faults in seismic data.

80
4.3.3Depression, fault-like features of Slide U
Nine elongate, depression, fault-like features have been identified on top of Slide U in
the Naust Formation (Figure 49A). Similarly to the Storegga Slide and Slide T, these features
related to Slide U lie relatively close to each other, in the central to the western parts of the
study area northwest of the slide scar (Figure 49A). Except for feature number 3, all of them
have a northwest-southeast orientation, with the mean orientation being 273°. The DFFs
extend from above the top of Slide U and down to its various glide planes (Figure 49B).
Because the different glide planes lie at different stratigraphical levels, the height of these
features varies substantially.
The average depth for the DFFs of Slide U is 70 ms TWT. This means that the
average depth of the Slide U DFFs is less than for the two younger slides in the time domain
of seismic data. However, because of a possible increase in material compaction and an
accompanying increase in p-wave velocity, the average depth for the DFFs of Slide U is
closer to the ones found for the younger DFFs. Their average depth translates to approx. 63 m
for a velocity = 1 780 m/s. Keeping in mind the possible errors (misinterpretation, seismic
resolution, errors in velocity application) the average depths of the DFFs for the three slides
may be almost identical.
The average dimensions in terms of width and depth for the DFFs of Slide U appear
to be quite similar to the ones found for the other two slides. The DFFs are more homogenous
in length compared to the ones of the Storegga Slide. The longest DFF is 2.11 times longer
than the shortest (3711 m vs. 1762 m), while the widest one is 1.96 times wider than the
narrowest DFF (137 m vs. 70 m). There is seemingly no correlation between length, size
and/or location for the DFFs of Slide U.

81
Figure 49 - A displays an horizon above Slide U where 9 DFFs have been interpreted, marked with dotted lines in various colors and numbered. B displays a random seismic line where DFFs 1, 2
and 4 can be seen. These features are seen to be similar to high-angle faults in seismic data.

82
4.4 Areas of large amplitude anomalies
Areas of particularly large seismic anomalies, so-called bright spots, were discovered
around horizons Top Naust U and Top Naust N/Top Kai (Figure 50A).
RMS amplitude cubes and maps are powerful tools for imaging amplitude anomalies
in seismic data. Figure 50 shows that large RMS amplitude anomalies can be seen around the
horizons Top Naust U and Top Naust N/Top Kai. As can be seen from Figure 50A, apart
from these horizons there are no other prominent RMS amplitude anomalies on that seismic
inline; this is also the situation for the rest of the study area. RMS amplitude maps were
generated for windows from +25 ms to -25 ms for Top Naust U and +50 ms to – 50 ms for
Top Naust N (Figure 51 B and C).
The RMS amplitude map of the Top Naust U (Figure 50B) reflector shows two main
areas of high amplitude anomalies, which are separated by a band of low amplitude. A
similar pattern can be recognized on the RMS amplitude map of the Top Naust N reflector
(Figure 50C), although the two areas seem to be more merged together.
Such large anomalies are often a result of a high fluid content. The Nyegga area has
been a focus location for studying fluid flow, and many papers have been published on the
subject (e.g. Bunz et al. 2003, Mienert et al. 2005a, Weibull, 2008, Hjelstuen et al. 2009 and
Plaza Faverola et al. 2009). Weibull, (2008) investigated 287 pockmarks and 441 acoustic
chimneys in the Nyegga area using high resolution swath bathymetry and 3D seismic data.
As such fluid flow is well-known to occur within the study area. This also can be seen from
the many pockmarks which are present on the seafloor (Figure 30) and other surfaces (Figure
36 and Figure 44).
On Figure 51 a small number of the vertical fluid migration features within the study
area are indicated on a seismic crossline. These are acoustic chimneys which culminate in
pockmarks on the seabed. The occurrence of acoustic chimneys connected to the pockmarks
suggests that there is an ongoing migration of fluids from deeper reservoirs towards the
seafloor.

83
Figure 50 - A displays an inline from an RMS amplitude cube with key horizons marked. Of note are the large anomalies present around Top Naust U and Top Naust N/Top Kai horizons. B displays an RMS amplitude map for a window from +25 ms to -25 ms around the Top Naust U horizon. C displays an RMS amplitude map for a window from +50 ms to -50 ms around the Top Naust N horizon. The black lines on the left in B and C give the location for the seismic inline in figure A, the white lines give the location of the seismic crossline displayed in Figure 51.

84
Figure 51 - A seismic crossline showing the migration of fluids inside the dotted black rectangles. Location indicated in Figure 50.
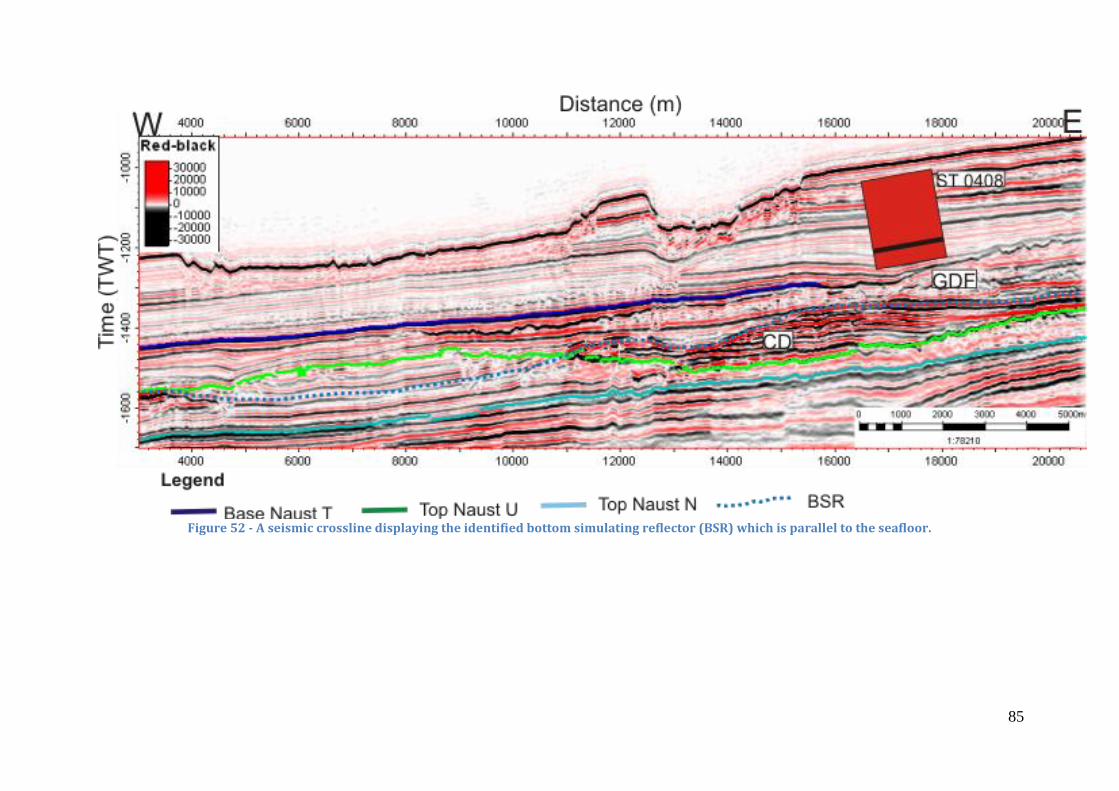
85
Figure 52 - A seismic crossline displaying the identified bottom simulating reflector (BSR) which is parallel to the seafloor.

86
A bottom simulating reflector (BSR) has also been identified in the study area (Figure
52). Where it is present, the BSR is recognized by a sudden termination of high amplitude
reflections (Bunz et al. 2003). The BSR occurs within marine hemipelagic and contouritic
sediments and cross-cuts the Top Naust U reflector (Figure 52).
This BSR and the large amplitude anomalies are most likely connected to each other
and with free gas, and could have an influence on the slope failure of the study area. This will
be discussed in the following chapter.

87
5. Discussion
The discussion chapter of this thesis has its basis in the interpretations and
observations from Chapter 4 and previous work related to the study area and to submarine
slides in general.
5.1 Correlation of slides
Three slides have been identified and interpreted in this thesis (Figure 53). I will
attempt to correlate them with slides which have been identified and discussed in previous
works (e.g. Solheim et al. (2005a) and Bull et al. (2009b)). Important features of the slides
identified in this thesis and their correlated slides are summarized in Table 5.1.
Solheim et al. (2005a) investigated seven large pre-Holocene slides on the mid-
Norwegian continental margin (Figure 4). The topmost identified slide of this thesis is the
Storegga Slide. The second identified slide lies within the Naust T sedimentary sequence and
has been named Slide T. This slide does not seem to correspond to any of the slides discussed
by Solheim et al. (2005a). However, Bull et al. (2009b) described a slide situated on the
northern flank of the Storegga Slide which was informally named the “South Vøring Slide”
from its location on the outer slope of the Vøring Plateau (Figure 4B). Based on this slides
location on the northern flank of the Storegga Slide and its seismostratigraphic location in to
“Naust subdivision B” (Bull et al. 2009b), which may correspond to the bottommost part of
Naust T in the stratigraphy used in this thesis, the SVS may correspond to Slide T. The
outline of the SVS suggested by Bull et al. (2009b) shows a side- or headwall that lies within
the study area (Figure 4B and Figure 35).The “ribbed” morphology (Figure 39A) that
characterizes the top of Slide T can also be recognized on top of the SVS (Bull et al. 2009b).
Based on infilling by what Bull et al. (2009a) refer to as Naust subdivision A (Naust T in this
thesis), the SVS was interpreted to have occurred before 250 Ka. Because Slide T has the
Base Naust T reflector as its main glide plane, it can be inferred to be approximately 200 Ka
(Figure 15), which may correspond to the estimated age of the SVS.
The slide named Slide U has four intra Naust A/Naust U reflectors acting as its glide
planes, and the top Naust U reflector as its top. This slide lies within the Naust A and U
sedimentary sequences. Solheim et al. (2005a) described, among others, one large slide with
the INS4, INS5 and TNU (old nomenclature, see Figure 15 for correlation) reflectors as main
glide planes, reflectors within the same sedimentary sequences as the identified glide planes
88
of Slide U. This slide was named Slide S. As can be seen from Figure 4, Slide S was mapped
in the study area of this thesis, and correlates to Slide U. Solheim et al. (2005a) found this
slide to cover a large area on the mid-Norwegian continental margin (Figure 4) and that it has
a scar area which is comparable to the Storegga Slide. This figure shows that the study area
lies in the outer areas of the mapped slide S, possibly along a sidewall which corresponds to
the identification of this feature (Figure 41A). Slide S was inferred to be approximately 0.5
Ma of age (Solheim et al. 2005a).
Figure 4A shows that the study area for this thesis lies on the outskirts of all the major
slides mapped by Solheim et al. (2005a). From Figure 4B it can be seen that Slide T is also
found to occupy somewhat the same area as the slides of Solheim et al. (2005a). The
observations correspond to the identifications of head- or sidewalls for all three slides in the
study area.
Slide U has actually been traced outside of the area Solheim et al. (2005a) gives as an
outline for his Slide S (Figure 4A and Figure 53 ). According to Figure 4A this slide should
only be present in the southernmost part of the study area. However it has been shown to
extend further north from the study area, and as such it is larger than what Solheim et al.
(2005a) found it to be.
The extent of the scars of the slides overlap a great deal in the study area (Figure 53).
As table 5.1 shows, the Storegga, T and U slides cover areas of approximately 75km2, 55km
2
and 210km2 respectively, in the study area. Approximately 45km
2 (85%) of the Slide T scar
lies within the same area as the Storegga Slide scar, while approx. 40km2 (75%) of the Slide
T scar overlaps with the Slide U scar. Approx. 65 km2 (85%) of the Storegga Slide scar
overlaps with the area of the Slide U scar. This means that there is a high correlation between
the slide scar areas in the study area.

89
Figure 53 - An outline of the three identified slides on a bathymetrical map of the mid-Norwegian continental margin. The green line gives an outline of the entire Storegga Slide.

90
Table 5.1 – A summary and comparison of key features of the three identified slides and correlated slides.
Slide Sidewall Slide scar Age Thickness Main glide Internal Characteristic features
or headwall km2
planes reflections
height (m)
Stratigraphic Ma
Storegga 50-120 75 Holocene 0.008 10-70 ms INT3 Continuous, Crown cracks, large intact block,
little deformation slide blocks, parallell ridges,
glide plane shifts, large, steep sidewall
Slide T 15-35 55 Middle ~0.2 35-70 ms Base Naust T Continuous, more Crown cracks, parallell ridges,
Pleistocene deformation glide plane shifts, "ribbed" morphology
South Vøring Not 850 Middle 0.25 35 ms Intra Naust B Continuous, some Thinning, high relative volume loss,
Slide (SVS) available Pleistocene deformation closely spaced blocks and ridges,
Bull et al. (2009b) modest extension
Slide U 40-100 210 Middle ~0.5 20-90 ms Top Naust N Varying; different Crown cracks, parallel ridges, glide
Pleistocene Intra Naust U in east and west, plane shifts, slide scar extends
north and south north from study area, filled in by
contourites
Slide S 45-120 23.700 Middle Plesistocene ~0.5 Up to 220 m INS4, INS5, Distinct headwall, overlain by contourites,
Solheim et al. TNU stratigraphic glide plane shifts
(2005a) rotated fault blocks in front of headwall

91
5.2 Kinematic indicators
Bull et al. (2009a) define a kinematic indicator as “a geological structure or feature
which records information related to the type and direction of motion during the time of
emplacement”. Kinematic indicators are important because they aid in the understanding of
initiation, evolution and cessation of slope failures. A number of kinematic indicators have
been discovered and mapped in relation to all of the three identified slides in the study area.
A discussion and comparison of the various features of the different slides can help to
discover similarities and differences between the Storegga, T and U slides.
The identified kinematic indicators include; head- and sidewalls, slide blocks and
ridges, ramps and flats and DFFs. Starting with the side- or headwalls, these represent an
extensional failure surface and forms in much the same way as extensional faults. They
propagate along-strike perpendicular to the direction of minimum compressive stress; this
direction is commonly parallel to the slope because of the effect of gravity on the sediments.
As such, the orientation of the headwall can give kinematic information, since it reveals the
original direction of movement for the slide material (Bull et al. 2009a).
Areas in close proximity to the headwall are often characterized by extensional
features such as blocks and ridges. The blocks and ridges are normally elongate in the along-
strike direction because of their association with the extensional movements which propagate
along-strike orthogonal to the direction of minimum confining stress, and also oriented
parallel to sub-parallel to the headwall scarp (Frey Martinez et al. 2005).
The upslope terminations of the submarine slides have usually been referred to as
headwalls throughout this thesis. However these features, which mark the boundary between
the slide scar and undisturbed material, could also perhaps be side- or backwalls. This
depends on the large-scale shape of the slide scar and the main direction of transport for the
slide. Figure 2 shows that the headwall of the Storegga Slide lies to the east of the study area
with the main direction of sediment transport towards the west-northwest from the headwall
(Haflidason et al. 2004). The upslope termination of the Storegga Slide in the Nyegga area is
thus most likely a sidewall of the slide. Figure 4B displays the extent of Slide T as mapped by
Bull et al. (2009a). The bathymetry of the present day mid-Norwegian margin shows a
deepening trend towards the west (Figure 53), this was probably the case when Slide T was
triggered as well. The main direction of material transport for Slide T was also towards the
west from the study area (Bull et al. 2009a). This suggests that the slides headwall is the
92
easternmost termination of the slide (Figure 4B). This means that the upslope termination of
Slide T identified in the study area is most likely a sidewall of the slide. Solheim et al.
(2005a) traced the headwall of Slide U a short distance southeast of the study area. This
suggests that the upslope termination of Slide U which is seen in the dataset is the headwall
of this slide and not a sidewall.
The interpretations and models in this section are based on various attribute maps
from the results chapter and the identification of kinematic indicators in the maps.
5.2.1 Kinematic indicators of the Storegga Slide
The main transport direction for the failed material of the Storegga Slide is found to
be southwards from the study area, on the basis of the many identified kinematic indicators
from both the top, bottom and internally in the slide. These indicators include; the sidewall
(Figure 30) slide blocks (Figure 30 and Figure 33) and ridges (Figure 33) and ramps and flats
(Figure 30). Figure 54 is a model which displays examples of kinematic indicators, as well as
the inferred directions of transport on various locations on the seafloor and on the main glide
plane of the Storegga Slide. These models are largely based on Figure 33A and Figure 34B
and the inferred kinematic indicators identified on these. This model was also inserted onto a
bathymetrical map of the mid-Norwegian margin to get a clearer picture of the direction in a
larger scheme (Figure 55).
Figure 54A displays the interpreted directions of initial transportation on the top of the
Storegga Slide. From the figure one can see that the orientation of the sidewall is
approximately east-west, with the slide material laying to its south. With the direction of
minimum compressive stress being downslope this indicates an initial movement of failed
material towards the south in the study area. The many blocks and ridges which can be seen
on this model indicate the same direction of initial transportation. This can be inferred from
their shape, as the large majority are elongate in the east-west direction, and also oriented
parallel to the headwall scarp.
Figure 54B displays the interpreted directions of initial transportation on the bottom
(i.e. glide plane) of the Storegga Slide. Many of the same features and characteristics can be
recognized on both Figure 54A and B, for example ridges, the intact block, the headwall and
“quiet” areas without any distinct kinematic indicators or other features. The identifed ramp
and flat features can also serve as kinematic indicators. Most ramps will have an orientation
which is perpendicular to the main direction of transport. When studying Figure 30B one can

93
see that the ramps trend east-west, which would indicate a transport direction towards the
south or north, in this case the south. The main transport direction is inferred to be the same
for the glide plane as for the top of the Storegga Slide, because of a similar orientation of the
sidewall as well as ridges, and the orientation of the ramps and flats.
It is interesting to note, however, that there are several areas on Figure 54 where the
transport direction varies from the main direction of transport. The areas all lie in proximity
to the intact block, and the transport of material in these areas seems to have gone around the
block before converging with the main direction of transport. This can be inferred from both
the shape of the headwall, especially to the northeast of the intact block, as well as from the
shape of the ridges and blocks which lie in proximity to the block (Figure 33A).
As Figure 55 displays; the direction of material transport in relation to the Storegga
Slide can be seen to closely follow the bathymetry, which is no surprise as gravity is most
likely the main driving mechanism of the failed material downslope.
The observed kinematic indicators related to the Storegga Slide are typical of the
headwall or upslope domain (Bull et al. 2009a).
5.2.1.1 The intact block on the seafloor
The large erratic and in-situ located block on the seafloor of the Nyegga area has
repeatedly been referred to as an intact block in this thesis. Does it actually represent a
feature which has not been affected by sliding? Figure 30B and Figure 33B show that this
block is not characterized by the same chaotic and/or disturbed seismic facies as the
surrounding failed slide material and the internal reflections show good lateral continuity.
This fact, coupled with indicators of transport of failed slide material that bends around the
block, would strongly suggest that this block is in fact a feature which has withstood the
failure which has affected the surrounding material. Such apparently intact blocks of
sediment are a characteristic feature in several slides on the Mid-Norwegian margin,
including the Storegga Slide (Solheim et al. 2005a).
The shape of the intact block also serves as a kinematic indicator as it is clearly
oriented in the same direction as the inferred direction of main material transport (Figure
30A), to the southwest. The failed material transported downslope has most likely eroded the
block and thus shaped it and given it the same orientation as the general mass movement
direction.
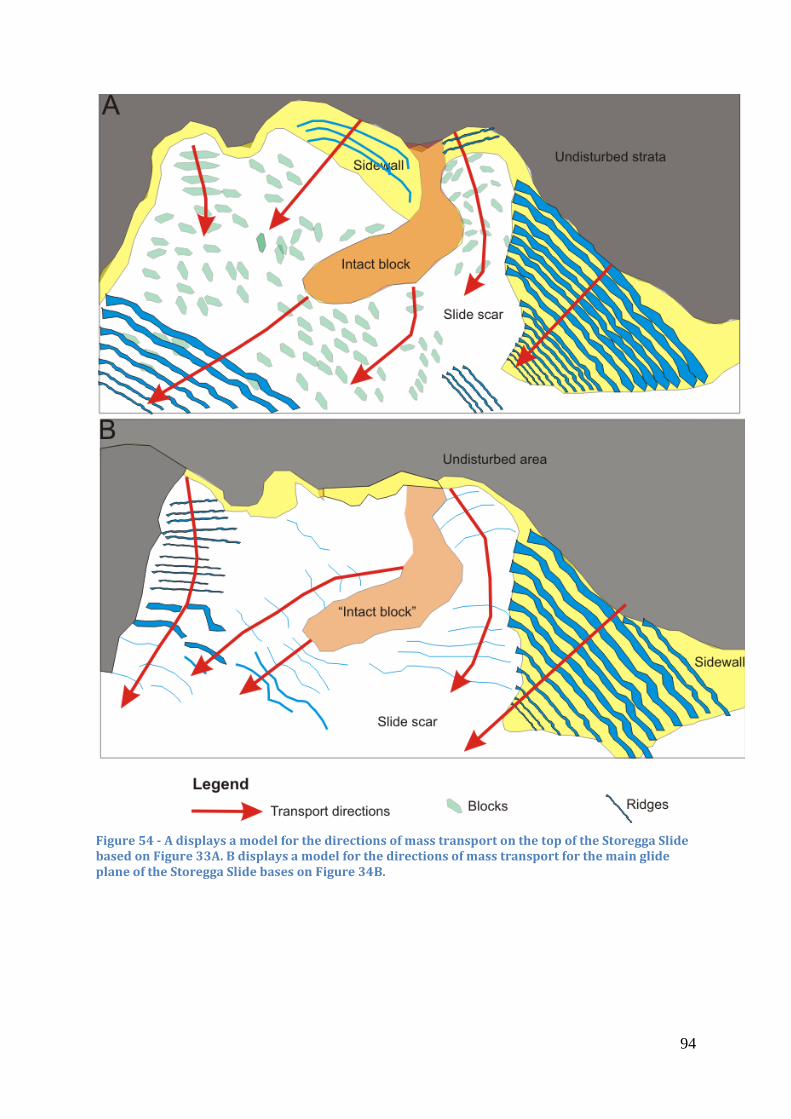
94
Figure 54 - A displays a model for the directions of mass transport on the top of the Storegga Slide based on Figure 33A. B displays a model for the directions of mass transport for the main glide plane of the Storegga Slide bases on Figure 34B.

95
Figure 55 – The model from Figure 54A inserted on a bathymetric map of the mid-Norwegian margin.
5.2.2 Kinematic indicators of Slide T
The main direction of transport of failed material by Slide T is found to be towards
the south-southwest from the study area. This direction is inferred from the various kinematic
indicators which have been identified from the slides top and bottom, as well as internally
within the slide. The kinematic indicators identified in relation to Slide T are; the sidewall
(Figure 36A), ridges (Figure 39A and Figure 40B) and DFFs (Figure 48). The model on
Figure 56A and B displays examples of kinematic indicators, as well as the inferred
directions of main transport of material related to Slide T and is largely based on Figure 39A
and Figure 40B. This model was also inserted on a bathymetric map of the mid-Norwegian
margin to give an indication of the direction of transport on a larger scale (Figure 57)

96
The sidewall of Slide T (Figure 56A) has roughly the same orientation as the sidewall
of the Storegga Slide, that is approximately east-west. The direction of minimum
compressive stress would be perpendicular to this, in this case downslope towards the south.
Also, consistently with the observations related to the Storegga Slide is the fact that the ridges
found on top of Slide T also have their longest axis oriented approximately east-west, parallel
to the orientation of the headwall. Both of these factors would infer an initial direction of
transport approximately southwards from the study area.
Figure 56B displays a model of the kinematic indicators and transport direction of
glide plane 2 for Slide T. The sidewall of the slide and a number of ridges are shown. The
ridges share the same orientation as the ones identified on top of the slide, i.e. their longest
axis is oriented approximately east-west. This indicates a direction of transport generally
southward from the study area.
Similarly to the Storegga Slide, the observed kinematic indicators related to Slide T
are also typical of the upslope domain (Bull et al. 2009a). This supports the suggestion from
section 5.1 that the study area lays in the sidewall region of Slide T.
The main direction of mass transport from Slide T also correlates with the present day
bathymetry of the area (Figure 57). From this it can be inferred that the bathymetry was
similar during the time of triggering Slide T.

97
Figure 56 - A displays a model for the directions of mass transport on the top of Slide T based on Figure 39A. B displays a model for the directions of mass transport from the glide plane of Slide T based on Figure 40B.

98
Figure 57 - The model from Figure 56A inserted on a bathymetric map of the mid-Norwegian margin.
5.2.3 Kinematic indicators of Slide U
The main direction of transport of failed slide material for Slide U is likely the same
as for the Storegga and T slides, southwards from the study area (Figure 58). Figure 58 is a
model based on Figure 45B and C and Figure 46B. This transport direction is based on the
identification of kinematic indicators, and their orientations. For Slide U, two kinds of
kinematic indicators have been identified from the top, bottom and internally in the slide; the
headwall and a number of ridge-like features (Figure 58). The directions and the occurrence
of kinematic indicators were almost identical for the top and bottom of this slide; therefore
there is only one model for the whole slide and not two separate ones as for the Storegga and
T Slides.

99
The headwall has two different orientations in the study area (Figure 44A, Figure 58),
in the western part the headwall is oriented approximately east-west, and towards the east the
headwall is oriented approximately northeast-southwest. The ridges are oriented parallel to
the headwall; they have their longest axis oriented approximately east-west where the
headwall has this orientation, and their longest axis oriented more north-south where the
headwall has this orientation. These factors indicate that there are two main directions of
transport of material from the study area: southward and towards the east-southeast. This also
corresponds with the general bathymetry of the top of Slide U which can be seen on Figure
44A. Based on the shape of the ridges, these two directions seem to converge towards the
south into one main direction and the main transport of material by Slide U is found to have
been southwards from the study area.
For the eastern areas of the scar of Slide U, there are only a few kinematic indicators.
Ridge-like features have been observed on a variance attribute time-slice (Figure 45B). These
features have their longest axis oriented approximately east-west, which indicates a transport
of material towards the south. This is supported by the observed glide plane shifting that
takes place here (Figure 42 and Figure 46A). It indicates that the slide has moved to deeper
stratigraphical levels towards the south. This also suggests that Slide U has transported
material to the south in this area.
The directions of material transport of Slide U correlates well with the general
bathymetry of todays mid-Norwegian continental margin (Figure 58). This indicates similar
bathymetrical conditions as for the younger slides and that gravity most likely played an
important role for mass transport of Slide U.

100
Figure 58 –A displays a model of the directions of mass movement in relation to Slide U based Figure 45B and C and Figure 46B inserted on a bathymetrical map.
5.2.4 Comparisons between kinematic indicators of the slides
The two topmost slides, which both lie within the Naust T sequence, share many
characteristics. Their sidewalls lie in the same areas, though at different stratigraphic depths,
and share a similar orientation. Ridges that have been identified in relation to the Storegga
and T slides also show the same orientation. One difference is that blocks have not been
identified within Slide T. As Figure 54 and Figure 56 display, the interpreted main directions
of transport are roughly the same for both slides, towards the south from the study area.

101
Slide U, however, varies a great deal from the two younger slides (Figure 58) even
though its headwall occupies approximately the same area as the sidewall of the Storegga and
T slides. The sidewall of Slide U curves northward which gives a different inferred direction
of mass transport in parts of the slide scar. However, from the kinematic indicators, which are
visible in relation to Slide U, the main directions of transport of failed material in the study
area seems to be similar to the direction for the Storegga and T slides, which is towards the
south and southeast from the study area. This may indicate that the general trend of
bathymetry of the seafloor has been similar during the times of triggering of all three slides.
One similarity between all the slides is that a “staircase-like” morphology has been
observed in regards to the blocks and ridges. This indicates the possibility of a retrogressive
slide development for both of these slides.
5.3 Crown cracks
The depression fault-like features (DFFs) identified at the Storegga (Figure 47), T
(Figure 48) and U (Figure 49) slides are interpreted to be crown cracks. Crown cracks are
subtle, elongate depression or linear features in planform which on seismic profiles appear as
small-scale faults or fractures. Such crown cracks are often associated with or found close to,
in the landward direction from, headwall scarps (Frey Martinez et al. 2005 and Bull et al.
2009a). The depressions which have been mapped in this thesis all fullfil the criteria
mentioned above. Crown cracks are another example of a kinematic indicator, and they occur
in otherwise undeformed and undisplaced strata close to a headwall. These features form as a
result of the development of extensional stresses. They are thought to represent the upslope
propagation of failure during retrogressive failure (Frey Martinez et al. 2005). As such, the
crown cracks can be assumed to have been formed after the sliding has occurred, and they
represent areas where extension has occurred, but not led to sliding. The direction of the
propagation of stress is perpendicular to the orientation of the cracks` longest axis.
27 crown cracks from all the three slides have been mapped. The presence of these
features in relation to the identified slides suggests a retrogressive slide development for
these slides (Frey Martinez et al. 2005).

102
5.3.1 Crown cracks of the Storegga Slide
Figure 59 displays the interpreted directions of propagation of stress and failure on the
top of the Storegga Slide inferred from the orientation of the crown cracks (which have a
mean orientation of approx. 299°). The direction of propagation of stress as a result of
extensional movements in the sidewall is found to be towards the northeast from the slide
scar. This means that if the sidewall of the Storegga Slide was to have developed further, i.e.
if the extensional stress would have been larger or propagated further, it would have
propagated in this direction.
As mentioned in Chapter 4, the height of the cracks is equal to the vertical distance
between the top of the slide and the various glide planes. Thus the relative distribution of
extensional stress cannot be inferred from the depth of the crown cracks. However, the width
and length of the crown cracks might give information about the relative distribution of
stress. The crown cracks are in general both widest and longest in central parts of the area just
north of the intact block, which could suggest that the undisplaced strata located there have
been exposed to more extensional stress than in other areas of crown cracks. The cracks in
this area are also almost joined together as they lie in a dense cluster; which suggests a
somewhat uniform distribution of stress in this area. The northern termination of crown crack
1 lies approx. 8 km removed from the slide scar. This gives an indication of how far the
extensional stresses might propagate through otherwise undisplaced material to form crown
cracks. There are no observed crown cracks on the seafloor between the cluster of cracks 5-7
and cracks 8 and 12. This could suggest that there was no extensional stress here; or more
likely that the stress was not large enough to result in the formation of any crown cracks.
The crown cracks of the Storegga Slide were likely formed by the same extensional
movement, or by similar movements spaced closely in time. This can be inferred from the
fact that they show a uniform direction in their orientation, and because they start and
terminate at common stratigraphic levels. This indicates that they were all formed by
extensional movements in the same direction and with roughly the same strength, likely the
same movement. All of the observed crown cracks extend from the top of the slide down to
the glide plane, which implies that they have been formed as a result of extensional
movements and stress related to the Storegga Slide. This is suggested because the glide plane
represents the lowest stratigraphical level to have been influenced by sliding processes, which

103
the crown cracks are a result of. Based on this, the cracks are likely of a similar age as the
slide event.
Crown cracks 2, 3 and 4 can be seen to terminate close to the intact block (Figure 59).
This indicates that some extensional movements have been active in proximity to it, but these
have not been sufficient to initiate failure in the area of the intact block.
Figure 59 - A time-map of the top of the Storegga Slide, i.e. the seafloor, with interpreted crown cracks. The arrows indicate the inferred directions of stress and failure propagation.
104
5.3.2 Crown cracks of Slide T
Figure 60 displays the interpreted directions of the propagation of stress on the top of
Slide T inferred from the orientations of identified crown cracks related to the Slide (these
features have a mean orientation of 308°). The direction of propagation of stress and failure
as a result of extensional movements in the sidewall is found to be towards the northeast from
the slide scar. The crown cracks of Slide T lie in a cluster northwards from the slide scar, in
contrast to the Storegga Slide where some also lie to the east of the slide scar. This suggests
that if the retrogressive development of the slide had continued, the sidewall would have
propagated to the north-northeast.
The largest (i.e. widest and longest) cracks of Slide T are the ones which lie closest to
the slide scar, where the highest stress exists. Crown crack 5 which lies further away from the
sidewall is the narrowest and second-shortest crack, a fact which correlates with the stress
energy decreasing away from the slide scar. The northern termination of this crack lies
approximately 8 kilometres northwest of the sidewall, similarly to the Storegga Slide.
The crown cracks of Slide T were most likely formed by the same extensional
movement, or by different extensions spaced closely in time. This can be inferred from the
fact that the identified cracks show the same orientations and start and terminate at the same
stratigraphical levels. All of the observed crown cracks seem to terminate at glide plane 2 of
Slide T. This implies that the crown cracks have been formed during the same extensional
movement that initiated Slide T.

105
Figure 60 - A time map of the top of Slide T with interpreted crown cracks. The arrows indicate inferred direction of stress and failure propagation.
5.3.3 Crown cracks of Slide U
Figure 61 displays the interpreted directions for the propagation of stress as a result of
extensional movements related to Slide U inferred from the orientations of crown cracks from
the top surface of the slide (these have a mean orientation of 273°). In contrast to the
Storegga and T slides, not all of the identified cracks show a similar orientation; crown crack

106
3 has an orientation of approx. 50°. This implies that there are two directions of stress
propagation for Slide U. The main direction of stress propagation is towards the east-
northeast, while the eastern-most crack indicates a northwest propagation in that area. That
the extension has developed westward is reflected in the shape of the headwall as it bends
northwards in the central part of Figure 61 east of crown crack 3. If the retrogression of the
sidewall of Slide U had continued, the slide would have mainly expanded towards the
northeast and also to the northwest in areas surrounding crown crack 3.
There does not seem to be any correlation between the location (i.e. proximity to the
side- or headwall) of the crown cracks and their size. Because of this, it is difficult to estimate
in which areas the extensional stress has been the largest. However, logically this should
perhaps be in the area closest to the slide scar. The western termination of crack 7 lies
approximately 4.5 kilometres removed from the slide scar, which gives an indication of how
far the extension propagated through the undisturbed strata.
The cracks of Slide U have seemingly been formed by more than one extensional
movement based on their varying orientations. One extension has likely been directed to the
northeast while another has been directed towards the northwest based on the deviation in
orientation shown by crack 3. All of the identified cracks terminate at various glide planes of
Slide U (glide planes 1, 2 and 3) and at different stratigraphical levels (Figure 49). This
means that the crown cracks have likely been formed as a result of different stages of sliding.
For example the cracks that reach glide plane 1 have been formed when material failed along
that surface.

107
Figure 61 - A time map of the top of Slide U with interpreted crown cracks. The arrows indicate inferred direction of stress and failure propagation.
5.4 Mechanisms and timing of sliding
Sliding mechanisms refers to how material has been displaced and also which stage in
its transport development the slide has reached (Figure 10). The degree of deformation of
features such as slide blocks and the character of the internal structure of the material are
important indicators in these regards. The gradient of the head- and sidewalls and of the
surface in general most likely has a large influence on how far material is transported and
possibly on how much it is reworked and deformed under transport. The kinematic indicators
identified in relation to a submarine slide can also give us information about which stage of
the slide development the slide has reached and what mechanisms drive it a long or short
distance downslope. A kinematic indicator which has been identified in relation to all the
slides is parallel ridges and troughs. They are oriented roughly perpendicular to the inferred
direction of mass movement. These features are associated with spreading, a type of mass

108
movement where materials (sediments) are extended and broken into more or less coherent
blocks which are transported or tilted along a surface (Figure 5) (Micaleff et al. 2009). A
step- or staircase-like pattern has been observed on some of these ridges of the Storegga and
T Slides; this can indicate a retrogressive pattern of movement for the submarine slope failure
(Bull et al. 2009a). The presence of crown cracks is another feature which is indicative of
such a retrogressive development (Frey Martinez et al. 2005).
The timing of the various events of a slide relative to each other is important in
regards to how sliding has occurred and developed post-triggering. There have been several
glide planes observed in relation to all of the three slides. Which glide plane is utilized by a
slide in an area can yield information about the timing of sliding in that area relative to other
areas where another glide plane is utilized. The slides most likely have a retrogressive
development where the shallower glide planes could indicate a later timing for sliding.
5.4.1 Mechanisms and timing of sliding at the northern Storegga Slide escarpment
The stage of initial sliding is characterized by the formation of blocks and slabs where
the material moves downslope as a more or less cohesive mass (Bryn et al. 2005b). The
material will have a high degree of internal coherency with low internal deformation. This in
contrast to how material might be transported further down the slope (Figure 10). These
criteria are filled by the part of the Storegga Slide which has been investigated in this thesis;
continuous blocks and ridges and an internal structure containing a number of more or less
continuous reflections (Figure 30B and C and Figure 33B and C). We are therefore most
likely in the initial stage of sliding where the material moves downslope driven almost
exclusively by gravity and maintains a large part of its original structure and composition.
The identification of a large number of parallel ridges and troughs which are oriented
perpendicular to the main direction of mass movement are indicative that spreading has
occurred. The spreading has resulted in the failure of the sediment mass and deconstruction
into more or less coherent blocks of material. Micaleff et al. (2007) proposed two models for
spreading within the Storegga Slide. (1) In model 1 spreading would develop retrogressively
along the glide plane because of repeated failure of the headwall. Failure propagates upslope
as a result of fracturing of sediment into a number of coherent blocks which progressively
undergo translation and disintegration. (2) In model 2 material above the glide plane acts as a
thin coherent slab that is extended downslope by gravity and drag forces resist the movement

109
at the base. The resultant stress to which the slab is subjected is higher downslope than
upslope, which generates sufficient tension to break up the slab.
It seems most likely that spreading at the northern escarpment of the Storegga Slide
has occurred retrogressively as the occurrence of stair-case morphology and crown cracks
indicate retrogressive mechanisms. The extension of this spreading movement has propagated
upslope until it has been halted due to stress reduction.
The mass movement related to the northern escarpment of the Storegga Slide has most
likely not taken place as one single event, but rather as several, likely three, smaller events
(Figure 62). The intact block separates two different “mini-slides” to its left and to its right
and it is possible that sliding in the sidewall to the east and to the northwest of the intact
block also forms a separate event. Figure 34A displays the location and extent of the glide
planes of the Storegga Slide, where glide plane 3 is the deepest and glide plane 2 is the
shallowest.
Glide plane 3 is utilized by the Storegga Slide to the east of the intact block (Figure
34) which indicates that this was the area where sliding was first initiated since glide plane 3
is the oldest. This is event 1 of the sliding. The majority of the failed material, which lies
west-southwest of the intact block, utilizes glide plane 1 (the INT3 reflector). This has most
likely been initiated as a second event following sliding along glide plane 1 and is event 2.
The two biggest and most defined areas of the sidewall utilize glide plane 2, and are likely the
youngest event, event 3. These areas of the sidewall show little deformation and material has
most likely not been transported far. Event 3 has likely occurred as a result of a collapse of
the sidewall. The sidewall also shows a lower gradient in these areas, which results in a lower
transport distance for the failed material. This timing correlates somewhat to Micaleff et al.
(2009) who defined the intact block and the sidewalls as one, younger, event and the rest of
the area as one, older, event (Figure 16b, Micaleff et al. 2009).

110
Figure 62 - The extent of different events of mass movement related to the Storegga Slide. The numbers are in rising order, 1 is the oldest event etc.
Figure 63 displays a schematic model of the timing and development of the Storegga
Slide in the study area. Before any of the three events of the slide occurred, normal marine
hemipelagic sediments filled the future slide scar and the topography of the seafloor was
smooth and similar to the undisturbed deposits that now lie north of the slide scar. Then
retrogression reached the study area and triggered event 1 first, then events 2 and 3. This
development has resulted in the distinct slide scar seen today on the seafloor of the Nyegga
area. Of the total approximately 75 km2 of material which have been influenced by the
Storegga Slide, event 1 is responsible for 17 km2, event 2 for 47 km
2 and event 3 for 10 km
2.

111
Figure 63 - A schematic model of the development of the Storegga Slide scar. 1: The situation before triggering of the slide, the future slide scar is filled in by normal marine deposits. 2: Event 1 of the sliding is initiated via retrogression from further down-slope and has removed material from a part of the slide scar. 3: Event 2 is initiated. 4: Event 3 is initiated.

112
5.4.2 Mechanisms and timing of sliding for Slide T
In terms of which stage of sliding Slide T has reached within the study area, the best
indicators seem to be the many continuous ridges (Figure 39B) and the slides internal
reflections. Compared to the Storegga Slide, the internal reflection of Slide T are less
continuous and more disrupted. This would suggest that the material has been transported
further downslope and/or undergone more deformation. However, the slide material still
shows continuity and reflectors can be traced inside the slide material. Because of this, the
material has likely still been transported as a more or less coherent mass, and not for example
as a debris flow or a turbidite (Figure 10). The slide was most likely in its initial stage of
mass-movement and mass movement has been driven mostly by gravity.
It is likely that Slide T has developed in a similar way to the northern escarpment of
the Storegga Slide, as parallel ridges oriented perpendicularly to the direction of mass
movement are identified in relation to this slide as well. These indicate that spreading has
occurred in relation to Slide T. Also similarly to the Storegga Slide there are many signs
suggesting a retrogressive development of Slide T, as a staircase-like morphology shown by
the ridges on the glide plane (Figure 40B) and several crown cracks have been identified.
This indicates that model 1 (Micaleff et al. 2007) applies for spreading related to Slide T as
well.
Two different events of mass movement have been identified for Slide T (Figure 64).
Event 1 is the oldest and signifies the first instance of mass movement by Slide T. This
movement has utilized glide plane 1 of Slide T which is the Base Naust T reflector. During
event 1 material from the west and from central parts of the slide scar were translated along
this glide plane. Event two has utilized glide plane 2 of Slide T and has displaced material
southwards shortly after event 1. Figure 64 correlates with Figure 38 in the sense that the
areas of poor lateral continuity indicated on Figure 38B correlates to event 1, while areas of
ridges are related to event 2 on Figure 64. That the surface morphology on Figure 38 shows
such varying characteristics indicates different mechanisms and/or timing of the mass
movements related to the two surface morphologies. This supports the idea that there have
been two different events of different timing in relation to Slide T. Figure 65 is a schematic
model of the development of Slide T where the different stages of sliding have influenced
material in different parts of the slide scar.

113
Figure 64 - The extent of different events of mass movement related to the Slide T. The numbers are in rising order, 1 is the oldest event and 2 the youngest.
Of the total approx. 55 km2 of material in the scar of Slide T, event 1 has influenced
40 km2 while event 2 has influenced 15 km
2.
Bull et al. (2009b) suggested a subsurface sediment mobilisation and extrusion
mechanism for the SVS (Slide T) as a whole as it was found to exhibit a departure from
retrogressive models of slope failure development. Its defining characteristics were found to
be “the anomalous volumetric depletion of the lower part of the pre-failure unit with respect
to the modest concomitant extension of the deformed body in the downslope direction.” A
sequence of deformation similar to the one reported for quick clay was the basis for the
model of development of the SVS: (1) a high water content, fine-grained unit is deposited and
rapidly buried; (2) down flank undermining (Slide D from Bull et al. (2009b)) releases lateral
confining pressure at the toe of the transparent interval which leads to liquefaction; (3) the
mobilised material is squeezed from beneath the overburden and extruded into the water
column. Then the overburden starts to extend, fracture and subside because of volumetric
depletion of the underlying unit, which continues until the mobilised material is extruded.

114
Figure 65 - A schematic model of the development of the Slide T scar. 1: The situation before triggering of the slide, the future slide scar is filled in by normal marine deposits. 2: Event 1 of the sliding is initiated via retrogression from further down-slope and has removed material from part of the slide scar. 3: Event 2 is initiated.

115
A defining characteristic which was observed in relation to this slide by Bull et al.
(2009b) and which led to the formation of this model, was a volume loss of 40% for the area
affected by sliding and very little extension in the translation direction. In the study area, this
thinning has and volume loss has not been observed, while extensional features like parallel
ridges and crown cracks have. Thus, within the study area a retrogressive development of
Slide T seems more likely.
5.4.3 Mechanisms and timing of sliding for Slide U
As described in Chapter 4 and illustrated on Figure 42 and Figure 43 the internal
reflections of the material of Slide U varies a great deal across the study area. This could also
suggest that the mechanisms of the slide are very different across the study area. In general
the slide material is more transparent and chaotic and seems more disrupted towards the
north, while it is more continuous towards the south and west in the study area.
I start with the area which is covered by ridges in the southwest of the study area
(Figure 45C and Figure 58A). In this area the internal reflections of the slide material show
high internal coherency and low internal deformation (Figure 43B). This indicates that
material in this area has not been transported very far along the glide plane and that we are
likely in the initial stage of sliding (Figure 10). In these areas close to the headwall, material
has most likely been driven downslope by gravity and undergone little deformation.
In the northeast areas of the slide scar, Slide U has a transparent internal character and
the material shows high internal coherency and relatively low deformation (Figure 42 and
Figure 43A). This indicates that the material in this area has not been transported far and/or
has not been exposed to deformation processes. The slide scar seems to extend northwards
from the study area (Figure 42 and Figure 43A), which indicates that a possible sidewall also
lies northward from the study area. The inferred direction of mass movement (Figure 58A) is
found to be towards the south in this eastern part of the slide scar. These observations suggest
that the material in the eastern part of the Slide U scar has been transported southwards
because of the activation of a sidewall which lies north of the study area.
Towards the southeast Slide U is filled in and /or overlain by contouritic deposits
(Figure 42) which show a high amplitude. Velocity effects from these deposits could be the
reason that the Slide U material which is translated across glide plane 4 appears as one large
positive reflection. Another reason could be that these deposits have been transported further

116
from their source and are more deformed as a result of this. In the northeast areas of Slide U
we are likely in the initial stage of sliding, where mass movement has been driven by gravity,
as material shows high coherency and little deformation. Towards the southeast the slide
jumps down to deeper and older stratigraphical levels, deformation increases and internal
coherency diminishes. It is possible that a transition towards more plastic flow has taken
place towards the southeast, however no indications have been found that the material is
moved as a debris flow. Therefore Slide U is found to most likely be in the initial stage of
sliding, similarly to the Storegga and T Slides, and mass movement has occurred as a result
of the influence of gravity.
Indicators of a retrogressive development of Slide U have been identified; the stair-
case like morphology of the ridges of the southwest sidewall and the crown cracks. In
addition to these, glide plane jumping is seen on Figure 42 which illustrates how the
retrogression and glide plane jumping might have developed. Glide plane jumping has also
taken place towards the western part of Slide U (Figure 46A). Here, the locations and extents
of the various glide planes are displayed. Locations of stratigraphical jumping and
retrogression coincide with the areas of glide plane shifts.

117
Figure 66 - The extent of the different events of mass movement related to Slide U. The numbers are in rising order, 1 is the oldest event etc.
Four different smaller events of mass movement have been identified in relation to
Slide U (Figure 66). The identification of these is based on the interpretation of Slide U as a
retrogressive slide and the identification and extent of its glide planes (Figure 46A). This
means that failure and sliding took place gradually as retrogression propagated upwards in
the stratigraphy and northwards. Sliding has therefore most likely occurred along the deepest
glide plane first, which is indicated as event 1 (Figure 66), and then initiated as event 2 etc.
Sliding was likely initiated in the south first and then propagated northwards (Figure 66).
Event 2 terminated at the headwall in the southwest and then propagated northeast. Event 3 is
a smaller event than the other three and seems to terminate within the study area as opposed
to the other events. Event 4 is the shallowest and northernmost event of Slide U and
propagates northwards from the study area. It pinches out towards the east of the study area,

118
as does event 3. Figure 67 displays a schematic model for the development of Slide U. Of the
total approx 210 km2 of material in the scar of Slide U, event 1 has influenced 108 km
2, event
2 43 km2, event 3 9 km
2 and event 4 58 km
2.
Figure 68 displays a general model for the initiation and development of sliding and
failure for the Storegga, T and U Slides.
Figure 67 - A schematic model of the development of the Slide T scar. 1: The situation before triggering of the slide, the future slide scar is filled in by normal marine deposits. 2: Event 1 of the sliding is initiated via retrogression from further down-slope and has removed material from a part of the slide scar. 3: Event 2 is initiated. 4: Event 3 is initiated. 5: Event 4 is initiated.

119
Figure 68 - A generalized model for the development of the Storegga, T and U Slides. (1) Normal fine-grained marine deposition during interstadials, with a following burial by glacial deposits during a glacial. (2) Retrogression from a point of failure further down-slope leads to destabilizing and spreading and the start of failure in the area. (3) Material fails and is transported down-slope by gravity, retrogression and spreading continues. (4) Large quantities of material have been removed, the remaining material is deformed and parallel ridges are found. The retrogression and spreading continues and crown cracks are formed.

120
5.5Possible triggering mechanisms for submarine sliding
Submarine sliding is initiated when the shear stress oriented downslope exceeds the
resisting shear strength. The known triggering mechanisms for submarine sliding on the mid-
Norwegian continental margin (build up of excess pore pressure, seismic loading, earthquakes
and dissociation of gas hydrates) are summarized in chapter 2.3. Which of these mechanisms (if
any) have been responsible for triggering sliding within the study area is important to find out.
5.5.1 Possible excess pore pressure
As established in Chapter 2, the build up of excess pore pressure is thought to be the pre-
conditioning factor for sliding on the mid-Norwegian margin (Bryn et al. 2005b, Solheim et al.
2005a) (Figure 19). In order for excess pore pressure to occur and lead to submarine sliding
within the study area high sediment loads of till and glacial debris are necessary components, as
these effectively trap fluids within hemipelagic and contouritic drift (CD) deposits beneath
(Solheim et al. 2005a). A sequence similar to this has been identified (Figure 42) where a glacial
debris flow (GDF) overlies a contourite drift within the Naust S sedimentary sequence. These
deposits were thus deposited post-Slide U, with the contourites filling in the slide scar and as
such could not have played a role in the triggering of Slide U. As a matter of fact, there are no
identified glide planes within the Naust S sedimentary sequence which makes it unlikely that any
sliding has occurred as a result of the GDF overlying the CD in this case.
Another glacial debris flow has been identified within the Naust T sequence (Figure 27).
This GDF lies 30-50 ms TWT above the identified glide planes of the Storegga Slide and might
therefore have influenced this failure. The GDF is from the Weichselian and is 15-30 Ka (Rise et
al., 2005) and is therefore older than the Storegga Slide. This GDF covers the whole study area
except for the Storegga slide scar and could have acted as a large low-permeability barrier for
escaping fluids from the underlying marine sediments.
Another possibility is that the excess pore pressure has not been generated in the study
area, but rather somewhere else and then migrated into it the area of failure (e.g. Dugan and
Fleming 2000). Kjeldstad et al. (2003) hypothesized that fluid migration within the mid-
Norwegian margin could be related to excess pore pressure generated by prograding wedges.
Excess pore pressure is generated under the slope of the prograding sediment load, the main

121
wedge. Pore pressure decreases behind it as a result of the venting of fluids. As Figure 21B
displays, the largest thickness of glacigenic debris flows lies northward from the study area of,
while the thickness decreases toward the study area. Excess pore pressure could thus have been
generated to the north, and then migrated laterally into the study area following the pressure
gradients as progradational loading causes fluid to migrate laterally through affected parts of the
basin (Kjeldstad et al. 2003). As this vertical loading has taken place throughout the Plio-
Pleistocene, this mechanism can explain the generation of excess pore pressures in relation to all
three identified slides.
This is an essential pre-conditioning factor for the failure of the hemipelagic and
contouritic sediments in the Naust Formation, however a final push, a triggering mechanism, is
also needed.
5.5.2 Overpressurised layers and the presence of fluids
The presence of gas could be important in relation to the triggering of submarine sliding.
The dissociation of gas hydrates and the seepage of fluids including shallow methane gas are two
triggering mechanisms related to the presence of gas in the sub-seabed (Canals et al. 2004). Gas
hydrates as triggering mechanisms on the mid-Norwegian margin in general have been discussed
in Chapter 2.3.2. What is interesting and relevant to investigate, is if they are present in the
dataset and what effect they might have had on the failure of the three identified slides.
The areas of large amplitude anomalies discovered around the Top Naust U and Top
Naust N/Top Kai horizons (Figure 4.22) are inferred to be overpressurised layers based on the
evidence of fluid flow throughout the data set, with pockmarks on the seabed (Figure 29) and on
other surfaces (Figure 35 and Figure 44). Pockmarks often connect to active chimneys or pipes in
the subsurface (Figure 4.23), which are vertical cylindrical structures. Pockmark and chimney
formations in continental margins are indicative of overpressurised formations at depth in the
sub-seabed (Rise et al., 1999). That overpressurised layers exist within the Nyegga area has
previously been established by Weibull (2008), Hjelstuen et al. (2009) and Plaza-Faverola et al.
(2009). Plaza Faverola et al. (2009) found evidence of two zones of low velocity in the upper 800
mbsf (meters below sea floor) in the study area. These zones were found to coincide with high-
amplitude zones in 2D and 3D reflection seismic data, which are the same two zones discovered

122
in this thesis around the Top Naust U and Top Naust N/Top Kai horizons. These findings suggest
the occurrence of gas in the sub-seabed of the Nyegga area.
A BSR (bottom-simulating reflector) is, as established in Chapter 2.3.2, an important
indication of the presence of gas hydrates as it represents the base of the gas-hydrate stability
zone (BHGSZ) (Bouriak et al. 2000). Such a feature has been identified in the study area (Figure
52). The presence of a BSR in the study area has also been established by Weibull (2008) and
Plaza Faverola et al. (2009), as well as by Bunz et al. (2003) (Figure 21A). The identification of a
BSR in the study area strongly suggests the presence of gas hydrates, and the presence of gas is
also supported by the many fluid flow features and the overpressurised layers.
The location of the headwall for the Storegga Slide fits exactly with the area where
Mienert et al. (2005b) modelled hydrate stability conditions that would coincide with the gas
hydrate stability zone (GHSZ) outcrop zone. The headwall area is thus located at the place where
the biggest in-situ pore pressure build-up would be as a result of dissociation of gas hydrates. The
timing of the Storegga Slide slope failure matches a period of warmer water inflow when hydrate
stability underwent the most significant thickness reduction. Changes in the climatic conditions
following the Last Glacial Maximum could have led to the decreasing and dissociating of the
hydrate zone prior to the initiation of sliding (Mienert et al. 2005b).
As Figure 52 shows, the BSR and thus the BGHSZ, lies much deeper than the Storegga
Slide does, thus it is clear that destabilization had to have taken place at another place in the
BGHSZ in order for it to possibly act as a trigger. Sultan et al. (2004b) found that as a result of
temperature and pressure increase, hydrates could dissolve at the top of the GHSZ in order to
reach chemical equilibrium with the surrounding water mass. The model developed by Sultan et
al. (2004b) contradicts previous beliefs that the destabilization of hydrates only occurs at the
BGHSZ. This numerical model was applied for the Storegga Slide, where hydrostatic pressure
due to the change of the sea level and the increase of the sea water temperature were considered.
Simulation results showed that the melting of gas hydrate might be at the origin of a retrogressive
failure of the Storegga Slide.
The dissolution of gas hydrates is possibly a contributing factor to the Storegga Slide
submarine slope failure (Mienert et al. 2005b). However for the older identified slides in the
study area the role of gas hydrates is difficult to accurately model or predict. As the GHSZ is
dependent on temperature and pressure conditions and migrates up or down according to the sea
123
level there is no “palaeo GHSZ” one can relate to older slides. Fluid migration and the presence
of likely overpressurised horizons all the way down to the Kai Formation (Figure 50 and Figure
51) indicate that gas and fluids have been present in the Nyegga area over a long period of time.
Seeing as how the slide scars overlap to some extent (Figure 53) and the general bathymetry of
the area possibly has been similar to today during times of triggering for the older slides, it is not
unlikely that similar conditions in regards to the BGHSZ have been prevalent at earlier times.
Because of this, the dissociation of gas hydrates could have been a contributing factor for
triggering of submarine sliding in the Nyegga area throughout the Pleistocene as well.
Gas hydrates as a possible triggering mechanism for retrogressive submarine sliding is
only possible if dissolution in fact does occur at the top of the GHSZ. Otherwise, it can most
likely be excluded.
Gas and other fluids present in the sub seabed could still play a role in creating instability
and promoting failure of the material as they migrate upwards through the layers. The presence of
fluids will effectively reduce the shear strength of sediments because it lowers cohesion and
interlocking by reducing the internal friction which serves to hold together deposits. As such,
fluids might play a local role in the sliding at the Nyegga area in other ways than excess pore
pressures or dissociation of gas hydrates.
5.5.3 Earthquakes as a trigger for retrogressive slide development
Solheim et al. (2005a) found that sliding events would most likely occur during
deglaciation or in the initial parts of an interglacial/interstadials. This is based on the observation
that glacio-isostatic seismicity would likely be at its highest during such periods, which provides
a likely trigger, earthquakes. Other factors which support this theory is the lack of glacial debris
flows filling in slide scars, and the thickness of contouritic infilling in the slide scars (Figure 42).
Lack of infilling by GDFs indicates that glaciers had retreated from the outer shelf during and in
the initial period of sliding, while infilling by contourites suggest long periods of contouritic drift
deposition before the next episode of maximum glaciation (Solheim et al. 2005a).
A retrogressive model has previously been suggested for the development of the slides.
This means that the failure and subsequent sliding has likely originated at a location further
downslope and then retrogressed upwards. This process requires that unloading of the headwall

124
causes strain concentrations and loss of strength in a base layer, and that failure then propagated
upslope along a layer of marine deposits. The less sensitive units above undergo expansion and
acceleration into the slide scar as a result of gravity loading with formation of a new headwall
(Bryn et al. 2005b). Retrogression continues to expand upslope as long as there is sufficient
debris mobility and favourable soil conditions. During the final stages of sliding lateral spreading
occurs and generally slows down as it moves closer to the shelf where glacial compaction has
influenced the sediments. Retrogression of the slides has stopped when the sidewall has
retrogressed up to where it meets the consolidated glacial deposits and the mobility of the blocks
has decreased (Bryn et al. 2005b). This is a model suggested by Bryn et al. (2005b) for the
development of the Storegga Slide, but as a retrogressive model it could apply to all three slides
of this thesis.
Bryn et al. (2005b) postulated that a strong earthquake triggered the initial failure of the
Storegga Slide in the steep slopes of the Brygge Formation oozes in the distal parts of the slide
area. This initial slide then removed toe support and increased the shear strain to a critical level
and resulted in the development of failure in the central areas of the slide including the study area
of this thesis. During the final stages of the slide development final shaping and infilling of debris
flow channels and development of embayments in the central head scarp took place. A
retrogressive development of the Storegga Slide is supported by many other articles from the area
as well (e.g. Gauer et al. (2005), Haflidason et al. (2004), Haflidason et al. (2005), Kvalstad et al.
(2005b)).
Naturally, the majority of the research of sliding in the area has focused on the Storegga
Slide, as it is the most recent event and therefore the most accessible. However, it is likely that
similar mechanisms have been at work for Slide U at least, because it covers an area similar to
the Storegga Slide (Figure 4) and shows many of the same characteristics both in the study area
and elsewhere (Solheim et al. 2005a). Instability caused by pore pressure build-up and triggered
by strong earthquakes was found by Solheim et al. (2005a) to be the most likely cause for the
slides investigated in that article, which include Slide U. For Slide T, Bull et al. (2009b) as
discussed previously, suggested a different development, which could suggest different trigger
mechanisms as well. This slide is markedly smaller than the Storegga and U Slides (Figure 4),
and could be driven by other mechanisms than these two slides. Because there have been several
episodes of of alternating glaciations and deglaciations throughout Naust times, strong

125
earthquakes occurring as a result of isostatic rebound could be a possible triggering mechanism
also for older slides.
5.6 The evolution of “small-scale” submarine sliding in the Nyegga area
Three submarine slides have been identified in this thesis in the Nyegga area, all of them
lying within the Naust Formation. The slides occurred at approximately 400, 200 and 8 Ka.,
respectively. This means that sliding occurs with a frequency of approx. 200 Ka in the Nyegga
area, Solheim et al. (2005a) found that major slides on the mid-Norwegian margin as a whole
occur around every 100 Ka. There are several similarities between these slides; the sidewalls of
the slides and their associated slide scars can be seen to overlap to some extent (Figure 53),
features such as crown cracks, parallel and stair-case like ridges are found in relation to all the
slides, and the kinematic indicators indicate similar directions of material transport and
extensional stress propagation in the Nyegga area. These observations could indicate that the
preconditions, mechanisms and developments of these slides have been similar as well.
The deepest and oldest slide identified in this thesis, Slide U, is approximately 0.4 Ma and
shows some characteristics which vary from the two younger slides. Slide U does not have a
northward termination in the study area, while the Storegga and T Slides only cover the southern
part of the study area. This may suggest that there could have been different conditions regarding
bathymetry and slope inclination during the time of Slide U, as failure seems to have occurred
further up on what today is the Vøring Plateau. Sliding is most likely initiated during deglaciation
or in initial parts of an interglacial (Solheim et al. 2005), which is supported in this thesis by the
observation of a contourite infilling the Slide U scar. Because of this, the possible difference in
the bathymetry and slope inclination during the time of Slide U would not have simply been a
result of glacial influence.
Similar mechanisms have likely been at work in the initiation and development of all the
slides within the Nyegga area. Signs of retrogression and spreading have been identified for all
slides, and the material shows a similar degree of reworking as well. This suggests that, just like
for the mid-Norwegian margin as a whole (Solheim et al. 2005a), the triggering and development
of slides in the Nyegga area is cyclic and governed by similar processes each time it occurs.

126
5.7 Future outlook
Throughout this thesis the Nyegga area has been documented as having a history of slope
failure and mass movement. An important question for the future is whether or not this is likely
to occur again, and if so, when? Prior to the development of the Ormen Lange Field, which lies to
the south of the study area inside the scar of the Storegga Slide (Figure 1.2), a project named the
Seabed Project was initiated with the goal of securing a safe field development (Solheim et al.
2005b). The two main questions this project aimed to answer were: 1. Can new major, tsunami-
generating slides occur naturally or induced by human activities? 2: Can smaller slides, which
may threaten field installations, occur on the steep slopes created by the Storegga Slide?
The Seabed project concluded that the development of the Ormen Lange field is safe with
respect to submarine sliding. Because of the close link between the deposition that is controlled
by climatic factors and sliding, it would likely take another interglacial-glacial cycle to reach a
stage that could trigger another major, tsunami-generating slide in the area (Solheim et al.
2005b).
While a large slide similar to the Storegga Slide is thus unlikely to occur again in the near
future, Solheim et al. (2005a) found that a large slide occurs on the mid-Norwegian margin
approximately every 100 Ka, what about other movements related to the slides?
With spreading inferred to be an important form of mass movement for the Storegga Slide
within the study area, there is a potential future risk for the area as this could propagate further
into undisturbed strata. The identified crown cracks could be seen as areas of spreading where
this mechanism has not been able to initiate sliding for various reasons. Spreads often occur over
large regions and terrain with a low slope gradient that do not appear in danger of sliding.
Spreading is normally limited to some hundreds of meters (Micaleff et al. 2007). Keeping this in
mind, areas of potential spreading could pose risks for installations on the seabed as well as
pipelines.

127
6. Conclusions
3D Seismic data and the use of Petrel software allowed to visualize and map three
different submarine slides within the Naust Formation at the Nyegga area. Through
mapping of the top and bottom surfaces of the slides the identification of morphological
features provide the base to infer the direction and mechanisms of submarine sliding.
The three slides are referred to as the Storegga, T and U slides. Their respective ages are
approximately 8, 200 and 400 Ka. Identified glide planes suggest a failure that was
initiated in marine deposits.
The slides show many similar features (i.e. head- or sidewalls, ridges, blocks, crown
cracks) which display similar properties (i.e. size, orientation). These indicate similarities
in direction of material movement, slide mechanisms and stress propagation.
27 crown cracks have been identified in relation to the slides, all lie to the north of their
respective slide scars. These are likely formed by a propagation of extensional stress
through strata that otherwise have not been influenced by sliding. Crown cracks are good
indicators for slide development.
Spreading of material is inferred to be the likely type of mass movement for a large part
of the slide due to the observed large number of parallel ridges. None of the slides have
failed as one single event, but rather as several smaller events.
Sliding in the Nyegga area and on the mid-Norwegian margin in general is likely a result
of the buildup of excess pore pressure. This results in unstable deposits and is an essential
precondition for submarine sliding in the area.
The Nyegga area is known for extensive fluid migration as documented by fluid charged
layers, fluid migration and gas hydrates. The presence of fluids in the sediments will
likely increase instability, however the dissolution of gas hydrates is not considered a
likely triggering mechanism for retrogressive sliding.
Sliding in the study area is probably a result of retrogressive development. Crown cracks
and an observed staircase-like morphology of ridges are indicative of a retrogressive
development. Failure has likely started downslope and expanded upslope into the study
area.

128
The propagation of spreading of failed material and crown cracks upslope could be seen
as a potential geohazard in the future.

129
References
Atakan, K. and Ojeda, A., 2005. Stress transfer in the Storegga area, offshore mid-Norway.
Marine and Petroleum Geology, v. 22, p. 161-170.
Badley, M., E., 1985. Practical Seismic Interpretation: Boston. International Human Resources
Development Corporation. 265 pp.
Berg, K., Solheim, A. and Bryn, P., 2005. The Pleistocene to recent geological development of
the Ormen Lange area. Marine and Petroleum Geology, v. 22, p. 161-170.
Bondevik, S., Løvholt, F., Harbitz, C., Mangerud, J., Dawson, A. and Svendsen, J. I., 2004. The
Storegga Slide Tsunami – comparing field observations with numerical simulations. Marine and
Petroleum Geology, v. 22, p. 195-208.
Bouriak, S., Vanneste, M. and Soutkine, A., 2000. Inferred gas hydrates and clay diapirs near the
Storegga Slide on the southern edge of the Vøring Plateau, offshore Norway. Marine Geology, v.
163, p. 125-148.
Brekke, H., 2000. The tectonic evolution of the Norwegian Sea Continental Margin with
emphasis on the Vøring and Møre Basins. In: Nøttvedt, A. (Editor), Dynamics of the Norwegian
Margin. Geological Society, London, p. 327-378.
Brown, A., 1999. Interpretation of Three-Dimensional Seismic Data, Fifth Edition. AAPG
Memoir 42 SEG Investigations in Geophysics, No. 9, pp. 355.
Bryn, P., Solheim, A., Berg, K., Lien, R., Forsberg, C. F., Haflidason, H., Ottesen, D. and Rise,
L., 2003. The Storegga Slide complex: Repeated large scale sliding in response to climatic
cyclicity, in: Locat, J. and Mienert, J. (Editors). Submarine mass movements and their
consequences. Kluwer Academic Press, The Netherlands, p 215-222.

130
Bryn, P., Berg, K., Stoker, M. S., Haflidason, H. and Solheim, A., 2005a. Contourites and their
relevance for mass wasting along the Mid-Norwegian Margin. Marine and Petroleum Geology v.
22, p. 85-96.
Bryn, P., Berg, K., Forsberg, C., F., Solheim, A. and Kvalstad, T., J., 2005b. Explaining the
Storegga Slide, Marine and Petroleum Geology v. 22, p. 11-19.
Bugge, T., 1975. Kart med kystkontur og dybdekoter for den norske kontinentalsokkel. Cont.
Shelf Inst. (IKU), v. 55, 21 pp.
Bugge, T., 1980. Øvre lags geologi på kontinentalsokkelen utenfor Møre og Trøndelag. Cont.
Shelf Inst. (IKU), v. 104, 44 pp.
Bugge, T. 1983. Submarine slides on the Norwegian continental margin, with special emphasis
on the Storegga area. Continental Shelf and Petroleum Technology Research Inst. A/S, v. 104,
pp. 44.
Bugge, T., Belderson R. H., Kenyon, N. H., 1988. The Storegga Slide. Philosophical
Transactions of the Royal Society, London, A. p. 357-388.
Bulat, J., 2003. Imaging the Afen slide from commercial 3D seismic methodology and
comparisons with high-resolution data. In: Submarine mass movements and their consequences,
Kluwer Academic Publishers, 2003.
Bulat, J., 2005. Some considerations on the interpretation of seabed images based on commercial
3D seismic in the Faroe-Shetland Channel. Basin Research, v. 17, p. 21-42.
Bull, S., Cartwright, J. and Huuse, M., 2009a. A review of kinematic indicators from mass-
transport complexes using 3D seismic data. Marine and Petroleum Geology v. 26, p.1132-1151.

131
Bull, S., Cartwright, J. and Huuse, M., 2009b. A subsurface evacuation model for submarine
slope failure. Basin Research , v. 21, p. 433-443.
Bukovics, C. and Ziegler, P. A., 1985. Tectonic development of the mid-Norway continental
margin. Marine and Petroleum Geology, v. 2, p. 2-22.
Bungum, H., Lindholm, C. and Faleide, J., 2005. Postglacial seismicity offshore mid-Norway
with emphasis on spatio-temporal-magnitudal variations. Marine and Petroleum Geology v. 22,
p. 137-148.
Bunz, S., Mienert, J. and Berndt, C., 2003. Geological controls on the Storegga gas-hydrate
system of the mid-Norwegian continental margin. Earth and Planetary Science Letters, v. 209, p.
291-307.
Bunz, S., Mienert, J., Vanneste, M. and Andreassen, K., 2004. Gas hydrates at the Storegga
Slide: Constraints from an analysis of multicomponent, wide-angle seismic data. Geophysics, v.
70, p. 19-34.
Canals, M., Lastras, G., Urgeles, R., Casamor, J. L., Mienert, J., Cattaneo, A., De Batist, M.,
Haflidason, H., Imbo, Y., Laberg, J. S., Locat, J., Long, D., Longva, O., Masson, D. G., Sultan,
N., Trincardi, F. and Bryn, P., 2004. Slope failure dynamics and impacts from seafloor and
shallow sub-seafloor geophysical data: case studies from the COSTA project. Marine Geology, v.
213, p. 9-72.
Cartwright, J. and Huuse, M., 2005. 3D seismic technology: the geological”Hubble”. Basin
Research, v. 17, p. 1-20
Dalland, A., Worsley, D. and Ofstad, K., 1988. A lithostratigraphic scheme for the Mesozoic and
Cenozoic succession offshore mid- and northern Norway. NPD Bulletin NO 4, p. 1-87
132
Dugan, B. and Fleming, P. B., 2000. The New Jersey margin: compaction and fluid flow. Journal
of Geochemical Exploration, v. 69-70, p. 477-481.
Eidvin, T., Bugge, T. and Smelror. M., 2007. The Molo Formation, deposited by coastal
progradation on the inner Mid-Norwegian continental shelf, coeval with the Kai Formation to the
west and the Utsira Formation in the North Sea. Norwegian Journal of Geology, v. 87, p. 75-142
Eldholm, O., Thiede, J. and Taylor, E., 1989. Evolution of the Vøring Volcanic Margin.
Proceedings of the Ocean Drilling Program, v. 104.
Forsberg, C. F. and Locat, J., 2005. Mineralogical and microstructural development of the
sediments on the Mid-Norwegian margin. Marine and Petroleum Geology, v. 22, p. 109-122
Frey Martinez, J., Cartwright, J. and Hall, B., 2005. 3D seismic interpretation of slump
complexes: examples from the continental margin of Israel. Basin Research, v. 18, p. 83-108.
Gauer, P., Kvalstad, T. J., Forsberg, C. F., Bryn, P. and Berg, K., 2005. The last phase of the
Storegga Slide: simulation of retrogressive slide dynamics and comparison with slide-scar
morphology. Marine and Petroleum Geology, v. 22, p. 171-178.
Gracia, E., Dañobeitia, J., PARSIFAL Team, 2003. Mapping active faults offshore Portugal
(36°N-38°N): implications for seismic hazard assessment along the southwest Iberian margin.
Geology, v. 31, p. 83-86.
Haflidason, H., Sejrup, H. P., Bryn, P., Lien, R., Masson, D., Jacobs, C., Huehenerback, V. and
Berg, K., 2002. The architecture and slide mechanism of the Storegga Slide, Mid Norwegian
margin. The Norwegian Petroleum Society, Annual Meeting in Trondheim, October 2002. NPF
Abstracts and Proceeding Number 2, p. 80-81.

133
Haflidason, H., Gravdal, A. and Sejrup, H. P., 2003. The Northern Storegga Escarpment –
Morphology and Features. In: Mienert, J. and Weaver, P. (Eds), European Margin Sediment
Dynamics: Side-Scan Sonar and Seismic Images. Springer Verlag, Berlin Heidelberg, p. 45-53.
Haflidason, H., Sejrup, H. P., Nygård, A., Mienert, J., Bryn, P., Lien, R., Forsberg, C. F., Berg,
K. and Masson, D., 2004. The Storegga Slide architecture, geometry and slide development.
Marine Geology, v. 213, p. 201-234.
Hampton, M. A., 1972. The role of subaqueous debris flow in generating turbidity currents.
Journal of Sedimentary Petrology, v. 42, p. 775-793.
Hampton, M. A., Lee, H. J. and Locat J., 1996. Submarine landslides. Reviews of Geophysics, v.
34, p. 33-59.
Henrich, R. and Baumann, K. H., 1994. Evolution of the Norwegian Current and the
Scandinavian Ice Sheets during the past 2.6 m.y.: evidence from ODP Leg 104 biogenic
carbonate and terrigenous records. Palaeogeography, Palaeoclimatology, Palaeoecology, v. 108,
p. 75-94.
Hjelstuen, B. O., Eldholm, O. and Skogseid, J., 1999. Cenozoic evolution of the northern Vøring
margin. Geological Society of America Bulletin, v. 111, p. 1792-1807.
Hjelstuen, B. O., Haflidason, H., Sejrup, H. P. and Nygård, A., 2009. Sedimentary and structural
control on pockmark development – evidence from the Nyegga pockmark field, NW European
margin. Geo-Marine letters D01 10.1007/s000367-009-0172-4.
Holtedahl, H., 1971. Kontinentalsokkelen som en del av jorden, Forskningsnytt v. 3/71, p. 12-17.
Ivanov, M. K., Westbrook, G., Blinova, V., Kozlova, A., Mazzini, A., Nouze, H. and Minshull,
T., 2007. First time sampling of Gas Hydrate from the Vøring Plateau. EOS, Transactions,
American Geophysical Union, v. 88, p. 209-216.

134
Kjeldstad, A., Skogseid, J., Langtangen, H. P., Bjørlykke, K. and Høeg, K., 2003. Differential
loading by prograding sedimentary wedges on continental margins: An arch-forming mechanism,
J. Geophys. Res., v. 108, p. 4.1- 4.21.
Kvalstad, T., T., Nadim, F., Kaynia, A., M., Mokkelbost, K., H. and Bryn, P., 2005a. Soil
conditions and slope stability in the Ormen Lange area. Marine and Petroleum Geology, v. 22, p.
299-310.
Kvalstad, T. J., Andresen, L., Forsberg, C. F., Berg, K., Bryn, P. and Wangen, M., 2005b. The
Storegga Slide: evaluation of triggering sources and slide mechanics. Marine and Petroleum
Geology, v. 22, p. 245-256.
Laberg, J.S., Long, D., Mienert, J., Trincardi, F., Urgeles, R., Vorren, T.O., Wilson, C, 2004.
Triggering mechanisms of slope instability processes and sediment failures on continental
margins, a geotechnical approach. Marine Geology, v. 213, p. 291-32
Laberg, J. S., Stoker, M. S., Dahlgren, K. I., de Haas, H., Haflidason, H., Hjelstuen, B. O.,
Nielsen, T., Shannon, P., Vorren, T., van Weering, T. C. E. and Ceramicola, S., 2005. Cenozoic
alongslope processes and sedimentation on the NW European Atlantic margin. Marine and
Petroleum Geology, v. 22, p. 1069-1088.
Leeder, M., 2006. Sedimentology and Sedimentary Basins, from turbulence to tectonics.
Blackwell Publishing, pp. 592.
Locat, J., Lee, H.J., 2002. Submarine landslides: advances and challenges. Can Geotech. Journal,
v. 39, p. 193-212.
Løseth, T. M., 1999. Submarine massflow sedimentation: computer modelling and basin fill
stratigraphy (Lecture Notes in Earth Sciences), Springer Publishing, pp. 156

135
Marfurt, K. J., Scheet, R. R., Sharp, J. A. and Harper, M. G., 1998. Suppression of the acquisition
footprint for seismic sequence attribute mapping. Geophysicist, v. 62, p. 1774-1778.
Micaleff, A., Masson, D. G., Berndt, C. and Stow, D. A. V., 2007. Morphology and mechanics of
submarine spreading: A case study from the Storegga Slide. J. Geophys. Res., v. 112, p. 1-21.
Micaleff, A., Masson, D. G., Berndt, C. and Stow, D. A. V., 2009. Development and mass
movement processes of the north-eastern Storegga Slide. Quaternary Science Reviews, v. 28, p.
433-448.
Mienert, J., Bunz, S., Guidard, S., Vanneste, M. and Berndt, C., 2005a. Ocean bottom
seismometer investigations in the Ormen Lange area offshore mid-Norway provide evidence for
shallow gas layers in subsurface sediments. Marine and Petroleum Geology, v. 22, p. 287-297.
Mienert, J., Vanneste, M., Andreassen, K., Haflidason, H. and Sejrup, H. P., 2005b. Ocean
warming and gas hydrate stability on the mid-Norwegian at the Storegga Slide. Marine and
Petroleum Geology, v. 22, p. 233-244.
Mulder, T. and Cochonat, P., 1996. Classification of offshore mass movements. Journal of
Sedimentary Research, v. 66, p. 43-57.
Mulder, T., Savoye, B. and Syvitski, J. P. M., 1997. Numerical modeling of a mid-sized gravity
flow: the 1979 Nice turbidity current (dynamics, processes, sediment budget and seafloor
impact). Sedimentology, v. 44, p. 305-326.
Plaza-Faverola, A., Bunz, S. and Mienert, J., 2009. Fluid distributions inferred from P-wave
velocity and reflection seismic amplitude anomalies beneath the Nyegga pockmark field of the
mid-Norwegian margin. Marine and Petroleum Geology article in press.

136
Martinsen, O. J. and Nøttvedt, A., 2003. Av hav stiger landet. In: Ramberg, A., Bryhni, I. and
Nøttvedt, A (Eds), 2006. Making of a Land –Geology of Norway. Norwegian Geological Society,
p. 441-477.
Rise, L., Sættem, J., Fanavoll, S., Thorsnes, T., Ottesen, D. and Bø, R., 1999. Sea-bed pockmarks
related to fluid migration from Mesozoic bedrock strata in the Skagerrak offshore Norway.
Marine and Petroleum Geology, v. 16, p. 619-631.
Rise, L., Ottesen, D., Berg, K. and Lundin, E., 2005. Large-scale development of the mid-
Norwegian shelf and margin with emphasis on the last 3 million years. Marine and Petroleum
Geology, v. 22, p. 33-44.
Rise, L., Ottesen, D., Longva, O., Solheim, A., Andersen, E. S. and Ayers, S, 2006. The
Sklinnadjupet slide and its relation to the Elsterian glaciation on the mid-Norwegian margin.
Marine and Petroleum Geology, v. 23, p. 569-583.
Skinner, M. R. and Bornhold B. D, 2003. Slope failures and paleoseismicity, Effingham Inlet
Southern Vancouver Island, British Columbia, Canada. In: Locat, J. and Mienert, J. (Editors).
Submarine mass movements and their consequences. Kluwer Academic Press, The Netherlands,
p 215-222.
Solheim, A., Berg, K., Forsberg, C. F. and Bryn, P., 2005a. The Storegga Slide complex:
repetitive large scale sliding with similar cause and development. Marine and Petroleum
Geology, v. 22, p. 97-107.
Solheim, A., Bryn, P., Sejrup, H. P., Mienert, J. and Berg, K., 2005. Ormen Lange – an integrated
study for the safe development of a deep-water gas field within the Storegga Slide Complex, NE
Atlantic continental margin; executive summary. Marine and Petroleum Geology, v. 22, p. 1-9.

137
Stride, A. H., Curray, J. R., Moore, D. G. and Belderson, R. H., 1969. Marine Geology of the
Atlantic continental margin of Europe. Philosophical Transactions of the Royal Society, London
v. 264, p. 31-75.
Stoker, M. S., Praeg, D., Hjelstuen, B. O., Laberg, J. S., Nielsen, T. and Shannon, P. M., 2005.
Neogene stratigraphy and the sedimentary and oceanographic development of the NW European
Atlantic margin. Marine and Petroleum Geology, v. 22, p. 977-1005.
Strout, J., M. and Tjelta, T. I., 2005. In situ pore pressures: What is their significance and how
can they be reliably measured? Marine and Petroleum Geology, v. 22, p. 275-285.
Sultan, N., Cochonat, P., Canals, M., Cattaneo, A., Dennielou, B., Haflidason, H., Laberg, J. S.,
Long, D., Mienert, J., Trincardi, F., Urgeles, R., Vorren, T. O. and Wilson, C., 2004a. Triggering
mechanisms of slope instability and sediment failures on continental margins: a geotechnical
approach. Marine and Petroleum Geology, v. 213, p. 291-321.
Sultan, N., Cochonat, P., Foucher, K.-P. and Mienert, J., 2004b. Effect of gas hydrates melting on
seafloor slope instability. Marine Geology, v. 213, p. 79-401.
Swiecicki, T., Gibbs, P. G., Farrow, G. E. and Coward, M. P., 1998. A tectonostratigraphic
framework for the Mid-Norway region. Marine and Petroleum Geology, v. 15, p. 245-276.
Thiede, J. and Myhre, A., M., 1996. 36. The palaeoceanographic history of the North Atlantic-
Arctic gateway: synthesis of the Leg 151 drilling results. Proceedings of Ocean Drilling Program
Scientific Results, v. 151, p. 645-658.
Vanneste, M., De Batist, M., Golmshtok, A., Kremlev, A., Versteeg, A., 2001. Multi-frequency
seismic study of gas-hydrate bearing sediments in Lake Baikal, Siberia. Marine Geology, v. 172
p. 1-21.

138
Vanneste, M., Mienert, J. and Bünz. S., 2006. The Hinlopen Slide: A giant, submarine slope
failure on the northern Svalbard margin, Arctic Ocean. Earth and Planetary Science Letters, v.
245, p. 373-388.
Weibull, W., 2008. Geological fluid flow systems at Nyegga of the Mid-Norwegian margin.
Master’s thesis, University of Tromsø.
Yilmaz, O, 2001. Seismic Data Analysis, Processing, Inversion and Interpretation of Seismic
Data. Investigations in Geophysics, Volume II, 2. Society of Exploration Geophysicists, Tulsa.

A
Appendix
Statistics of the crown cracks
Notation
Ccnr = Crown crack number
L = length in meters Bsl = below sea
level
W = maximum width in meters Depth top = Depth of top of fault m/s bsl (avg)
Orient = Orientation
Depth bottom = Depth of bottom of fault m/s bsl(avg)
X start = X-coordinate at start of crown crack, northwestern-most point
Height = Height of crown crack in m/s (avg)
Y start = Y-coordinate at start of crown crack, northwestern-most point
X end = X-coordinate at end of crown crack, defined as southeastern-most point
Y end = Y-coordinate at end of crown crack, defined as southeastern-most point
Term = Stratigraphical level crack terminates at Gp = Glide plane number for that Slide

B
Statistics of the crown cracks of the Storegga Slide
Ccnr X start Y start X end Y end L W Orient Tilt (avg) Depth top
Depth bottom
Height Term
1 597933 7171617 599528 7171079 1778 192 282
23,73 113,89 90,16 Gp 1 2 602082 7173026 605655 7171508 4394 270 299
35,12 89,81 54,69 Gp 1
3 602871 7172341 604071 7172435 1229 180 262
22,21 93,97 71,76 Gp 1 4 598388 7175937 606204 7171641 9728 155 299
33,89 92,1 58,21 Gp 1
5 612644 7169318 614304 7167946 2721 160 309
29,8 153,85 124,05 Gp 1 6 612572 7169189 614332 7167722 2589 94 309
5,6 144,74 139,14 Gp 1
7 614219 7168473 614555 7168069 594 92 319
4,32 138,71 134,39 Gp 1 8 603871 7175077 606152 7172406 3752 252 319
12,69 94,04 81,35 Gp 1
9 601234 7175654 602251 7175087 1208 129 299
18,71 96,45 77,74 Gp 1 10 600207 7175625 600907 7175445 731 87 284
18,47 92,03 73,56 Gp 1
11 598465 7177443 600014 7176680 1762 86 296
15,34 93,97 78,63 Gp 1 12 604666 7174565 605135 7174169 641 72 310
16,91 101,04 84,13 Gp 1
MEAN
2594 147 299
19,73 108,72 88,98

C
Statistics of the crown cracks of Slide T
Ccnr X start Y start X end Y end L W Orient Tilt (avg) Depth top
Depth bottom
Height Term
1 598639 7175859 601736 7173718 3955 166 305
109,47 194,08 84,61 Gp 2 2 600328 7175635 602361 7174970 2195 192 289
116,23 192,12 75,89 Gp 2
3 598528 7177347 600228 7176267 1984 175 303
109,17 189,45 80,28 Gp 2 4 596622 7177340 597455 7175936 1610 139 330
109,46 184,58 75,12 Gp 2
5 596248 7179933 597363 7178382 1723 90 325
112,57 188,01 75,44 Gp 2 6 603851 7174715 605461 7173931 1970 154 296
145,01 209,86 64,85 Gp 2
MEAN
2240 153 308
116,95 193,02 76,03 Gp 2
Statistics of the crown cracks of Slide A
Ccnr X start Y start X end Y end L W Orient Tilt (avg) Depth top
Depth bottom
Height Term
1 601337 7171155 603044 7170374 1943 74 293
315,46 352,13 36,67 Gp 1 2 601070 7170551 604110 7169639 3451 70 287
247,52 348,13 100,61 Gp 3
3 605074 7171270 603566 7169934 2113 126 49
264,26 336,72 72,46 Gp 2 4 601199 7170020 603163 7168994 2313 115 298
238,63 273,57 34,94 Gp 1
5 599171 7171675 600191 7170704 1762 83 319
278,67 403,19 124,52 Gp 3 6 597562 7171145 598903 7169665 2652 137 316
294,54 408,55 114,01 Gp 3
7 601980 7174195 605091 7173158 3711 114 288
304,55 379,7 75,15 Gp 2 8 603994 7173282 605125 7172142 1898 125 314
299,53 347,4 47,87 Gp1
9 603021 7171899 604554 7171099 1884 105 297
289,41 322,4 32,99 Gp1 MEAN
2414 105 273
291,4 352,42 71,02


![Geology · Geology Forthescientificjournal,seeGeology(journal). Geology(fromtheAncientGreekγῆ,gē,i.e.“earth”and-λoγία,-logia,i.e.“studyof,discourse”[1][2](https://img.pdfslide.tips/doc/110x75/5f512a8dc36d4d05a271efd1/geology-geology-forthescientiicjournalseegeologyjournal-geologyfromtheancientgreekgieaoeearthaand-o-logiaieaoestudyofdiscoursea12.jpg)