Embed Size (px)
Citation preview

Mountaciri & al./ Appl. J. Envir. Eng. Sci. 7 N°2(2021) 213-225
213
MATLAB Simulation of IEEE 802.11p Technology on High
User’s Mobility
Mountaciri Abderrahima, Makroum Elmostafaa, Youssefi My Abdelkadera
a Laboratoire d’Ingénierie, de Management Industriel et d’Innovation (LIMII), Faculté ́ des Sciences et
techniques (FST), université Hassan I, Settat, Morroco.
Corresponding author. E-mail : [email protected]
Received 12 Apr 2021, Revised 17 May 2021, Accepted 13 Jun 2021
Abstract
In this article proposed IEEE 802.11p Physical layer (PHY). A MATLAB simulation is performed to
analyze the baseband processing of the transceiver. Orthogonal Frequency Division Multiplexing
(OFDM) is applied in this project according to the IEEE 802.11p standard, which allows data
transmission rates from 3 to 27 Mbps. Separate modulation schemes, bit phase shift modulation
(BPSK), quadrate phase shift modulation (QPSK), and quadrature amplitude modulation (QAM), are
used for different data rates. These schemes are combined with time interleaving and a convolutional
error correction code. A guard interval is inserted at the start of the transmitted symbol to reduce the
effect of intersymbol interference (ISI). This article studies the PHY physical layer of the IEEE
802.11p vehicular communication standard. An IEEE.802.11p PHY model, with many associated
phenomena, is implemented in the V2V vehicle-to- vehicle, and the vehicle-to-vehicle ad hoc network
(VANET) provides convenient coordination between moving vehicles. A moving vehicle could move
at a very high speed, producing a Doppler effect that damages OFDM symbols and also causes inter-
carrier interference (ICI). This article has discussed VANET technology versus 802.11a technology,
as they have many differences when it comes to user mobility. The Doppler effect resulting from the
mobility of the user with a high speed of 25 to 400 km / h has been studied as the main parameter, the
estimation of the channel based on the lms algorithm has been proposed in order to improve the
performance of the physical physical chain
Keywords : ANET, OFDM, 802.11p, Doppler Effect, power spectral Density.
Introduction
Vehicle-to-vehicle and vehicle-to-infrastructure ommunications aim to reduce road accidents,
automatic fare collection, route information, working lights, etc. The Vehicle-to-Vehicle
Communication Consortium (C2C-CC) is a non-profit industrial organization supporting the creation
of a European standard for future communicating vehicles covering all brands. The 802.11p standard

Mountaciri & al./ Appl. J. Envir. Eng. Sci. 7 N°2(2021) 213-225
214
is designed for use in vehicle-2-vehicle and vehicle-2-infrastructure communications. This standard
is based on the same structures as that of the 802.11a standard; The IEEE 802.11p standard typically
uses 10 MHz bandwidth channels in the 5.9 GHz band (5.850–5.925 GHz). This is half the bandwidth,
or double the transmission time for a specific data symbol, as used in 802.11aVehicle-to-vehicle and
vehicle-to-infrastructure communications aim to reduce road accidents, automatic fare collection,
route information, working lights, etc. The Vehicle-to-Vehicle Communication Consortium (C2C-
CC) is a non-profit industrial organization supporting the creation of a European standard for future
communicating vehicles covering all brands. The 802.11p standard is designed for use in vehicle-2-
vehicle and vehicle-2-infrastructure communications. This standard is based on the same structures
as that of the 802.11a standard; The IEEE 802.11p standard typically uses 10 MHz bandwidth
channels in the 5.9 GHz band (5.850–5.925 GHz). This is half the bandwidth, or double the
transmission time for a specific data symbol, as used in 802.11a.
1. Physical layer specifications
1.1. PHY IEEE 802.11 a and IEEE 802.11 p.
The RF LAN system is initially planned for 5.15-5.25, 5.25-5.35 and 5.725-5.825 GHz unlicensed;
in the National Information Structure (U-NII) bands, the OFDM system provides a wireless LAN
with useful data rates of 6, 9, 12, 18,24, 36, 48 and 54 Mbit/s. The support for data transmission and
reception rates of 6, 12 and 24 Mbit / s are mandatory. The system uses 52 subcarriers which are
modulated by binary or quadrature phase modulation (BPSK/QPSK), quadrature amplitude
modulation (QAM) 16 or quadrature amplitude modulation (QAM) 64. Forward error correction
coding (convolutional coding) is used with a coding rate of 1/2, 2/3 or 3/4. Figure 2 shows the format
of the PPDU, where the preamble of the OFDM PLCP, the OFDM PLCP header, the PSDU, the tail
bits and the range bits are shown. The PLCP header contains the following fields : LENGTH, RATE,
a reserved bit, an even parity bit and the SERVICE field. In terms of modulation, LENGTH, RATE,
reserved bit and parity bit (with 6 tail bits "zero" in the appendix) form a single, separate OFDM
symbol, called SIGNAL, which is transmitted with the most robust combination of BPSK modulation
and a coding rate of R = 1/2. The SERVICE field of the PLCP header and the PSDU (with 6 "zero"
tail bits and padding bits), called DATA, are transmitted at the data rate described in the RATE field
and can constitute several OFDM symbols. The tail bits in the SIGNAL symbol allow the decoding
of the RATE and LENGTH fields immediately after receiving the tail bits. The RATE and LENGTH
fields are required to decode the DATA part of the packet. IEEE 802.11p is a standard based on
802.11-2007 [2] PHY is based on OFDM and is analogous to 802.11a. to analyze the physical layer
of 802.11p, with the most important parameters making the comparison with IEEE 802. 11 a,
developed for communication between vehicles and operates within the 802.11p standard at a
frequency of 5, 9 GHz, the bandwidth of 802.11p is 10 MHz, which is half the bandwidth of 802.11a.
The distribution of any signal is accompanied by attenuation, which depends on the distance from the
point of transmission and the frequency of the signal. The received signal can vary due to reflections
from moving vehicles, many copies of the signal arrive at the receiving antenna with different levels
and delays, in order to avoid the negative influence of signal interference. The received signal may

Mountaciri & al./ Appl. J. Envir. Eng. Sci. 7 N°2(2021) 213-225
215
vary due to reflections from moving vehicles and many copies of the signal arrive atthe receiving
antenna with different levels and delays, in order to avoid the negative influence of the interference.
OFDM is used, its realization in the transmitter using the inverse Fourier transform (IFFT), consider
the first N-carriers multiplexed on the signal of the temporal frequency representation.The 802.11p
standard uses the IFFT with a window of 64 frequency (N) subcarriers. Since the channel has a
bandwidth of 10 MHz (Bw), each orthogonal frequency subcarrier has a spacing of Bw / N = 0.15625
MHz (Δf). Among the64 orthogonal subcarriers, 56 are used: 52 - data tones, 4 pilottones. The cyclic
prefix (CP) is an important part of OFDM. The CP is the last part of the signal, which is added at the
beginning. A fragment of the desired signal is transmitted to the CP; it guarantees the orthogonality
of the subcarriers in the received signal. The CP is redundant information, which reduces the
transmission speed, but protects against inter-symbol interference. The duration of the CP depends
on the decoder and the maximum receiver. The longer the delay, the longer the CP duration should
be. The IEEE 802.11p [3]. standard offers data transmission rates of 3, 4.5, 6, 9, 12, 18, 24 and 27
Mbps; the frequency range used is 5,850 to 5,925 GHz, which is divided into 7 channels of 10 MHz.
The standard is based communications. The transmission bandwidth is divided into several narrow
sub-channels, which are transmitted in parallel. Ideally, each sub-channel is narrow enough that the
fading it experiences is flat.
2 Flow and delay limit
To achieve maximum flow and minimum delay for a real WAVE system where several vehicles are
struggling for wireless support [4]. The lowest data rate of 3 Mbps is used. The physical layer
convergence procedure protocol data unit (PPDU) of the IEEE 802.11 PHY consists of a Layer
Convergence Procedure (PLCP) preamble, PLCP header ,tail bits and fill bits of the physical layer
service data unit (PSDU), such as illustrated in figure 2. The PSDU format includes a MAC header,
Frame body and Fram as other keys parameters are summarized in Tables 1.Because the broadcast does
not require an ACK frame, the maximum throughput in (3) can be further simplified to e Check
Sequence (FCS) field. Values the duration of Tpm , Tsg and Tda, as well
Figure 1 -PPDU frame format for IEEE 802.11p OFDM PHY.

Mountaciri & al./ Appl. J. Envir. Eng. Sci. 7 N°2(2021) 213-225
216
𝐿𝑝𝑑 𝑖𝑠 𝑡ℎ𝑒 𝑑𝑎𝑡𝑎 𝑝𝑎𝑦𝑙𝑜𝑎𝑑 𝑤𝑖𝑡ℎ [0 − 2048] × 8 𝑏𝑖𝑡𝑠 , 𝑻𝒅𝒂𝒕𝒂 is the data transmission duration for
given by 𝑇𝑑𝑎𝑡𝑎 = Tpm + Tsg + Tsym[16+lhd+Lpdd+Lfcs+6
NDPBS]
lhd is the data MAC Layer header with a size of 328 bits lfcs is the frame check sequence (FCS)with a
size of 4 × 8 bits? 𝑵𝑫𝑷𝑩𝑺is the data bit per OFDM symbol given n table 1 .The packet delay is defined
as the time duration of a packet transmission and its successful reception. The minimum delay is given
by 𝑀𝐷 = Tdata + Tprop + TDIFS +𝐂𝐖𝐚𝐯𝐠 the maximum throughput limit (MTL) and minimum delay
limit (MDL) are shown The MTL and MDL are obtained by assuming that the NDBPS are infinite such
that the time duration for a data transmission is zero. The maximum throughput of IEEE 802.11p is
approximately 18 Mbps for the 27- Mbps PHY mode with a payload of 2,000 bytes, whereas the upper
limit is around 80 Mbps for an payload of 2,000 bytes, whereas The Maximum Throughput Limit (MTL)
and Minimum Delay Limit (MDL) are obtained by assuming that the NDBPS are infinite so that the
duration of a data transmission is zero. The maximum data rate for IEEE 802.11p is approximately 18
Mbps for the 27-Mbps PHY mode with a 2000-byte payload, while the upper limit is approximately 80
Mbps for an infinite data rate. The minimum delay is about 0.8 ms for 27-Mbps PHY mode with QAM;
the data rates that the 802.11a standard allows are 6, 9, 12, 18, 24, 36, 48 and 54 Mbps. An OFDM
symbol is sent to each 4μs, of which 0.8 μs is the cyclic prefix. As
Table 1-PHY modes and NDBPS of IEEE 802.11p
Datarate (Mbit/s) modulation Code rate 𝑵𝑫𝑩𝑷𝑺
1 3 BPSK 1/2 24
2 4.5 BPSK 3/4 36
3 6 QPSK 1/2 48
4 9 QPSK 3/4 72
5 12 16QAM 1/2 96
6 18 16QAM 3/4 144
7 24 64QAM 2/3 192
8 27 64QAM 3/4 216
250 000 symbols are sent every second, and one symbol uses 48 data carriers, a bit rate of 6 Mb/s is
obtained with BPSK modulation and a half rate convolutional code (48*1/2 *250000 = 6 Mb/s). To
determine the differences between the 802.11a and 802.11p standards, this document uses the BER (bit
error rate) as a comparison parameter. The channel used is an awgn and fading rayleigh channel; these
channels can be used for the 802.11a and 802.11p standards because they have the same structure. The
characteristics of the channels are taken from the literature The impulse channel response decreases
exponentially with delay. Characterized by the Rayleigh a Typical office environment for NLOS
condition with 50 ns RMS delay spreading a Gaussian channel - channel with additive white Gaussian
noise (AWGN).

Mountaciri & al./ Appl. J. Envir. Eng. Sci. 7 N°2(2021) 213-225
217
3 Resultats and discusion :
3.1 Fading in v2v channel
The V2V channel, in which both transmitter and receiver can be mobile, is a relatively newer area of
study. Wireless channels can be modeled either deterministically, or statistically [5, 6]. statistical
models are the most widely used because they do not attempt to provide an exact estimate the small
size of a scale chain of fading characteristics at points in space at a given time; instead, they try to
faithfully mimic the variation of these effects’ channels. small-scale discoloration, which most often
occurs due to destructive interference from several replicas of the transmitted signal arriving at the
receiver with different delays due to several reflections from several beams from buildings and other
installations as shown in figure 3 As an example autoroute to 6-lane highways with speeds ranging from
25 to more than 40 m/s and different traffic densities. Two-lane rural roads with speeds up to 30 m/s.
There are few buildings and the vehicle density is low. One and two-lane suburban roads streets. Traffic
density is generally low and speeds are limited to about 15 m/s or less on urban streets. They are
characterized by wider streets and higher traffic density than suburban streets. in order to describe the
frequency and temporal behavior of the channel . For an information carrying signal transmitted by the
channel havin𝑔 𝐵𝑇 bandwidth. the channel is said to have frequency selective fading if Bc is less than
𝐵𝑇, it is said to be non-frequency selective or to uniform fading if bc is greater than bt the consistency
band is defined
Figure 2- Illustration of the multi-path physical environment
maximum of the delay propagation delay, respectively. 𝑟𝑚𝑎𝑥 is defined to be less than the upper value
propagation with limited delay 𝑟𝑙𝑖𝑚 = 𝑇𝐺𝐼 = 1.6 μs The coherence time of the channel event is linked
to the vehicle speed v frequency, c is the speed of light and v is the speed of the vehicle. A slowly
changing channel has a small Doppler frequency or, equivalently, a large coherence time. If the
coherence time Tc is small, compared to the measured time interval Tm of the transmitted signal, the
channel is said to be fast fading. Otherwise, the channel is said to be slow fading. the channel parameters
include 𝐵𝑇 , Tm and τlim. 𝐵𝑇 = 10 MHz ; the measured signal interval Tm = packet time = 840 μs;
each transmitted packet contains 100 orthogonal frequency division multiplexing (OFDM) symbols; the

Mountaciri & al./ Appl. J. Envir. Eng. Sci. 7 N°2(2021) 213-225
218
maximum delay spreading time τmax is set to be less than the guard interval (GI) TGI of the OFDM
symbol, i.e. the limit of the maximum delay spreading time τlim = TGI = 1.6μs table 4 abstract four
types of multipath fading channels [11] The simulation of the model follows the structure of the
transmitter and the receiver of the standards 802.11a and 802.11p in figure 4 The transmitter has been
implemented with the steps: convolutional encoding with an encoding rate of R = 1/2 , BPSK modulation
mapping, IFFT implementation for 64 points, add CP. The effects of fading channel and white Gaussian
noise are added. The receiver includes the following steps: CP removal, FFT implementation for 64
points, BPSK modulation demapping, and error code decoding using Viterbi's hard decision algorithm.
To determine the differences between the 802.11a and 802.11p standards, [7] this article calculates the
BER ratio as a function of Eb / N0 for a channel with fading of type awgn and RAYLEIGH l despite the
increase in momentum, Doppler shift and difficult channel characteristics. the increase in momentum,
Doppler shift and difficult channel characteristics. The typical propagation of the effective delay for an
LOS signal component can be up to 320 ns, seen in Table 2 this can be
Table 2-condition of fading channel in DSRC
FLAT FADING FREQUENCY SELECTIVE
FADING
SLOW FADING
0 ≤ 𝑟𝑅𝑀𝑆 ≤ 20 𝑛𝑠𝑒𝑐
0≤𝑓𝑑 ≤ 595,2𝐻𝑧
0≤v≤v≤109 km/h
20𝑛𝑠𝑒𝑐 ≤ 𝑟𝑅𝑀𝑆 ≤ 320 𝑛𝑠𝑒
0≤𝑓𝑑 ≤ 595,2𝐻𝑧
0≤v≤v≤109 km/h
FAST FADING
0 ≤ 𝑟𝑅𝑀𝑆 ≤ 20 𝑛𝑠𝑒𝑐
595,2 ≤ 𝑓𝑑 ≤ 595,2𝐻𝑧
109km/h≤ v≤400km/h
20𝑛𝑠𝑒𝑐 ≤ 𝑟𝑅𝑀𝑆 ≤ 320 𝑛𝑠𝑒
595,2 ≤ 𝑓𝑑 ≤ 2185,2𝐻𝑧
109km/h≤v≤v≤400 km/h
more or less interpreted as (root mean square of) the time difference between the LOS comonent
and the last non component. The guard time is 1.6 s, therefore the guard time is sufficient to eliminate
ISI. However, according, If we assume a maximum speed of 400 km / h, the maximum Doppler
propagation will be 2185.2 KHz and this indicates a channel coherence time of 228.8s.
Figure 3 -IEEE 8023.11 p transmitter and receiver

Mountaciri & al./ Appl. J. Envir. Eng. Sci. 7 N°2(2021) 213-225
219
. A transmitted frame should not be `` on-air '' longer than this period, or the drive symbols at the start
of a frame will not be long enough and the signal may become too distorted. The size of the frame which
it depends on the bit rate, but it is only 686 bits for the lowest data rate (3 Mbit / s 228.8μs). Since the
probability of bit error (in a AWGN channel) of a communication system depends only on the SNR
per bit or Eb / N0, the energy per bit is doubled in 802.11p. Symbol time in 802.11p is doubled and
data rate is divided by If the data rate is halved and the transmit power remains the same, a symbol
contains twice the energy it makes in 802.11a, which means energy doubled by symbol and energy
doubled per bit (equation 𝑃𝑠 = 𝑄(√2𝐸𝑏
𝑁0) ;
𝐸𝑏
𝑁0 is the effective signal-to-noise ratio (SNR) per bit where
Eb is the energy per bit, N0 is the noise density in W/Hz Q (x) is the function Q, which is the distribution
function of a Gaussian distribution i.e. the integral which calculates the area under the right tail). Figure
5 gives the differences between the 802.11a and 802.11p standards The type of modulation used in this
simulation is binary phase shift modulation (BPSK). Although BPSK has a lower transmission rate, it
is often used for security or high mobility applications due to its lower BER property By comparing the
BER as a function of the SNR we can notice that the IEEE 802.11 p standard is better than the IEEE
802.11 a standard for a fixed SNR the p standard presents a low value of the BER in comparison with
the a standard due to its better reliability
Figure 4 -BER curves BPSK for IEEE 802.11a and IEEE 802.11 p
3.2 Doppler shift in IEEE 802.11 P
Doppler shift When a source vehicle and a receiver vehicle move relative to each other, the
frequency of the received signal will not be the same as the source. [8] When they get closer to each
other, the frequency of the received signal is higher than the source, and it decreases when they get
closer as seen in [9]. The Doppler effect has a great effect on vehicle networks due to the
VANET mobility Doppler shift When a source vehicle and a receiver vehicle move relative to
each other, the frequency of the received signal will not be the same as the source. [8] When they get
closer to each other, the frequency of the received signal is higher than the source, and it decreases when
they get closer as seen in [9]. The Doppler effect has a great effect on vehicle networks due to
the VANET mobility the frequency Doppler shift can be calculated ∆𝑓 = ±𝑓𝑐𝑣
𝑐 ⁄ 𝑐𝑜𝑠 𝛽𝒄 ;∆𝒇

Mountaciri & al./ Appl. J. Envir. Eng. Sci. 7 N°2(2021) 213-225
220
where is the deviation of the source vehicle frequency at the receiver. The frequency of the source is 𝒇𝒄
, 𝒗 is the speed difference between the source and transmitter vehicles, and c is the light velocity. In
vehicular networks the range of 𝑓𝑐=5.9GHZ for simulation we choose v є [25, 400km/h ] wich give ∆𝑓
є[136, 2185,2𝐻𝑧] for Doppler shift,.. OFDM symbol is very sensitive to the Doppler Shift. An OFDM
signal can be represented by 𝑣(𝑡) = ∑ 𝐴𝑖 cos(ω𝑖𝑁𝑠−1𝑖=1 𝑡 + 𝜑𝑖) 𝐴𝑖 ,ω𝑖 , 𝜑𝑖 be represented as respective
values of the amplitude, angular frequency, and phase of subcarrier used from the it to OFDM
signal. If Ns are the number of subcarriers used in OFDM, then each subcarrier must be orthogonal to
one another. This can be obtained if 𝑓𝑖 =ω𝑖 2𝜋⁄ which is the integer multiplication of1 2𝑇⁄ , with T is
the period of the data, and f1 is the frequency range with a value of 𝑅𝑠 =1
𝑇⁄ .If we continued equation
(2) with processing at up converter side to produce 5,9 GHz frequency, (2)becomes,𝑉𝑖 = 𝐴𝑖
cos( 𝜔𝑖 𝑡 +𝜑𝑖)𝑒−(𝑗2𝜋𝑓𝑐t) if he value 𝐴𝑖 cos( 𝜔𝑖 𝑡 + 𝜑𝑖) = 𝑆𝑖 then𝑽𝒊 = 𝑺𝒊𝒆−(𝒋𝟐𝝅𝒇c t) (3) When the value of
𝑒−(𝑗2𝜋𝑓𝑐) and τ𝑖 represents the carrier frequency and delay to the it component of the received signal,
respectively. If the vehicle moves at a constant velocity v, and each vehicle moves straight with 𝛽 =
0 then the value of the transmitted signal is affected by the value of 𝑣𝑐 ⁄ cos 𝛽 so the equation (3)
become 𝑽𝒊 = 𝑺𝒊𝒆−(𝒋𝟐𝝅𝒇𝒄) τ𝑖 𝒆(𝒋𝟐𝝅∆𝒇)𝒕 with (𝑗2𝜋∆𝑓 𝑡) is a value from phase-changing at the transmitted
signal. If the value of t = ¼ Δf , then the equation becomes 𝑉𝑖 = 𝑗𝑒−(𝑗2𝜋𝑓𝑐) τ𝑖 Assuming the period is ¼ of
the Doppler shift 0 ≤ ∆𝒇 ≤ ±𝟐. 𝟏𝟖𝟓𝒌𝑯𝒛 , the MATLAB simulation model see APPENDIX 1 is
calculated for a variation in vehicle speed of 25.75,125 175 225 and 400 km / h, the SNR varies from 1
to 40 dB Figure 6 gives the result of parameters such as as defined by the IEEE 802.11p standard, the
channel used is a combination of a Rayleigh and an AWGN. For the BER 10e-3 value if the mobile speed
is 30 km / h. no communication can be performed when the SNR is less than 10 dB; for communication
to be effective at SNR = 16 dB, the maximum relative speed must be less than or equal to 175 km / h.
Fig 6 describes the impact of the Doppler effect in the IEEE 802.11 p standard due to the high mobility
of the channel, we observe that the BER decreases if the speed increases which deters the transmission,
a matlab program describing the operation of the IEEE 802.11a PHY layer gives in APPENDIX 2
encoding process consists of many steps, the transmitted bits are generated with the data source
component. These data are modulated using phase-shift modulation (BPSK or QPSK) or amplitude
modulation (16-QAM or 64 QAM) the transmitted signal rate which can vary by 3 Mb / s (with BPSK
and 1/2 code rate) at 27 Mb / s (with 64-QAM and 3/4 code rate . In order to compare the modulation,
M - ary, figure 7 and figure8 , respectively give the BER the qam 4 and the qam 64, figure 9 and
10 respectively give the constellations which are the distance between points I and Q modulation
system for M = 4 and M = 64 4-QAM has been found to offer the best performance (lowest BER)
compared to 16-QAM and 64-QAM. The results of the comparison also show that a modulation
scheme with a lower constellation value has better BER performance due to the higher bit rate we
note the influence of the Rayleigh type channel. We conclude the error performance of the 4QAM-
OFDM, 8QAM-OFDM and 16QAM-OFDM systems on the AWGN channel and the Rayleigh fading
channel. It is observed from the simulation results that the signal power increases the error rate decreases
in both AWGN and Rayleigh fading channels but the error rate increases as the value of the modulation
scheme the error data can be reduced as well as transmission easily influenced by noise. the error data
can be reduced as well as transmission easily influenced by noise. 64 QAM is much better than 4 QAM
when BER decreases SNR increases because signal is stronger than noise. 64QAM modulation requires

Mountaciri & al./ Appl. J. Envir. Eng. Sci. 7 N°2(2021) 213-225
221
because signal is stronger than noise. . the error data can be reduced as well as transmission easily
influenced by noise. 64 QAM is much better than 4 QAM when BER decreases SNR increasesbecause
signal is stronger than noise. 64QAM modulation requires because signal is stronger than noise. 64QAM
modulation requires to 4QAM We also validate the communication performance of OFDM systems
proposed by the MATLAB simulation is the result of experimentation with the BER (Bit Error Rate)
test with different SNR (Signal Noise Ratios). It may be observed that
Figure 5-BER BPSK . V є [ 25 , 400km/h ]

Mountaciri & al./ Appl. J. Envir. Eng. Sci. 7 N°2(2021) 213-225
222
figure 6- BER Vs SNR 4QAM
Figure 7 -BER V s SNR 64QAM
he system has better noise canceling capability, BER decreases rapidly with increasing SNR. Also, in
the same state of SNR, 16QAM has a lower BER than BPSK. It shows that, M-ary modulation system
has higher bandwidth utilization than binary modulation but it has less advantages in noise canceling

Mountaciri & al./ Appl. J. Envir. Eng. Sci. 7 N°2(2021) 213-225
223
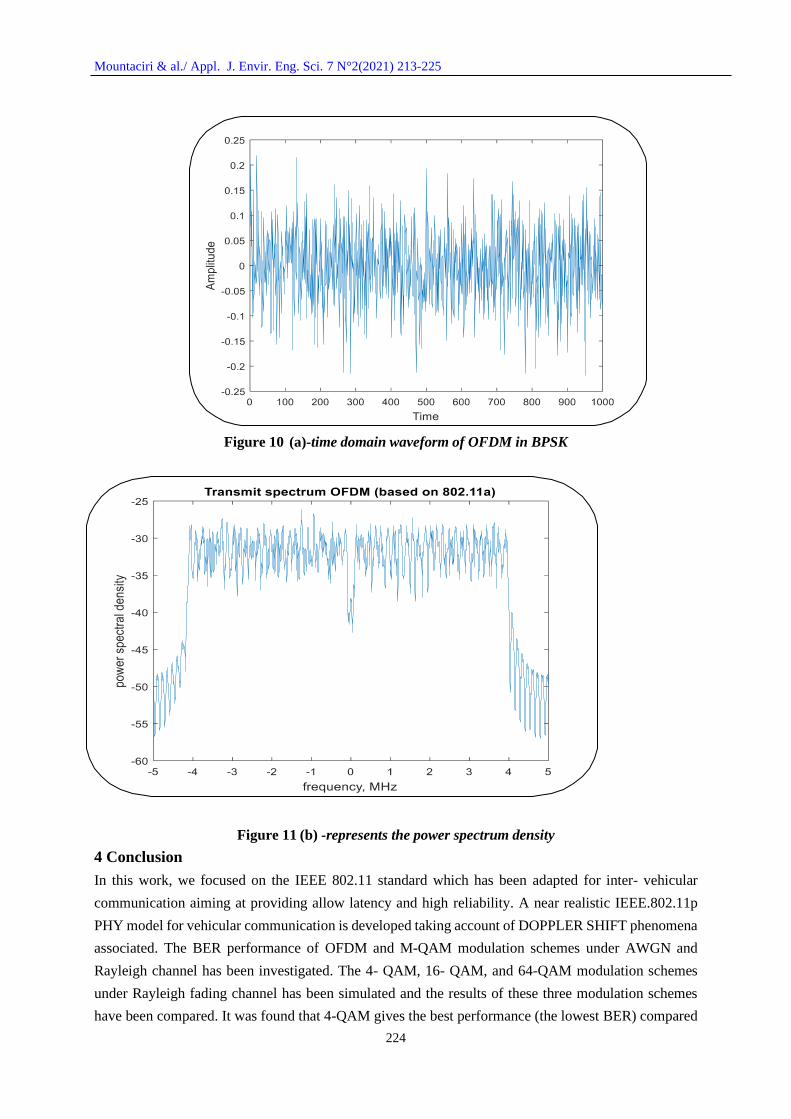
capability. Figure 11 (a) is the time domain waveform of OFDM.. Figure 11 (b) represents the power
spectrum density of the modulated OFDM signal which contains 52 subcarriers, it shows that the data
of the OBUs are correctly modulated on the relevant subcarriers
Figure8-received constellation 4 QAM
Figure 9 - received constellation 64 QAM
Mountaciri & al./ Appl. J. Envir. Eng. Sci. 7 N°2(2021) 213-225
224
Figure 10 (a)-time domain waveform of OFDM in BPSK
Figure 11 (b) -represents the power spectrum density
4 Conclusion
In this work, we focused on the IEEE 802.11 standard which has been adapted for inter- vehicular
communication aiming at providing allow latency and high reliability. A near realistic IEEE.802.11p
PHY model for vehicular communication is developed taking account of DOPPLER SHIFT phenomena
associated. The BER performance of OFDM and M-QAM modulation schemes under AWGN and
Rayleigh channel has been investigated. The 4- QAM, 16- QAM, and 64-QAM modulation schemes
under Rayleigh fading channel has been simulated and the results of these three modulation schemes
have been compared. It was found that 4-QAM gives the best performance (the lowest BER) compared

Mountaciri & al./ Appl. J. Envir. Eng. Sci. 7 N°2(2021) 213-225
225
to 8-QAM and 16- QAM. The comparison results also shows that a modulation scheme with lower
constellation value has better BER performance because of having higher bit rate. The performance of
QAM and QPSK modulation schemes has also been compared. It was found that the QPSK gives lower
BER compared to QAM modulation scheme. It is also observed that the lower the order of modulation
techniques is, the better system performance is obtained without the consideration of spectral efficiency.
Finally, the performances of QPSK-based OFDM, 16-QAMbased OFDM, and 64-QAM-based OFDM
in Rayleigh channel has also been compared. It was found that the QPSK-based OFDM always give
the lowest BER compared to the 16-QAM-based OFDM and 64-QAM-based OFDM in order to
increase the throughput, performance of IEEE 802 a with BPSK modulation and IEEE802.11 p with
BPSK and also Doppler effect it conclude that IEEE 802.11 p offer the lower BER .The technology
(MIMO) implemented in the V2V technology is used for higher rate bit and lower BER will be the
subject of my futur work
References
1. CSU, Q., Mac, T., Kop, J., & Sengupta, R. (2004, October). Vehicle-to-vehicle safety messagng
in DSRC. In Proceedings of the 1st ACM international workshop on Vehicular ad hoc networks
(pp. 19-28).
2. IEEE Std. P802.11p/D3.0, “Draft Amendment for Wireless Accessing Vehicular Environments
(WAVE)”, July, 2007.
3. Li, Y. J. (2010, November). An overview of the DSRC/WAVE technology. In International
Conference on Heterogeneous Networking for Quality, Reliability, Security and Robustness (pp.
544-558). Springer, Berlin, Heidel
4. Song, Y. S., & Choi, H. K. (2017). Analysis of V2V broadcast performance limit for WAVE
communication systems using two‐ray path loss model. ETRI Journal, 39(2), 213-221.
5. Vivek, N., Srikanth, S. V., Saurabh, P., Vamsi, T. P., & Raju, K. (2014, February). On field
performance analysis of IEEE 802.11 p and WAVE protocol stack for V2V & V2I
communication. In International Conference on Information Communication and Embedded
Systems (ICICES2014) (pp. 1-6). IEEE.
6. MAR, Jeich, KUO, Chi-Cheng, LIN, You-Rong, et al. Design of software- defined radio
channel simulator for wireless communications: case study with DSRC and UWB channels.
IEEE Transactions on Instrumentation and Measurement, 2009, vol. 58, no 8, p. 2755-2766.
7. KUKOLEV, P. Comparison of 802.11 a and 802. 11p over fading channels. Elektrorevue,
2013, vol. 4, no 1, p. 7-11.
8. Wijngaarden, P. V. (2011). Frame capture in IEEE 802.11 p vehicul etworks: a simulation-
based approach (Master's thesis, University of Twente).
9. [9 ] PAMUNGKAS, Wahyu et SURYANI, Titiek. Doppler effect in VANE chnology on high
user's mobility. In : 2018 International Conference on Informatio nd Communications
Technology (ICOIACT). IEEE, 2018. p. 899-904