Embed Size (px)
Citation preview
8/6/2019 MECN 4016 Aerodynamics
http://slidepdf.com/reader/full/mecn-4016-aerodynamics 1/40
MECN 4016 Aerodynamics 06 June 2011
0
MECN 4016 Aerodynamics
Assignment –
“Methods of Determining the Low Speed Downwash Angle on an Aft Tail ”
Jameson Bentley
Thando Tshabalala
06 June 2011
8/6/2019 MECN 4016 Aerodynamics
http://slidepdf.com/reader/full/mecn-4016-aerodynamics 2/40
MECN 4016 University of the Witwatersrand
School of Aeronautical Engineering
1
Abstract
Various methods were applied to estimate the downwash angle of a wing at a very low Mach
number, and the effect this would have on the effective angle of attack of a tail aft of the wing. The
theory for the analysis is based around Prandtl’s Lifting Line Theory, where calculations were
performed using Microsoft Excel and Matlab. The theory was compared to empirical data obtained
from performing wind tunnel tests of the same downwash scenario. Further models were
established using Vortex Panel Method Tornado, run in Matlab, as well as a DATCOM analysis. From
the four methods of analysis it was found that the downwash angle produced by a rectangular
NACA-0015 (with chord 0.08m and span 0.48m at an airspeed of 33.57m/s) was a function of angle
of attack. This function was represented by a linear relationship as anticipated from the theory.
Furthermore it was validated that the influence coefficients were a function of wing geometry and
remained constant with changing angles of attack. Therefore the downwash angle varied with the
value for lift coefficient. It was also found that the spanwise location at a constant distance aft of the
wing changed the downwash angle because it changed both the lift co-efficient and the influence
coefficients. This relationship was rather more complex and required numerical iteration and matrix
methods to solve. The DATCOM analysis revealed a perfectly linear relationship between lift
coefficient and downwash angle and a similarly linear relationship between downwash and angle of
attack.
8/6/2019 MECN 4016 Aerodynamics
http://slidepdf.com/reader/full/mecn-4016-aerodynamics 3/40
MECN 4016 University of the Witwatersrand
School of Aeronautical Engineering
2
Declaration
Group declaration with joint task submitted for assessment
We, the undersigned, are registered for MECN 4016, Aerodynamics in the year 2011. We
herewith submit the following task,
“Methods of Determining the Low Speed Downwash Angle on an Aft Tail ”
in partial fulfilment of the requirements of the above course.
We hereby declare the following:
We are aware that plagiarism (the use of someone else’s work without their permission
and/or without acknowledging the original source) is wrong. We confirm that the work submitted herewith for assessment in the above course is our
own unaided work except where we have been explicitly indicated otherwise.
This task has not been submitted before, either individually or jointly, for any course
requirement, examination or degree at this or any other tertiary educational institution.
We have followed the required conventions in referencing the thoughts and ideas of others.
We understand that the University of the Witwatersrand may take disciplinary action against
us if it can be shown that this task is not our own unaided work or that we have failed to
acknowledge the sources of the ideas or words in our writing in this task.
Signed this, the ____________ day of ________________ in the year___________.
Student number Student name Signature % contribution
324628 Thando Tshabalala 50.0
0616194H Jameson Bentley 50.0
8/6/2019 MECN 4016 Aerodynamics
http://slidepdf.com/reader/full/mecn-4016-aerodynamics 4/40
MECN 4016 University of the Witwatersrand
School of Aeronautical Engineering
3
Contents Abstract ............................................................................................................................................ 1
Declaration ........................................................................................................................................ 2
List of Figures .................................................................................................................................... 5
List of Tables ..................................................................................................................................... 6
1. Introduction .............................................................................................................................. 7
1.1. Background Information .................................................................................................... 7
1.2. Literature ........................................................................................................................... 9
The Downwash Aft of an Unswept Wing (3) ............................................................................... 9
2. Objectives ................................................................................................................................ 17
3. Analysis ................................................................................................................................... 18
3.1. Prandtl’s Lifting Line Theory ............................................................................................. 18
3.2. DATCOM .......................................................................................................................... 20
4. Experimentation ...................................................................................................................... 21
4.1. CFD (Tornado) .................................................................................................................. 21
4.2. Wind-tunnel Test ............................................................................................................. 22
4.2.1. Apparatus ................................................................................................................. 22
4.2.2. Procedure................................................................................................................. 25
4.2.3. Observations ............................................................................................................ 25
5. Results ..................................................................................................................................... 26
6. Discussion ................................................................................................................................ 30
6.1. Thando Tshabalala ........................................................................................................... 30
6.2. Jameson Bentley .............................................................................................................. 30
7. Conclusions and Recommendations ......................................................................................... 34
7.1. Thando Tshabalala ........................................................................................................... 34
7.2. Jameson Bentley .............................................................................................................. 34
8. References ............................................................................................................................... 36
8/6/2019 MECN 4016 Aerodynamics
http://slidepdf.com/reader/full/mecn-4016-aerodynamics 5/40
MECN 4016 University of the Witwatersrand
School of Aeronautical Engineering
4
9. Appendix ................................................................................................................................. 37
8/6/2019 MECN 4016 Aerodynamics
http://slidepdf.com/reader/full/mecn-4016-aerodynamics 6/40
MECN 4016 University of the Witwatersrand
School of Aeronautical Engineering
5
List of Figures
Figure 1: Variation of Downwash with lift coefficient ......................................................................... 7
Figure 2: Variation of maximum downwash angle in the symmetry plane with Cl for a Clark Y aerofoil
.......................................................................................................................................................... 8
Figure 3: Comparison of calculated and experimental downwash at the tail of the midwing-
monoplane model (Silverstein, S and Bullivant 1939) ......................................................................... 9
Figure 4: Prandtl's model for the bound vorticity and the trailing vortex sheet generated by a finite
wing (Phillips, et al. 2002) ................................................................................................................ 10
Figure 5: Schematic of the vorticity rollup behind a finite wing with elliptical planform shapeb
(Phillips, et al. 2002) ........................................................................................................................ 11
Figure 6; the vortex used for estimating the downwash a few chord lengths or more aft of an
unswept wing (Phillips, et al. 2002).................................................................................................. 12
Figure 7: The wing tip vortex strength factor as predicted from the series solution to Prandtl’s lifting-
line theory (Phillips, et al. 2002) ...................................................................................................... 15
Figure 8: The wingtip vortex span factor as predicted from the series solution to Prandtl's lifting line
theory (Phillips, et al. 2002) ............................................................................................................. 15
Figure 9: The effect of tail position on the downwash angle in the plane of symmetry aft of an
unswept wing (Phillips, et al. 2002).................................................................................................. 16
Figure 10: Plan view of the Continuous Wind Tunnel used for the test............................................. 22
Figure 11: The configuration of the wing and tail as set up in the continuous wind tunnel ............... 23
Figure 12: Bubble inclinometer ........................................................................................................ 24
Figure 13: Downwash angle versus semi-spanwise position, using Prantdl’s LLT .............................. 26
Figure 14: Variation in downwash angle with AoA for both Prantdl’s LLT and the windtunnel test ... 27
Figure 15: Relationship between downwash angle and lift coefficient according to Prantdl’s LLT, and
the DATCOM analysis ...................................................................................................................... 27
Figure 16: Lift coefficient versus AoA for Prantdl’s LLT compared to the theoretical value. .............. 28
Figure 17: Lift coefficient versus AoA for the wind tunnel experiment compared to the theoretical
value. .............................................................................................................................................. 29
Figure 18: Spanwise variation in lift coefficient produced by Vortex Panel Method Tornado. ........... 38
Figure 19: Spanwise variation in normalized force over the surface of the wing, according to panel
methods run in Tornado. ................................................................................................................. 39
8/6/2019 MECN 4016 Aerodynamics
http://slidepdf.com/reader/full/mecn-4016-aerodynamics 7/40
MECN 4016 University of the Witwatersrand
School of Aeronautical Engineering
6
List of Tables
Table 1: Results as published from DATCOM ................................................................................... 20
Table 2: Geometric characteristics of the wing and tail sections ...................................................... 23
Table 3: Group member responsibility ............................................................................................. 37
8/6/2019 MECN 4016 Aerodynamics
http://slidepdf.com/reader/full/mecn-4016-aerodynamics 8/40
MECN 4016 University of the Witwatersrand
School of Aeronautical Engineering
7
1. Introduction
1.1.
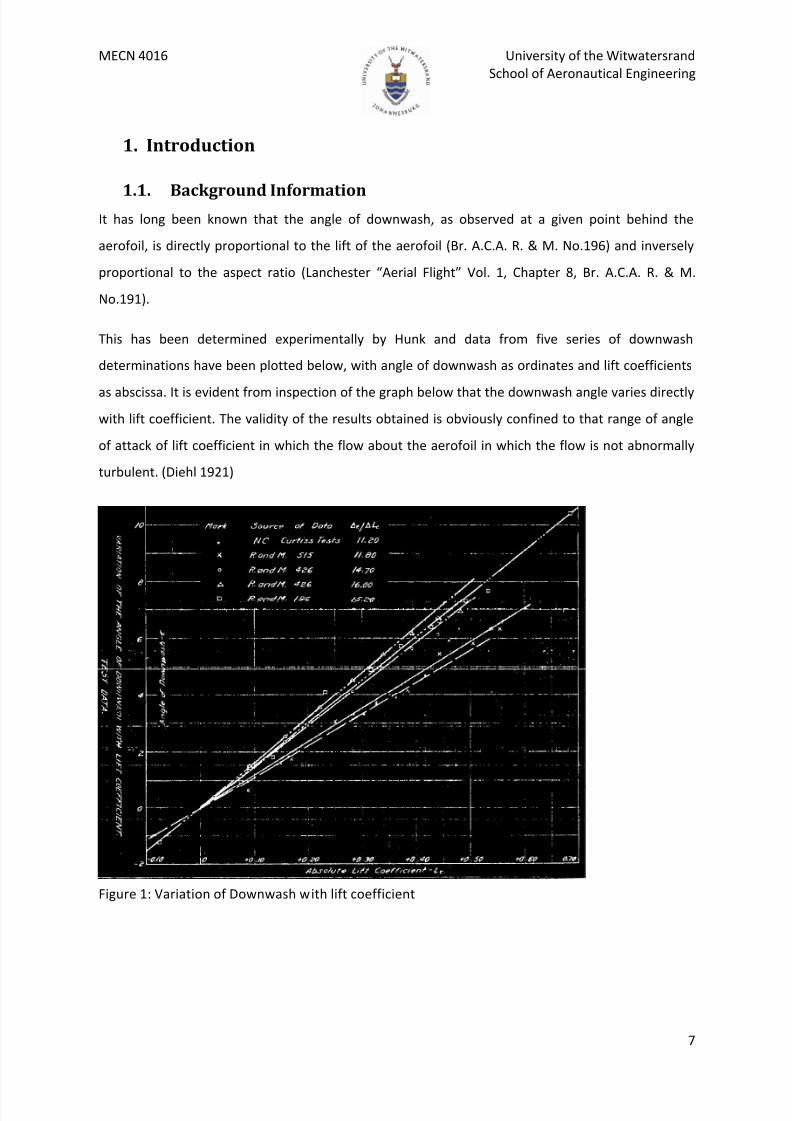
Background InformationIt has long been known that the angle of downwash, as observed at a given point behind the
aerofoil, is directly proportional to the lift of the aerofoil (Br. A.C.A. R. & M. No.196) and inversely
proportional to the aspect ratio (Lanchester “Aerial Flight” Vol. 1, Chapter 8, Br. A.C.A. R. & M.
No.191).
This has been determined experimentally by Hunk and data from five series of downwash
determinations have been plotted below, with angle of downwash as ordinates and lift coefficients
as abscissa. It is evident from inspection of the graph below that the downwash angle varies directly
with lift coefficient. The validity of the results obtained is obviously confined to that range of angle
of attack of lift coefficient in which the flow about the aerofoil in which the flow is not abnormally
turbulent. (Diehl 1921)
Figure 1: Variation of Downwash with lift coefficient
8/6/2019 MECN 4016 Aerodynamics
http://slidepdf.com/reader/full/mecn-4016-aerodynamics 9/40
MECN 4016 University of the Witwatersrand
School of Aeronautical Engineering
8
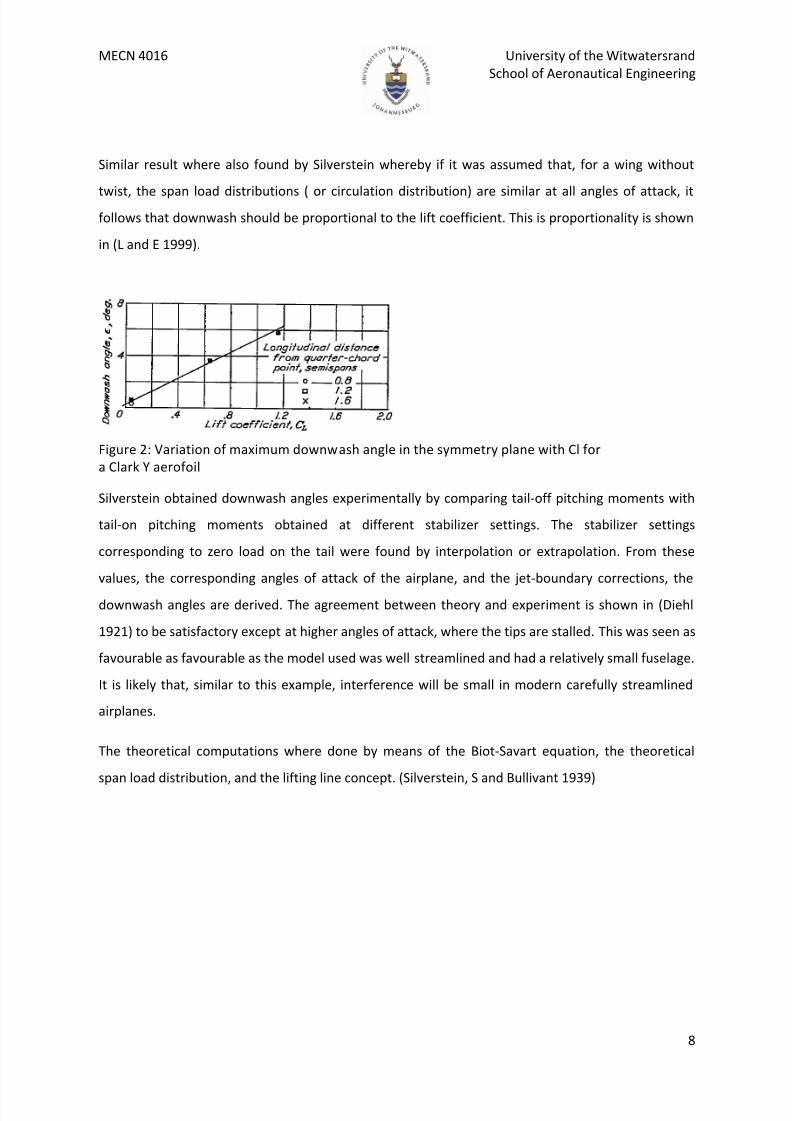
Similar result where also found by Silverstein whereby if it was assumed that, for a wing without
twist, the span load distributions ( or circulation distribution) are similar at all angles of attack, itfollows that downwash should be proportional to the lift coefficient. This is proportionality is shown
in (L and E 1999).
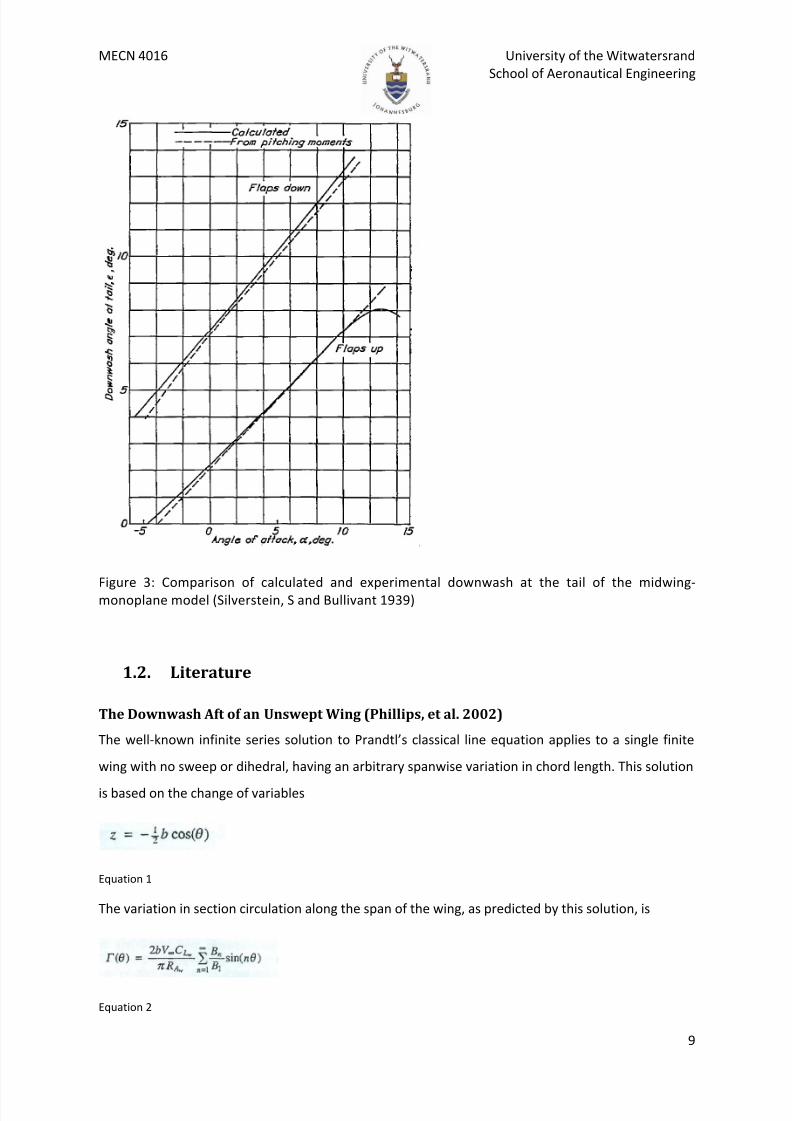
Silverstein obtained downwash angles experimentally by comparing tail-off pitching moments with
tail-on pitching moments obtained at different stabilizer settings. The stabilizer settings
corresponding to zero load on the tail were found by interpolation or extrapolation. From these
values, the corresponding angles of attack of the airplane, and the jet-boundary corrections, the
downwash angles are derived. The agreement between theory and experiment is shown in (Diehl
1921) to be satisfactory except at higher angles of attack, where the tips are stalled. This was seen as
favourable as favourable as the model used was well streamlined and had a relatively small fuselage.
It is likely that, similar to this example, interference will be small in modern carefully streamlined
airplanes.
The theoretical computations where done by means of the Biot-Savart equation, the theoretical
span load distribution, and the lifting line concept. (Silverstein, S and Bullivant 1939)
Figure 2: Variation of maximum downwash angle in the symmetry plane with Cl for
a Clark Y aerofoil
8/6/2019 MECN 4016 Aerodynamics
http://slidepdf.com/reader/full/mecn-4016-aerodynamics 10/40
MECN 4016 University of the Witwatersrand
School of Aeronautical Engineering
9
Figure 3: Comparison of calculated and experimental downwash at the tail of the midwing-monoplane model (Silverstein, S and Bullivant 1939)
1.2. Literature
The Downwash Aft of an Unswept Wing (Phillips, et al. 2002)
The well-known infinite series solution to Prandtl’s classical line equation applies to a single finite
wing with no sweep or dihedral, having an arbitrary spanwise variation in chord length. This solution
is based on the change of variables
Equation 1
The variation in section circulation along the span of the wing, as predicted by this solution, is
Equation 2
8/6/2019 MECN 4016 Aerodynamics
http://slidepdf.com/reader/full/mecn-4016-aerodynamics 11/40
MECN 4016 University of the Witwatersrand
School of Aeronautical Engineering
10
Historically, the coefficients in this infinite series solution may have been usually evaluated from
collocation methods. Typically the series is truncated to a finite number of terms and the coefficients
in the finite series are evaluated by requiring the lifting-line equation to be satisfied at a number of
spanwise locations equal to the number of terms in the series. A very straightforward method was
first presented by Glauert (Glauert 1959). Most recently, Rasmussen and Smith (L and E 1999) have
presented a more rigorous and rapidly converging method, based on a Fourier series expansion
similar to that first used by Lots and Karamcheti (Karamcheti 1966).
Using Equation 1 and Equation 2and the following equation for bound vorticity
The spanwise variation of shed vorticity is
Equation 3
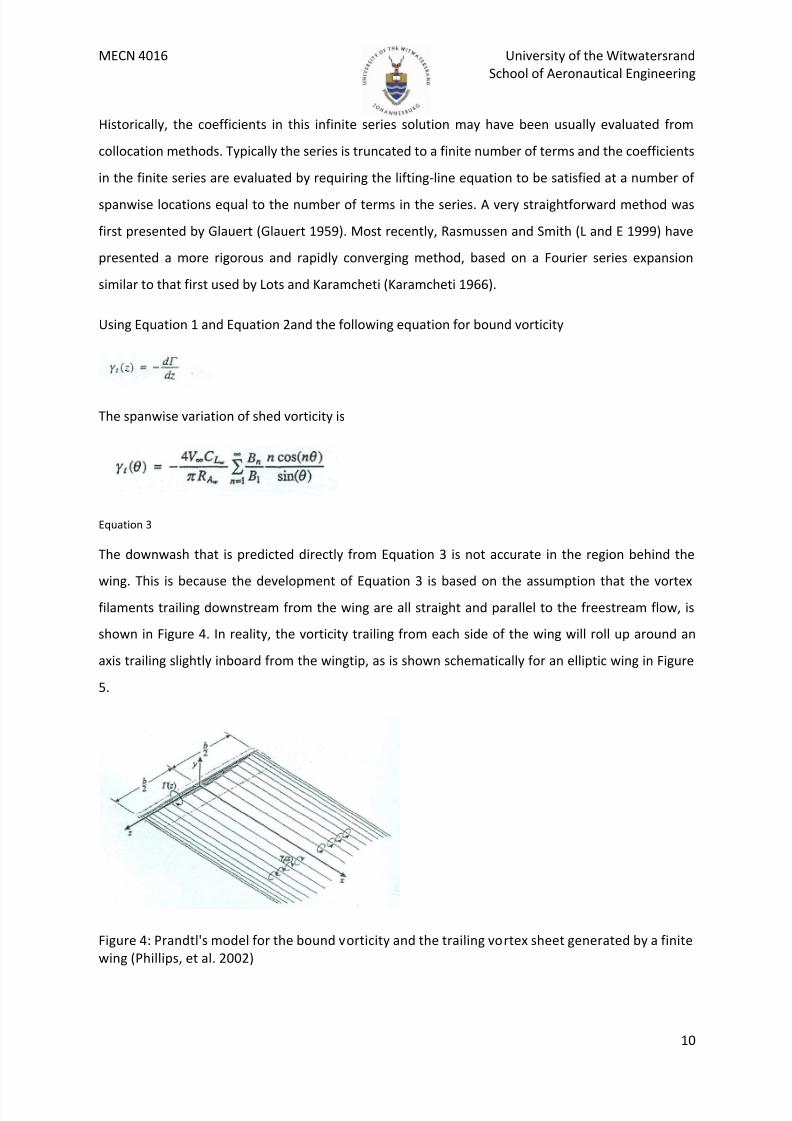
The downwash that is predicted directly from Equation 3 is not accurate in the region behind the
wing. This is because the development of Equation 3 is based on the assumption that the vortex
filaments trailing downstream from the wing are all straight and parallel to the freestream flow, is
shown in Figure 4. In reality, the vorticity trailing from each side of the wing will roll up around an
axis trailing slightly inboard from the wingtip, as is shown schematically for an elliptic wing in Figure
5.
Figure 4: Prandtl's model for the bound vorticity and the trailing vortex sheet generated by a finite
wing (Phillips, et al. 2002)
8/6/2019 MECN 4016 Aerodynamics
http://slidepdf.com/reader/full/mecn-4016-aerodynamics 12/40
MECN 4016 University of the Witwatersrand
School of Aeronautical Engineering
11
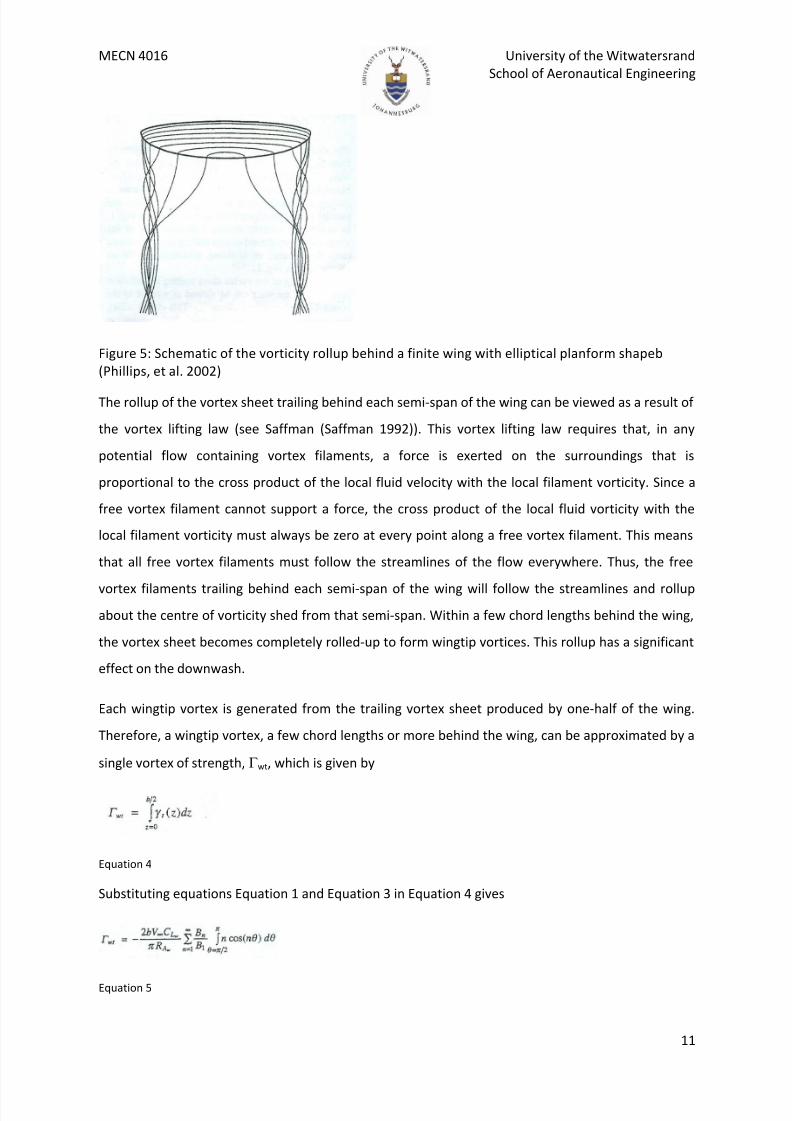
Figure 5: Schematic of the vorticity rollup behind a finite wing with elliptical planform shapeb
(Phillips, et al. 2002)
The rollup of the vortex sheet trailing behind each semi-span of the wing can be viewed as a result of
the vortex lifting law (see Saffman (Saffman 1992)). This vortex lifting law requires that, in any
potential flow containing vortex filaments, a force is exerted on the surroundings that is
proportional to the cross product of the local fluid velocity with the local filament vorticity. Since a
free vortex filament cannot support a force, the cross product of the local fluid vorticity with the
local filament vorticity must always be zero at every point along a free vortex filament. This means
that all free vortex filaments must follow the streamlines of the flow everywhere. Thus, the free
vortex filaments trailing behind each semi-span of the wing will follow the streamlines and rollup
about the centre of vorticity shed from that semi-span. Within a few chord lengths behind the wing,
the vortex sheet becomes completely rolled-up to form wingtip vortices. This rollup has a significant
effect on the downwash.
Each wingtip vortex is generated from the trailing vortex sheet produced by one-half of the wing.
Therefore, a wingtip vortex, a few chord lengths or more behind the wing, can be approximated by a
single vortex of strength, wt, which is given by
Equation 4
Substituting equations Equation 1 and Equation 3 in Equation 4 gives
Equation 5
8/6/2019 MECN 4016 Aerodynamics
http://slidepdf.com/reader/full/mecn-4016-aerodynamics 13/40
MECN 4016 University of the Witwatersrand
School of Aeronautical Engineering
12
Performing the indicated integration, we have
Equation 6
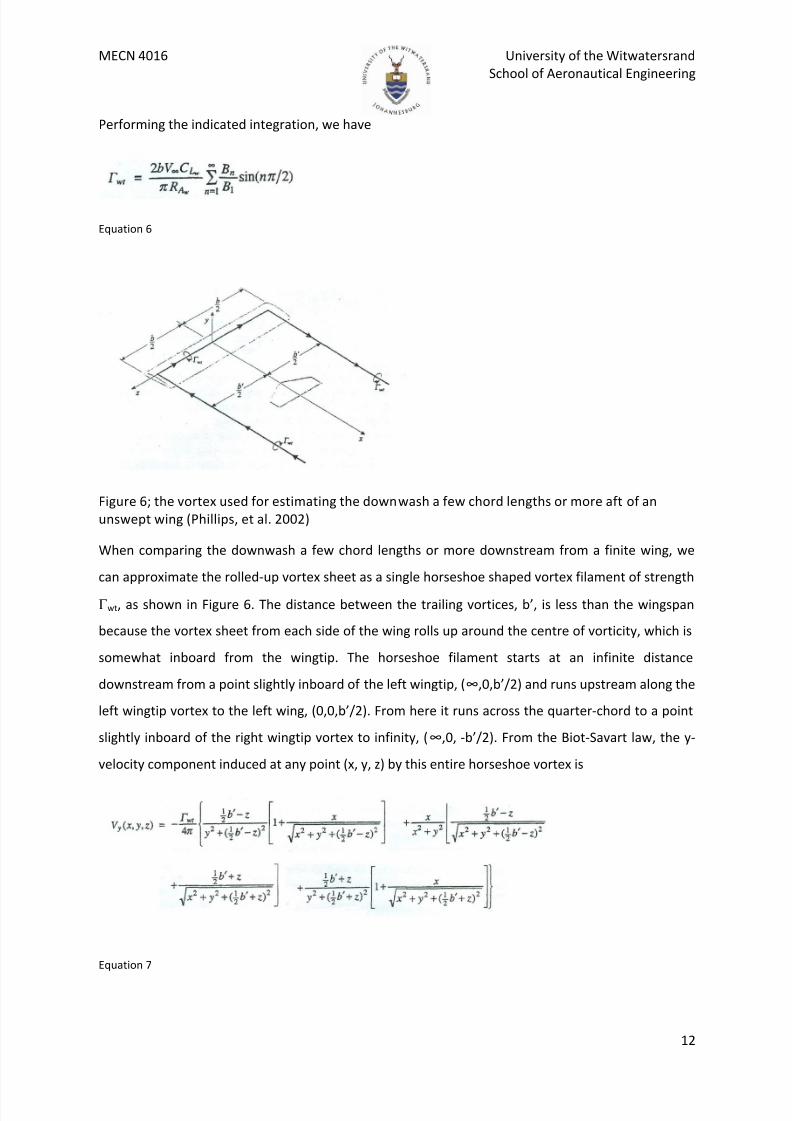
Figure 6; the vortex used for estimating the downwash a few chord lengths or more aft of an
unswept wing (Phillips, et al. 2002)
When comparing the downwash a few chord lengths or more downstream from a finite wing, we
can approximate the rolled-up vortex sheet as a single horseshoe shaped vortex filament of strength
wt, as shown in Figure 6. The distance between the trailing vortices, b’, is less than the wingspan
because the vortex sheet from each side of the wing rolls up around the centre of vorticity, which is
somewhat inboard from the wingtip. The horseshoe filament starts at an infinite distance
downstream from a point slightly inboard of the left wingtip, (∞,0,b’/2) and runs upstream along the
left wingtip vortex to the left wing, (0,0,b’/2). From here it runs across the quarter-chord to a point
slightly inboard of the right wingtip vortex to infinity, (∞,0, -b’/2). From the Biot-Savart law, the y-
velocity component induced at any point (x, y, z) by this entire horseshoe vortex is
Equation 7
8/6/2019 MECN 4016 Aerodynamics
http://slidepdf.com/reader/full/mecn-4016-aerodynamics 14/40
MECN 4016 University of the Witwatersrand
School of Aeronautical Engineering
13
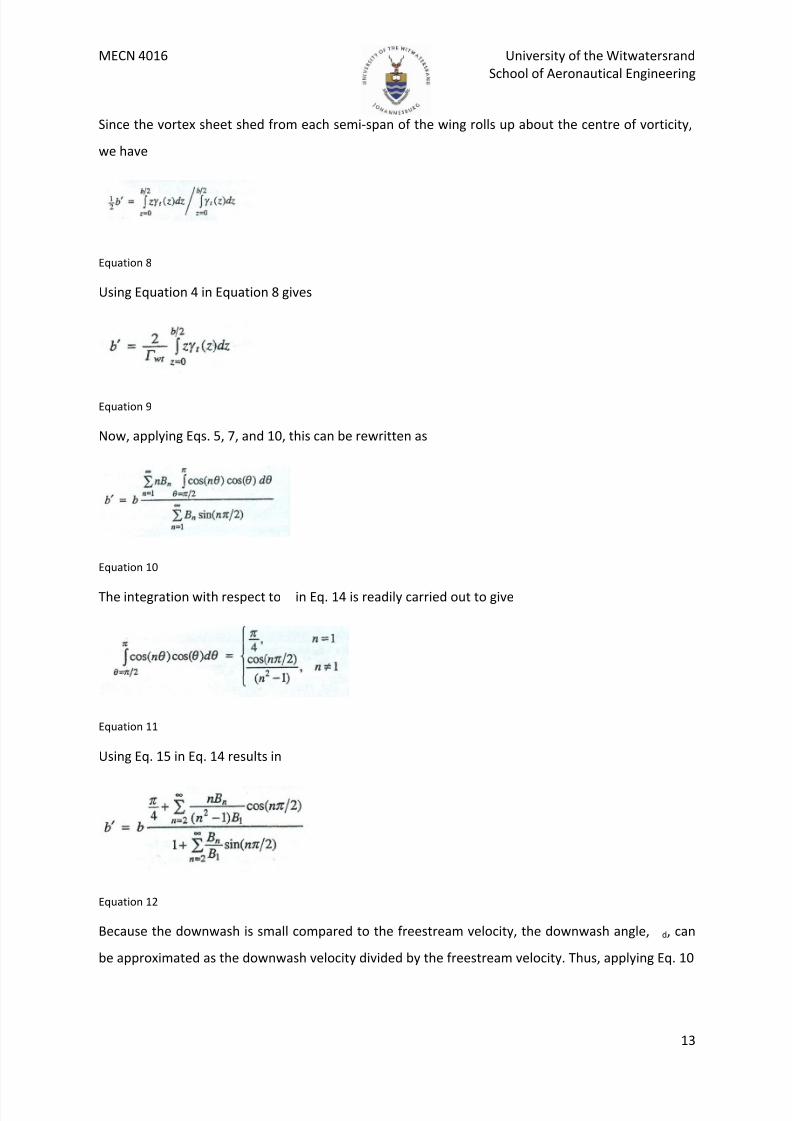
Since the vortex sheet shed from each semi-span of the wing rolls up about the centre of vorticity,
we have
Equation 8
Using Equation 4 in Equation 8 gives
Equation 9
Now, applying Eqs. 5, 7, and 10, this can be rewritten as
Equation 10
The integration with respect to in Eq. 14 is readily carried out to give
Equation 11
Using Eq. 15 in Eq. 14 results in
Equation 12
Because the downwash is small compared to the freestream velocity, the downwash angle, d, can
be approximated as the downwash velocity divided by the freestream velocity. Thus, applying Eq. 10
8/6/2019 MECN 4016 Aerodynamics
http://slidepdf.com/reader/full/mecn-4016-aerodynamics 15/40
MECN 4016 University of the Witwatersrand
School of Aeronautical Engineering
14
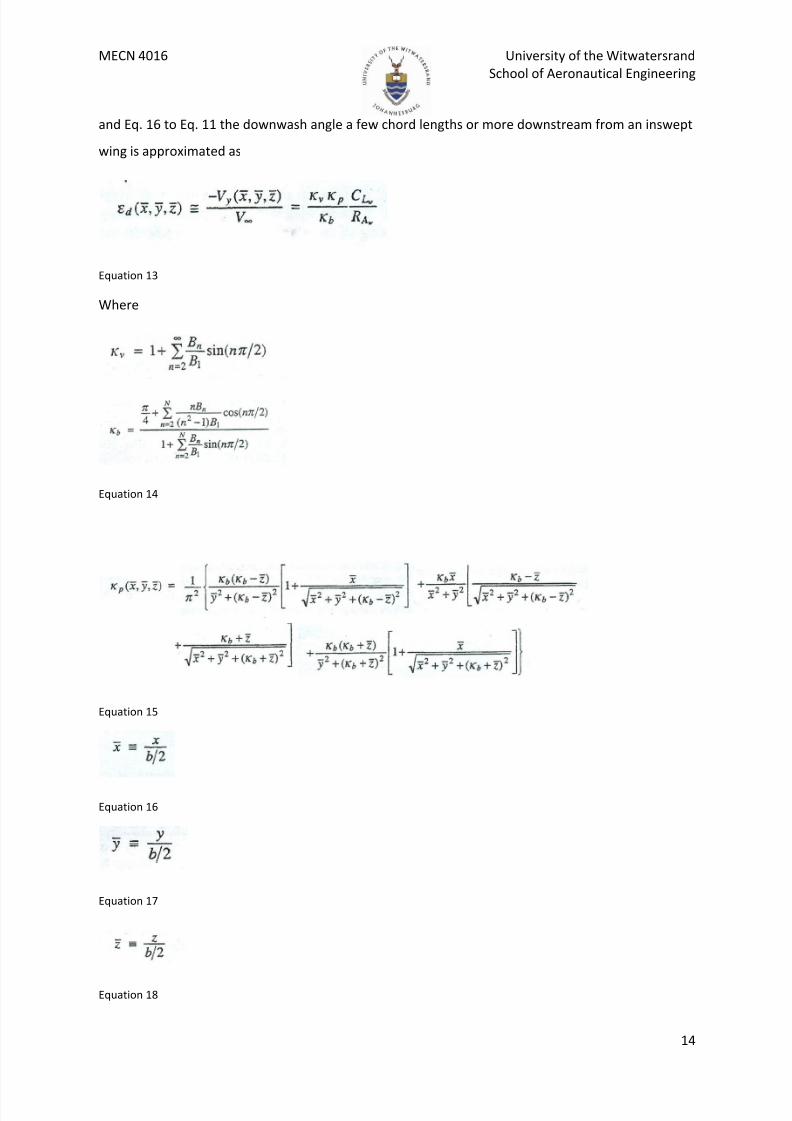
and Eq. 16 to Eq. 11 the downwash angle a few chord lengths or more downstream from an inswept
wing is approximated as
Equation 13
Where
Equation 14
Equation 15
Equation 16
Equation 17
Equation 18
8/6/2019 MECN 4016 Aerodynamics
http://slidepdf.com/reader/full/mecn-4016-aerodynamics 16/40
MECN 4016 University of the Witwatersrand
School of Aeronautical Engineering
15
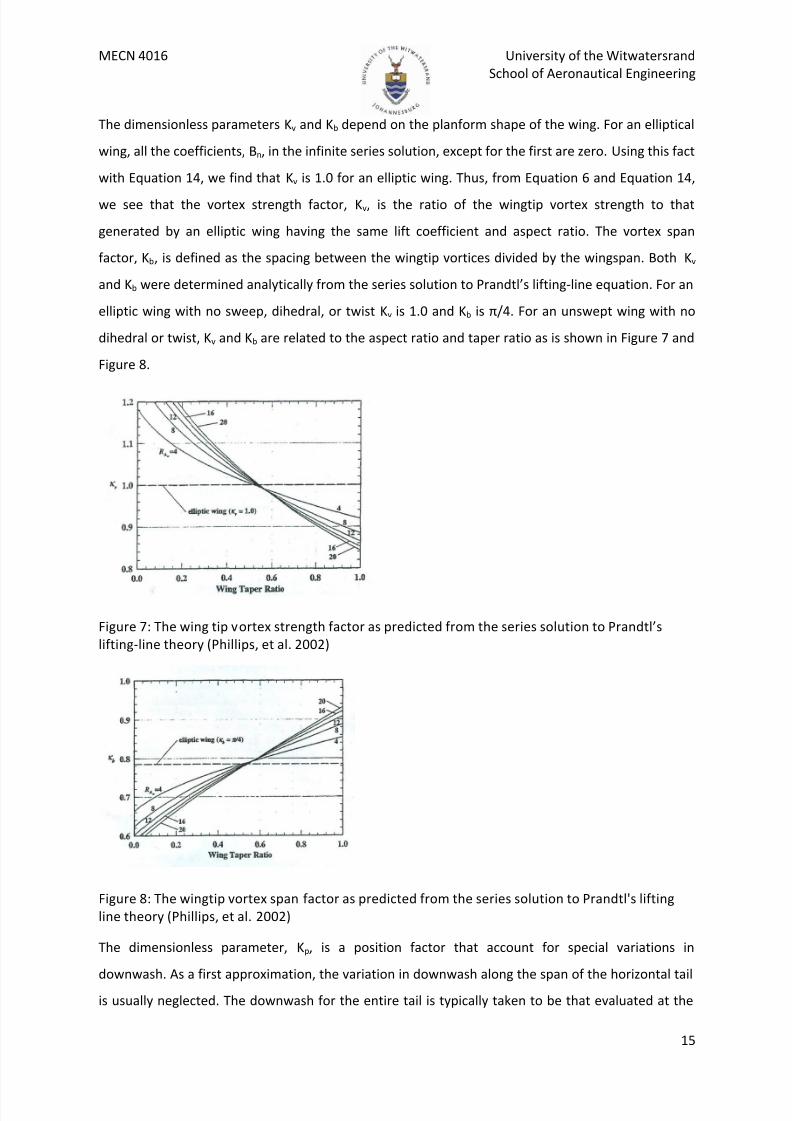
The dimensionless parameters Kv and Kb depend on the planform shape of the wing. For an elliptical
wing, all the coefficients, Bn, in the infinite series solution, except for the first are zero. Using this fact
with Equation 14, we find that Kv is 1.0 for an elliptic wing. Thus, from Equation 6 and Equation 14,
we see that the vortex strength factor, Kv, is the ratio of the wingtip vortex strength to that
generated by an elliptic wing having the same lift coefficient and aspect ratio. The vortex span
factor, Kb, is defined as the spacing between the wingtip vortices divided by the wingspan. Both Kv
and Kb were determined analytically from the series solution to Prandtl’s lifting-line equation. For an
elliptic wing with no sweep, dihedral, or twist Kv is 1.0 and Kb is π/4. For an unswept wing with no
dihedral or twist, Kv and Kb are related to the aspect ratio and taper ratio as is shown in Figure 7 and
Figure 8.
Figure 7: The wing tip vortex strength factor as predicted from the series solution to Prandtl’s
lifting-line theory (Phillips, et al. 2002)
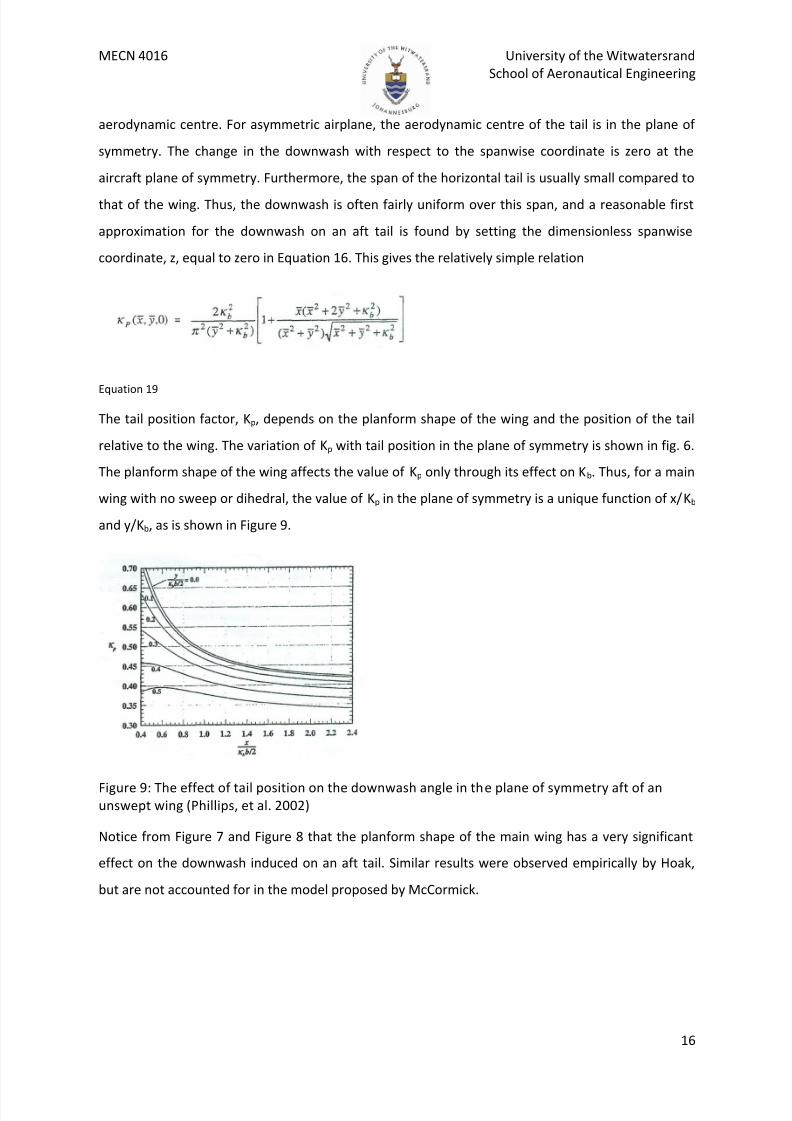
Figure 8: The wingtip vortex span factor as predicted from the series solution to Prandtl's lifting
line theory (Phillips, et al. 2002)
The dimensionless parameter, Kp, is a position factor that account for special variations in
downwash. As a first approximation, the variation in downwash along the span of the horizontal tail
is usually neglected. The downwash for the entire tail is typically taken to be that evaluated at the
8/6/2019 MECN 4016 Aerodynamics
http://slidepdf.com/reader/full/mecn-4016-aerodynamics 17/40
MECN 4016 University of the Witwatersrand
School of Aeronautical Engineering
16
aerodynamic centre. For asymmetric airplane, the aerodynamic centre of the tail is in the plane of
symmetry. The change in the downwash with respect to the spanwise coordinate is zero at the
aircraft plane of symmetry. Furthermore, the span of the horizontal tail is usually small compared to
that of the wing. Thus, the downwash is often fairly uniform over this span, and a reasonable first
approximation for the downwash on an aft tail is found by setting the dimensionless spanwise
coordinate, z, equal to zero in Equation 16. This gives the relatively simple relation
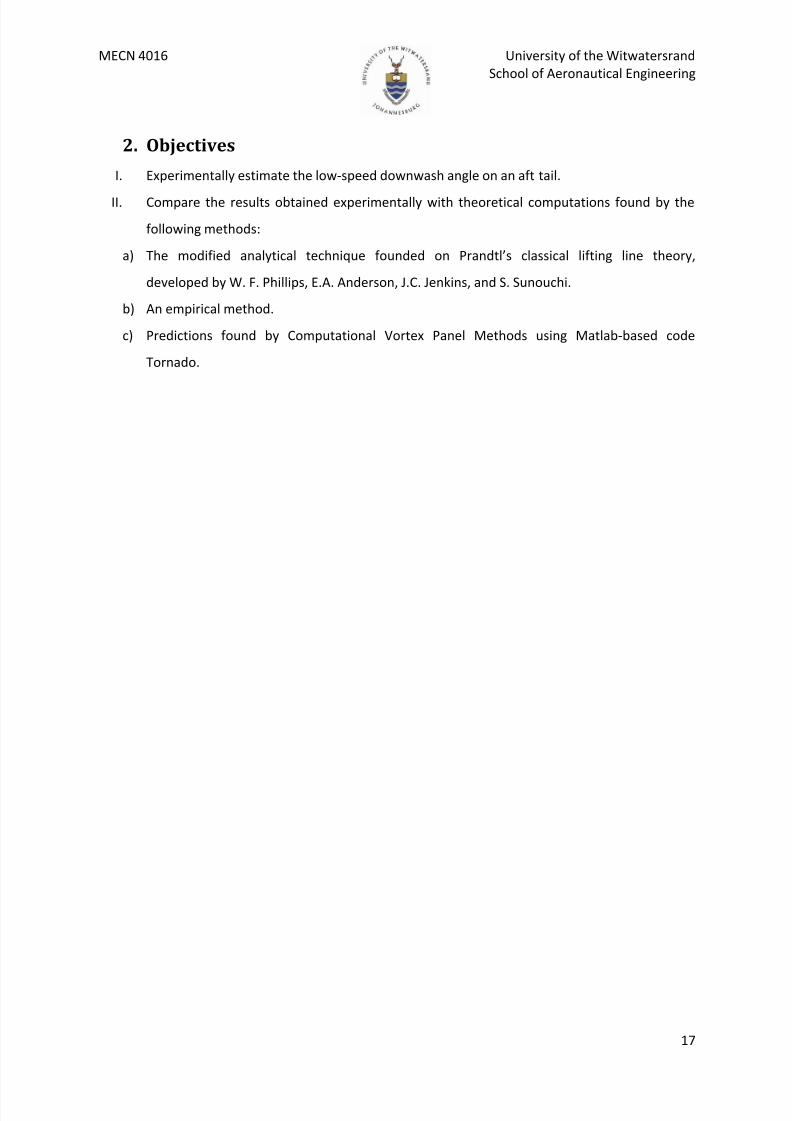
Equation 19
The tail position factor, Kp, depends on the planform shape of the wing and the position of the tail
relative to the wing. The variation of Kp with tail position in the plane of symmetry is shown in fig. 6.
The planform shape of the wing affects the value of Kp only through its effect on Kb. Thus, for a main
wing with no sweep or dihedral, the value of Kp in the plane of symmetry is a unique function of x/Kb
and y/Kb, as is shown in Figure 9.
Figure 9: The effect of tail position on the downwash angle in the plane of symmetry aft of anunswept wing (Phillips, et al. 2002)
Notice from Figure 7 and Figure 8 that the planform shape of the main wing has a very significant
effect on the downwash induced on an aft tail. Similar results were observed empirically by Hoak,
but are not accounted for in the model proposed by McCormick.
8/6/2019 MECN 4016 Aerodynamics
http://slidepdf.com/reader/full/mecn-4016-aerodynamics 18/40
MECN 4016 University of the Witwatersrand
School of Aeronautical Engineering
17
2. Objectives
I. Experimentally estimate the low-speed downwash angle on an aft tail.
II. Compare the results obtained experimentally with theoretical computations found by the
following methods:
a) The modified analytical technique founded on Prandtl’s classical lifting line theory,
developed by W. F. Phillips, E.A. Anderson, J.C. Jenkins, and S. Sunouchi.
b) An empirical method.
c) Predictions found by Computational Vortex Panel Methods using Matlab-based code
Tornado.
8/6/2019 MECN 4016 Aerodynamics
http://slidepdf.com/reader/full/mecn-4016-aerodynamics 19/40
MECN 4016 University of the Witwatersrand
School of Aeronautical Engineering
18
3. Analysis
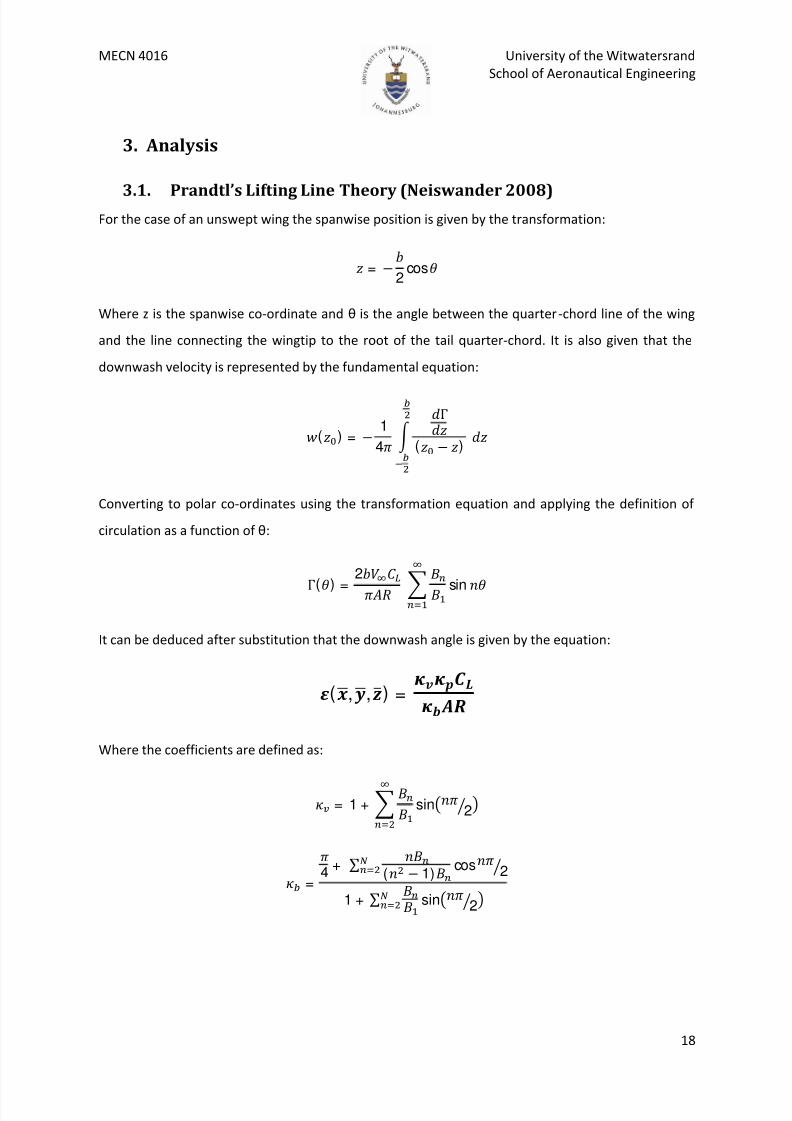
3.1.
Prandtl’s Lifting Line Theory (Neiswander 2008)For the case of an unswept wing the spanwise position is given by the transformation:
= −2
cos
Where z is the spanwise co-ordinate and θ is the angle between the quarter-chord line of the wing
and the line connecting the wingtip to the root of the tail quarter-chord. It is also given that the
downwash velocity is represented by the fundamental equation:
() = − 1
4 Γ( − )
Converting to polar co-ordinates using the transformation equation and applying the definition of
circulation as a function of θ:
Γ() =
2
sin
It can be deduced after substitution that the downwash angle is given by the equation:
(,,) =
Where the coefficients are defined as:
= 1 + sin 2
=
4
+ ∑ ( − 1) cos 2
1 + ∑ sin 2
8/6/2019 MECN 4016 Aerodynamics
http://slidepdf.com/reader/full/mecn-4016-aerodynamics 20/40
MECN 4016 University of the Witwatersrand
School of Aeronautical Engineering
19
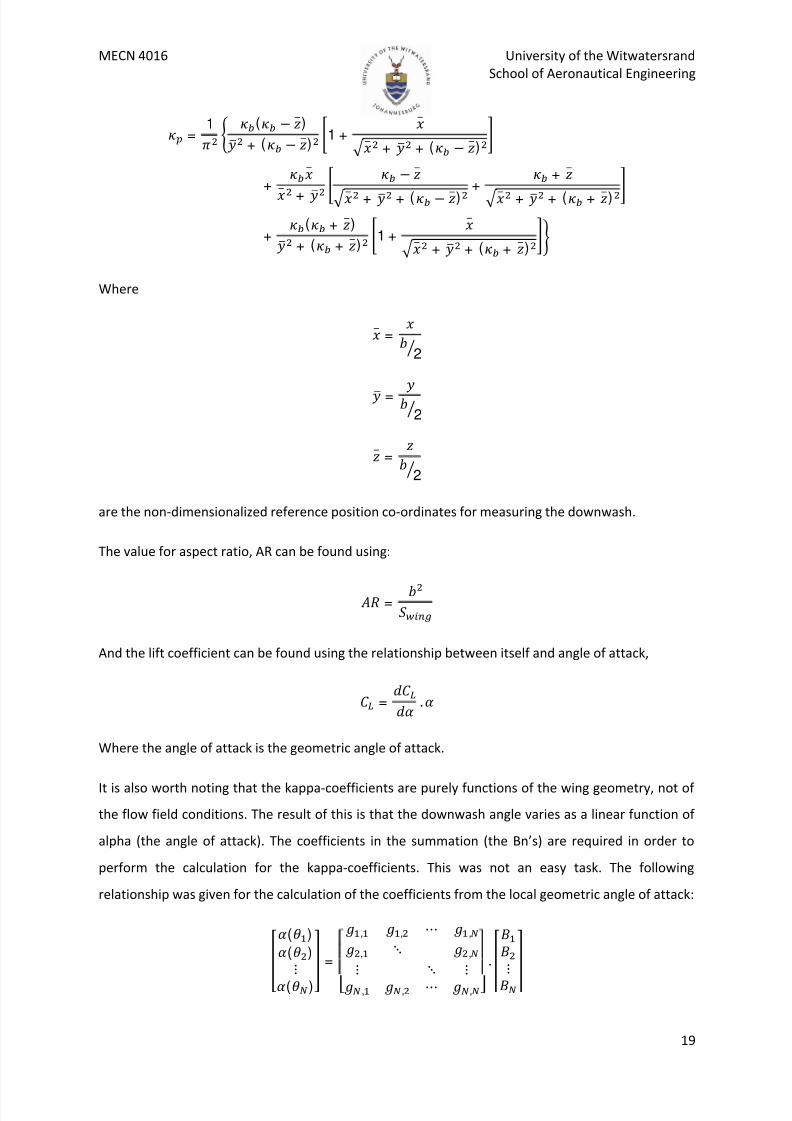
=1 ( − ) + ( − ) 1 +
+ + ( − )+
+ − + + ( − )+
+
+ + ( + )+
( + ) + ( + ) 1 + + + ( + )
Where
=2
= 2
=2
are the non-dimensionalized reference position co-ordinates for measuring the downwash.
The value for aspect ratio, AR can be found using:
=
And the lift coefficient can be found using the relationship between itself and angle of attack,
= .
Where the angle of attack is the geometric angle of attack.
It is also worth noting that the kappa-coefficients are purely functions of the wing geometry, not of
the flow field conditions. The result of this is that the downwash angle varies as a linear function of
alpha (the angle of attack). The coefficients in the summation (the Bn’s) are required in order to
perform the calculation for the kappa-coefficients. This was not an easy task. The following
relationship was given for the calculation of the coefficients from the local geometric angle of attack:
()
(
)
⋮()=
⎣
, , ⋯ ,, ⋱ ,
⋮ ⋱ ⋮, , ⋯ ,⎦.
⋮
8/6/2019 MECN 4016 Aerodynamics
http://slidepdf.com/reader/full/mecn-4016-aerodynamics 21/40
MECN 4016 University of the Witwatersrand
School of Aeronautical Engineering
20
The central g-matrix was determined and expanded in Microsoft Excel. However for the calculation
of the Bn’s that requires the inverse of matrix g multiplied by the angles of attack, i.e.
[] = []. [()]
This operation was input into Matlab from Excel and then plotted back into Excel to solve for the
kappa-coefficients. The results of this can be found in the sections that follow.
3.2. DATCOM
DATCOM is an empirical method that has the fundamental purpose is to estimate aerodynamic
stability and control characteristics in preliminary design applications. This computational method was use by first defining flight condition( Mach number, Altitude, and
angle of attacks to be analyzed), followed by synthesis which sets up the CG location as well as the
position of the wing and tail surfaces, also the wing planform is defined by using variables related to
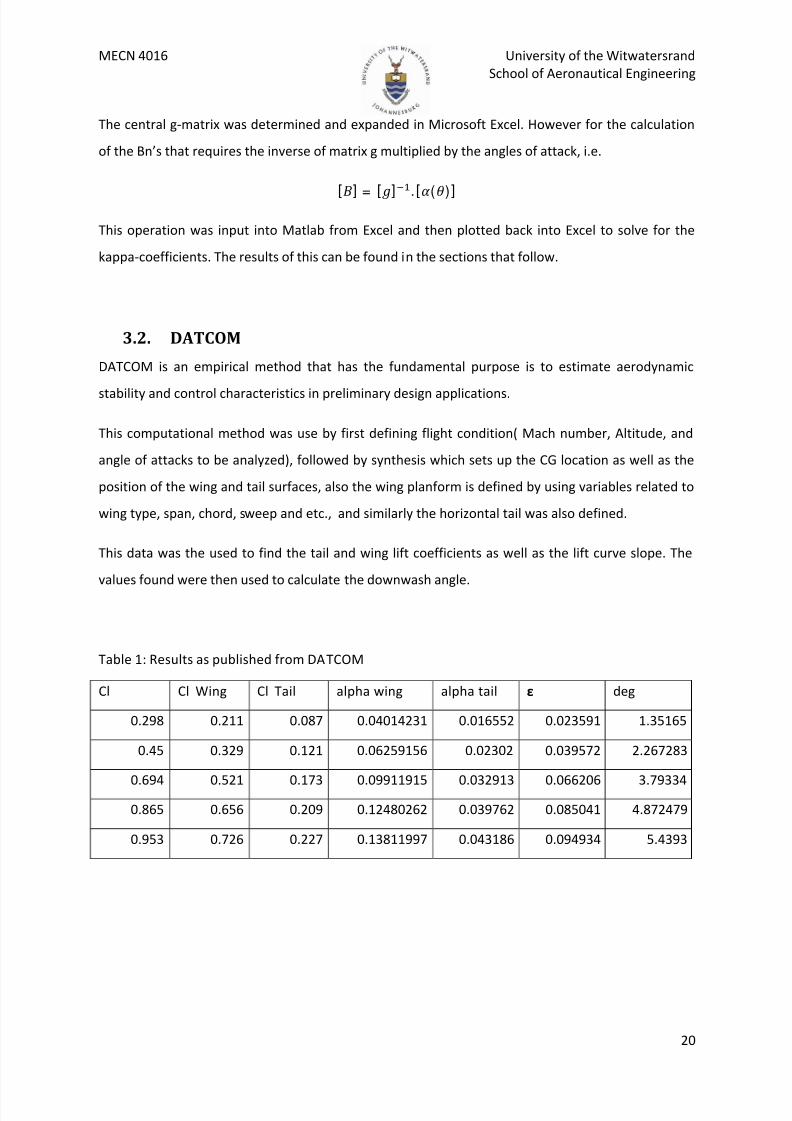
wing type, span, chord, sweep and etc., and similarly the horizontal tail was also defined. This data was the used to find the tail and wing lift coefficients as well as the lift curve slope. The
values found were then used to calculate the downwash angle.
Table 1: Results as published from DATCOM
Cl Cl Wing Cl Tail alpha wing alpha tail ε deg
0.298 0.211 0.087 0.04014231 0.016552 0.023591 1.35165
0.45 0.329 0.121 0.06259156 0.02302 0.039572 2.267283
0.694 0.521 0.173 0.09911915 0.032913 0.066206 3.79334
0.865 0.656 0.209 0.12480262 0.039762 0.085041 4.872479
0.953 0.726 0.227 0.13811997 0.043186 0.094934 5.4393
8/6/2019 MECN 4016 Aerodynamics
http://slidepdf.com/reader/full/mecn-4016-aerodynamics 22/40
MECN 4016 University of the Witwatersrand
School of Aeronautical Engineering
21
4. Experimentation
4.1.
CFD (Tornado)Tornado is a Vortex Panel Method that was run in Matlab in order to theoretically calculate the
effects of the angle of attack on downwash. First the parameters for analysis had to be input into the
program. This began by defining the panels over the surface of the airfoil that would be the basis for
calculation. The wing was analysed as a combination of 20 identical partitions from tip to tip. These
partitions were each one-twentieth of the span in width and had 10 identical panels segmenting the
upper surface and 10 identical panels segmenting the lower surface. The rule-of-thumb with panel
methods is the more panels that are used; the more the method replicates the actual surface. This
however comes at computational cost in the form of time-expenditure. It was defined also that the
partitions would each have zero dihedral, zero twist, zero flap deflection and zero change in airfoil
profile across the span. This was in accordance with the experimental test piece used in the wind
tunnel test. The span, chord length and profile were defined as those used in the wind tunnel and
the details can be found in table 2 in the following section. The origin was defined as the leading
edge at the wing root.
In addition to the geometry being defined, the flow conditions also had to be input. This was mainly
to define the speed of the airstream and what angle of attack the wing was at. Due to the amount of
time taken to perform a single simulation, the angle of attack was fixed at a reasonable 4°. This was
a fairly good point to choose to compare to the other methods because it is in a range where the lift
curve slope of the wing is roughly linear.
After the geometry and flow field conditions were input, the panel lattice was generated. This was
when the surfaces of the wing were discretized into the various panels that would be used for the
analysis. Following the lattice generation, the various simulations were performed. The flight
condition was classified as a steady, level flight path and as such no values were input for sideslip
angle, pitch angle or any of the angular rates. For this reason only the alpha sheet, force, lift and
coefficient distribution were simulated across the span. The results were obtained in the form of
graphs an tables as output by the Tornado code and can be found in the results section that follows.
8/6/2019 MECN 4016 Aerodynamics
http://slidepdf.com/reader/full/mecn-4016-aerodynamics 23/40
MECN 4016 University of the Witwatersrand
School of Aeronautical Engineering
22
4.2. Wind-tunnel Test
4.2.1. Apparatus
Closed-circuit Wind Tunnel
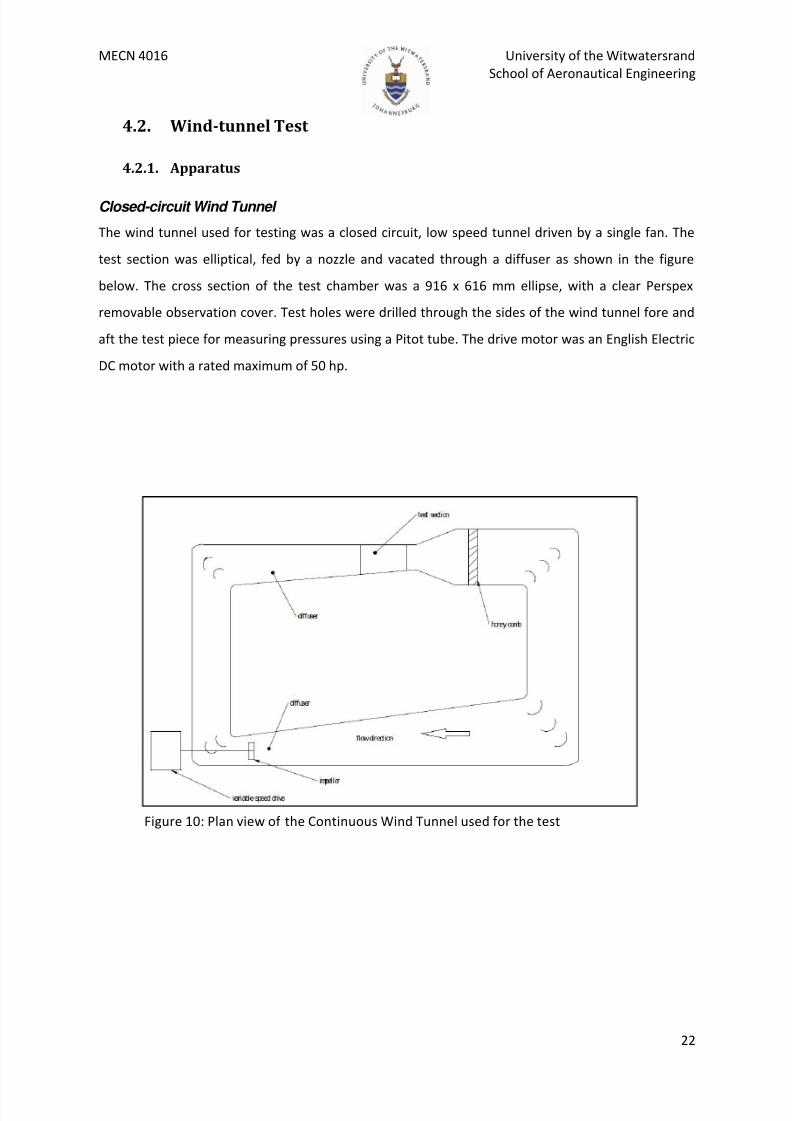
The wind tunnel used for testing was a closed circuit, low speed tunnel driven by a single fan. The
test section was elliptical, fed by a nozzle and vacated through a diffuser as shown in the figure
below. The cross section of the test chamber was a 916 x 616 mm ellipse, with a clear Perspex
removable observation cover. Test holes were drilled through the sides of the wind tunnel fore and
aft the test piece for measuring pressures using a Pitot tube. The drive motor was an English Electric
DC motor with a rated maximum of 50 hp.
Figure 10: Plan view of the Continuous Wind Tunnel used for the test
8/6/2019 MECN 4016 Aerodynamics
http://slidepdf.com/reader/full/mecn-4016-aerodynamics 24/40
MECN 4016 University of the Witwatersrand
School of Aeronautical Engineering
23
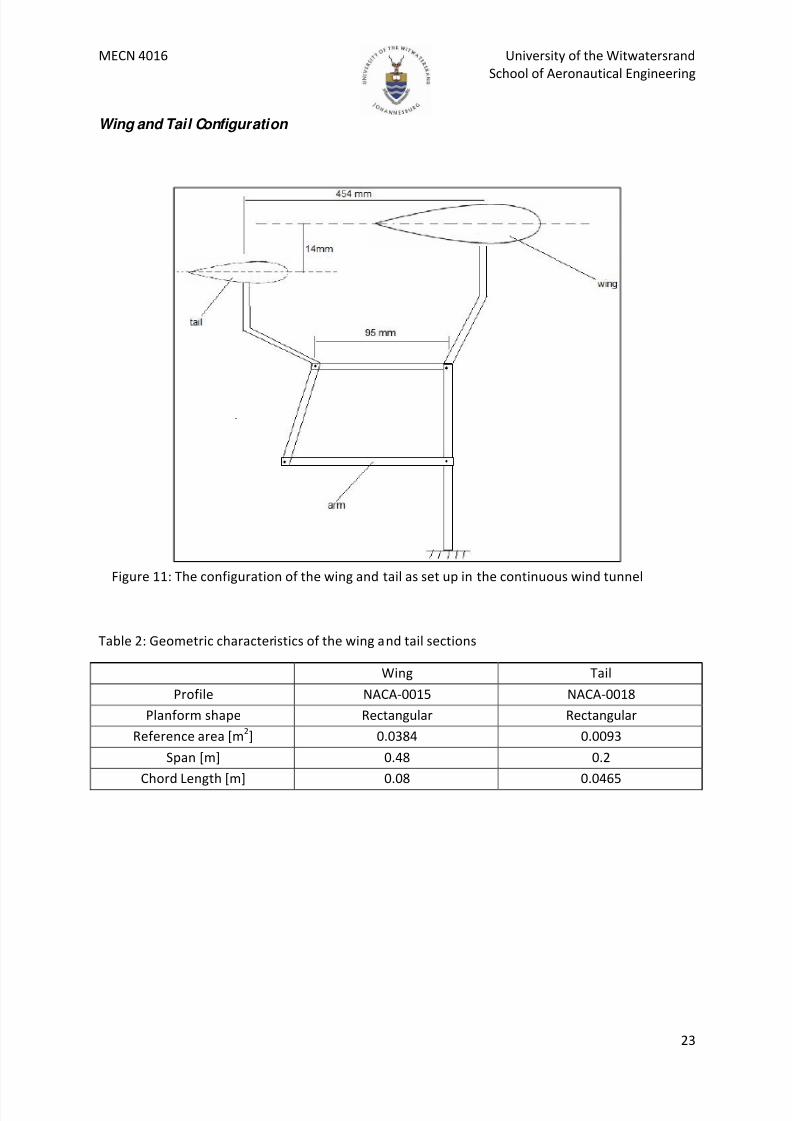
Wing and Tail Configuration
Table 2: Geometric characteristics of the wing and tail sections
Wing Tail
Profile NACA-0015 NACA-0018
Planform shape Rectangular Rectangular
Reference area [m2] 0.0384 0.0093
Span [m] 0.48 0.2
Chord Length [m] 0.08 0.0465
Figure 11: The configuration of the wing and tail as set up in the continuous wind tunnel
8/6/2019 MECN 4016 Aerodynamics
http://slidepdf.com/reader/full/mecn-4016-aerodynamics 25/40
MECN 4016 University of the Witwatersrand
School of Aeronautical Engineering
24
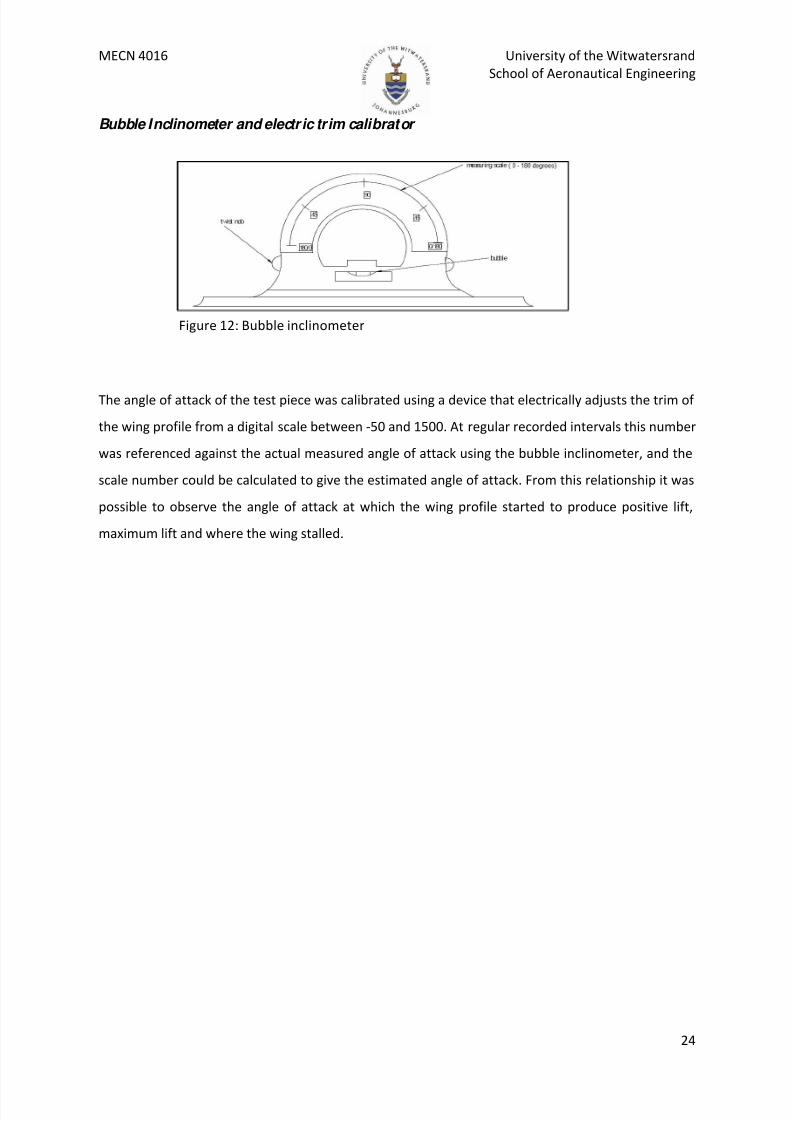
Bubble Inclinometer and electr ic trim calibrator
The angle of attack of the test piece was calibrated using a device that electrically adjusts the trim of
the wing profile from a digital scale between -50 and 1500. At regular recorded intervals this number
was referenced against the actual measured angle of attack using the bubble inclinometer, and the
scale number could be calculated to give the estimated angle of attack. From this relationship it was
possible to observe the angle of attack at which the wing profile started to produce positive lift,
maximum lift and where the wing stalled.
Figure 12: Bubble inclinometer
8/6/2019 MECN 4016 Aerodynamics
http://slidepdf.com/reader/full/mecn-4016-aerodynamics 26/40
MECN 4016 University of the Witwatersrand
School of Aeronautical Engineering
25
4.2.2. Procedure
Precautions before testing
1.
Ensure there are not obstacles within the wind tunnel.2. Ensure that all parts of the wind tunnel are secure.
3. Ensure that the test section door is properly closed before taking aerodynamic
measurements.
4. When varying the angle of attack, only move in one direction (do not increase then decrease
the angle of attack before the end of the test run).
5. Allow the air flow to settle before taking measurements.
Testing procedure
In order to determine the value of the downwash angle, that is, the difference between the
aerodynamic, or effective angle of attack, and the geometrical, actual angle between the tail centre
line and the direction of flight the following procedure was used:
1. The angle of attack was measured on the bubble inclinometer and the arm was set to this
value.
2. The door to the tunnel was then closed and bolted.
3. The tunnel was then started and the airspeed for the oncoming air flow was set.
4. Tail and wing lift was then measured separately by means of a strain gauges in terms of
strain.
5. This procedure was repeated for various angles of attack.
4.2.3. Observations
For low angles of attack there was excessive vibration of the airfoils, causing vast
fluctuations in the strain readings.
Past a certain angle of attack the wing became fully effective and the vibration slowed down
and taking readings was much easier.
The apparatus fairing could have played a role in affecting the airflow towards the tail, or
otherwise changing the pressure variation below the wing.
8/6/2019 MECN 4016 Aerodynamics
http://slidepdf.com/reader/full/mecn-4016-aerodynamics 27/40
MECN 4016 University of the Witwatersrand
School of Aeronautical Engineering
26
5. Results
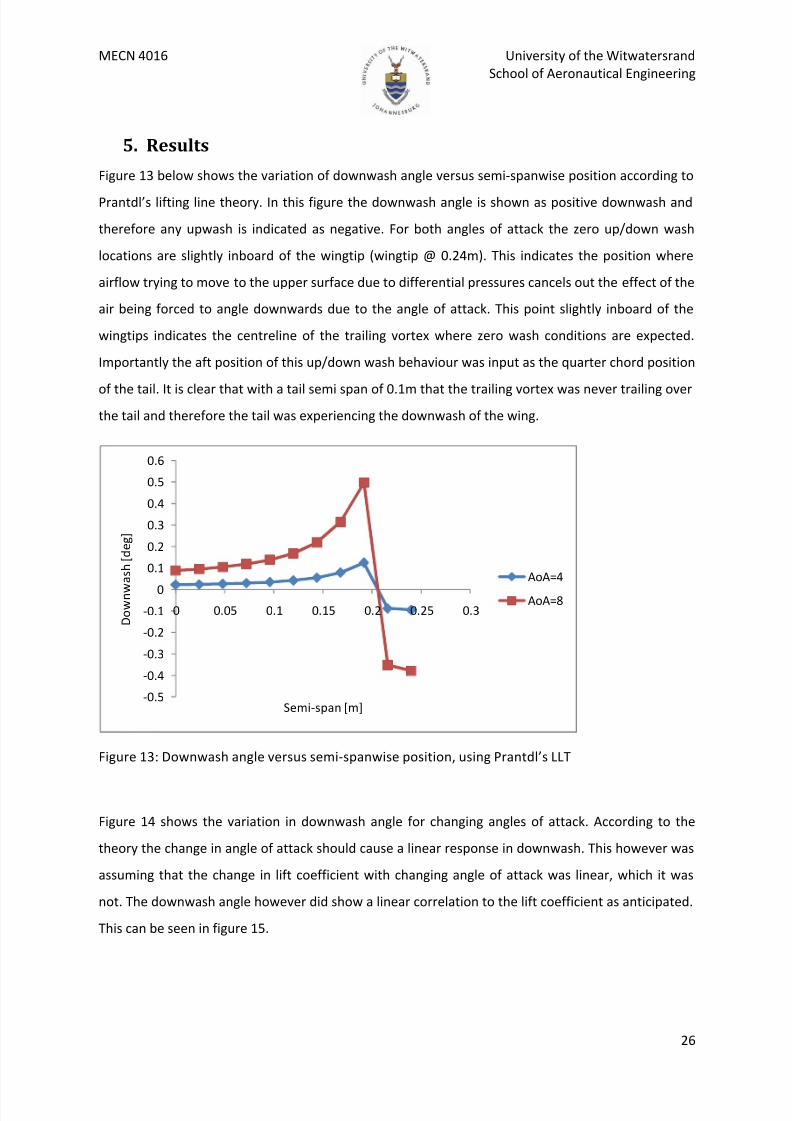
Figure 13 below shows the variation of downwash angle versus semi-spanwise position according to
Prantdl’s lifting line theory. In this figure the downwash angle is shown as positive downwash and
therefore any upwash is indicated as negative. For both angles of attack the zero up/down wash
locations are slightly inboard of the wingtip (wingtip @ 0.24m). This indicates the position where
airflow trying to move to the upper surface due to differential pressures cancels out the effect of the
air being forced to angle downwards due to the angle of attack. This point slightly inboard of the
wingtips indicates the centreline of the trailing vortex where zero wash conditions are expected.
Importantly the aft position of this up/down wash behaviour was input as the quarter chord position
of the tail. It is clear that with a tail semi span of 0.1m that the trailing vortex was never trailing over
the tail and therefore the tail was experiencing the downwash of the wing.
Figure 13: Downwash angle versus semi-spanwise position, using Prantdl’s LLT
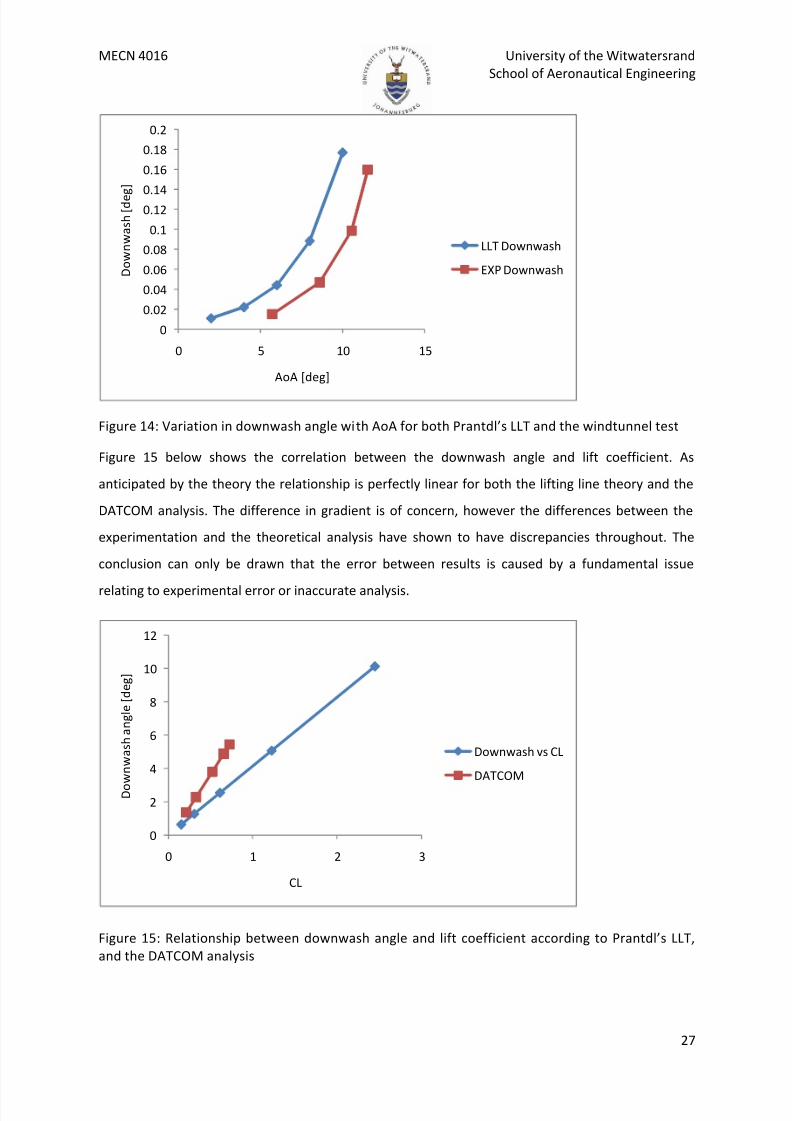
Figure 14 shows the variation in downwash angle for changing angles of attack. According to the
theory the change in angle of attack should cause a linear response in downwash. This however was
assuming that the change in lift coefficient with changing angle of attack was linear, which it was
not. The downwash angle however did show a linear correlation to the lift coefficient as anticipated.
This can be seen in figure 15.
-0.5
-0.4
-0.3
-0.2
-0.1
0
0.1
0.2
0.3
0.4
0.5
0.6
0 0.05 0.1 0.15 0.2 0.25 0.3 D o w n w
a s h [ d e g ]
Semi-span [m]
AoA=4
AoA=8
8/6/2019 MECN 4016 Aerodynamics
http://slidepdf.com/reader/full/mecn-4016-aerodynamics 28/40
MECN 4016 University of the Witwatersrand
School of Aeronautical Engineering
27
Figure 14: Variation in downwash angle with AoA for both Prantdl’s LLT and the windtunnel test
Figure 15 below shows the correlation between the downwash angle and lift coefficient. As
anticipated by the theory the relationship is perfectly linear for both the lifting line theory and the
DATCOM analysis. The difference in gradient is of concern, however the differences between the
experimentation and the theoretical analysis have shown to have discrepancies throughout. The
conclusion can only be drawn that the error between results is caused by a fundamental issue
relating to experimental error or inaccurate analysis.
Figure 15: Relationship between downwash angle and lift coefficient according to Prantdl’s LLT,
and the DATCOM analysis
0
0.02
0.04
0.06
0.08
0.1
0.120.14
0.16
0.18
0.2
0 5 10 15
D o w n w a s h [ d e g ]
AoA [deg]
LLT Downwash
EXP Downwash
0
2
4
6
8
10
12
0 1 2 3
D o
w n w a s h a n g l e [ d e g ]
CL
Downwash vs CL
DATCOM
8/6/2019 MECN 4016 Aerodynamics
http://slidepdf.com/reader/full/mecn-4016-aerodynamics 29/40
MECN 4016 University of the Witwatersrand
School of Aeronautical Engineering
28
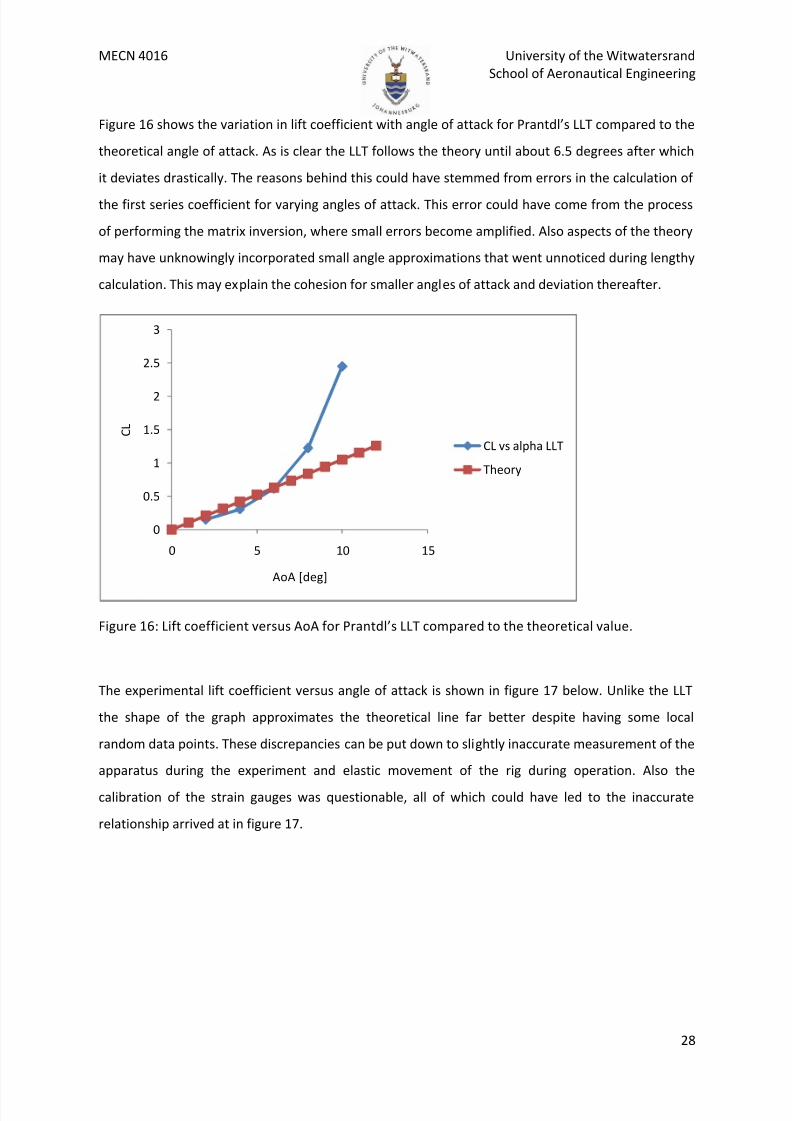
Figure 16 shows the variation in lift coefficient with angle of attack for Prantdl’s LLT compared to the
theoretical angle of attack. As is clear the LLT follows the theory until about 6.5 degrees after which
it deviates drastically. The reasons behind this could have stemmed from errors in the calculation of
the first series coefficient for varying angles of attack. This error could have come from the process
of performing the matrix inversion, where small errors become amplified. Also aspects of the theory
may have unknowingly incorporated small angle approximations that went unnoticed during lengthy
calculation. This may explain the cohesion for smaller angles of attack and deviation thereafter.
Figure 16: Lift coefficient versus AoA for Prantdl’s LLT compared to the theoretical value.
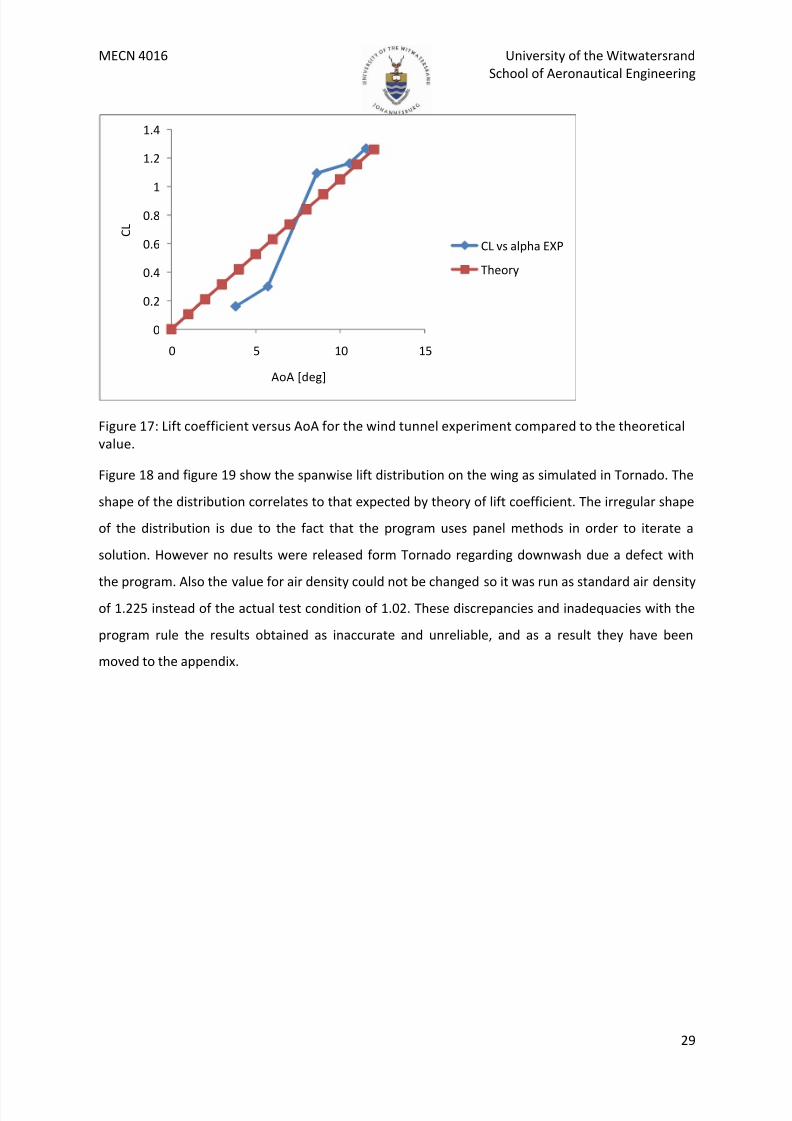
The experimental lift coefficient versus angle of attack is shown in figure 17 below. Unlike the LLT
the shape of the graph approximates the theoretical line far better despite having some local
random data points. These discrepancies can be put down to slightly inaccurate measurement of the
apparatus during the experiment and elastic movement of the rig during operation. Also the
calibration of the strain gauges was questionable, all of which could have led to the inaccurate
relationship arrived at in figure 17.
0
0.5
1
1.5
2
2.5
3
0 5 10 15
C L
AoA [deg]
CL vs alpha LLT
Theory
8/6/2019 MECN 4016 Aerodynamics
http://slidepdf.com/reader/full/mecn-4016-aerodynamics 30/40
MECN 4016 University of the Witwatersrand
School of Aeronautical Engineering
29
Figure 17: Lift coefficient versus AoA for the wind tunnel experiment compared to the theoretical
value.
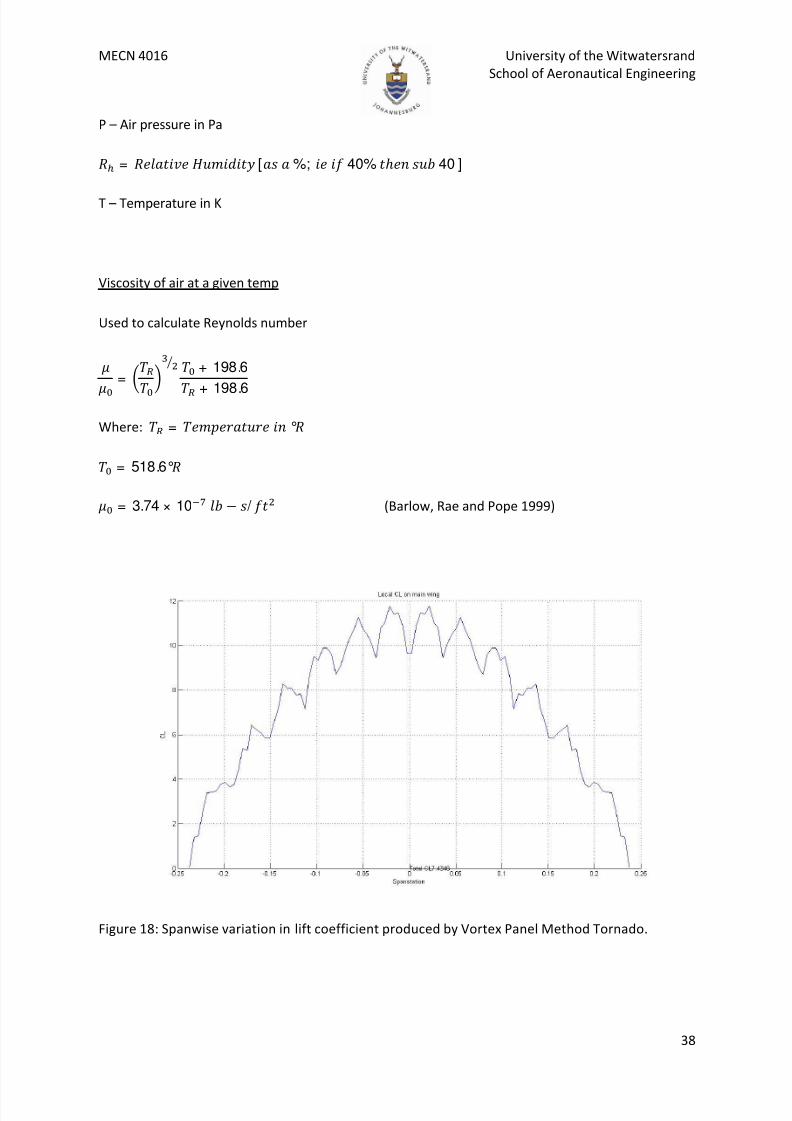
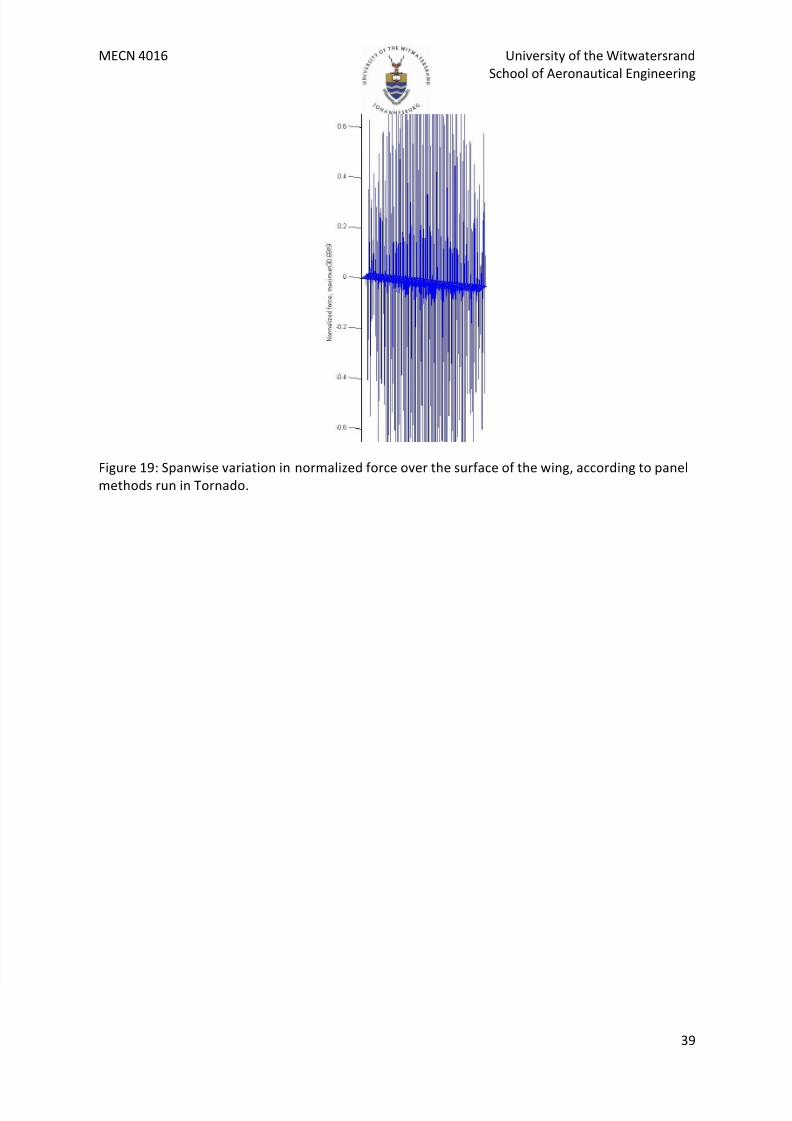
Figure 18 and figure 19 show the spanwise lift distribution on the wing as simulated in Tornado. The
shape of the distribution correlates to that expected by theory of lift coefficient. The irregular shape
of the distribution is due to the fact that the program uses panel methods in order to iterate a
solution. However no results were released form Tornado regarding downwash due a defect with
the program. Also the value for air density could not be changed so it was run as standard air density
of 1.225 instead of the actual test condition of 1.02. These discrepancies and inadequacies with the
program rule the results obtained as inaccurate and unreliable, and as a result they have been
moved to the appendix.
0
0.2
0.4
0.6
0.8
1
1.2
1.4
0 5 10 15
C L
AoA [deg]
CL vs alpha EXP
Theory
8/6/2019 MECN 4016 Aerodynamics
http://slidepdf.com/reader/full/mecn-4016-aerodynamics 31/40
MECN 4016 University of the Witwatersrand
School of Aeronautical Engineering
30
6. Discussion
6.1.
Thando TshabalalaThe downwash was theoretically expected to be directly proportional to the lift of the airfoil, by
referring to figure 15 one can see that this has been confirmed by theoretical computational
methods used in DATCOM as well as Prandtl’s Lifting line theory as both graphs illustrate linear
behaviour between the downwash and lift coefficient.
The relation between downwash and angle of attack was also proposed to be linear both
experimentally and theoretically by means of figure 3. If one compare this to figure 14 one notes
that this is not what was found by the model used and the results obtained experimentally.
The variation in lift coefficient with angle of attack for Prantdl’s LLT compared to the theoretical
angle of attack may be viewed in Figure 16 .Prandtl’s model follows the theory until about 6.5
degrees after which the values for Prandtl become considerably higher . The reasons behind this
could have stemmed from errors in the calculation of the first series coefficient for varying angles of
attack in addition to the process of performing the matrix inversion, in which small errors become
amplified and rounding off errors also become more prominent. Also aspects of the theory may have
unknowingly incorporated small angle approximations that went unnoticed during lengthy
calculation. This may explain the cohesion for smaller angles of attack and deviation thereafter. It
also should be noted that stall is not taken into account at higher angles of attack (this occurs due to
separation) which is what would happen in reality.
The experimental lift coefficient versus angle of attack is shown in figure 17 below. Unlike the LLT
the shape of the graph approximates the theoretical line far better despite having some local
random data points. These inaccuracies can be attributed to slightly inaccurate measurement of the
apparatus during the experiment and elastic movement of the rig during operation. This also could
be due to the fact that not all tunnel interference effects could be eliminated as no correction was
introduced for the model being in a closed wind tunnel which results in the reduction of the wake
behind the model. This was not taken into account during theoretical analysis.
The calibration of the strain gauges was questionable, which could have led to the inaccurate
relationship arrived at in figure 17. This could also be due to the fact that the experiment was
performed a higher angles of attack in the region where aerodynamic theory may break down due to
separation. Another reason for these discrepancies may be due to the fact that effects of turbulence
8/6/2019 MECN 4016 Aerodynamics
http://slidepdf.com/reader/full/mecn-4016-aerodynamics 32/40
MECN 4016 University of the Witwatersrand
School of Aeronautical Engineering
31
were also not taken into account (there is always sound level of turbulence in real flows) which
causes more random behaviour in air flows. The approximate manner in which the lifting –line
theory deals with bound voracity may also causes data variations.
8/6/2019 MECN 4016 Aerodynamics
http://slidepdf.com/reader/full/mecn-4016-aerodynamics 33/40
MECN 4016 University of the Witwatersrand
School of Aeronautical Engineering
32
6.2. Jameson Bentley
The results obtained from the experimentation neither completely validated or completely
invalidated the results obtained from Prantdl’s Lifting Line Theory. However based upon the
research conducted and the generally understood theory, the lifting line method seemed to show
strong correlation to real-world practical examples regarding the airflow over airfoils. This
particularly true when observing figure 15, the relationship between downwash and lift coefficient.
Predictably the graph is a straight line, in accordance with the theoretical relationship, and despite a
contrasting slope to that of the DATCOM analysis, this still lends credibility and confidence to the
data surrounding the lifting line calculations (because both are perfectly linear). In figure 13 the
spanwise downwash is plotted, where it is observed that the downwash increases for increasing
angles of attack. This makes logical sense because lift increases with increasing angles of attack and
the downwash is a function of the lift at any particular spanwise station. This lends itself to another
well known relationship regarding lift, in that it is commonly understood that lift cannot be
produced without the presence of circulation (the Kutta-Joukowsky theorem). Considering that the
downwash angles are calculated based on the generation of circulation, this all correlates
appropriately. The matter of circulation however is not confined to a mere mathematical formality;
it is evident on figure 13. Near the wing tip there is a presence of negative downwash, or upwash.
Practically this represents the tendency of the high pressure air on the lower surface to move
towards the lower pressure air on the upper surface. This potential and resulting separation off the
trailing edge manifests itself as upwash at the tip. A conundrum now exists for the span in-between
the upwash at the tip and the downwash from approximately mid-span. The result is for the flow to
separate off the trailing edge a small spanwise distance inboard of the wingtip with a high-energy
rotational flow due to the difference in upwash and downwash meeting at a point. This forms the
trailing vortex. Importantly the theory suggests that if the wing had infinite aspect ratio and
therefore infinite span, there would never exist the point where the air would try to move from the
high pressure of the lower surface to the low pressure of the upper surface and therefore the trailing
vortex would never form. Practically however, we know this never to be the case.
Figure 14 shows the variation in downwash angle with increasing angles of attack for both the lifting
line theory and the experimental wind tunnel test. The result of this shows a close correlation
between the curve shape of each approach, only with a slight offset in the x-axis, meaning that in
the real case a higher angle of attack is required to induce the same downwash angle. This
discrepancy could be put down to a mistake regarding the calculated air density, a difference in the
ideal and actual airfoil surface roughness, or general experimental error.
8/6/2019 MECN 4016 Aerodynamics
http://slidepdf.com/reader/full/mecn-4016-aerodynamics 34/40
MECN 4016 University of the Witwatersrand
School of Aeronautical Engineering
33
The variation of lift coefficient with angle of attack is shown by figures 16 and 17, for the lifting line
theory and the experimental data respectively. The general trend is followed for small angles of
attack for the lifting line case; however the graph begins to deviate above approximately 6 degrees.
This could have been caused by amplified errors in the matrix inversion for calculating the series of
lifting line coefficients or just due to some mathematical inconsistency. For figure 17 the lift
coefficient versus angle of attack showed little correlation to the exact slope outlined by the theory.
Unfortunately very few data points were taken and this affected the resolution of the results. The
rough shape of the linear relationship is approximately followed. This discrepancy can be put down
to inaccurate experimentation techniques and questionable calibration data.
8/6/2019 MECN 4016 Aerodynamics
http://slidepdf.com/reader/full/mecn-4016-aerodynamics 35/40
MECN 4016 University of the Witwatersrand
School of Aeronautical Engineering
34
7. Conclusions and Recommendations
7.1.
Thando TshabalalaConclusions
The lifting line theory provides a sufficient basis for computation on the downwash angle behind
aerofoil without flaps on an aft tail but this concept breaks down at high angles of attack where
separation occurs.
The empirical model (DATCOM) approximately agrees with theoretical expectations but not
necessarily experimental due to approximations, inaccuracies and random behaviour due to
separation followed by turbulence mentioned above.
Abbot was also found to be theoretically very accurate for simulation.
Recommendations
It would be more ideal if the experiment was performed at lower angles of attack for better
correlation with theoretical data. And if it were possible to have performed the experiment at lower
speeds to model more laminar flow.
In addition to this a correction factor could have been introduced to take into affect wake effects in
the tunnel as well as changes in density being accounted for.
7.2. Jameson Bentley
Conclusions
Downwash angle varies linearly with coefficient of lift and spanwise location. It was also
found that the downwash at the point of trailing vortex formation was zero. This point was
slightly inboard of the wingtip.
Experimental wind tunnel testing can validate the theoretical data providing that methods of
experimentation are accurate.
The downwash produced by a wing makes a significant difference to the lift produced by a
tail aft of the main wing.
8/6/2019 MECN 4016 Aerodynamics
http://slidepdf.com/reader/full/mecn-4016-aerodynamics 36/40
MECN 4016 University of the Witwatersrand
School of Aeronautical Engineering
35
Prantdl’s Lifting Line Theory is an accurate and acceptable method for evaluating the
downwash produced by a wing, where the effect of the downwash can be found at varying
locations aft of the wing.
Recommendations
Perform the experiment knowing the geometry and profile information in greater detail.
Take far more data points for the experimental data.
Use a more sophisticated CFD program compared to Tornado in order to validate/invalidate
the results.
Use a generic program based on Prantdl’s Lifting Line Theory in order to validate/invalidate
the data obtained.
Perform the experiment using a cambered airfoil as well.
8/6/2019 MECN 4016 Aerodynamics
http://slidepdf.com/reader/full/mecn-4016-aerodynamics 37/40
MECN 4016 University of the Witwatersrand
School of Aeronautical Engineering
36
8. References
Barlow, J. B., W. H. Rae, and A Pope. Low-speed wind tunnel testing. Wiley, 1999.
Diehl, Walter S. “The Determination of Downwash.” National Advisory Comittee for Aeronautics,
1921.
Glauert, H. The Elements of Aerfoil an Airscrew Theory. Cambridge: Cambridge University Press,
1959.
Karamcheti, K. Ideal Fluid Dynamics. New York: Wiley, 1966.
L, Rasmussen M, and Smith D E. “Liftind-Line Theory for Arbitrary Shaped Wings.” Journal of Aircraft,1999.
Neiswander, Brian. Prantdl's Lifting Line Theory and Finite Wings. University of Notre Dame, 2008.
Phillips, W. F, Anderson E.A, J. C. jenkins, and S Sunouchi. “Estimationg the Low-Speed Downwash
Angle on an Aft Tail.” 40th Aerospace Sciences Meeting & Exhibit, 2002.
Saffman, P. G. Vortex Dynamins. Cambridge: Cambridge University Press, 1992.
Silverstein, Abe, Katzoff S, and Kenneth W Bullivant. “Downwah and Wake Behind Plain and Flapped
Airfoils.” National Advisory Committee for Aeronautics, 1939.
8/6/2019 MECN 4016 Aerodynamics
http://slidepdf.com/reader/full/mecn-4016-aerodynamics 38/40
MECN 4016 University of the Witwatersrand
School of Aeronautical Engineering
37
9. Appendix
Table 3: Group member responsibility
Section Person responsible
Background Thando Tshabalala
Literature survey: Research and write up Thando Tshabalala
Objectives Thando Tshabalala
Apparatus: Write up and diagrams Thando Tshabalala
Procedure for windtunnel Thando Tshabalala
Analysis: Prantdl Lifting Line theory Jameson Bentley
Analysis: Datcom Thando Tshabalala
Experimentation: Windtunnel data processing Jameson Bentley
Experimentation: Tornado Jameson Bentley
Results: Processing and interpretation Jameson Bentley
Discussion Individual
Conclusions and Recommendations Individual
Formatting, final write up, abstract Jameson Bentley
Compilation Jameson Bentley
EQUATIONS TO DESCRIBE THE PROPERTIES OF AIR
Air density as a function of Temp and Relative Humidity
= 0.0034847 ( − 0.003796) /
= (1.7526 × 10)(. / )
Where:
−
−
8/6/2019 MECN 4016 Aerodynamics
http://slidepdf.com/reader/full/mecn-4016-aerodynamics 39/40
MECN 4016 University of the Witwatersrand
School of Aeronautical Engineering
38
P – Air pressure in Pa
= [ %; 40% ℎ 40 ]
T – Temperature in K
Viscosity of air at a given temp
Used to calculate Reynolds number
=
+ 198.6
+ 198.6
Where: = °
= 518.6°
= 3.74 × 10 − / (Barlow, Rae and Pope 1999)
Figure 18: Spanwise variation in lift coefficient produced by Vortex Panel Method Tornado.
8/6/2019 MECN 4016 Aerodynamics
http://slidepdf.com/reader/full/mecn-4016-aerodynamics 40/40
MECN 4016 University of the Witwatersrand
School of Aeronautical Engineering
Figure 19: Spanwise variation in normalized force over the surface of the wing, according to panel
methods run in Tornado.