Embed Size (px)
Citation preview

Membrane Electrode Assemblies Based on Hydrocarbon Ionomers
and New Catalyst Supports for PEM Fuel Cells
Sophie von Kraemer
Doctoral Thesis
Applied Electrochemistry, School of Chemical Science and Engineering,
Kungliga Tekniska Högskolan, Stockholm 2008
Akademisk avhandling som med tillstånd av Kungliga Tekniska
Högskolan i Stockholm framlägges till offentlig granskning för avläggande
av teknologie doktorsexamen fredagen den 24 oktober 2008,
kl 09.30 i sal F3, Lindstedtsvägen 26, KTH

All rights reserved
Sophie von Kraemer 2008
Printed in Sweden
Universitetsservice US-AB, Stockholm, 2008
TRITA-CHE Report 2008:64
ISSN 1654-1081
ISBN 978-91-7415-124-4

Keywords. Catalyst Support, Carbon, High Temperature Proton Exchange Membrane Fuel Cell, Hydrocarbon Ionomer, Membrane Electrode Assembly, Nafion, PEFC, PEMFC, Porous Electrode, Sulfonated Polysulfone, Titanium Dioxide
Abstract The proton exchange membrane fuel cell (PEMFC) is a potential electrochemical power device for vehicles, auxiliary power units and small-scale power plants. In the membrane electrode assembly (MEA), which is the core of the PEMFC single cell, oxygen in air and hydrogen electrochemically react on separate sides of a membrane and electrical energy is generated. The main challenges of the technology are associ-ated with cost and lifetime. To meet these demands, firstly, the component ex-penses ought to be reduced. Secondly, enabling system operation at elevated tem-peratures, i.e. up to 120 °C, would decrease the complexity of the system and sub-sequently result in decreased system cost. These aspects and the demand for suffi-cient lifetime are the strong motives for development of new materials in the field. In this thesis, MEAs based on alternative materials are investigated with focus on hydrocarbon proton-conducting polymers, i.e. ionomers, and new catalyst supports. The materials are evaluated by electrochemical methods, such as cyclic voltammetry, polarisation and impedance measurements; morphological stud-ies are also undertaken. The choice of ionomers, used in the porous electrodes and membrane, is crucial in the development of high-performing stable MEAs for dy-namic operating conditions. The MEAs are optimised in terms of electrode compo-sition and preparation, as these parameters influence the electrode structure and thus the MEA performance. The successfully developed MEAs, based on the hy-drocarbon ionomer sulfonated polysulfone (sPSU), show promising fuel cell per-formance in a wide temperature range. Yet, these membranes induce mass-transport limitations in the electrodes, resulting in deteriorated MEA performance. Further, the structure of the hydrated membranes is examined by nuclear magnetic reso-nance cryoporometry, revealing a relation between water domain size distribution and mechanical stability of the sPSU membranes. The sPSU electrodes possess properties similar to those of the Nafion electrode, resulting in high fuel cell per-formance when combined with a high-performing membrane. Also, new catalyst supports are investigated; composite electrodes, in which deposition of platinum (Pt) onto titanium dioxide reduces the direct contact between Pt and carbon, show promising performance and ex-situ stability. Use of graphitised carbon as catalyst support improves the electrode stability as revealed by a fuel cell degradation study. The thesis reveals the importance of a precise MEA development strategy, involving a broad methodology for investigating new materials both as in-tegrated MEAs and as separate components. As the MEA components and proc-esses interact, a holistic approach is required to enable successful design of new MEAs and ultimately development of high-performing low-cost PEMFC systems.

Nyckelord. Högtemperatur-polymerelektrolytbränslecell, Ickefluorerad polymer, Jonomer, Katalysatorbärare, Kol, MEA, Nafion, PEFC, PEMFC, Porös elektrod, Sulfonerad polysulfon, Titandioxid
Sammanfattning Polymerelektrolytbränslecellen (PEMFC) är en potentiell elektrokemisk kraftkälla för fordon, hjälpkraftsystem och småskalig kraftproduktion. Den centrala delen i den enskilda PEMFC cellen är den s.k. membranelektrodenheten (MEA), i vilken luftens syre och vätgas reagerar elektrokemiskt på olika sidor av ett membran och genererar elektrisk energi. De huvudsakliga hindren med teknologin är kostnads- och livstidsrelaterade. För att åtgärda dessa problem bör komponentkostnaderna reduceras, dessutom skulle ökad driftstemperatur för MEA minska systemkom-plexiteten och därmed även systemkostnaden. Tillsammans med kravet på tillräcklig livstid är dessa aspekter starka skäl för utveckling av nya material inom området. I denna avhandling studeras MEA baserade på alternativa material med fokus på nya protonledande polymerer, d.v.s. jonomerer, och katalysatorbärar-material. Materialen utvärderas elektrokemiskt m.h.a. metoder såsom cyklisk vol-tammetri, polarisations- och impedansmätningar, och morfologiska studier utförs även. Valet av jonomerer i elektroder och membran är avgörande för utvecklingen av stabila högpresterande MEA för dynamiska driftsförhållanden. MEA optimeras m.a.p. elektrodsammansättning och tillverkningsmetod eftersom parametrarna på-verkar elektrodstrukturen och därmed MEA-prestanda. MEA baserade på sulfone-rade polysulfoner (sPSU) är fördelaktiga att framställa och de visar lovande bränslecellsprestanda i ett omfångsrikt temperaturintervall. Dock förorsakar sPSU-membranen masstranport-begränsningar i elektroderna, vilket resulterar i försämrad MEA-prestanda. Membranmorfologin studeras därtill med kärnmagnetisk resonans-kryoporometri som avslöjar ett samband mellan storleksfördelning av vattendomä-ner och mekanisk stabilitet i sPSU-membranen. sPSU-elektroderna har liknande egenskaper som Nafion elektroden, vilket resulterar i hög bränslecellsprestanda då elektroderna kombineras med högpresterande membran. Även alternativa katalysa-torbärarmaterial utforskas; kompositelektroder, i vilka kontakten mellan platina och kol minskas genom att titandioxid används som platinabärare, visar lovande bränsle-cellsegenskaper och ex-situ termisk stabilitet. Enligt en elektrokemisk degraderings-studie ökar livslängden för elektroden när grafitiserat kol används som katalysator-bärarmaterial. Som helhet konkretiserar denna avhandling betydelsen av en nog-grann MEA-utvecklingsstrategi med en bred metodik för karakterisering av nya ma-terial som integrerade MEA så väl som skilda komponenter. P.g.a. att komponen-terna och processerna i MEA växelverkar krävs ett holistiskt tillvägagångssätt för att möjliggöra en framgångsrik utformning av MEA baserade på nya material som slut-ligen bidrar till utvecklingen av effektiva och förmånliga PEMFC-system.

List of Papers
This thesis is a summary of the following papers, appended at the end, and some complementary unpublished results. Paper I S. von Kraemer, A. I. Sagidullin, G. Lindbergh, I. Furó, E.
Persson and P. Jannasch Pore Size Distribution and Water Uptake in
Hydrocarbon and Perfluorinated Proton-Exchange Membranes as Studied by NMR Cryoporometry
Fuel Cells, 3-4, 262-269 (2008) Paper II S. von Kraemer, M. Puchner, P. Jannasch, A. Lundblad
and G. Lindbergh Gas Diffusion Electrodes and Membrane Electrode
Assemblies Based on a Sulfonated Polysulfone for High-Temperature PEMFC
J. Electrochem. Soc., 153, A2077-A2084 (2006) Paper III S. von Kraemer, G. Lindbergh, B. Lafitte, M. Puchner and
P. Jannasch Substitution of Nafion with Sulfonated Polysulfone in
Membrane-Electrode Assembly Components for 60-120 °C PEMFC Operation
J. Electrochem. Soc., 155, B1001-B1007 (2008) Paper IV S. von Kraemer, K. Wikander, G. Lindbergh, A. Lundblad
and A. E. C. Palmqvist Evaluation of TiO2 as Catalyst Support in Pt-TiO2/C
Composite Cathodes for the Proton Exchange Membrane Fuel Cell
J. Power Sources, 180, 185-190 (2008)

LIST OF PAPERS
Contribution to the Papers. All papers have been written by the author of this thesis and the author has taken major part in the planning, implementation and evaluation of the research projects. Co-authors have been responsible for the NMR and DSC measurements in Paper I, the synthesis and fundamental characterisation of ionomers in Papers II and III, as well as catalyst material preparation, gas porosimetry and TEM/SEM characterisation in Paper IV.
Additional work, also compiled during the thesis work yet not included in the thesis, is listed below. I S. von Kraemer, M. Puchner, P. Jannasch, A. Lundblad and G. Lindbergh Proc. of 209th Electrochemical Society Meeting, Denver, USA, 601, 173 (2006)
II S. von Kraemer, B. Lafitte, G. Lindbergh and P. Jannasch Proc. of the Second European Fuel Cell Technology and Applications
Conference (ASME), Rome, Italy, EFC2007-39251 (2007)
III S. von Kraemer, M. Puchner, P. Jannasch and G. Lindbergh American Chemical Society: Advances in Materials for PEMFC
Systems, Asilomar, CA, USA, 48-I (2005)
IV S. von Kraemer, G. Lindbergh, A. Lundblad, B. Lafitte, and P. Jannasch American Chemical Society: Advances in Materials for PEMFC
Systems, Asilomar, CA, USA, 45-B (2007)
V S. von Kraemer and G. Lindbergh 1st Carisma Conference: Progress in MEA Components for Medium and
High Temperature Polymer Electrolyte Fuel Cells, La Grande Motte, France (2008)
VI S. von Kraemer, K. Wikander, G. Lindbergh and A. E. C. Palmqvist EU Carisma Workshop: Degradation Issues for MEAs and Their
Components, Grenoble, France, PP-2 (2007)
VII A. Sagidullin, S. von Kraemer, I. Furó and G. Lindbergh EU Carisma Workshop: Ionomer Membranes for Medium and High
Temperature PEM Fuel Cells, Stuttgart, Germany, PP-16 (2007)

Contents
Abstract
List of Papers
Nomenclature
1 Introduction....................................................................................... 1
1.1 The Proton Exchange Membrane Fuel Cell System ................ 4
1.2 The Membrane Electrode Assembly .............................................. 6
Electrode Morphology..................................................................................... 7 Electrode Performance and Durability........................................................... 8 Proton Exchange Membrane Morphology ................................................... 10 Membrane Performance and Durability ...................................................... 11 Water Balance in the MEA ....................................................................... 12
1.3 Utilisation of Hydrocarbon Ionomers in the MEA................. 13
Sulfonated Polysulfone Ionomers .................................................................. 14 Incorporation of Hydrocarbon Ionomers into the Electrode.......................... 15
1.4 Utilisation of Pt Catalysts Supported on Novel Materials in the Electrode.......................................................................................... 15
Catalyst Support Degradation..................................................................... 15 Incorporation of Alternative Catalyst Support Materials............................ 16
2 Scope of the Thesis ................................................................. 19

CONTENTS
3 Experimental ................................................................................. 21
3.1 Membrane Characteristics................................................................ 21
Water Uptake ............................................................................................. 21 Membrane Morphology ................................................................................ 22 Water Balance in the Membranes................................................................ 23 H2/O2 Permeability in the Membranes ...................................................... 24
3.2 Electrode and MEA Preparation.................................................... 24
Spray Coating of sPSU Based Electrodes ................................................... 24 Preparation of Electrodes Based on Novel Catalyst Supports. .................... 24
3.3 Electrode Morphology ...................................................................... 25
Structure and Composition of Electrodes and Catalyst Supports. ............... 25 Electrode Electronic Conductivity. ............................................................... 25
Thermal Stability of Catalyst-Support Material ......................................... 26
3.4 Experimental Fuel Cell Setup ........................................................ 26
3.5 Electrochemical Characterisation ................................................ 27
Electrochemically Active Catalyst Area – Cyclic Voltammetry .................. 27 Fuel Cell Performance – Polarisation Measurements and Electrochemical Impedance Spectroscopy (EIS) ..................................................................... 27
Electrode Double Layer Capacitance........................................................... 28
Electrochemical Electrode Stability .............................................................. 28
Cell Resistance – iR Correction Measurements ........................................... 29
4 Results and Discussion ....................................................... 31 4.1 Hydrocarbon Ionomer Membrane Characteristics ........... 31
Fundamental sPSU Characteristics............................................................. 31
Membrane Morphology Study ...................................................................... 33
Nafion Membrane Structure........................................................................ 35
sPSU Membrane Structure ......................................................................... 35 Water Balance in the Membranes................................................................ 37
H2/O2 Permeability in the Membranes ...................................................... 38
4.2 Electrodes Based on sPSU Hydrocarbon Ionomers ....... 39
The sPSU Electrode Morphology ................................................................ 39
Electronic Conductivity of sPSU Electrodes ................................................ 42
Wetting of the Electronic Phase in sPSU Electrodes................................... 42
Electrochemically Active Catalyst Area and Kinetics of the sPSU Electrodes ..................................................................................................... 42

CONTENTS
4.3 Fuel Cell Performance of MEAs Based on Hydrocarbon Ionomers.................................................................................................. 43
Influence of the Cathodic sPSU Content ..................................................... 43
Influence of the sPSU Ion Exchange Capacity............................................ 44
Influence of Membrane on MEA Characteristics........................................ 45
Cell Resistance ............................................................................................. 48
4.4 Pt Catalysts Deposited on Titanium Dioxide Supports . 49
Structural and Compositional Characterisation .......................................... 49
Thermal Stability of the Pt-TiO2/C Composite ......................................... 51 Influence of Pt-TiO2:C Ratio on the Cathode Performance......................... 51
Influence of Pt:TiO2 Ratio on the Cathode Performance ............................. 52
4.5 Pt Catalysts Deposited on Graphitised Carbon................. 53
5 Conclusions .................................................................................... 55
5.1 Hydrocarbon Ionomer Membrane Characteristics .......... 55
5.2 Impact of a Hydrocarbon Ionomer on the Electrode Characteristics ....................................................................................... 56
5.3 Impact of a Hydrocarbon Ionomer on the MEA Characteristics ....................................................................................... 57
5.4 Performance and Stability of New Catalyst Supports ..... 58
5.5 Overall Conclusions and Future Outlook............................ 58
Acknowledgements ............................................................................ 61
References ................................................................................................... 63
Nomenclature
BET/BJH Brunauer Emmet Teller/Barret Joyner Halenda BOP Balance of plant BPP Bipolar plate CCM Catalyst coated membrane CE Counter electrode DMAc Dimethylacetamide DSC Differential scanning calorimetry EIS Electrochemical impedance spectroscopy EV Electric vehicle FCV/FCHV Fuel cell vehicle/Fuel cell hybrid vehicle GDE Gas diffusion electrode GDL Gas diffusion layer HFR High frequency resistance ICEV Internal combustion engine vehicle idc Direct current density IEC Ion exchange capacity
Number of water molecules per sulfonic acid unit
MEA Membrane electrode assembly NMR Nuclear magnetic resonance ORR Oxygen reduction reaction PEMFC Proton exchange membrane fuel cell PFSA Poly[perfluorosulfonated acid] PTFE Polytetrafluoroethylene (Teflon) RE Reference electrode RH Relative humidity RHE Reversible hydrogen electrode SANS/SAXS Small angle neutron scattering/Small angle X-ray
scattering SEM/TEM Scanning electron microscopy/Transmission electron microscopy sPSU Sulfonated polysulfone WE Working electrode

1
Chapter 1
Introduction Currently the global energy demand is ~250 million barrels per day of oil equivalents, corresponding to a yearly energy consumption of ~16*1016 Wh, and the estimated increase in demand is 40-50 % between 2005 and 2030 1-2. The transport sector and power/heat production contribute to the total global energy use by 24 % and 33 %, respectively, and the transport sector, which is the most oil-dependent sector, is projected as the fastest growing in the next decades1. Presently, there are two major energy-related global threats; the high probability of global warming resulting in humanitarian, environmental and economical crisis, as a consequence of the anthropogenic green-house gas emissions, as well as the decrease in discovery of significant oil findings, resulting in an insecure and costly supply of the primary energy on which the global economy is dependent2. These two threats have different grounds, however, they lead to the same conclusion; there is a considerable need for the fossil fuel-based society to be converted into an energy-wise sustainable society. Radical energy savings, efficient energy use and development of renewable energy resources are included in this global challenge1. The importance of governance action in a global perspective is worthwhile to emphasise; developing means of control, such as policies, tax systems and economical incitements for clean-technology development and investments, is crucial. Further, the introduction of sustainable technologies, e.g. in the transport and power production sectors, is of high importance. The present challenge is to develop an energy system where sustainable energy resources are used most effi-ciently; production, distribution as well as utilisation of energy should be optimised in terms of efficiency. For automotive applications the overall efficiency, i.e. the well-to-wheel efficiency, is given by the efficiency in fuel production and the vehicle

CHAPTER 1 INTRODUCTION
2
efficiency, i.e. tank-to-wheel efficiency. Hence, it is essential to consider i) the choice of energy resource (fossil fuels, biomass, hydro/wind/solar power), ii) the fuel and/or electricity production (based on either fossil fuels or biomass), as well as iii) the vehicle technology (internal combus-tion engine vehicle (ICEV), hybrid electric vehicle or electric vehicle (EV)). A current ICEV has an average overall efficiency of ~15 % for a dynamic driving cycle3. For a hybrid vehicle, the efficiency is improved (~30 %) as the ICE is hybridised with a battery3. However, if fossil fuels are replaced by biofuels, the overall efficiency of a biofuel hybrid vehicle is reduced to 20 % due to 40-50 % efficiency in the fuel production compared to ~88 % gasoline/diesel production3,4. Compared to the ICEVs, EVs have potentially high vehicle efficiency, due to the high efficiency of the electric motor and the electrochemical power device compared to the combustion engine, limited in its efficiency by the Carnot cycle5. Thus, EVs, which are fully powered by an electrochemical power device, are preferable for increasing vehicle efficiency and for achieving zero emission targets. The EV is a battery vehicle or a fuel cell vehicle (FCV), and the latter is a fuel cell hybrid vehicle (FCHV) if combined with an assisting battery. Despite the high efficiency and zero emissions of the EVs, the overall efficiency and environmental footprint of an EV are highly dependent on the production method of electricity (battery vehicle) and hydrogen (FCHV). For battery vehicles, 60-67 % vehicle efficiency has been reported, and the overall efficiency (25-57 %) is highly dependent on the choice of electricity production4,6,7. The potential improvement of battery vehicle efficiency is related to introduc-tion of new battery technologies, yet the promising Li-ion battery technology is presently lacking field-demonstration in automotive applications. Additionally, the charging time and driving range are current challenges in the battery vehicle development. Another compli-cation is related to the lack of an energy buffer in the current power-grid infrastructure; the development of a transport sector based on electricity is challenging in terms of handling large variations in electricity produc-tion and demand. In FCHVs, the proton exchange membrane fuel cell (PEMFC) is the generally used fuel cell technology due to the compact and lightweight unit, and the low operating temperature (80 °C), allowing rapid start-up. The highest currently reported vehicle efficiency for a FCHV is 60 %8 and comparable efficiency (average of 56 %) has been reported in the U.S Department of Energy’s Controlled Hydrogen Fleet and Infrastructure Validation and Demonstration Project9. The overall FCHV efficiency will depend on the hydrogen (H2) production, storage

CHAPTER 1 INTRODUCTION
3
and distribution, e.g. when combined with H2 production via biomass conversion or solar/hydro-power based water electrolysis6,10, the overall efficiency for a FCHV is 34-45 %. In contrast to the battery vehicles, the FCHV would allow an energy buffer in the energy infrastructure, as the H2 supplied to the FCHV is acting as an energy carrier, thus considerably increasing the energy system flexibility. Yet, the establishment of a secure fuel infrastructure as well as a competitive and sustainable H2 production is stated as a major impediment in the commercialisation of FCHVs11,12. In the context of stationary power production, fuel cells are suitable as electrochemical energy converters in small-scale heat-and-power plants and auxiliary power units in heavy-duty vehicles12,13. For these applica-tions, the PEMFC technology is operating at a rather low temperature (~80 °C) compared to high-temperature fuel-cell technologies such as solid oxide fuel cells (SOFCs) (>800 °C). The high-temperature systems are preferable in stationary combined heat-and-power plants due to the higher quality of co-generated heat and larger fuel flexibility. However, the long start up time due to the high temperature reduces the operation flexibility of small stationary fuel cell systems. The lifetime target of 40 000 h and cost targets for stationary applications are obvious challenges in the SOFC as well as the PEMFC technology, and therefore, the technologies are currently considered to have rather comparable poten-tial in small scale power production. In relation to the transport and power production sectors, portable electronics is the sector in which the majority of the PEMFC units are presently installed, implying that the portable market is closest to mass commercialisation of PEMFCs12. The main obstacles of the PEMFC technology for both automotive and stationary applications are associated with cost issues and lifetime. For automotive applications, the durability target for FCHVs is >5 000 h. Previously 2000 h lifetime was reported and recently, improvement of stack-lifetime data has been presented by several companies and groups14-16. An essential obstacle in reaching sufficient lifetime is the degradation of the components in the membrane electrode assembly (MEA), thus alternatives to the currently used materials are required. The current estimated cost of a PEMFC system for automotive applications is high, $ 108/kW system, even though the calculations are based on large production volume17. The required cost achievement for the automotive PEMFC system by 2015 is $ 30/kW while in stationary applications a higher system cost is allowed15,17. Realisation of the cost targets involves i) reduced platinum (Pt) catalyst content and efficient Pt recycling, ii) low-cost component materials and iii) reduced complexity
CHAPTER 1 INTRODUCTION
4
of the system. The present work has been carried out in the context of these cost reduction and durability related challenges.
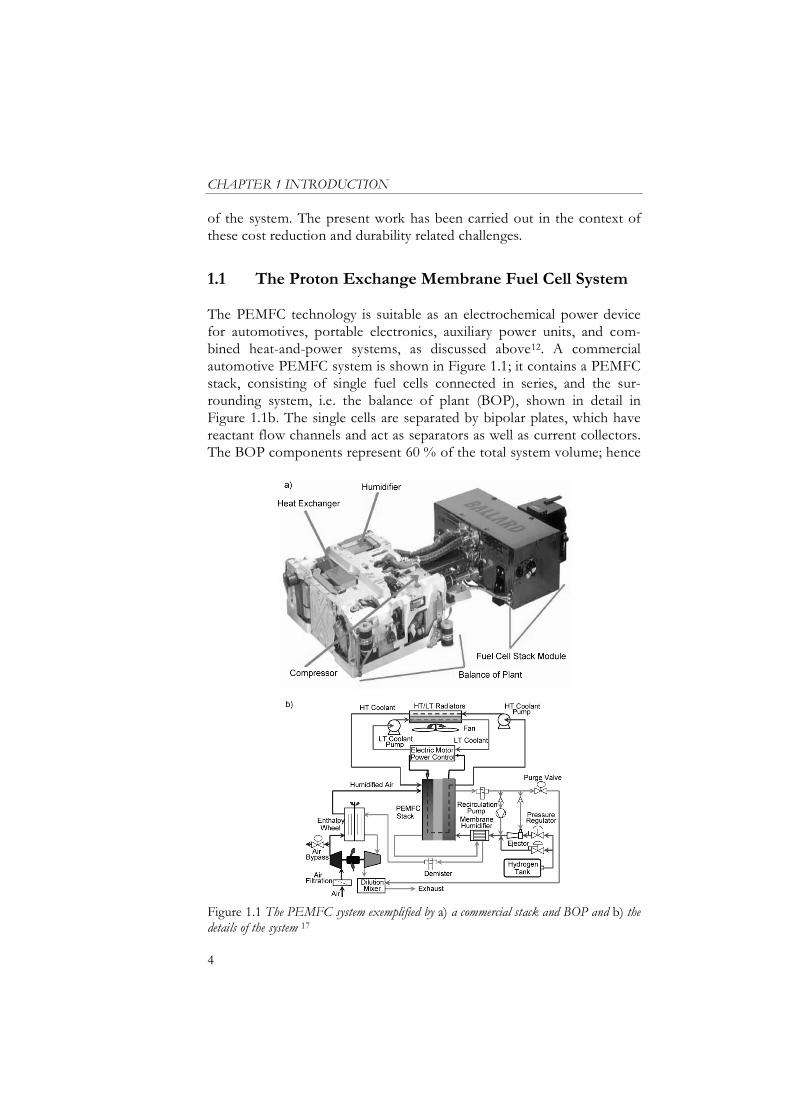
1.1 The Proton Exchange Membrane Fuel Cell System The PEMFC technology is suitable as an electrochemical power device for automotives, portable electronics, auxiliary power units, and com-bined heat-and-power systems, as discussed above12. A commercial automotive PEMFC system is shown in Figure 1.1; it contains a PEMFC stack, consisting of single fuel cells connected in series, and the sur-rounding system, i.e. the balance of plant (BOP), shown in detail in Figure 1.1b. The single cells are separated by bipolar plates, which have reactant flow channels and act as separators as well as current collectors. The BOP components represent 60 % of the total system volume; hence
Figure 1.1 The PEMFC system exemplified by a) a commercial stack and BOP and b) the details of the system 17

CHAPTER 1 INTRODUCTION
5
a reduced complexity of the BOP is preferable for automotive applica-tions. The cost contributions for the stack and BOP components are presented in Figure 1.2; the analysis was based on a vertically integrated system at a production volume of 500 000 stacks/y. The current PEMFC system cost is much higher due to a supply-chain scenario and low production volume. Depending on the choice of system components, slightly varying cost contributions may be observed17. As illustrated by the cost analysis, the electrodes, mostly due to the Pt catalyst, dominate the stack cost, followed by other components such as the polymer membrane, gas diffusion layers (GDL) and bipolar plates (BPP). The analysis is based on a 0.75 mg Pt cm-2 loading17, which is rather high compared to the aimed goal of 0.2 mg Pt cm-2 15. A reduced Pt loading combined with an improved Pt utilisation would result in a large cost reduction but also low cost membranes and electrodes would signifi-cantly contribute. Further, reduced component expenses are related to a high power density of the system as the amount of required material per kW is minimised17,18. Instead of H2, methanol may be fed into the PEMFC system, thus named a direct methanol fuel cell (DMFC). Methanol may be considered a more convenient fuel than H2, yet methanol oxidation is sluggish compared to H2 oxidation, demanding considerably higher Pt catalyst loadings compared to the PEMFC, consequently resulting in increased system cost. The BOP cost contribution is mainly related to air compression, reactant gas humidification and cooling, as illustrated in Figure 1.2. In a fuel cell stack with 50 % electrical efficiency, as much
Figure 1.2 Calculated cost contributions of stack and BOP components for an 80 kW fuel cell system ($ 108/kW) based on a vertically integrated system at a production volume of 500 000 stacks/y 17

CHAPTER 1 INTRODUCTION
6
heat as electrical power is generated, thus requiring highly efficient cooling19. BOP cost reduction would be related to i) a shift to elevated stack-operating temperatures, which decreases the cooling system complexity due to an increased temperature gradient between fuel cell stack and the coolant, and ii) reduced humidity requirements, resulting in decreased size of the humidification system18-21. Water management would be eased due to the native decrease of liquid water present in a system operating at temperatures above 100 °C. In addition, higher temperatures allow improved kinetics and increased fuel flexibility in terms of increased carbon monoxide tolerance of the Pt catalyst19-21. Hence, operation at elevated temperatures (up to 120 °C) and reduced humidity (15-50 % relative humidity (RH)) has been set as a global R&D objective15. For stationary heat-and-power plants, higher quality of co-generated heat due to elevated operation temperature would certainly be preferable. The main impediment to high-temperature PEMFCs is deteriorated component performance and stability. The currently used materials are limited in lifetime and performance at standard operation (80 °C); the stability and the performance will be further challenged at >100 °C14,16,18. Overall, the obstacles of durability and cost have launched a vast materials research for the PEMFC in the context of developing alternatives to the currently used catalysts, catalyst supports, ionomers, bipolar plates and sealings15-16,18,21.
1.2 The Membrane Electrode Assembly A single cell in a fuel cell stack has a five-layered structure consisting of gas diffusion layers (GDLs) and MEA, visualised in Figure 1.3. A polymer membrane separates the electrodes and acts as a proton-conducting electrolyte, a reactant separator and as an electronic insulator. The reactant gases are humidified to supply the MEA with water. As illustrated in Figure 1.3, the H2 fuel, supplied on the anode side, is oxidised, and the produced protons are transported through the hydrated membrane to the cathode, where the O2 in air is reduced and water is produced, resulting in the overall cell reaction with water as the only product5:
2H
2+ O
22H
2O (1.1)
The separate electrode reactions are shown in Figure 1.3. H2 oxidation reaction (HOR) is a fast reaction compared to the O2 reduction reaction

CHAPTER 1 INTRODUCTION
7
Figure 1.3 The five-layered single cell: gas diffusion layers and the membrane electrode assembly (MEA), with electron micrographs of the porous electrode and the agglomerate
(ORR); the main reaction losses are therefore related to the sluggish cathode reaction5. Electrode Morphology. The electrodes are porous, thus named gas diffusion electrodes (GDEs), and the structure is shown by a scanning electron microscopy (SEM) image in Figure 1.3. The porosity originates from the catalyst support material, which is a high-surface electron-conducting material (e.g. carbon), forming a porous structure when bound together in agglomerates with a mechanical binder. The binder is usually a proton-conducting polymer, i.e. an ionomer, which allows proton conduction in the electrode22-26. A high degree of catalyst-surface wetting by the ionomer is crucial for high catalyst utilisation. The high porosity results in a large electrode area compared to the geometrical area and enables gas to be transported in the electrode. Also electrons and protons have to be transported to the catalyst for a reaction to occur; electron- and proton-conducting components should thus create a percolating network in the electrode. The gas pores have to be evenly distributed and the gas should be able to permeate through the ionomer present in the agglom-erates, illustrated in Figure 1.3, to reach the catalytic sites. In addition to the slow cathode reaction kinetics, the production of water may result in cathode limitations as well. The water causes electrode flooding, i.e. blocking of the gas transport in the pores, resulting in O2 mass-transport limitations at higher currents. Cathode flooding may be avoided either by

CHAPTER 1 INTRODUCTION
8
developing electrodes with high porosity and low hydrophilicity, through addition of e.g. PTFE27, by reducing electrode thickness, or by decreas-ing the quantity of liquid water, e.g. by increasing operating temperature. In addition, cathodes with graded Nafion content in the perpendicular direction have been shown to reduce flooding28. The GDLs, situated outside the electrodes as shown in Figure 1.3, yield an even gas distribu-tion over the electrode area and improve the water management of the MEA22,23. The morphology, i.e. the performance, of the electrode, is dependent on the composition as well as the electrode preparation method22-24,29-37. Both the ratio of Pt-C/ionomer and the choice of catalyst support material influence the electrode structure29-31. The electrodes are prepared, as discussed in detail in Chapter 3, from inks based on supported platinum (typically Pt-C), ionomer and solvents and applied by e.g. spraying or painting onto the GDL24,27-30 or the mem-brane, the latter resulting in a catalyst-coated membrane (CCM)31-34. Depending on the solvent, the ionomer form in the ink will vary, thus different porous structures are formed as is illustrated schematically in Figure 1.4; the less solved the ionomer, i.e. the more colloidal the ionomer form, the higher the observed electrode porosity35-37. As an alternative to the conventional gas diffusion electrodes, MEAs with Pt-coated nano-whisker electrodes have recently been developed38 and alternative methods, e.g. dry layer preparation and electrospraying, have been reported39,40. Electrode Performance and Durability. Electrode performance is dependent on the Pt content in the electrode. Particularly at the cathode, a high loading is required to achieve sufficient power density, thus increased catalyst activity is required to achieve such a low loading as 0.2 mg Pt cm-2 in the MEA, which would significantly contribute to realisation of the target of <0.2 g Pt/kW15,16. The cathode environment is rather harsh on the Pt-supported carbon (Pt-C) due to the hydrous environment and the oxidative voltage window, i.e. Ecathode =0.6-1.2 V vs RHE (reversible
Figure 1.4 The ionomer formations in the ink a) solved ionomer form and b) colloidal ionomer form influence the electrode structure

CHAPTER 1 INTRODUCTION
9
hydrogen electrode) compared to Eanode=0-0.05 V vs RHE. Elevated cathode potentials have been observed during stack start-up and shut-down due to local fuel starvation at the anode, and high anode potential, due to complete fuel starvation, may occur as well14,16,41,42. The structure of a commercial Pt-C material is seen in the micrograph in Figure 1.3. The stability of the Pt nanoparticles has been shown to be highly dependent on humidity, temperature, voltage cycling and alloying with non-noble metals16,41-44. Sintering of Pt particles results in loss of electrochemically active catalyst area and the dissolved Pt is transported into the membrane. The stability of the Pt nanoparticles is influenced by the anchoring to the support as well as support degradation41,43. Addi-tionally, Pt has been stated to accelerate oxidation of the carbon acting as support41,42,45,46. The stability of the carbon material is related to humid-ity, temperature, voltage as well as carbon properties16,41-43,46. Overall, Pt-C material degradation influences the fuel cell performance in terms of decreased activity, deteriorated mass transport and membrane poisoning by Pt cations41,43,44,47. The Pt particle stability has been reported to decrease more drastically with humidity than with temperature, hence low humidity operation would increase the Pt catalyst lifetime in the fuel cell, and this may be accomplished by high temperature operation16. In addition, Pt alloyed with non-noble metals such as Co has shown promising stability and performance16,41,43,48. Carbon degradation accelerates with increasing operating temperature, therefore, research is carried out on alternative materials to increase the electrode stability16,41. The other component in the gas diffusion electrode is the ionomer, binding together the catalyst-support network. The require-ments set on the ionomer are high conductivity and sufficient permeability to avoid limited gas transport in the agglomerates, as listed in Table 1.149. The chemical degradation of the ionomer in the electrode Table 1.1 Summarised requirements on the ionomer used in the membrane as well as in the electrodes 49
Property Ionomer in the membrane Ionomer in the electrodes (a) Proton conductivity
25 % RH (S cm-1) >0.1 (120 °C) >0.03 (25 °C)
>0.1 (120 °C) >0.03 (25 °C)
H2 permeability 80 °C
(mol cm-1 s-1 atm-1) <1*10-10
>1*10-15
O2 permeability 80 °C
(mol cm-1 s-1 atm-1) <3*10-10
>1*10-14 Water uptake (%) <100 in boiling H2O <200 in boiling H2O Chemical stability Stable in presence of radicals Stable in presence of radicals
Mechanical stability Critical Less critical (a) Values based on a model including a 2 nm thick ionomer film in the electrode49

CHAPTER 1 INTRODUCTION
10
is believed to be high compared to the ionomer in the membrane, and the degradation is proposed to result in decreased electrode perform-ance50. The mechanical stress of the ionomer at dynamic operating conditions may deteriorate the electrode properties as well14. The amount of ionomer in the electrode represents only a fraction of the ionomer in the MEA, thus contributing only marginally to the cost16, yet the need for a highly stable ionomer in the electrode motivates develop-ment of alternative electrodes. Proton Exchange Membrane Morphology. Most current fuel cell membranes, including the often-considered standard material Nafion, whose molecu-lar structure is presented in Figure 1.5, rely on water as a medium for proton conduction51-53. In other membranes, such as polybenzimidazole, phosphoric acid is the proton-conducting medium19. In Nafion, the SO3- group, situated on the side chain in the polymer, attracts protons and the protons are transported in water between these ionic sites. The per-fluorinated backbone of Nafion is highly hydrophobic in contrast to the hydrophilic side chains, resulting in a phase-separated ionomer structure in the hydrated membrane. A schematic image as proposed by Kreuer of the phase-separated structure is shown in Figure 1.553. The more densely located the ionic groups, i.e. the higher the ion-exchange capacity (IEC = moles of ionic sites/g ionomer), the higher the proton conduc-tivity observed for the membrane54. A model, illustrating the morphological reorganisation and formation of a percolating water channel network as water content is increased, has been proposed by
-SO3-
Protonic charge carrierH2O
1 nm
Figure 1.5 The morphology of the Nafion membrane, with the water channels, sulfonic acid groups and protons as proposed by Kreuer 53; as well as the molecular structure of the perfluorinated ionomer

CHAPTER 1 INTRODUCTION
11
Gebel et al52. The properties of the water channel network, i.e. density of ionic groups, channel diameter and continuity of channels, control i) the transport of species (protons, reactant gases and water) through the membrane and ii) water uptake and mechanical stability of the mem-brane, thus directly influencing the performance and lifetime of the MEA. Also, the state of the water in the membrane, i.e. the degree of association of water to the polymer matrix, which is related to the polymer backbone properties, is essential to consider55.
The structural features of membranes, including the hy-drophilic domains, have mainly been studied by either i) scattering methods such as small angle X-ray/neutron scattering (SAXS/SANS) or ii) surface characterisation such as transmission electron microscopy (TEM)51,52,56. The drawback of SAXS/SANS is the narrow scattering-vector space, i.e. only small domains are detectable51,52. However, recent development in the methodology has enabled data over an extended angular range to be detected52. TEM analysis shows only the surface morphology, which may differ significantly from the bulk structure. Most structural membrane studies have been carried out on Nafion membranes, as summarised by Mauritz and Moore51. The studies have included Nafion structure dependence on water uptake, manufacturing and pretreatment55,57, and several structural models have been pro-posed51. For new membrane materials, structural studies have been included in only a few studies; a minor fraction of hydrocarbon iono-mers have been investigated in terms of the state of the water and water domain size53,58-60. Overall, the need for complementary methods for membrane morphology characterisation has been emphasised51. In addition, in the evaluation of new ionomers, relating the membrane morphology to the fuel cell performance is essential52,56. Membrane Performance and Durability. The requirements of a high-performing membrane are low reactant permeability, sufficient proton conductivity, high chemical and mechanical stability at dynamic operat-ing conditions, i.e. wide humidity and temperature range, as summarised in Table 1.115,49,56. In addition, low-cost synthesis and recycling processes are necessary56,61. Two of the limitations of the conventional materials such as Nafion are the high production costs and low recyclability. Also, the perfluorinated membranes are limited in operating temperature due to i) low thermal stability in hydrated state above 100 °C as well as ii) insufficient proton conductivity at decreased humidity due to deficient water-retention61,62. Hence, to enable high-temperature operation ( 120 °C), membranes with improved water retention and proton

CHAPTER 1 INTRODUCTION
12
conductivity at low humidity as well as enhanced mechanical and thermal stability at elevated temperatures and dynamic conditions are required. Degradation of the membrane during stack lifetime may occur due to dehydration or Pt-poisoning, resulting in decreased H+ conductivity, i.e. larger power loss of the system. Also, for sufficient lifetime performance the membrane should be chemically resistant to different reactive species produced at the electrodes, e.g. in the reaction of crossover gases14,63. The gas permeability of the membrane has been shown to be important for the MEA stability; less reactant crossover gives fewer radical attacks on the MEA materials63-64. Added to the chemical stability, the mechanical stability of the membrane is also a crucial lifetime parameter16,63. In both of these membrane-degradation processes pinhole formation occurs, resulting in complete failure of a single cell, thus being one of the most damaging failure modes in a stack. The mechanical stress is mostly related to the water content of the membrane. Firstly, uncontrolled water uptake results in excessive swelling, i.e. low mechanical stability, of the pristine membrane, as well as over-compression of GDLs in an assembled compressed stack16. Secondly, dynamic operating conditions, such as cycling in a wide temperature and humidity window, cause dimensional changes in the MEA, since membrane water uptake is highly dependent on humidity and temperature53-55,65. In addition, membrane water uptake varies greatly over time; the morphology is related to the preparation and history of the material51,55,57,66. Development of membranes with only minor dimensional change in a wide temperature and humidity range is thus required to avoid failure due to mechanical stress. Water Balance in the MEA. The water management of the MEA is vital to consider in the development of high-performing single cells55,67. The humidity of the entering gases influences the MEA performance consid-erably, and the requirements of system operation at reduced humidity demand self-humidifying processes. Variation in water content influ-ences the membrane stability and performance, as described above. The proton-conduction component in the membrane as well as in the electrode depends on the presence of water. Further, water produced in the cathode causes O2 mass-transport limitations if not transported efficiently from the electrode. The design of the bipolar plate flow-field and GDLs, shown in Figure 1.3, is essential for reducing cathode flooding and avoiding anode dry out20,67. The water transport in the membrane is illustrated in Figure 1.6. The proton transport in the membrane causes an electro-osmotic drag of water from the anode to the cathode and due to the production of water at the cathode a concen-

CHAPTER 1 INTRODUCTION
13
Figure 1.6 The water balance in the MEA depends on the cathode water production, gas humidity, membrane water transport and GDL design.
tration gradient of water is present in the membrane, resulting in back diffusion of water from the cathode to the anode55,67,68. In addition, any pressure difference over the membrane would cause a pressure gradient driven water transport. The overall water balance influences the MEA performance; an efficient back transport of water in the membrane prevents cathode flooding, thus improving performance at high currents, and allows humidification of the anode side at reduced humidity, thus avoiding increased ohmic resistance in the membrane54,69-73. Also, low electro-osmotic drag is preferable for an optimised water balance19,68. The water balance in the membrane, i.e. the selfhumidification ability, has been improved by enhancing anode hydrophilicity as hydrophilic inorganic composites were added74 and by reducing the membrane thickness as bulk distance for the back-transport of water was reduced72. However, decreased membrane thickness increases the risk of mechani-cal degradation and increased gas crossover. In general, the MEA design is subject to optimisation where contradicting parameters and required properties are balanced.
1.3 Utilisation of Hydrocarbon Ionomers in the MEA The requirements of MEA operation at elevated temperature and reduced humidity, improved durability and decreased cost have resulted in increased interest in alternative materials to the commercial perfluori-nated PFSA (poly[perfluorosulfonic acid]) ionomers provided by DuPont, Asahi Glass, Solvay and 3M16. The lack of mechanical robust-ness at high temperatures and the high cost make the perfluorinated ionomers unsuitable for utilisation in MEAs56,75. Recent reports show improvements of mechanical stability and water retention, i.e. selfhu-midification, of the perfluorinated membranes at elevated temperatures, e.g. by introducing inorganic composites into the membrane or by developing thin reinforced membranes76-82. Cost projections for PFSA membranes in automotive applications, based on 1 million vehicles/year, imply a cost interval of $ 1.5-6/kW, in which the lower range is rather optimistic but considered as affordable16. Still, high cost for smaller

CHAPTER 1 INTRODUCTION
14
production volumes, low recyclability, high-temperature degradation as well as fluoride-related metallic bipolarplate corrosion remain as chal-lenges for PFSA-based MEAs, thus motivating research in alternative ionomers16,61. Several hydrocarbon ionomers, such as polyimides, poly(ether ketone)s, poly(arylene ether sulfone)s and polybenzimidazoles, have been subject to research for PEM applications as discussed in several reviews19-21,62,75. The high thermal and chemical stability, low cost, high MEA recyclability and good reactant barrier properties are the main grounds for utilising hydrocarbon polymers in PEMFCs. The higher hydrophilicity of the backbone in hydrocarbon ionomers yields generally different membrane properties than those of perfluorinated ionomers. Challenges related to the hydrocarbon membranes are the dynamic water uptake behaviour and the embrittlement degradation during humidity cycling16. Sulfonated Polysulfone Ionomers. The sulfonated polysulfones (sPSU), also named sulfonated poly(arylene ether sulfone)s, constitute a comprehen-sively studied hydrocarbon ionomer group62,83-88. sPSU ionomers have been shown to be suitable as PEM materials due to readily available low-cost monomers and polymers as well as the promising thermal and mechanical stability. The ionomers have good film-forming properties and fuel cell evaluation of a particular sPSU membrane sandwiched between commercial electrodes showed high stability during 300 h operation at fully humidified conditions86,87,89. The structure of a random sPSU is shown in Scheme 1.1. The ionomer is composed of hydropho-bic monomers and hydrophilic monomers; the latter include a side chain supplied with a sulfonic acid unit. Length and ratio of monomers as well as flexibility of backbone and side chains are decisive for the membrane properties. The ratio of the two monomers determines the IEC of the
Scheme 1.1 Molecular structure of random sulfonated polysulfones; the molar fraction of sulfonated units and the structure (Ar) of the non-sulfonated units are shown.

CHAPTER 1 INTRODUCTION
15
ionomer. Increased IEC results in higher proton conductivity and higher hydrophilicity, i.e. water uptake, of the membrane56,58,60,61. The mechani-cal stability is compromised in highly hydrophilic membranes; hence a balance between the two monomers is required for optimal properties. Incorporation of Hydrocarbon Ionomers into the Electrode. The ionomer in the electrode has to be workable in the ink manufacturing, i.e. the ionomer form and behaviour should be possible to control in the ink preparation. Sufficient proton conductivity, permeability and chemical stability are required for an optimal electrode whereas mechanical stability, including good film-forming properties, is not of large significance, as listed in Table 1.149. This is in contrast with the ionomer membrane develop-ment, where mechanical stability and low permeability are highly prioritised. Also, the cathode and anode ionomers may well have different properties in terms of hydrophilicity. Therefore, the ionomers, used in electrodes and membrane in a high-performing MEA, are optimally rather different. However, the ionomers in the components should be highly compatible in a wide temperature and humidity range. The more differing the properties of the ionomers, the higher the risk of electrode delamination, which ought to be avoided since it decreases MEA lifetime62,89-92,95. The MEA optimisation process includes devel-opment of the different components as well as the complete MEA; thus, a balance between the above-described properties has to be established. Compared to the highly active research area of novel membrane devel-opment, the work carried out on fully integrated MEAs based on novel ionomers has been reported less frequently; the processability of the ionomer into well-integrated MEAs is only scarcely considered91,93-97. The extensive development work on Nafion-based electrodes launched by Wilson et al.22-37, implies the considerable amount of R&D needed for optimisation of the novel ionomer-based MEAs such as the sPSU MEAs18.
1.4 Utilisation of Pt Catalysts Supported on Novel Materials in the Electrode Catalyst Support Degradation. Carbon oxidation in PEMFC electrodes is related to operating conditions, voltage window, and Pt content16,41-45, as discussed previously. Carbon surface area and degree of graphitisation influence the resistance against oxidation; the larger the amount of oxidative sites, the higher the susceptibility of surface oxidation43,46,48. The degradation of Pt is strongly related to support degradation and

CHAPTER 1 INTRODUCTION
16
voltage cycling43,48. The complete oxidation of carbon becomes signifi-cant at high voltages, >0.9 V vs RHE, and results in CO2 formation41:
C(s )+ 2H2O CO2 + 4H+
+ 4e (1.2)
For PEMFCs, the electrodes may experience a high voltage, >1.2 V vs RHE, due to fuel starvation and the avoidance of these high voltages may partly be achieved by operation control strategies14,16,42. However, for systems where fuel starvation occurs, an accelerated test with potentiostatic hold at 1.2 V for 100 h has been proposed to correspond relatively well to a lifetime operation in automotive applications with 30 000 start-up/shut-down cycles16. In resemblance to the electrochemical stability tests, a thermal stability test has been developed and confirmed to be in agreement with an accelerated electrochemical method46. Overall, the catalyst material durability is complex to study, as causes of degradation are overlapping, thus making the development of relevant degradation methodologies a challenge16,41,42,44,48. Incorporation of Alternative Catalyst Support Materials. As previously done in the context of phosphoric acid fuel cells, the corrosion of carbon may be mitigated by developing electrodes based on graphitised carbons, which are stable alternatives to the carbon black supports due to reduced surface heterogeneity and higher resistance against oxidation14,16,41. Also, a lowered surface area decreases carbon oxidation16,48. Recently, the utilisation of carbon nanotubes as catalyst supports has shown promising
Figure 1.7 TEM images of a) carbon black and b) graphitised carbon provided by Kjell Wikander.

CHAPTER 1 INTRODUCTION
17
stability41. Figure 1.7 exemplifies structural differences between carbon black and graphitised carbon. The accomplishment of i) an adequate amount of deposited Pt and Pt anchoring to the alternative carbon support and ii) an optimal electrode structure, as the latter is highly depending on the catalyst support structure, is challenging14,41. Addi-tional demands on the support material are sufficient electronic conductivity and effective processability in ink preparation. In general, performance and stability evaluation of electrodes based on new carbon supports assembled in MEAs at real fuel cell conditions is neces-sary16,42,43. The potential of utilising alternative materials to replace carbon as catalyst support has been explored recently98-100. The use of substoichiometric titanium oxide (TixOy) has been reported to provide promising corrosion resistance and catalytic performance98-99. Lately, it has been proposed that a nm-thick TiO2 film may operate as proton-conductor101. Also, Pt has been deposited onto TiO2/C composite materials. Addition of titanium oxide to a conventional Pt-C electrode has implied improved Pt utilisation102-103, and stability104, thus composite electrodes are highly interesting to study.


19
Chapter 2
Scope of the Thesis The aim of this work is to address the challenge of designing membrane electrode assemblies (MEAs) based on new materials. The scope is related to overcoming the cost and durability obstacles of the PEMFC technology. To meet the cost reduction demand, the component costs should be reduced, which includes efficient catalyst use and recycling. Additionally, system operation at elevated temperatures, i.e. up to 120 °C, would allow flexibility in terms of hydrogen fuel purity, increased performance and reduced complexity of balance of plant components, and subsequently decreased system cost. However, elevated temperature operation sets high demands on the materials stability in the system. The demand on reduced materials cost and wide temperature range operation has raised the interest in alternative materials for replacing the current MEA components, such as the proton-conducting ionomers and the catalyst materials. Hydrocarbon ionomers have been stated as possible alternatives to the current commercial perfluorinated ionomers, which are costly and limited in performance and durability at elevated tempera-tures. Thus, novel ionomer membrane research has expanded extensively, however development of complete MEAs based on novel ionomers is only scarcely included in the materials research. The devel-opment and evaluation of integrated MEAs as units is essential as the complex interactions in the MEA are difficult to foresee from ex situ membrane studies alone. In this thesis the focus is incorporation of hydrocarbon ionomers, sulfonated polysulfones (sPSU) in particular, into complete MEAs. These sPSUs have previously been shown to possess suitable membrane characteristics and in this work the impact of integrating the hydrocarbon ionomer into the whole MEA is investigated in terms of electrode morphology, gas permeability, kinetics and fuel cell performance in a wide temperature range, 60-120 °C. The ionomer

CHAPTER 2 SCOPE OF THE THESIS
20
membrane morphology is crucial for the MEA performance, thus the hydrocarbon membrane morphology is studied in comparison to the commercial Nafion membrane. Nuclear magnetic resonance cryoporo-metry is a method allowing membranes to be examined in hydrated state, which is the usual state of fuel cell membranes during operation. The NMR signal is related to the amount of water freezing and melting in a given temperature range, enabling location of water in channels of various sizes and the method is employed as a complement to conven-tional methods for determination of membrane properties. The stability of the conventional catalyst support materials is limited during lifetime operation already at temperatures around 80 °C. At elevated temperatures, the degradation is accelerated further, becom-ing even more critical. Also, the direct contact of platinum (Pt) and carbon has been shown to contribute to carbon degradation. In this thesis the possibility of reducing carbon degradation by depositing Pt onto titanium dioxide while maintaining the same performance is explored by studying Pt-TiO2/C composite cathodes. In addition, electrodes based on Pt deposited onto graphitised carbon are studied. Overall, low catalyst loading, in accordance with the global R&D targets, is utilised throughout the work to reduce Pt-related costs.

21
Chapter 3
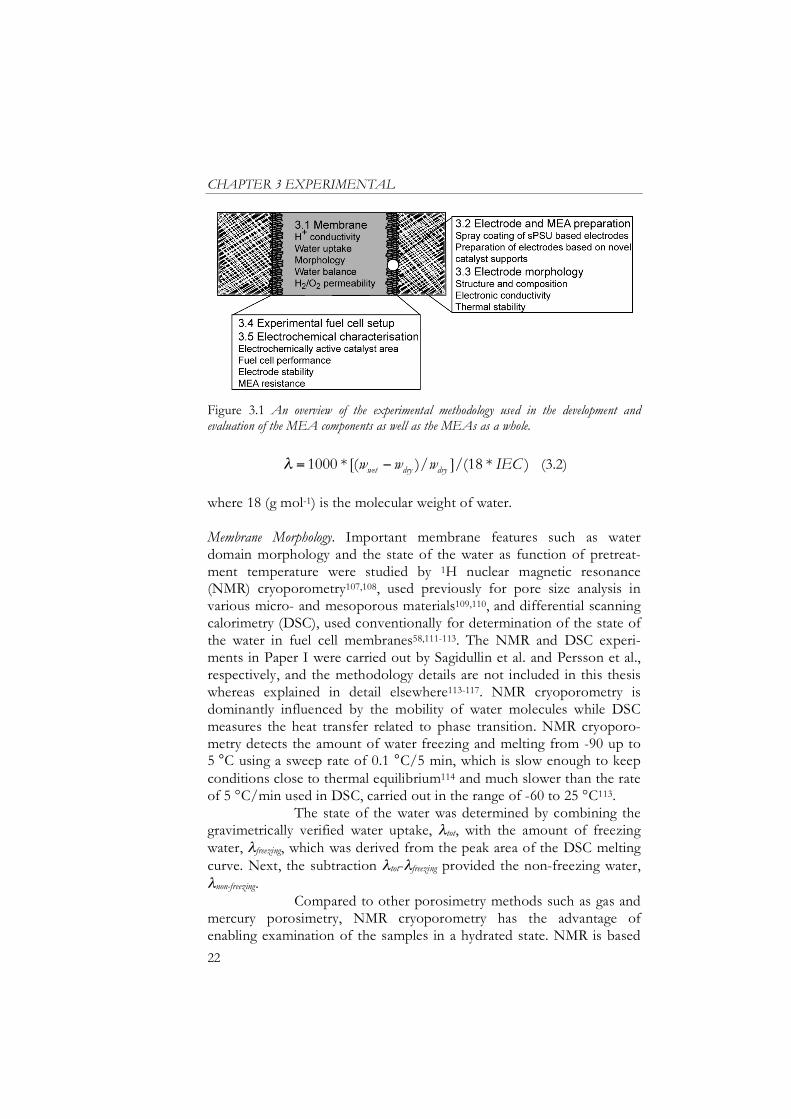
Experimental The used experimental methods are summarised below and an overview of the studied characteristics and utilised methodology is shown in Figure 3.1.
3.1 Membrane Characteristics
The sPSU ionomers, with molecular structures shown in Scheme 1.1, were synthesised by direct polycondensation. Puchner and Lafitte et al. carried out the ionomer synthesis, the development of organically modified ZrPO4 composite membranes, as well as the fundamental ionomer characterisation: i) determination of IEC, ii) thermo-gravimetric analysis (TGA) for measuring the temperature (T5 %) at which 5 % weight loss occurs, and iii) the in-plane proton conductivity (Papers II, III)105,106. Water Uptake. The membrane water uptake dependence on the tempera-ture at fully immersed conditions measured by determination of membrane weight in wet state (wwet) and in dry state (wdry). The water vapour uptake was measured in a gravimetric setup, where the mem-brane was allowed to hang on a thread, connected to a balance equipment, and placed in a humidity-controlled chamber. The water uptake was calculated as:
Water uptake = [(wwet wdry )/wdry ] *100 % (3.1)
Next the hydration number, , i.e. the number of water molecules per sulfonic acid unit, may be determined:
CHAPTER 3 EXPERIMENTAL
22
Figure 3.1 An overview of the experimental methodology used in the development and evaluation of the MEA components as well as the MEAs as a whole.
= 1000 * [(wwet wdry )/wdry ]/(18 * IEC ) (3.2)
where 18 (g mol-1) is the molecular weight of water. Membrane Morphology. Important membrane features such as water domain morphology and the state of the water as function of pretreat-ment temperature were studied by 1H nuclear magnetic resonance (NMR) cryoporometry107,108, used previously for pore size analysis in various micro- and mesoporous materials109,110, and differential scanning calorimetry (DSC), used conventionally for determination of the state of the water in fuel cell membranes58,111-113. The NMR and DSC experi-ments in Paper I were carried out by Sagidullin et al. and Persson et al., respectively, and the methodology details are not included in this thesis whereas explained in detail elsewhere113-117. NMR cryoporometry is dominantly influenced by the mobility of water molecules while DSC measures the heat transfer related to phase transition. NMR cryoporo-metry detects the amount of water freezing and melting from -90 up to 5 °C using a sweep rate of 0.1 °C/5 min, which is slow enough to keep conditions close to thermal equilibrium114 and much slower than the rate of 5 °C/min used in DSC, carried out in the range of -60 to 25 °C113. The state of the water was determined by combining the gravimetrically verified water uptake, tot, with the amount of freezing water, freezing, which was derived from the peak area of the DSC melting curve. Next, the subtraction tot- freezing provided the non-freezing water,
non-freezing. Compared to other porosimetry methods such as gas and mercury porosimetry, NMR cryoporometry has the advantage of enabling examination of the samples in a hydrated state. NMR is based

CHAPTER 3 EXPERIMENTAL
23
on the Gibbs-Thomson equation, which describes the relation between melting point depression T, i.e. difference between the melting tem-perature of bulk liquid and the actual temperature of the pore-filling liquid, and the pore size:
T =K
r (3.3)
where the constant K characterises the thermodynamic properties of the probe liquid114-117. Initially, the information obtained from NMR cryoporometry is the dependence of signal intensity I on T 107. Since the NMR signal intensity is directly proportional to the molten water volume, the melting curves I( T) may be transformed into the tempera-ture dependence of the specific pore volume of pores that contain molten water at T, as explained in Paper I 107. The data may be further converted into pore size distributions. In the pore size distributions, the position of the small radii peaks, relative the other samples, should be interpreted with caution due to i) the increasing influence of the pore wall with decreasing pore radius and ii) the assumption of a constant non-frozen water layer in the three ionomers, as a customary correction of approximately two water monolayers (~0.6 nm) was carried out116. Yet, the trends observed for the different materials are strongly indica-tive. Water Balance in the Membranes. The MEA water balance, illustrated in Figure 1.6, was studied in the fuel cell setup described below. Nafion and sPSU MEAs were evaluated at 80 and 100 °C, respectively. A symmetri-cal H2/H2 cell was used instead of the conventional O2/H2 fuel cell setup to avoid voltage losses due to the sluggish cathode reaction. In addition, excess gas was supplied to avoid mass-transport limitations. Thus, the potential scan revealed the ohmic resistance of the membrane, as the hardware resistances were constant with time and current. By varying the humidity of the supplied gases, water gradients may be produced. Membrane resistance dependence on symmetrical an-ode/cathode humidity variation was compared to the variation in membrane resistance when anode humidity was varied while the cathode humidity was kept constantly at 100 % RH. In the first case the symmet-rical RH resulted in a constant water profile through the MEA while in the latter case the asymmetrical RH produced a water gradient in the MEA, thus triggering water back diffusion from cathode to anode. This method is considered an in situ tool for evaluating the capability of back-diffusion, i.e. selfhumidification ability, in the membrane.

CHAPTER 3 EXPERIMENTAL
24
H2/O2 Permeability in the Membranes. The gas permeability in the mem-branes was determined by measuring the crossover current of H2 oxidation and O2 reduction, respectively, at the working electrode (WE) when either H2 or O2 was fed to the counter electrode (CE) and N2 was fed to the WE. The measurements were carried out on MEAs mounted in a fuel cell setup, described below, during a slow potential scan. The overpotential needed for reaching the limiting current in the O2 cross-over measurements was significantly higher than in the H2 crossover measurements, resulting in a larger error margin for the O2 measure-ments. The CE reaction for the H2 analysis was H2 evolution from H+, while the O2 analysis involved a CE reaction of O2 evolution from H2O but most likely also carbon oxidation, thus the O2 measurement should be avoided in MEA lifetime testing.
3.2 Electrode and MEA Preparation Spray Coating of sPSU Based Electrodes. Electrodes were prepared by spray coating of a series of inks, in which i) the sPSU ionomer content, ii) solvent systems, or iii) the incorporated ionomer (sPSU P50, sPSU A70, both shown in Scheme 1.1, or Nafion), were varied. The sPSU inks were prepared by adding sPSU ionomer, dissolved in dimethylacetamide (DMAc), to 20 % Pt/Vulcan XC-72. Next, an appropriate amount of additional solvent was added to dilute the DMAc, thus membrane failure could be avoided during electrode application. The inks were ultrasoni-cated and stirred before sprayed onto the substrate. For MEA preparation, the cathode was applied onto the membrane and after drying the one-sided MEA, the anode was applied in the same manner on the opposite side, resulting in a CCM. The airbrushing procedure and catalyst loading determination have been described previously31. The Pt loading was ~0.1 mg cm-2 in all electrodes and the electrode area was ~1 cm2, which assured a study where dimensional effects, such as uneven gas distribution over the electrode area, could be disregarded. Next, the sPSU MEAs were ion exchanged in boiling dilute acid and rinsed thoroughly in water; the MEAs assembled with GDLs are shown in Figure 3.2. Preparation of Electrodes Based on Novel Catalyst Supports. The inks were prepared by adding Nafion solution to Pt deposited onto different catalyst supports. The preparation of the Pt-support samples was carried out by Wikander et al.118. The samples consisted of i) TiO2 as catalyst support mixed with carbon in a composite material as well as ii) Pt deposited onto graphitised carbon (surface area 120 m2 g-1 compared to

CHAPTER 3 EXPERIMENTAL
25
the ~230 m2 g-1 surface area of conventional carbon black). The inks were ultrasonicated, stirred and pipetted onto heated Nafion membranes. The pipetting method is a fast electrode-preparation method compared to spray coating, thus suitable for fast screening of catalyst materials118. The porosity is presumably lower compared to the spray-coated elec-trodes, and these electrodes are therefore considered to be unoptimised for operation at high currents. A commercial GDE, serving as CE, was hot-pressed onto the opposite side of the membrane.
3.3 Electrode Morphology Structure and Composition of Electrodes and Catalyst Supports. SEM was used to study the cross-sections of the sPSU electrodes in terms of investigating the electrode structure and thickness. The overall porosity was deter-mined by relating the calculated compact thickness of the electrode to the thickness determined from micrographs. Transmission electron microscopy (TEM) and SEM-EDX analysis on various catalyst support materials, carried out by Wikander et al., were used for determination of the theoretical geometrical area of the Pt nanoparticles, the elemental composition and Pt loading of the prepared materials. N2 gas porosimetry was carried out on the sPSU-based electrodes and on the novel catalyst support materials in cooperation with Wikander et al. The specific surface area was determined by BET analysis. The primary pore area and pore size distributions were calcu-lated using the BJH desorption model119,120. Electrode Electronic Conductivity. The electronic conductivity of the elec-trodes was determined by the four-probe van der Pauw method, described in detail elsewhere121.
Figure 3.2 The laboratory-scale sPSU and Nafion MEAs assembled between GDLs

CHAPTER 3 EXPERIMENTAL
26
Thermal Stability of Catalyst-Support Material. The stability of catalyst supports was evaluated by studying the thermal stability in air according to a method, which demonstrated a high agreement with an accelerated electrochemical degradation test46. The samples were kept in air at 170 °C and later at 210 °C to further accelerate the test and the weight change was noted throughout the period.
3.4 Experimental Fuel Cell Setup For the electrochemical measurements either an in-house fuel cell setup, previously described by Ihonen et al.122,123, or a commercial fuel cell setup, provided by Fuel Cell Technologies Inc., was utilised. Both setups are shown in Figure 3.3. The advantage of the in-house fuel cell is the possibility of controlling the clamping pressure over the sample by using movable current collectors. An air-pressurised regulator, shown in Figure 3.3a, controlled the clamping pressure, and the pressure on the MEA could be kept constant through a whole measurements series. The drawback of this setup is the difficulty of firm pressurisation of the cell environment, which is related to the sealings of the movable current collectors. Therefore, a commercial fuel cell was used for most of the high temperature measurements, where pressurisation was needed for fully humidified conditions at >100 °C. In the commercial hardware, the pressure on the MEA was determined by the thickness of gaskets and the momentum force with which the cell was pressed together.
Figure 3.3 The laboratory fuel cell test stations, a) the in-house setup with the clamping pressure regulation and b) the commercial setup with the cell pressure manometers in the gas outlets.

CHAPTER 3 EXPERIMENTAL
27
Consequently, the cell resistance was slightly higher due to higher contact resistance than in the in-house hardware. At pressurised condi-tions, the total pressure in the cell, ptot, controlled by vents in the outlet pipes as shown in Figure 3.3b, corresponded to ptot = pgas+pwater, where pgas is the partial pressure of reactant gases and pwater is the partial pressure of water, which increases with temperature. Excess reactants, i.e. high stoichiometry, were used in all experiments. The electrochemical measurements were carried out using either a Solartron 1287 potentiostat with Solartron 1255 Frequency Response Analyzer or a PAR 273A potentiostat controlled by Corrware and Z Plot software.
3.5 Electrochemical Characterisation Electrochemically Active Catalyst Area – Cyclic Voltammetry. Determination of the electrochemically active catalyst area was carried out by N2 cyclic voltammetry, the anode was fed with 5 % H2 to reduce crossover effects118. The area of the hydrogen desorption peak was estimated and the corresponding electrochemically active area was calculated by assuming a hydrogen monolayer on Pt with a charge of 210 C cm-2. The double layer charging and discharging of the carbon surface is visible in the range of ~0.4-0.6 V and the change in the oxidation of support material and active surface groups, e.g. the hydroquinone-quinone redox couple, is detectable in this voltage range47. Fuel Cell Performance – Polarisation Measurements and Electrochemical Impedance Spectroscopy (EIS). Fuel cell polarisation curves were recorded with O2 supplied to the cathode. The H2 anode CE was employed as reference electrode (RE) in all measurements. The MEAs were activated by voltage cycling, and subsequently, steady state polarisation curves were recorded. EIS is a transient method where the impedance, i.e. the frequency-dependent resistance, is measured. A small perturbation in current (or voltage) is applied around a steady state current (or a voltage), as is presented in the schematic inset in Figure 3.4. The impedance data are presented in a typical Nyquist plot, also shown in Figure 3.4. The perturbation is 5 % of the direct current density, idc. By varying the perturbation frequency, processes with different time constants may be distinguished. Impedance at varying idc will also enable differentiation of processes; the impedance is dominated by kinetics at low idc, whereas the impedance is mostly related to mass transport at higher idc124. EIS was performed in the frequency range from 100 kHz to 20 mHz under galvanostatic control. Galvanostatic control was used due to the direct

CHAPTER 3 EXPERIMENTAL
28
Figure 3.4 A fuel cell polarisation curve and the electrochemical impedance spectroscopy (EIS), carried out around different direct current densities, idc, are shown. The inset illustrates the variation in perturbation frequency and the resulting EIS Nyquist plot, where the complex values, i.e. the combination of the imaginary and real parts, of the frequency-dependent impedance are plotted.
relation between current and water production at the cathode. A galvanostatic measurement at a given idc was carried out before recording the impedance spectra at the given idc. The limiting proton conductivity is detected by a characteristic 45° slope in the high frequency range125. The longer the extension of this slope, the more the proton conductivity governs the impedance response. The ohmic resistance in the cell is determined by the high frequency intercept. Electrode Double Layer Capacitance. The double layer capacitance for sPSU electrodes was measured by applying short current pulses to the cell with N2 passing over the WE and 5% H2 in Ar passing over the CE/RE. The linear potential gradient, measured over a 2-second period, was propor-tional to the double layer capacitance as proposed earlier by Gode et al.31.
Electrochemical Electrode Stability. The catalyst support stability was evalu-ated at 80 °C and 100 % RH by an accelerated test, in which a potentiostatic measurement at 1.25 V vs RHE during 100 h was carried out. As mentioned before, a 1.2 V potentiostatic measurement for 100 h

CHAPTER 3 EXPERIMENTAL
29
has been proposed to relate rather well to 300 000 start up/shut down cycles, which an automotive FC stack experiences during the lifetime16. The potentiostatic measurement was interrupted during the 100 h period as cyclic voltammetry as well as polarisation curves were recorded to analyse the electrode degradation. Cell Resistance – iR Correction Measurements. The total resistance of the cell, Rtot, is the sum of different resistances:
Rtot = Relec + Rmembrane + Rinterface (3.4)
where Relec is the electronic resistance in the cell hardware and GDLs and Rmembrane is the membrane resistance. Rinterface is the resistance related to the interface between the membrane and the electrodes. This parameter is generally regarded as a good indication of the degree of integration in the MEA62,89-92. The total resistance of the cell was determined either by i) the current interrupt (CI) method carried out by the potentiostat, ii) high frequency resistance (HFR) in EIS or iii) potential scan in a symmetrical H2 cell. For the CI measurements, control measurements were carried out by EIS. The two methods were found to be in good agreement for the sPSU-based MEAs run at high humidity conditions. The EIS HFR determination was appropriate for cell resistance verification; the resistance was extracted from the 50-25 kHz frequency range in the impedance analysis. Nevertheless, the measurements were less stable at high current densities (>600 mA cm-2) especially in pressurised cells and therefore impedance measurements became more unreliable due to the susceptibility to minor variation in current. Thus, the symmetrical H2 cell was found to be most suitable for cell resistance determination in a wide current range. The polarisation curves measured in the symmetrical H2 cell are related to the ohmic resistance of the cell due to fast electrode reactions, as discussed in the section on the water balance study. The ohmic resistance determination in a H2 cell is unattainable simultane-ously with fuel cell polarisation curves, and the cathode has to be purged with N2 before change of gas, making the H2 method time-consuming compared to the EIS.


31
Chapter 4
Results and Discussion
4.1 Hydrocarbon Ionomer Membrane Characteristics Fundamental sPSU Characteristics. The sPSU membranes, used in this work, were fundamentally characterised by Puchner and Lafitte; the thermal stability, Tg, and ion-exchange capacity, IEC, are shown in Table 4.1 and the in-plane proton conductivity dependence on temperature is listed in Table 4.2. The sPSU-A70 and sPSU-P50 ionomers are naturally different in terms of proton conductivity due to the different IEC. Table 4.2 shows the through-plane conductivity originating from the resistance of the fuel-cell tested MEAs. The through-plane conductivity of the sPSU membranes is high compared to the in-plane conductivity in the pristine sPSU membranes, most likely due to the pretreatment of the MEA membranes in boiling acid126. In contrast, the Nafion membranes have low through-plane conductivity compared to the in-plane conductivity, which may be due to differing membrane history, e.g. less optimised structures at high temperatures after acid pretreatment, as well as anisotropy in the extruded membrane57,66. Furthermore, disagreements in conductivity, as different methods are used, have been reported127,128. Generally for the sPSUs, a rather high IEC is required to achieve sufficient proton conductivity, however, the comparison with Nafion should be carried out being aware of the difference in density; assumed
Table 4.1 The fundamental characteristics of the sPSU ionomers compared to Nafion
Water uptake/(%) [H+]est (a)/(M) Ionomer
Tg,5 %
/(°C) IEC
/(meq g-1) 20 °C 80 °C 25 °C 80 °C sPSU A70 287 1.45 51 120 1 0.7 sPSU P50 298 0.95 18 32 0.8 0.7
Nafion 336 0.91 21 34 1.3 1.1 (a) [H+]est=(IEC * Densitywater * Xwater volume fraction, wet membrane)/Water uptake (%)*100 111
CHAPTER 4 RESULTS AND DISCUSSION
32
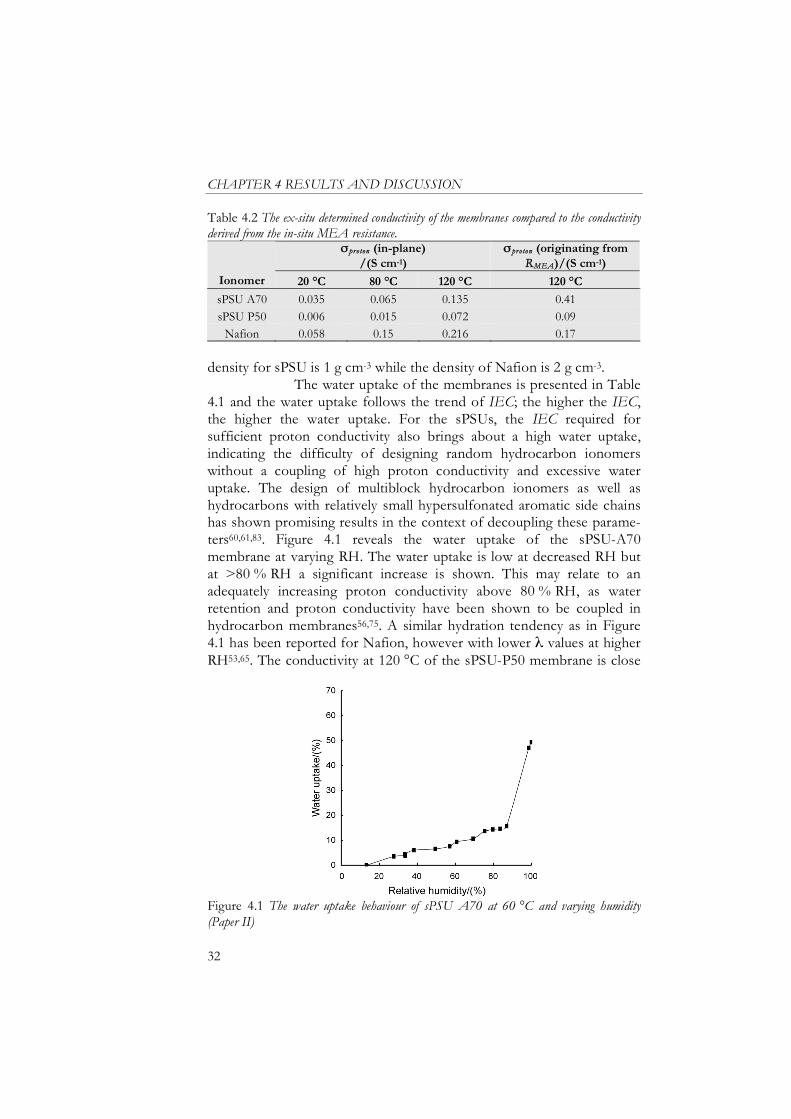
Table 4.2 The ex-situ determined conductivity of the membranes compared to the conductivity derived from the in-situ MEA resistance.
proton (in-plane) /(S cm-1)
proton (originating from RMEA)/(S cm-1)
Ionomer 20 °C 80 °C 120 °C 120 °C
sPSU A70 0.035 0.065 0.135 0.41
sPSU P50 0.006 0.015 0.072 0.09
Nafion 0.058 0.15 0.216 0.17
density for sPSU is 1 g cm-3 while the density of Nafion is 2 g cm-3. The water uptake of the membranes is presented in Table 4.1 and the water uptake follows the trend of IEC; the higher the IEC, the higher the water uptake. For the sPSUs, the IEC required for sufficient proton conductivity also brings about a high water uptake, indicating the difficulty of designing random hydrocarbon ionomers without a coupling of high proton conductivity and excessive water uptake. The design of multiblock hydrocarbon ionomers as well as hydrocarbons with relatively small hypersulfonated aromatic side chains has shown promising results in the context of decoupling these parame-ters60,61,83. Figure 4.1 reveals the water uptake of the sPSU-A70 membrane at varying RH. The water uptake is low at decreased RH but at >80 % RH a significant increase is shown. This may relate to an adequately increasing proton conductivity above 80 % RH, as water retention and proton conductivity have been shown to be coupled in hydrocarbon membranes56,75. A similar hydration tendency as in Figure 4.1 has been reported for Nafion, however with lower values at higher RH53,65. The conductivity at 120 °C of the sPSU-P50 membrane is close
Figure 4.1 The water uptake behaviour of sPSU A70 at 60 °C and varying humidity (Paper II)
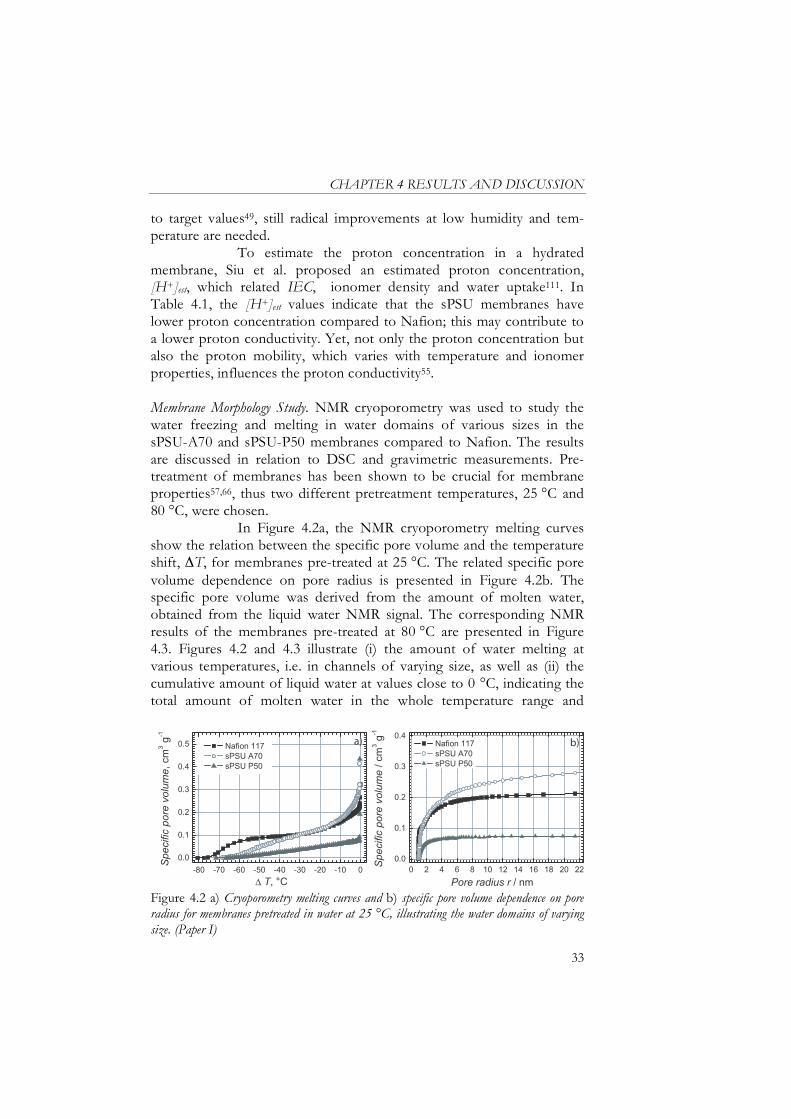
CHAPTER 4 RESULTS AND DISCUSSION
33
to target values49, still radical improvements at low humidity and tem-perature are needed. To estimate the proton concentration in a hydrated membrane, Siu et al. proposed an estimated proton concentration, [H+]est, which related IEC, ionomer density and water uptake111. In Table 4.1, the [H+]est values indicate that the sPSU membranes have lower proton concentration compared to Nafion; this may contribute to a lower proton conductivity. Yet, not only the proton concentration but also the proton mobility, which varies with temperature and ionomer properties, influences the proton conductivity55. Membrane Morphology Study. NMR cryoporometry was used to study the water freezing and melting in water domains of various sizes in the sPSU-A70 and sPSU-P50 membranes compared to Nafion. The results are discussed in relation to DSC and gravimetric measurements. Pre-treatment of membranes has been shown to be crucial for membrane properties57,66, thus two different pretreatment temperatures, 25 °C and 80 °C, were chosen. In Figure 4.2a, the NMR cryoporometry melting curves show the relation between the specific pore volume and the temperature shift, T, for membranes pre-treated at 25 °C. The related specific pore volume dependence on pore radius is presented in Figure 4.2b. The specific pore volume was derived from the amount of molten water, obtained from the liquid water NMR signal. The corresponding NMR results of the membranes pre-treated at 80 °C are presented in Figure 4.3. Figures 4.2 and 4.3 illustrate (i) the amount of water melting at various temperatures, i.e. in channels of varying size, as well as (ii) the cumulative amount of liquid water at values close to 0 °C, indicating the total amount of molten water in the whole temperature range and
a) b)
Figure 4.2 a) Cryoporometry melting curves and b) specific pore volume dependence on pore radius for membranes pretreated in water at 25 °C, illustrating the water domains of varying size. (Paper I)

CHAPTER 4 RESULTS AND DISCUSSION
34
b) a)
Figure 4.3 a) Cryoporometry melting curves and b) specific pore volume dependence on pore radius for membranes pretreated in water at 80 °C, illustrating water domains of varying size. (Paper I)
providing the total water uptake and values listed in Table 4.3. The derived pore size distributions for the membranes are given in Figure 4.4. The accuracy of the data is limited by two effects; firstly, the water, most strongly associated to the polymer matrix, may have a non-freezing nature even at T < -81 °C and is thus not included in the detected amount of water. Secondly, water in pores larger than ~22 nm, corresponding to T > -1.1 °C, is excluded due to difficulties in distin-guishing between the melting of water in the largest pores and the melting of bulk water in the NMR tube. It is worthwhile noting that repeated freezing-melting cycles showed no significant variation, demonstrating that most of the water remained in the membrane during the temperature cycling. In Table 4.4, the data based on the DSC analysis is shown; the non-freezing water is determined by subtracting the gravimetrically determined water uptake with the freezing water originating from DSC. Table 4.3 Water uptake and related values for sPSU-A70, sPSU-P50 and Nafion
membranes
Water uptake (a)/(%) (b) Ionomer
Pretreatment Twat er /(°C) r 22 nm r < 1.5 nm r 22 nm r < 1.5 nm
sPSU A70 25 29 10 11 4
sPSU A70 80 94 18 36 7
sPSU P50 25 8 3 5 2
sPSU P50 80 34 16 20 9
Nafion 25 21 10 13 6
Nafion 80 34 14 21 9 (a) Determined from the NMR cryoporometry melting curves at the given pore radius. (b) Based on the cumulative water uptake at the given pore radius.
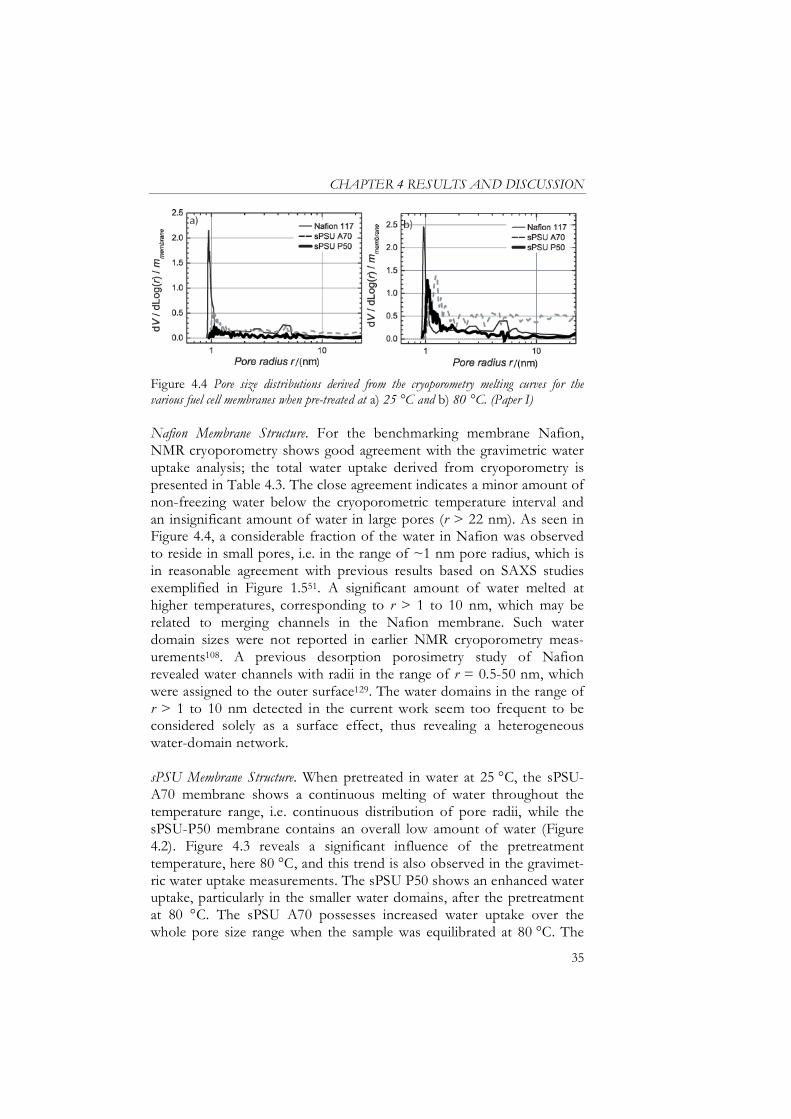
CHAPTER 4 RESULTS AND DISCUSSION
35
Figure 4.4 Pore size distributions derived from the cryoporometry melting curves for the various fuel cell membranes when pre-treated at a) 25 °C and b) 80 °C. (Paper I)
Nafion Membrane Structure. For the benchmarking membrane Nafion, NMR cryoporometry shows good agreement with the gravimetric water uptake analysis; the total water uptake derived from cryoporometry is presented in Table 4.3. The close agreement indicates a minor amount of non-freezing water below the cryoporometric temperature interval and an insignificant amount of water in large pores (r > 22 nm). As seen in Figure 4.4, a considerable fraction of the water in Nafion was observed to reside in small pores, i.e. in the range of ~1 nm pore radius, which is in reasonable agreement with previous results based on SAXS studies exemplified in Figure 1.551. A significant amount of water melted at higher temperatures, corresponding to r > 1 to 10 nm, which may be related to merging channels in the Nafion membrane. Such water domain sizes were not reported in earlier NMR cryoporometry meas-urements108. A previous desorption porosimetry study of Nafion revealed water channels with radii in the range of r = 0.5-50 nm, which were assigned to the outer surface129. The water domains in the range of r > 1 to 10 nm detected in the current work seem too frequent to be considered solely as a surface effect, thus revealing a heterogeneous water-domain network. sPSU Membrane Structure. When pretreated in water at 25 °C, the sPSU-A70 membrane shows a continuous melting of water throughout the temperature range, i.e. continuous distribution of pore radii, while the sPSU-P50 membrane contains an overall low amount of water (Figure 4.2). Figure 4.3 reveals a significant influence of the pretreatment temperature, here 80 °C, and this trend is also observed in the gravimet-ric water uptake measurements. The sPSU P50 shows an enhanced water uptake, particularly in the smaller water domains, after the pretreatment at 80 °C. The sPSU A70 possesses increased water uptake over the whole pore size range when the sample was equilibrated at 80 °C. The

CHAPTER 4 RESULTS AND DISCUSSION
36
increased occurrence of large water domains and the observed shift in the position of the peak in the range of r ~1 nm are associated with the high hydrophilicity, excessive water uptake and observed low mechanical stability of the sPSU-A70 membrane. For sPSU P50, the dominating peak is in the range of r ~1 nm. The total amount of water located in the membranes, when pretreated at 25 °C, is highest for sPSU A70, followed by Nafion and then by sPSU P50, as listed in Table 4.3. For the membranes pretreated at 80 °C a comparable cumulative water content is observed for Nafion and sPSU P50. The water uptake in pores r <1.5 nm, included in Table 4.3, is considered as a measure of the fraction of water in the small pores. Comparison of the (r <1.5 nm) values with the (r
22 nm) values reveals that only a part of the water in the membranes, at the most ~50 %, is located in the smaller pores. An evaluation of the water uptake derived from gravimet-ric measurements (Table 4.1) and cryoporometry (Table 4.3) reveals a discrepancy between the two methods for the sPSU-A70 membranes. This is likely due to the occurrence of pores exceeding the instrumental limit of detectable pores, which is also supported by the positive slopes for r > 20 nm in Figures 4.2 and 4.3. The water melting characteristics of sPSU A70 in the DSC analysis, presented in Paper I, show a large and rather broad melting peak close to 0 °C suggesting a significant amount of freezing water, which is also revealed in Table 4.4. This water may be related to the water freezing in the large water domains also detected by NMR cryoporometry. The DSC analysis for the sPSU-P50 membrane when pre-treated at 80 °C indicates a large fraction of non-freezing water whereas the cryoporometry reveals a significant fraction of freezing water. Due to the limitations of DSC, e.g. dependency on sample preparation and the gravimetric measurements as well as high scan rate, the results should be interpreted with caution, as has been discussed recently112. Yet, the DSC results on sPSU P50 may possibly be inter-preted as a confirmation of the large fraction of small channels that are detected by NMR cryoporometry but not by DSC, which detects the rapidly freezing water due to the fast temperature scan. Table 4.4 The state of the water in sPSU-A70 and sPSU-P50 membranes as derived from DSC.
Ionomer Pretreatment Twater /(°C) to t(a) f r eezing
(b) non- f r eezing(c)
sPSU A70 80 46 33 13
sPSU P50 80 19 1 18 (a) Based on gravimetrically determined water uptake reported in Table 4.1 (b) Based on integration of DSC melting peak (c) Calculated as total water - freezing water

CHAPTER 4 RESULTS AND DISCUSSION
37
Water Balance in the Membranes. The water balance measurements were carried out in a H2/H2 cell, thus detecting the ohmic resistance of the MEA, as presented in Figures 4.5a and c. Protons are transported from the anode through the membrane to the cathode as in the true H2/O2 fuel cell. However, H2O is not produced in the cathode reaction, therefore the asymmetrical humidity cell, i.e. with 100 % RH on cathode side and decreased anode humidity, mimics a low-humidity H2/O2 cell, where the water production on the cathode side creates a water concen-tration gradient through the membrane. As the humidity is varied symmetrically for the Nafion-based MEA, the resistance, i.e. the slope in Figure 4.5a, of the Nafion 115 membrane increased significantly at humidity < 98 % RH, and this was also reflected in the fuel cell performance at the same conditions shown in Figure 4.5b. In addition, the slope increases at higher currents, showing that the resistance is not constant in the current density range of 0-3 A cm-2. The increased membrane resistance is related to dry-out of the membrane, as discussed previously69-71. In contrast to the symmetri-
Figure 4.5 Water balance measurements carried out on Nafion 115 MEAs as humidity is varied symmetrically on cathode and anode (c/a) side in a) H2/H2 cell and b) H2/O2 cell, and as anode humidity is varied while cathode humidity is constantly 100 % RH in c) H2/H2 cell and d) H2/O2 cell.

CHAPTER 4 RESULTS AND DISCUSSION
38
cal RH tests, as anode humidity was varied while cathode humidity was kept at 100 % RH the resistance of the membrane was remained unchanged above 80 % RH, as is demonstrated in Figure 4.5c. This is also reflected in the fuel cell performance at the corresponding condi-tions shown in Figure 4.5d. An efficient back diffusion of water from the cathode to the anode in the Nafion membrane55 maintains the mem-brane humidified at lower humidity than in the previous case of the symmetrical humidity cell. An asymmetrical-humidity analysis was carried out on an sPSU-P50 MEA, based on a thinner membrane (90 m) than that of the Nafion MEA (125 m). Although cathode humidity is kept constant at 100 % RH and the anode humidity is reduced only slightly, a significant increase in resistance and an amplification in resistance at higher currents are revealed in Figure 4.6a, which is also reflected in the fuel cell performance illustrated in Figure 4.6b. This strongly implies that the back transport of water is low in the sPSU-P50 membrane, resulting in a low degree of self-humidification. H2/O2 Permeability in the Membranes. Figure 4.7 illustrates the gas perme-ability related to temperature in sPSU-P50 and Nafion membranes in assembled MEAs at fully humidified conditions. The O2 permeability in sPSU P50 at 60-120 °C may be compared to the O2 permeability values, which were previously reported for similar hydrocarbon ionomers, however measured in a microelectrode setup at temperatures in the range of 30-70 °C130. The permeability for Nafion at 60 °C is in the same range as previously reported data determined at 35-75 % RH in a microelec-trode setup131. The 60 % lower gas crossover in sPSU P50 than in Nafion in the temperature range of 60-120 °C is favourable as decreased gas permeability in the membrane has been shown to improve MEA lifetime63,64.
Figure 4.6 Water balance measurements carried out in a) H2/H2 cell and b) H2/O2 cell as only anode humidity is varied while cathode humidity is constantly 100 % RH.

CHAPTER 4 RESULTS AND DISCUSSION
39
Figure 4.7 Temperature dependence of the gas crossover in sPSU-P50 and Nafion (Paper III)
Considering the gas permeability of the ionomer incorporated in the electrode, a proposed ionomer-film model demonstrates that the O2 permeability across a 2 nm thick electrode ionomer film may be ne-glected when exceeding 1*10-14 mol cm-1 s-1 atm-1 (Table 1.1). This minimum value, and subsequent values for longer transport lengths in agglomerates, is significantly lower than the permeability for the sPSU P50 in Figure 4.7. Thus, as a rather homogeneous distribution of the ionomer in the electrodes is assumed, the gas permeability in the sPSU electrodes is not contributing to the limitations of the MEA at high humidity in the range of 60-120 °C. These results are controversial, as hydrocarbon incorporation in the electrode has been expected to induce significant permeability limitations compared to Nafion21.
4.2 Electrodes Based on sPSU Hydrocarbon Ionomers The sPSU Electrode Morphology. The SEM images of the electrodes with varying sPSU-A70 content are shown in Figure 4.8. These images show highly porous electrodes when the ionomer content is below 20 wt%, whereas the porosity is drastically reduced in the electrodes with >30 wt% sPSU, which is also revealed in Figure 4.9, showing the dependence of ionomer content on the total BET surface area (4.9a) and the total porosity (4.9b) of the electrode. In addition, the pore size distributions in Figure 4.10a reveal the overall decrease in occurrence of pores with decreased ionomer content. As shown in Figure 4.9, the structures of the electrodes with ~25 wt% Nafion and ~20 wt% sPSU (based on isopropanol-water ink) are comparable, whereas a higher porosity has been reported for sPEEK-based electrodes93.

CHAPTER 4 RESULTS AND DISCUSSION
40
Figure 4.8 SEM images of sPSU electrodes with varying ionomer content, from left 5, 20, 30 and 40 wt% (Paper II)
As revealed in Figure 4.10a, the primary pore area, i.e. the area imparted by pores <10 nm, decreases drastically in the range of 0-20 wt% sPSU. Previously, a comparison of the pore size distribution of as-received 20 % Pt-C material and Pt-C/Nafion electrodes shows that the primary pores exist mainly between the carbon particles132. The detected primary pore volume decreases as the carbon forms agglomerates with added ionomer, thus indicating the degree of wetting of the electron-conducting phase in the electrodes. Subsequently, the decreased primary pore area implies a well-wetted electronic phase in electrodes with sPSU contents exceeding 20 wt%. The degree of the solubility of the ionomer in the ink is fundamental for the resulting electrode morphology; the use of poor solvents (in this work acetone/water and isopropanol/water for sPSU) results in colloidal inks whereas the use of good solvents (in this work
Figure 4.9 The dependence of ionomer content on a) the BET surface area and the area imparted by pores <10 nm, and b) the porosity of sPSU electrodes, prepared from different inks, compared to previously presented data of Nafion electrodes 31 (Paper II)

CHAPTER 4 RESULTS AND DISCUSSION
41
Figure 4.10 The pore size distributions for sPSU electrodes as a) the sPSU content and b) solvent systems are varied. The inset in b) shows area imparted by primary pores, d<10 nm. (Paper II)
DMAc for sPSU) results in inks in which the ionomer is completely dissolved35,36. Also, a low evaporation rate of the utilised solvent, i.e. DMAc in this study, may contribute to less-porous electrodes. The porosity is indeed lower for electrodes prepared from the DMAc-based ink, as illustrated in Figures 4.9b and 4.10b. This is due to the presence of a well-dissolved sPSU ionomer in the ink, covering the catalyst carbon surface efficiently, thus resulting in a low primary pore area for the DMAc-based electrodes, as shown in the inset of Figure 4.10b. The pore size distributions for electrodes with various ink solvents differ in the shift of the maximum of pore volume, which indicates some colloidal ionomer formation, illustrated schematically in Figure 1.4, in the inks based on poor solvents.

CHAPTER 4 RESULTS AND DISCUSSION
42
Electronic Conductivity of sPSU Electrodes. Considering the requirements for PEMFC applications, the electronic conductivity is sufficient (170-380 S m-1) in all sPSU electrodes, irrespectively of the sPSU content or the ink solvent, and the values are in the same range as previous reported results on Nafion electrodes31. Wetting of the Electronic Phase in sPSU Electrodes. The double layer capaci-tance for a fully wetted electronic phase of Vulcan XC-72 is approximately 4.5 F m-3 according to previous calculations31. Thus, the ~4 F m-3 double layer capacitance in the 10 wt% sPSU electrode indicates an electronic phase practically completely covered with iono-mer, which is in agreement with the porosimetry study indicating a fully wetted surface in 20 wt% sPSU electrodes. Measurements on sPSU electrodes deposited onto either the GDL or the membrane reveal a higher double layer capacitance for the electrode applied on the GDL. This indicates that a part of the carbon in the microporous layer of the GDL is covered by the ionomer, showing that electrodes applied onto the GDL might possess poor mass-transport properties due to the ionomer being present in the GDL, and consequently CCMs are pre-ferred. Previous studies on Nafion-based electrodes have shown that the more colloidal the ink, the less the wetting of the GDL37. Electrochemically Active Catalyst Area and Kinetics of the sPSU Electrodes. The influence of incorporation of sPSU into the electrode is shown in Figure 4.11, where the electrochemical impedance (EI) spectra for assembled MEAs at idc = 20 mA cm-2 indicate similar kinetics in the sPSU-P50 and Nafion electrodes at 120 °C at two humidity levels, as impedance at such
Figure 4.11 EI spectra recorded at idc = 20 mA cm-2 of sPSU and Nafion electrodes deposited onto Nafion membranes at 100 % and 80 % RH. (Paper III)

CHAPTER 4 RESULTS AND DISCUSSION
43
low currents is dominated by charge transfer (Figure 3.4). In addition, cyclic voltammetry measurements at 60 °C show comparable electro-chemically active areas for the Nafion electrode (27 m2 (g Pt)-1) and the sPSU-P50 electrode (24 m2 (g Pt)-1), when both electrodes were based on 20 % Pt-C from E-TEK Division. This may be related to the similar electrode structures of the 20-wt% sPSU and 25-wt% Nafion electrodes shown in Figure 4.9a. Furthermore, as compared to Nafion electrodes both analogous and lower Pt utilisation has been reported for sPEEK electrodes91,96, demonstrating the considerable influence of ink and electrode preparation. As indicated by the ~45° slope at high frequencies in Figure 4.11, an increased proton resistance in both electrodes, yet slightly higher in the sPSU electrode, is shown at 80 % RH, which was also indicated by Figure 4.1.
4.3 Fuel Cell Performance of MEAs Based on Hydrocarbon Ionomers The morphological and electrochemical characterisation of the sPSU electrodes, discussed above, indicates that with an optimised sPSU ionomer content, electrodes with morphology, electronic conductivity and catalyst utilisation comparable to that of the benchmarking Nafion electrode, are attainable. Next, integrated sPSU MEAs were studied as a whole. Influence of Cathodic sPSU Content. The electrochemical performance for MEAs with two different sPSU-A70 contents is presented in Figure 4.12a. The kinetic behaviour for the two cathodes is quite similar, which
Figure 4.12 sPSU-A70 MEA fuel cell performance as a) the sPSU content in the cathode and b) the temperature is varied. The losses due to iR losses are illustrated in b). (Paper II)

CHAPTER 4 RESULTS AND DISCUSSION
44
may indicate a comparable Pt utilisation, thus supporting the conclusions drawn from the porosimetry and double layer capacitance measurements considering the degree of sPSU wetting of Pt-C. Limitations at high currents occur in both sPSU cathodes, though the 20-wt% sPSU electrode reaches higher ORR currents when currents are normalised against the Pt loading. The sPSU content is not the only crucial parame-ter causing the mass-transport limitations in the sPSU MEAs as water production, high humidity and ionomer properties also contribute. Figure 4.12b presents the impact of iR correction on the polarisation curves for the sPSU-A70 MEA. Most polarisation curves shown in this work are iR corrected, thus illustrating the electrode losses. Influence of the sPSU Ion Exchange Capacity. The sPSU ionomers at two IEC were incorporated into MEAs and evaluated in the range of 60-120 °C at fully humidified conditions. In Figure 4.13, the iR-corrected steady state polarisation curves of the sPSU MEAs demonstrate a clear difference in fuel cell performance at 60 °C and high current density between the two sPSU MEAs. This was assigned to the difference in IEC, which influ-ences proton conductivity, permeability, and hydrophilicity of the ionomer in electrodes and membrane. The lower performance of sPSU-P50 MEA can most likely be assigned to the low proton conductivity. Considering the permeability, previously discussed permeability meas-urements indicate sufficient permeability for the sPSU-P50 electrodes. At 120 °C operation, the observed sPSU cathode flooding is not relieved by
Figure 4.13 H2/O2 polarisation curves at 60 and 120 °C for sPSU MEAs at two IECs. The Nafion-based MEA is presented as comparison. The cathodic Pt loading is 0.1 mg cm-2. (Paper III)

CHAPTER 4 RESULTS AND DISCUSSION
45
a decreased hydrophilicity of the incorporated ionomer. This is contra-dictory to predictions, which imply that incorporation of a hydrophilic ionomer into the electrode would increase electrode flooding21,91. A comparison of the sPSU MEAs with the Nafion MEA implies that both sPSU ionomers, irrespective of IEC, induce severe limitations in the MEA compared to the Nafion ionomer, as revealed in Figure 4.13. Influence of Membrane on MEA Characteristics. Membrane-induced limita-tions were studied by comparing the electrochemical properties of the sPSU-P50 electrodes deposited onto sPSU-P50 and Nafion membranes. Figure 4.14a illustrates the steady state polarisation curves and Figures 4.14b-c show the EI spectra, revealing a significant influence of the membrane present in the MEA on the fuel cell performance of the sPSU electrode. The impedance at idc=100-600 mA cm-2 is mainly related to the mass transport in the electrode; thus amplified mass-transport limitations in the sPSU electrode deposited onto the sPSU membrane are revealed. Figure 4.15 illustrates the iR-corrected polarisation curves at 60 and 120 °C and EI spectra recorded at idc=100 mA cm-2 for Nafion elec-trodes, deposited onto an sPSU-P50 membrane or a Nafion membrane. Similar to the observation for the sPSU electrodes, Figure 4.15 presents a considerable influence of the membrane present in the MEA on the Nafion electrode performance. An evaluation of Figures 4.14a and 4.15a reveals characteristics of the sPSU electrode, when deposited onto a Nafion membrane, similar to those of the Nafion MEA at 120 °C. As a comparison, these MEA performances approach the 0.2g Pt/kW target
Figure 4.14 Fuel cell performance at 60 and 120 °C of MEAs consisting of sPSU electrodes applied onto Nafion and sPSU membranes; a) iR-corrected H2/O2 polarisation curves and EI spectra recorded at b) idc = 100 mA cm-2 and c) idc = 600 mA cm-2. The cathodic Pt loading is 0.1 mg cm-2. (Paper III)
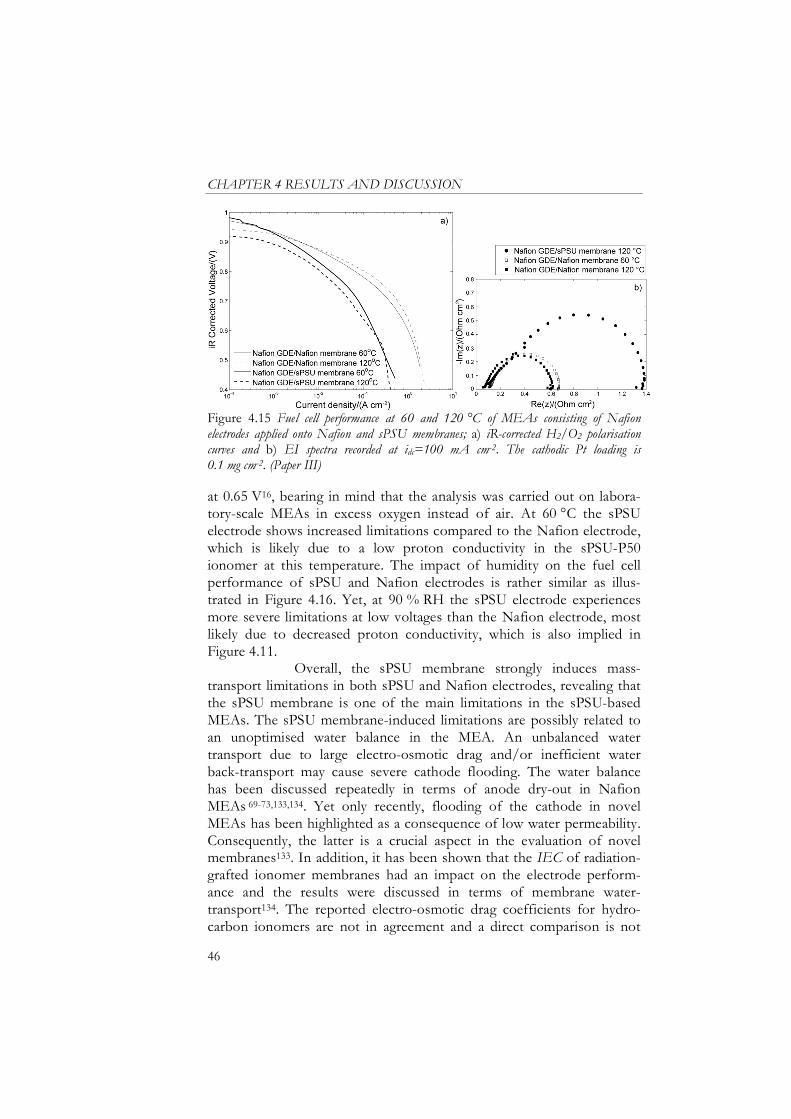
CHAPTER 4 RESULTS AND DISCUSSION
46
Figure 4.15 Fuel cell performance at 60 and 120 °C of MEAs consisting of Nafion electrodes applied onto Nafion and sPSU membranes; a) iR-corrected H2/O2 polarisation curves and b) EI spectra recorded at idc=100 mA cm-2. The cathodic Pt loading is 0.1 mg cm-2. (Paper III)
at 0.65 V16, bearing in mind that the analysis was carried out on labora-tory-scale MEAs in excess oxygen instead of air. At 60 °C the sPSU electrode shows increased limitations compared to the Nafion electrode, which is likely due to a low proton conductivity in the sPSU-P50 ionomer at this temperature. The impact of humidity on the fuel cell performance of sPSU and Nafion electrodes is rather similar as illus-trated in Figure 4.16. Yet, at 90 % RH the sPSU electrode experiences more severe limitations at low voltages than the Nafion electrode, most likely due to decreased proton conductivity, which is also implied in Figure 4.11. Overall, the sPSU membrane strongly induces mass-transport limitations in both sPSU and Nafion electrodes, revealing that the sPSU membrane is one of the main limitations in the sPSU-based MEAs. The sPSU membrane-induced limitations are possibly related to an unoptimised water balance in the MEA. An unbalanced water transport due to large electro-osmotic drag and/or inefficient water back-transport may cause severe cathode flooding. The water balance has been discussed repeatedly in terms of anode dry-out in Nafion MEAs 69-73,133,134. Yet only recently, flooding of the cathode in novel MEAs has been highlighted as a consequence of low water permeability. Consequently, the latter is a crucial aspect in the evaluation of novel membranes133. In addition, it has been shown that the IEC of radiation-grafted ionomer membranes had an impact on the electrode perform-ance and the results were discussed in terms of membrane water-transport134. The reported electro-osmotic drag coefficients for hydro-carbon ionomers are not in agreement and a direct comparison is not

CHAPTER 4 RESULTS AND DISCUSSION
47
Figure 4.16 The fuel cell performance at 120 °C varying humidity for sPSU and Nafion electrodes, when applied onto Nafion membranes. The cathodic Pt loading is 0.1 mg cm-2. (Paper III)
feasible due to differing water content and polymers in the studied membranes90,135. The low gas permeability of sPSU and the low metha-nol permeability of similar ionomers indicate decreased water perme-ability compared to that of Nafion56,58. In addition, the above discussed water balance measurements also demonstrate unoptimised water balance in the sPSU-P50 membrane compared to the Nafion membrane (Figures 4.5 and 4.6). Further, incorporation of various fractions of an organi-cally modified ZrPO4 composite material into the sPSU-P50
membrane106 was studied in terms of MEA performance as presented in Figure 4.17a; these composites have been proposed to improve low-humidity operation for Nafion-based membranes due to enhanced water retention19,66,76. In contrast to previous results, the incorporation of the composite into the sPSU-P50 membrane shows no significant improve-ment of MEA performance at reduced humidity, as illustrated in Figure 4.17b. Also, the MEA resistances are increased equally at reduced humidity. These observations show that the characteristics of the ionomer membrane, in which the composites are incorporated, are of relevance as composite membranes are developed. The inefficient water transport of the sPSU-P50 ionomer possibly influences the composite membranes as well, thus resulting in low water-retaining properties though composites are integrated. Still, the composite membranes possess improved mechanical characteristics compared to the pure

CHAPTER 4 RESULTS AND DISCUSSION
48
Figure 4.17 The impact of incorporation of composites in the sPSU-P50 MEAs as a) the composite content is varied and b) humidity is varied at 120 °C.
ionomer membranes as was also reported for composite Nafion mem-branes81. On the whole, no refined lifetime studies were carried out on the sPSU MEAs, yet during the fuel cell evaluation the sPSU-P50 MEAs were run 300 h in a wide temperature and voltage window without apparent membrane degradation. However, the electrochemi-cally active Pt area decreases to 18 m2 g-1 during high temperature operation, which is similar to an observed degradation after 500 h of operation at 80 °C50. Consequently, the utilised commercial catalysts are not meeting the stability requirements and the need for stable catalyst materials for high temperature operation is thus evident16,41,43. Cell Resistance. The cell resistance presented in Figure 4.18 shows related cell resistances for the sPSU membrane-based MEAs as well as for the
Figure 4.18 The cell resistance of the sPSU and Nafion MEAs (Paper III)
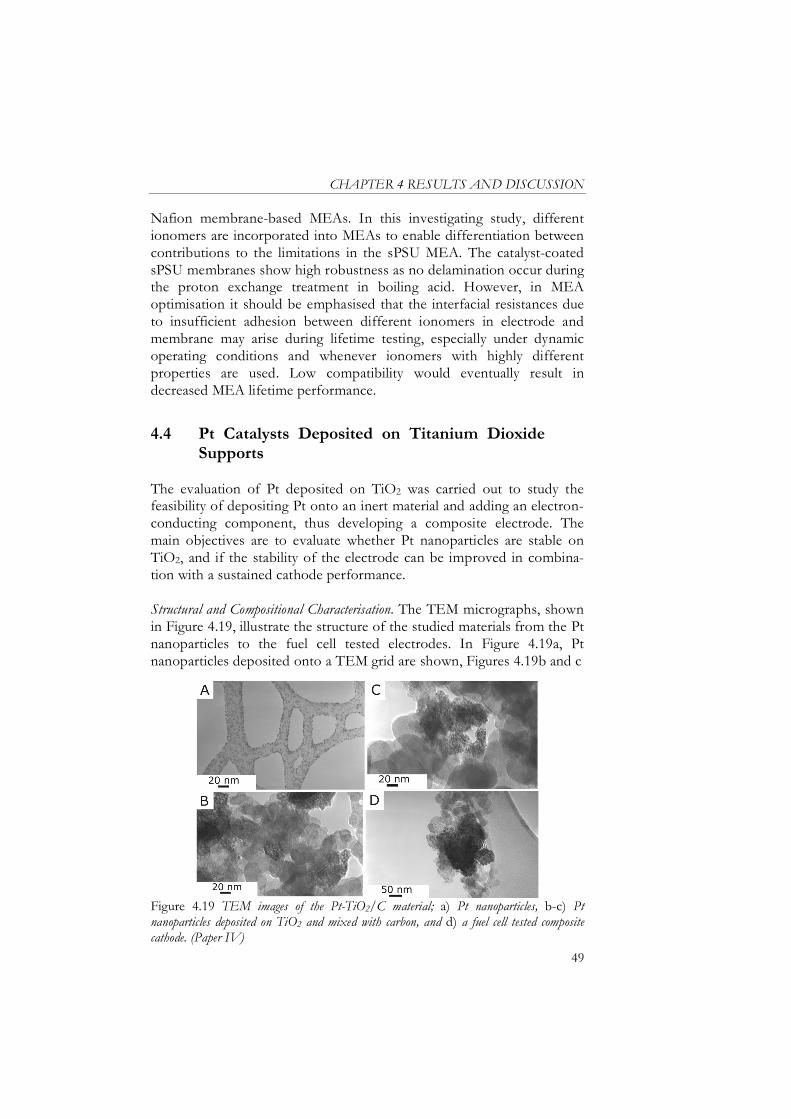
CHAPTER 4 RESULTS AND DISCUSSION
49
Nafion membrane-based MEAs. In this investigating study, different ionomers are incorporated into MEAs to enable differentiation between contributions to the limitations in the sPSU MEA. The catalyst-coated sPSU membranes show high robustness as no delamination occur during the proton exchange treatment in boiling acid. However, in MEA optimisation it should be emphasised that the interfacial resistances due to insufficient adhesion between different ionomers in electrode and membrane may arise during lifetime testing, especially under dynamic operating conditions and whenever ionomers with highly different properties are used. Low compatibility would eventually result in decreased MEA lifetime performance.
4.4 Pt Catalysts Deposited on Titanium Dioxide Supports The evaluation of Pt deposited on TiO2 was carried out to study the feasibility of depositing Pt onto an inert material and adding an electron-conducting component, thus developing a composite electrode. The main objectives are to evaluate whether Pt nanoparticles are stable on TiO2, and if the stability of the electrode can be improved in combina-tion with a sustained cathode performance. Structural and Compositional Characterisation. The TEM micrographs, shown in Figure 4.19, illustrate the structure of the studied materials from the Pt nanoparticles to the fuel cell tested electrodes. In Figure 4.19a, Pt nanoparticles deposited onto a TEM grid are shown, Figures 4.19b and c
Figure 4.19 TEM images of the Pt-TiO2/C material; a) Pt nanoparticles, b-c) Pt nanoparticles deposited on TiO2 and mixed with carbon, and d) a fuel cell tested composite cathode. (Paper IV)

CHAPTER 4 RESULTS AND DISCUSSION
50
show Pt-TiO2/C samples with 30 and 50 vol% carbon, respectively. The figures visualise the percolating carbon network in the electrodes, which contributes to the macroscopic electronic conductivity in the electrode, as well as the Pt-TiO2 aggregates, which are partly isolated from the electron-conducting carbon network, hence influencing the local electronic conductivity. The electrode morphology of the Pt-TiO2/C sample, before and after fuel cell testing, is illustrated in Figures 4.19c and d. The micrographs show well-dispersed Pt nanoparticles deposited on the anatase TiO2 with only a minor spill-over on the carbon as well as a minor migration of Pt in the sample during fuel cell operation. In contrast, analogous TEM micrographs of samples prepared using rutile TiO2 illustrate major spill-over of Pt nanoparticles from the rutile TiO2 to the carbon, revealing the importance of a support that enables a sufficient anchoring of Pt when developing stable Pt catalysts, as was previously highlighted14,41,43. The macroscopic electronic conductivity of the Pt-TiO2/C composite electrodes, containing 50 vol% carbon, is low (17-34 S m-1) compared to reported values for Pt-C based electrodes31 due to the low bulk electronic conductivity of TiO2. However, the electronic conductivity is not considered to be the limiting parameter in the Pt-TiO2/C composite electrodes since the electronic conductivity is significantly higher than reported proton conductivity for a typical GDE31. Yet, possible deficiency in local electron conductivity in the Pt- TiO2 aggregates is not detectable in the macroscopic electronic conduc-tivity measurements.
Figure 4.20 The thermal stability of Vulcan XC-72, Pt-Vulcan XC-72 and Pt-TiO2/C composite material. (Paper IV)

CHAPTER 4 RESULTS AND DISCUSSION
51
Thermal Stability of the Pt-TiO2/C Composite. The thermal stability of the 10 wt% Pt-TiO2/C composite, containing 50 vol% carbon, is high during thermal treatment for 1000 h at 170 °C followed by 4000 h at 210 °C as illustrated in Figure 4.20. The as-obtained Vulcan XC-72, em-ployed as reference sample, shows no trend in loss or gain of weight during the stability test period while the weight loss of 20 wt% Pt-Vulcan XC-72 is significant. Previously, consumed carbon fractions of ~0.2 for 20 wt% Pt-Vulcan XC-72 and ~0.1 for 10 wt% Pt-Vulcan XC-72 after 900 h at 195 ° were observed. A close agreement between the thermal stability method and an accelerated electrochemical stability tests has been reported46, therefore high thermal stability of the Pt-TiO2/C composite may possibly be an indication for high electrochemical stability. Furthermore, high electrochemical stability of Pt-TiOx/C electrodes has recently been reported104. Influence of Pt-TiO2:C Ratio on the Cathode Performance. Figure 4.21a shows the low oxygen reduction activity of the carbon-free Pt-TiO2 cathode, and this is assigned the limited macroscopic electron conductivity of TiO2. The fuel cell performance increases with carbon fraction, which is in agreement with the enhanced electrochemically active Pt area. The proposed reason for the improved performance due to increased carbon fraction is the establishment of a percolating electron-conducting network in the electrode, which results in an enhanced macroscopic electronic conductivity in the electrode. Nevertheless, also the cathode with 50 vol% carbon is limited at higher current density despite its sufficiently high macroscopic electronic conductivity. The TEM images in Figure 4.19 imply the percolating electron-conducting carbon network
Figure 4.21 The polarisation curves of Pt-TiO2 composite cathodes with varying a) carbon content and b) Pt content. The benchmarking sample Pt-C is shown as comparison. (Paper IV)

CHAPTER 4 RESULTS AND DISCUSSION
52
in the electrode as well as the presence of Pt particles in the TiO2 aggregates, which are isolated from electron transport, thus indicating that the electrodes are limited by insufficient local electronic conductiv-ity. Influence of Pt:TiO2 Ratio on the Cathode Performance. Figure 4.21b presents the fuel cell polarisation curves for cathodes with a constant 50 vol% carbon fraction and varying amounts of Pt deposited on TiO2, illustrat-ing the relation between increased Pt concentration on TiO2 and increased oxygen reduction current. This may be explained by enhanced local electronic conductivity, as the Pt-TiO2 aggregates are partly isolated from the percolating electron-conducting carbon network as seen in Figure 4.19. The likelihood of improved performance, due to a signifi-cant increase in the direct contact of Pt-C when the Pt:TiO2 ratio is increased, may be ruled out by the TEM examination, which illustrates a low degree of direct contact between Pt and C in the Pt-TiO2/C com-posite structure throughout the electrode series. The electrochemically active Pt area for the electrodes is compared in Table 4.5 to the total geometrical surface of the Pt nanoparticles based on the TEM analysis. Increased amount of Pt deposited on TiO2 enhances the electrochemi-cally active area in the cathode, however the Pt utilisation is low in all Pt-TiO2/Vulcan composite electrodes compared to the Pt-C sample. The electrochemically active area for the Pt-C reference sample is in agree-ment with previous results on similar materials that indicate low Pt utilisation118. Yet, the Pt-TiO2/C composite cathode with highest Pt:TiO2 ratio possesses a performance comparable to the Pt-C cathode, which may be related to a high fuel cell performance of Pt-TiOx/C electrodes104. Also, the Pt-TiOx/C electrodes were interestingly proposed to enhance the MEA selfhumidification at dry operating conditions104. Improvement of the Pt-TiO2/C cathode performance by electrode ink optimisation is expected since the ink compositions used so far have been optimised for Pt-C electrodes31. Table 4.5 The electrochemically active area and the geometrical Pt area in the Pt-TiO2/C composite electrodes
Pt content on TiO2 support/(wt%)
Electrochemically active Pt area(a)/(m2 (g Pt)-1)
Geometrical Pt area(b) /(m2 (g Pt)-1)
5 8 88 12 14 123 32 17 104
Pt-C sample (11 wt% Pt) 29 117 (a) Determined from the hydrogen desorption peak in the cyclic voltammograms (b) Calculated from the size histograms based on the TEM micrographs assuming spherical particle geometry

CHAPTER 4 RESULTS AND DISCUSSION
53
4.5 Pt Catalysts Deposited on Graphitised Carbon In addition to TiO2-based electrodes, evaluation of electrodes based on Pt deposited on graphitised carbon was carried out to study the feasibil-ity of depositing Pt onto alternative carbons in terms of Pt utilisation, fuel cell performance and stability. The graphitised low-surface-area carbon electrodes as well as conventional electrodes, based on Pt deposited onto carbon black, were evaluated in an accelerated electro-chemical degradation test, i.e. a potentiostatic measurement at 1.25 V for 100 h. Figure 4.22 reveals a decrease in electrochemically active Pt area during the 100 h degradation test irrespectively of utilised carbon support, which is in agreement with previously reported Pt loss during ~1.2 V potentiostatic tests43,48. The decreased electrochemically active Pt area and TEM images of fuel cell tested samples imply that the Pt nanoparticles deposited on the evaluated support materials are not sufficiently stable, thus resulting in Pt particle sintering. Figure 4.22b reveals an initially low electrochemically active Pt area in the graphitised carbon electrode compared to the carbon black electrode (Figure 4.22a), this may be explained by particle sintering during MEA preparation and conditioning as the original particle size is rather small (~2.4 nm)118. The oxidation of the carbon surface is demonstrated by the magnitude of the double layer currents around 0.5 V in the cyclic voltammograms; the graphitised carbon, Figure 4.22b, is less oxidised than carbon black, Figure 4.22a, thus implying a more stable carbon structure as surface oxidation is the first step in the corrosion process. However, for detection of the actual corrosion, i.e. carbon leaving the surface, analysis of exhaust gases by e.g. mass spectrometry or gas chromatography is required. For the carbon black electrodes in Figure
Figure 4.22 Cyclic voltammetry on cathodes based on Pt deposited on a) carbon black and b) graphitised carbon. The period of potentiostatic corrosion test at 1.25 V is labelled and compared to the beginning of life (BOL) behaviour.
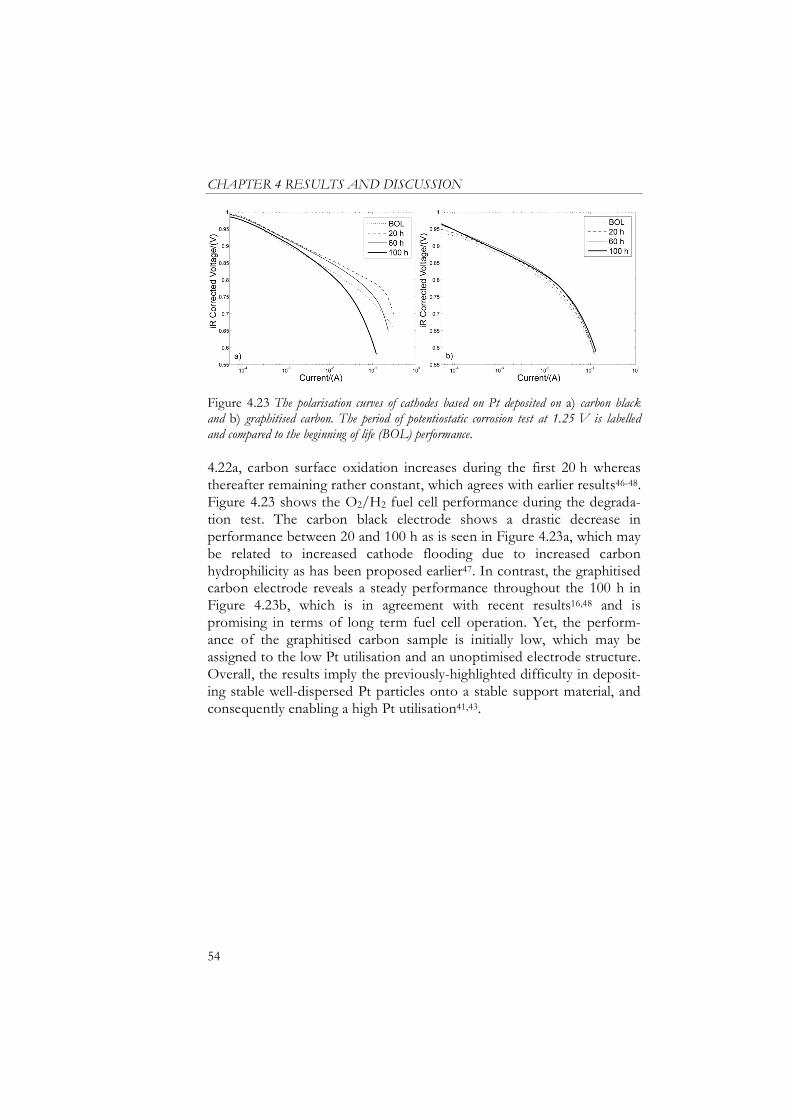
CHAPTER 4 RESULTS AND DISCUSSION
54
Figure 4.23 The polarisation curves of cathodes based on Pt deposited on a) carbon black and b) graphitised carbon. The period of potentiostatic corrosion test at 1.25 V is labelled and compared to the beginning of life (BOL) performance.
4.22a, carbon surface oxidation increases during the first 20 h whereas thereafter remaining rather constant, which agrees with earlier results46-48. Figure 4.23 shows the O2/H2 fuel cell performance during the degrada-tion test. The carbon black electrode shows a drastic decrease in performance between 20 and 100 h as is seen in Figure 4.23a, which may be related to increased cathode flooding due to increased carbon hydrophilicity as has been proposed earlier47. In contrast, the graphitised carbon electrode reveals a steady performance throughout the 100 h in Figure 4.23b, which is in agreement with recent results16,48 and is promising in terms of long term fuel cell operation. Yet, the perform-ance of the graphitised carbon sample is initially low, which may be assigned to the low Pt utilisation and an unoptimised electrode structure. Overall, the results imply the previously-highlighted difficulty in deposit-ing stable well-dispersed Pt particles onto a stable support material, and consequently enabling a high Pt utilisation41,43.
55
Chapter 5
Conclusions
The focus of the present work is the development and evaluation of MEAs based on alternative materials in the context of the cost reduction and durability challenges of the PEMFC technology. To meet the demands, materials expenses ought to be decreased, which also includes efficient Pt catalyst use and recycling. Furthermore, system operation at elevated temperatures would decrease the complexity of the system and subsequently result in decreased system cost. These aspects as well as the demand on sufficient lifetime are the strong motives for the develop-ment of new materials in the field.
5.1 Hydrocarbon Ionomer Membrane Characteristics In order to enable increased system operating temperature, low-cost hydrocarbon sPSU membranes are studied in terms of proton conductiv-ity, water uptake, morphology, water balance, and gas permeability, which all are properties connected to the membrane performance and stability. The sPSUs possess adequate proton conductivity when the IEC
is increased, however this is linked to a high water uptake, which induces reduced mechanical stability. Characterisation of the hydrated membrane morphology confirms the observed low mechanical stability of the sPSU with high IEC; the membrane contains water domains in a wide size range, which is related to the low resistance towards excessive water uptake. In contrast, the sPSU membrane with low IEC reveals a signifi-cant occurrence of small pores, demonstrating a controlled water uptake, which is a requirement for sufficient mechanical stability. For Nafion, the water uptake and the significant pore size distribution peak of water domains at r ~1 nm are in agreement with the gravimetric water uptake and previously proposed hydrated membrane morphology. Yet, about

CHAPTER 5 CONCLUSIONS
56
half of the water in the membrane is located in larger water domains, which has not been highlighted before. Hence, the importance of including the water channel size distribution, i.e. structural heterogene-ities of the ionomer membrane, in the membrane analysis is demon-strated. Despite the analogous water uptake and water domain size for the Nafion and low-IEC sPSU membranes at moderate tempera-tures, the proton conductivity is superior in the Nafion membrane. Also, the transport of water and reactant gases is lower in the sPSU membrane and the membrane morphology contributes most likely to these proper-ties, thus implying a structural dissimilarity in the two membranes not revealed by cryoporometry. Morphological differences in terms of a large amount of dead-end channels and isolated water domains in the sPSU membrane compared to a percolating water network in the Nafion membrane may contribute to the differing transport properties. Also, aspects such as influence of polymer backbone and side chains on the transport of the species are crucial and should be further investigated. The observed low gas permeability of the membrane is favourable, as it has been shown to improve MEA lifetime. Water transport, until only recently neglected in novel ionomer research, is shown to be of great importance. The revealed sPSU membrane characteristics illustrate the importance of decoupling disadvantageous properties, such as excessive water uptake, inefficient water transport, from favourable properties, such as high proton conductivity and low gas permeability.
5.2 Impact of a Hydrocarbon Ionomer on the Electrode Characteristics The sPSU electrodes with optimised ionomer content possess properties similar to those of the benchmarking Nafion electrode considering morphology, electronic conductivity, ionomer wetting, catalyst utilisation and kinetics. The morphology study reveals highly porous electrodes up to an sPSU content of 20 wt%. Also, an sPSU content of up to 20 wt% is needed to achieve a fully wetted electronic phase. The most favourable ink solvent is a poor sPSU solvent with fast evaporation rate as this results in electrodes with increased secondary pore area, which is important for attaining sufficient gas transport. The gas permeability of the sPSU is sufficiently high to be considered as non-limiting when incorporated into the electrode, which is also shown in the fuel cell evaluation. Considering the MEA preparation, the hydrocarbon sPSU electrodes are straightforwardly applied directly onto the sPSU mem-
CHAPTER 5 CONCLUSIONS
57
branes and maintenance of an integrated MEA structure during acid-boiling treatment proves a highly compatible MEA. In addition, ionomer wetting of the microporous layer of the GDL is observed for the electrode-coated GDLs, consequently illustrating the advantage of preparing CCMs, which is the utilised method in the current work.
5.3 Impact of a Hydrocarbon Ionomer on the MEA Characteristics
The sPSU-MEA fuel cell performance indicates similar kinetics as the cathodic sPSU content is varied between 10-20 wt%, which is related to the practically fully wetted electronic phase. The influence of the IEC is significant at 60 °C, presumably due to low proton conductivity of the low-IEC ionomer at these temperatures. At elevated temperatures, the IEC is not of considerable influence for the fuel cell performance as mass-transport limitations are apparent in both MEAs. Overall, the work implies that cathode flooding is not only related to the hydrophilicity or the content of the incorporated ionomer in the electrode. The investigation on the impact of the membrane present in the MEA reveals that the sPSU membrane induces mass-transport limitations in both sPSU and Nafion electrodes. Presumably, the primary limiting factor of the sPSU-based MEAs is the mass-transport limitations in the electrodes caused by the unoptimised water transport in the sPSU membrane also indicated by water balance measurements. Further, the incorporation of composites, which has been reported to improve the water retention in Nafion membranes, does not contribute to an enhanced sPSU MEA performance at reduced humidity. This strength-ens the conclusion of inefficient water transport in the sPSU membrane, which results in low water retention despite composite integration into the membrane. The sPSU and Nafion electrodes possess similar fuel cell characteristics, indicating no limiting influence of utilising sPSU instead of Nafion as ionomer component in the electrode at high temperature and humidity. However, at low temperature and reduced humidity the proton conductivity is deteriorated to a higher extent in the sPSU electrode than in the Nafion electrode. Consequently, the importance of electrochemical evalua-tion of novel ionomers as whole MEAs as well as separate components is demonstrated. The often-neglected holistic approach in the research on novel ionomers is required to increase the comprehension of the ionomers and the corresponding MEAs.

CHAPTER 5 CONCLUSIONS
58
5.4 Performance and Stability of New Catalyst Supports In order to reduce the direct contact between Pt and carbon, since Pt may catalyse carbon corrosion, TiO2 is investigated as catalyst support material in Pt-TiO2/C composite electrodes as an approach to improve cathode stability and simultaneously maintain sufficient cathode per-formance. The Pt-anatase TiO2/C composite is shown to be highly stable in the thermal stability study and only minor migration of Pt from the anatase TiO2 during fuel cell operation is observed. Pt-TiO2/C composite electrodes possess improved fuel cell cathode performance as the carbon fraction and the amount of Pt deposited on TiO2 are in-creased. The Pt-TiO2/C composite material, involving promising stability and comparable cathode performance to that of the conven-tional Pt-C electrode, illustrates the motivation for combining new materials with different functionality, i.e. catalyst support, water pre-server, proton- and electron conductor, in the PEMFC electrode. Yet, further optimisation in terms of decreasing TiO2 particle size and developing the electrode structure with the new components are required to fully identify the potential of the composite electrodes. In addition to the TiO2-based electrodes, the feasibility of depositing Pt onto graphitised carbons in terms of fuel cell performance and stability is evaluated. In contrast to the conventional carbon black electrode, the graphitised carbon-based electrode reveals a promising stability in terms of fuel cell performance. Still, the performance of the graphitised carbon electrode has to be improved by increasing the Pt utilisation and optimising the electrode structure. The results on new catalyst supports reveal the significant influence of substrate for deposit-ing stable Pt particles and the challenge in finding a stable catalyst support that enables deposition of highly dispersed stable Pt particles.
5.5 Overall Conclusions and Future Outlook To reduce the cost of the PEMFC stack, an increased operating tempera-ture and development of stable low-cost materials are required. In general, the Pt content of MEAs ought to be lowered and Pt recyclability has to be improved; the aspect of low Pt loading has therefore been included in the MEA evaluation throughout this work. The overall MEA performance depends on i) membrane performance, in terms of trans-port of various species and stability, ii) electrode performance, related to structure and integrated ionomer, as well as iii) catalyst material perform-ance, including stability and catalyst utilisation.

CHAPTER 5 CONCLUSIONS
59
The sPSU-based MEAs are shown to be suitable for fuel-cell operation in a wide temperature range. It is revealed that the sPSU membrane induces limitations due to an unbalanced water transport, thus severely deteriorating MEA performance. The sPSU membranes are feasible to optimise in terms of proton conductivity, water uptake and mechanical stability as ionomer properties are changed. However, the desirable properties naturally convey unwanted properties, making the decoupling of these two property categories the most obvious challenge in the development of hydrocarbon membranes for fuel-cell operation in a wide temperature and humidity range. The drawback of low water retention in the hydrocarbon membranes is well known, yet the impor-tance of efficient membrane transport for high-performing MEAs is only rarely included in alternative membrane development. The current work illustrates the significance of developing membranes with efficient water transport in order to eventually enable improved MEA self humidifica-tion and high performance at low humidity operation. The sPSU-based electrodes are revealed as being as high performing as the conventional Nafion electrodes. Still, the proton conductivity of the sPSU ionomer at reduced temperature and humidity has to be improved by increasing the overall understanding of the structure-transport relation in the ionomer incorporated into the electrode and by drastically increasing the ionic exchange capacity. This optimisation ought to be undertaken without sacrificing the compatibility between the MEA components. In the context of catalyst supports, apart from the promising stability and fuel cell performance of the novel Pt-TiO2 composite electrodes and the high electrochemical stability of the graphitised carbon electrodes, the catalyst utilisation of the studied gas diffusion electrodes remains a challenge throughout the work. Thus, this thesis reveals the need for an accurate design of catalyst support materi-als and electrode morphology to enhance catalyst utilisation, to enable decreased Pt content in the MEA, and eventually to meet the cost target of the PEMFC system. Ultimately, this thesis demonstrates the importance of a precise MEA development strategy, involving a broad methodology for investigating new materials in integrated MEAs and as separate compo-nents, to increase the knowledge of the impact of novel materials on the overall fuel cell characteristics. As the MEA components and processes interact, a holistic approach is essential to enable successful design of new MEAs and ultimately development of high-performing low-cost PEMFC systems.


61
Acknowledgements First I would like to thank MISTRA, the Swedish Foundation for Strategic Environmental Research, for funding this PhD project.
A special thanks to my supervisor Göran Lindbergh for giving me the opportunity to work in this interesting field, for supporting
my work and for assigning me a lot of responsibility, thus making it possible
for me to become independent in my research work. I would also like to thank all colleagues at Applied Electrochemistry, including the colleagues in the PEMFC group and Anders Lundblad, who was my supervisor during the first years of my
work. A special thanks to Linda for your support and for listening; Henrik, for the time shared in the lab and for the valuable feedback on fuel cell
research; Sara for your optimism and laughter; Ivan, for your support and
great irony; Shelley and Maria W for sharing office and thoughts; Andreas N for being such a warm and thoughtful co-worker, and Andreas B for
sharing your energy and motivation.
Thanks to my collaborators in the Mistra project; firstly, the group at Polymer and Materials Chemistry, Lund University; Patric Jannasch,
Mario Puchner, Elin Persson and Benoît Lafitte for providing me with ionomer material. Patric, you have given me a lot of feedback and working
with you has taught me a great deal about ionomers. Secondly, thanks to my
collaborators Kjell Wikander and Anders Palmqvist at Applied Surface Chemistry, Chalmers University of Technology, for the cooperation on
catalyst supports. Kjell, thanks for all discussions and supporting phone calls from Göteborg.
Alexandr Sagidullin and István Furó at the NMR centre, KTH, are acknowledged for the collaboration on the membrane structures
and for introducing me to the NMR field. Also, thanks to Steven Holdcroft for motivating and valuable discussions.
At last, I would like to thank all of you being closest to me, my dearly loved ones, to whom I dedicate this work. Thank you for the inspiration
and support. It is great to have you as life witnesses and wonderful to be included in your lives!


63
References 1. Exxon Mobil, The Outlook for Energy – A View to 2030 (2007) 2. International Energy Agency, World Energy Outlook 2006 (2006) 3. Toyota Motor Co. Toyota Hybrid System, THS II (2003) 4. TSS Consultants (NREL), Gridley Ethanol Demonstration Project
Utilizing Biomass Gasification Technology (2005) 5. J. Larminie and A. Dicks, Fuel Cell Systems Explained 2nd Edition,
J. Wiley & Sons Ltd, England (2003) 6. M. Åhman, Energy, 26, 973-989 (2001) 7. K. Handa and H. Yoshida, Mitsubishi Motors Technical Review, 19,
66-70 (2007) 8. Honda Motor Co. Honda FCX Clarity Press Kit (2006) 9. K. Wipke, S. Sprik, H. Thomas, C. Welch and J. Kurtz, NREL
Learning Demonstration Interim Progress Report (2007) 10. European Commission Joint Research Centre, Well-to-wheels
Analysis of Future Automotive Fuels and Power Trains in the European
Context (2007) 11. R. von Helmolt and U. Eberle, J. Power Sources, 165, 833-843
(2007) 12. G. Crawley, Fuel Cell Today, Opening Doors to Fuel Cell
Commercialisation - PEMFC (2006) (www.fuelcelltoday.com) 13. G. Crawley, Fuel Cell Today, Opening Doors to Fuel Cell
Commercialisation – SOFC (2007) (www.fuelcelltoday.com) 14. F. A. de Bruijn, V. A. T. Dam and G. J. M. Janssen, Fuel Cells,
8, 3-22 (2008) 15. N. Garland, DOE Hydrogen Programme R&D Goals (2007) 16. M. F. Mathias, R. Makharia, H. A. Gasteiger, J. J. Conley, T. J.
Fuller, C. J. Gittleman, S. S. Kocha, D. P. Miller, C. K. Mittelsteadt, T. Xie, S. G. Yan and P. T Yu, The Electrochem.
Soc. Interface, Fall, 24-35 (2005) 17. E. J. Carlson, P. Kopf, J. Sinha and S. Sriramulu, NREL Cost
Analysis of PEM Fuel Cell Systems for Transportation (2005) 18. B. C. H. Steele and A. Heinzel, Nature, 414, 345-352 (2001)

REFERENCES
64
19. Q. Li, R. He, J. O. Jensen and N. J. Bjerrum, Chem. Mater., 15, 4896-4915 (2003)
20. J. Zhang, Z. Xie, J. Zhang, Y.Tang, C. Song, T. Navessin, Z. Shi, D. Song, H. Wang, D. P. Wilkinson, Z.-S. Liu and S. Holdcroft, J. Power Sources, 160, 872-891 (2006)
21. Y. Shao, G. Yin, Z. Wang and Y. Gao, J. Power Sources, 167, 235-242 (2007)
22. E. Antolini, J. Appl. Electrochem., 34, 563-576 (2004) 23. S. Litster and G. McLean, J. Power. Sources., 130, 61-76 (2004) 24. E. A. Ticianelli, C. R. Derouin, A. Redondo and S. Srinivasan,
J. Electrochem. Soc., 135, 2209-2214 (1988) 25. M. S. Wilson and S. Gottesfeld, J. Appl. Electrochem., 22, 1-7
(1992) 26. M. S. Wilson and S. Gottesfeld, J. Electrochem. Soc., 139, L28-
L30 (1992) 27. F. Lufrano, E. Passalacqua, G. Squadrito, A. Patti and L.
Giorgi, J. Appl. Electrochem., 29, 445-448 (1999) 28. Z. Xie, T. Navessin, K. Shi, R. Chow, Q. Wang, D. Song, B.
Andreaus, M. Eikerling, Z. Liu and S. Holdcroft, J. Electrochem.
Soc., 152, A1171-A1179 (2005) 29. Z. Poltarzewski, P. Staiti, V. Alderucci, W. Wieczorek and N.
Giordano, J. Electrochem. Soc., 139, 761-765 (1992) 30. E. Passalacqua, F. Lufrano, G. Squadrito, A. Patti and L.
Giorgi, Electrochim. Acta, 46, 799-805 (2001) 31. P. Gode, F. Jaouen, G. Lindbergh, A. Lundblad and G.
Sundholm, Electrochim. Acta, 48, 4175-4187 (2003) 32. Th. Frey and M. Linardi, Electrochim. Acta, 50, 99-105 (2004) 33. L. Xiong and A. Manthiram, Electrochim. Acta, 50, 3200-3204
(2005) 34. R. R. Passos, V. A. Paganin and E. A. Ticianelli, Electrochim.
Acta, 51, 5239-5245 (2006) 35. M. Uchida, Y. Aoyama, N. Eda and A. Ohta, J. Electrochem.
Soc., 142, 463-468 (1995) 36. M. Uchida, Y. Aoyama, N. Eda and A. Ohta, J. Electrochem.
Soc., 142, 4143-4149 (1995) 37. S.-J. Shin, J.-K. Lee, H.-Y. Ha, S.-A. Hong, H.-S. Chun and I.-
H. Oh, J. Power Sources, 106, 146-152 (2002) 38. S. Lasher, J. Sinha and Y. Yang, DOE Hydrogen Programme FY
Annual Progress Report (2007) 39. E. Güzlow, M. Schulze, N. Wagner, T. Kaz, R. Reissner, G.
Steinhilber and A. Schneider, J. Power Sources, 86, 352-362 (2000)

REFERENCES
65
40. Q. A. Baturina and G. E. Wnek, Electrochem. Sol. State Lett., 8, A267-A269 (2005)
41. X. Yu and S. Ye, J. Power Sources, 172 145-154 (2007) 42. S. Maas, F. Finsterwalder, G. Frank, R. Hartmann and C.
Merten, J. Power Sources, 176, 444-451 (2008) 43. A. S. Aricò, A. Stassi, E. Modica, R. Ornelas, I. Gatto, E.
Passalacqua and V. Antonucci, J. Power Sources, 178, 525-536 (2008)
44. W. Bi and T. F. Fuller, J. Electrochem. Soc., 155, B215-B221 (2008)
45. L. M. Roen, C. H. Paik and T.D. Jarvi, Electrochem. Sol. State
Lett., 7, A19-A22 (2004) 46. D. A. Stevens, M. T. Hicks, G. M. Haugen and J. R. Dahn,
J. Electrochem. Soc., 152, A2309-A2315 (2005) 47. K.H. Kangasniemi, D. A. Condit and T. D. Jarvi, J. Electrochem.
Soc., 151, E125-E132 (2004) 48. S. C. Ball, S. L. Hudson, D. Thompsett and B. Theobald, J.
Power Sources, 171, 18-25 (2007) 49. H. A. Gasteiger and M. F. Mathias, in Proton Conducting
Membrane Fuel Cells III, PV-2002-31, The Electrochemical Society Proceedings Series, Salt Lake City, UT (2002)
50. J. Xie, D. L. Wood III, K. L. More, P. Atanassov and R. L. Borup, J. Electrochem. Soc., 152, A1011-A1020 (2005)
51. K. A. Mauritz and R. B. Moore, Chem. Rev., 104, 4535-4585 (2004)
52. G. Gebel and O. Diat, Fuel Cells, 5, 261-276 (2005) 53. K. D. Kreuer, J. Mem. Sci., 185, 29-39 (2001) 54. T. A. Zawodzinksi, C. Derouin, S. Radzinski, R. J. Sherman, V.
T Smith, T. E. Springer and S. Gottesfeld, J. Electrochem. Soc., 140, 1041-1047 (1993)
55. S. Gottesfeld and T. A. Zawodzinski, in Advances in
Electrochemical Science and Engineering Vol 5, Chapter 5 Polymer Electrolyte Fuel Cells, Wiley, Germany (1997)
56. M. A. Hickner and B. S. Pivovar, Fuel Cells, 5, 213-228 (2005) 57. G. Alberti, R. Narducci and M. Sganappa, J. Power Sources, 178,
575-583 (2007) 58. Y. S. Kim, L. Dong, M. A. Hickner, T. E. Glass, V. Webb and
J. E. McGrath, Macromolecules, 3, 6281-6285 (2003) 59. J. F. Blachot, O. Diat, J.-L. Putaux, A.-L. Rollet, L. Rubatat, C.
Vallois, M. Müller and G. Gebel, J. Mem. Sci., 214, 31-42 (2003) 60. B. Lafitte and P. Jannasch, Adv. Funct. Mater., 17, 2823-2834
(2007)

REFERENCES
66
61. Y. Yang and S. Holdcroft, Fuel Cells, 5, 171-186 (2005) 62. M. A. Hickner, H. Ghassemi, Y. S. Kim, B. R. Einsla and J. E.
McGrath, Chem. Rev., 104, 4587-4612 (2004) 63. A. Collier, H. Wang, X. Z. Yuan, J. Zhang and D. P.
Wilkinson, Int. J. Hydrogen Energy, 31, 1838-1854 (2006) 64. V. A. Sethuraman, J. W. Weidner, A. T. Haug and L. V.
Protsailo, J. Electrochem. Soc., 155, B119-B124 (2008) 65. K.D. Kreuer, Solid State Ionics, 97, 1-15 (1997) 66. M. Casciola, G. Alberti, M. Sganappa and R. Narducci, J. Power
Sources, 162, 141-145 (2006) 67. V. A. Paganin, C. L. F. Oliveira, E. A. Ticianelli, T. E Springer
and E. R. Gonzalez, Electrochim. Acta, 43, 3761-3766 (1998) 68. B. S. Pivovar, Polymer, 47, 4194-4202 (2006) 69. B. Andreaus and G. G. Scherer, Solid State Ionics, 168, 311-320
(2004) 70. Q. Yan, H. Toghiani and J. Wu, J. Power Sources, 158, 316-325
(2006) 71. H. Matic, A. Lundblad, G. Lindbergh and P. Jacobsson,
Electrochem. Solid-State Lett., 8, A5-A7 (2005) 72. F. Liu, G. Lu and C.-W. Wang, J. Membr. Sci., 287, 126-131
(2007) 73. A. Schneider, H. Kuhn, A. Wokaun and G. G. Scherer, J.
Electrochem. Soc., 152, A2383-A2389 (2005) 74. Z. Xie, T. Navessin, Z. Shi, R. Chow and S. Holdcroft, J.
Electroanal. Chem., 596, 38-46 (2006) 75. J. Rozière and D. J. Jones, Annu. Rev. Mater. Res., 33, 503-555
(2003) 76. G. Alberti and M. Casciola, Annu. Rev. Mater. Res., 33, 129-154
(2003) 77. O. Savadogo, J. Power Sources, 127, 135-161 (2004) 78. A. S. Aricò, P. Burce, B. Scrosati, J.-M. Tarascon and W. van
Schalkwijk, Nat. Mater., 4, 366-377 (2005) 79. K. T. Adjemian, S. J. Lee, S. Srinivasan, J. Benziger and A. B.
Bocarsly, J. Electrochem. Soc., 149, A256-A261 (2002) 80. Y. Si, H. R. Kunz and J. M. Fenton, J. Electrochem. Soc., 151,
A623-A631 (2004) 81. F. Bauer and M. Willert-Porada, Fuel Cells, 3-4, 261-269 (2006) 82. E. Chalkova, N. V. Fekin, S. Komarneni and S. N. Lvov,
J. Electrochem. Soc., 154, B288-B295 (2007) 83. W. L. Harrison, M. A. Hickner, Y. S. Kim and J. E. McGrath,
Fuel Cells, 5, 201-212 (2005) 84. P. Jannasch, Curr. Opin. Colloid Interface Sci., 8, 96-102 (2003)

REFERENCES
67
85. P. Jannasch, Fuel Cells, 5, 248-260 (2005) 86. B. Lafitte, L. E. Karlsson and P. Jannasch, Macromol. Rapid
Commun., 23, 896-900 (2002) 87. L. E. Karlsson and P. Jannasch, Electrochim. Acta, 50, 1939-
1946 (2005) 88. F. Lufrano, I. Gatto, P. Staiti, V. Antonucci and E.
Passalacqua, Solid State Ionics, 145, 47-51 (2001) 89. H. Ekström, B. Lafitte, J. Ihonen, H. Markusson, P. Jacobsson,
A. Lundblad, P. Jannasch and G. Lindbergh, Solid State Ionics, 178, 959-966 (2007)
90. Y. S. Kim, M. J. Summer, W. L. Harrison, J. S. Riffle, J. E. McGrath and B. S. Pivovar, J. Electrochem. Soc., 151, A2150-A2156 (2004)
91. E. B. Easton, T. Astill and S. Holdcroft, J. Electrochem. Soc., 152, A752-A758 (2005)
92. B. S. Pivovar and Y. S. Kim, J. Electrochem. Soc., 154, B739-B744 (2007)
93. J.-S. Park, P. Krishnan, S.-H. Park, G.-G. Park, T.-H. Yang, W.-Y. Lee and C.-S. Kim, J. Power Sources, 178, 642-650 (2008)
94. A. B. Béléké, K. Miyatake, H. Uchida and M. Watanabe, Electrochim. Acta, 53, 1972-1978 (2007)
95. H.-Y. Jung, K.-Y. Cho, K. A. Sung, W.-K. Kim, M. Kurkuri and J.-K. Park, Electrochimica Acta, 52, 4916-4921 (2007)
96. V. Ramani, S. Swier, M. T. Shaw, R. A. Weiss, H. R. Kunz and J. M. Fenton, J. Electrochemical Soc., 155, B532-B537 (2008)
97. F. Seland, T. Berning, B. Børresen and R. Tunold, J. Power Sources, 160, 27-36 (2006)
98. T. Ioroi, Z. Siroma, N. Fujiwara, S. Yamazaki and K. Yasuda, Electrochem. Comm., 7, 183-188 (2005)
99. T. Ioroi, H. Senoh, S. Yamazaki, Z. Siroma, N. Fujiwara and K. Yasuda, J. Electrochem. Soc., 155, B321-B326 (2008)
100. Y. Suzuki, A. Ishihara, S. Mitsushima, N. Kamiya and K. Ota, Electrochem. Sol. State Lett., 10, B105-B107 (2007)
101. H. Ekström, B. Wickman, M. Gustavsson, P. Hanarp, L. Eurenius, E. Olsson and G. Lindbergh, Electrochim. Acta, 52, 4239-4245 (2007)
102. J. Shim, C.-R. Lee, H.-K. Lee, J.-S. Lee and E. J. Cairns, J.
Power Sources, 102, 172-177 (2001) 103. L. Xiong and A. Manthiram, Electrochim. Acta, 49, 4163-4170
(2004) 104. J. Tian, G. Sun, M. Cai, Q. Mao and Q. Xin, J. Electrochem. Soc,
155, B187-B193 (2008)

REFERENCES
68
105. M. Puchner and P. Jannasch, ACS: Advances in Mater. PEMFC
Systems, CA, USA, Abstract 35-I (2005) 106. B. Lafitte and P. Jannasch, Nordic PEMFC, Stockholm,
Sweden, PP4 (2006) 107. J. H. Strange, M. Rahman and E. G. Smith, Phys. Rev. Lett., 71,
3589-3591 (1993) 108. J.D. Jeon and S.-Y. Kwak, J. Phys. Chem. B, 111, 9437-9443
(2007) 109. F. V. Chávez and M. Schönhoff, J. Chem. Phys., 126, 104705:1-7
(2007) 110. O. Petrov, I. Furó, M. Schuleit, R. Domanig, M. Plunkett and
J. Daicic, Int. J. Pharm., 309, 157-162 (2006) 111. A. Siu, J. Schmeisser and S. Holdcroft, J. Phys. Chem. B, 110,
6072-6080 (2006) 112. T. L. Kalapos, B. Decker, H. A. Every, H. Ghassemi and T. A.
Zawodzinski Jr., J. Power Sources, 172, 14-19 (2007) 113. L. E. Karlsson, B. Wesslén and P. Jannasch, Electrochim. Acta,
47, 3269-3275 (2002) 114. O. Petrov and I. Furó, Phys. Rev. E, 73, 011608:1-7 (2006) 115. O. V. Petrov, D. Vargas-Florencia and. I. Furó, J. Phys. Chem.
B, 111, 1574-1581 (2007) 116. D. Vargas-Florencia, O.V. Petrov and I. Furó, J. Colloid. Interf.
Sci., 305, 280-285 (2007) 117. A. Sagidullin, S. von Kraemer, I. Furó and G. Lindbergh,
Manuscript in preparation 118. K. Wikander, H. Ekström, A. E. C. Palmqvist and G.
Lindbergh, Electrochim. Acta, 52, 6848-6855 (2007) 119. S. Brunauer, P. H. Emmet and E. Teller, J. Am. Chem. Soc., 60,
309-319 (1938) 120. P. E. Barret, L. G. Joyner and P. P. Halenda, J. Am. Chem. Soc.,
73, 373-380 (1951) 121. A. Lundblad, J. New Mat. Electrochem. Systems, 7, 21-28 (2004) 122. J. Ihonen, F. Jaouen, G. Lindbergh and G. Sundholm,
Electrochim. Acta, 46, 2899-2911 (2001) 123. J. Ihonen, M. Mikkola and G. Lindbergh, J. Electrochem. Soc.,
151, A1152-A1161 (2004) 124. F. Jaouen, G. Lindbergh and K. Wiezell, J. Electrochem. Soc.,
150, A1711-A1717 (2003) 125. T. E. Springer, T. A. Zawodzinski, M. S. Wilson and S.
Gottesfeld, J. Electrochem. Soc., 143, 587-599 (1996) 126. Y. S. Kim, L. Dong, M. A. Hickner, B. S. Pivovar and J. E.
McGrath, Polymer, 44, 5729-5736 (2003)
REFERENCES
69
127. C. H. Lee, H. B. Park, Y. M. Lee and R. D. Lee, Ind. Eng. Chem.
Res., 44, 7617-7626 (2005) 128. Z. Xie, C. Song, B. Andreaus, T. Navessin, Z. Shi, J. Zhang
and S. Holdcroft, J. Electrochem. Soc., 153, E173-E178 (2006) 129. J. Divisek, M. Eikerling, V. Mazin, H. Schmitz, U. Stimming
and Y. M. Volfkovich, J. Electrochem. Soc. 145, 2677-2683 (1998) 130. L. Zhang, C. Ma and S. Mukerjee, Electrochim. Acta, 48, 1845-
1859 (2003) 131. P. Gode, G. Lindbergh and G. Sundholm, J. Electroanal. Chem.,
518, 115-122 (2002) 132. J. Ihonen, F. Jaouen, G. Lindbergh, A. Lundblad and G.
Sundholm, J. Electrochem. Soc., 149, A448-A454 (2002) 133. I. Harkness, J. Howells and J. Sharman (Johnson Matthey
Technology Centre), presentation at Carisma Workshop “Ionomer
Membranes” Stuttgart (2007) 134. T. Navessin, M. Eikerling, Q. Wang, D. Song, Z. Liu, J.
Horsfall, K. V. Lovell and S. Holdcroft, J. Electrochem. Soc., 152, A796-A805 (2005)
135. M. Ise, K. D. Kreuer and J. Maier, Solid State Ionics, 125, 213-223 (1999)