Embed Size (px)
Citation preview
i
METABOLIC REGULATION OF HIF-1α AND mTORC1
SIGNALLING
CHOW AI LEE
(Bachelor of Biomedical Science (Hons), University of
Malaya)
A THESIS SUBMITTED
FOR THE DEGREE OF DOCTOR OF PHILOSOPHY
DEPARTMENT OF BIOCHEMISTRY
NATIONAL UNIVERSITY OF SINGAPORE
2017
Supervisor:
Dr Long Yun Chau
Examiners:
Dr Xu Feng
Dr Ban Hon Kim Kenneth
Professor Anna Krook, Karolinska Institute

ii
DECLARATIONS
I hereby declare that this thesis is my original work and it has been written by
me in its entirety. I have duly acknowledged all the sources of information
which have been used in this thesis.
This thesis has also not been submitted for any degree in any university
previously.
_________________________
Chow Ai Lee
27 July 2017

iii
ACKNOWLEDGEMENTS
Four years ago, if I’d said “No” to NUS and remained part of the allied health
profession, I’d be content helping humankind, one at a time. But, I was still in
search of something, and I quickly realised that as we attended to our patients,
there was always one more question that has no answers to. Still so much that
we don’t know about the science and arts of medicine and dentistry. So, I took
that leap of faith – I said “Yes” and did the PhD. This journey has finally
culminated in this thesis, and I owe it all to the following:
LYC lab: Dr Long Yun Chau, Dr Yu Xinlei, Arthur Sim Yi Loong, Johanne
Shane Tian, Hayden Tan Weng Shiong, Ang Li Fern, Isabel Low, Wan Zhi Yi,
Goh Ying Siu, Cho Yik Lam, Audrey and Jessica Poh;
A/P Thilo Hagen, Dr Jean-Paul Kovalik, A/P Theresa Tan May Chin, and Ms
Sanna Grannas for your wisdom, professional advice and opportunities, and
support throughout these years and what comes after;
Dr Lynette Ng and Dr James Lee Tsung-Lin from TDS (SMG), for enabling the
scientist in me with your insights into academia and R&D, and for showing me
what it means to run a business with compassion;
My brothers- and sisters-in-arm. You guys rocked my world, kept me sane, and
I hope I’ve rocked yours :) Dr Chua Yee Liu, Mohd Sufyan, Mario, Serene
Chua, Chan Shu Ning, Faeze Monji, Zhu Yanan, Anu, Mohd Nadjad, Lee Wai
Yeow (Felix), Fanny, Grace, Desi, Dr Lim Yi Shan, Dr Gireedhar

iv
Venkatachalam (Giree), Dr Tan Hwee Tong, Dr Vidhi Patel, Dr Hong Shin Yee,
Dr Christine Hu, Tan Shi Hua;
Forgive me for the gratuitous name-dropping, but without your genuine interest,
thoughtfulness and openness in discussing the pyruvate-HIF-1α project at
various conferences, I’d never consider all these new perspectives and
shortcomings: William G. Kaelin, Jared Rutter, Uemura Tadashi, Jason
Tennessen, and Bernhard Radlwimmer,
The lurkers and ardent supporters from the Archive since 2015, for being the
yang to the PhD’s yin, for making this the best form of procrastination, and for
persuading me into thinking that cultivating a second career out of a hobby is a
good idea;
Rebecca Helton, God bless, for eight beautiful years of friendship;
To the people who remind me of home: Foo Nian, Yujin, and Jian Zhen;
Mom and Dad, Mei Mei (Dr Chow Wen Lee, yes, it’s official);
My husband, Dr Lee Yin Jen,
Thank you.
Sometimes you just gotta go for it. The more often you can do things you might
get a no for and that you have to put yourself up and face potential ridicule,
the better.
v
PUBLICATION LIST
Wan, Z. Y., Tian, J. S., Tan, H. W., Chow, A. L., Sim, A. Y., Ban, K. H., &
Long, Y. C. (2016). Mechanistic target of rapamycin complex 1 is an essential
mediator of metabolic and mitogenic effects of fibroblast growth factor 19 in
hepatoma cells. Hepatology, 64(4), 1289-1301. doi:10.1002/hep.28639
(Manuscript in preparation) Chow, A.L., Ching, J., Kovalik, J.P. & Long, Y.C.
Pyruvate-mediated HIF-1α stabilisation at normoxia is dependent on α-
ketoglutarate and the implication of lysine catabolism as a metabolic repair
system.
vi
CONTENTS
ACKNOWLEDGEMENTS .............................................................................. iii
PUBLICATION LIST ....................................................................................... v
SUMMARY ...................................................................................................... ix
LIST OF TABLES ............................................................................................ xi
LIST OF FIGURES ......................................................................................... xii
LIST OF ABBREVIATIONS ......................................................................... xiv
CHAPTER 1: GENERAL INTRODUCTION .................................................. 1
1.1 Metabolic dysregulation in cancer ...................................................... 1
1.1.1 The Warburg Effect ..................................................................... 2
1.1.2 Tricarboxylic acid (TCA) cycle ................................................... 5
1.1.3 Metabolism of amidic amino acids .............................................. 8
1.1.4 Hyperammonaemia .................................................................... 13
1.2 Oncogenesis at the signalling level ................................................... 15
1.2.1 Hypoxia inducible factor (HIF)-1α ............................................ 16
1.2.2 Mechanistic target of rapamycin complex 1 (mTORC1) pathway
27
1.3 Metabolic error repair pathways........................................................ 36
1.3.1 DL-2-hydroxyglutarate (DL-2HG) ............................................ 36
1.3.2 Lysine catabolism ...................................................................... 37
1.4 Aims and objectives .......................................................................... 39
CHAPTER 2: MATERIALS AND METHODS ............................................. 42
2.1 Cell culture ........................................................................................ 42
2.2 Western Blot assay ............................................................................ 44
2.3 Quantitative real time-PCR (qPCR) .................................................. 58
2.4 Seahorse Extracellular Flux (XF) Analyser ...................................... 61
2.5 Flow cytometry ................................................................................. 63
2.6 Metabolomics analysis ...................................................................... 64
2.7 Mitochondrial membrane potential (MMP) measurement ................ 65
2.8 Cell fractionation for profiling of compartmentalized metabolites ... 66
2.9 Ammonia quantification .................................................................... 68
2.10 Statistical analysis ............................................................................. 68
vii
CHAPTER 3: Pyruvate-mediated HIF-1α stabilisation at normoxia is
dependent on α-KG and the implication of lysine catabolism as a metabolic
repair mechanism ............................................................................................. 70
3.1 Introduction ....................................................................................... 70
3.2 Results ............................................................................................... 71
3.2.1 Pyruvate-induced HIF-1α stabilisation was restricted to cancer
cell lines 71
3.2.2 Pyruvate increased HIF-1α protein level by downregulating its
rate of degradation .................................................................................... 73
3.2.3 Exhaustion of intracellular oxygen or raised ROS level did not
contribute to HIF-1α stabilisation ............................................................. 76
3.2.4 Organic acids and amino acids profile modulations in response
to pyruvate ................................................................................................ 80
3.2.5 Paradoxical implications of α-KG accumulation in mediating
HIF-1α stabilisation .................................................................................. 83
3.2.6 The significance of malate in regulating cycling of mitochondrial
metabolites ................................................................................................ 86
3.2.7 Lysine catabolism as a metabolic repair mechanism ................. 90
3.2.8 Physiological significance of pyruvate-induced HIF-1α
stabilisation ............................................................................................... 94
3.3 Discussion ......................................................................................... 95
CHAPTER 4: Ammonium ions sensitises mTORC1 to amino acids via the
Src/Akt signalling axis ................................................................................... 102
4.1 Introduction ..................................................................................... 102
4.2 Results ............................................................................................. 103
4.2.1 Pyruvate downregulated mTORC1 signalling likely by
modulating ammonia metabolism........................................................... 103
4.2.2 Ammonium ions activated mTORC1 signalling pathway ....... 108
4.2.3 Ammonium ions activated mTORC1 independently of essential
amino acids, but required glutamine ....................................................... 110
4.2.4 Modulations to amino acids profiling in response to ammonium
ions 113
4.2.5 Implications of Src/Akt pathway in mediating ammonium ion-
induced mTORC1 activation .................................................................. 118
4.2.6 Implications of hyperammonaemia in the liver ....................... 123
4.3 Discussion ....................................................................................... 126
CHAPTER 5: Asparagine regulates mTORC1 signalling as an amino acid . 129
5.1 Introduction ..................................................................................... 129
viii
5.2 Results ............................................................................................. 129
5.2.1 Asparagine did not alter intracellular amino acid profile ........ 129
5.2.2 Intracellular accumulation of asparagine was rate-limiting for
mTORC1 activation ................................................................................ 133
5.2.3 The role of asparagine or glutamine as an amino acid exchange
factor was independent of small GTPase Arf1 ....................................... 137
5.2.4 Asparagine or glutamine mediated mTORC1 in sensing
endogenous amino acids, in an Akt and Arf1-dependent manner .......... 141
5.3 Discussion ....................................................................................... 147
CHAPTER 6: GENERAL DISCUSSION ..................................................... 151
6.1 Clinical significance of metabolite signalling ................................. 151
6.2 Conclusion ....................................................................................... 155
6.3 Future work ..................................................................................... 159
REFERENCES .............................................................................................. 161
ix
SUMMARY
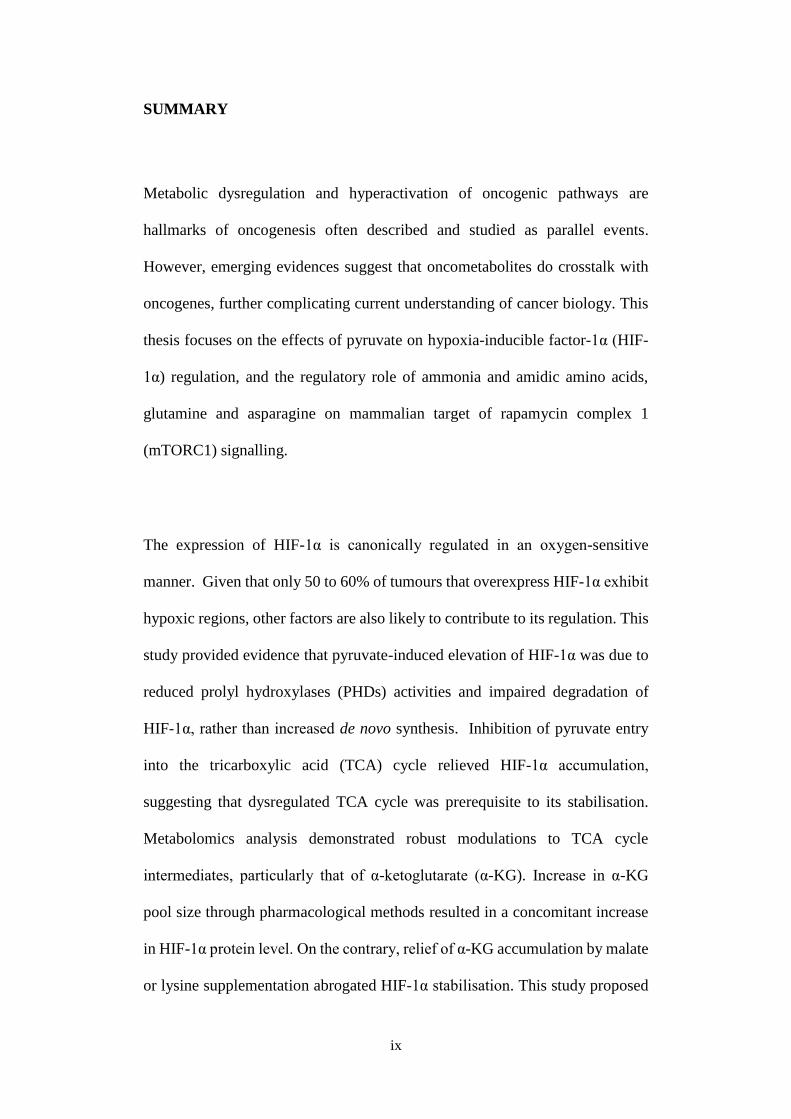
Metabolic dysregulation and hyperactivation of oncogenic pathways are
hallmarks of oncogenesis often described and studied as parallel events.
However, emerging evidences suggest that oncometabolites do crosstalk with
oncogenes, further complicating current understanding of cancer biology. This
thesis focuses on the effects of pyruvate on hypoxia-inducible factor-1α (HIF-
1α) regulation, and the regulatory role of ammonia and amidic amino acids,
glutamine and asparagine on mammalian target of rapamycin complex 1
(mTORC1) signalling.
The expression of HIF-1α is canonically regulated in an oxygen-sensitive
manner. Given that only 50 to 60% of tumours that overexpress HIF-1α exhibit
hypoxic regions, other factors are also likely to contribute to its regulation. This
study provided evidence that pyruvate-induced elevation of HIF-1α was due to
reduced prolyl hydroxylases (PHDs) activities and impaired degradation of
HIF-1α, rather than increased de novo synthesis. Inhibition of pyruvate entry
into the tricarboxylic acid (TCA) cycle relieved HIF-1α accumulation,
suggesting that dysregulated TCA cycle was prerequisite to its stabilisation.
Metabolomics analysis demonstrated robust modulations to TCA cycle
intermediates, particularly that of α-ketoglutarate (α-KG). Increase in α-KG
pool size through pharmacological methods resulted in a concomitant increase
in HIF-1α protein level. On the contrary, relief of α-KG accumulation by malate
or lysine supplementation abrogated HIF-1α stabilisation. This study proposed
x
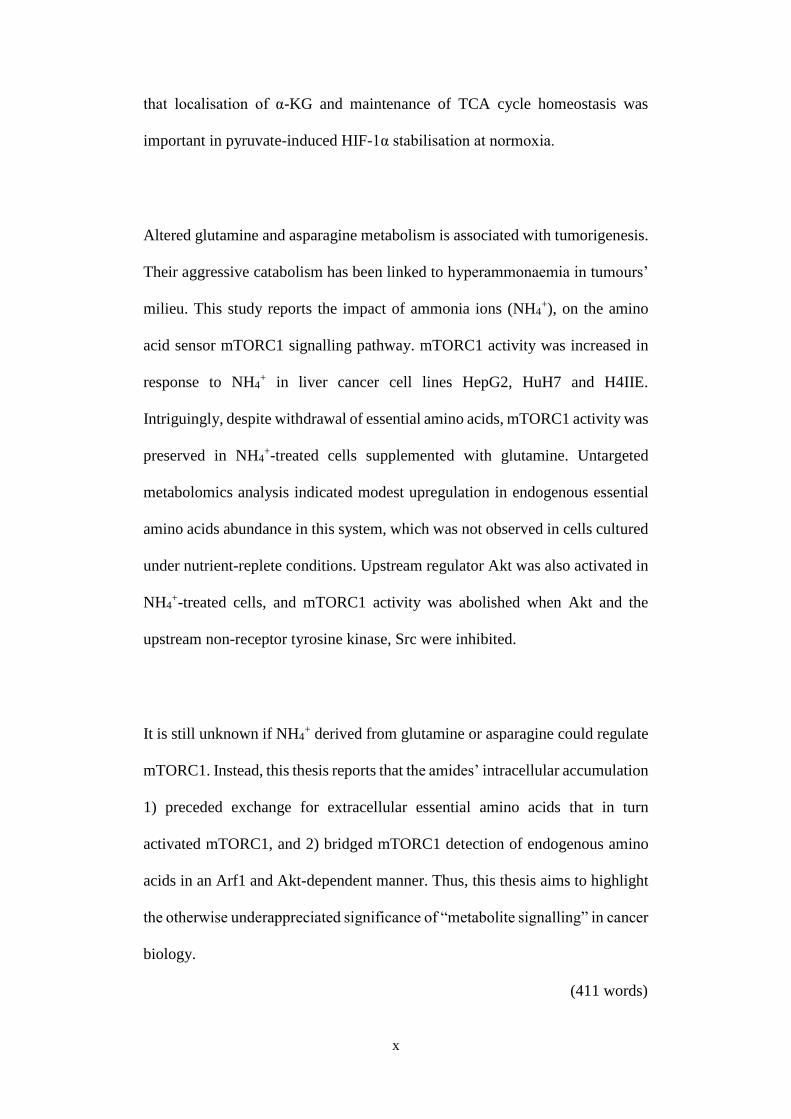
that localisation of α-KG and maintenance of TCA cycle homeostasis was
important in pyruvate-induced HIF-1α stabilisation at normoxia.
Altered glutamine and asparagine metabolism is associated with tumorigenesis.
Their aggressive catabolism has been linked to hyperammonaemia in tumours’
milieu. This study reports the impact of ammonia ions (NH4+), on the amino
acid sensor mTORC1 signalling pathway. mTORC1 activity was increased in
response to NH4+ in liver cancer cell lines HepG2, HuH7 and H4IIE.
Intriguingly, despite withdrawal of essential amino acids, mTORC1 activity was
preserved in NH4+-treated cells supplemented with glutamine. Untargeted
metabolomics analysis indicated modest upregulation in endogenous essential
amino acids abundance in this system, which was not observed in cells cultured
under nutrient-replete conditions. Upstream regulator Akt was also activated in
NH4+-treated cells, and mTORC1 activity was abolished when Akt and the
upstream non-receptor tyrosine kinase, Src were inhibited.
It is still unknown if NH4+ derived from glutamine or asparagine could regulate
mTORC1. Instead, this thesis reports that the amides’ intracellular accumulation
1) preceded exchange for extracellular essential amino acids that in turn
activated mTORC1, and 2) bridged mTORC1 detection of endogenous amino
acids in an Arf1 and Akt-dependent manner. Thus, this thesis aims to highlight
the otherwise underappreciated significance of “metabolite signalling” in cancer
biology.
(411 words)
xi
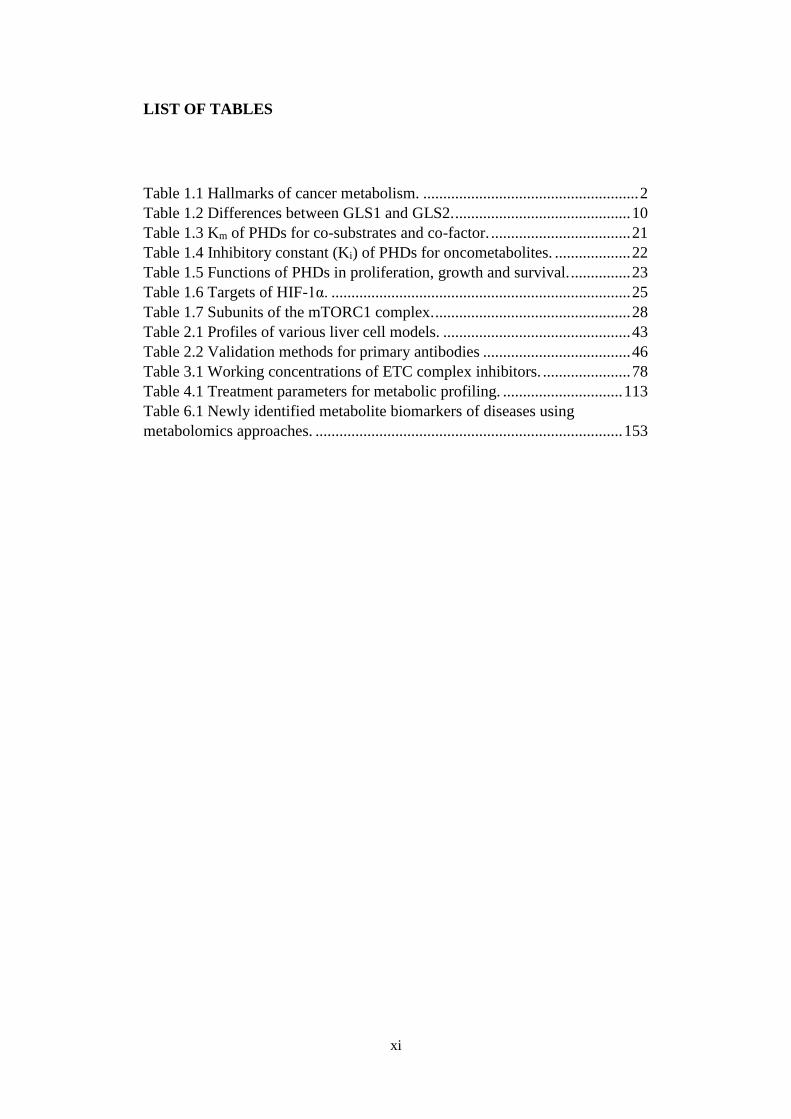
LIST OF TABLES
Table 1.1 Hallmarks of cancer metabolism. ...................................................... 2
Table 1.2 Differences between GLS1 and GLS2. ............................................ 10
Table 1.3 Km of PHDs for co-substrates and co-factor. ................................... 21
Table 1.4 Inhibitory constant (Ki) of PHDs for oncometabolites. ................... 22
Table 1.5 Functions of PHDs in proliferation, growth and survival. ............... 23
Table 1.6 Targets of HIF-1α. ........................................................................... 25
Table 1.7 Subunits of the mTORC1 complex. ................................................. 28
Table 2.1 Profiles of various liver cell models. ............................................... 43
Table 2.2 Validation methods for primary antibodies ..................................... 46
Table 3.1 Working concentrations of ETC complex inhibitors. ...................... 78
Table 4.1 Treatment parameters for metabolic profiling. .............................. 113
Table 6.1 Newly identified metabolite biomarkers of diseases using
metabolomics approaches. ............................................................................. 153
xii
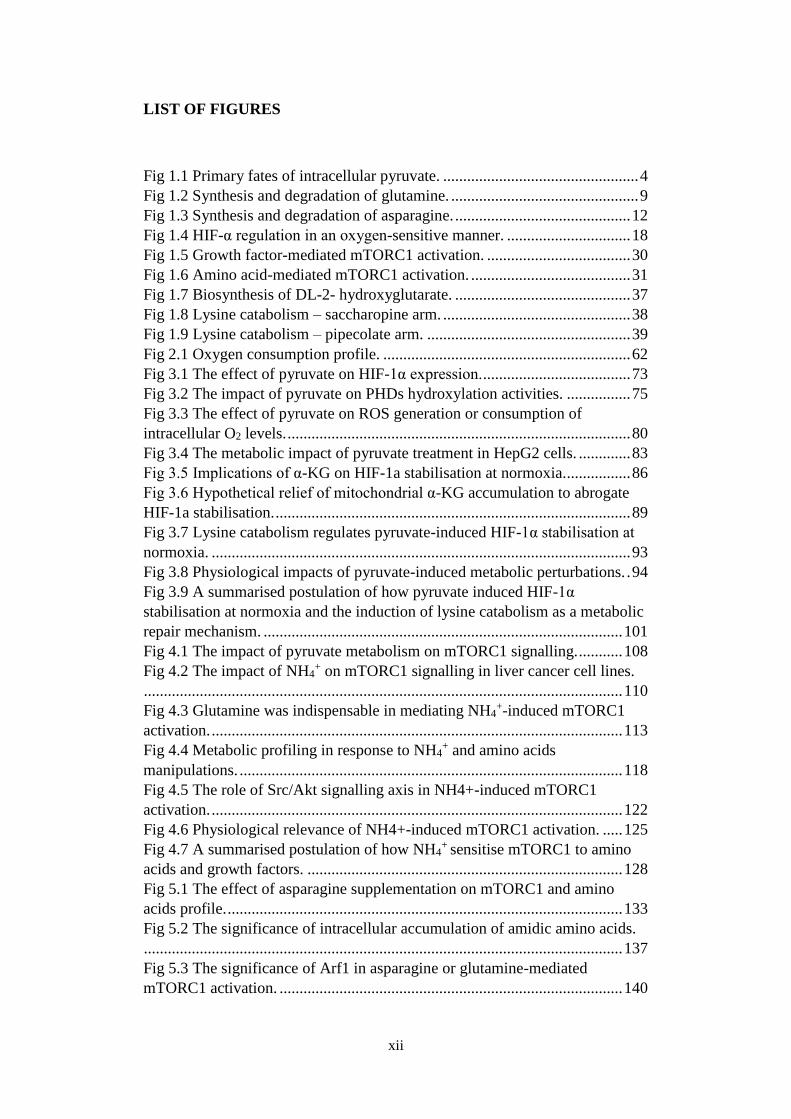
LIST OF FIGURES
Fig 1.1 Primary fates of intracellular pyruvate. ................................................. 4
Fig 1.2 Synthesis and degradation of glutamine. ............................................... 9
Fig 1.3 Synthesis and degradation of asparagine. ............................................ 12
Fig 1.4 HIF-α regulation in an oxygen-sensitive manner. ............................... 18
Fig 1.5 Growth factor-mediated mTORC1 activation. .................................... 30
Fig 1.6 Amino acid-mediated mTORC1 activation. ........................................ 31
Fig 1.7 Biosynthesis of DL-2- hydroxyglutarate. ............................................ 37
Fig 1.8 Lysine catabolism – saccharopine arm. ............................................... 38
Fig 1.9 Lysine catabolism – pipecolate arm. ................................................... 39
Fig 2.1 Oxygen consumption profile. .............................................................. 62
Fig 3.1 The effect of pyruvate on HIF-1α expression. ..................................... 73
Fig 3.2 The impact of pyruvate on PHDs hydroxylation activities. ................ 75
Fig 3.3 The effect of pyruvate on ROS generation or consumption of
intracellular O2 levels. ...................................................................................... 80
Fig 3.4 The metabolic impact of pyruvate treatment in HepG2 cells. ............. 83
Fig 3.5 Implications of α-KG on HIF-1a stabilisation at normoxia. ................ 86
Fig 3.6 Hypothetical relief of mitochondrial α-KG accumulation to abrogate
HIF-1a stabilisation. ......................................................................................... 89
Fig 3.7 Lysine catabolism regulates pyruvate-induced HIF-1α stabilisation at
normoxia. ......................................................................................................... 93
Fig 3.8 Physiological impacts of pyruvate-induced metabolic perturbations. . 94
Fig 3.9 A summarised postulation of how pyruvate induced HIF-1α
stabilisation at normoxia and the induction of lysine catabolism as a metabolic
repair mechanism. .......................................................................................... 101
Fig 4.1 The impact of pyruvate metabolism on mTORC1 signalling. ........... 108
Fig 4.2 The impact of NH4+ on mTORC1 signalling in liver cancer cell lines.
........................................................................................................................ 110
Fig 4.3 Glutamine was indispensable in mediating NH4+-induced mTORC1
activation. ....................................................................................................... 113
Fig 4.4 Metabolic profiling in response to NH4+ and amino acids
manipulations. ................................................................................................ 118
Fig 4.5 The role of Src/Akt signalling axis in NH4+-induced mTORC1
activation. ....................................................................................................... 122
Fig 4.6 Physiological relevance of NH4+-induced mTORC1 activation. ..... 125
Fig 4.7 A summarised postulation of how NH4+ sensitise mTORC1 to amino
acids and growth factors. ............................................................................... 128
Fig 5.1 The effect of asparagine supplementation on mTORC1 and amino
acids profile. ................................................................................................... 133
Fig 5.2 The significance of intracellular accumulation of amidic amino acids.
........................................................................................................................ 137
Fig 5.3 The significance of Arf1 in asparagine or glutamine-mediated
mTORC1 activation. ...................................................................................... 140

xiii
Fig 5.4 The implications of Arf1 and Akt in mTORC1 sensing of endogenous
amino acids. ................................................................................................... 146
Fig 5.5 A summarised postulation of how amidic amino acids asparagine and
glutamine signal to mTORC1 via two distinct mechanisms. ......................... 150
Fig 6.1 General workflow to achieve cell functions. ..................................... 151
Fig 6.2 Metabolic regulation of HIF-1α and mTORC1. ................................ 158
xiv
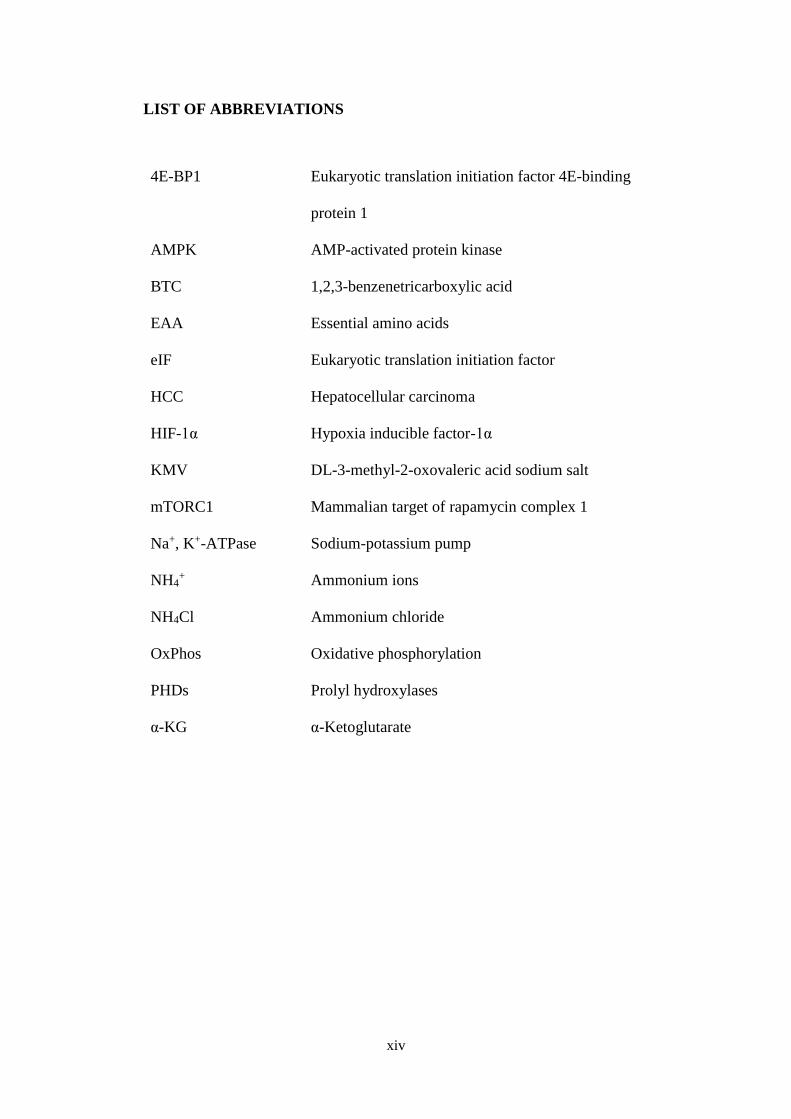
LIST OF ABBREVIATIONS
4E-BP1 Eukaryotic translation initiation factor 4E-binding
protein 1
AMPK AMP-activated protein kinase
BTC 1,2,3-benzenetricarboxylic acid
EAA Essential amino acids
eIF Eukaryotic translation initiation factor
HCC Hepatocellular carcinoma
HIF-1α Hypoxia inducible factor-1α
KMV DL-3-methyl-2-oxovaleric acid sodium salt
mTORC1 Mammalian target of rapamycin complex 1
Na+, K+-ATPase Sodium-potassium pump
NH4+ Ammonium ions
NH4Cl Ammonium chloride
OxPhos Oxidative phosphorylation
PHDs Prolyl hydroxylases
α-KG α-Ketoglutarate
1
CHAPTER 1: GENERAL INTRODUCTION
1.1 Metabolic dysregulation in cancer
A normal cell regulates its physiological functions according to nutrient
availability, as cell expansion involves de novo biosynthesis and assembly of
new cellular structures, an expensive process that commences in the presence
of growth factors. However, mutations that go unrepaired may trigger cells to
transform, and they are induced to proliferate uncontrollably beyond the
restraints of apoptotic signalling. To sustain uncontrolled proliferation, energy
and metabolic demands must be met by some means.
Recently, six hallmarks of cancer metabolism have been proposed to illustrate
how these cells display 1) improved capacities for nutrient uptake, 2)
opportunistic resource allocation to support pro-oncogenic pathways, and 3)
modification of their microenvironment to be more conducive for cancer
propagation (Table 1.1). They highlight an intimate crosstalk between
metabolism and gene regulation to explain the inherent complexity of cancers
(Hanahan & Weinberg, 2011; Pavlova & Thompson, 2016).
2
Table 1.1 Hallmarks of cancer metabolism.
Strategy Mechanism
Metabolite-induced
changes to cell function
Modulate gene regulation
Influence components of tumour
microenvironment
Metabolic
reprogramming
Increase reliance on glycolysis or TCA cycle for
biosynthesis of building blocks
Increase uptake of nitrogenous sources
Oncogene-induced
nutrient uptake
Enhance uptake of glucose and amino acids
Evolve secondary means for nutrient acquisition
1.1.1 The Warburg Effect
In the 1920s, Otto Warburg and colleagues observed that actively proliferating
cells preferentially conduct fermentative glycolysis even in the presence of
oxygen (O2), generating lactate as by-products (Warburg, Wind, & Negelein,
1927). Two metabolic events were subsequently postulated as oncogenic
precursors. One, cells suffered irreparable respiration injury within the
mitochondria (Warburg, 1956a, 1956b). This concept has not been accepted as
a wide range of cancer cells still retain normal mitochondria functions which
are necessary for survival (Jose, Bellance, & Rossignol, 2011; Moreno-Sanchez,
Rodriguez-Enriquez, Marin-Hernandez, & Saavedra, 2007). Two, cells that
grow increasingly dependent on glucose fermentation for energy generation will
survive as they adapt to these respiratory insults. These cells are thus “selected”
for their capacities to thrive on glucose fermentation and become precursors of
3
transformed cells (Warburg et al., 1927). 18-Fluoro-deoxyglucose-based
positron emission tomography imaging demonstrated that most primary and
metastatic cancers exhibit a significant increase in glucose uptake compared to
normal tissues (Gatenby & Gillies, 2004).
Decades later, it remains debatable whether the Warburg effect is a cause or
consequence of tumour formation. A consensus is eventually reached whereby
the fate of intracellular pyruvate, specifically, whether pyruvate is shunted to
fermentative glucose metabolism or oxidative phosphorylation (OxPhos)
dictates whether a cell is committed to proliferation or senescence, respectively
(Kaplon et al., 2013; Olenchock & Vander Heiden, 2013) (Fig 1.1).
4
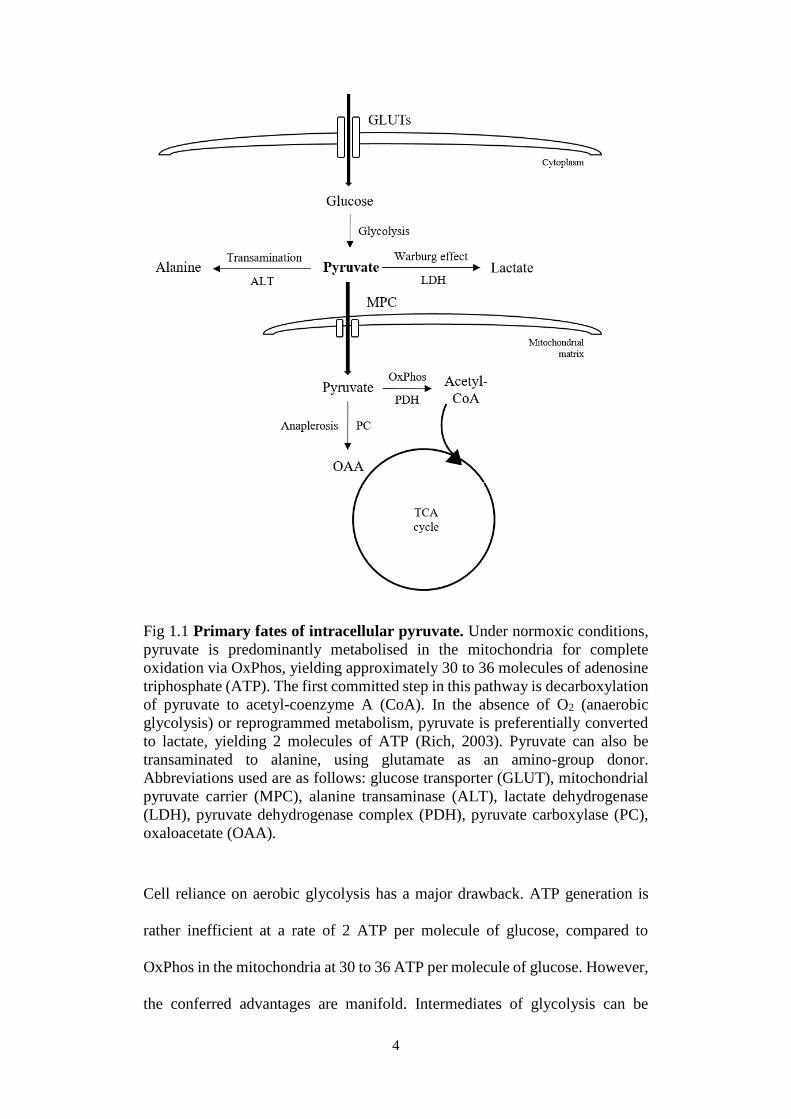
Fig 1.1 Primary fates of intracellular pyruvate. Under normoxic conditions,
pyruvate is predominantly metabolised in the mitochondria for complete
oxidation via OxPhos, yielding approximately 30 to 36 molecules of adenosine
triphosphate (ATP). The first committed step in this pathway is decarboxylation
of pyruvate to acetyl-coenzyme A (CoA). In the absence of O2 (anaerobic
glycolysis) or reprogrammed metabolism, pyruvate is preferentially converted
to lactate, yielding 2 molecules of ATP (Rich, 2003). Pyruvate can also be
transaminated to alanine, using glutamate as an amino-group donor.
Abbreviations used are as follows: glucose transporter (GLUT), mitochondrial
pyruvate carrier (MPC), alanine transaminase (ALT), lactate dehydrogenase
(LDH), pyruvate dehydrogenase complex (PDH), pyruvate carboxylase (PC),
oxaloacetate (OAA).
Cell reliance on aerobic glycolysis has a major drawback. ATP generation is
rather inefficient at a rate of 2 ATP per molecule of glucose, compared to
OxPhos in the mitochondria at 30 to 36 ATP per molecule of glucose. However,
the conferred advantages are manifold. Intermediates of glycolysis can be
5
channelled into generation of amino acids, nucleic acids, and lipids to sustain
cell proliferation (Duckwall, Murphy, & Young, 2013). Synthesis and excretion
of lactate maintains an acidic extracellular milieu that facilitates evasion of the
host’s immune system, in addition to enhanced self-proliferation and invasion
(Kato et al., 2013). Bypassing OxPhos leads to reduced rate of electron flow
through the electron transport chain (ETC), and thus reduced production of
reactive oxygen species (ROS), deoxyribonucleic acids (DNA) damage and the
triggering of protective mechanisms such as apoptosis (J. Lu, Tan, & Cai, 2015).
1.1.2 Tricarboxylic acid (TCA) cycle
Pyruvate, the end product of glycolysis also serves as a bridge to mitochondrial
respiration. Pyruvate can be decarboxylated to acetyl-CoA by PDH in the
mitochondrial matrix. The mammalian PDH comprises of 132 subunits, and its
activities are regulated by five coenzymes, namely thiamine pyrophosphate,
lipoamide, CoA, flavin adenine dinucleotide (FAD) and nicotinamide adenine
dinucleotide (NAD):
Pyruvate + CoA + NAD+ NADH + acetyl-CoA + CO2
Acetyl-CoA is next condensed with OAA to produce citrate, a reaction which is
catalysed by citrate synthase. Entry of pyruvate into the TCA cycle in this
manner does not contribute net carbon, as the 2 carbons from acetyl-CoA will
be released as carbon dioxide (CO2) in subsequent reactions:
OAA + acetyl-CoA citrate
6
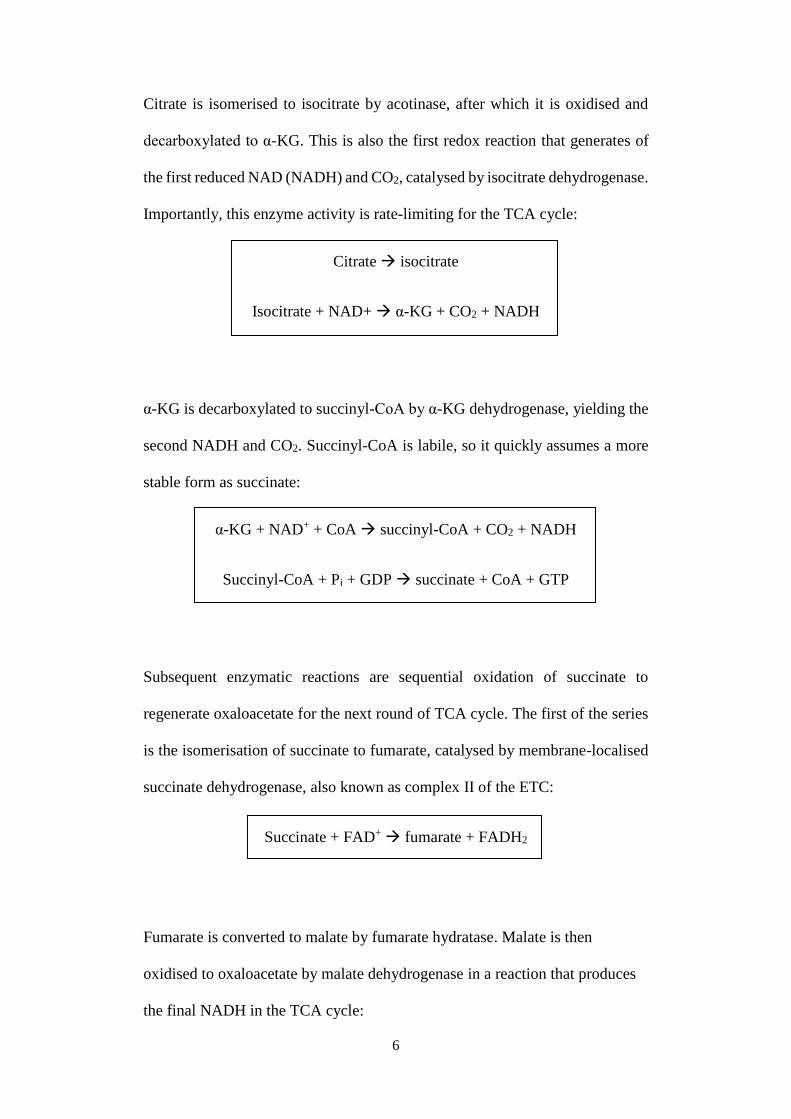
Citrate is isomerised to isocitrate by acotinase, after which it is oxidised and
decarboxylated to α-KG. This is also the first redox reaction that generates of
the first reduced NAD (NADH) and CO2, catalysed by isocitrate dehydrogenase.
Importantly, this enzyme activity is rate-limiting for the TCA cycle:
Citrate isocitrate
Isocitrate + NAD+ α-KG + CO2 + NADH
α-KG is decarboxylated to succinyl-CoA by α-KG dehydrogenase, yielding the
second NADH and CO2. Succinyl-CoA is labile, so it quickly assumes a more
stable form as succinate:
α-KG + NAD+ + CoA succinyl-CoA + CO2 + NADH
Succinyl-CoA + Pi + GDP succinate + CoA + GTP
Subsequent enzymatic reactions are sequential oxidation of succinate to
regenerate oxaloacetate for the next round of TCA cycle. The first of the series
is the isomerisation of succinate to fumarate, catalysed by membrane-localised
succinate dehydrogenase, also known as complex II of the ETC:
Succinate + FAD+ fumarate + FADH2
Fumarate is converted to malate by fumarate hydratase. Malate is then
oxidised to oxaloacetate by malate dehydrogenase in a reaction that produces
the final NADH in the TCA cycle:
7
Fumarate malate
Malate + NAD+ OAA + NADH
The TCA cycle proceeds as described only under aerobic conditions even
though O2 is not a direct substrate of any enzymes. Its continual activity requires
availability of NAD+ and FAD, and these oxidised forms are regenerated by the
transfer of electrons to O2 at complex IV of the ETC. In other word, oxidation
of NADH by complex I is prerequisite for the maintenance of TCA cycle. When
NADH accumulates, PDH and α-KGDH are inhibited by negative feedback,
thus preventing carbon sources from entering the cycle (Berg, Tymoczko, &
Stryer, 2002).
Evidence suggests that coupling of TCA cycle to OxPhos is tumour suppressive
as it promotes senescence (Kaplon et al., 2013; Olenchock & Vander Heiden,
2013). On the contrary, enhanced anaplerosis confers oncogenic properties.
Anaplerosis is the act of replenishing TCA cycle intermediate pool, usually by
consuming pyruvate or glutamine as substrates. This is advantageous to cancer
cells as large abundance of these intermediates sustain synthesis of fatty acids
and cholesterol, nucleotides, and NEAA (Pavlova & Thompson, 2016). As
exemplified in clinical samples, mutations in succinate dehydrogenase have
been observed in paraganglioma, gastric stromal tumours and acute
lymphoblastic leukaemia (ALL) (Rutter, Winge, & Schiffman, 2010). A
8
correlation between upregulated pyruvate carboxylase activities and
malignancy has also been reported in breast, lung and liver cancers (Fan et al.,
2009; Forbes, Meadows, Clark, & Blanch, 2006; K. J. Liu, Kleps, Henderson,
& Nyhus, 1991).
1.1.3 Metabolism of amidic amino acids
1.1.3.1 Glutamine
Glutamine is a non-polar amino acid that forms the largest pool (more than 60%)
of freely circulating amino acid at a concentration of about 0.5 mM (Bergstrom,
Furst, Noree, & Vinnars, 1974; Mayers & Vander Heiden, 2015). The bulk of it
is synthesised in the skeletal muscles, the adipose tissues to a lesser extent
(Curthoys & Watford, 1995), or the lungs when nutrient is scarce (Hulsewe et
al., 2003; Plumley et al., 1990). The liver on the other hand both consume and
synthesise glutamine, depending on zonation, pH and ammonia level (Curthoys
& Watford, 1995; Hensley, Wasti, & DeBerardinis, 2013) (Fig 1.2).
9
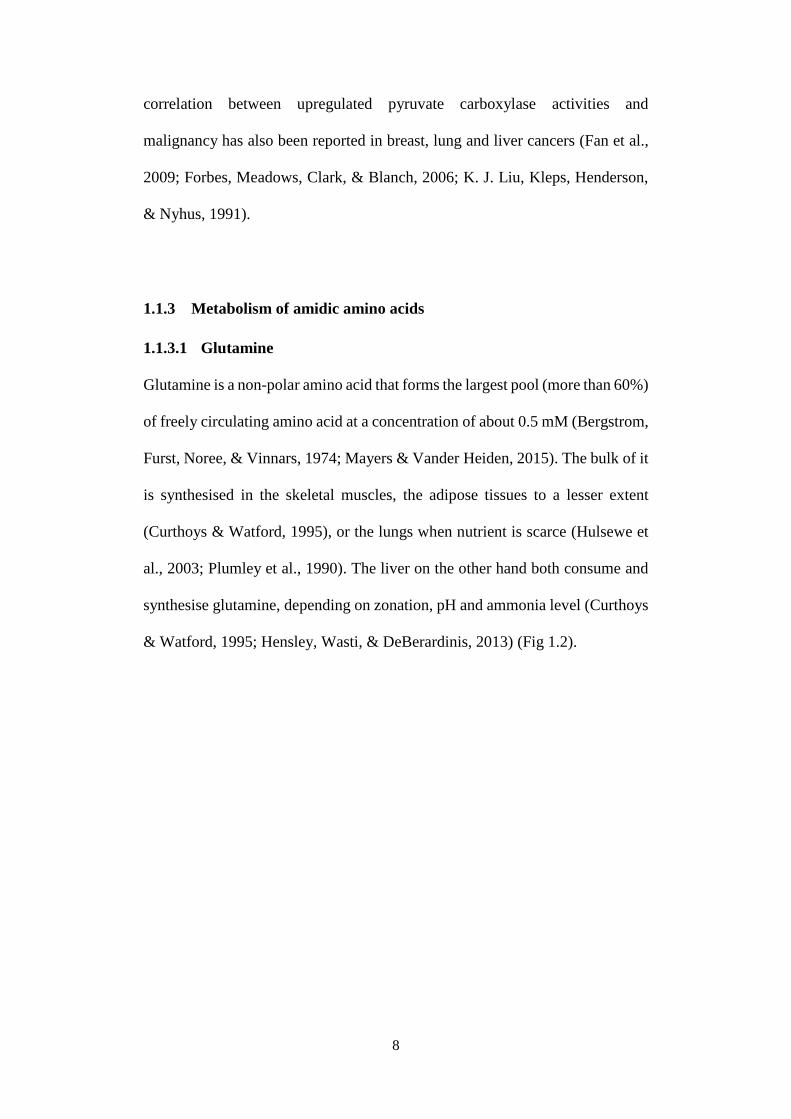
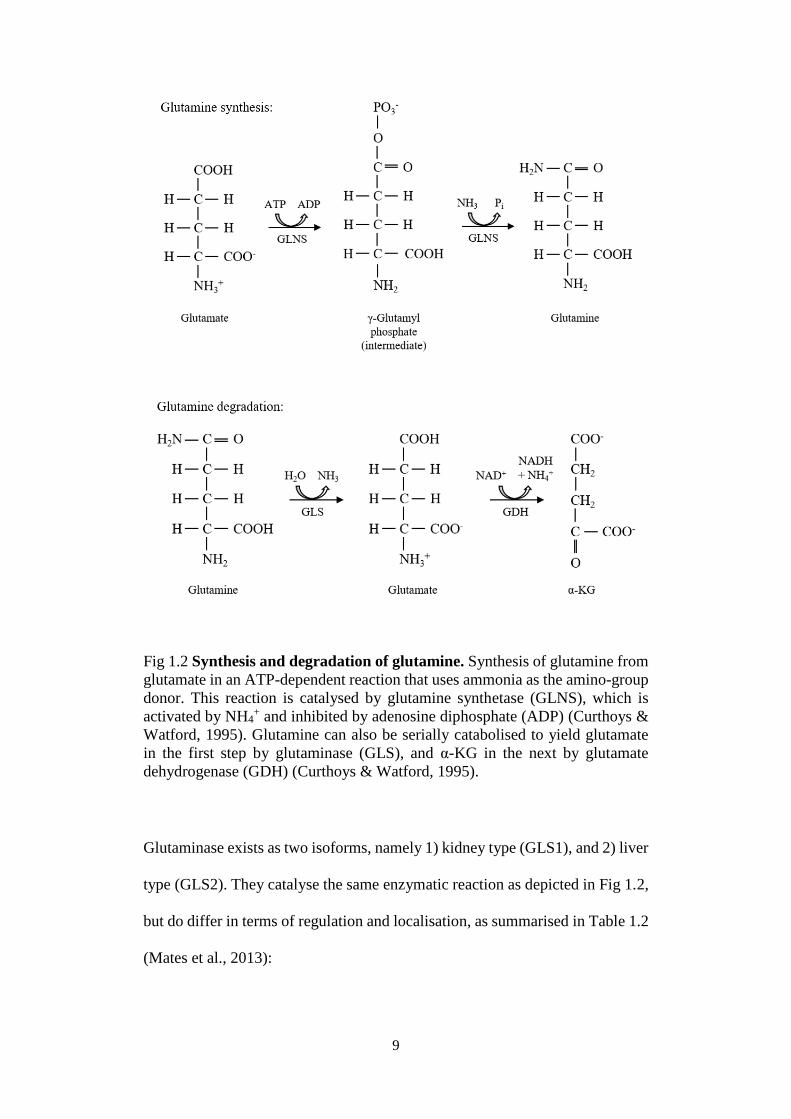
Fig 1.2 Synthesis and degradation of glutamine. Synthesis of glutamine from
glutamate in an ATP-dependent reaction that uses ammonia as the amino-group
donor. This reaction is catalysed by glutamine synthetase (GLNS), which is
activated by NH4+ and inhibited by adenosine diphosphate (ADP) (Curthoys &
Watford, 1995). Glutamine can also be serially catabolised to yield glutamate
in the first step by glutaminase (GLS), and α-KG in the next by glutamate
dehydrogenase (GDH) (Curthoys & Watford, 1995).
Glutaminase exists as two isoforms, namely 1) kidney type (GLS1), and 2) liver
type (GLS2). They catalyse the same enzymatic reaction as depicted in Fig 1.2,
but do differ in terms of regulation and localisation, as summarised in Table 1.2
(Mates et al., 2013):
10
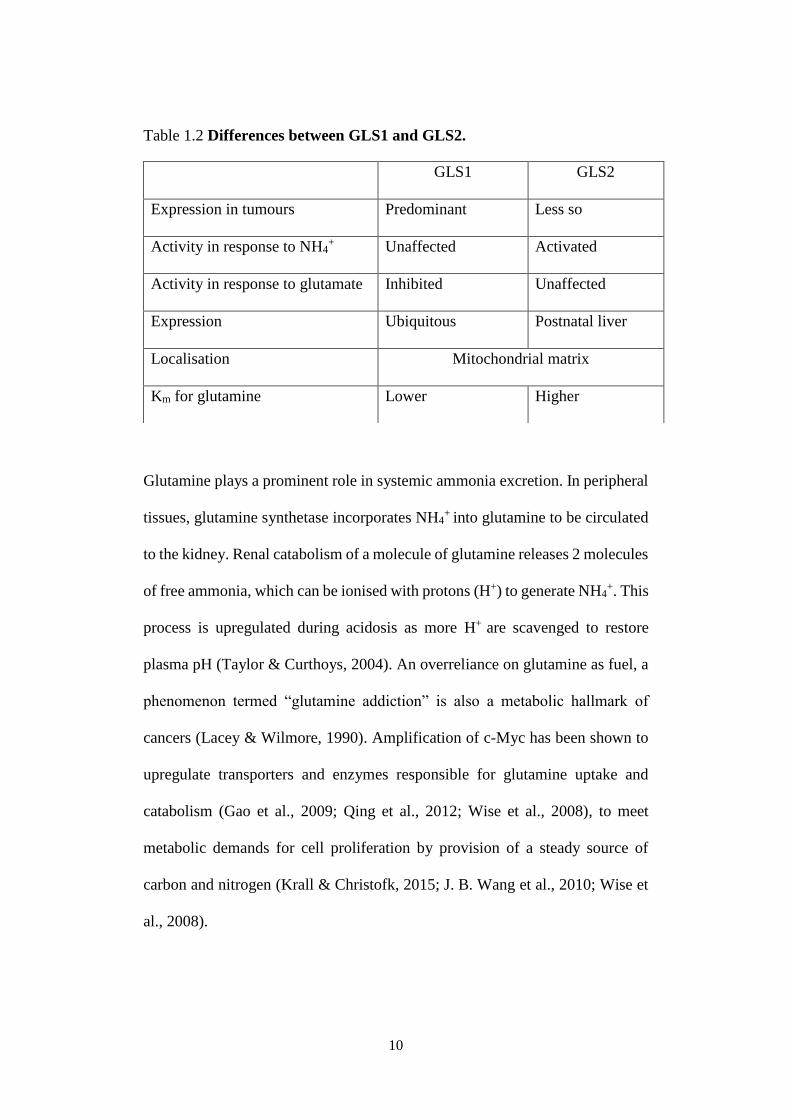
Table 1.2 Differences between GLS1 and GLS2.
Glutamine plays a prominent role in systemic ammonia excretion. In peripheral
tissues, glutamine synthetase incorporates NH4+ into glutamine to be circulated
to the kidney. Renal catabolism of a molecule of glutamine releases 2 molecules
of free ammonia, which can be ionised with protons (H+) to generate NH4+. This
process is upregulated during acidosis as more H+ are scavenged to restore
plasma pH (Taylor & Curthoys, 2004). An overreliance on glutamine as fuel, a
phenomenon termed “glutamine addiction” is also a metabolic hallmark of
cancers (Lacey & Wilmore, 1990). Amplification of c-Myc has been shown to
upregulate transporters and enzymes responsible for glutamine uptake and
catabolism (Gao et al., 2009; Qing et al., 2012; Wise et al., 2008), to meet
metabolic demands for cell proliferation by provision of a steady source of
carbon and nitrogen (Krall & Christofk, 2015; J. B. Wang et al., 2010; Wise et
al., 2008).
GLS1 GLS2
Expression in tumours Predominant Less so
Activity in response to NH4+ Unaffected Activated
Activity in response to glutamate Inhibited Unaffected
Expression Ubiquitous Postnatal liver
Localisation Mitochondrial matrix
Km for glutamine Lower Higher
11
1.1.3.2 Asparagine
Asparagine and glutamine are similar in structure, the latter having one
additional methylene bridge in its side chain. Plasma concentration of
asparagine (0.05 – 0.1 mM) is not as high as that of glutamine (Stegink et al.,
1991).
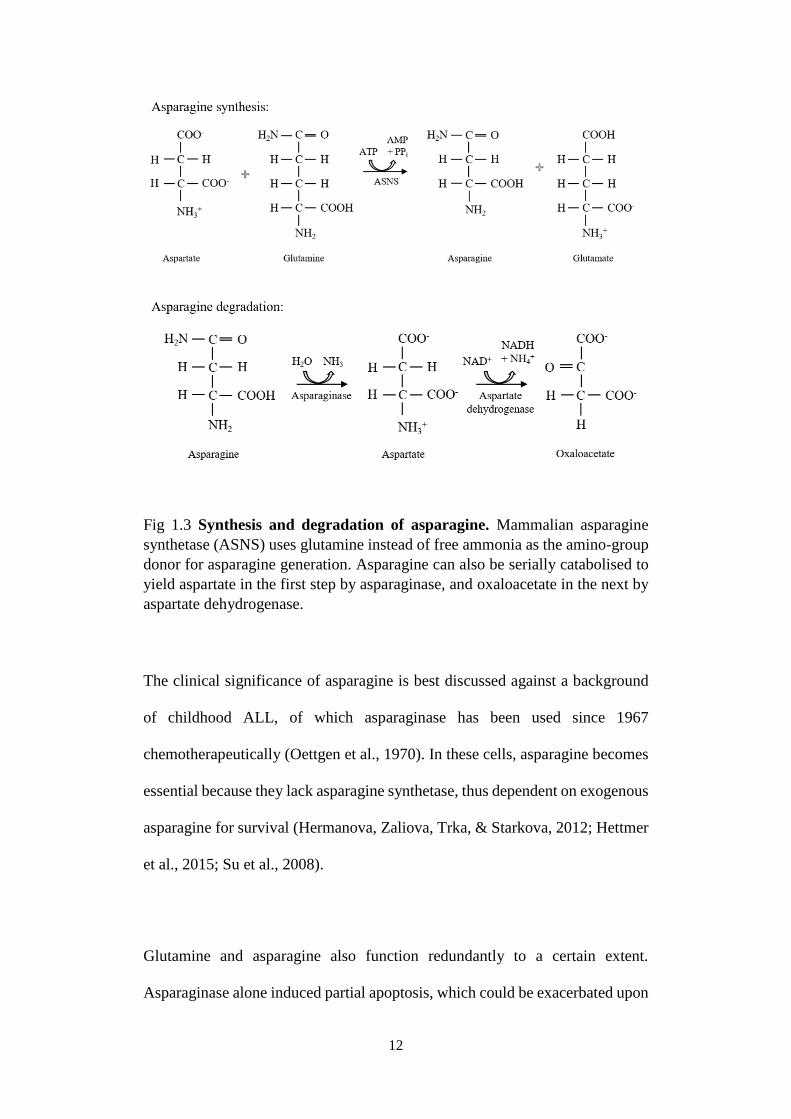
Asparagine synthetase catalyses the biosynthesis of asparagine in an ATP-
dependent manner. There are two bacterial forms of asparagine synthetase, one
which uses ammonia as the nitrogen donor (AS-A), the other uses glutamine
(AS-B). The enzymatic activity of mammalian asparagine synthetase is similar
to AS-B (Balasubramanian, Butterworth, & Kilberg, 2013). Conversely,
asparagine catabolism by asparaginase and aspartate dehydrogenase yields
aspartate and oxaloacetate, respectively (Fig 1.3). Asparaginase exhibits some
glutaminase activity as well, but the Km for this reaction is 100-fold higher
(Muller & Boos, 1998).
12
Fig 1.3 Synthesis and degradation of asparagine. Mammalian asparagine
synthetase (ASNS) uses glutamine instead of free ammonia as the amino-group
donor for asparagine generation. Asparagine can also be serially catabolised to
yield aspartate in the first step by asparaginase, and oxaloacetate in the next by
aspartate dehydrogenase.
The clinical significance of asparagine is best discussed against a background
of childhood ALL, of which asparaginase has been used since 1967
chemotherapeutically (Oettgen et al., 1970). In these cells, asparagine becomes
essential because they lack asparagine synthetase, thus dependent on exogenous
asparagine for survival (Hermanova, Zaliova, Trka, & Starkova, 2012; Hettmer
et al., 2015; Su et al., 2008).
Glutamine and asparagine also function redundantly to a certain extent.
Asparaginase alone induced partial apoptosis, which could be exacerbated upon
13
co-inhibition of glutamine synthetase (Tardito et al., 2007). Depression of TCA
cycle intermediate pools and ETC impairment following glutamine withdrawal
could be restored with supplementation of aspartate, a product of asparagine
deamidation (Birsoy et al., 2015). This highlights the previously neglected role
of asparagine as a promoter of cellular survival.
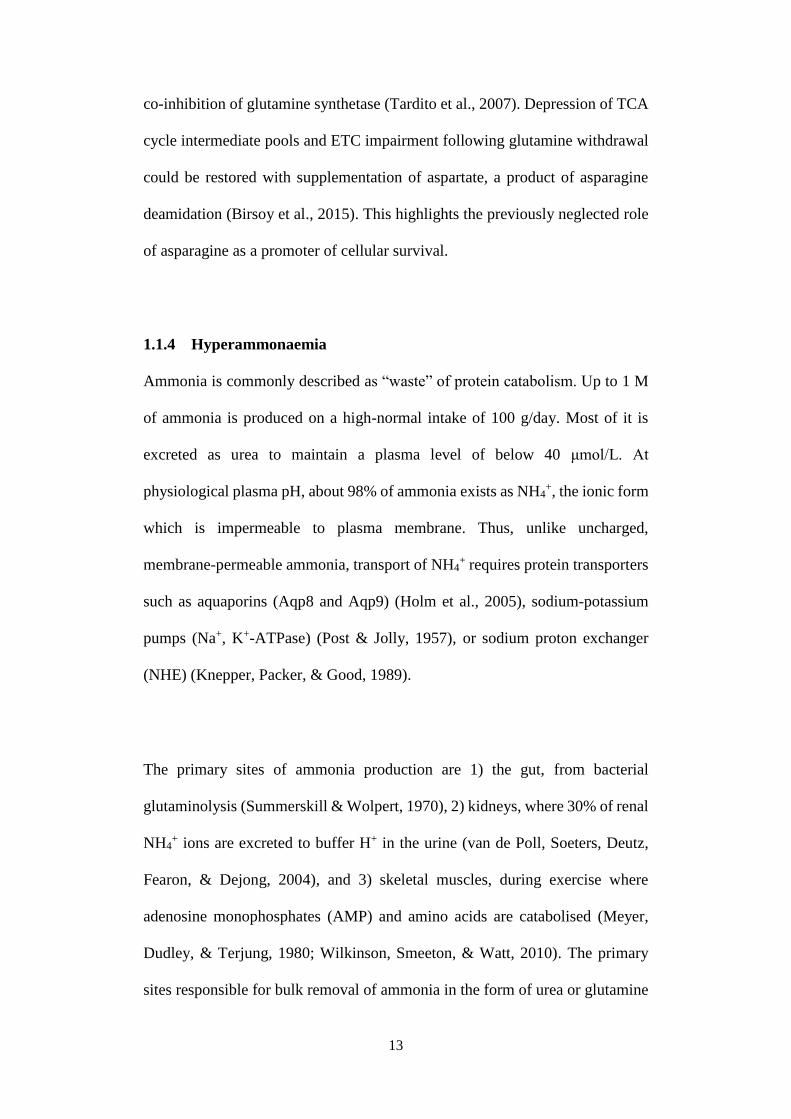
1.1.4 Hyperammonaemia
Ammonia is commonly described as “waste” of protein catabolism. Up to 1 M
of ammonia is produced on a high-normal intake of 100 g/day. Most of it is
excreted as urea to maintain a plasma level of below 40 μmol/L. At
physiological plasma pH, about 98% of ammonia exists as NH4+, the ionic form
which is impermeable to plasma membrane. Thus, unlike uncharged,
membrane-permeable ammonia, transport of NH4+ requires protein transporters
such as aquaporins (Aqp8 and Aqp9) (Holm et al., 2005), sodium-potassium
pumps (Na+, K+-ATPase) (Post & Jolly, 1957), or sodium proton exchanger
(NHE) (Knepper, Packer, & Good, 1989).
The primary sites of ammonia production are 1) the gut, from bacterial
glutaminolysis (Summerskill & Wolpert, 1970), 2) kidneys, where 30% of renal
NH4+ ions are excreted to buffer H+ in the urine (van de Poll, Soeters, Deutz,
Fearon, & Dejong, 2004), and 3) skeletal muscles, during exercise where
adenosine monophosphates (AMP) and amino acids are catabolised (Meyer,
Dudley, & Terjung, 1980; Wilkinson, Smeeton, & Watt, 2010). The primary
sites responsible for bulk removal of ammonia in the form of urea or glutamine
14
are the liver and skeletal muscles, respectively (Wright, Noiret, Olde Damink,
& Jalan, 2011).
In vitro systems lack sophisticated interorgan transport and disposal of
ammonia, necessitating employment of other means to control ammonia levels.
Two strategies can be considered: 1) reduced dependence on exogenous
glutamine, or 2) filtering of culture media. To achieve the aforementioned, cells
can be genetically modified to overexpress glutamine synthetase, or adapted for
survival in glutamine-free media. Controlled addition of glutamine or
substitution with stable derivatives also prevents spontaneous glutamine
decomposition. On the other hand, ion-exchange membranes and filters, or
electrodialysis can efficiently remove ammonia from culture media
(Capiaumont et al., 1995; Schneider, Marison, & von Stockar, 1996).
In humans, maintenance of plasma ammonia at low basal of 40 μmol/L is
important, and this is predominantly achieved by incorporating excess ammonia
into glutamine and alanine for subsequent processing via hepatic urea cycle. In
the event of increased ammonia production or impaired clearance,
hyperammonaemia sets in. Hyperammonaemia is clinically defined as plasma
ammonia concentration above 50 μmol/L in adults, or above 100 μmol/L in
neonates. Clinical presentations of hyperammonaemia begin at plasma
ammonia >100 mg/dL as appetite loss, nausea, insomnia, agitation and
personality changes. The severity of these symptoms increases at higher
ammonia level where seizures, loss of consciousness, coma and eventually
15
death may occur. Compared to other organs, the brain is most susceptible to
hyperammonaemia, rapidly developing into cerebral oedema (Paprocka &
Jamroz, 2012). Liver dysfunctions, hereditary urea cycle disorders, infections
with urea-splitting organisms, and drug administration (for example,
asparaginase, 5-fluorouracil and carbamazepine) all promote synthesis of
ammonia in vivo (Paprocka & Jamroz, 2012; Walker, 2012).
Episodes of hyperammonaemia are also regularly observed in tumours’ milieu.
Low millimolar concentrations of ammonia have been reported in the interstitial
fluid of human tumour xenografts and tumour-bearing rats (Chance, Cao, Foley-
Nelson, Nelson, & Fischer, 1989; Chance, Cao, Nelson, Foley-Nelson, &
Fischer, 1988; C. H. Eng, Yu, Lucas, White, & Abraham, 2010). How
hyperammonaemia modulates cancer cell functions, if at all, remains to be
investigated.
1.2 Oncogenesis at the signalling level
Cells that are mutated in their genome but escape repair or apoptosis may
transform, and oftentimes this involves translation of proteins with aberrant
functions that allow cells to proliferate uninhibitedly. Six hallmarks of cancers
were first proposed in 2000 (Hanahan & Weinberg, 2000) to characterise
cancers in general, but have since been updated (Hanahan & Weinberg, 2011)
to include two emerging ones. They are 1) constitutive proliferation, 2)
insensitivity to growth inhibitory signals, 3) ability to metastasise, 4) bypassing
senescence checkpoints, 5) expansion of new vasculature network, 6)
16
insensitivity to death signals, 7) dysregulated cellular energetics, and 8) evasion
of host immunity.
To achieve these, cells commonly repurpose cell signalling, assisted by
modified protein effectors encoded by mutated genes. Great effort has been
made to develop therapeutics that intervene such pathways. This year, U.S.
Food & Drugs Administration (FDA) has approved for the first time, treatment
with pembrolizumab for any solid tumour harbouring biomarkers for
microsatellite instability. This is in contrast with the convention of prescribing
drugs according to the tumour’s site of origin (U.S. Food & Drugs
Administration, 2017). Such advancement further underscores the significance
of intervening aberrant signalling pathways to combat oncogenesis. This thesis
focused on the regulation of two key oncogenic pathways, 1) HIF-1α, and 2)
mTORC1 in response to oncometabolites.
1.2.1 Hypoxia inducible factor (HIF)-1α
1.2.1.1 Structural description of HIF
In the early 90’s, the consensus motif now known as hypoxia response element
(HRE) was first identified in the 3’ enhancer region of the gene that encodes for
erythropoietin. Subsequently, HIF-1 was identified as a HRE-binding protein
(Goldberg, Dunning, & Bunn, 1988; Semenza, Nejfelt, Chi, & Antonarakis,
1991). Heterodimerisation of one α- and one β-subunit forms a functional HIF
transcription factor that binds to target promoters at the HRE region. In humans,
there are 3 paralogues of the α-subunit: HIF-1α, HIF-2α and HIF-3α. Either of
17
these can bind with one of the three paralogues of the β-subunit: HIF-1β, HIF-
2β and HIF-3β, also known as aryl hydrocarbon receptor nuclear translocator
(ARNT). The α- and β-subunits are differentially regulated. The β-subunits are
expressed constitutively whereas the α-subunits are regulated in an oxygen-
sensitive manner. For both academic and clinical significance, HIF-1α receives
the most investigative attention as it is 1) ubiquitously expressed, 2) the
preferred substrate for PHD2, the most abundantly and also ubiquitously
expressed paralogue of PHDs, and 3) widespread involvement in oncogenesis
(Semenza, 2003).
The amino terminal contains a basic helix-loop-helix (bHLH) domain that
allows interaction with the DNA. Adjacent to it is the Per-ARNT-Sim (PAS)
domain where heterodimerisation with the β-subunits take place. The oxygen-
dependent degradation domain (ODD) has two proline residues that when
hydroxylated, targets the α-subunits to proteasomal degradation. This allows the
transcription factor to be regulated in an oxygen-sensitive manner. Towards the
carboxy terminal are two transactivation domains – the N- and C-terminal
transactivation domain (N- and C-TAD) for direct interaction with
transcriptional coactivators CREB binding protein (CBP) and p300 family. On
the contrary, the β-subunits harbour bHLH and PAS domains, but not the ODD.
Thus, the regulation of β-subunits expression or stability is insensitive to O2
availability (Smirnova et al., 2012).
18
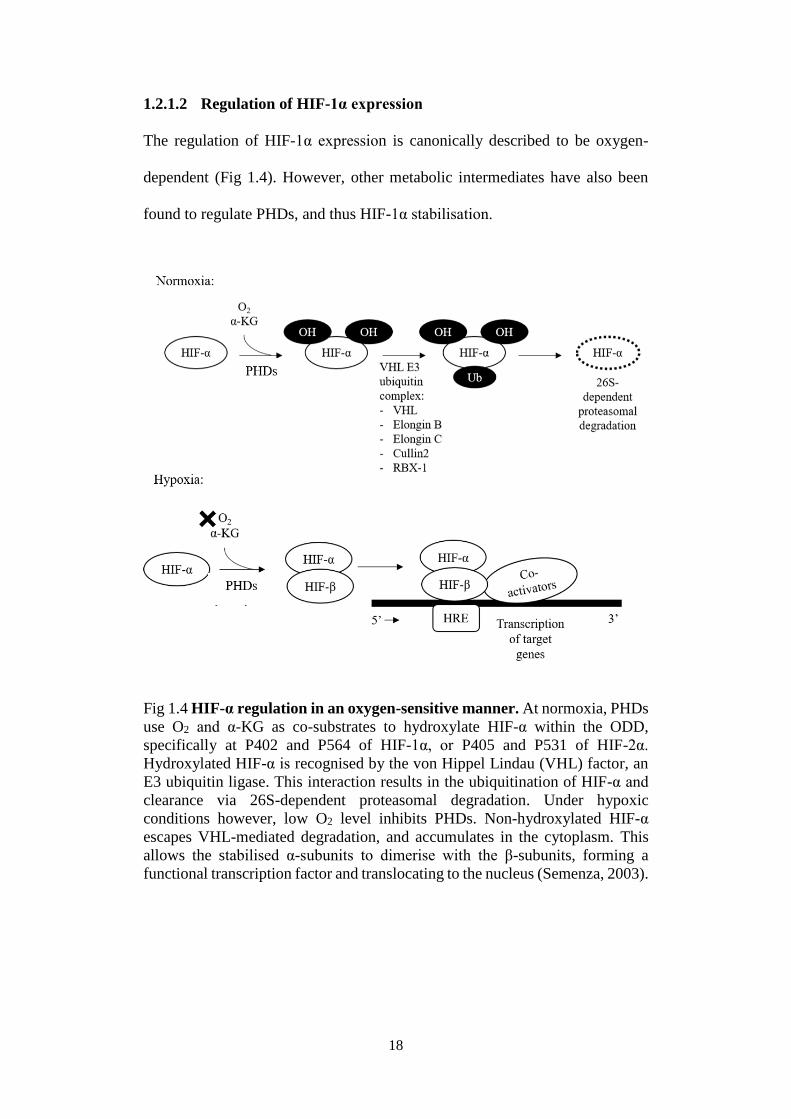
1.2.1.2 Regulation of HIF-1α expression
The regulation of HIF-1α expression is canonically described to be oxygen-
dependent (Fig 1.4). However, other metabolic intermediates have also been
found to regulate PHDs, and thus HIF-1α stabilisation.
Fig 1.4 HIF-α regulation in an oxygen-sensitive manner. At normoxia, PHDs
use O2 and α-KG as co-substrates to hydroxylate HIF-α within the ODD,
specifically at P402 and P564 of HIF-1α, or P405 and P531 of HIF-2α.
Hydroxylated HIF-α is recognised by the von Hippel Lindau (VHL) factor, an
E3 ubiquitin ligase. This interaction results in the ubiquitination of HIF-α and
clearance via 26S-dependent proteasomal degradation. Under hypoxic
conditions however, low O2 level inhibits PHDs. Non-hydroxylated HIF-α
escapes VHL-mediated degradation, and accumulates in the cytoplasm. This
allows the stabilised α-subunits to dimerise with the β-subunits, forming a
functional transcription factor and translocating to the nucleus (Semenza, 2003).
19
Besides suppression of proteasome clearance during hypoxia, enhanced de novo
synthesis in response to certain stimuli also promotes HIF-1α expression. This
is mediated by the phosphatidylinositol 3-phosphate kinase
(PI3K)/Akt/mTORC1 or mitogen-activated protein kinase (MAPK) pathways
which functions are associated with protein translation (Semenza, 2003).
Constitutive activation of PI3K/Akt signalling in tuberous sclerosis 2 (TSC2)-/-
cells leads to stimulation of mTORC1 and upregulation of HIF-1α synthesis
(Land & Tee, 2007). Likewise, in liver kinase B1 (LKB1) and AMP-activated
protein kinase (AMPK)-deficient mice, a concurrent increase in mTORC1
activities and HIF-1α protein level has been observed (Shackelford et al., 2009).
Growth factors may also act as upstream stimuli of these signalling pathways,
as in the case of hepatocyte growth factor or angiotensin II-induced HIF-1α
expression (Sanchez-Lopez et al., 2005; Tacchini, Dansi, Matteucci, &
Desiderio, 2001).
The influence of mitochondria-derived ROS on HIF-1α stabilisation has been
extensively studied since the proposal of ROS as a direct inhibitor of PHDs.
Superoxides produced at complex III of the ETC is described as an oxidiser of
cofactor ferrous ions (Fe2+). Its oxidation to ferric ions (Fe3+) inactivates PHDs,
resulting in HIF-1α stabilisation (Brunelle et al., 2005; Guzy et al., 2005).
However, counter-evidence has also been presented, in which PHDs are shown
to be non-responsive to redox modulations by hydrogen peroxide (H2O2)
(Masson et al., 2012). Inhibition of ETC is also thought to reduce O2
consumption at complex IV, and allows O2 to be redistributed to other cellular
compartments, especially where PHDs are localised for their reactivation
20
(Hagen, Taylor, Lam, & Moncada, 2003). Mitochondria-derived ROS may even
be dispensable in regulating HIF-1α expression. Rho 0 cells, essentially cells
that have been depleted of mitochondrial DNA, are still capable of stabilising
HIF-1α in response to hypoxia (Schroedl, McClintock, Budinger, & Chandel,
2002).
1.2.1.3 Prolyl hydroxylases (PHDs)
Four paralogues of PHDs have been identified: PHD1, PHD2, PHD3 and P4H-
TM in humans. PHD1 and PHD2 have 407 and 426 amino acids residues
respectively, whereas PHD3 have only 239, due to the absence of N-terminal
domains (harbours only a catalytic domain). The expression of PHD1 and PHD3
is the highest in the testes and cardiac myocytes respectively, whereas PHD2 is
ubiquitously expressed in the highest abundance across tissues. Their cellular
localisations vary as well; PHD1 is mainly nuclear, PHD2 is primarily
cytoplasmic while PHD3 occupies both nuclear and cytoplasmic compartments
(Smirnova et al., 2012). Strikingly, P4H-TM is anchored to the membrane of
the endoplasmic reticulum (ER) with its catalytic domain facing the lumen.
Despite this unusual orientation (catalytic domain faces away from cytoplasmic
and nuclear compartments, which are where HIF-1α usually localise to), it still
hydroxylates HIF-1α and other paralogues (Myllyharju, 2013).
The PHDs are members of 2-oxoglutarate dependent dioxygenases (2-OGDDs)
family of enzymes. They use O2 and α-KG as obligatory co-substrates, in
addition to Fe2+ and ascorbate as cofactors to carry out primarily but not limited
21
to, hydroxylation reactions. A generic enzymatic reaction involves
stoichiometric decarboxylation of α-KG (electron donor) and receipt of one
atom of oxygen, to generate succinate and incorporate a hydroxyl group on a
proline residue of the substrate protein (Smirnova et al., 2012).
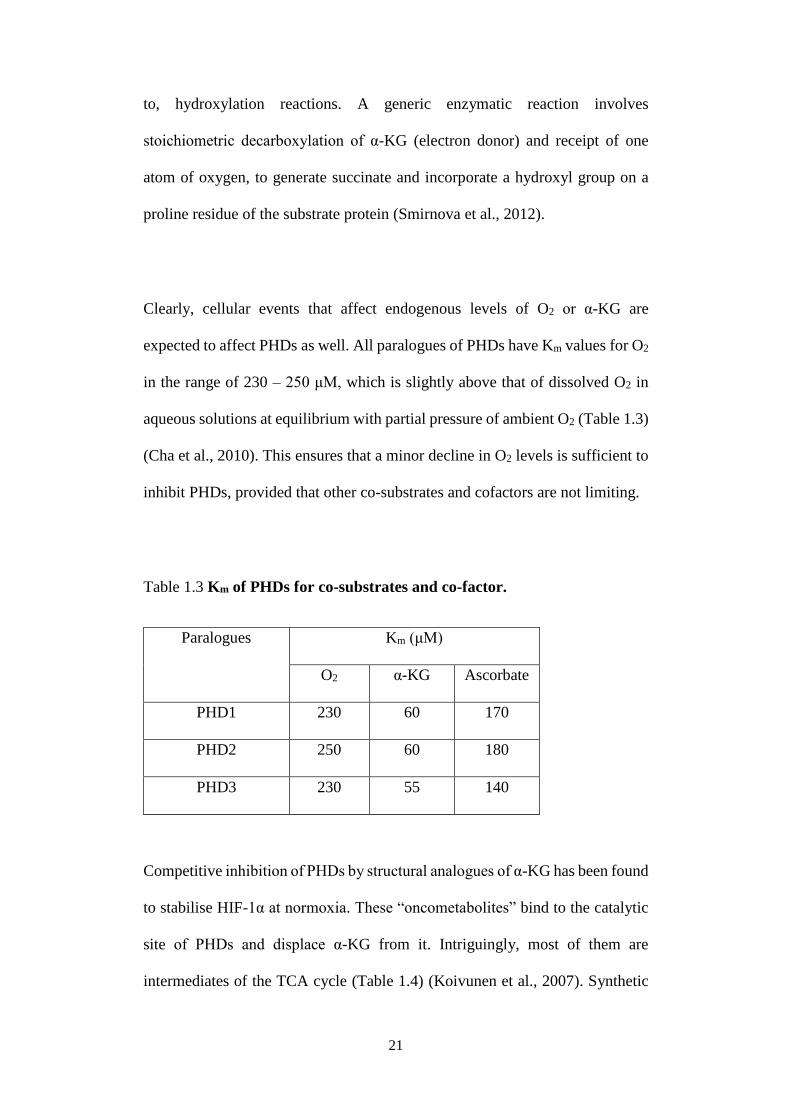
Clearly, cellular events that affect endogenous levels of O2 or α-KG are
expected to affect PHDs as well. All paralogues of PHDs have Km values for O2
in the range of 230 – 250 μM, which is slightly above that of dissolved O2 in
aqueous solutions at equilibrium with partial pressure of ambient O2 (Table 1.3)
(Cha et al., 2010). This ensures that a minor decline in O2 levels is sufficient to
inhibit PHDs, provided that other co-substrates and cofactors are not limiting.
Table 1.3 Km of PHDs for co-substrates and co-factor.
Paralogues Km (μM)
O2 α-KG Ascorbate
PHD1 230 60 170
PHD2 250 60 180
PHD3 230 55 140
Competitive inhibition of PHDs by structural analogues of α-KG has been found
to stabilise HIF-1α at normoxia. These “oncometabolites” bind to the catalytic
site of PHDs and displace α-KG from it. Intriguingly, most of them are
intermediates of the TCA cycle (Table 1.4) (Koivunen et al., 2007). Synthetic
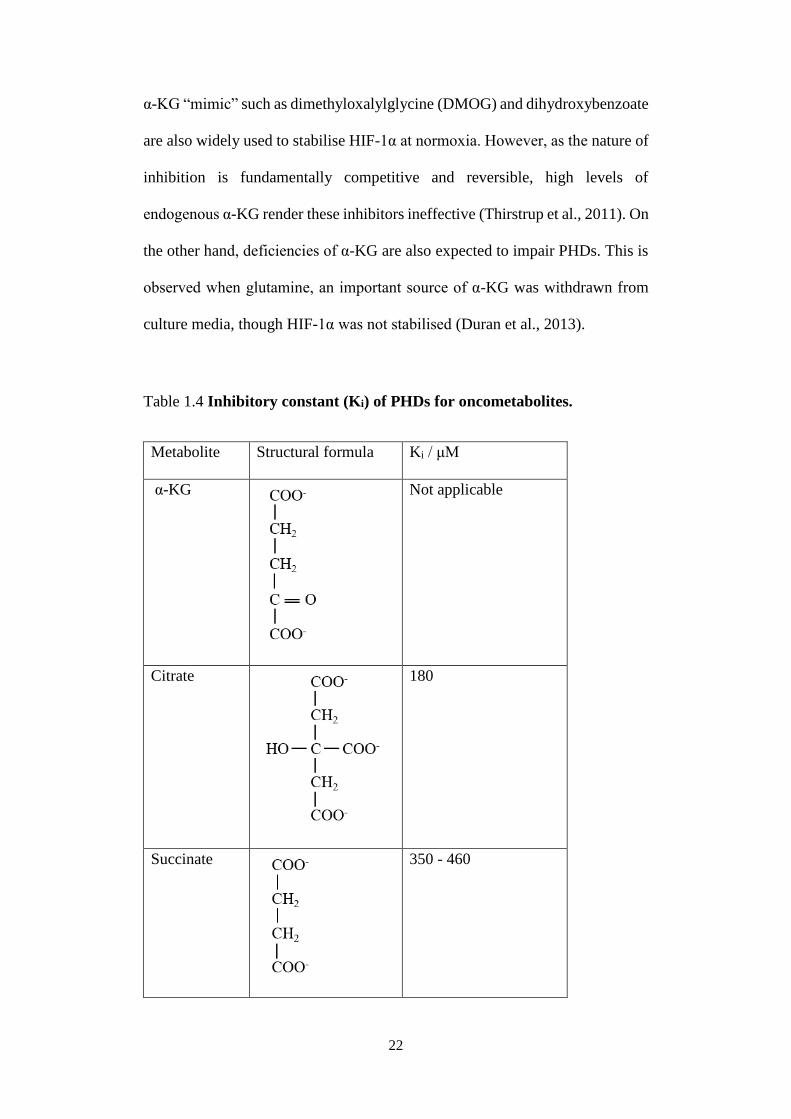
22
α-KG “mimic” such as dimethyloxalylglycine (DMOG) and dihydroxybenzoate
are also widely used to stabilise HIF-1α at normoxia. However, as the nature of
inhibition is fundamentally competitive and reversible, high levels of
endogenous α-KG render these inhibitors ineffective (Thirstrup et al., 2011). On
the other hand, deficiencies of α-KG are also expected to impair PHDs. This is
observed when glutamine, an important source of α-KG was withdrawn from
culture media, though HIF-1α was not stabilised (Duran et al., 2013).
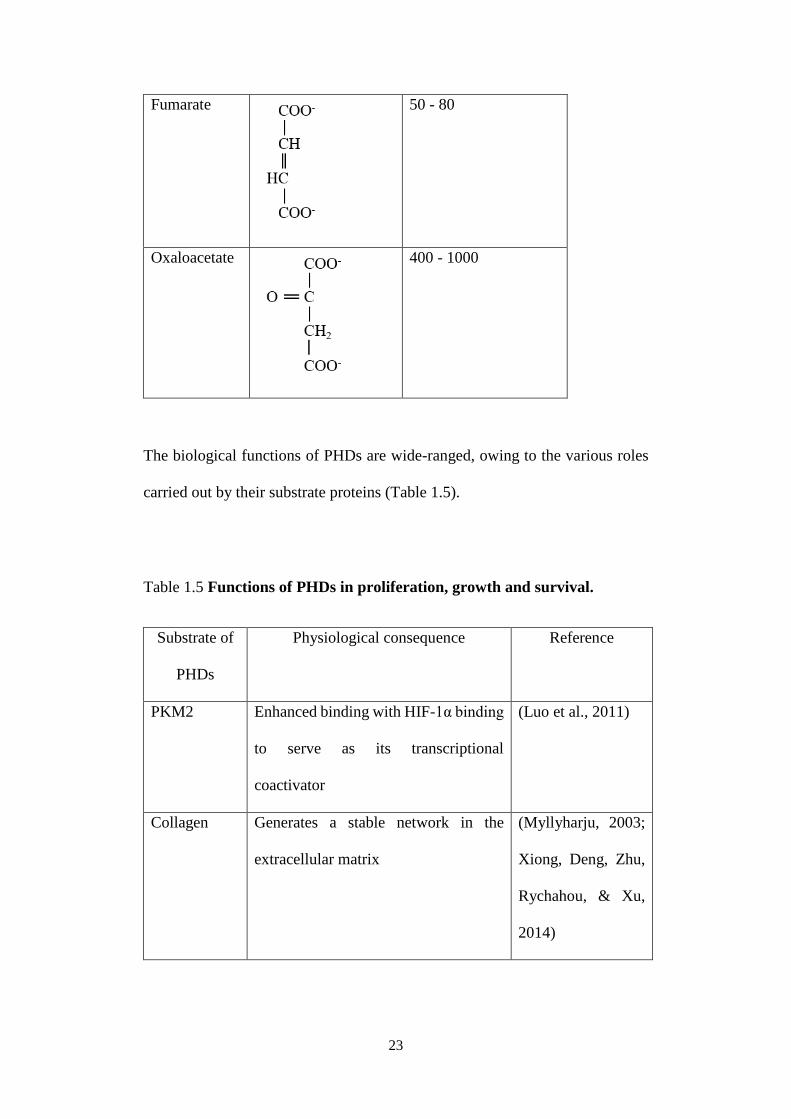
Table 1.4 Inhibitory constant (Ki) of PHDs for oncometabolites.
Metabolite Structural formula Ki / μM
α-KG
Not applicable
Citrate
180
Succinate
350 - 460
23
Fumarate
50 - 80
Oxaloacetate
400 - 1000
The biological functions of PHDs are wide-ranged, owing to the various roles
carried out by their substrate proteins (Table 1.5).
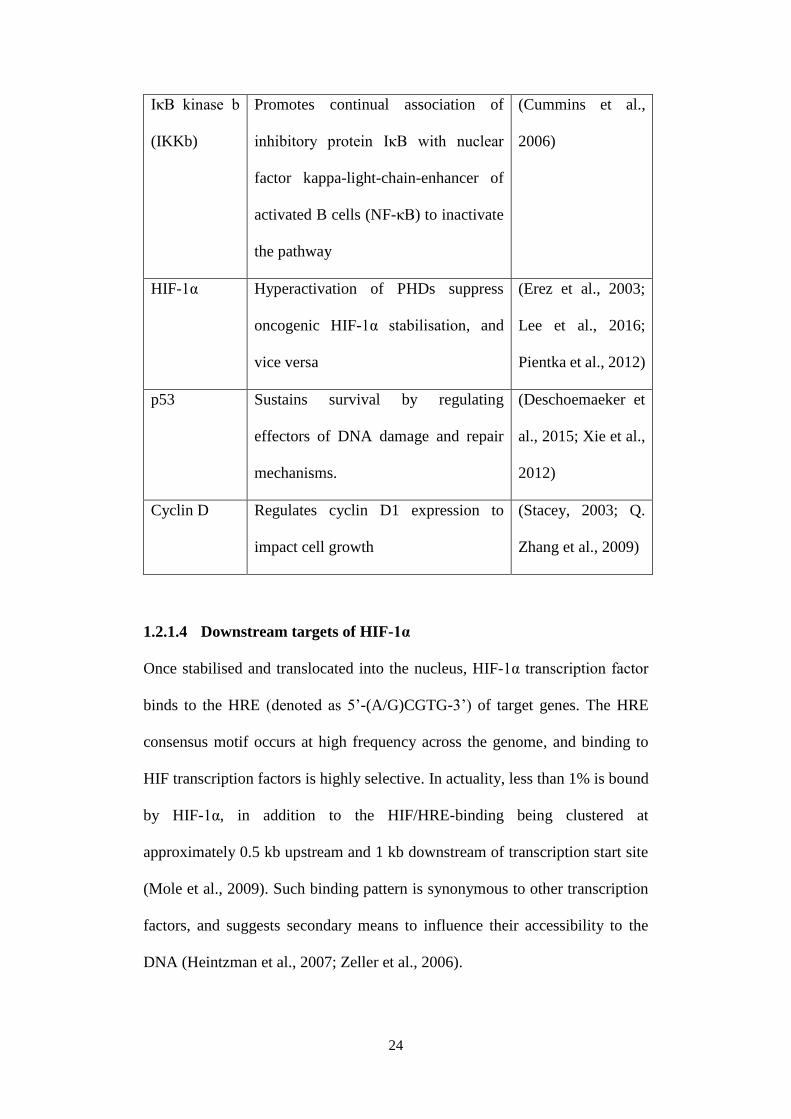
Table 1.5 Functions of PHDs in proliferation, growth and survival.
Substrate of
PHDs
Physiological consequence Reference
PKM2 Enhanced binding with HIF-1α binding
to serve as its transcriptional
coactivator
(Luo et al., 2011)
Collagen Generates a stable network in the
extracellular matrix
(Myllyharju, 2003;
Xiong, Deng, Zhu,
Rychahou, & Xu,
2014)
24
IκB kinase b
(IKKb)
Promotes continual association of
inhibitory protein IκB with nuclear
factor kappa-light-chain-enhancer of
activated B cells (NF-κB) to inactivate
the pathway
(Cummins et al.,
2006)
HIF-1α Hyperactivation of PHDs suppress
oncogenic HIF-1α stabilisation, and
vice versa
(Erez et al., 2003;
Lee et al., 2016;
Pientka et al., 2012)
p53 Sustains survival by regulating
effectors of DNA damage and repair
mechanisms.
(Deschoemaeker et
al., 2015; Xie et al.,
2012)
Cyclin D Regulates cyclin D1 expression to
impact cell growth
(Stacey, 2003; Q.
Zhang et al., 2009)
1.2.1.4 Downstream targets of HIF-1α
Once stabilised and translocated into the nucleus, HIF-1α transcription factor
binds to the HRE (denoted as 5’-(A/G)CGTG-3’) of target genes. The HRE
consensus motif occurs at high frequency across the genome, and binding to
HIF transcription factors is highly selective. In actuality, less than 1% is bound
by HIF-1α, in addition to the HIF/HRE-binding being clustered at
approximately 0.5 kb upstream and 1 kb downstream of transcription start site
(Mole et al., 2009). Such binding pattern is synonymous to other transcription
factors, and suggests secondary means to influence their accessibility to the
DNA (Heintzman et al., 2007; Zeller et al., 2006).
25
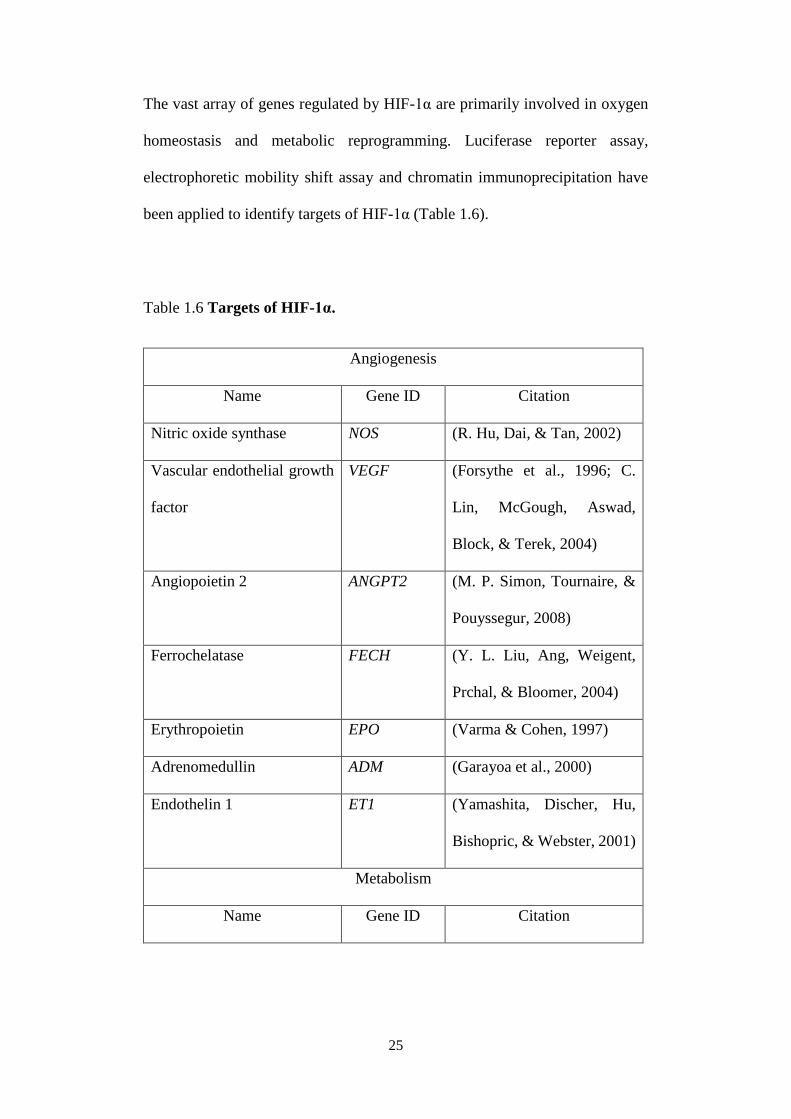
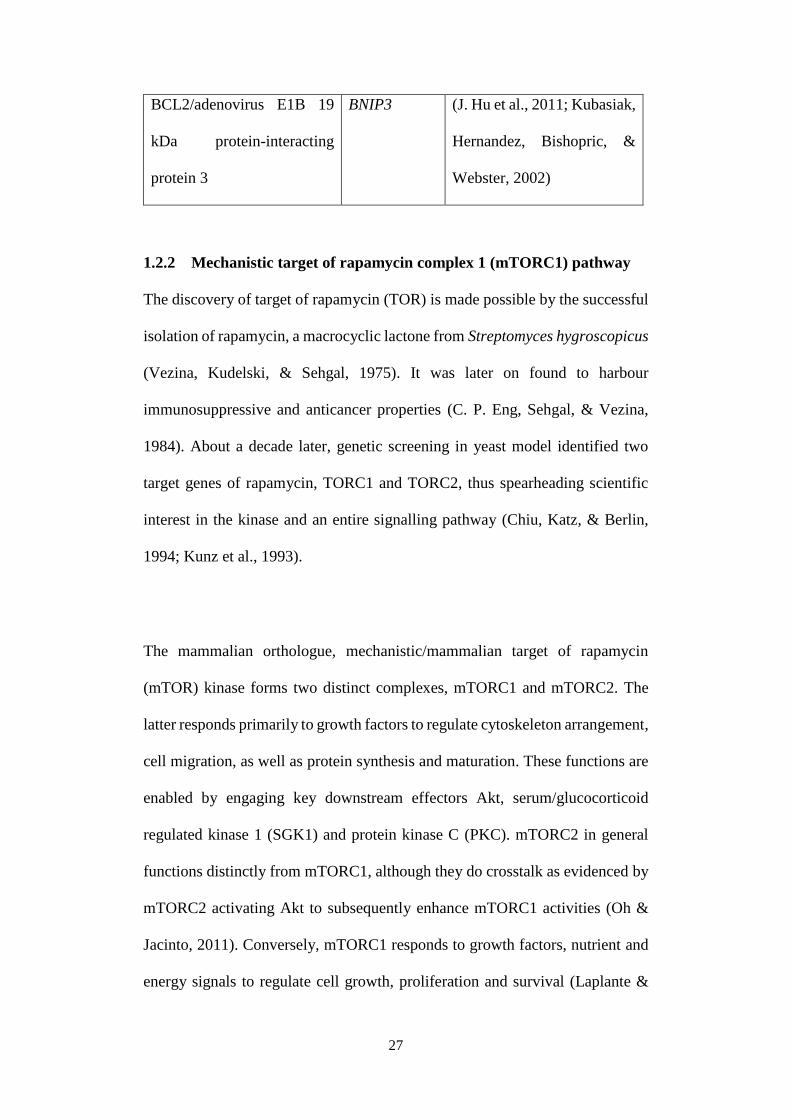
The vast array of genes regulated by HIF-1α are primarily involved in oxygen
homeostasis and metabolic reprogramming. Luciferase reporter assay,
electrophoretic mobility shift assay and chromatin immunoprecipitation have
been applied to identify targets of HIF-1α (Table 1.6).
Table 1.6 Targets of HIF-1α.
Angiogenesis
Name Gene ID Citation
Nitric oxide synthase NOS (R. Hu, Dai, & Tan, 2002)
Vascular endothelial growth
factor
VEGF (Forsythe et al., 1996; C.
Lin, McGough, Aswad,
Block, & Terek, 2004)
Angiopoietin 2 ANGPT2 (M. P. Simon, Tournaire, &
Pouyssegur, 2008)
Ferrochelatase FECH (Y. L. Liu, Ang, Weigent,
Prchal, & Bloomer, 2004)
Erythropoietin EPO (Varma & Cohen, 1997)
Adrenomedullin ADM (Garayoa et al., 2000)
Endothelin 1 ET1 (Yamashita, Discher, Hu,
Bishopric, & Webster, 2001)
Metabolism
Name Gene ID Citation
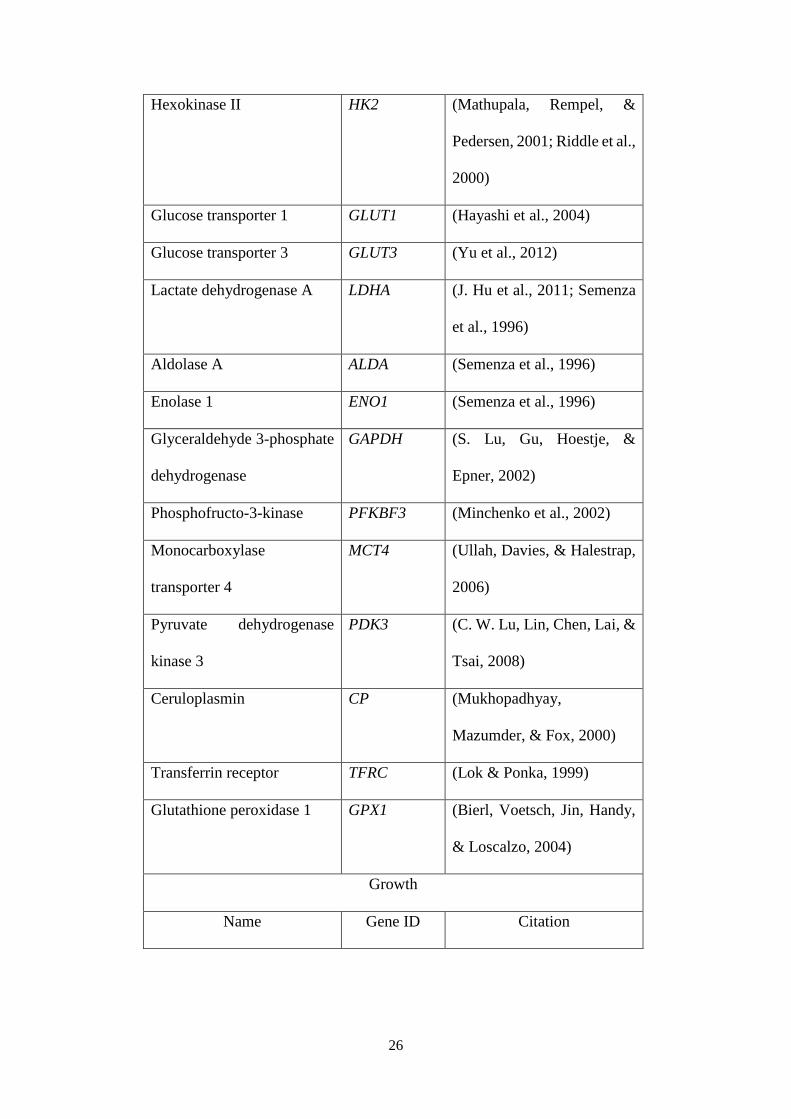
26
Hexokinase II HK2 (Mathupala, Rempel, &
Pedersen, 2001; Riddle et al.,
2000)
Glucose transporter 1 GLUT1 (Hayashi et al., 2004)
Glucose transporter 3 GLUT3 (Yu et al., 2012)
Lactate dehydrogenase A LDHA (J. Hu et al., 2011; Semenza
et al., 1996)
Aldolase A ALDA (Semenza et al., 1996)
Enolase 1 ENO1 (Semenza et al., 1996)
Glyceraldehyde 3-phosphate
dehydrogenase
GAPDH (S. Lu, Gu, Hoestje, &
Epner, 2002)
Phosphofructo-3-kinase PFKBF3 (Minchenko et al., 2002)
Monocarboxylase
transporter 4
MCT4 (Ullah, Davies, & Halestrap,
2006)
Pyruvate dehydrogenase
kinase 3
PDK3 (C. W. Lu, Lin, Chen, Lai, &
Tsai, 2008)
Ceruloplasmin CP (Mukhopadhyay,
Mazumder, & Fox, 2000)
Transferrin receptor TFRC (Lok & Ponka, 1999)
Glutathione peroxidase 1 GPX1 (Bierl, Voetsch, Jin, Handy,
& Loscalzo, 2004)
Growth
Name Gene ID Citation
27
BCL2/adenovirus E1B 19
kDa protein-interacting
protein 3
BNIP3 (J. Hu et al., 2011; Kubasiak,
Hernandez, Bishopric, &
Webster, 2002)
1.2.2 Mechanistic target of rapamycin complex 1 (mTORC1) pathway
The discovery of target of rapamycin (TOR) is made possible by the successful
isolation of rapamycin, a macrocyclic lactone from Streptomyces hygroscopicus
(Vezina, Kudelski, & Sehgal, 1975). It was later on found to harbour
immunosuppressive and anticancer properties (C. P. Eng, Sehgal, & Vezina,
1984). About a decade later, genetic screening in yeast model identified two
target genes of rapamycin, TORC1 and TORC2, thus spearheading scientific
interest in the kinase and an entire signalling pathway (Chiu, Katz, & Berlin,
1994; Kunz et al., 1993).
The mammalian orthologue, mechanistic/mammalian target of rapamycin
(mTOR) kinase forms two distinct complexes, mTORC1 and mTORC2. The
latter responds primarily to growth factors to regulate cytoskeleton arrangement,
cell migration, as well as protein synthesis and maturation. These functions are
enabled by engaging key downstream effectors Akt, serum/glucocorticoid
regulated kinase 1 (SGK1) and protein kinase C (PKC). mTORC2 in general
functions distinctly from mTORC1, although they do crosstalk as evidenced by
mTORC2 activating Akt to subsequently enhance mTORC1 activities (Oh &
Jacinto, 2011). Conversely, mTORC1 responds to growth factors, nutrient and
energy signals to regulate cell growth, proliferation and survival (Laplante &
28
Sabatini, 2012). Its regulation in response to nitrogenous metabolites is the
focus of this thesis.
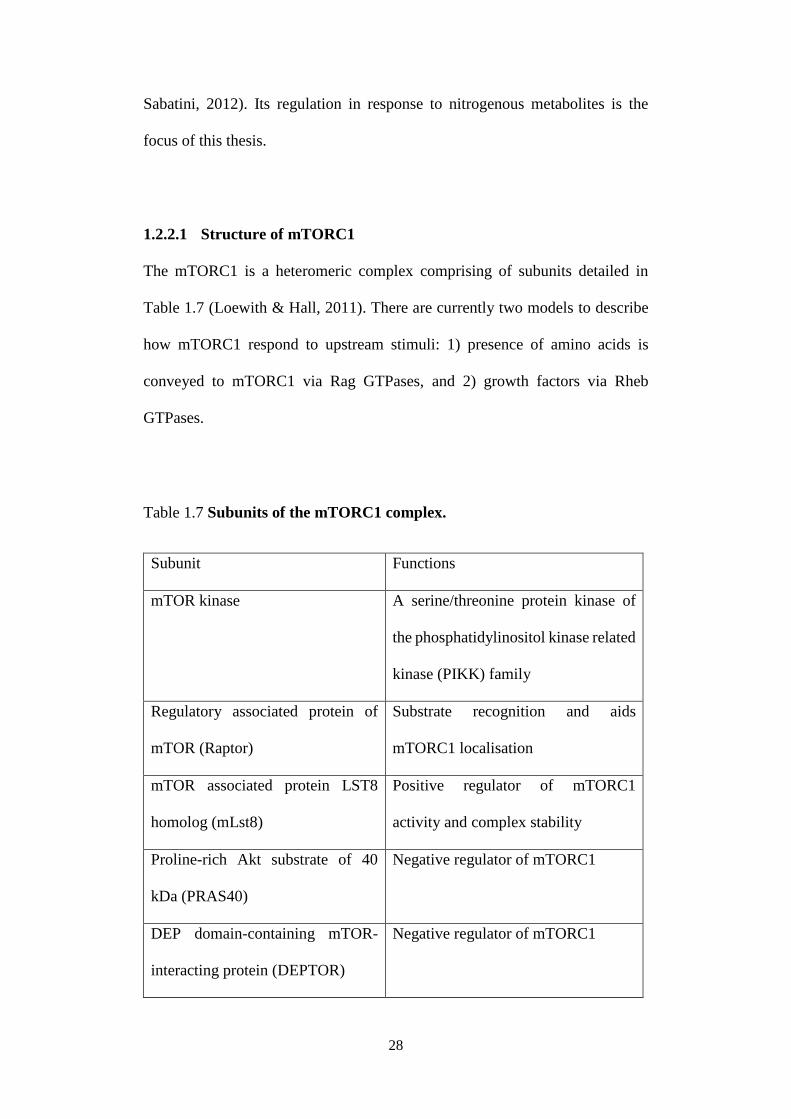
1.2.2.1 Structure of mTORC1
The mTORC1 is a heteromeric complex comprising of subunits detailed in
Table 1.7 (Loewith & Hall, 2011). There are currently two models to describe
how mTORC1 respond to upstream stimuli: 1) presence of amino acids is
conveyed to mTORC1 via Rag GTPases, and 2) growth factors via Rheb
GTPases.
Table 1.7 Subunits of the mTORC1 complex.
Subunit Functions
mTOR kinase A serine/threonine protein kinase of
the phosphatidylinositol kinase related
kinase (PIKK) family
Regulatory associated protein of
mTOR (Raptor)
Substrate recognition and aids
mTORC1 localisation
mTOR associated protein LST8
homolog (mLst8)
Positive regulator of mTORC1
activity and complex stability
Proline-rich Akt substrate of 40
kDa (PRAS40)
Negative regulator of mTORC1
DEP domain-containing mTOR-
interacting protein (DEPTOR)
Negative regulator of mTORC1
29
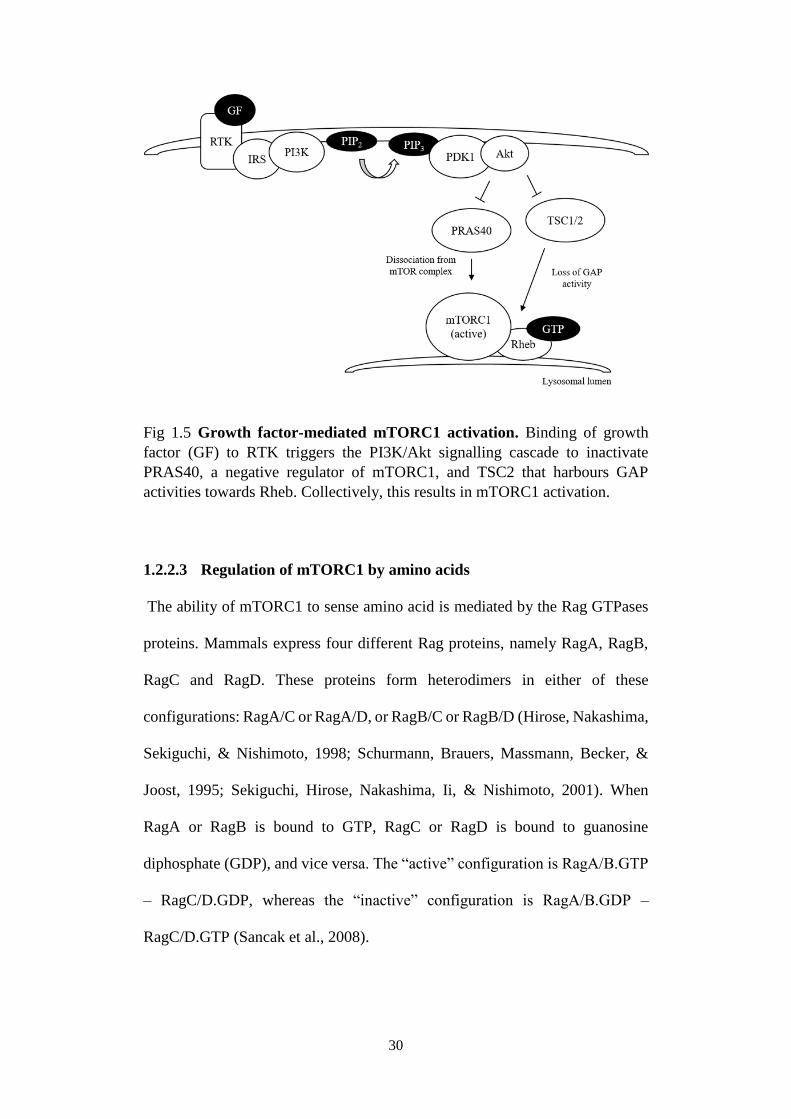
1.2.2.2 Regulation of mTORC1 by growth factors
Upon binding of growth factors to receptor tyrosine kinase (RTK), these
receptors dimerise, leading to autophosphorylation of tyrosine residues on the
cytoplasmic domain. Then, class I PI3K is activated, either by 1) direct binding
to phosphorylated RTK (Domchek, Auger, Chatterjee, Burke, & Shoelson,
1992), or 2) binding to scaffolding adaptors such as insulin receptor substrate
(IRS) (Myers et al., 1992). Activated PI3K converts phosphatidylinositol 4,5-
bisphosphate (PIP2) to phosphatidylinositol 3,4,5-triphosphate (PIP3) (Bunney
& Katan, 2010), a reaction that is antagonised by the phosphatase and tensin
homolog (PTEN) (Maehama & Dixon, 1998). PIP3 recruits 3-phosphoinositide-
dependent kinase 1 (PDK1) to the plasma membrane (Bunney & Katan, 2010;
Vanhaesebroeck & Alessi, 2000). Here, PDK1 phosphorylates Akt at T308
(Alessi et al., 1997). Activated Akt phosphorylates multiple downstream targets
including PRAS40 (Kovacina et al., 2003) and TSC2 (Inoki, Li, Zhu, Wu, &
Guan, 2002) of the mTORC1 signalling pathway. When PRAS40 is
phosphorylated, it binds to 14-3-3 and dissociates from mTORC1, resulting in
the complex activation (Kovacina et al., 2003). TSC2 is a GTPase-activating
protein (GAP) for Rheb (Dibble et al., 2012). Phosphorylation of TSC2 by Akt
inactivates it, thus allowing Rheb to become guanosine triphosphate (GTP)-
bound and activated. It now directly interacts with mTORC1 and activates it
(Fig 1.5) (Long, Lin, Ortiz-Vega, Yonezawa, & Avruch, 2005).
30
Fig 1.5 Growth factor-mediated mTORC1 activation. Binding of growth
factor (GF) to RTK triggers the PI3K/Akt signalling cascade to inactivate
PRAS40, a negative regulator of mTORC1, and TSC2 that harbours GAP
activities towards Rheb. Collectively, this results in mTORC1 activation.
1.2.2.3 Regulation of mTORC1 by amino acids
The ability of mTORC1 to sense amino acid is mediated by the Rag GTPases
proteins. Mammals express four different Rag proteins, namely RagA, RagB,
RagC and RagD. These proteins form heterodimers in either of these
configurations: RagA/C or RagA/D, or RagB/C or RagB/D (Hirose, Nakashima,
Sekiguchi, & Nishimoto, 1998; Schurmann, Brauers, Massmann, Becker, &
Joost, 1995; Sekiguchi, Hirose, Nakashima, Ii, & Nishimoto, 2001). When
RagA or RagB is bound to GTP, RagC or RagD is bound to guanosine
diphosphate (GDP), and vice versa. The “active” configuration is RagA/B.GTP
– RagC/D.GDP, whereas the “inactive” configuration is RagA/B.GDP –
RagC/D.GTP (Sancak et al., 2008).
31
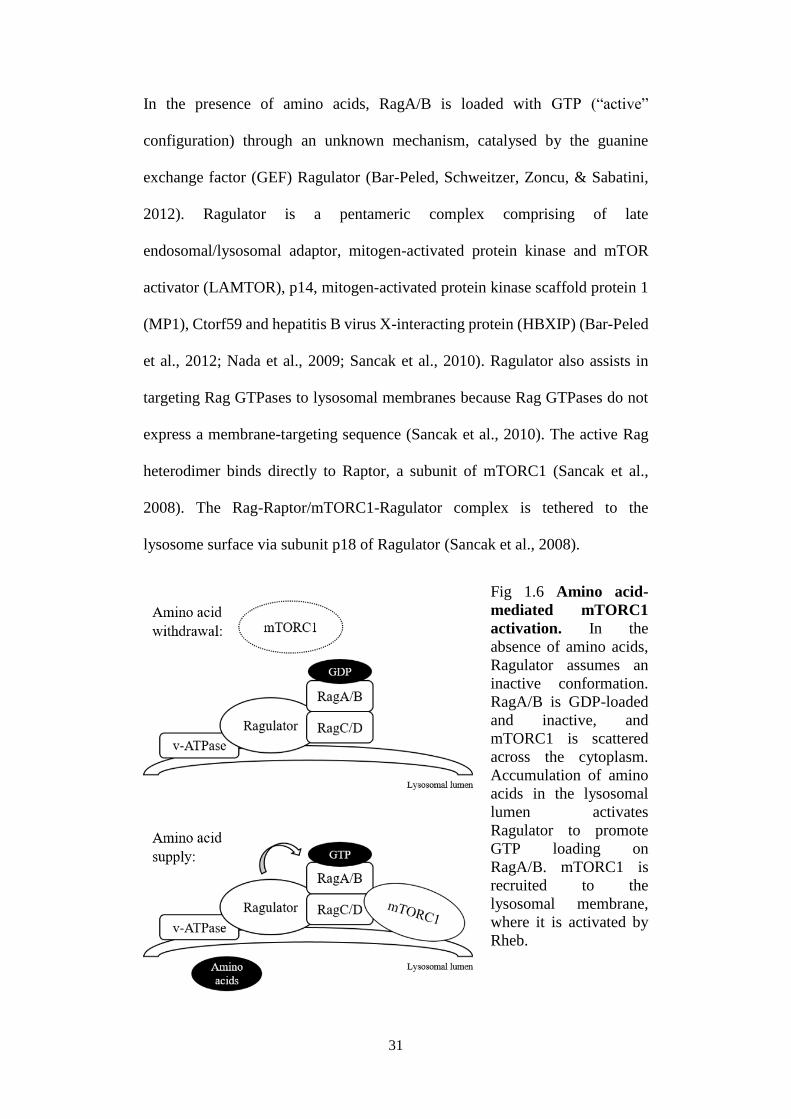
In the presence of amino acids, RagA/B is loaded with GTP (“active”
configuration) through an unknown mechanism, catalysed by the guanine
exchange factor (GEF) Ragulator (Bar-Peled, Schweitzer, Zoncu, & Sabatini,
2012). Ragulator is a pentameric complex comprising of late
endosomal/lysosomal adaptor, mitogen-activated protein kinase and mTOR
activator (LAMTOR), p14, mitogen-activated protein kinase scaffold protein 1
(MP1), Ctorf59 and hepatitis B virus X-interacting protein (HBXIP) (Bar-Peled
et al., 2012; Nada et al., 2009; Sancak et al., 2010). Ragulator also assists in
targeting Rag GTPases to lysosomal membranes because Rag GTPases do not
express a membrane-targeting sequence (Sancak et al., 2010). The active Rag
heterodimer binds directly to Raptor, a subunit of mTORC1 (Sancak et al.,
2008). The Rag-Raptor/mTORC1-Ragulator complex is tethered to the
lysosome surface via subunit p18 of Ragulator (Sancak et al., 2008).
Fig 1.6 Amino acid-
mediated mTORC1
activation. In the
absence of amino acids,
Ragulator assumes an
inactive conformation.
RagA/B is GDP-loaded
and inactive, and
mTORC1 is scattered
across the cytoplasm.
Accumulation of amino
acids in the lysosomal
lumen activates
Ragulator to promote
GTP loading on
RagA/B. mTORC1 is
recruited to the
lysosomal membrane,
where it is activated by
Rheb.
32
Evidences suggest that amino acids do not all regulate mTORC1 in the same
way, or to the same magnitude. They regulate mTORC1 in a manner that is
distinct from that of growth factors, yet is prerequisite for optimal growth factor
signalling (Hara et al., 1998). How mTORC1 sense amino acids remain a
subject of contention, and evidence so far provide that amino acids (individually
or collectively) (Jewell et al., 2015; Krall, Xu, Graeber, Braas, & Christofk,
2016; Nicklin et al., 2009) as well as their derivative metabolites (Duran et al.,
2013; Duran et al., 2012) can regulate mTORC1. At present, three amino acids
have been identified as potent regulators of mTORC1, namely leucine,
glutamine, and arginine.
Leucine is an essential, branched chain amino acid (BCAA) which is transported
into the cells via system L amino acid transporters. It binds directly to GDH to
promote glutamate deamination to α-KG (Erecinska & Nelson, 1990), the latter
of which drives mTORC1 activation (Duran et al., 2012). In the absence of
leucine, accumulation of uncharged transfer RNA (tRNA) activates general
control nonderepressible 2 (GCN2) to subsequently downregulate mTORC1 in
a eukaryotic translation initiation factor (eIF) 2a-dependent manner (Averous et
al., 2016; Dong, Qiu, Garcia-Barrio, Anderson, & Hinnebusch, 2000). When
leucine is present, the enzyme that ligases leucine to its tRNA, leucyl-tRNA
synthetase (LeuRS) translocates to the lysosome. It next binds to and exerts its
GAP activity on RagD, contributing to the activation of mTORC1 (Bar-Peled et
al., 2013; Han et al., 2012).
33
Unlike leucine, glutamine activates mTORC1 in a separate mechanism that is
mediated by Arf1 GTPases (Jewell et al., 2015; Li et al., 2010). These proteins
are classically components of intracellular vesicle trafficking. Much remains to
be learned about how glutamine regulate GTP/GDP cycling on Arf1, and in turn
how these proteins interact and modulate the activity of mTORC1. Evidence
thus far indicates that constitutive GTP- or GDP-loading on Arf1 significantly
inhibits amino acid-dependent mTORC1 activity, at once highlighting the
importance of normal GTP/GDP cycling of these proteins (Jewell et al., 2015).
Glutamine also activates mTORC1 indirectly by regulating the cellular uptake
of extracellular leucine. It begins with the import of extracellular glutamine via
SLC1A5. Then, SLC7A5 and SLC3A2 in concert exchange accumulated
glutamine for extracellular BCAA such as leucine (Nicklin et al., 2009).
Glutaminolysis also facilitates mTORC1 activities, as sequential deamination
of glutamine yields α-KG, the proximal metabolite responsible for the complex
activation (Curi et al., 2005; Duran et al., 2012).
In comparison, NEAA do not normally regulate mTORC1 at such high
potencies. Chronic withdrawal of NEAA in mouse models is generally well-
tolerated (Maddocks et al., 2013), although under certain conditions can be
made essential or limiting. For example, p53-mediated metabolic
reprogramming confers cancer cells their dependence on serine metabolism
(Maddocks et al., 2013). Transport of small amino acids such as alanine, proline
and glycine by proton-assisted amino acid transporter 1 and 2 (PAT1 and PAT2)
(Boll, Foltz, Rubio-Aliaga, Kottra, & Daniel, 2002; Z. Chen et al., 2003) have
been correlated with mTORC1 activation as well. These “transceptors” are
34
abundantly expressed on the surface of late endosomes and lysosomes, and their
overexpression has been found to inhibit mTORC1 due to drainage of amino
acids from intra-lysosomal lumen (Sagne et al., 2001). Identifying transceptors
or enzymes that directly interact with NEAA would provide additional insight
into their significance in mTORC1 regulation.
1.2.2.4 Significance of mTORC1 signalling pathway
During amino acids limitation, mTORC1 is largely dispersed across the
cytoplasm. No longer in proximity with lysosome-localised Rheb, mTORC1 is
inactivated (Sancak et al., 2010; Sancak et al., 2008). Under these
circumstances, three signalling outcomes are typically observed. One,
dephosphorylation of downstream target eukaryotic translation initiation factor
4E-binding protein 1 (4E-BP1) and p70S6K, and subsequent suppression of
protein synthesis (Chauvin et al., 2014; Hara et al., 1998; X. Wang, Campbell,
Miller, & Proud, 1998). Inactivation of mTORC1 causes hypophosphorylation
of 4E-BP1, and thus locked in a complex with eIF4E and eIF4F (Jankowska-
Anyszka et al., 1998). Hypophosphorylation of p70S6K also inactivates
downstream ribosomal protein S6 and inhibition of its interaction with 40S
ribosomal subunit (Hara et al., 1998). Both events significantly inhibit protein
translation.
Two, Unc-51 like autophagy activating kinase 1 (ULK1) is activated to induce
autophagy, a catabolic process that breaks down superfluous endogenous
protein structures as a means of replenishing amino acid store (J. Kim, Kundu,
35
Viollet, & Guan, 2011). ULK1 activation leads to phosphorylation of Raptor, a
subunit of mTORC1. This post-translational modification prevents Raptor from
recognising substrates of mTORC1, thus abolishes activation of downstream
targets 4E-BP1 and p70S6K (Dunlop, Hunt, Acosta-Jaquez, Fingar, & Tee,
2011). In contrast, in the presence of amino acids, mTORC1 mediates ULK1
phosphorylation and inactivation to suppress autophagy (J. Kim et al., 2011).
Clearly, mTORC1 functions as a molecular regulator on which metabolic cues,
and cell proliferation and growth signalling converge. With respect to stem cell
physiology, mTORC1 can influence a cell’s commitment into self-renewal or
differentiation, depending on nutrient availability. Haematopoietic stem cells
reside in a relatively hypoxic and nutrient-depleted microenvironment in the
bone marrow, thus requiring their physiologies to be regulated accordingly to
the availability of these resources (Hirao & Hoshii, 2013; Suda, Takubo, &
Semenza, 2011). In PTEN-null mice, hyperactivation of mTOR resulted in
propagation and differentiation of marrow stem cells into haematopoietic cells
(Yilmaz et al., 2006; J. Zhang et al., 2006). Modulation of mTORC1 activities
is also relevant to oncogenesis. In hepatocellular carcinoma (HCC), mTOR
activation is commonly associated with aggressive tumour phenotype and
poorer prognosis (Calvisi et al., 2011; Sahin et al., 2004). Owing to pro-growth
and -survival properties that mTORC1 confers once activated, deregulation of
mTORC1 activities has emerged as a key promoter of oncogenesis (Guertin &
Sabatini, 2007). Naturally, abrogating mTORC1 signalling with analogues of
rapamycin (a naturally occurring inhibitor for mTORC1) has been used in the
clinic to treat cancers. The first “rapalog” to be approved by FDA in 2007,
36
temsirolimus is used to treat renal cell carcinoma, and subsequently, sirolimus
and everolimus to treat lymphangioleiomyomatosis or progressive
neuroendocrine tumours of pancreatic origin, respectively (L. C. Kim, Cook, &
Chen, 2017).
1.3 Metabolic error repair pathways
The word “homeostasis” originates from New Latin “homois” which means
similar, and “stasis” which means standing still. In biology, homeostasis is a
cellular property of maintaining parameters within a controlled, acceptable
range at equilibrium which is crucial for survival. Within the narrow context of
metabolism, concentrations of metabolites are kept in check by evolving
corrective mechanisms that are largely enzymatic in nature (Linster, Van
Schaftingen, & Hanson, 2013).
1.3.1 DL-2-hydroxyglutarate (DL-2HG)
DL-2-hydroxyglutarate is a metabolite endogenously found at low levels with
previously unspecified functions. Its generation is mediated by 1) malate
dehydrogenase, 2) DL-2-hydroxyglutarate dehydrogenase (Fig 1.7).
The primary enzymatic activity of MDH involves reversible conversion of
malate to oxaloacetate. It also reduces α-KG to L-2-hydroxyglutarate although
at a much lower efficiency (106-fold lower). This secondary reaction remains
physiologically significant because the pool size of α-KG is greater than that of
oxaloacetate. Up to several g/day of L-2-hydroxyglutarate is formed in this
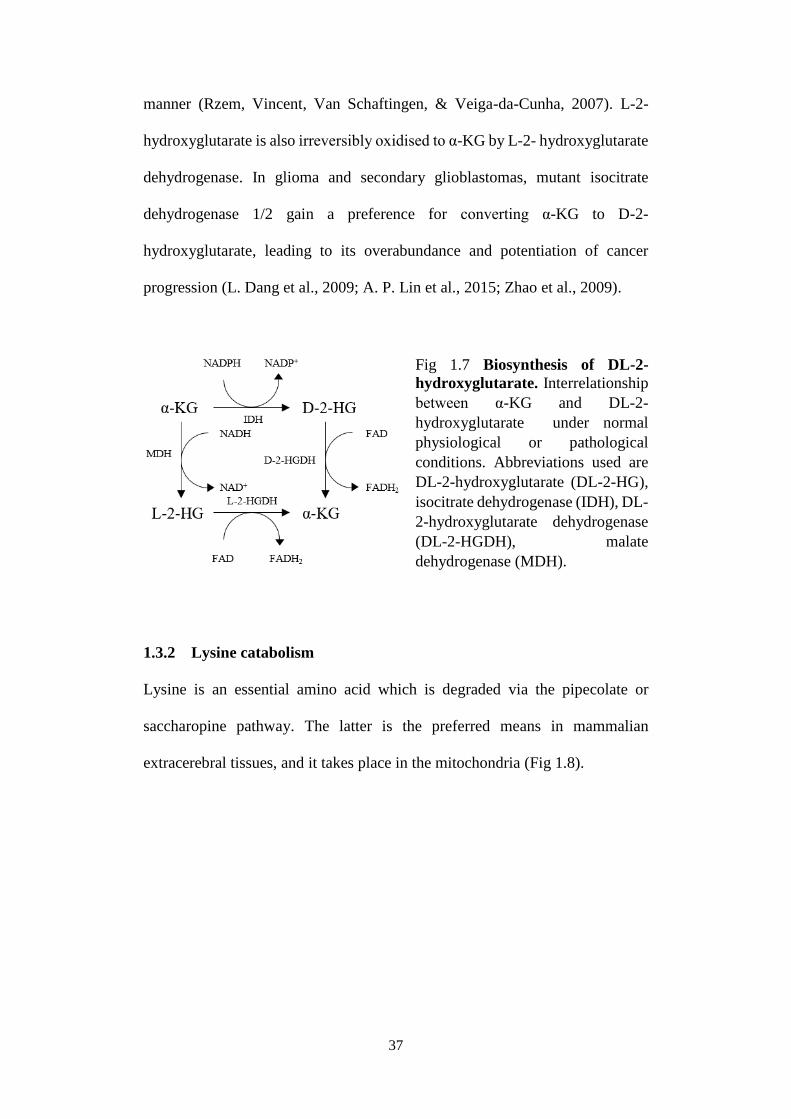
37
manner (Rzem, Vincent, Van Schaftingen, & Veiga-da-Cunha, 2007). L-2-
hydroxyglutarate is also irreversibly oxidised to α-KG by L-2- hydroxyglutarate
dehydrogenase. In glioma and secondary glioblastomas, mutant isocitrate
dehydrogenase 1/2 gain a preference for converting α-KG to D-2-
hydroxyglutarate, leading to its overabundance and potentiation of cancer
progression (L. Dang et al., 2009; A. P. Lin et al., 2015; Zhao et al., 2009).
Fig 1.7 Biosynthesis of DL-2-
hydroxyglutarate. Interrelationship
between α-KG and DL-2-
hydroxyglutarate under normal
physiological or pathological
conditions. Abbreviations used are
DL-2-hydroxyglutarate (DL-2-HG),
isocitrate dehydrogenase (IDH), DL-
2-hydroxyglutarate dehydrogenase
(DL-2-HGDH), malate
dehydrogenase (MDH).
1.3.2 Lysine catabolism
Lysine is an essential amino acid which is degraded via the pipecolate or
saccharopine pathway. The latter is the preferred means in mammalian
extracerebral tissues, and it takes place in the mitochondria (Fig 1.8).
38
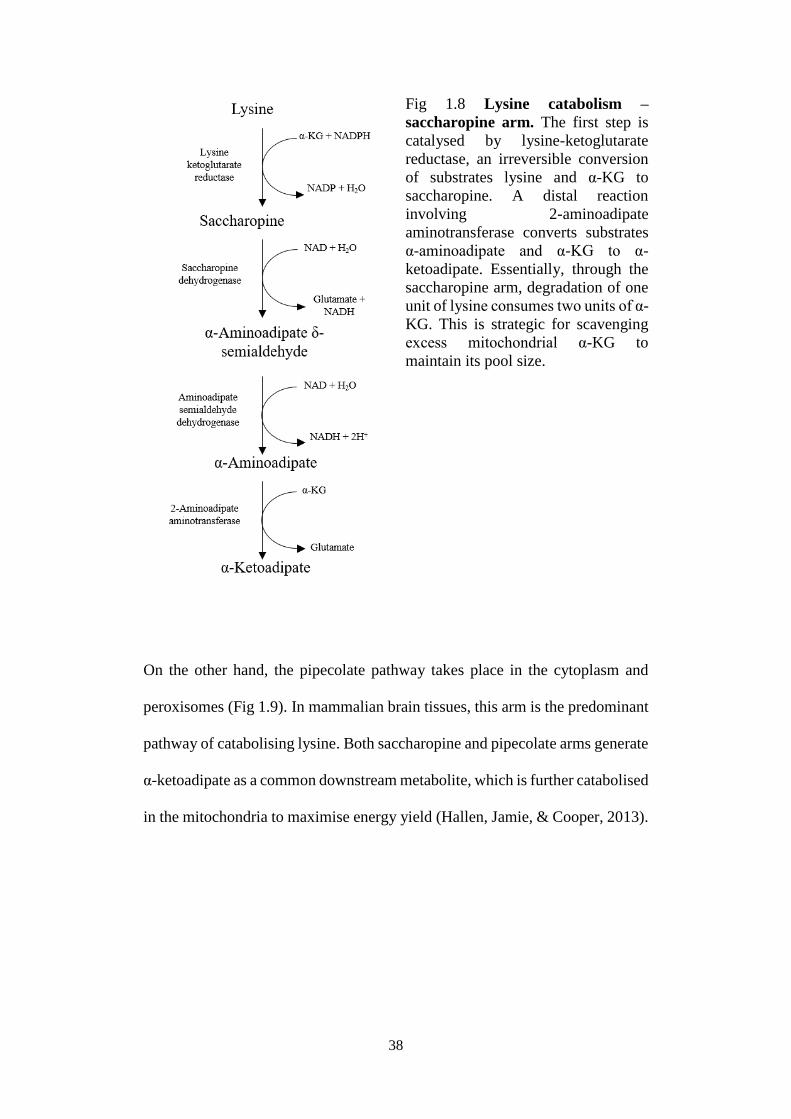
Fig 1.8 Lysine catabolism –
saccharopine arm. The first step is
catalysed by lysine-ketoglutarate
reductase, an irreversible conversion
of substrates lysine and α-KG to
saccharopine. A distal reaction
involving 2-aminoadipate
aminotransferase converts substrates
α-aminoadipate and α-KG to α-
ketoadipate. Essentially, through the
saccharopine arm, degradation of one
unit of lysine consumes two units of α-
KG. This is strategic for scavenging
excess mitochondrial α-KG to
maintain its pool size.
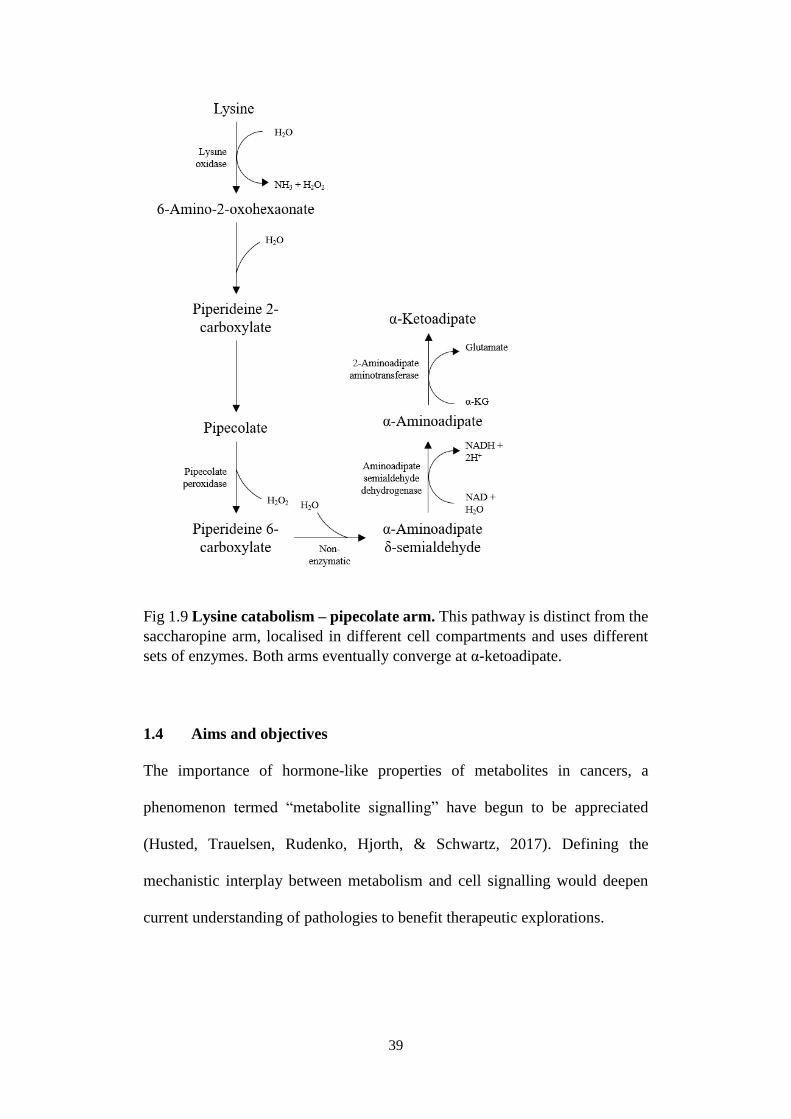
On the other hand, the pipecolate pathway takes place in the cytoplasm and
peroxisomes (Fig 1.9). In mammalian brain tissues, this arm is the predominant
pathway of catabolising lysine. Both saccharopine and pipecolate arms generate
α-ketoadipate as a common downstream metabolite, which is further catabolised
in the mitochondria to maximise energy yield (Hallen, Jamie, & Cooper, 2013).
39
Fig 1.9 Lysine catabolism – pipecolate arm. This pathway is distinct from the
saccharopine arm, localised in different cell compartments and uses different
sets of enzymes. Both arms eventually converge at α-ketoadipate.
1.4 Aims and objectives
The importance of hormone-like properties of metabolites in cancers, a
phenomenon termed “metabolite signalling” have begun to be appreciated
(Husted, Trauelsen, Rudenko, Hjorth, & Schwartz, 2017). Defining the
mechanistic interplay between metabolism and cell signalling would deepen
current understanding of pathologies to benefit therapeutic explorations.
40
In actively proliferating cells in which aerobic glycolysis frequently takes place
(Warburg et al., 1927), the end product pyruvate is generated in high volume.
The subsequent fate of pyruvate, specifically, whether pyruvate is shunted away
from OxPhos to lactate production, or assimilated into the TCA cycle has been
proposed to promote oncogenesis or senescence, respectively (Kaplon et al.,
2013; Olenchock & Vander Heiden, 2013). Crucial to the regulations of these
metabolic events is the oncogenic transcription factor HIF-1α, which functions
as a master regulator of glycolytic pathways (Semenza, 2003, 2007, 2013). It is
thus imperative to determine the mechanistic relationship between the
oncometabolite pyruvate with the oncogene HIF-1α, as explored in the first part
of the thesis. By taking advantage of gas chromatography-mass spectrometry
(GC-MS) platform for metabolomics analyses on whole cell lysates and cell
fractions, this study aims to:
1) Investigate the mechanism of HIF-1α degradation in response to
pyruvate at normoxia
2) Characterize metabolite profiles to explain modulations on HIF-1α
expression
3) Suggest metabolic interventions to reverse pyruvate-induced HIF-1α
expression
Perturbations to metabolic pathways in response to a high influx of pyruvate is
expected to impact other metabolism-associated signalling pathways as well. As
a hub of nutrient and growth factor signalling, the mTORC1 signalling pathway
is subsequently examined in the latter chapters of this thesis. Preliminary data
41
implied that pyruvate-dependent scavenging of ammonia was involved in the
downregulation of mTORC1. Therefore, the study was expanded to examine the
impact of nitrogenous metabolites on mTORC1. This question is particularly
relevant to cancers in which episodic hyperammonaemia is frequently observed
in the surrounding tumour milieu (Chance et al., 1989; Chance et al., 1988; C.
H. Eng & Abraham, 2010). This pathological increase in ammonia synthesis has
been attributed to altered cancers metabolism due to avid consumption of
glutamine (C. H. Eng & Abraham, 2010; Lacey & Wilmore, 1990), or a side-
effect from L-asparaginase therapy in leukemic patients (Heitink-Polle, Prinsen,
de Koning, van Hasselt, & Bierings, 2013; Walker, 2012). Despite the
abundance of associative evidence suggesting modulation of mTORC1 by
nitrogenous metabolites, the exact mechanism has yet to be defined. To this end,
Chapters 4 and 5 aim to:
1) Describe the mechanism of mTORC1 regulation in response to NH4+
2) Assess the contribution of asparagine and glutamine to mTORC1
signalling
3) Investigate alternative means of regulating mTORC1 in response to
asparagine and glutamine
42
CHAPTER 2: MATERIALS AND METHODS
2.1 Cell culture
HCC cell lines, HepG2 and HuH7 were used as the main cell models in this
thesis. These cells were maintained in complete growth media consisting of
Dulbecco’s Modified Eagle Medium (DMEM) (with 4.5 g/L of glucose, 25 mM
of HEPES, and 4 mM of L‐glutamine) supplemented with 10% fetal bovine
serum (FBS), 100 U/ml penicillin and 100 μg/ml streptomycin, and incubated
at 37°C at 5% CO2. The same growth media was used to maintain human
hepatoblastoma cells, HuH6, normal human hepatocytes, L02 and rat hepatoma
cells H4IIE.
Human hepatocytes THLE-2 and THLE-3 expressing phenotypic features of
normal adult liver epithelial cells were maintained in Bronchial Epithelial
Growth Medium (BEGM) supplemented with 70 ng/ml phosphoethanolamine
(Lonza Walkersville, MD, USA), 10% FBS and 100 U/ml penicillin and 100
µg/ml streptomycin. Prior to cell seeding, culture dishes were coated with 0.03
mg/ml bovine collagen type I dissolved in BEGM. Human myoblasts HSMM
were maintained in Skeletal Muscle Growth Media-2 (SkGM-2 Basal Medium),
supplemented with SkGM-2 SingleQuots Kit containing human epidermal
growth factor, fetuin, bovine serum albumin (BSA), dexamethasone, insulin and
gentamicin/amphotericin-B (Lonza Walkersville, MD, USA).
The liver cell lines used in this thesis are derived from organisms of different
genetic and pathological backgrounds (Table 2.1). It is crucial to interrogate
43
hypotheses in a varied array of cell models to ensure that 1) the phenotypes
observed are not atypical and unique to one cell line, and 2) the conclusions
reported are robust and reproducible across different cell contexts.
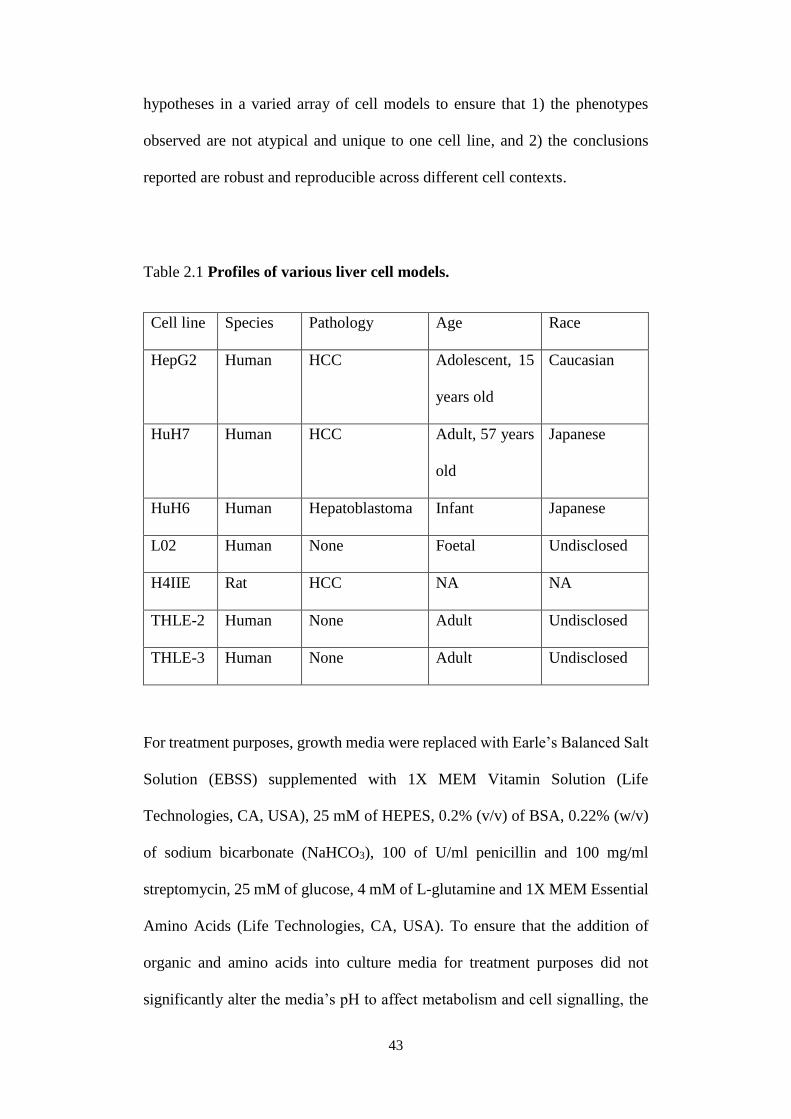
Table 2.1 Profiles of various liver cell models.
Cell line Species Pathology Age Race
HepG2 Human HCC Adolescent, 15
years old
Caucasian
HuH7 Human HCC Adult, 57 years
old
Japanese
HuH6 Human Hepatoblastoma Infant Japanese
L02 Human None Foetal Undisclosed
H4IIE Rat HCC NA NA
THLE-2 Human None Adult Undisclosed
THLE-3 Human None Adult Undisclosed
For treatment purposes, growth media were replaced with Earle’s Balanced Salt
Solution (EBSS) supplemented with 1X MEM Vitamin Solution (Life
Technologies, CA, USA), 25 mM of HEPES, 0.2% (v/v) of BSA, 0.22% (w/v)
of sodium bicarbonate (NaHCO3), 100 of U/ml penicillin and 100 mg/ml
streptomycin, 25 mM of glucose, 4 mM of L-glutamine and 1X MEM Essential
Amino Acids (Life Technologies, CA, USA). To ensure that the addition of
organic and amino acids into culture media for treatment purposes did not
significantly alter the media’s pH to affect metabolism and cell signalling, the
44
pH of EBSS reconstituted with metabolites of interest (at working
concentrations) were adjusted to physiological 7.0 to 7.2. Media were sterile
filtered and introduced to cells to initiate experiments.
2.2 Western Blot assay
Cells were homogenized on ice in radioimmunoprecipitation assay buffer
(RIPA) buffer supplemented with 5 mM each of β-glycerophosphate, sodium
fluoride, sodium orthovanadate, sodium pyrophosphate and 1X Protease
Inhibitor (Thermo Fisher Scientific). The resultant lysate was sonicated and
centrifuged at 13 000 xg for 10 min at 4°C to pellet down cell debris. Protein
concentration of the supernatant was determined by Pierce BCA protein assay
(Life Technologies, CA, USA). Neat lysate was typically diluted to 1 µg/ml
protein in sample buffer containing 31.25 mM of Tris-HCl, 12.5% (v/v)
glycerol, 1% (w/v) sodium dodecyl sulphate (SDS), 0.005% (v/v) of
bromophenol blue and 0.2 mM of dithiothreitol (DTT). Proteins were denatured
at 65°C for 15 min. A total of typically 30 µg of protein per sample was
separated on a standard 6% or 10%, or 6 to 12% gradient SDS-polyacrylamide
electrophoresis (PAGE) gel. Proteins were then transferred onto polyvinylidene
fluoride (PVDF) membranes and blocked with 5% (w/v) non-fat milk dissolved
in 1X Tris-Buffered Saline and 1% Tween-20 (TBST) for 1 h at room
temperature. Membranes were incubated overnight with relevant primary
antibodies at 4°C. To remove non-specific binding of primary antibodies,
membranes were washed with 1X TBST for 30 min before incubation with
horseradish peroxidase-conjugated secondary antibody for 1 h at room
temperature. After washing off non-specific binding of secondary antibodies
45
with 1X TBST for another 30 min, proteins were visualized by
chemiluminescence. Band intensity was quantified with ImageJ software
(version 1.50i).
To obtain total protein bands, phospho‐ or hydroxylated-protein blots were
stripped with a buffer containing 1.5% (w/v) of glycine pH-ed to 2.2, 1% (v/v)
of stock 10% SDS and 0.1% (v/v) of Tween-20 for 30 min at room temperature.
After thorough washing of membranes with 1X TBST thrice (10 min each) to
remove residual buffer and blocking with 5% (w/v) of non-fat milk, membranes
were re-probed with appropriate primary antibodies targeting total protein-of-
interest. Protein bands were visualised by chemiluminescence and their
intensity quantified as described earlier.
To ensure primary antibodies used are sufficiently characterised for accuracy in
reporting, they are rigorously validated via several methods by the
manufacturing companies. Target proteins are detected via Western Blot or
immunofluorescence 1) in multiple cell lines known to express them, 2) in cells
treated with kinase-specific activators and/or inhibitors, or protein lysates
treated with phosphatases to assess the phosphorylation status of target proteins,
3) in knockout or siRNA-treated cells, and 4) to determine correct subcellular
localisation of target proteins upon their induction of translocation (“CST
Antibody Validation Principle”, 2010; “Cell Signaling Technology”, 2015a – d,
2016a – g, 2017a – f; “Proteintech”, n.d.-a, -b). Details of such validation assays
for each antibody are as follows:
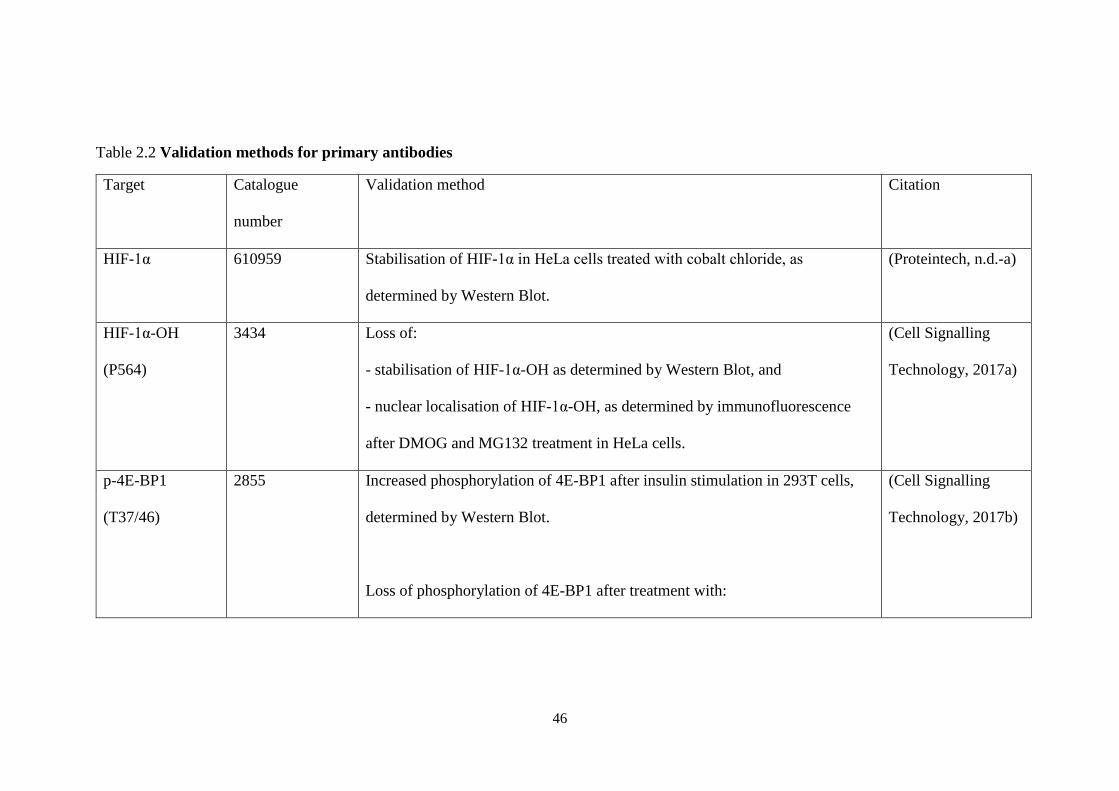
46
Table 2.2 Validation methods for primary antibodies
Target Catalogue
number
Validation method Citation
HIF-1α 610959 Stabilisation of HIF-1α in HeLa cells treated with cobalt chloride, as
determined by Western Blot.
(Proteintech, n.d.-a)
HIF-1α-OH
(P564)
3434 Loss of:
- stabilisation of HIF-1α-OH as determined by Western Blot, and
- nuclear localisation of HIF-1α-OH, as determined by immunofluorescence
after DMOG and MG132 treatment in HeLa cells.
(Cell Signalling
Technology, 2017a)
p-4E-BP1
(T37/46)
2855 Increased phosphorylation of 4E-BP1 after insulin stimulation in 293T cells,
determined by Western Blot.
Loss of phosphorylation of 4E-BP1 after treatment with:
(Cell Signalling
Technology, 2017b)
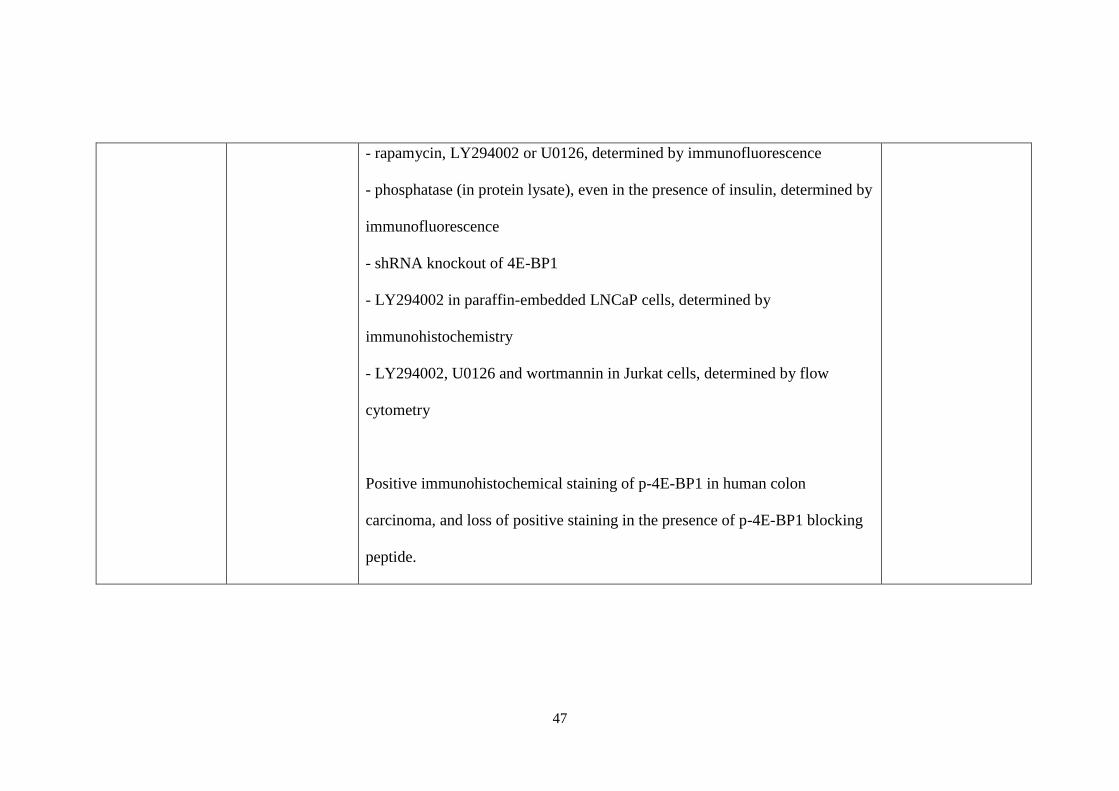
47
- rapamycin, LY294002 or U0126, determined by immunofluorescence
- phosphatase (in protein lysate), even in the presence of insulin, determined by
immunofluorescence
- shRNA knockout of 4E-BP1
- LY294002 in paraffin-embedded LNCaP cells, determined by
immunohistochemistry
- LY294002, U0126 and wortmannin in Jurkat cells, determined by flow
cytometry
Positive immunohistochemical staining of p-4E-BP1 in human colon
carcinoma, and loss of positive staining in the presence of p-4E-BP1 blocking
peptide.
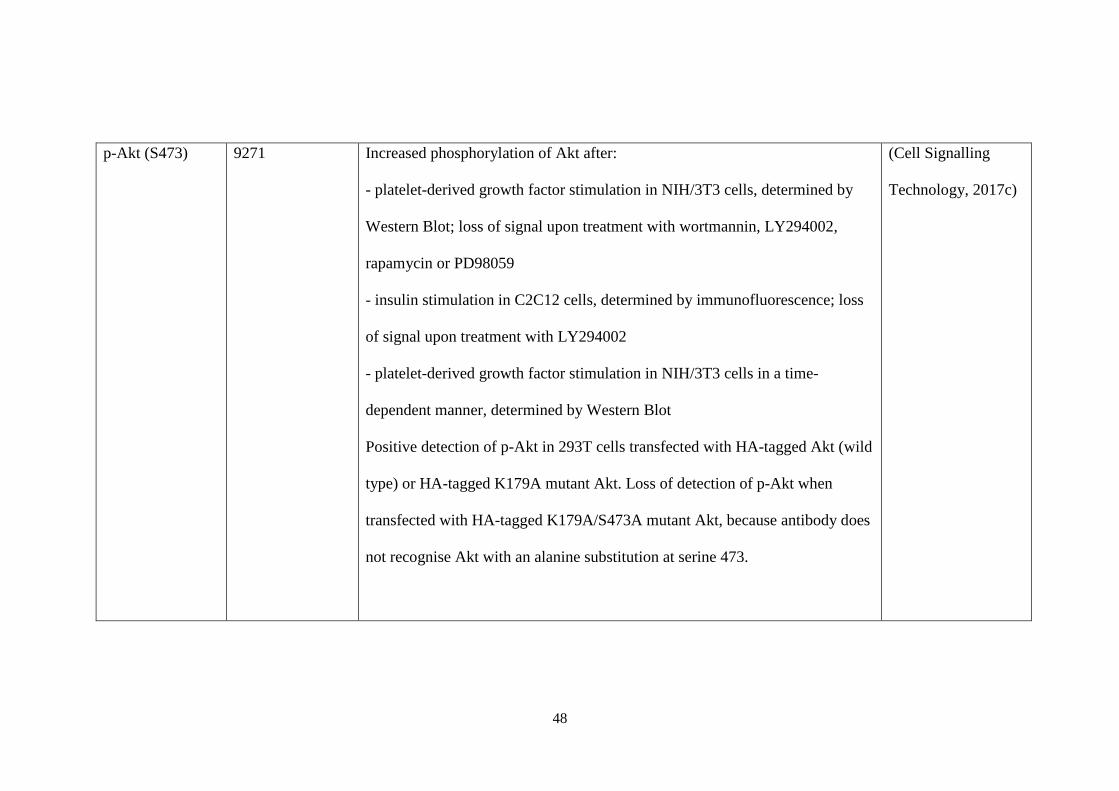
48
p-Akt (S473) 9271 Increased phosphorylation of Akt after:
- platelet-derived growth factor stimulation in NIH/3T3 cells, determined by
Western Blot; loss of signal upon treatment with wortmannin, LY294002,
rapamycin or PD98059
- insulin stimulation in C2C12 cells, determined by immunofluorescence; loss
of signal upon treatment with LY294002
- platelet-derived growth factor stimulation in NIH/3T3 cells in a time-
dependent manner, determined by Western Blot
Positive detection of p-Akt in 293T cells transfected with HA-tagged Akt (wild
type) or HA-tagged K179A mutant Akt. Loss of detection of p-Akt when
transfected with HA-tagged K179A/S473A mutant Akt, because antibody does
not recognise Akt with an alanine substitution at serine 473.
(Cell Signalling
Technology, 2017c)
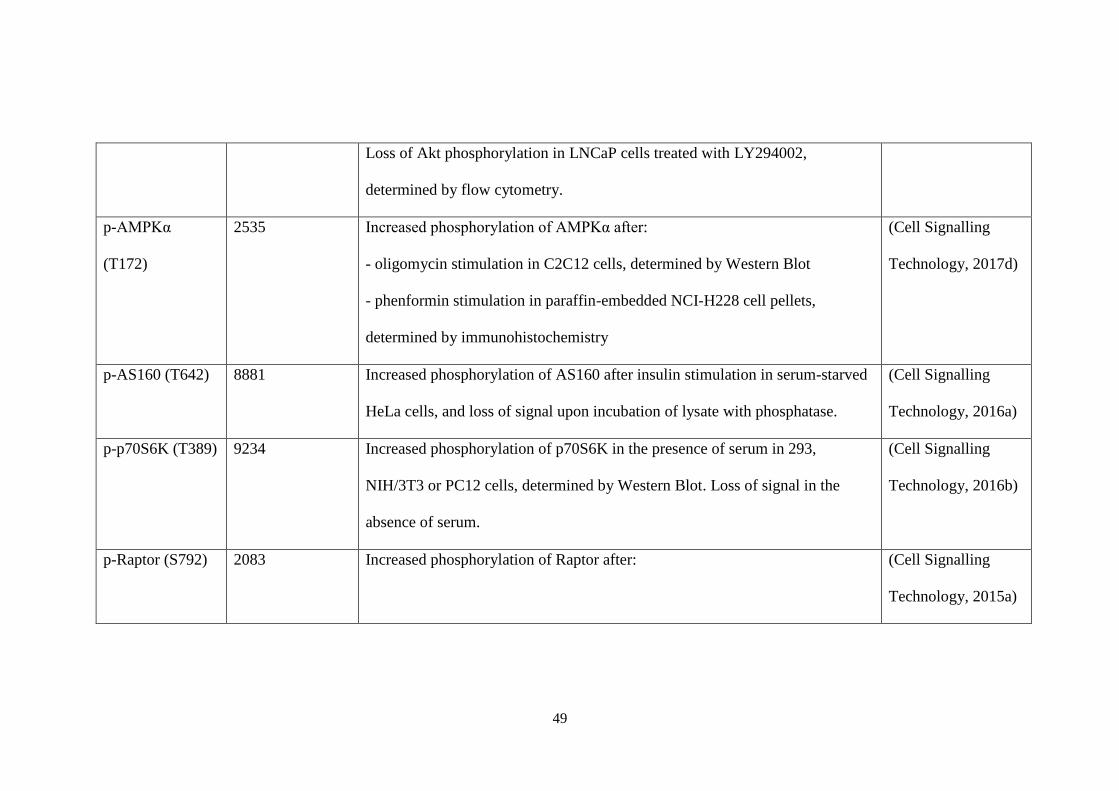
49
Loss of Akt phosphorylation in LNCaP cells treated with LY294002,
determined by flow cytometry.
p-AMPKα
(T172)
2535 Increased phosphorylation of AMPKα after:
- oligomycin stimulation in C2C12 cells, determined by Western Blot
- phenformin stimulation in paraffin-embedded NCI-H228 cell pellets,
determined by immunohistochemistry
(Cell Signalling
Technology, 2017d)
p-AS160 (T642) 8881 Increased phosphorylation of AS160 after insulin stimulation in serum-starved
HeLa cells, and loss of signal upon incubation of lysate with phosphatase.
(Cell Signalling
Technology, 2016a)
p-p70S6K (T389) 9234 Increased phosphorylation of p70S6K in the presence of serum in 293,
NIH/3T3 or PC12 cells, determined by Western Blot. Loss of signal in the
absence of serum.
(Cell Signalling
Technology, 2016b)
p-Raptor (S792) 2083 Increased phosphorylation of Raptor after: (Cell Signalling
Technology, 2015a)
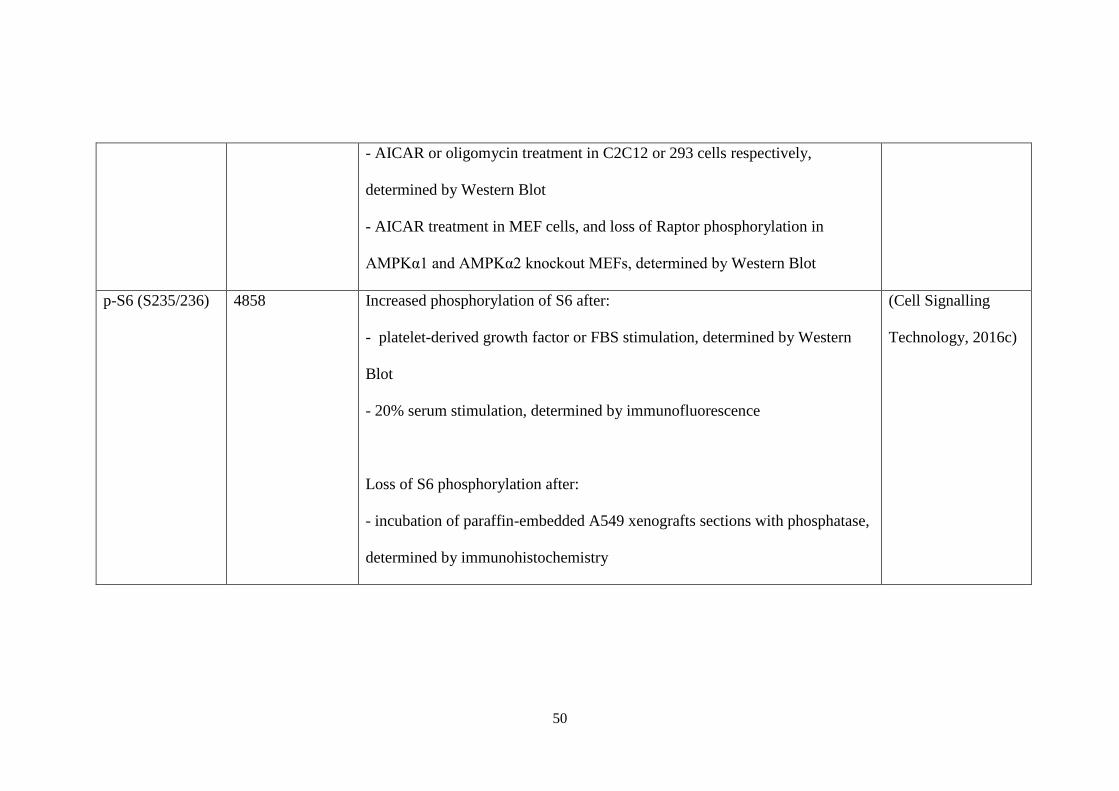
50
- AICAR or oligomycin treatment in C2C12 or 293 cells respectively,
determined by Western Blot
- AICAR treatment in MEF cells, and loss of Raptor phosphorylation in
AMPKα1 and AMPKα2 knockout MEFs, determined by Western Blot
p-S6 (S235/236) 4858 Increased phosphorylation of S6 after:
- platelet-derived growth factor or FBS stimulation, determined by Western
Blot
- 20% serum stimulation, determined by immunofluorescence
Loss of S6 phosphorylation after:
- incubation of paraffin-embedded A549 xenografts sections with phosphatase,
determined by immunohistochemistry
(Cell Signalling
Technology, 2016c)
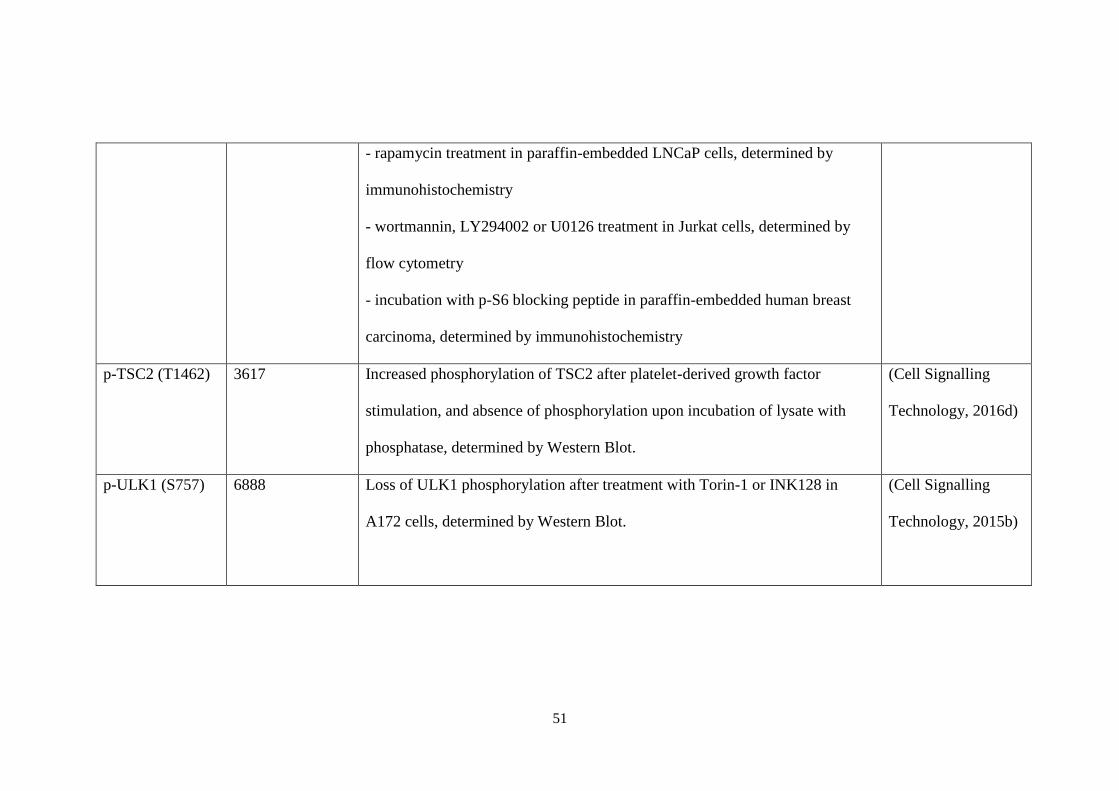
51
- rapamycin treatment in paraffin-embedded LNCaP cells, determined by
immunohistochemistry
- wortmannin, LY294002 or U0126 treatment in Jurkat cells, determined by
flow cytometry
- incubation with p-S6 blocking peptide in paraffin-embedded human breast
carcinoma, determined by immunohistochemistry
p-TSC2 (T1462) 3617 Increased phosphorylation of TSC2 after platelet-derived growth factor
stimulation, and absence of phosphorylation upon incubation of lysate with
phosphatase, determined by Western Blot.
(Cell Signalling
Technology, 2016d)
p-ULK1 (S757) 6888 Loss of ULK1 phosphorylation after treatment with Torin-1 or INK128 in
A172 cells, determined by Western Blot.
(Cell Signalling
Technology, 2015b)
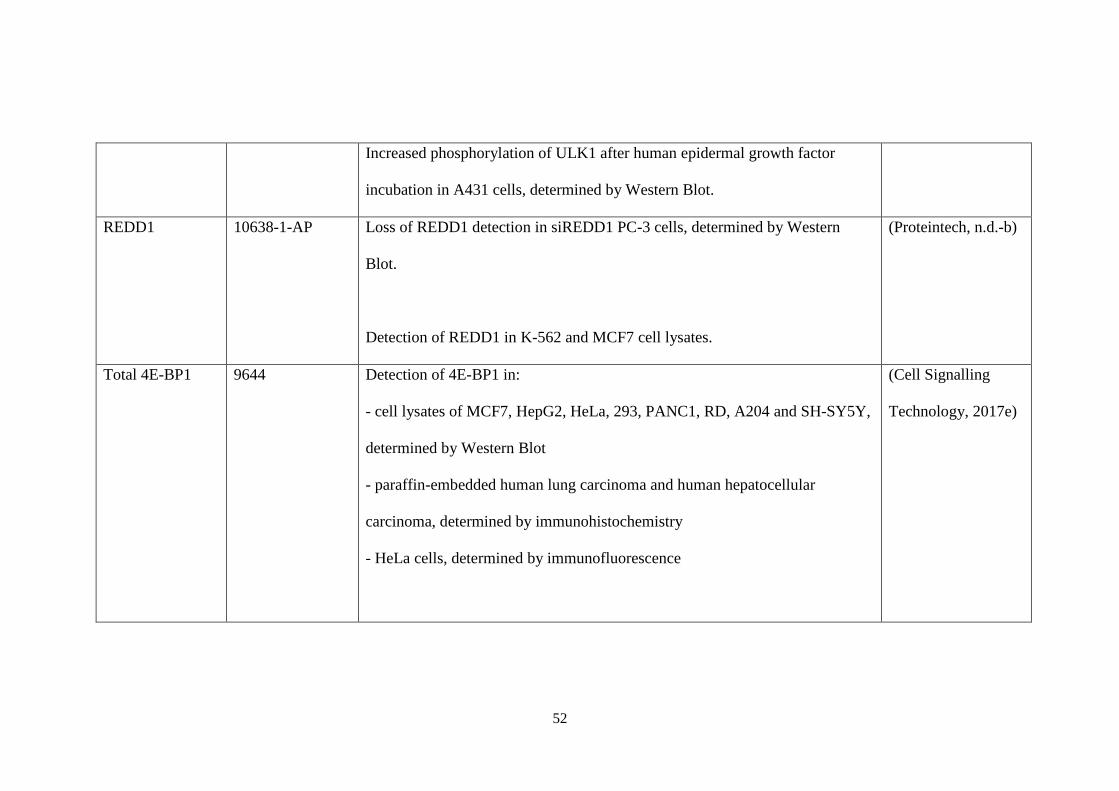
52
Increased phosphorylation of ULK1 after human epidermal growth factor
incubation in A431 cells, determined by Western Blot.
REDD1 10638-1-AP Loss of REDD1 detection in siREDD1 PC-3 cells, determined by Western
Blot.
Detection of REDD1 in K-562 and MCF7 cell lysates.
(Proteintech, n.d.-b)
Total 4E-BP1 9644 Detection of 4E-BP1 in:
- cell lysates of MCF7, HepG2, HeLa, 293, PANC1, RD, A204 and SH-SY5Y,
determined by Western Blot
- paraffin-embedded human lung carcinoma and human hepatocellular
carcinoma, determined by immunohistochemistry
- HeLa cells, determined by immunofluorescence
(Cell Signalling
Technology, 2017e)
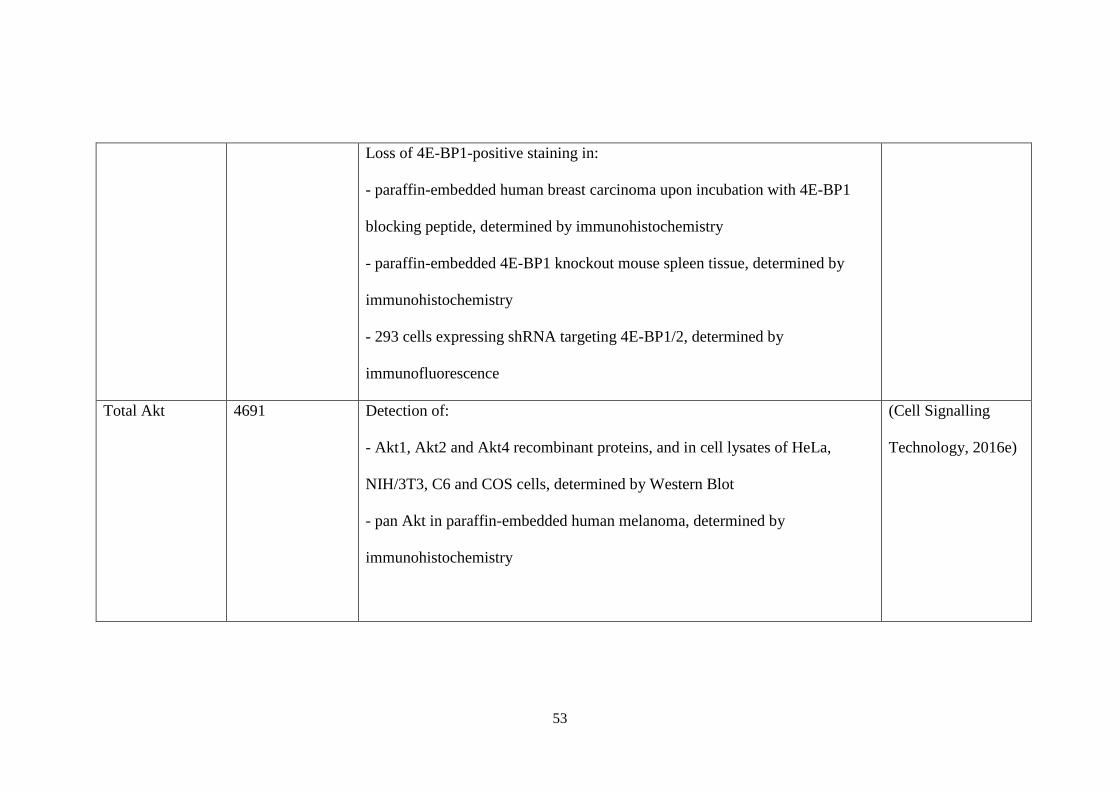
53
Loss of 4E-BP1-positive staining in:
- paraffin-embedded human breast carcinoma upon incubation with 4E-BP1
blocking peptide, determined by immunohistochemistry
- paraffin-embedded 4E-BP1 knockout mouse spleen tissue, determined by
immunohistochemistry
- 293 cells expressing shRNA targeting 4E-BP1/2, determined by
immunofluorescence
Total Akt 4691 Detection of:
- Akt1, Akt2 and Akt4 recombinant proteins, and in cell lysates of HeLa,
NIH/3T3, C6 and COS cells, determined by Western Blot
- pan Akt in paraffin-embedded human melanoma, determined by
immunohistochemistry
(Cell Signalling
Technology, 2016e)
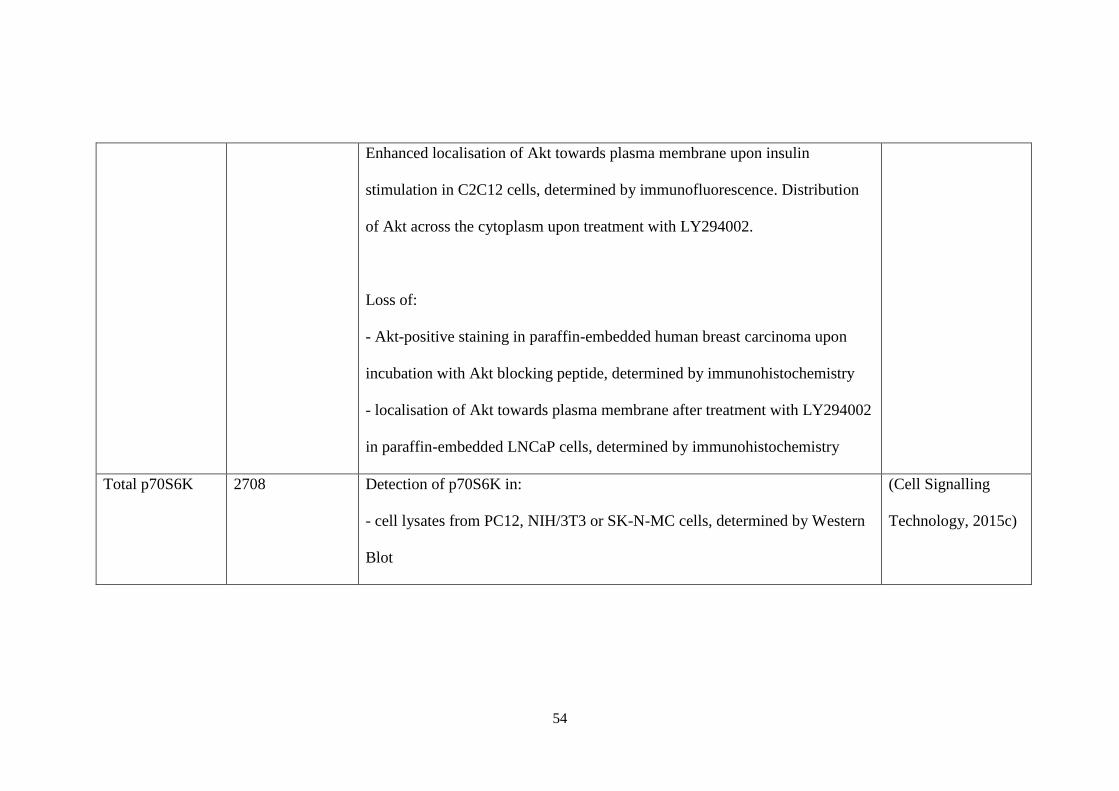
54
Enhanced localisation of Akt towards plasma membrane upon insulin
stimulation in C2C12 cells, determined by immunofluorescence. Distribution
of Akt across the cytoplasm upon treatment with LY294002.
Loss of:
- Akt-positive staining in paraffin-embedded human breast carcinoma upon
incubation with Akt blocking peptide, determined by immunohistochemistry
- localisation of Akt towards plasma membrane after treatment with LY294002
in paraffin-embedded LNCaP cells, determined by immunohistochemistry
Total p70S6K 2708 Detection of p70S6K in:
- cell lysates from PC12, NIH/3T3 or SK-N-MC cells, determined by Western
Blot
(Cell Signalling
Technology, 2015c)
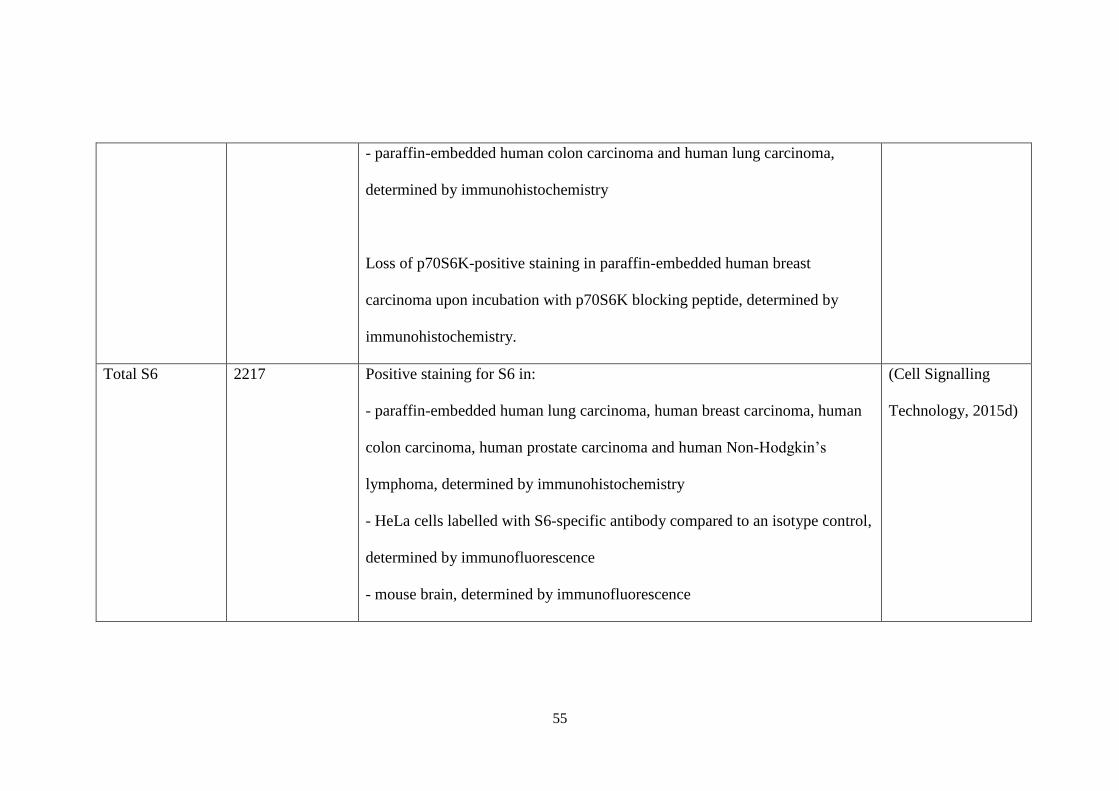
55
- paraffin-embedded human colon carcinoma and human lung carcinoma,
determined by immunohistochemistry
Loss of p70S6K-positive staining in paraffin-embedded human breast
carcinoma upon incubation with p70S6K blocking peptide, determined by
immunohistochemistry.
Total S6 2217 Positive staining for S6 in:
- paraffin-embedded human lung carcinoma, human breast carcinoma, human
colon carcinoma, human prostate carcinoma and human Non-Hodgkin’s
lymphoma, determined by immunohistochemistry
- HeLa cells labelled with S6-specific antibody compared to an isotype control,
determined by immunofluorescence
- mouse brain, determined by immunofluorescence
(Cell Signalling
Technology, 2015d)
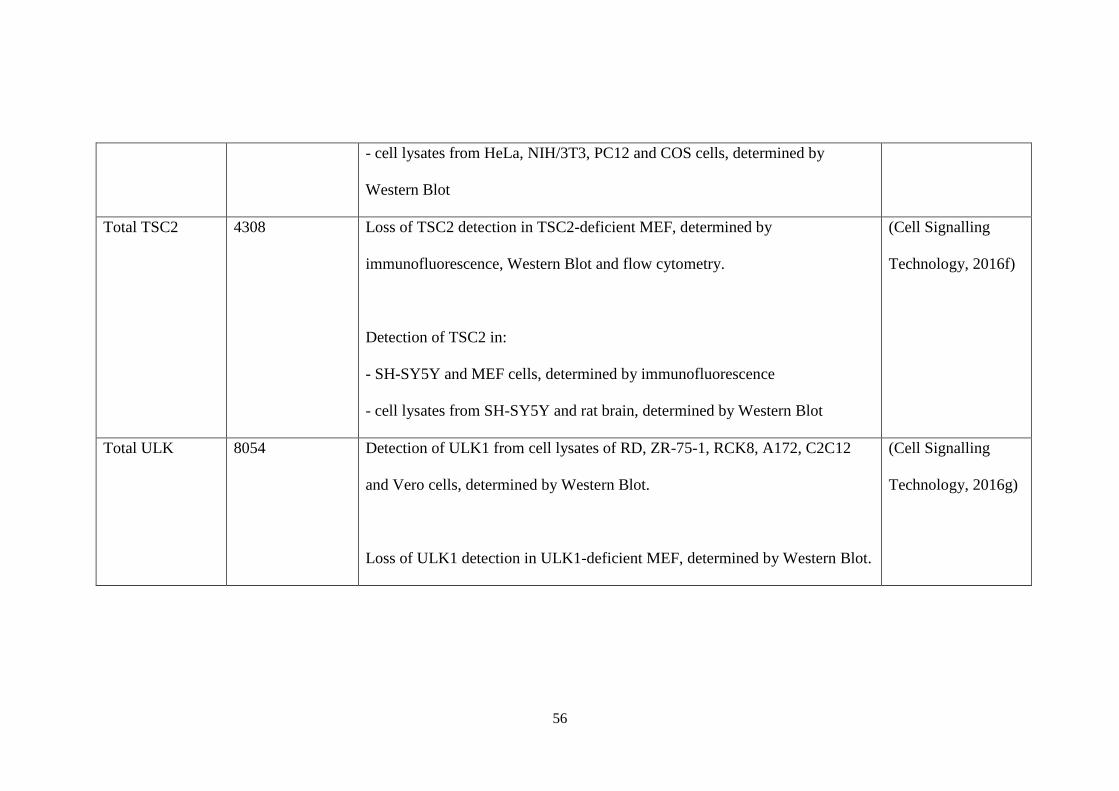
56
- cell lysates from HeLa, NIH/3T3, PC12 and COS cells, determined by
Western Blot
Total TSC2 4308 Loss of TSC2 detection in TSC2-deficient MEF, determined by
immunofluorescence, Western Blot and flow cytometry.
Detection of TSC2 in:
- SH-SY5Y and MEF cells, determined by immunofluorescence
- cell lysates from SH-SY5Y and rat brain, determined by Western Blot
(Cell Signalling
Technology, 2016f)
Total ULK 8054 Detection of ULK1 from cell lysates of RD, ZR-75-1, RCK8, A172, C2C12
and Vero cells, determined by Western Blot.
Loss of ULK1 detection in ULK1-deficient MEF, determined by Western Blot.
(Cell Signalling
Technology, 2016g)
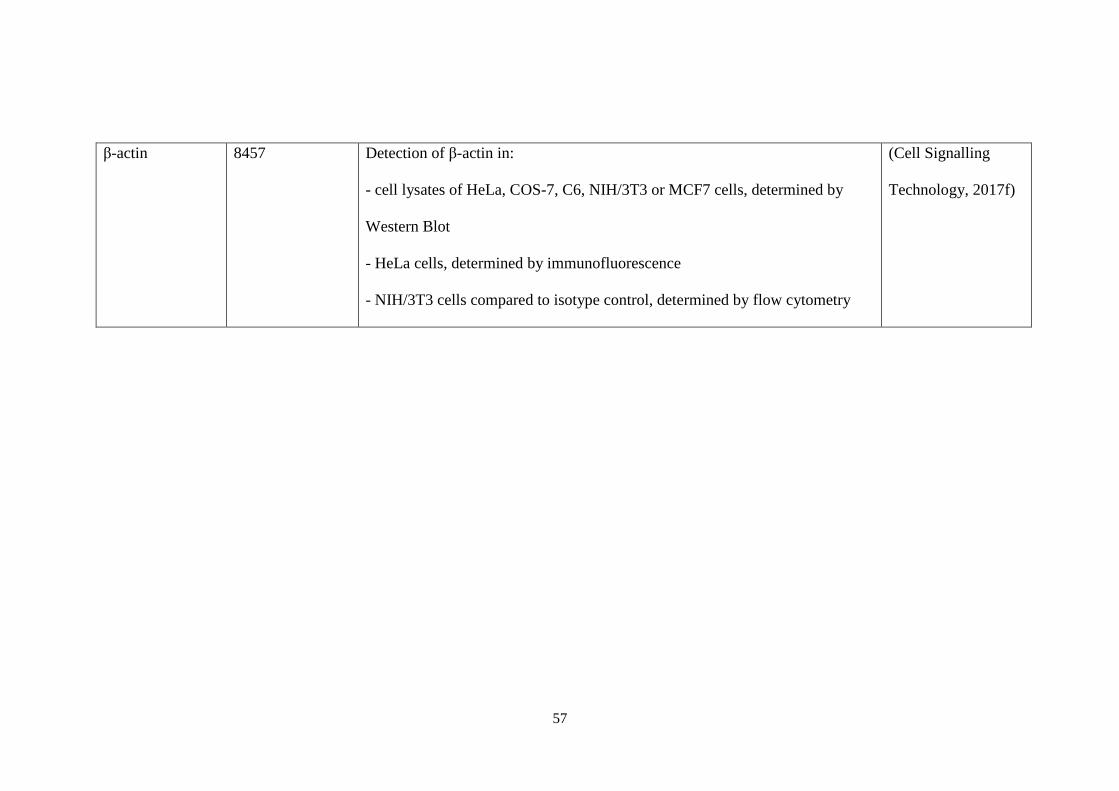
57
β-actin 8457 Detection of β-actin in:
- cell lysates of HeLa, COS-7, C6, NIH/3T3 or MCF7 cells, determined by
Western Blot
- HeLa cells, determined by immunofluorescence
- NIH/3T3 cells compared to isotype control, determined by flow cytometry
(Cell Signalling
Technology, 2017f)
58
2.3 Quantitative real time-PCR (qPCR)
RNA was extracted using the ReliaPrepTM RNA Cell Miniprep System
(Promega, WI, USA). Snap-frozen cell layers were scrapped on ice in
proprietary BL buffer containing 1% (v/v) of 1-thioglycerol to inactivate
endogenous RNAse. Lysates were pipetted multiple times through a P200 to
shear DNA, before being centrifuged through mini-columns that specifically
bind nucleic acids. After washing of debris, bound DNA were digested by direct
application of RNAse-free DNAse I to the membrane. The mini-columns were
washed again followed by elution of RNA in nuclease-free water. RNA purity
was determined spectrophotometrically, by which a value of A260/A280
between 1.7 to 2.1 was considered of acceptable purity.
Purified RNA was converted to cDNA using SuperScript® III First‐Strand
Synthesis System for RT‐PCR (Life Technologies, CA, USA) with oligo(dT)20.
Typically, 3 µg of RNA sample was added to a mix of oligo(dT)20 primers and
deoxynucleotides to be denatured at 65○C for 5 min and subsequently on ice for
at least 1 min. Next, cDNA synthesis mix comprising of proprietary 1X RT
buffer, 2 U/mL of RNaseOUT, 10 U/uL of SuperScript® III RT, 5 mM of
magnesium chloride (MgCl2) and 10 mM of dithiothreitol was added to initiate
reverse transcription at 50○C for 50 min. Reactions were then terminated at 85○C
for 5 min, and RNase H was added to each reaction to degrade RNA, incubated
at 37○C for 20 min. The resultant cDNA was stored at -20○C.
qPCR was performed using the GoTaq® qPCR Master Mix (Promega, WI,
USA) using the Applied Biosystems 7300 Real‐Time PCR System. A reaction
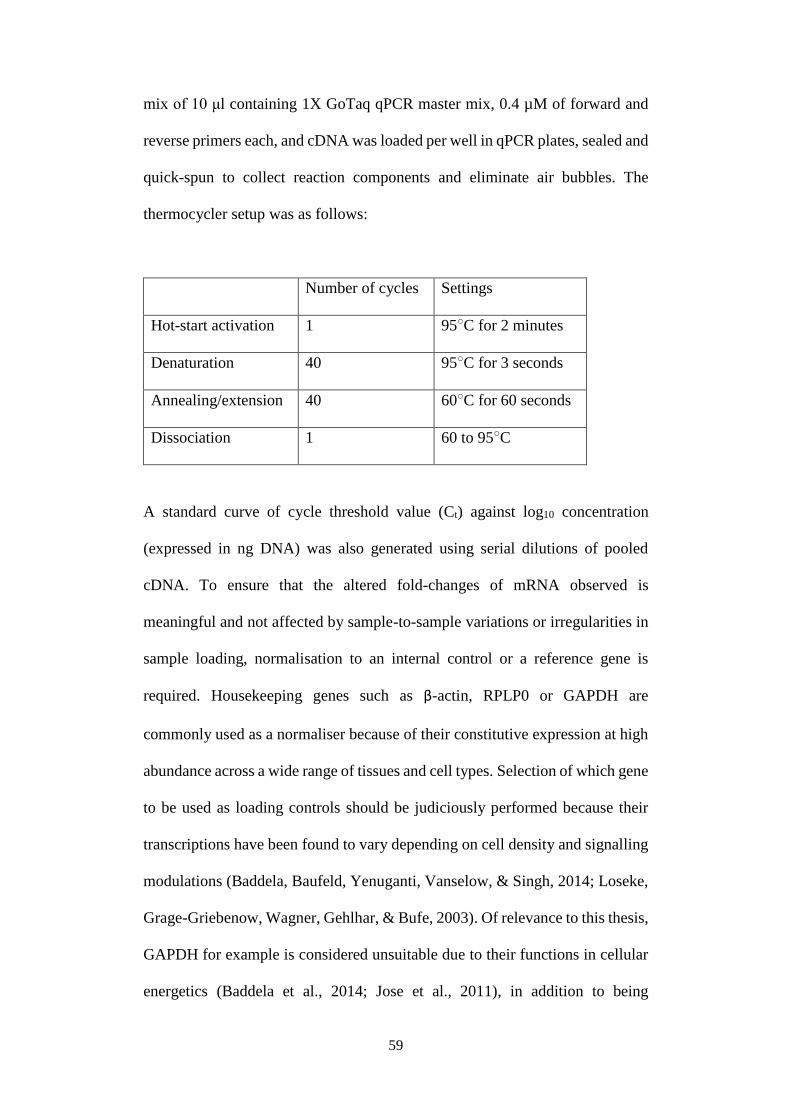
59
mix of 10 μl containing 1X GoTaq qPCR master mix, 0.4 µM of forward and
reverse primers each, and cDNA was loaded per well in qPCR plates, sealed and
quick-spun to collect reaction components and eliminate air bubbles. The
thermocycler setup was as follows:
Number of cycles Settings
Hot-start activation 1 95○C for 2 minutes
Denaturation 40 95○C for 3 seconds
Annealing/extension 40 60○C for 60 seconds
Dissociation 1 60 to 95○C
A standard curve of cycle threshold value (Ct) against log10 concentration
(expressed in ng DNA) was also generated using serial dilutions of pooled
cDNA. To ensure that the altered fold-changes of mRNA observed is
meaningful and not affected by sample-to-sample variations or irregularities in
sample loading, normalisation to an internal control or a reference gene is
required. Housekeeping genes such as β-actin, RPLP0 or GAPDH are
commonly used as a normaliser because of their constitutive expression at high
abundance across a wide range of tissues and cell types. Selection of which gene
to be used as loading controls should be judiciously performed because their
transcriptions have been found to vary depending on cell density and signalling
modulations (Baddela, Baufeld, Yenuganti, Vanselow, & Singh, 2014; Loseke,
Grage-Griebenow, Wagner, Gehlhar, & Bufe, 2003). Of relevance to this thesis,
GAPDH for example is considered unsuitable due to their functions in cellular
energetics (Baddela et al., 2014; Jose et al., 2011), in addition to being
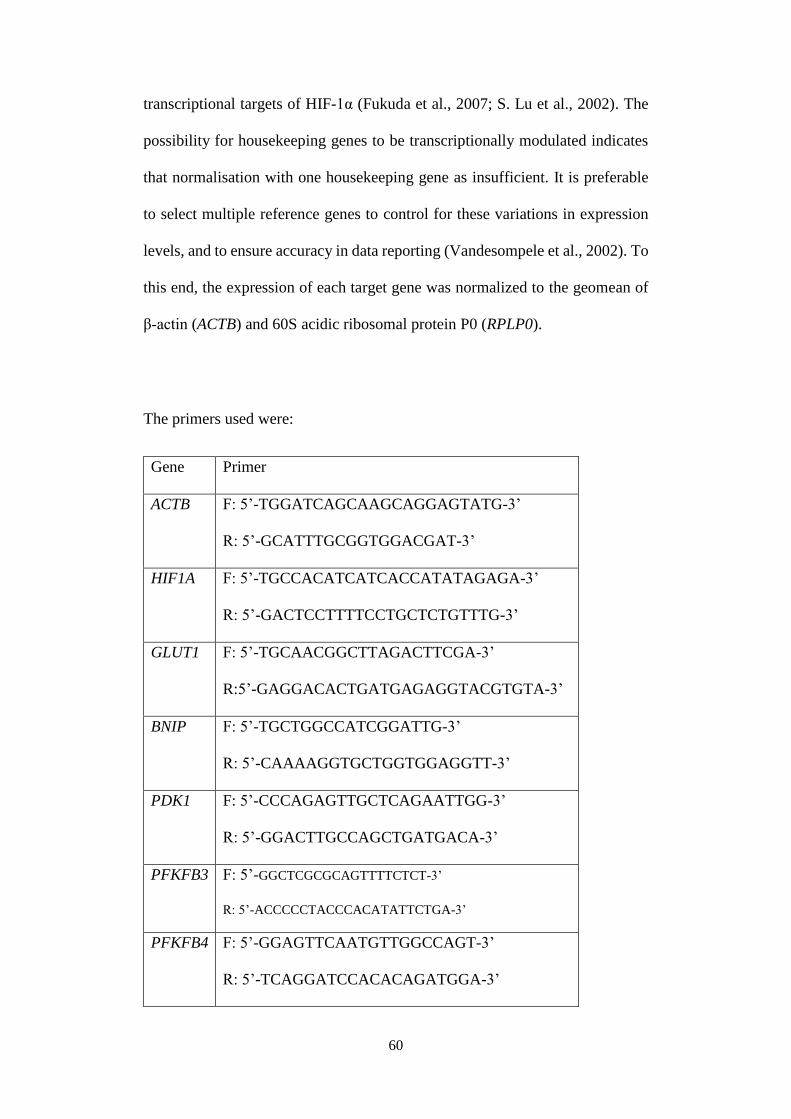
60
transcriptional targets of HIF-1α (Fukuda et al., 2007; S. Lu et al., 2002). The
possibility for housekeeping genes to be transcriptionally modulated indicates
that normalisation with one housekeeping gene as insufficient. It is preferable
to select multiple reference genes to control for these variations in expression
levels, and to ensure accuracy in data reporting (Vandesompele et al., 2002). To
this end, the expression of each target gene was normalized to the geomean of
β‐actin (ACTB) and 60S acidic ribosomal protein P0 (RPLP0).
The primers used were:
Gene Primer
ACTB F: 5’-TGGATCAGCAAGCAGGAGTATG-3’
R: 5’-GCATTTGCGGTGGACGAT-3’
HIF1A F: 5’-TGCCACATCATCACCATATAGAGA-3’
R: 5’-GACTCCTTTTCCTGCTCTGTTTG-3’
GLUT1 F: 5’-TGCAACGGCTTAGACTTCGA-3’
R:5’-GAGGACACTGATGAGAGGTACGTGTA-3’
BNIP F: 5’-TGCTGGCCATCGGATTG-3’
R: 5’-CAAAAGGTGCTGGTGGAGGTT-3’
PDK1 F: 5’-CCCAGAGTTGCTCAGAATTGG-3’
R: 5’-GGACTTGCCAGCTGATGACA-3’
PFKFB3 F: 5’-GGCTCGCGCAGTTTTCTCT-3’
R: 5’-ACCCCCTACCCACATATTCTGA-3’
PFKFB4 F: 5’-GGAGTTCAATGTTGGCCAGT-3’
R: 5’-TCAGGATCCACACAGATGGA-3’
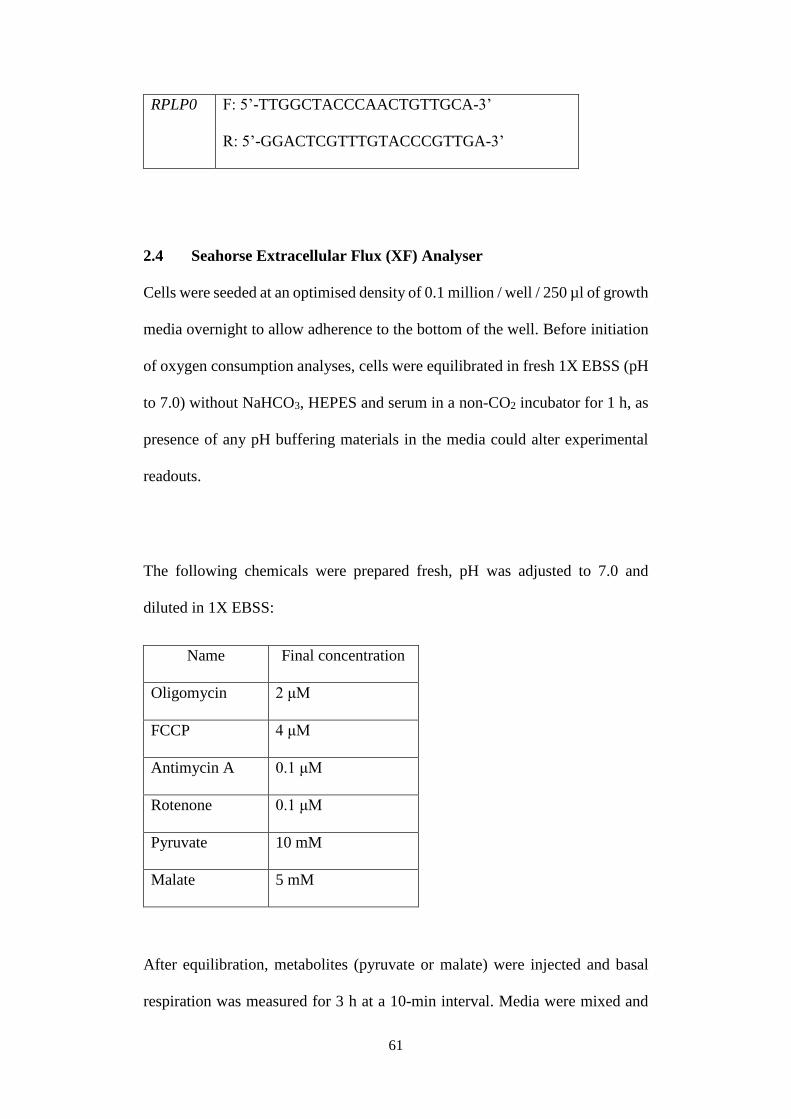
61
RPLP0 F: 5’-TTGGCTACCCAACTGTTGCA-3’
R: 5’-GGACTCGTTTGTACCCGTTGA-3’
2.4 Seahorse Extracellular Flux (XF) Analyser
Cells were seeded at an optimised density of 0.1 million / well / 250 µl of growth
media overnight to allow adherence to the bottom of the well. Before initiation
of oxygen consumption analyses, cells were equilibrated in fresh 1X EBSS (pH
to 7.0) without NaHCO3, HEPES and serum in a non-CO2 incubator for 1 h, as
presence of any pH buffering materials in the media could alter experimental
readouts.
The following chemicals were prepared fresh, pH was adjusted to 7.0 and
diluted in 1X EBSS:
Name Final concentration
Oligomycin 2 μM
FCCP 4 μM
Antimycin A 0.1 μM
Rotenone 0.1 μM
Pyruvate 10 mM
Malate 5 mM
After equilibration, metabolites (pyruvate or malate) were injected and basal
respiration was measured for 3 h at a 10-min interval. Media were mixed and
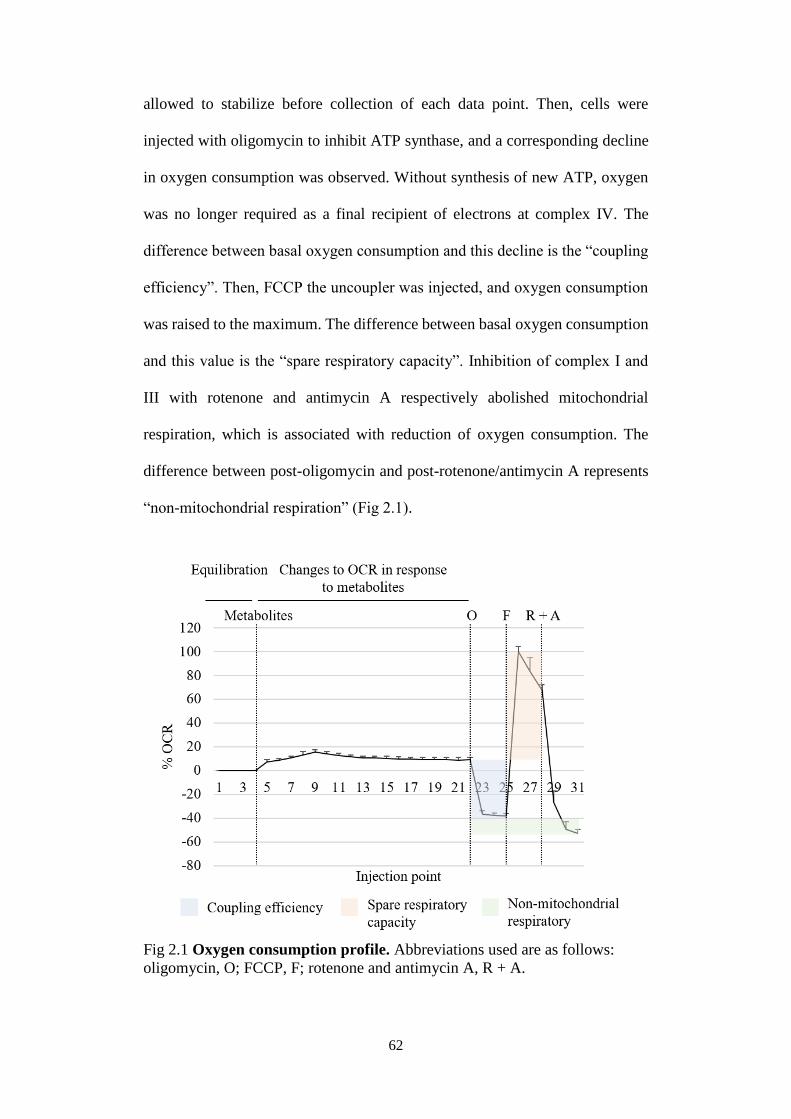
62
allowed to stabilize before collection of each data point. Then, cells were
injected with oligomycin to inhibit ATP synthase, and a corresponding decline
in oxygen consumption was observed. Without synthesis of new ATP, oxygen
was no longer required as a final recipient of electrons at complex IV. The
difference between basal oxygen consumption and this decline is the “coupling
efficiency”. Then, FCCP the uncoupler was injected, and oxygen consumption
was raised to the maximum. The difference between basal oxygen consumption
and this value is the “spare respiratory capacity”. Inhibition of complex I and
III with rotenone and antimycin A respectively abolished mitochondrial
respiration, which is associated with reduction of oxygen consumption. The
difference between post-oligomycin and post-rotenone/antimycin A represents
“non-mitochondrial respiration” (Fig 2.1).
Fig 2.1 Oxygen consumption profile. Abbreviations used are as follows:
oligomycin, O; FCCP, F; rotenone and antimycin A, R + A.
63
2.5 Flow cytometry
Flow cytometry was used to determine 1) intracellular ROS, 2) cell cycle, and
3) cell size. Staining protocols and preparations of cell suspension differ for
each purpose.
To measure ROS, maintenance of cell metabolism and speed of sample
processing is crucial, as this assay is performed on viable, metabolically active
cells. Thus, 1 h before termination of experiments, cells were stained with 5 μM
of 2’, 7’-dichlorofluororescin diacetate (DCFDA) at 37°C. Then, treatment
media were collected, and cell layers were treated with 0.25% trypsin-EDTA.
To prevent continuous digestion by trypsin, cells were reconstituted in their
respective media. The advantages of doing this are, 1) trypsin was inactivated
by dilution with a large volume of media containing 0.2% BSA, and 2) treatment
conditions were preserved as cells remain in contact with treatment media. As
a positive control, cells were treated with 1 mM of H2O2 for 15 min. Data
acquisition was carried out on a BD FACSCanto II flow cytometer, analysed
with BD FACSDivaTM software, and post-processed with the Flowing Software.
After gating out cell debris and doublets, cell population of interest was detected
using Ex 488 nm and Em 525 nm.
For analyses of cell cycle and cell size, cells were fixed in 75% ethanol for 15
min at 4°C. Cells were then rinsed once with ice-cold 1X PBS and stained with
FxCycle propidium iodide (PI)/RNAse at room temperature for 45 min in the
dark, after which they were detected on a flow cytometer using Ex 488 nm and
64
Em 525 nm. Cell cycle was expressed as a percentage of cells in G0/1 : S : G2/M
phases. Cell size was analysed only on quiescent G0/1-gated cells because cell
size may increase upon DNA duplication, rendering analysis inaccurate.
2.6 Metabolomics analysis
Cells were incubated with 1X EBSS treatment media prepared as described in
section 2.1. At the end of each experiment, cell layers were rinsed thoroughly
with ice cold 1X PBS to remove metabolites found in residual treatment media.
Cells were snapfrozen to immediately terminate experiments and preserve
endogenous metabolites. For untargeted metabolomics, starting material of 6.5
million HepG2 cells per sample were scraped in ice-cold extraction solution
consisting of acetonitrile (LC-MS grade, Sigma Aldrich), isopropanol (GC-MS
grade, Sigma Aldrich) and dH2O in the proportion 3 : 3 : 2. Then, cell lysates
were collected in polypropylene microcentrifuge tubes and delivered on dry ice
to West Coast Metabolomics Centre (UC Davis, CA, USA). Fold change of each
metabolite was obtained by:
65
For targeted metabolomics, starting material of 1 million HepG2 cells per
sample were scrapped in ice-cold extraction solution consisting of 0.6% formic
acid (Sigma Aldrich) in dH2O. An aliquot was removed for protein
concentration measurement using Pierce BCA protein assay. Cell lysates were
then topped up to a final volume with acetonitrile, and delivered on dry ice to
Duke-NUS Metabolomics Facility (Duke-NUS, Singapore). Normalised fold
change of each metabolite was obtained by:
2.7 Mitochondrial membrane potential (MMP) measurement
MMP is determined as the fluorescence intensity ratio of red aggregate to green
monomer in cells stained with the lipophilic dye, JC-1. When the mitochondria
are at a “basal”, non-depolarized state, JC-1 is detected at the Em of about 529
nm as green monomers. Upon membrane depolarization, JC-1 migrates across
the membrane to accumulate in the matrix, and is detected at the Em of about
590 nm as red aggregates.
Cells were stained with 2.5 μM of JC-1 at 37°C for 1 h before termination of
experiment. Treatment media were collected, and cell layers were detached by
trypsin treatment. To prevent continuous digestion by trypsin and to preserve
treatment conditions, cells were reconstituted in their respective media. This is
66
important because MMP is dynamically regulated and reversible to basal level
once metabolic perturbations are removed. As a negative control, cells were
treated with 10 μM of the uncoupler FCCP for 2 h at 37°C. Uncouplers abolish
potential difference across the mitochondria membranes, thus these cells would
display a low fluorescence intensity ratio of red aggregate to green monomer.
Detection of aggregate and monomer was determined spectrophotometrically,
at Ex 475 nm and Em 590 nm for red aggregate, and Em 530 nm for green
monomer.
2.8 Cell fractionation for profiling of compartmentalized metabolites
A practical protocol for detection of metabolites compartmentalized in different
organelles should achieve the following: 1) preservation of organelle integrity
for clean separation of metabolites to avoid cross-contamination, 2) quickly
performed as some metabolites are labile, and 3) complete inhibition of
endogenous metabolic activities post-experiment (during fractionation). This
necessitated a series of assays to be established and optimised as a “system”.
Cells were rinsed with ice-cold 1X PBS rapidly and thoroughly to remove
residual treatment media. Because cells were processed on ice from this point
onward, detachment with trypsin was unfeasible, and EDTA was used instead.
The concentration of EDTA had to be optimized as EDTA is an effective
calcium ion (Ca2+) chelator, which has direct impact on mitochondrial activities
(Bernardi, Angrilli, & Azzone, 1990; Voccoli, Tonazzini, Signore, Caleo, &
Cecchini, 2014). An optimum concentration of 3 mM of EDTA was chosen as
67
cells were detached on ice quickly (in 5 - 7 min, comparable to using trypsin)
without perturbations to MMP.
The resultant cell suspension was collected and centrifuged at 130 xg for 5 min
at 4°C to pellet down the cells. After rinsing of pellet with ice-cold 1X PBS to
remove residual EDTA, cell pellet was reconstituted in ice-cold Medium A
containing 250 mM of sucrose, 20 mM of HEPES, 10 mM of MgCl2 and 12.5
mM of KH2PO4, pH-ed to 7.1. This preserves mitochondria’s integrity during
selective permeabilization of plasma membrane by saponin, a plant glycoside
that interacts with membrane cholesterol to cause perforations, thus is relatively
inert to cholesterol-poor mitochondrial and nuclear membranes (Jamur &
Oliver, 2010). To optimize concentration of saponin, cells were incubated with
a range of concentration at 4°C for 15 min with constant agitation. The extent
of plasma membrane perturbation was determined by Trypan blue exclusion, as
permeabilized cells would appear stained under the microscope. The
concentration of 80 μg/ml of saponin was selected as more than 80% of cell
population was successfully perforated without affecting MMP.
MMP readout was used to approximate mitochondria integrity as it 1) alludes
to preservation of electrochemical gradient across mitochondrial membranes, 2)
can be performed economically, and 3) quickly on a spectrophotometer. Cell
fractions were then stored at -80°C for further analysis.
68
2.9 Ammonia quantification
Intracellular ammonia/NH4+ concentration was determined by using Ammonia
Colourimetric Assay Kit (BioVision, CA, USA). To terminate experiment,
treatment media were removed, and cell layers were rinsed with 1X PBS before
snapfreezing. A starting material of 0.8 million HepG2 per sample was
homogenised in proprietary Assay Buffer on ice, then centrifuged at 13 000 xg
for 10 min to remove cell debris. A reaction mix containing Assay Buffer,
OxiRed Probe, Enzyme Mix, Developer and Converting Enzyme was added to
cell lysate and incubated at 37°C for 1 h. A standard curve was generated using
serial dilutions of kit-provided NH4Cl. To control for background, cell lysate
was incubated with all components of reaction mix except converting enzyme.
OD was read at 570 nm on a spectrophotometer, and the concentration of
ammonia/NH4+ was normalised to protein concentration, as determined by
Pierce BCA protein assay.
2.10 Statistical analysis
To assess differences in measured differences 1) between two independent
groups, Student’s T-test was performed, whereby statistical significance was
accepted at p < 0.05, or 2) among groups of three or more, one-way ANOVA
was performed, followed by Tukey’s pairwise comparison whereby statistical
significance was accepted at p < 0.05.
In the case of targeted and untargeted metabolomics analyses, data were
further controlled for false discovery rate (FDR) by using the Benjamini-

69
Hochberg procedure. FDR was set between a conservative 0.05 to 0.1 (as
stated in the respective figure captions).
70
CHAPTER 3: Pyruvate-mediated HIF-1α stabilisation at normoxia is
dependent on α-KG and the implication of lysine catabolism as a
metabolic repair mechanism
3.1 Introduction
In 2011, Hanahan and Weinberg revised their proposed hallmarks of cancer to
include dysregulation of cellular energetics (Hanahan & Weinberg, 2011),
which has long been described by Warburg in the 1920s, in which he observed
a preference for actively proliferating cells to ferment glucose into lactate even
in the presence of oxygen. The oncogenic potential of glycolytic intermediates,
particularly that of pyruvate have since been questioned.
Pyruvate has been proposed to be the pivoting point of cell fate determination,
specifically whether it is pro-oncogenic or -senescent. Aerobic respiration
drives its mitochondrial decarboxylation to acetyl-CoA, an irreversible step
catalysed by PDH, which then enters the TCA cycle. Diverting pyruvate into
the oxidative arm via PDH has been shown to induce oncogene-induced
senescence against a background of BRAFV600E mutation in melanoma cells
(Kaplon et al., 2013; Olenchock & Vander Heiden, 2013) as a safeguard against
neoplastic transformation. Conversely, during hypoxia or in cancers, pyruvate
is shunted away from the mitochondria for preferential conversion to lactate in
the cytoplasm – the Warburg effect. This metabolic alteration has been shown
to be indispensable in sustaining accelerated proliferation rate (Duckwall et al.,
2013; Kato et al., 2013; J. Lu et al., 2015).
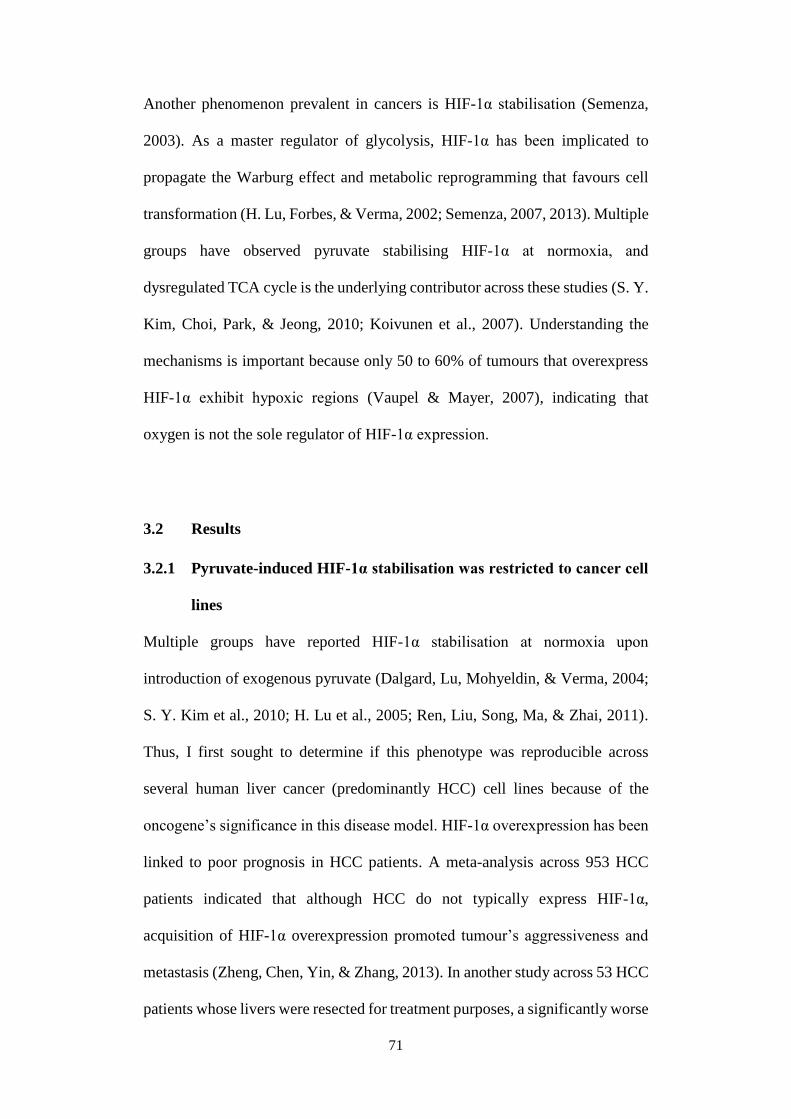
71
Another phenomenon prevalent in cancers is HIF-1α stabilisation (Semenza,
2003). As a master regulator of glycolysis, HIF-1α has been implicated to
propagate the Warburg effect and metabolic reprogramming that favours cell
transformation (H. Lu, Forbes, & Verma, 2002; Semenza, 2007, 2013). Multiple
groups have observed pyruvate stabilising HIF-1α at normoxia, and
dysregulated TCA cycle is the underlying contributor across these studies (S. Y.
Kim, Choi, Park, & Jeong, 2010; Koivunen et al., 2007). Understanding the
mechanisms is important because only 50 to 60% of tumours that overexpress
HIF-1α exhibit hypoxic regions (Vaupel & Mayer, 2007), indicating that
oxygen is not the sole regulator of HIF-1α expression.
3.2 Results
3.2.1 Pyruvate-induced HIF-1α stabilisation was restricted to cancer cell
lines
Multiple groups have reported HIF-1α stabilisation at normoxia upon
introduction of exogenous pyruvate (Dalgard, Lu, Mohyeldin, & Verma, 2004;
S. Y. Kim et al., 2010; H. Lu et al., 2005; Ren, Liu, Song, Ma, & Zhai, 2011).
Thus, I first sought to determine if this phenotype was reproducible across
several human liver cancer (predominantly HCC) cell lines because of the
oncogene’s significance in this disease model. HIF-1α overexpression has been
linked to poor prognosis in HCC patients. A meta-analysis across 953 HCC
patients indicated that although HCC do not typically express HIF-1α,
acquisition of HIF-1α overexpression promoted tumour’s aggressiveness and
metastasis (Zheng, Chen, Yin, & Zhang, 2013). In another study across 53 HCC
patients whose livers were resected for treatment purposes, a significantly worse
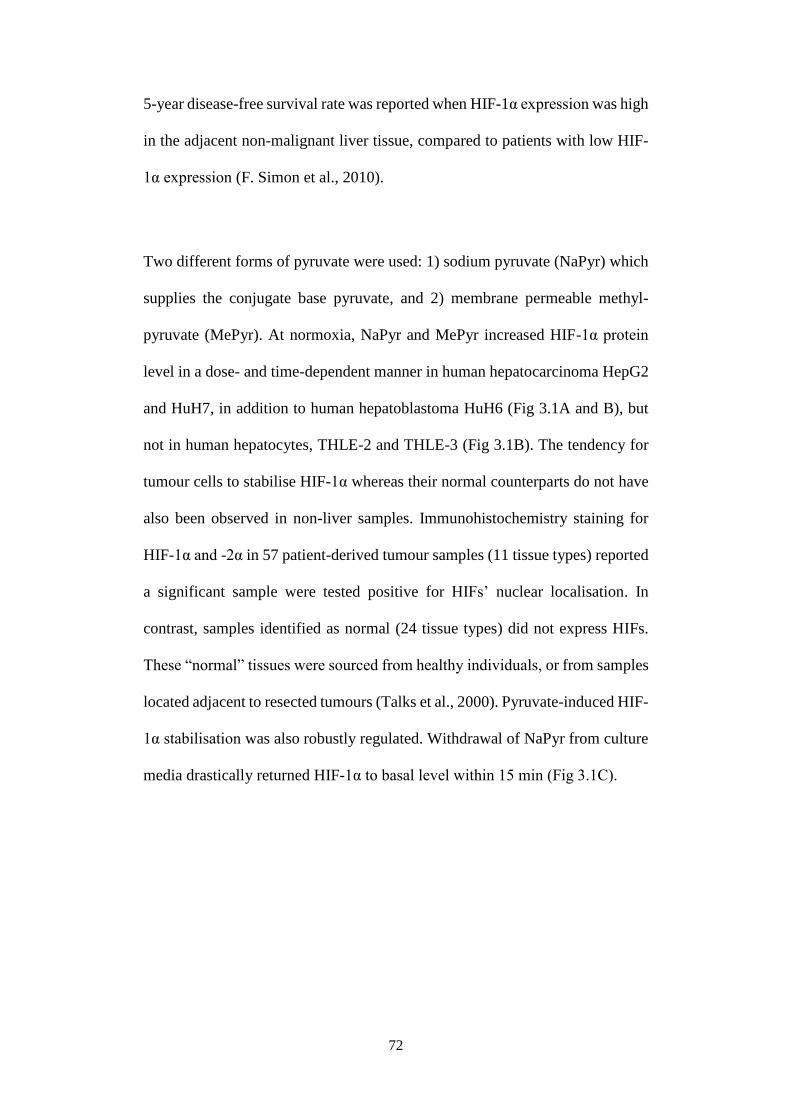
72
5-year disease-free survival rate was reported when HIF-1α expression was high
in the adjacent non-malignant liver tissue, compared to patients with low HIF-
1α expression (F. Simon et al., 2010).
Two different forms of pyruvate were used: 1) sodium pyruvate (NaPyr) which
supplies the conjugate base pyruvate, and 2) membrane permeable methyl-
pyruvate (MePyr). At normoxia, NaPyr and MePyr increased HIF-1α protein
level in a dose- and time-dependent manner in human hepatocarcinoma HepG2
and HuH7, in addition to human hepatoblastoma HuH6 (Fig 3.1A and B), but
not in human hepatocytes, THLE-2 and THLE-3 (Fig 3.1B). The tendency for
tumour cells to stabilise HIF-1α whereas their normal counterparts do not have
also been observed in non-liver samples. Immunohistochemistry staining for
HIF-1α and -2α in 57 patient-derived tumour samples (11 tissue types) reported
a significant sample were tested positive for HIFs’ nuclear localisation. In
contrast, samples identified as normal (24 tissue types) did not express HIFs.
These “normal” tissues were sourced from healthy individuals, or from samples
located adjacent to resected tumours (Talks et al., 2000). Pyruvate-induced HIF-
1α stabilisation was also robustly regulated. Withdrawal of NaPyr from culture
media drastically returned HIF-1α to basal level within 15 min (Fig 3.1C).
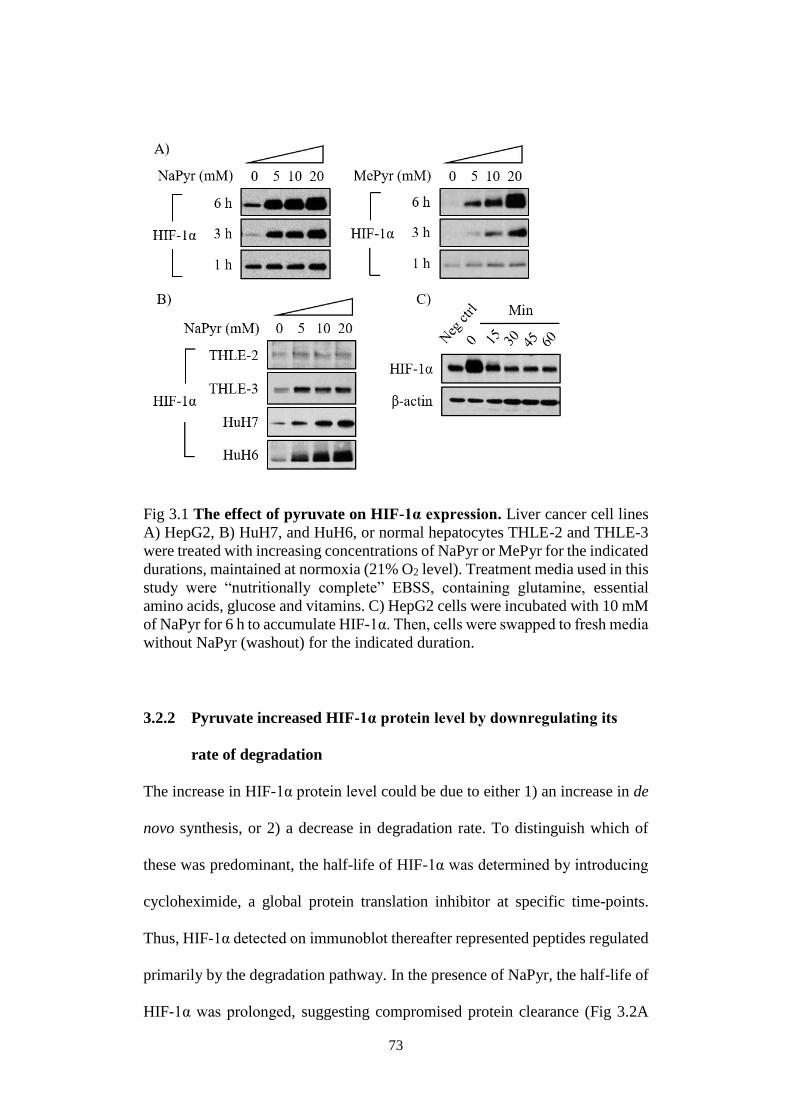
73
Fig 3.1 The effect of pyruvate on HIF-1α expression. Liver cancer cell lines
A) HepG2, B) HuH7, and HuH6, or normal hepatocytes THLE-2 and THLE-3
were treated with increasing concentrations of NaPyr or MePyr for the indicated
durations, maintained at normoxia (21% O2 level). Treatment media used in this
study were “nutritionally complete” EBSS, containing glutamine, essential
amino acids, glucose and vitamins. C) HepG2 cells were incubated with 10 mM
of NaPyr for 6 h to accumulate HIF-1α. Then, cells were swapped to fresh media
without NaPyr (washout) for the indicated duration.
3.2.2 Pyruvate increased HIF-1α protein level by downregulating its
rate of degradation
The increase in HIF-1α protein level could be due to either 1) an increase in de
novo synthesis, or 2) a decrease in degradation rate. To distinguish which of
these was predominant, the half-life of HIF-1α was determined by introducing
cycloheximide, a global protein translation inhibitor at specific time-points.
Thus, HIF-1α detected on immunoblot thereafter represented peptides regulated
primarily by the degradation pathway. In the presence of NaPyr, the half-life of
HIF-1α was prolonged, suggesting compromised protein clearance (Fig 3.2A
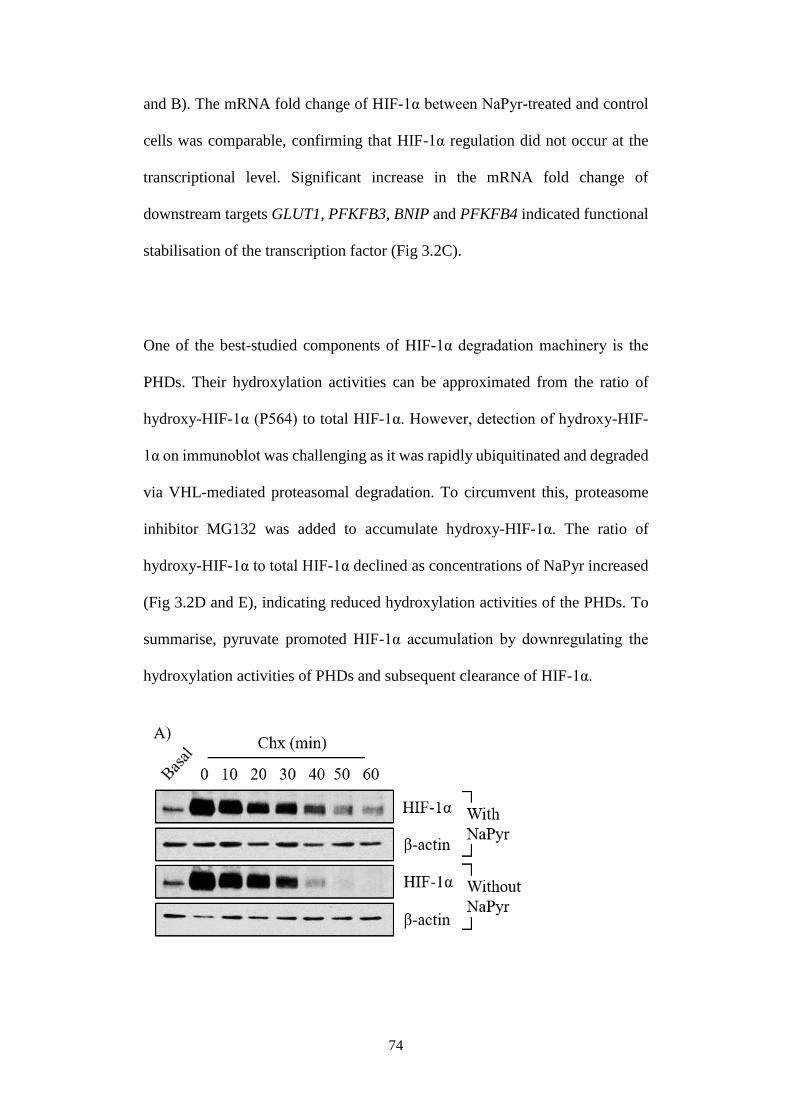
74
and B). The mRNA fold change of HIF-1α between NaPyr-treated and control
cells was comparable, confirming that HIF-1α regulation did not occur at the
transcriptional level. Significant increase in the mRNA fold change of
downstream targets GLUT1, PFKFB3, BNIP and PFKFB4 indicated functional
stabilisation of the transcription factor (Fig 3.2C).
One of the best-studied components of HIF-1α degradation machinery is the
PHDs. Their hydroxylation activities can be approximated from the ratio of
hydroxy-HIF-1α (P564) to total HIF-1α. However, detection of hydroxy-HIF-
1α on immunoblot was challenging as it was rapidly ubiquitinated and degraded
via VHL-mediated proteasomal degradation. To circumvent this, proteasome
inhibitor MG132 was added to accumulate hydroxy-HIF-1α. The ratio of
hydroxy-HIF-1α to total HIF-1α declined as concentrations of NaPyr increased
(Fig 3.2D and E), indicating reduced hydroxylation activities of the PHDs. To
summarise, pyruvate promoted HIF-1α accumulation by downregulating the
hydroxylation activities of PHDs and subsequent clearance of HIF-1α.
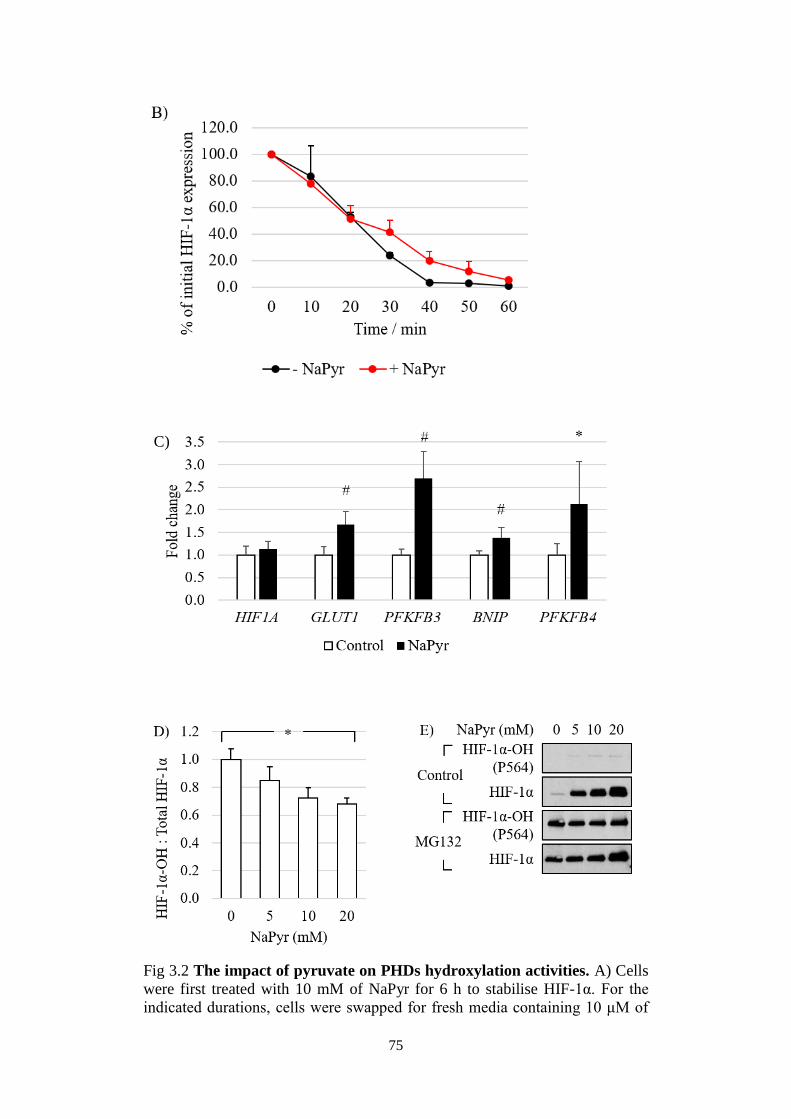
75
Fig 3.2 The impact of pyruvate on PHDs hydroxylation activities. A) Cells
were first treated with 10 mM of NaPyr for 6 h to stabilise HIF-1α. For the
indicated durations, cells were swapped for fresh media containing 10 μM of
C)
76
cycloheximide (Chx), in the absence or presence of NaPyr. B) Densitometry
analysis of (A), whereby the gradient of each curve generated is a function of
HIF-1α degradation rate. Data presented as mean ± SD, n = 2. C) Cells were
treated with 0 or 10 mM of NaPyr for 6 h. Data presented as mean ± SD, n = 6.
Statistical significance was determined by Student’s t-test, and accepted at p <
0.05, whereby *p < 0.05, #p < 0.01. D) Cells were pre-treated with 25 μM of
MG132 for 1 h, before incubation with increasing concentrations of NaPyr for
the next 6 h. The ratio of hydroxy HIF-1α to total HIF-1α was depicted as bar
graph, expressed as mean ± SD, n = 4. Statistical significance was determined
by one-way ANOVA followed by Tukey’s pairwise comparison, and accepted
at *p < 0.05. E) Representative Western Blot to assist derivation of the ratio of
hydroxy-HIF-1α to total HIF-1α.
3.2.3 Exhaustion of intracellular oxygen or raised ROS level did not
contribute to HIF-1α stabilisation
As members of the 2-oxoglutarate dependent dioxygenase family, PHDs utilise
O2 as obligatory substrates to carry out their hydroxylation functions. It was
possible that pyruvate promoted respiration to the extent of creating a hypoxic
microenvironment within the cell to inactivate PHDs. Ideally, intracellular
oxygen concentration should be measured directly but in this experiment, it was
extrapolated from oxygen consumption rate (OCR), measured by the Seahorse
XF Analyser. Avid consumption of O2 was presumed to exhaust intracellular
oxygen level. NaPyr-treated cells recorded a modest 10% increase in OCR,
compared to control (Fig 3.3A). Next, 5 mM of malate, a substrate of complex
I, was added to raise mitochondrial oxygen consumption (Ferguson & Williams,
1966; Protti et al., 2007). Theoretically, by promoting further consumption of
O2, endogenous O2 store would be depleted more, further enhancing HIF-1α
accumulation. Intriguingly, malate reduced HIF-1α to near basal level despite a
20% increase in OCR in NaPyr-treated cells (Fig 3.3A and B). These results
provided evidence that 1) promotion of oxygen consumption by pyruvate was
insufficient to stabilise HIF-1α, because 2) further doubling of OCR when
77
supplemented with malate did not promote HIF-1α stabilisation; instead, HIF-
1α was reduced to basal level.
ROS are natural by-products of the mitochondrial electron transport chain
(ETC). Considering prior evidences of ROS contributing to HIF-1α stabilisation
at normoxia (Chandel et al., 2000; Moon et al., 2010; Sullivan et al., 2013) and
OCR was raised in response to pyruvate (Fig 3.3A), I sought to assess the
correlations, if any, between ROS and HIF-1α accumulation. Intracellular ROS
was evaluated by flow cytometry analysis of DCFDA-stained cells. The relative
fluorescence unit (RFU) between control and NaPyr-treated samples was
comparable (Fig 3.3C), indicating that pyruvate did not promote significant
ROS production. Supplementation of NaPyr-treated cells with a potent
antioxidant N-acetylcysteine (NAC) did not affect HIF-1α (Fig 3.3D).
Introduction of H2O2 for up to 6 h also did not alter HIF-1α protein content (Fig
3.3E). ROS also takes the form of diverse peroxides of proteins, lipids and
nucleic acids. Non-oxygen-containing free radicals such as reactive carbonyl
species and reactive nitrogen species demonstrate oxidative capacities as well
(Lushchak, 2015). With respect to pyruvate-treated cells however, promotion of
ETC activities were found to decrease its redox potential to incur superoxide
anions production (Murphy, 2009; Starkov & Fiskum, 2003). These are further
processed into H2O2, hydroxyl radical and hydroxyl anion; ROS species that are
detectable by DCFDA and scavenged by NAC (Aruoma, Halliwell, Hoey, &
Butler, 1989; Kristiansen, Jensen, Moller, & Schulz, 2009). Collectively, these
data indicate that ROS did not mediate pyruvate-induced HIF-1α stabilisation.
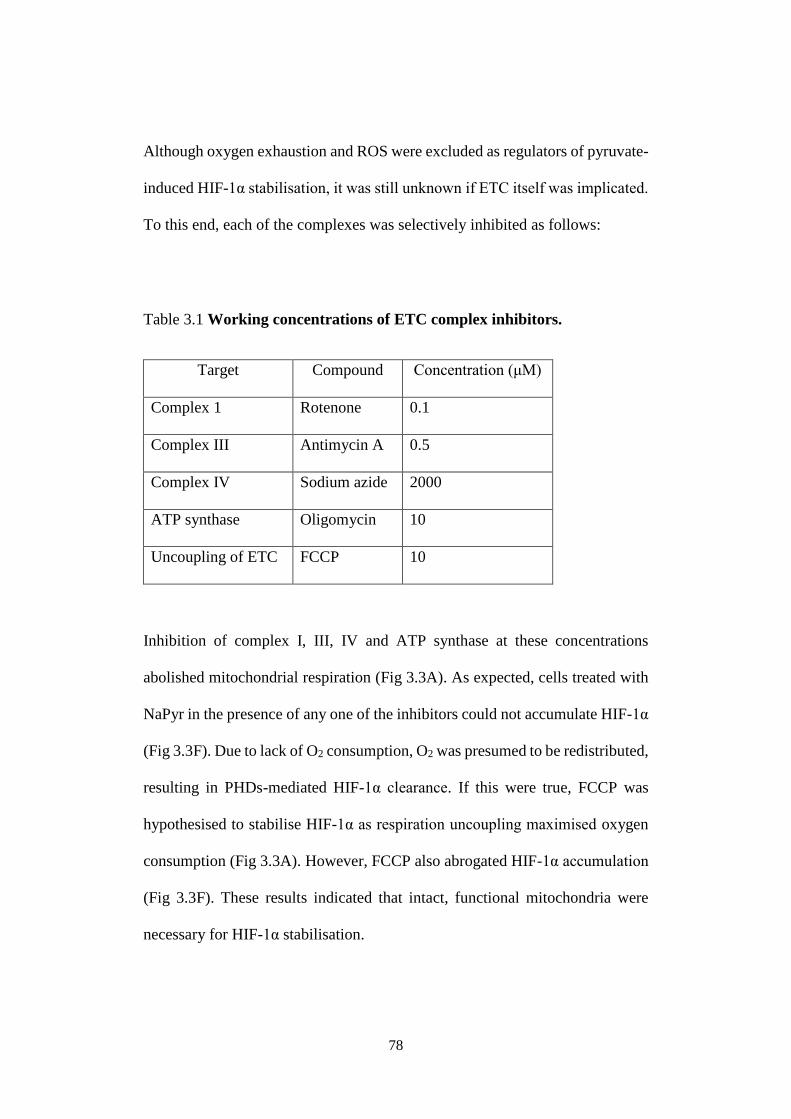
78
Although oxygen exhaustion and ROS were excluded as regulators of pyruvate-
induced HIF-1α stabilisation, it was still unknown if ETC itself was implicated.
To this end, each of the complexes was selectively inhibited as follows:
Table 3.1 Working concentrations of ETC complex inhibitors.
Target Compound Concentration (μM)
Complex 1 Rotenone 0.1
Complex III Antimycin A 0.5
Complex IV Sodium azide 2000
ATP synthase Oligomycin 10
Uncoupling of ETC FCCP 10
Inhibition of complex I, III, IV and ATP synthase at these concentrations
abolished mitochondrial respiration (Fig 3.3A). As expected, cells treated with
NaPyr in the presence of any one of the inhibitors could not accumulate HIF-1α
(Fig 3.3F). Due to lack of O2 consumption, O2 was presumed to be redistributed,
resulting in PHDs-mediated HIF-1α clearance. If this were true, FCCP was
hypothesised to stabilise HIF-1α as respiration uncoupling maximised oxygen
consumption (Fig 3.3A). However, FCCP also abrogated HIF-1α accumulation
(Fig 3.3F). These results indicated that intact, functional mitochondria were
necessary for HIF-1α stabilisation.
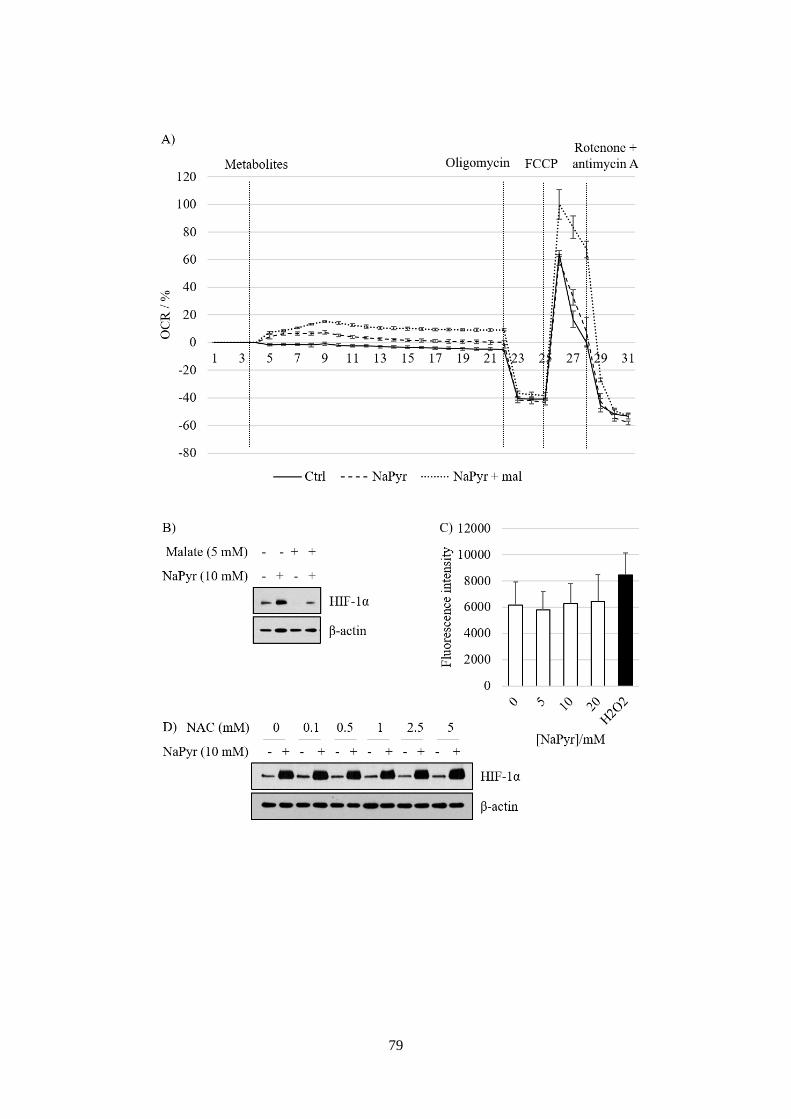
79
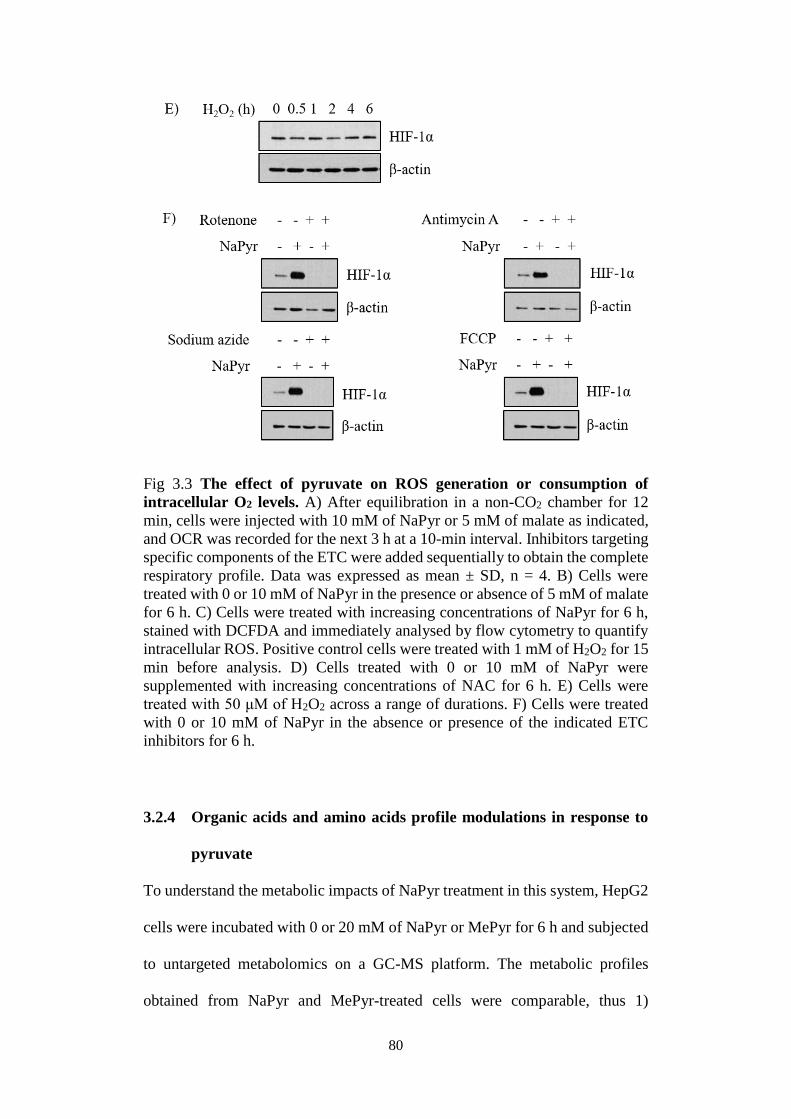
80
Fig 3.3 The effect of pyruvate on ROS generation or consumption of
intracellular O2 levels. A) After equilibration in a non-CO2 chamber for 12
min, cells were injected with 10 mM of NaPyr or 5 mM of malate as indicated,
and OCR was recorded for the next 3 h at a 10-min interval. Inhibitors targeting
specific components of the ETC were added sequentially to obtain the complete
respiratory profile. Data was expressed as mean ± SD, n = 4. B) Cells were
treated with 0 or 10 mM of NaPyr in the presence or absence of 5 mM of malate
for 6 h. C) Cells were treated with increasing concentrations of NaPyr for 6 h,
stained with DCFDA and immediately analysed by flow cytometry to quantify
intracellular ROS. Positive control cells were treated with 1 mM of H2O2 for 15
min before analysis. D) Cells treated with 0 or 10 mM of NaPyr were
supplemented with increasing concentrations of NAC for 6 h. E) Cells were
treated with 50 μM of H2O2 across a range of durations. F) Cells were treated
with 0 or 10 mM of NaPyr in the absence or presence of the indicated ETC
inhibitors for 6 h.
3.2.4 Organic acids and amino acids profile modulations in response to
pyruvate
To understand the metabolic impacts of NaPyr treatment in this system, HepG2
cells were incubated with 0 or 20 mM of NaPyr or MePyr for 6 h and subjected
to untargeted metabolomics on a GC-MS platform. The metabolic profiles
obtained from NaPyr and MePyr-treated cells were comparable, thus 1)
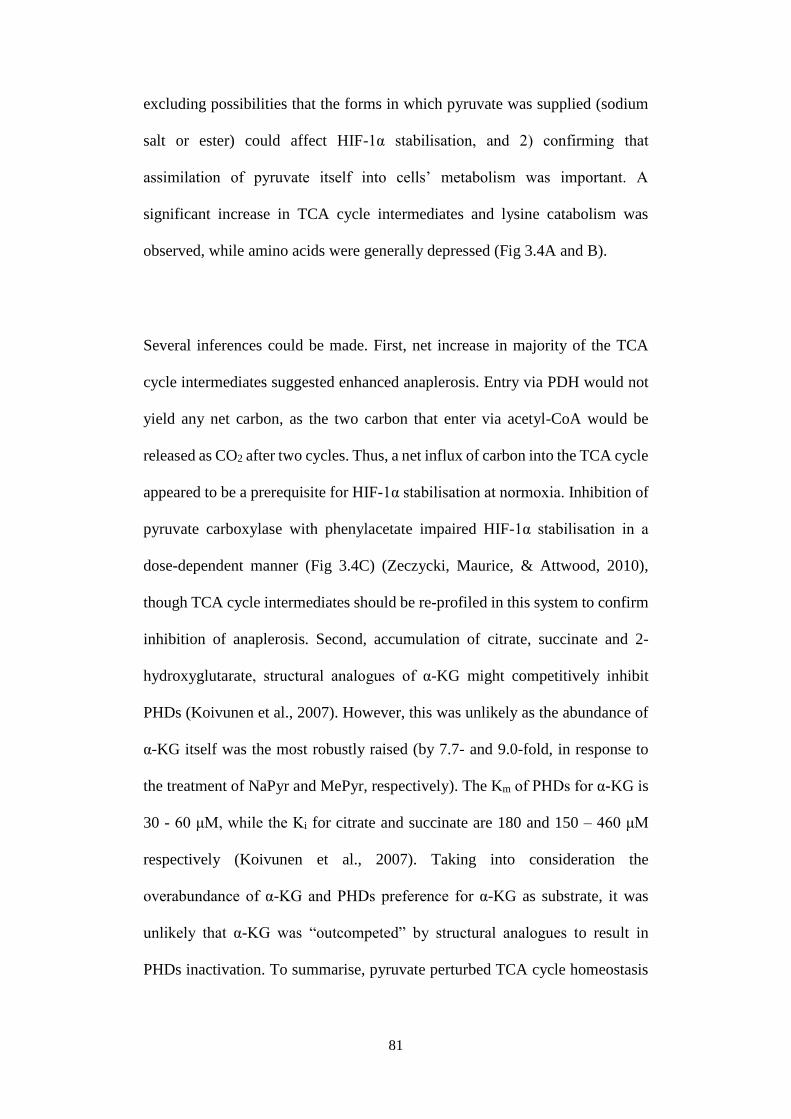
81
excluding possibilities that the forms in which pyruvate was supplied (sodium
salt or ester) could affect HIF-1α stabilisation, and 2) confirming that
assimilation of pyruvate itself into cells’ metabolism was important. A
significant increase in TCA cycle intermediates and lysine catabolism was
observed, while amino acids were generally depressed (Fig 3.4A and B).
Several inferences could be made. First, net increase in majority of the TCA
cycle intermediates suggested enhanced anaplerosis. Entry via PDH would not
yield any net carbon, as the two carbon that enter via acetyl-CoA would be
released as CO2 after two cycles. Thus, a net influx of carbon into the TCA cycle
appeared to be a prerequisite for HIF-1α stabilisation at normoxia. Inhibition of
pyruvate carboxylase with phenylacetate impaired HIF-1α stabilisation in a
dose-dependent manner (Fig 3.4C) (Zeczycki, Maurice, & Attwood, 2010),
though TCA cycle intermediates should be re-profiled in this system to confirm
inhibition of anaplerosis. Second, accumulation of citrate, succinate and 2-
hydroxyglutarate, structural analogues of α-KG might competitively inhibit
PHDs (Koivunen et al., 2007). However, this was unlikely as the abundance of
α-KG itself was the most robustly raised (by 7.7- and 9.0-fold, in response to
the treatment of NaPyr and MePyr, respectively). The Km of PHDs for α-KG is
30 - 60 μM, while the Ki for citrate and succinate are 180 and 150 – 460 μM
respectively (Koivunen et al., 2007). Taking into consideration the
overabundance of α-KG and PHDs preference for α-KG as substrate, it was
unlikely that α-KG was “outcompeted” by structural analogues to result in
PHDs inactivation. To summarise, pyruvate perturbed TCA cycle homeostasis
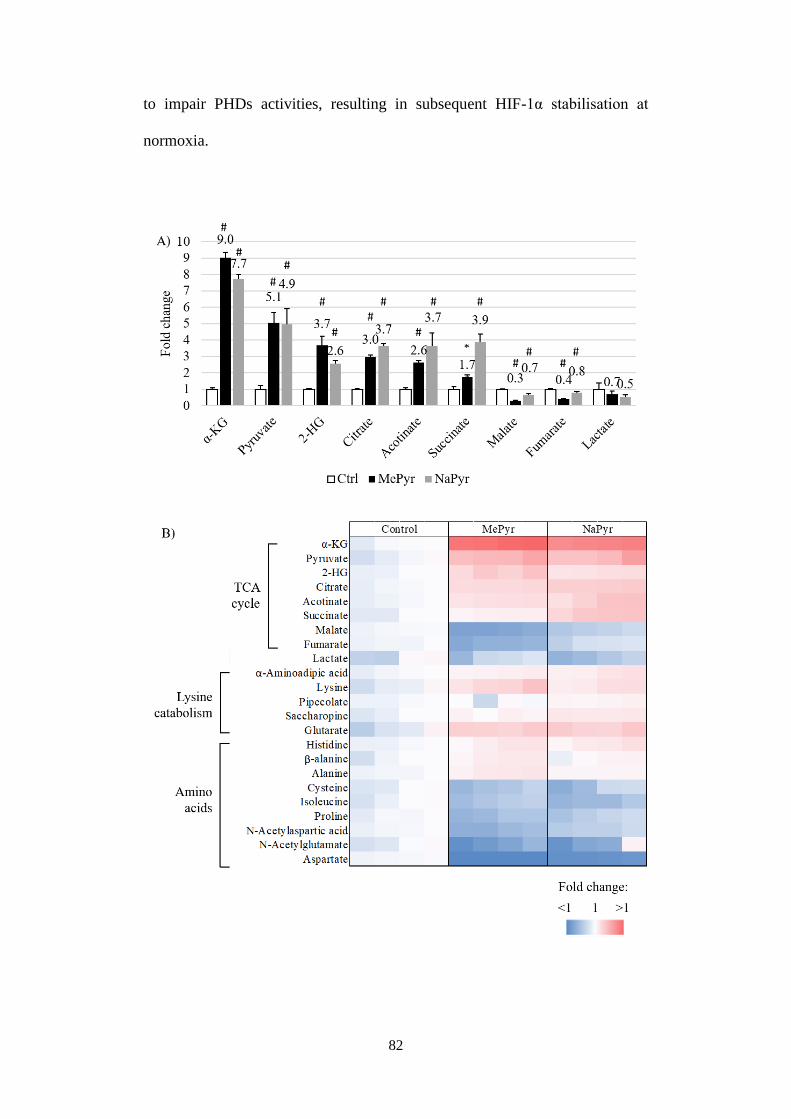
82
to impair PHDs activities, resulting in subsequent HIF-1α stabilisation at
normoxia.
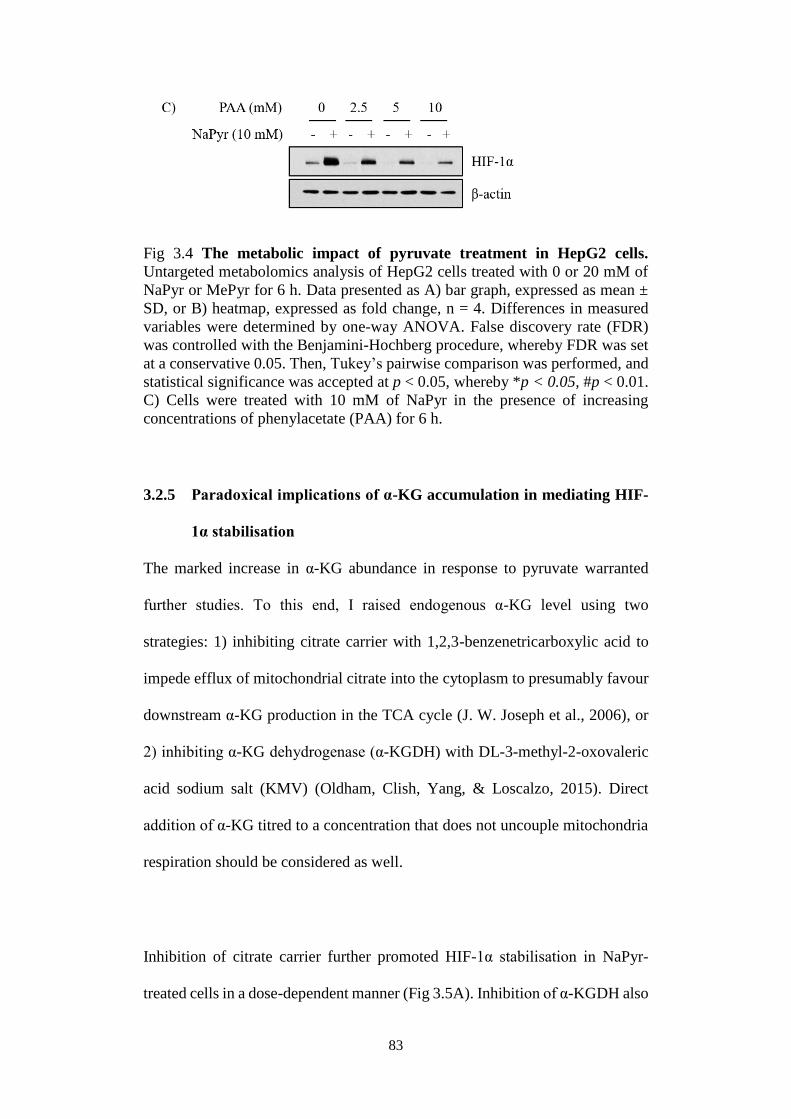
83
Fig 3.4 The metabolic impact of pyruvate treatment in HepG2 cells.
Untargeted metabolomics analysis of HepG2 cells treated with 0 or 20 mM of
NaPyr or MePyr for 6 h. Data presented as A) bar graph, expressed as mean ±
SD, or B) heatmap, expressed as fold change, n = 4. Differences in measured
variables were determined by one-way ANOVA. False discovery rate (FDR)
was controlled with the Benjamini-Hochberg procedure, whereby FDR was set
at a conservative 0.05. Then, Tukey’s pairwise comparison was performed, and
statistical significance was accepted at p < 0.05, whereby *p < 0.05, #p < 0.01.
C) Cells were treated with 10 mM of NaPyr in the presence of increasing
concentrations of phenylacetate (PAA) for 6 h.
3.2.5 Paradoxical implications of α-KG accumulation in mediating HIF-
1α stabilisation
The marked increase in α-KG abundance in response to pyruvate warranted
further studies. To this end, I raised endogenous α-KG level using two
strategies: 1) inhibiting citrate carrier with 1,2,3-benzenetricarboxylic acid to
impede efflux of mitochondrial citrate into the cytoplasm to presumably favour
downstream α-KG production in the TCA cycle (J. W. Joseph et al., 2006), or
2) inhibiting α-KG dehydrogenase (α-KGDH) with DL-3-methyl-2-oxovaleric
acid sodium salt (KMV) (Oldham, Clish, Yang, & Loscalzo, 2015). Direct
addition of α-KG titred to a concentration that does not uncouple mitochondria
respiration should be considered as well.
Inhibition of citrate carrier further promoted HIF-1α stabilisation in NaPyr-
treated cells in a dose-dependent manner (Fig 3.5A). Inhibition of α-KGDH also
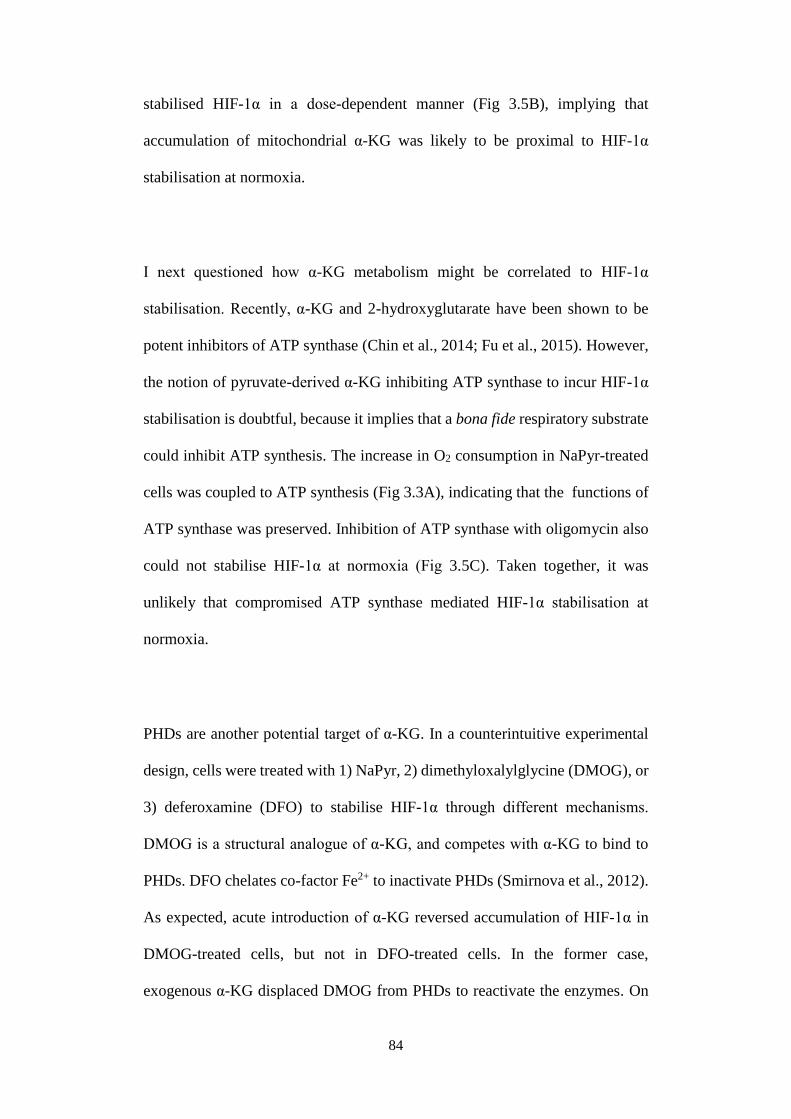
84
stabilised HIF-1α in a dose-dependent manner (Fig 3.5B), implying that
accumulation of mitochondrial α-KG was likely to be proximal to HIF-1α
stabilisation at normoxia.
I next questioned how α-KG metabolism might be correlated to HIF-1α
stabilisation. Recently, α-KG and 2-hydroxyglutarate have been shown to be
potent inhibitors of ATP synthase (Chin et al., 2014; Fu et al., 2015). However,
the notion of pyruvate-derived α-KG inhibiting ATP synthase to incur HIF-1α
stabilisation is doubtful, because it implies that a bona fide respiratory substrate
could inhibit ATP synthesis. The increase in O2 consumption in NaPyr-treated
cells was coupled to ATP synthesis (Fig 3.3A), indicating that the functions of
ATP synthase was preserved. Inhibition of ATP synthase with oligomycin also
could not stabilise HIF-1α at normoxia (Fig 3.5C). Taken together, it was
unlikely that compromised ATP synthase mediated HIF-1α stabilisation at
normoxia.
PHDs are another potential target of α-KG. In a counterintuitive experimental
design, cells were treated with 1) NaPyr, 2) dimethyloxalylglycine (DMOG), or
3) deferoxamine (DFO) to stabilise HIF-1α through different mechanisms.
DMOG is a structural analogue of α-KG, and competes with α-KG to bind to
PHDs. DFO chelates co-factor Fe2+ to inactivate PHDs (Smirnova et al., 2012).
As expected, acute introduction of α-KG reversed accumulation of HIF-1α in
DMOG-treated cells, but not in DFO-treated cells. In the former case,
exogenous α-KG displaced DMOG from PHDs to reactivate the enzymes. On
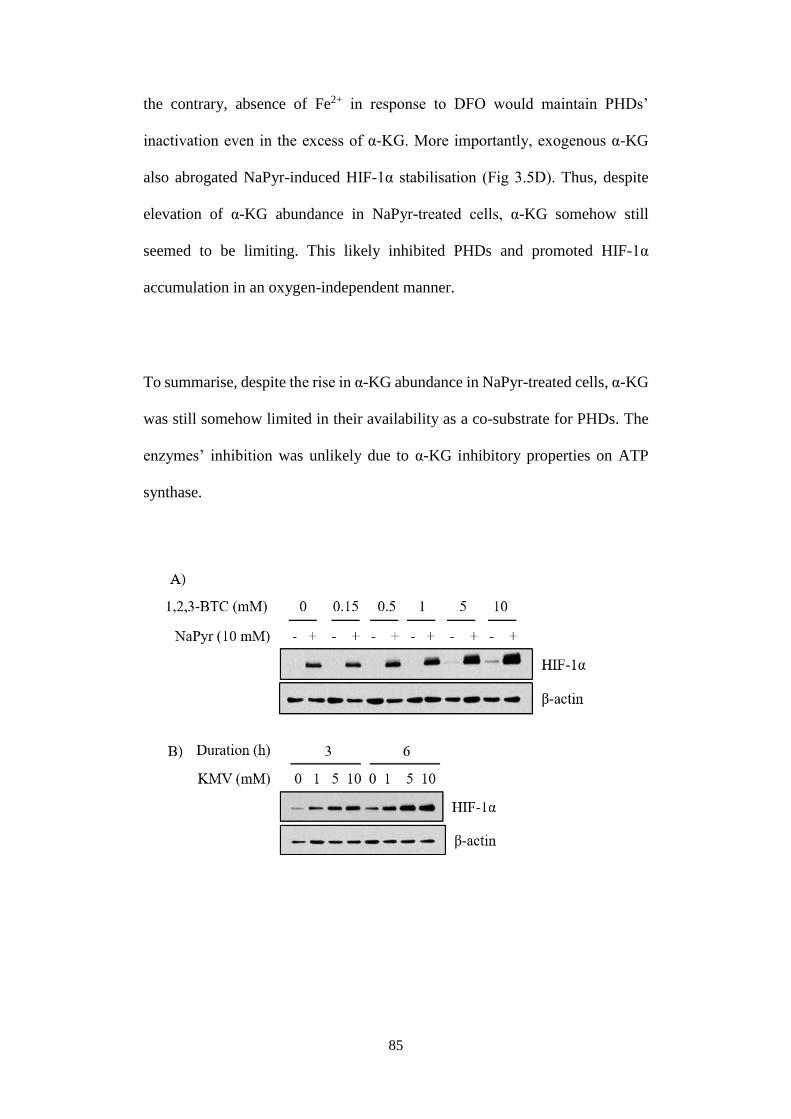
85
the contrary, absence of Fe2+ in response to DFO would maintain PHDs’
inactivation even in the excess of α-KG. More importantly, exogenous α-KG
also abrogated NaPyr-induced HIF-1α stabilisation (Fig 3.5D). Thus, despite
elevation of α-KG abundance in NaPyr-treated cells, α-KG somehow still
seemed to be limiting. This likely inhibited PHDs and promoted HIF-1α
accumulation in an oxygen-independent manner.
To summarise, despite the rise in α-KG abundance in NaPyr-treated cells, α-KG
was still somehow limited in their availability as a co-substrate for PHDs. The
enzymes’ inhibition was unlikely due to α-KG inhibitory properties on ATP
synthase.
86
Fig 3.5 Implications of α-KG on HIF-1a stabilisation at normoxia. A) Cells
were treated with 0 or 10 mM of NaPyr and increasing concentrations of 1,2,3-
benzenetricarboxylic acid (1,2,3-BTC) for 6 h. B) Cells were treated with
ascending concentrations of KMV for 3 or 6 h. C) Cells were treated with 0 or
10 mM of NaPyr for 6 h, in the presence or absence of 1 μM of oligomycin for
the indicated durations. D) Cells were treated with 0 or 10 mM of NaPyr for 6
h, or 1 mM of DMOG or DFO in the final 2 h to stabilise HIF-1α. In the final 1
h, 5 mM of α-KG was introduced.
3.2.6 The significance of malate in regulating cycling of mitochondrial
metabolites
In a previous experiment, malate supplementation abrogated HIF-1α
stabilisation in NaPyr-treated cells (Fig 3.3B). Malate also abrogated HIF-1α
stabilisation in KMV-treated cells (Fig 3.6A). However, the relief of HIF-1α
stabilisation was not accompanied by a restoration of TCA cycle profile (Fig
3.6B). This indicated that modulations to net abundance of TCA cycle
intermediates, specifically that of α-KG did not completely explain HIF-1α
stabilisation at normoxia.
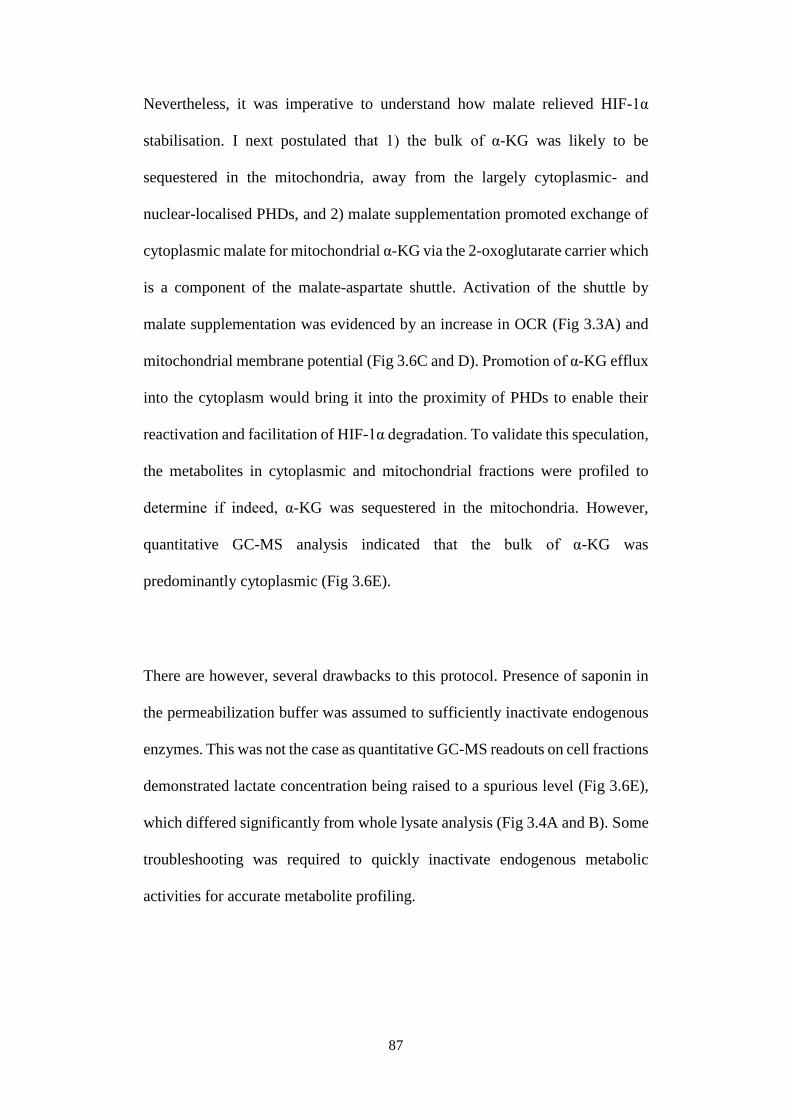
87
Nevertheless, it was imperative to understand how malate relieved HIF-1α
stabilisation. I next postulated that 1) the bulk of α-KG was likely to be
sequestered in the mitochondria, away from the largely cytoplasmic- and
nuclear-localised PHDs, and 2) malate supplementation promoted exchange of
cytoplasmic malate for mitochondrial α-KG via the 2-oxoglutarate carrier which
is a component of the malate-aspartate shuttle. Activation of the shuttle by
malate supplementation was evidenced by an increase in OCR (Fig 3.3A) and
mitochondrial membrane potential (Fig 3.6C and D). Promotion of α-KG efflux
into the cytoplasm would bring it into the proximity of PHDs to enable their
reactivation and facilitation of HIF-1α degradation. To validate this speculation,
the metabolites in cytoplasmic and mitochondrial fractions were profiled to
determine if indeed, α-KG was sequestered in the mitochondria. However,
quantitative GC-MS analysis indicated that the bulk of α-KG was
predominantly cytoplasmic (Fig 3.6E).
There are however, several drawbacks to this protocol. Presence of saponin in
the permeabilization buffer was assumed to sufficiently inactivate endogenous
enzymes. This was not the case as quantitative GC-MS readouts on cell fractions
demonstrated lactate concentration being raised to a spurious level (Fig 3.6E),
which differed significantly from whole lysate analysis (Fig 3.4A and B). Some
troubleshooting was required to quickly inactivate endogenous metabolic
activities for accurate metabolite profiling.
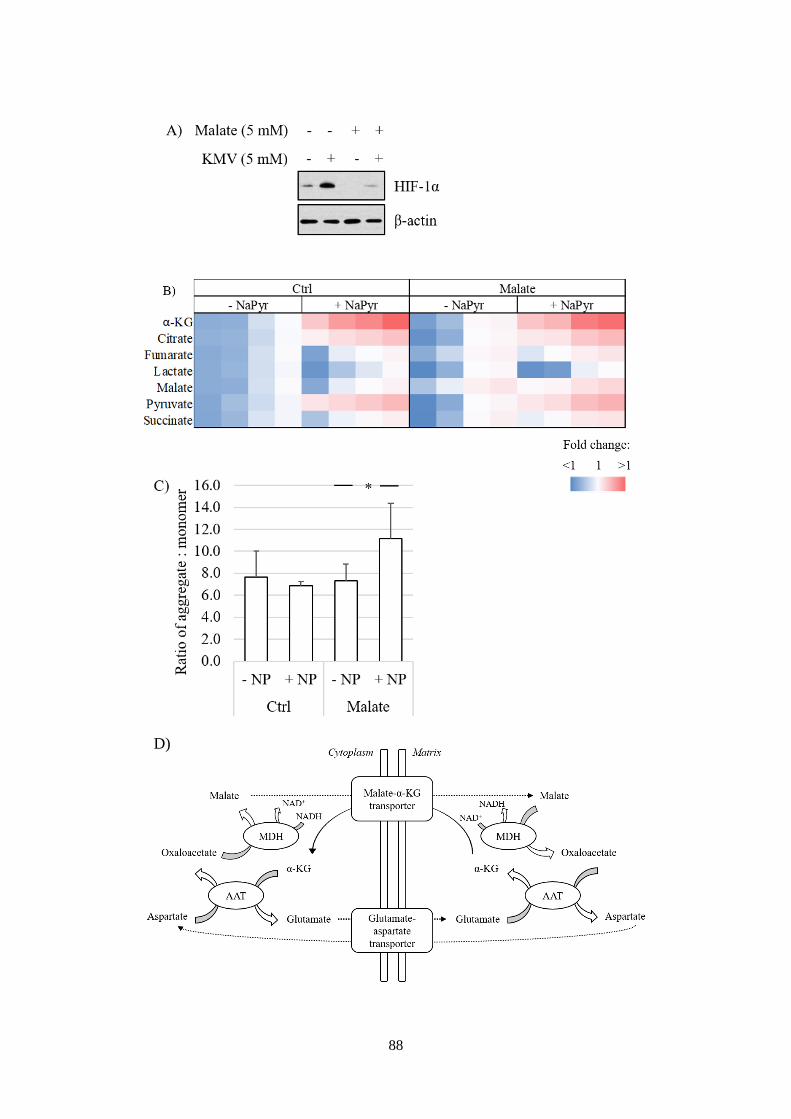
88
D)
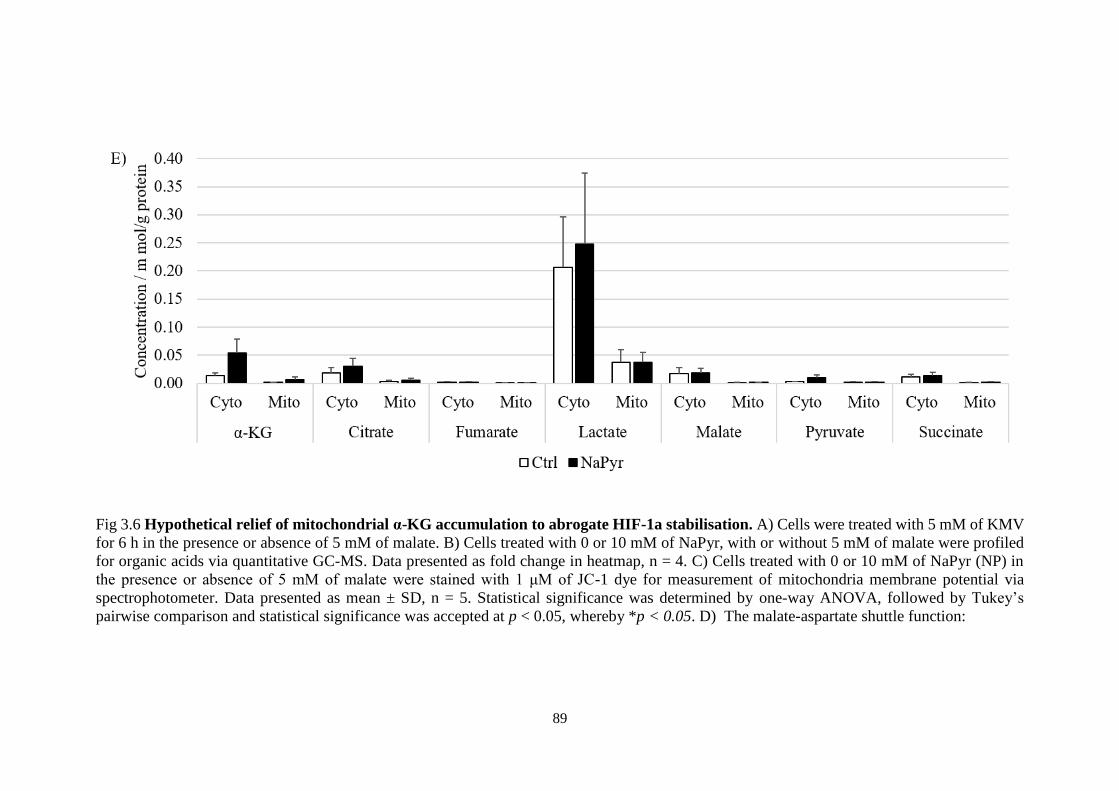
89
Fig 3.6 Hypothetical relief of mitochondrial α-KG accumulation to abrogate HIF-1a stabilisation. A) Cells were treated with 5 mM of KMV
for 6 h in the presence or absence of 5 mM of malate. B) Cells treated with 0 or 10 mM of NaPyr, with or without 5 mM of malate were profiled
for organic acids via quantitative GC-MS. Data presented as fold change in heatmap, n = 4. C) Cells treated with 0 or 10 mM of NaPyr (NP) in
the presence or absence of 5 mM of malate were stained with 1 μM of JC-1 dye for measurement of mitochondria membrane potential via
spectrophotometer. Data presented as mean ± SD, n = 5. Statistical significance was determined by one-way ANOVA, followed by Tukey’s
pairwise comparison and statistical significance was accepted at p < 0.05, whereby *p < 0.05. D) The malate-aspartate shuttle function:
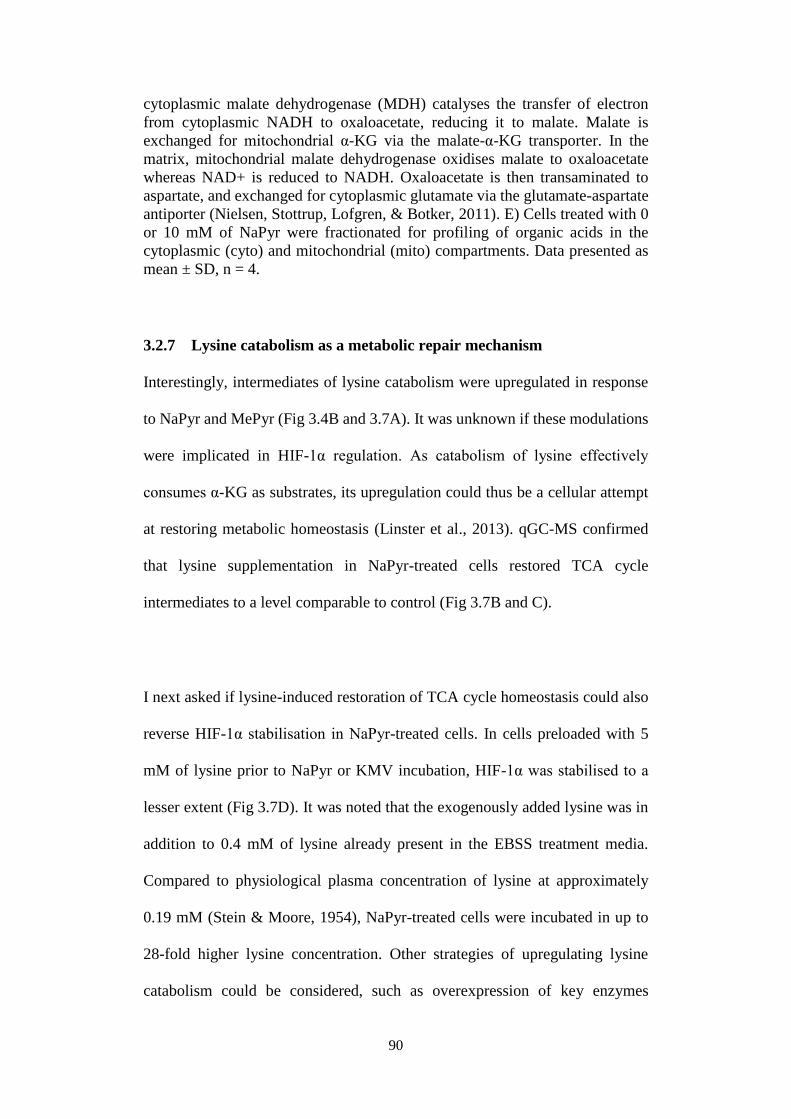
90
cytoplasmic malate dehydrogenase (MDH) catalyses the transfer of electron
from cytoplasmic NADH to oxaloacetate, reducing it to malate. Malate is
exchanged for mitochondrial α-KG via the malate-α-KG transporter. In the
matrix, mitochondrial malate dehydrogenase oxidises malate to oxaloacetate
whereas NAD+ is reduced to NADH. Oxaloacetate is then transaminated to
aspartate, and exchanged for cytoplasmic glutamate via the glutamate-aspartate
antiporter (Nielsen, Stottrup, Lofgren, & Botker, 2011). E) Cells treated with 0
or 10 mM of NaPyr were fractionated for profiling of organic acids in the
cytoplasmic (cyto) and mitochondrial (mito) compartments. Data presented as
mean ± SD, n = 4.
3.2.7 Lysine catabolism as a metabolic repair mechanism
Interestingly, intermediates of lysine catabolism were upregulated in response
to NaPyr and MePyr (Fig 3.4B and 3.7A). It was unknown if these modulations
were implicated in HIF-1α regulation. As catabolism of lysine effectively
consumes α-KG as substrates, its upregulation could thus be a cellular attempt
at restoring metabolic homeostasis (Linster et al., 2013). qGC-MS confirmed
that lysine supplementation in NaPyr-treated cells restored TCA cycle
intermediates to a level comparable to control (Fig 3.7B and C).
I next asked if lysine-induced restoration of TCA cycle homeostasis could also
reverse HIF-1α stabilisation in NaPyr-treated cells. In cells preloaded with 5
mM of lysine prior to NaPyr or KMV incubation, HIF-1α was stabilised to a
lesser extent (Fig 3.7D). It was noted that the exogenously added lysine was in
addition to 0.4 mM of lysine already present in the EBSS treatment media.
Compared to physiological plasma concentration of lysine at approximately
0.19 mM (Stein & Moore, 1954), NaPyr-treated cells were incubated in up to
28-fold higher lysine concentration. Other strategies of upregulating lysine
catabolism could be considered, such as overexpression of key enzymes
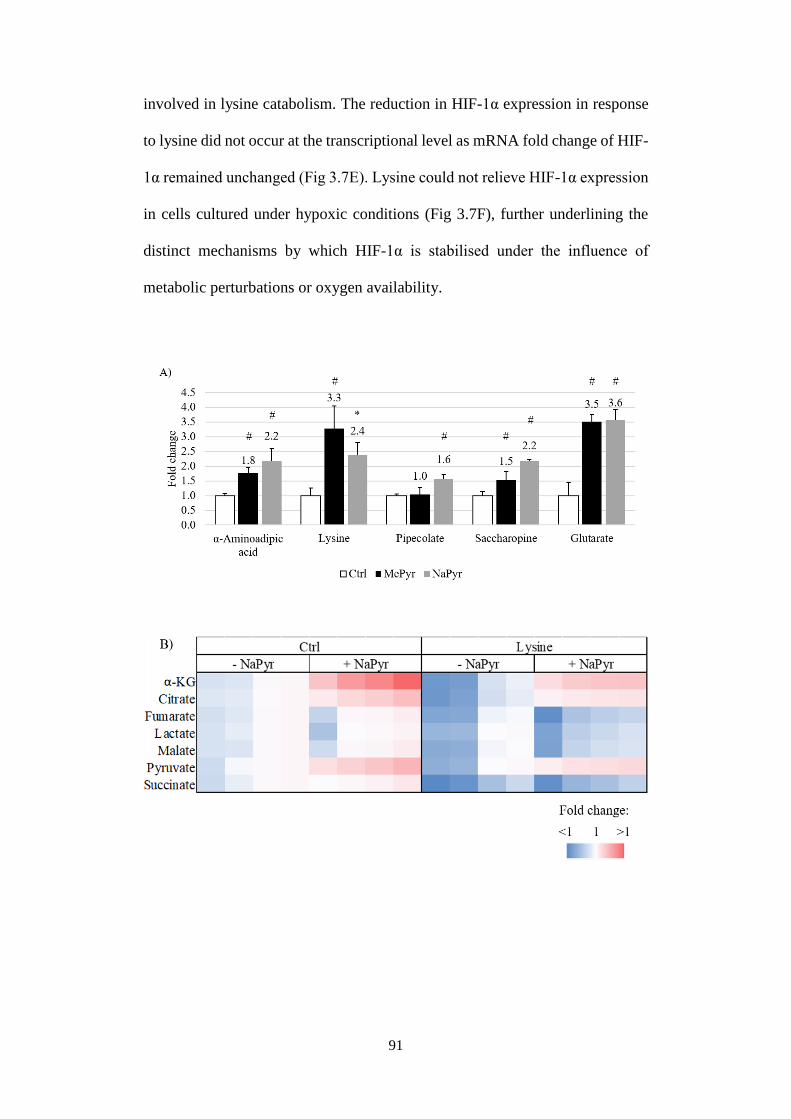
91
involved in lysine catabolism. The reduction in HIF-1α expression in response
to lysine did not occur at the transcriptional level as mRNA fold change of HIF-
1α remained unchanged (Fig 3.7E). Lysine could not relieve HIF-1α expression
in cells cultured under hypoxic conditions (Fig 3.7F), further underlining the
distinct mechanisms by which HIF-1α is stabilised under the influence of
metabolic perturbations or oxygen availability.
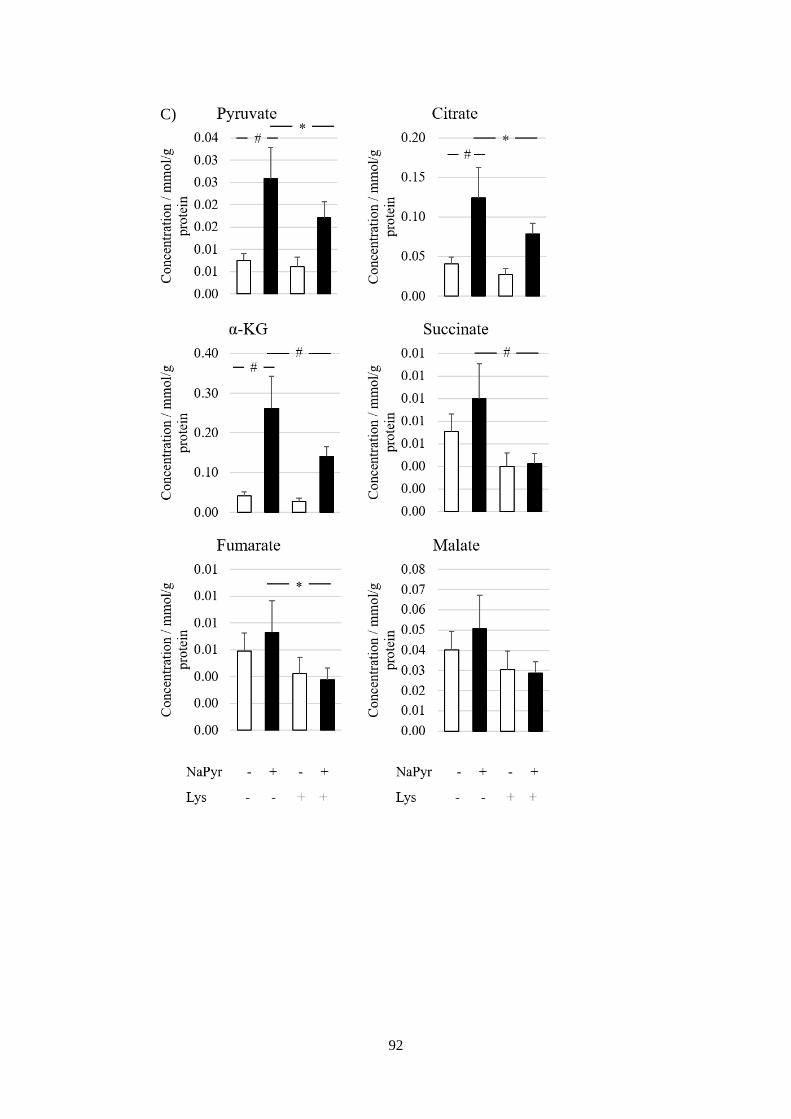
92
C)
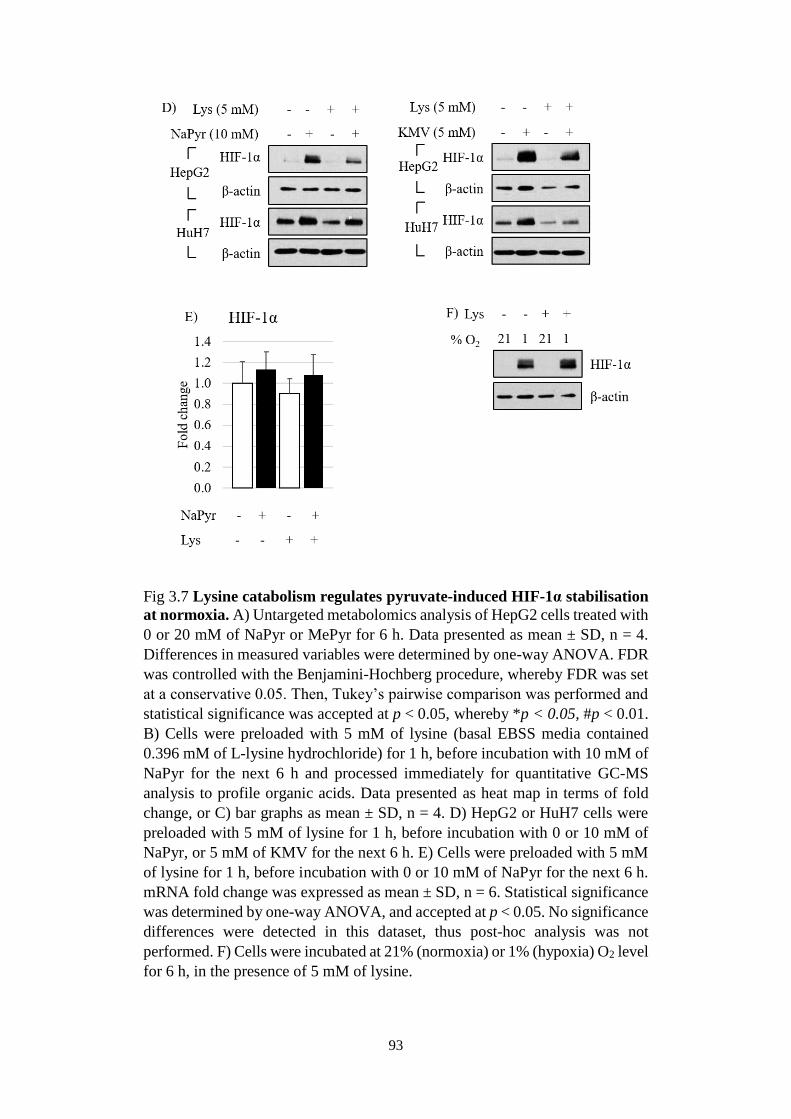
93
Fig 3.7 Lysine catabolism regulates pyruvate-induced HIF-1α stabilisation
at normoxia. A) Untargeted metabolomics analysis of HepG2 cells treated with
0 or 20 mM of NaPyr or MePyr for 6 h. Data presented as mean ± SD, n = 4.
Differences in measured variables were determined by one-way ANOVA. FDR
was controlled with the Benjamini-Hochberg procedure, whereby FDR was set
at a conservative 0.05. Then, Tukey’s pairwise comparison was performed and
statistical significance was accepted at p < 0.05, whereby *p < 0.05, #p < 0.01.
B) Cells were preloaded with 5 mM of lysine (basal EBSS media contained
0.396 mM of L-lysine hydrochloride) for 1 h, before incubation with 10 mM of
NaPyr for the next 6 h and processed immediately for quantitative GC-MS
analysis to profile organic acids. Data presented as heat map in terms of fold
change, or C) bar graphs as mean ± SD, n = 4. D) HepG2 or HuH7 cells were
preloaded with 5 mM of lysine for 1 h, before incubation with 0 or 10 mM of
NaPyr, or 5 mM of KMV for the next 6 h. E) Cells were preloaded with 5 mM
of lysine for 1 h, before incubation with 0 or 10 mM of NaPyr for the next 6 h.
mRNA fold change was expressed as mean ± SD, n = 6. Statistical significance
was determined by one-way ANOVA, and accepted at p < 0.05. No significance
differences were detected in this dataset, thus post-hoc analysis was not
performed. F) Cells were incubated at 21% (normoxia) or 1% (hypoxia) O2 level
for 6 h, in the presence of 5 mM of lysine.
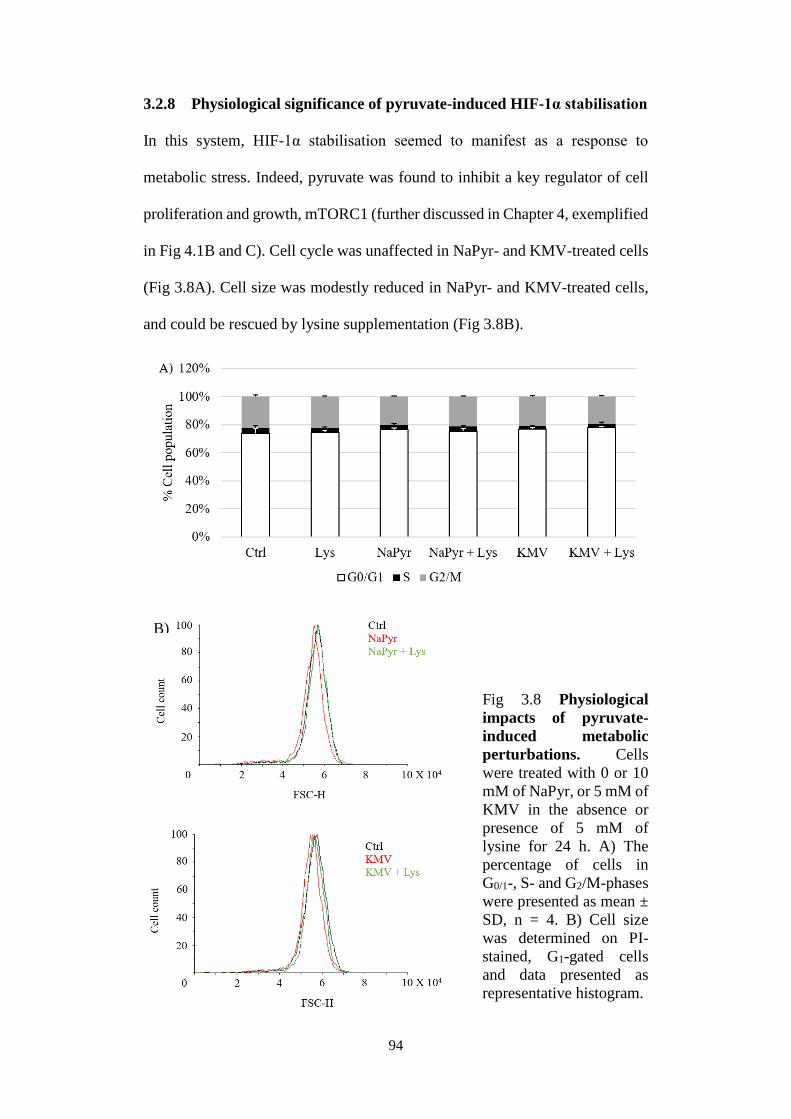
94
3.2.8 Physiological significance of pyruvate-induced HIF-1α stabilisation
In this system, HIF-1α stabilisation seemed to manifest as a response to
metabolic stress. Indeed, pyruvate was found to inhibit a key regulator of cell
proliferation and growth, mTORC1 (further discussed in Chapter 4, exemplified
in Fig 4.1B and C). Cell cycle was unaffected in NaPyr- and KMV-treated cells
(Fig 3.8A). Cell size was modestly reduced in NaPyr- and KMV-treated cells,
and could be rescued by lysine supplementation (Fig 3.8B).
Fig 3.8 Physiological
impacts of pyruvate-
induced metabolic
perturbations. Cells
were treated with 0 or 10
mM of NaPyr, or 5 mM of
KMV in the absence or
presence of 5 mM of
lysine for 24 h. A) The
percentage of cells in
G0/1-, S- and G2/M-phases
were presented as mean ±
SD, n = 4. B) Cell size
was determined on PI-
stained, G1-gated cells
and data presented as
representative histogram.
B)
95
3.3 Discussion
In this study, the effect of pyruvate on HIF-1α stabilisation at normoxia was
established by treating human liver cancer cell lines with as high as 10 mM of
pyruvate, a concentration range that is not physiologically relevant and might
allude to off-target stress responses. However, quantification of intracellular
pyruvate showed that the fold change was comparable to that in previously
reported head and neck cancer cells (S. Hu et al., 2015) or when mitochondrial
pyruvate carrier was inhibited (Bricker et al., 2012; Du et al., 2013).
The conduct of all experiments at normoxia, defined as 21% partial pressure of
O2 (pO2) raises doubt on the credibility of data presented. Tissue pO2 typically
ranges between 3 to 10%, defined as physioxia. Oxygenation in tumours is
poorer (between 0.3 to 4.2%) (McKeown, 2014). Thus, the culture conditions at
normoxia is in fact hyperoxic, and does not represent in vivo cellular milieu.
Because this thesis focuses on the metabolic regulation of HIF-1α independent
of O2 contribution, all treatment samples and their respective controls were
subjected to the same 21% pO2 during experiment. Nevertheless, controlling for
hyperoxia-induced errors in this manner is inferior to replicating key
experiments at physioxia. Maintaining cells in a hypoxia chamber can be
considered, in which 95% of gaseous nitrogen and 5% carbon dioxide mixture
is introduced to obtain the desired pO2 at physioxia or normoxia (Carreau, El
Hafny-Rahbi, Matejuk, Grillon, & Kieda, 2011).
96
Because pyruvate is the metabolite that links glycolysis to OxPhos, it is
strategically positioned to modulate cell cycle in response to energy and nutrient
availability. Specifically, the channelling of pyruvate to OxPhos is thought to
induce oncogene-induced senescence and reduce oncogenicity, whereas
shunting of pyruvate away from mitochondria, into fermentative glycolysis
(Warburg effect) promotes proliferation (Kaplon et al., 2013; Olenchock &
Vander Heiden, 2013). Inhibition of monocarboxylase transporters to
accumulate intracellular pyruvate has been shown to drive OxPhos and impair
growth (Hong et al., 2016). SLC5A8, a surface transporter of pyruvate is
downregulated across a range of cancer types, suggesting that cancers evolve to
suppress uptake of pyruvate (Ganapathy et al., 2008). However, pyruvate
assimilation into mitochondria metabolism may be prooncogenic as well. In
breast cancer cell lines, growth rate and OxPhos increases at higher
concentrations of NaPyr (up to 10 mM) in culture media (Diers, Broniowska,
Chang, & Hogg, 2012). Anaplerosis via pyruvate carboxylase is often enhanced
due to the enzyme’s overexpression in cancers, which is crucial for cell survival
and proliferation (Christen et al., 2016; Phannasil et al., 2015; Sellers et al.,
2015). Clearly, whether pyruvate is preferentially channelled into or away from
the mitochondria, and whether that in turn incurs growth promotion or arrest
depends on cell context. The cell models used in this thesis showed that pyruvate
increased OxPhos (Fig 3.3A) and anaplerosis (Fig 3.4A and B), without overt
changes to cell cycle and a modest decline in cell size (Fig 3.8A and B). In these
experiments, stabilisation of the glycolytic master regulator HIF-1α was tracked
across a 6 h window, likely representing an early and/or adaptive stress response
to pyruvate-induced oxidative metabolism. Chronic exposure to pyruvate could
97
be attempted to determine if, allowance of proper expression of HIF-1α target
genes could reprogram metabolism to favour cell proliferation and growth.
The function of oncometabolites in cancers is also beginning to be appreciated.
In vitro experiments observed that TCA cycle intermediates such as citrate,
succinate, and fumarate could competitively inhibit tumour suppressor PHDs
(S. Y. Kim et al., 2010; Koivunen et al., 2007), which clinical importance is
further exemplified in gliomas harbouring mutations to isocitrate
dehydrogenases. Not only are the mutant IDHs incapable of converting
isocitrate to α-KG, they also convert existing α-KG to 2-hydroxyglutarate, a
structural analogue of α-KG and thus, competitive inhibitor of PHDs (L. Dang
et al., 2009; Ma et al., 2015; Xu et al., 2011; Zhao et al., 2009). Mutant succinate
dehydrogenase in paraganglioma or phaeochromocytoma, or fumarate
hydratase in leiomyoma, leiomyosarcoma and renal cell carcinoma result in
accumulation of succinate and fumarate, respectively to inhibit PHDs and
stabilise HIF-1α (King, Selak, & Gottlieb, 2006; Koivunen et al., 2007; Rutter
et al., 2010). Naturally, high concentrations of endogenous α-KG would render
competitive inhibition of PHDs difficult (Thirstrup et al., 2011). In this study,
α-KG abundance was robustly increased by 7.7- to 9.0-fold in parallel to HIF-
1α accumulation (Fig 3.4A and B), which could be abolished by further addition
of α-KG (Fig 3.5D). This paradox implied that despite the overabundance of α-
KG, it was still a limiting factor.
98
A possible explanation to reconcile these findings is that PHDs were unable to
access the pool of α-KG. The idea of metabolite compartmentalisation is
possible because 1) the inner membrane of the mitochondria is largely
impermeable to metabolites, and 2) their cycling across mitochondrial
membrane is regulated in a transmembrane electrochemical gradient-sensitive
manner (Brand & Nicholls, 2011; Greenbaum & Wilson, 1985; Papa &
Paradies, 1974). This concept has also been proposed to regulate insulin
secretion in β-islet cells (Jensen et al., 2008; Odegaard et al., 2010). Of
relevance to this study is the malate-aspartate shuttle. The α-KG-malate
antiporter is a part of the shuttle, and exchanges mitochondrial α-KG for
cytoplasmic malate. Pyruvate- and KMV-induced HIF-1α stabilisation was
abrogated by malate supplementation (Fig 3.3B and 3.6A), and in parallel
promoted cycling of metabolites via the malate-aspartate shuttle without
significantly altering TCA cycle metabolic profile in total cell lysates (Fig 3.3A,
3.6C and D). This demonstrated the likelihood of α-KG relocation, and not total
abundance as a mechanism of regulating HIF-1α expression. There is yet
concrete evidence to confirm these questions: 1) is α-KG indeed
compartmentalised in the mitochondria, and if so, 2) how? An attempt was made
to profile α-KG in cytoplasmic and mitochondrial compartments. Despite
acceptable quality of cell fractionation and maintenance of organelle integrity,
there was difficulty in inactivating endogenous enzymes during sample
processing (compare Fig 3.4A with 3.6E).
Widespread metabolic consequences of pyruvate treatment were also likely to
evoke repair mechanisms to restore homeostasis. Aberrant build-up of
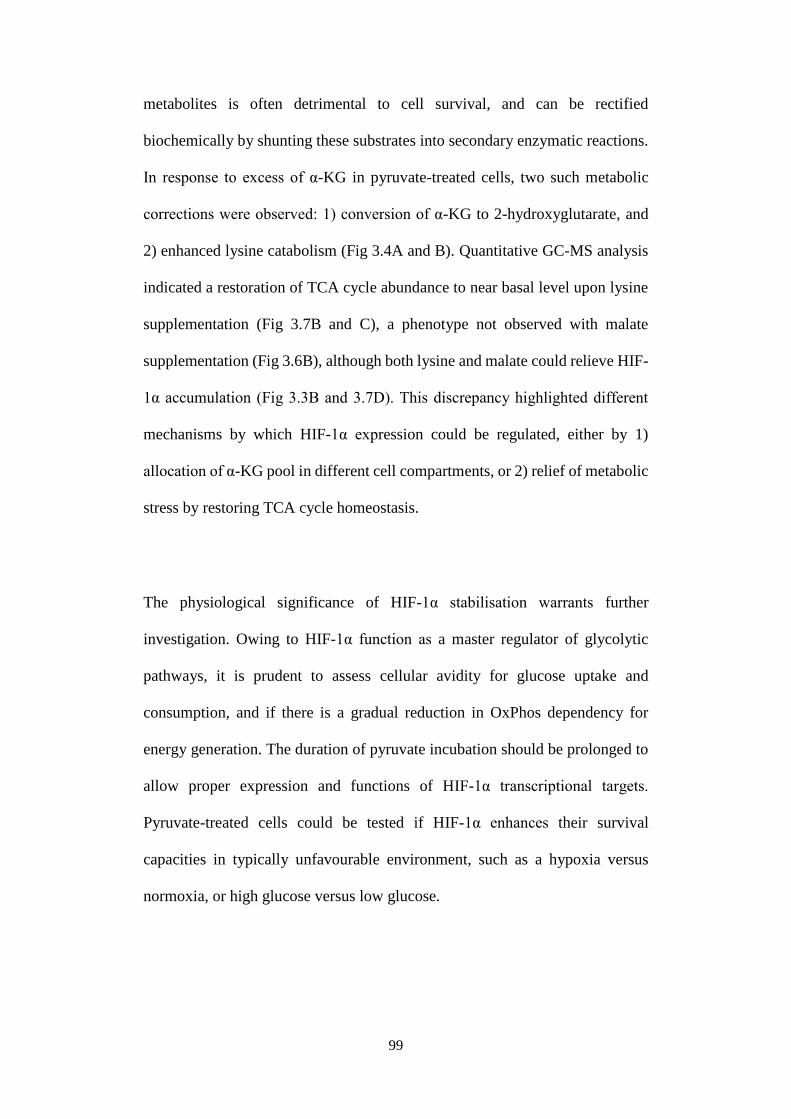
99
metabolites is often detrimental to cell survival, and can be rectified
biochemically by shunting these substrates into secondary enzymatic reactions.
In response to excess of α-KG in pyruvate-treated cells, two such metabolic
corrections were observed: 1) conversion of α-KG to 2-hydroxyglutarate, and
2) enhanced lysine catabolism (Fig 3.4A and B). Quantitative GC-MS analysis
indicated a restoration of TCA cycle abundance to near basal level upon lysine
supplementation (Fig 3.7B and C), a phenotype not observed with malate
supplementation (Fig 3.6B), although both lysine and malate could relieve HIF-
1α accumulation (Fig 3.3B and 3.7D). This discrepancy highlighted different
mechanisms by which HIF-1α expression could be regulated, either by 1)
allocation of α-KG pool in different cell compartments, or 2) relief of metabolic
stress by restoring TCA cycle homeostasis.
The physiological significance of HIF-1α stabilisation warrants further
investigation. Owing to HIF-1α function as a master regulator of glycolytic
pathways, it is prudent to assess cellular avidity for glucose uptake and
consumption, and if there is a gradual reduction in OxPhos dependency for
energy generation. The duration of pyruvate incubation should be prolonged to
allow proper expression and functions of HIF-1α transcriptional targets.
Pyruvate-treated cells could be tested if HIF-1α enhances their survival
capacities in typically unfavourable environment, such as a hypoxia versus
normoxia, or high glucose versus low glucose.
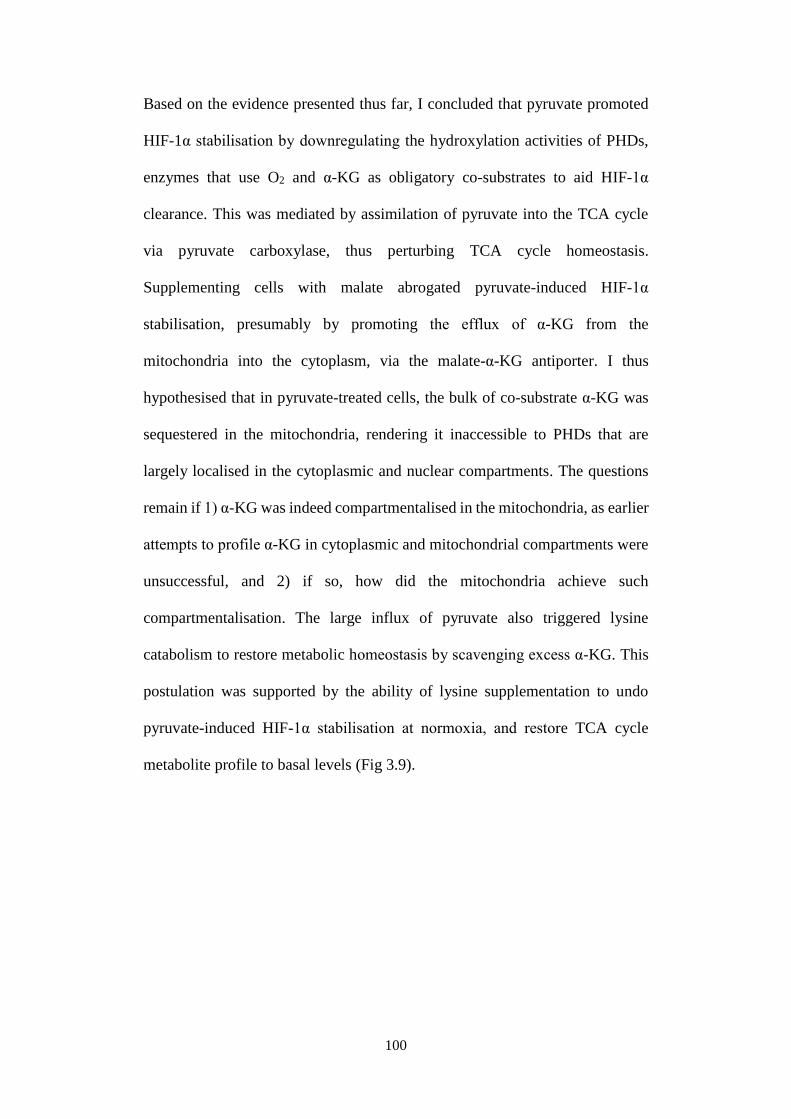
100
Based on the evidence presented thus far, I concluded that pyruvate promoted
HIF-1α stabilisation by downregulating the hydroxylation activities of PHDs,
enzymes that use O2 and α-KG as obligatory co-substrates to aid HIF-1α
clearance. This was mediated by assimilation of pyruvate into the TCA cycle
via pyruvate carboxylase, thus perturbing TCA cycle homeostasis.
Supplementing cells with malate abrogated pyruvate-induced HIF-1α
stabilisation, presumably by promoting the efflux of α-KG from the
mitochondria into the cytoplasm, via the malate-α-KG antiporter. I thus
hypothesised that in pyruvate-treated cells, the bulk of co-substrate α-KG was
sequestered in the mitochondria, rendering it inaccessible to PHDs that are
largely localised in the cytoplasmic and nuclear compartments. The questions
remain if 1) α-KG was indeed compartmentalised in the mitochondria, as earlier
attempts to profile α-KG in cytoplasmic and mitochondrial compartments were
unsuccessful, and 2) if so, how did the mitochondria achieve such
compartmentalisation. The large influx of pyruvate also triggered lysine
catabolism to restore metabolic homeostasis by scavenging excess α-KG. This
postulation was supported by the ability of lysine supplementation to undo
pyruvate-induced HIF-1α stabilisation at normoxia, and restore TCA cycle
metabolite profile to basal levels (Fig 3.9).
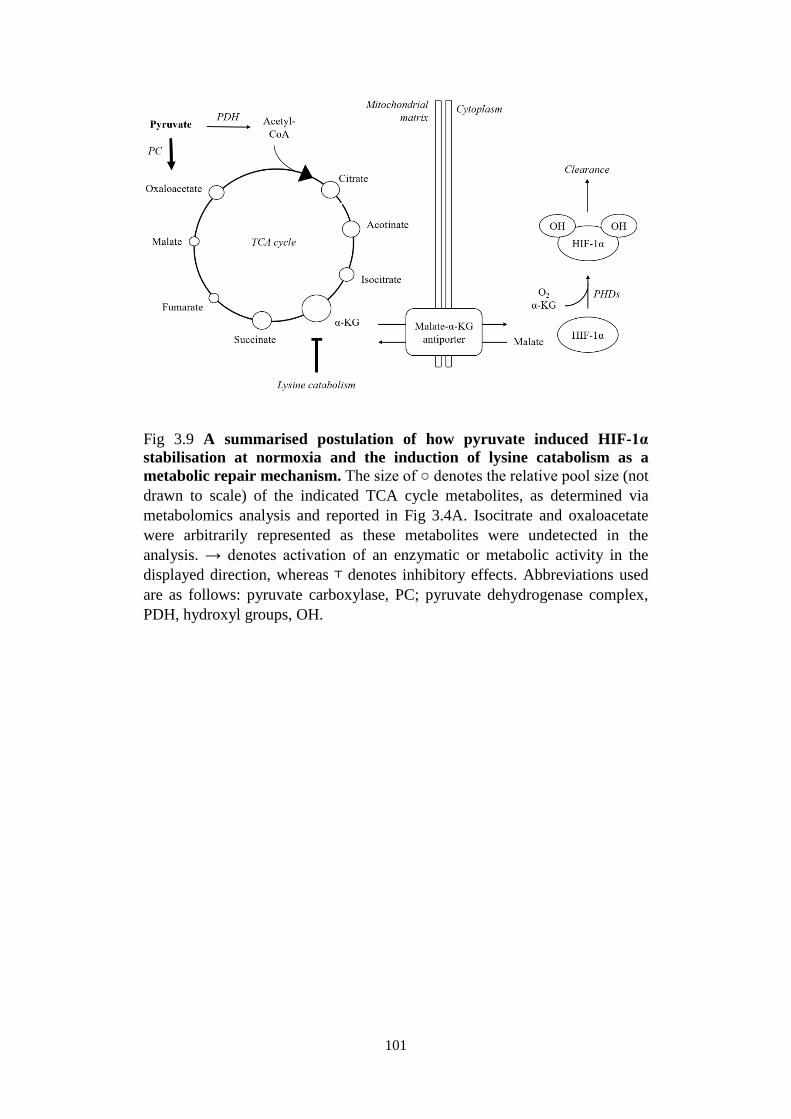
101
Fig 3.9 A summarised postulation of how pyruvate induced HIF-1α
stabilisation at normoxia and the induction of lysine catabolism as a
metabolic repair mechanism. The size of ○ denotes the relative pool size (not
drawn to scale) of the indicated TCA cycle metabolites, as determined via
metabolomics analysis and reported in Fig 3.4A. Isocitrate and oxaloacetate
were arbitrarily represented as these metabolites were undetected in the
analysis. → denotes activation of an enzymatic or metabolic activity in the
displayed direction, whereas ┬ denotes inhibitory effects. Abbreviations used
are as follows: pyruvate carboxylase, PC; pyruvate dehydrogenase complex,
PDH, hydroxyl groups, OH.
102
CHAPTER 4: Ammonium ions sensitises mTORC1 to amino acids via the
Src/Akt signalling axis
4.1 Introduction
Ammonia is often generated in excess against a tumorigenic background
(Carrascosa, Martinez, & Nunez de Castro, 1982; Chance et al., 1989; Chance
et al., 1988), primarily due to avid consumption of glutamine (Krall & Christofk,
2015). Conventionally perceived as a toxic metabolite, growing evidences are
pointing to its expanded role in cell signalling and metabolism. Glutamine-
derived ammonia has been proposed to stimulate autophagy in an
autocrine/paracrine manner as a means of promoting stress adaptation in
adjacent cells (C. H. Eng & Abraham, 2010). This is important for survival
during short-term nutrient withdrawal, and has been shown to sustain
metabolism in cancer cells under energy stress (Cheong, Lu, Lindsten, &
Thompson, 2012; Villar, Merhi, Djavaheri-Mergny, & Duran, 2015). How
ammonia activate autophagy is likely to be independent of the mTORC1/ULK1
axis or ERK1 (Cheong, Lindsten, Wu, Lu, & Thompson, 2011; Harder,
Bunkenborg, & Andersen, 2014), rather it requires activation of AMPK (Harder
et al., 2014).
Paradoxically, the carbon metabolites of glutaminolysis have been shown to
inhibit autophagy (Villar et al., 2015). Glutamine-derived α-KG activates
mTORC1 to subsequently impede autophagy by 1) enhancing GTP loading on
RagB GTPase (Duran et al., 2012), 2) activating PHDs (Duran et al., 2013), or
3) modulating acetyl-CoA metabolism and thus, protein acetylation (Marino et
103
al., 2014). Addressing the differential effects of nitrogen- versus carbon-
metabolites derived from glutaminolysis on autophagy is important. However,
relatively little is known about the impact of ammonia on mTORC1 itself. In
this chapter, I highlighted the role of Akt and Src kinase as key upstream
regulators of mTORC1 in response to NH4+, the ionic form in which 95% of
ammonia exists under physiological plasma pH. The term “ammonia” shall be
used to refer to both molecular ammonia and NH4+, whereas NH4
+ refers
specifically to the ionised species.
4.2 Results
4.2.1 Pyruvate downregulated mTORC1 signalling likely by modulating
ammonia metabolism
In Chapter 3, organic and amino acids profiles were altered in pyruvate-treated
cells (Fig 3.4A, B and 4.1A). These metabolic changes could potentially trigger
cellular nutrient sensors. mTORC1 signalling was observed to be
downregulated in NaPyr-treated cells, as determined by reduced
phosphorylation of downstream targets p70S6K and S6 (Fig 4.B and C). This
could be due to 1) reduced abundance of amino acids, 2) energy stress, 3)
expression of mTORC1-inhibitory proteins such as regulated in development
and DNA damage response 1 (REDD1) secondary to HIF-1α stabilisation, or 4)
scavenging of endogenous ammonia.
Aspartate was the most robustly decreased by 0.05- or 0.14-fold in response to
NaPyr or MePyr, respectively (Fig 4.1A). This could potentially inhibit
104
mTORC1, as maintenance of its basal activities requires amino acids. However,
supplementation of NaPyr-treated cells with aspartate was unable to restore
mTORC1 activities (Fig 4.1B). Supplementation of its amide, asparagine could
on its own activate mTORC1, a phenomenon that was discussed in greater detail
in Chapter 5.
The AMPK pathway is of relevance to this study as it regulates mTORC1 in
response to cell energy status. AMPK is a heterotrimeric complex comprising
of one catalytic α-subunit and two regulatory β- and γ-subunits. It is activated
during hypoxia or nutrient starvation when energy supply is low, leading to a
rise in AMP/ADP : ATP. Subsequently, it phosphorylates TSC2 and Raptor,
leading to inactivation of mTORC1 (Gwinn et al., 2008; Inoki, Zhu, & Guan,
2003; Mihaylova & Shaw, 2011). Immunoblot analysis indicated modest
phosphorylation of Raptor and AMPK in response to pyruvate, suggesting that
energy stress could be responsible for the suppression of mTORC1 activity in
NaPyr-treated cells (Fig 4.1B). Quantification of AMP/ADP : ATP or
assessment of AMPK functions could be conducted to verify this hypothesis.
During hypoxia, HIF-1α inhibits mTORC1 by enhancing the expression of
REDD1 (Shoshani et al., 2002). It displaces TSC2 from binding to 14-3-3, thus
freeing TSC2 to exert its GAP effects on Rheb to inhibit mTORC1 (DeYoung,
Horak, Sofer, Sgroi, & Ellisen, 2008; Dibble et al., 2012). As expected, malate
and lysine supplementation abrogated HIF-1α and REDD1 accumulation in
NaPyr-treated cells, yet mTORC1 activity remained repressed (Fig 4.1B and C),
105
suggesting that HIF-1α/REDD1 was unlikely to mediate mTORC1
downregulation.
Pyruvate is also an indirect ammonia scavenger as pyruvate can be
transaminated by alanine transaminase to yield alanine. This reaction allows
alanine to function as a temporary, non-toxic carrier of ammonia. In skeletal
muscles, once incorporated with primarily branched chain amino acids-derived
ammonia, alanine is circulated to the liver for detoxification (Holecek, 2013;
Palmer, Caldecourt, Snell, & Sugden, 1985). Although the overall importance
of alanine as ammonia regulator is weaker compared to glutamine (Forissier &
Baverel, 1981), a modest yet significant reduction in endogenous ammonia
levels (Fig 4.1D), accompanied by a 2.0- or 1.6-fold increase in alanine
abundance was observed in MePyr- or NaPyr-treated cells, respectively (Fig
4.1A). This observation prompted an in-depth investigation into mTORC1
regulation by ammonia, as demonstrated in subsequent sections of this chapter.
A summary of the possible mechanisms of pyruvate-induced mTORC1
inhibition is summarised in Fig 4.1E.
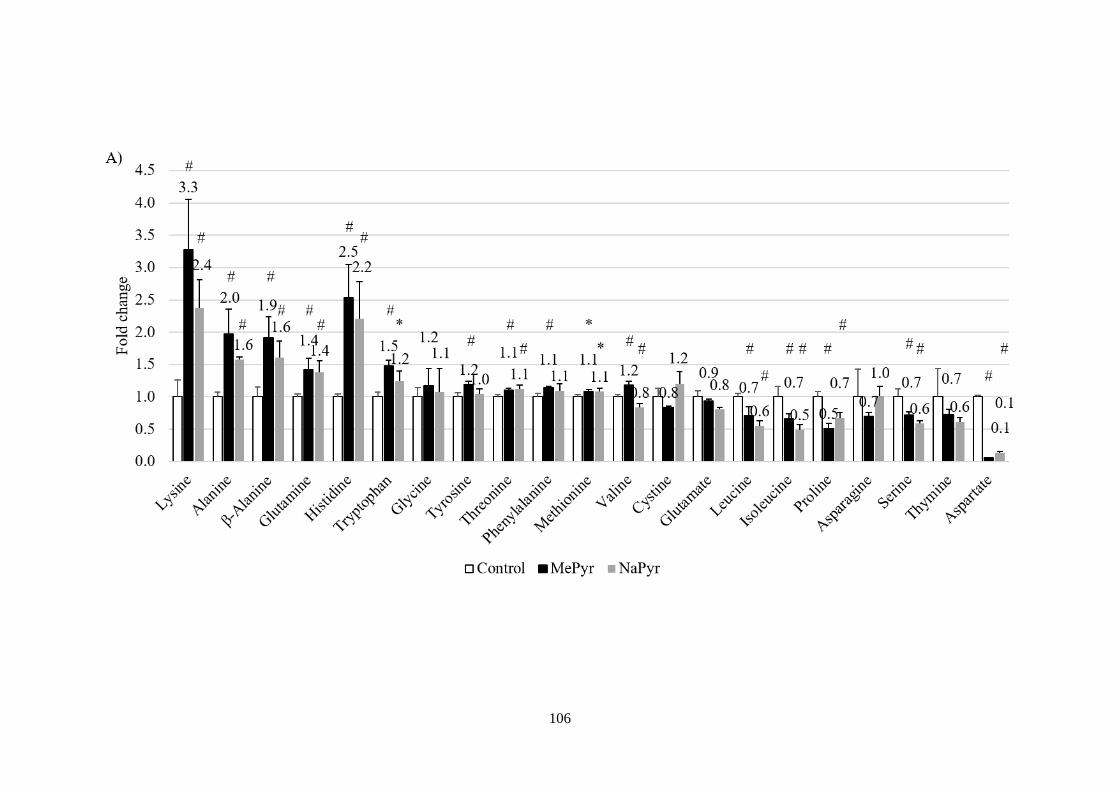
106
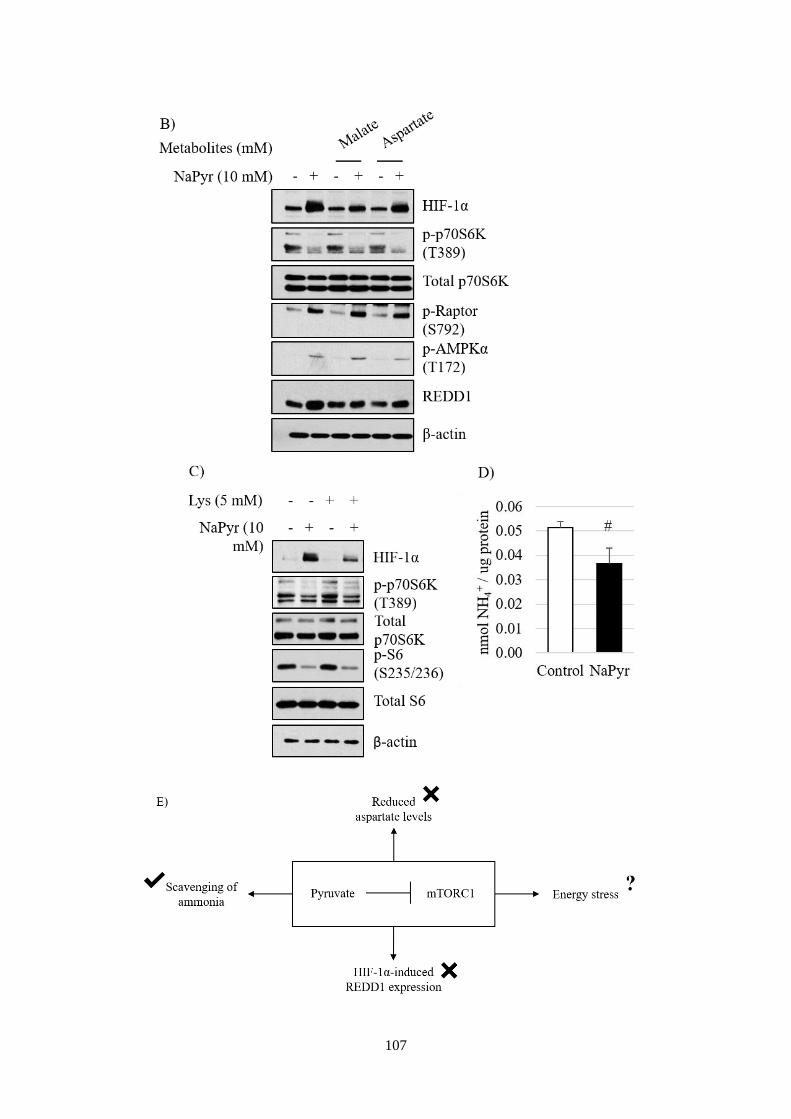
107
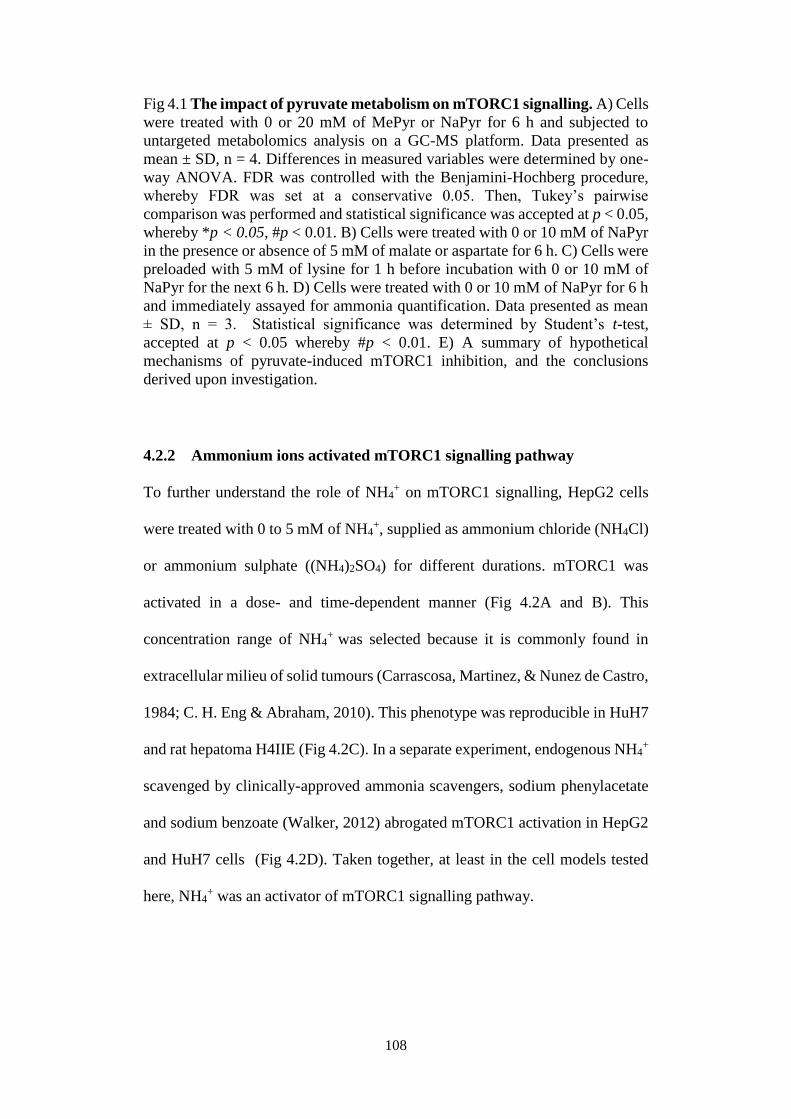
108
Fig 4.1 The impact of pyruvate metabolism on mTORC1 signalling. A) Cells
were treated with 0 or 20 mM of MePyr or NaPyr for 6 h and subjected to
untargeted metabolomics analysis on a GC-MS platform. Data presented as
mean ± SD, n = 4. Differences in measured variables were determined by one-
way ANOVA. FDR was controlled with the Benjamini-Hochberg procedure,
whereby FDR was set at a conservative 0.05. Then, Tukey’s pairwise
comparison was performed and statistical significance was accepted at p < 0.05,
whereby *p < 0.05, #p < 0.01. B) Cells were treated with 0 or 10 mM of NaPyr
in the presence or absence of 5 mM of malate or aspartate for 6 h. C) Cells were
preloaded with 5 mM of lysine for 1 h before incubation with 0 or 10 mM of
NaPyr for the next 6 h. D) Cells were treated with 0 or 10 mM of NaPyr for 6 h
and immediately assayed for ammonia quantification. Data presented as mean
± SD, n = 3. Statistical significance was determined by Student’s t-test,
accepted at p < 0.05 whereby #p < 0.01. E) A summary of hypothetical
mechanisms of pyruvate-induced mTORC1 inhibition, and the conclusions
derived upon investigation.
4.2.2 Ammonium ions activated mTORC1 signalling pathway
To further understand the role of NH4+ on mTORC1 signalling, HepG2 cells
were treated with 0 to 5 mM of NH4+, supplied as ammonium chloride (NH4Cl)
or ammonium sulphate ((NH4)2SO4) for different durations. mTORC1 was
activated in a dose- and time-dependent manner (Fig 4.2A and B). This
concentration range of NH4+ was selected because it is commonly found in
extracellular milieu of solid tumours (Carrascosa, Martinez, & Nunez de Castro,
1984; C. H. Eng & Abraham, 2010). This phenotype was reproducible in HuH7
and rat hepatoma H4IIE (Fig 4.2C). In a separate experiment, endogenous NH4+
scavenged by clinically-approved ammonia scavengers, sodium phenylacetate
and sodium benzoate (Walker, 2012) abrogated mTORC1 activation in HepG2
and HuH7 cells (Fig 4.2D). Taken together, at least in the cell models tested
here, NH4+ was an activator of mTORC1 signalling pathway.
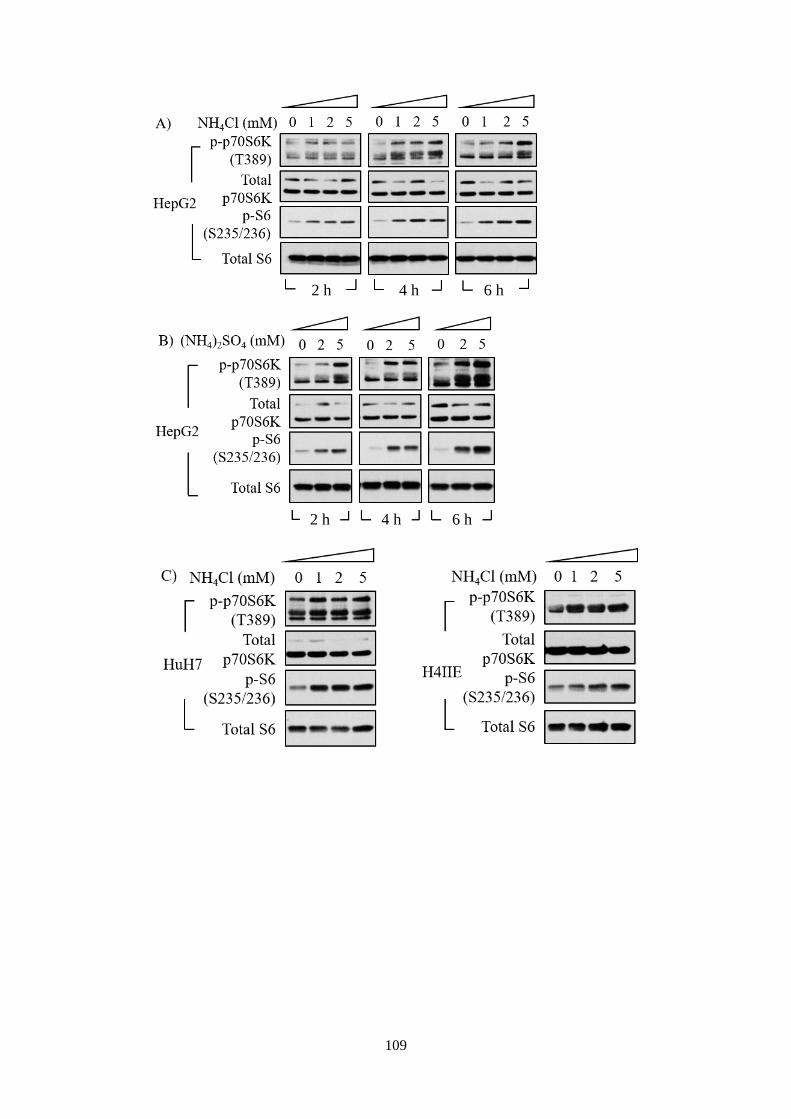
109
2 h 4 h 6 h
2 h 4 h 6 h
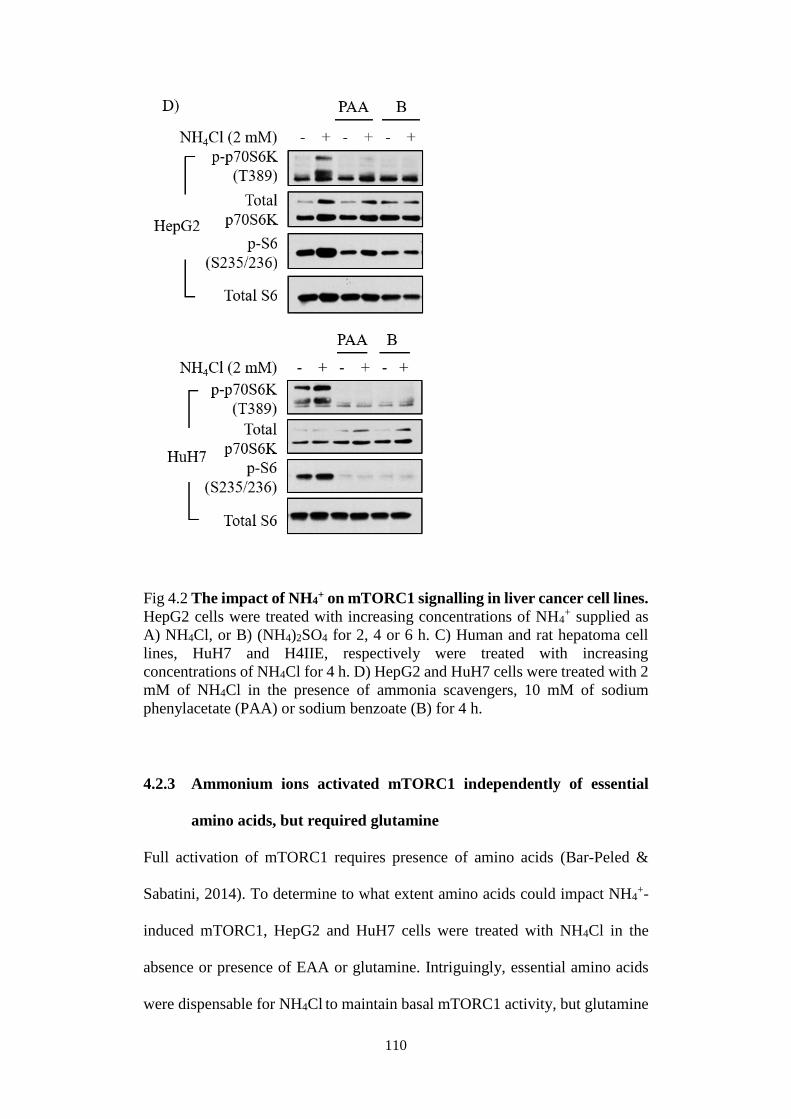
110
Fig 4.2 The impact of NH4+ on mTORC1 signalling in liver cancer cell lines.
HepG2 cells were treated with increasing concentrations of NH4+ supplied as
A) NH4Cl, or B) (NH4)2SO4 for 2, 4 or 6 h. C) Human and rat hepatoma cell
lines, HuH7 and H4IIE, respectively were treated with increasing
concentrations of NH4Cl for 4 h. D) HepG2 and HuH7 cells were treated with 2
mM of NH4Cl in the presence of ammonia scavengers, 10 mM of sodium
phenylacetate (PAA) or sodium benzoate (B) for 4 h.
4.2.3 Ammonium ions activated mTORC1 independently of essential
amino acids, but required glutamine
Full activation of mTORC1 requires presence of amino acids (Bar-Peled &
Sabatini, 2014). To determine to what extent amino acids could impact NH4+-
induced mTORC1, HepG2 and HuH7 cells were treated with NH4Cl in the
absence or presence of EAA or glutamine. Intriguingly, essential amino acids
were dispensable for NH4Cl to maintain basal mTORC1 activity, but glutamine
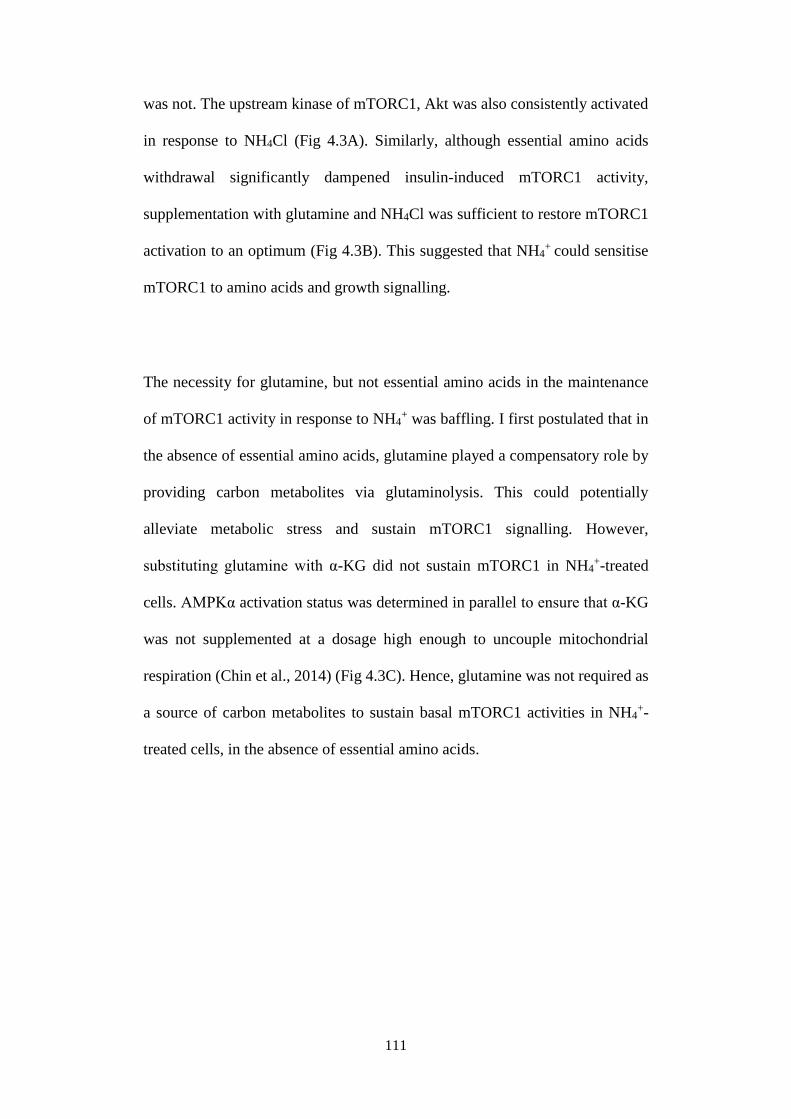
111
was not. The upstream kinase of mTORC1, Akt was also consistently activated
in response to NH4Cl (Fig 4.3A). Similarly, although essential amino acids
withdrawal significantly dampened insulin-induced mTORC1 activity,
supplementation with glutamine and NH4Cl was sufficient to restore mTORC1
activation to an optimum (Fig 4.3B). This suggested that NH4+ could sensitise
mTORC1 to amino acids and growth signalling.
The necessity for glutamine, but not essential amino acids in the maintenance
of mTORC1 activity in response to NH4+ was baffling. I first postulated that in
the absence of essential amino acids, glutamine played a compensatory role by
providing carbon metabolites via glutaminolysis. This could potentially
alleviate metabolic stress and sustain mTORC1 signalling. However,
substituting glutamine with α-KG did not sustain mTORC1 in NH4+-treated
cells. AMPKα activation status was determined in parallel to ensure that α-KG
was not supplemented at a dosage high enough to uncouple mitochondrial
respiration (Chin et al., 2014) (Fig 4.3C). Hence, glutamine was not required as
a source of carbon metabolites to sustain basal mTORC1 activities in NH4+-
treated cells, in the absence of essential amino acids.
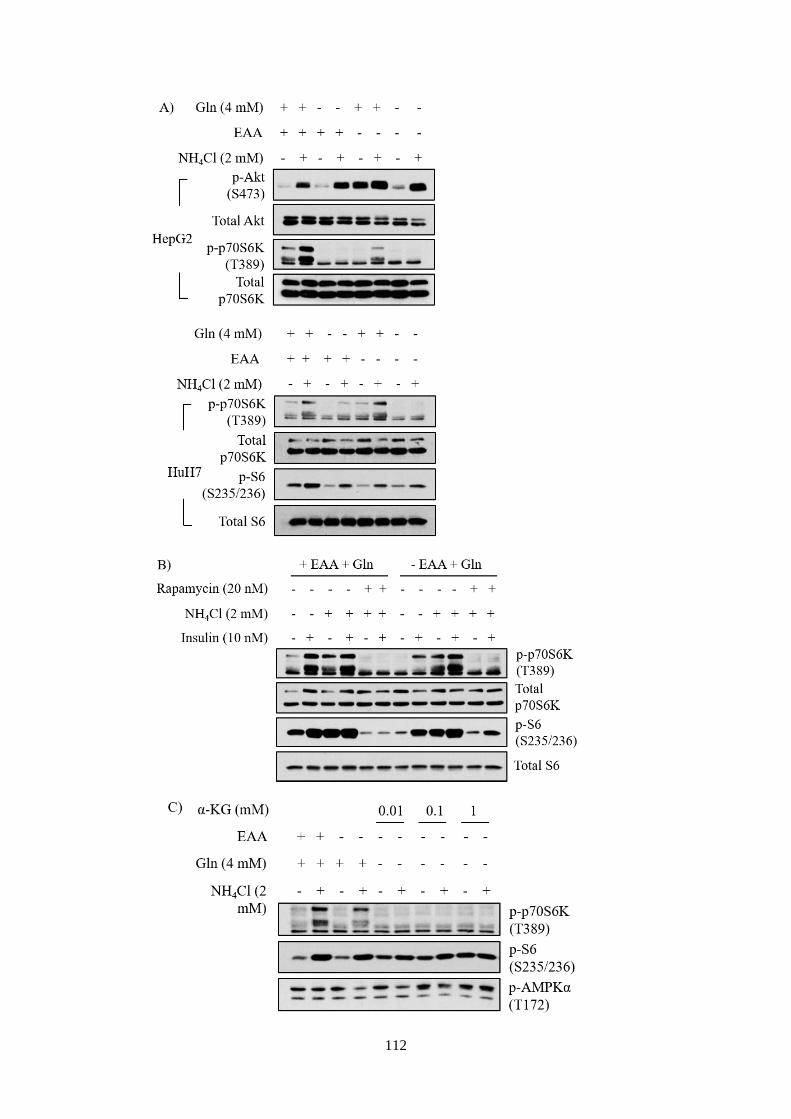
112
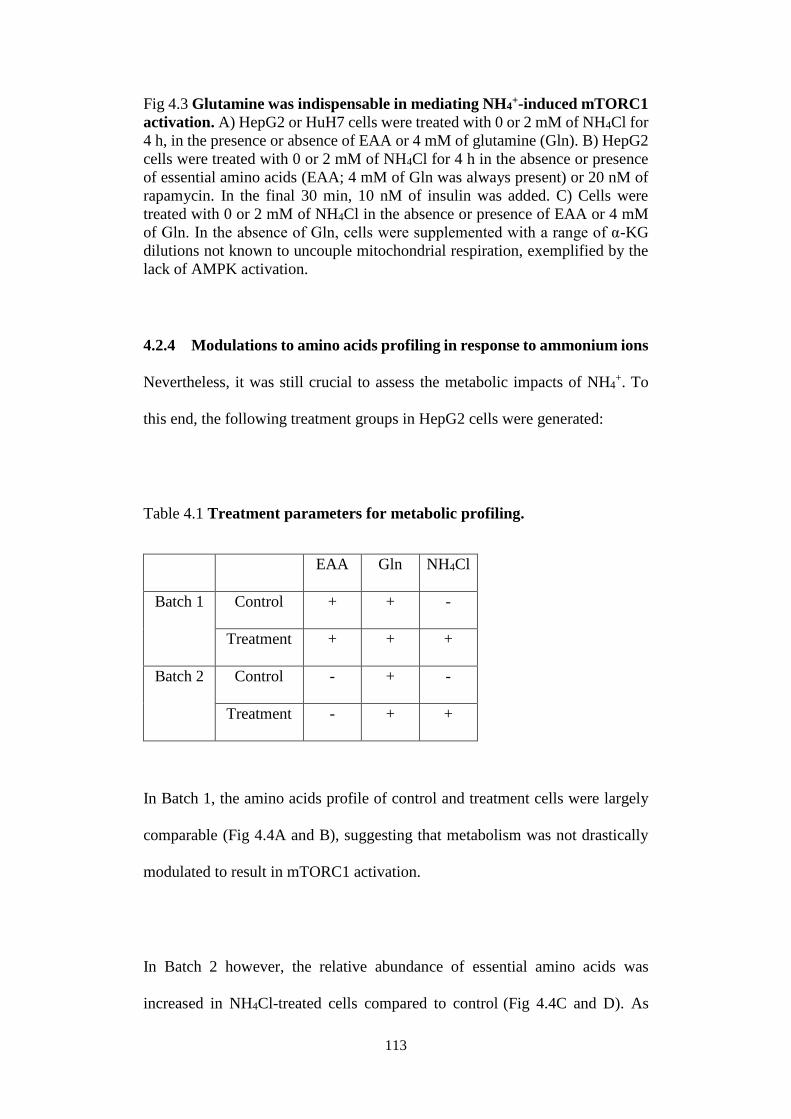
113
Fig 4.3 Glutamine was indispensable in mediating NH4+-induced mTORC1
activation. A) HepG2 or HuH7 cells were treated with 0 or 2 mM of NH4Cl for
4 h, in the presence or absence of EAA or 4 mM of glutamine (Gln). B) HepG2
cells were treated with 0 or 2 mM of NH4Cl for 4 h in the absence or presence
of essential amino acids (EAA; 4 mM of Gln was always present) or 20 nM of
rapamycin. In the final 30 min, 10 nM of insulin was added. C) Cells were
treated with 0 or 2 mM of NH4Cl in the absence or presence of EAA or 4 mM
of Gln. In the absence of Gln, cells were supplemented with a range of α-KG
dilutions not known to uncouple mitochondrial respiration, exemplified by the
lack of AMPK activation.
4.2.4 Modulations to amino acids profiling in response to ammonium ions
Nevertheless, it was still crucial to assess the metabolic impacts of NH4+. To
this end, the following treatment groups in HepG2 cells were generated:
Table 4.1 Treatment parameters for metabolic profiling.
EAA Gln NH4Cl
Batch 1 Control + + -
Treatment + + +
Batch 2 Control - + -
Treatment - + +
In Batch 1, the amino acids profile of control and treatment cells were largely
comparable (Fig 4.4A and B), suggesting that metabolism was not drastically
modulated to result in mTORC1 activation.
In Batch 2 however, the relative abundance of essential amino acids was
increased in NH4Cl-treated cells compared to control (Fig 4.4C and D). As
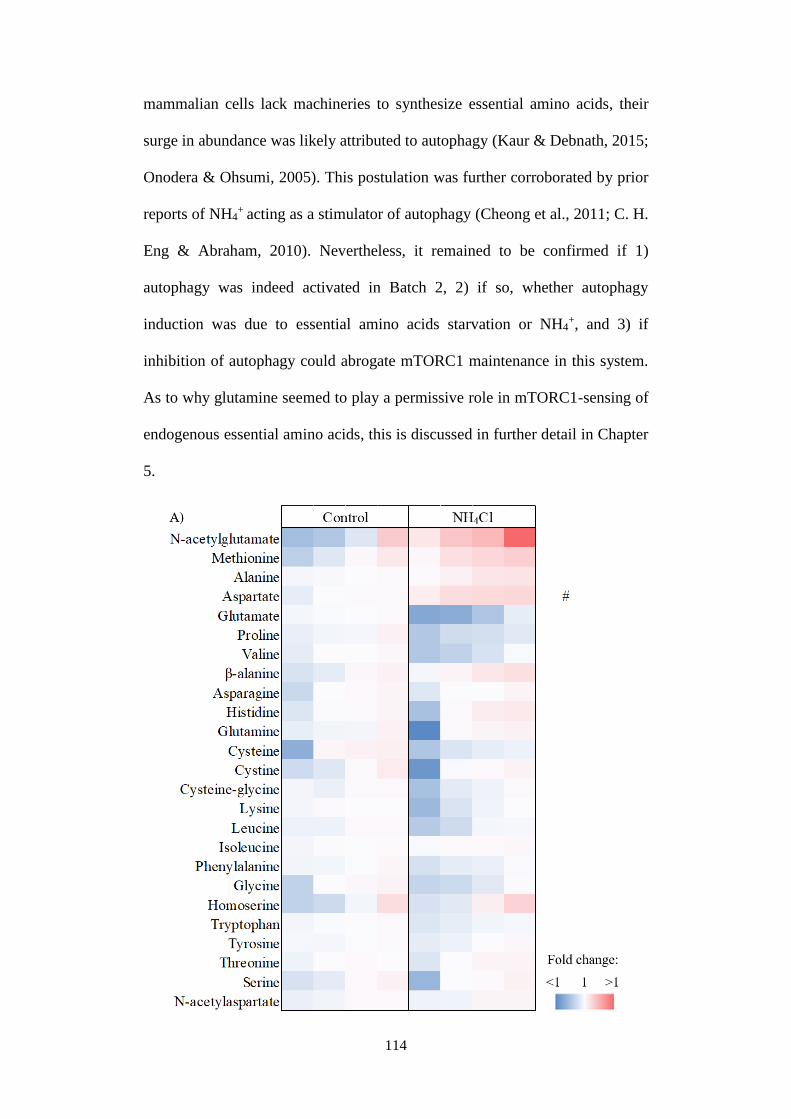
114
mammalian cells lack machineries to synthesize essential amino acids, their
surge in abundance was likely attributed to autophagy (Kaur & Debnath, 2015;
Onodera & Ohsumi, 2005). This postulation was further corroborated by prior
reports of NH4+ acting as a stimulator of autophagy (Cheong et al., 2011; C. H.
Eng & Abraham, 2010). Nevertheless, it remained to be confirmed if 1)
autophagy was indeed activated in Batch 2, 2) if so, whether autophagy
induction was due to essential amino acids starvation or NH4+, and 3) if
inhibition of autophagy could abrogate mTORC1 maintenance in this system.
As to why glutamine seemed to play a permissive role in mTORC1-sensing of
endogenous essential amino acids, this is discussed in further detail in Chapter
5.
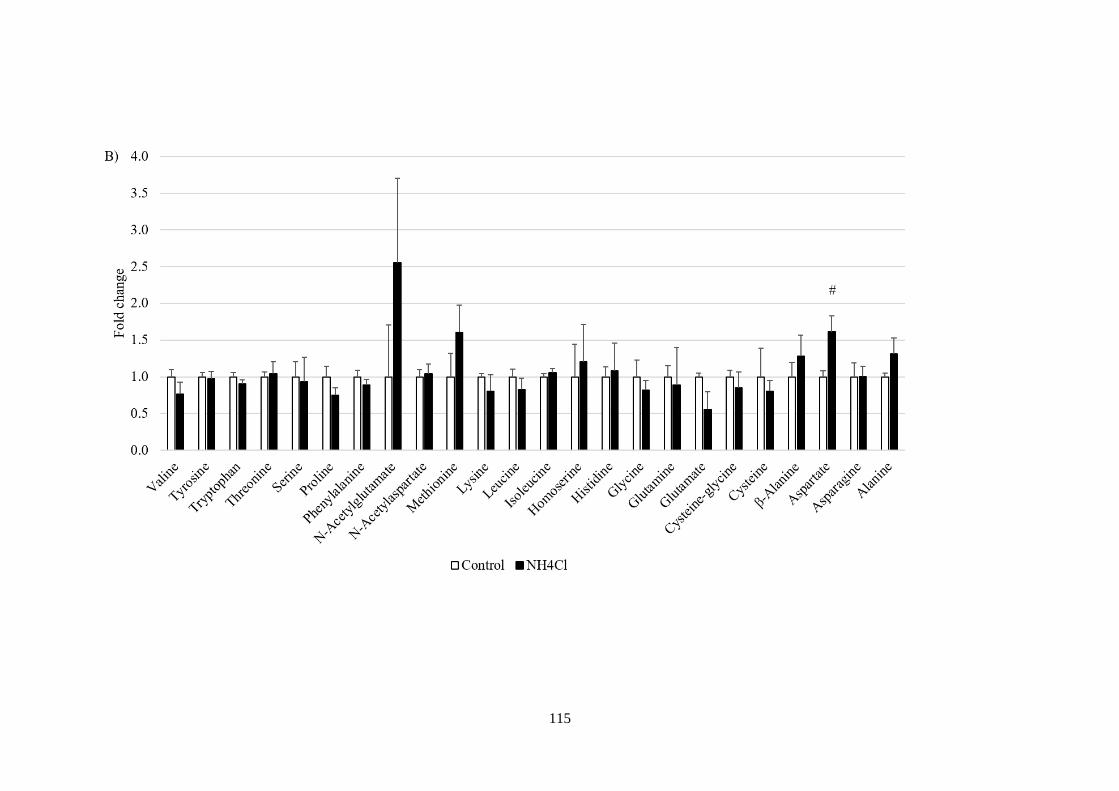
115
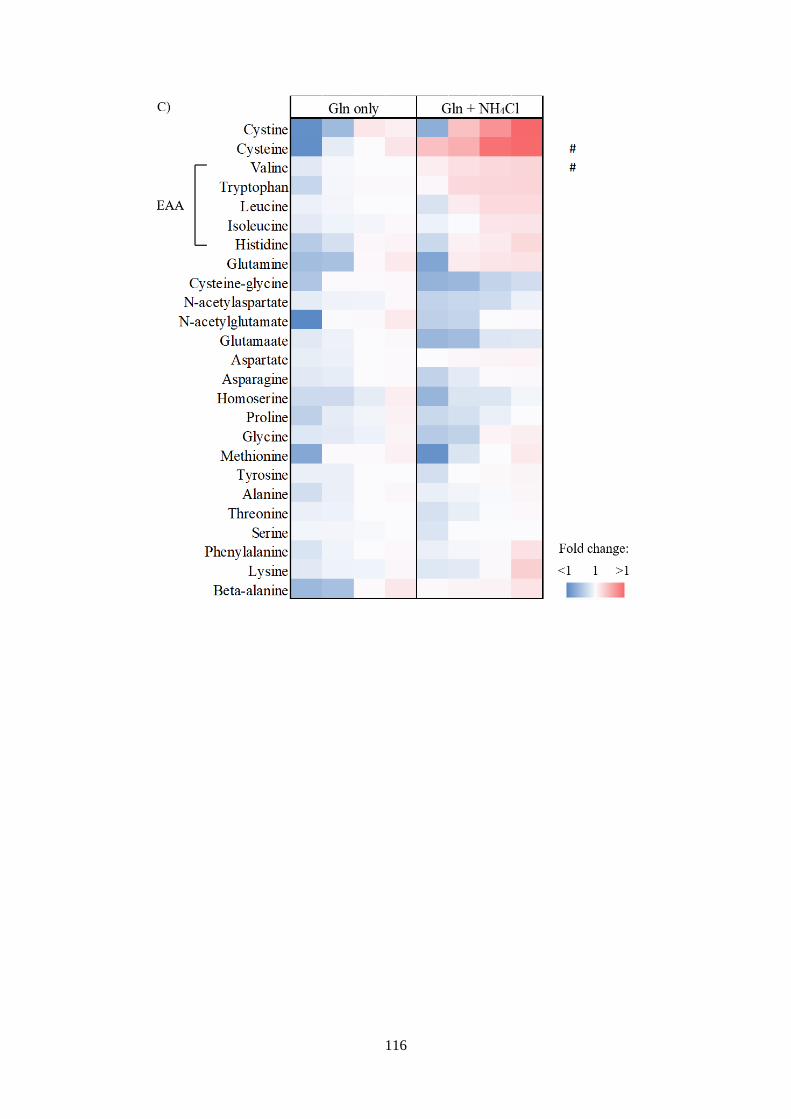
116
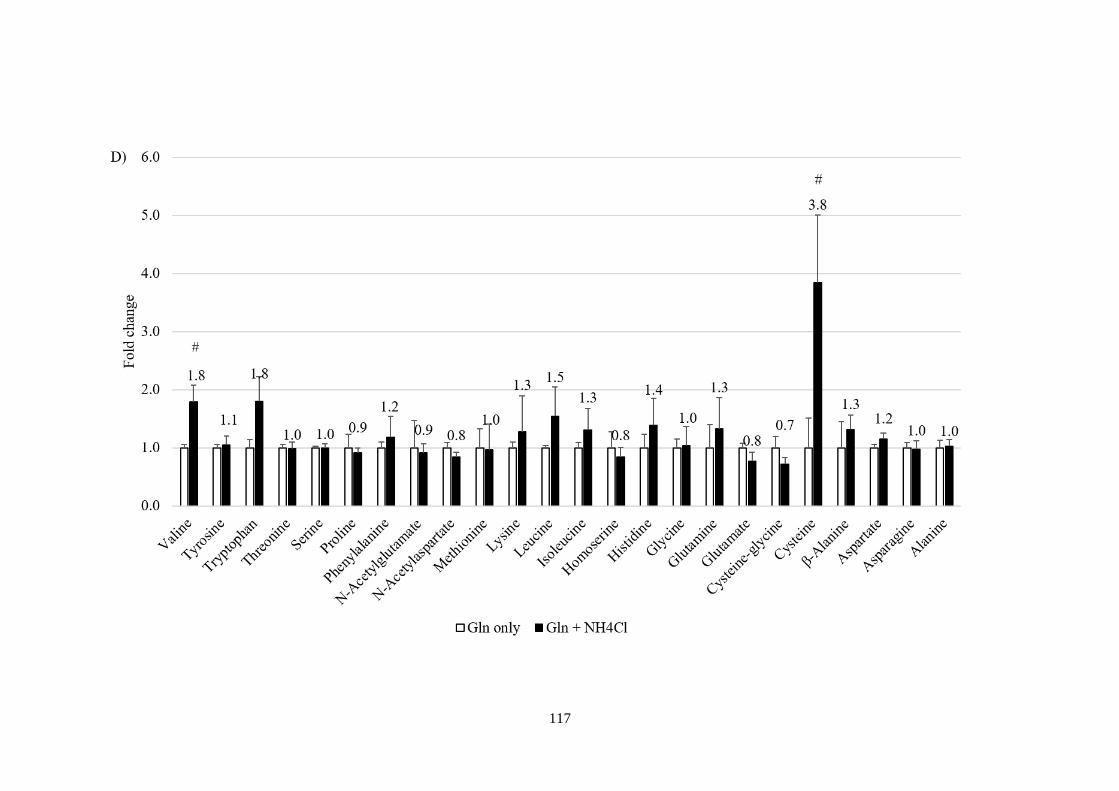
117
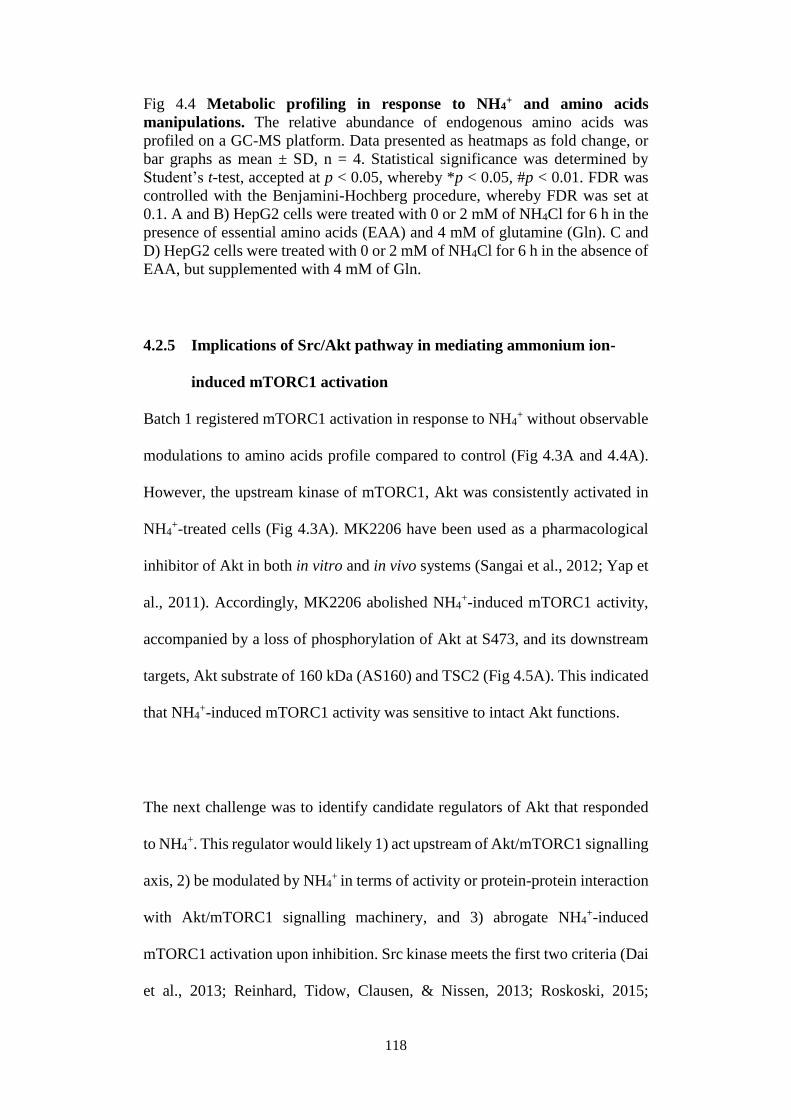
118
Fig 4.4 Metabolic profiling in response to NH4+ and amino acids
manipulations. The relative abundance of endogenous amino acids was
profiled on a GC-MS platform. Data presented as heatmaps as fold change, or
bar graphs as mean ± SD, n = 4. Statistical significance was determined by
Student’s t-test, accepted at p < 0.05, whereby *p < 0.05, #p < 0.01. FDR was
controlled with the Benjamini-Hochberg procedure, whereby FDR was set at
0.1. A and B) HepG2 cells were treated with 0 or 2 mM of NH4Cl for 6 h in the
presence of essential amino acids (EAA) and 4 mM of glutamine (Gln). C and
D) HepG2 cells were treated with 0 or 2 mM of NH4Cl for 6 h in the absence of
EAA, but supplemented with 4 mM of Gln.
4.2.5 Implications of Src/Akt pathway in mediating ammonium ion-
induced mTORC1 activation
Batch 1 registered mTORC1 activation in response to NH4+ without observable
modulations to amino acids profile compared to control (Fig 4.3A and 4.4A).
However, the upstream kinase of mTORC1, Akt was consistently activated in
NH4+-treated cells (Fig 4.3A). MK2206 have been used as a pharmacological
inhibitor of Akt in both in vitro and in vivo systems (Sangai et al., 2012; Yap et
al., 2011). Accordingly, MK2206 abolished NH4+-induced mTORC1 activity,
accompanied by a loss of phosphorylation of Akt at S473, and its downstream
targets, Akt substrate of 160 kDa (AS160) and TSC2 (Fig 4.5A). This indicated
that NH4+-induced mTORC1 activity was sensitive to intact Akt functions.
The next challenge was to identify candidate regulators of Akt that responded
to NH4+. This regulator would likely 1) act upstream of Akt/mTORC1 signalling
axis, 2) be modulated by NH4+ in terms of activity or protein-protein interaction
with Akt/mTORC1 signalling machinery, and 3) abrogate NH4+-induced
mTORC1 activation upon inhibition. Src kinase meets the first two criteria (Dai
et al., 2013; Reinhard, Tidow, Clausen, & Nissen, 2013; Roskoski, 2015;
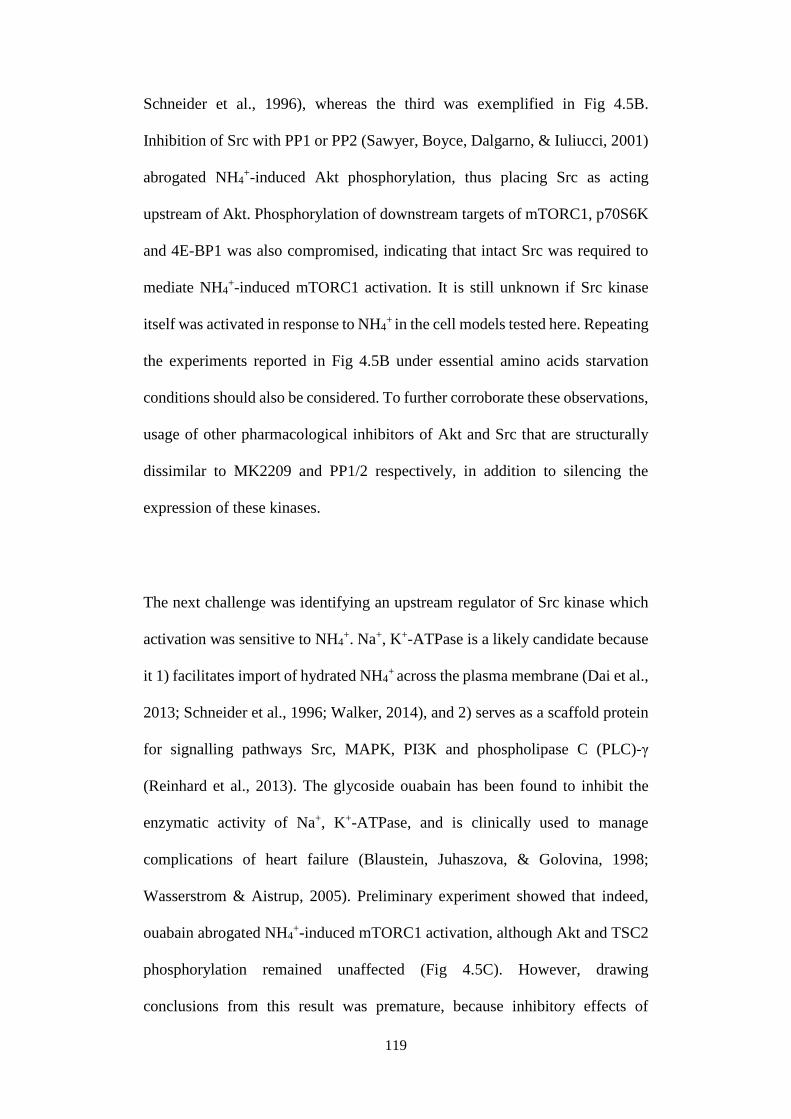
119
Schneider et al., 1996), whereas the third was exemplified in Fig 4.5B.
Inhibition of Src with PP1 or PP2 (Sawyer, Boyce, Dalgarno, & Iuliucci, 2001)
abrogated NH4+-induced Akt phosphorylation, thus placing Src as acting
upstream of Akt. Phosphorylation of downstream targets of mTORC1, p70S6K
and 4E-BP1 was also compromised, indicating that intact Src was required to
mediate NH4+-induced mTORC1 activation. It is still unknown if Src kinase
itself was activated in response to NH4+ in the cell models tested here. Repeating
the experiments reported in Fig 4.5B under essential amino acids starvation
conditions should also be considered. To further corroborate these observations,
usage of other pharmacological inhibitors of Akt and Src that are structurally
dissimilar to MK2209 and PP1/2 respectively, in addition to silencing the
expression of these kinases.
The next challenge was identifying an upstream regulator of Src kinase which
activation was sensitive to NH4+. Na+, K+-ATPase is a likely candidate because
it 1) facilitates import of hydrated NH4+ across the plasma membrane (Dai et al.,
2013; Schneider et al., 1996; Walker, 2014), and 2) serves as a scaffold protein
for signalling pathways Src, MAPK, PI3K and phospholipase C (PLC)-γ
(Reinhard et al., 2013). The glycoside ouabain has been found to inhibit the
enzymatic activity of Na+, K+-ATPase, and is clinically used to manage
complications of heart failure (Blaustein, Juhaszova, & Golovina, 1998;
Wasserstrom & Aistrup, 2005). Preliminary experiment showed that indeed,
ouabain abrogated NH4+-induced mTORC1 activation, although Akt and TSC2
phosphorylation remained unaffected (Fig 4.5C). However, drawing
conclusions from this result was premature, because inhibitory effects of
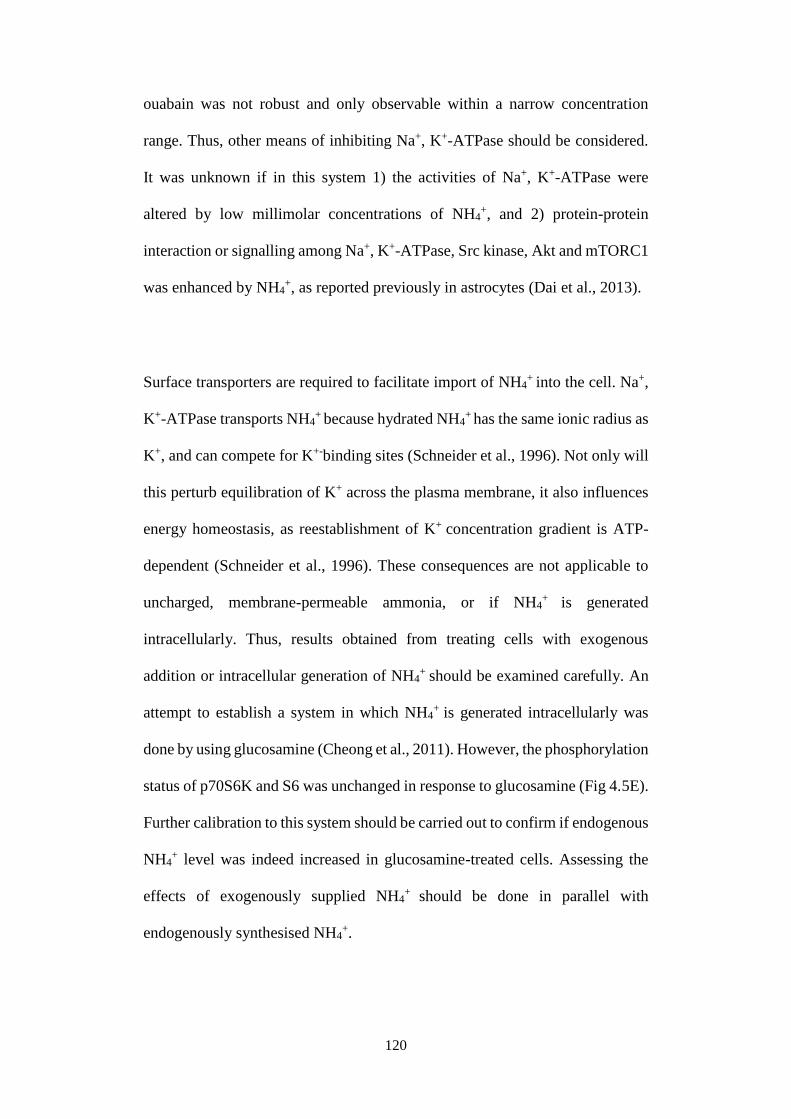
120
ouabain was not robust and only observable within a narrow concentration
range. Thus, other means of inhibiting Na+, K+-ATPase should be considered.
It was unknown if in this system 1) the activities of Na+, K+-ATPase were
altered by low millimolar concentrations of NH4+, and 2) protein-protein
interaction or signalling among Na+, K+-ATPase, Src kinase, Akt and mTORC1
was enhanced by NH4+, as reported previously in astrocytes (Dai et al., 2013).
Surface transporters are required to facilitate import of NH4+ into the cell. Na+,
K+-ATPase transports NH4+ because hydrated NH4
+ has the same ionic radius as
K+, and can compete for K+-binding sites (Schneider et al., 1996). Not only will
this perturb equilibration of K+ across the plasma membrane, it also influences
energy homeostasis, as reestablishment of K+ concentration gradient is ATP-
dependent (Schneider et al., 1996). These consequences are not applicable to
uncharged, membrane-permeable ammonia, or if NH4+ is generated
intracellularly. Thus, results obtained from treating cells with exogenous
addition or intracellular generation of NH4+ should be examined carefully. An
attempt to establish a system in which NH4+ is generated intracellularly was
done by using glucosamine (Cheong et al., 2011). However, the phosphorylation
status of p70S6K and S6 was unchanged in response to glucosamine (Fig 4.5E).
Further calibration to this system should be carried out to confirm if endogenous
NH4+ level was indeed increased in glucosamine-treated cells. Assessing the
effects of exogenously supplied NH4+ should be done in parallel with
endogenously synthesised NH4+.
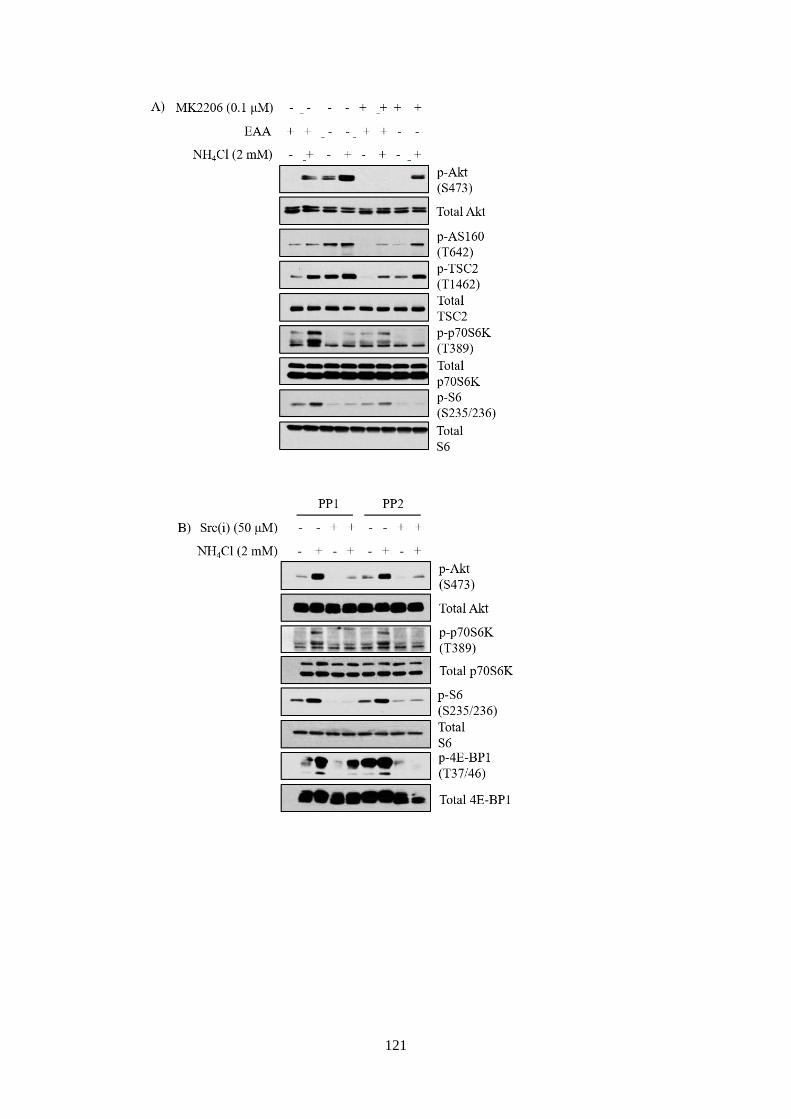
121
122
Fig 4.5 The role of Src/Akt signalling axis in NH4+-induced mTORC1
activation. A) Cells were treated with 0 or 2 mM of NH4Cl in the presence or
absence of essential amino acids (EAA; 4 mM of Gln was always present) for 4
h. Partial inhibition of Akt was achieved with 0.1 μM of MK2206. A more
robust inhibition should be attained by using higher concentrations of MK2206.
B) Cells were treated with 0 or 2 mM of NH4Cl in the presence or absence of
50 μM of Src kinase inhibitors, PP1 or PP2, for 4 h. C) Cells were treated with
0 or 2 mM of NH4Cl in the presence of EAA and 4 mM of glutamine, with or
without 150 nM of ouabain for 4 h. D) Cells were treated with increasing
concentrations of glucosamine in the presence or absence of 25 mM of glucose,
for 4 h. E) Cells were treated with 10 mM of glucosamine, in the presence of 25
mM of glucose for 24 h.
C)
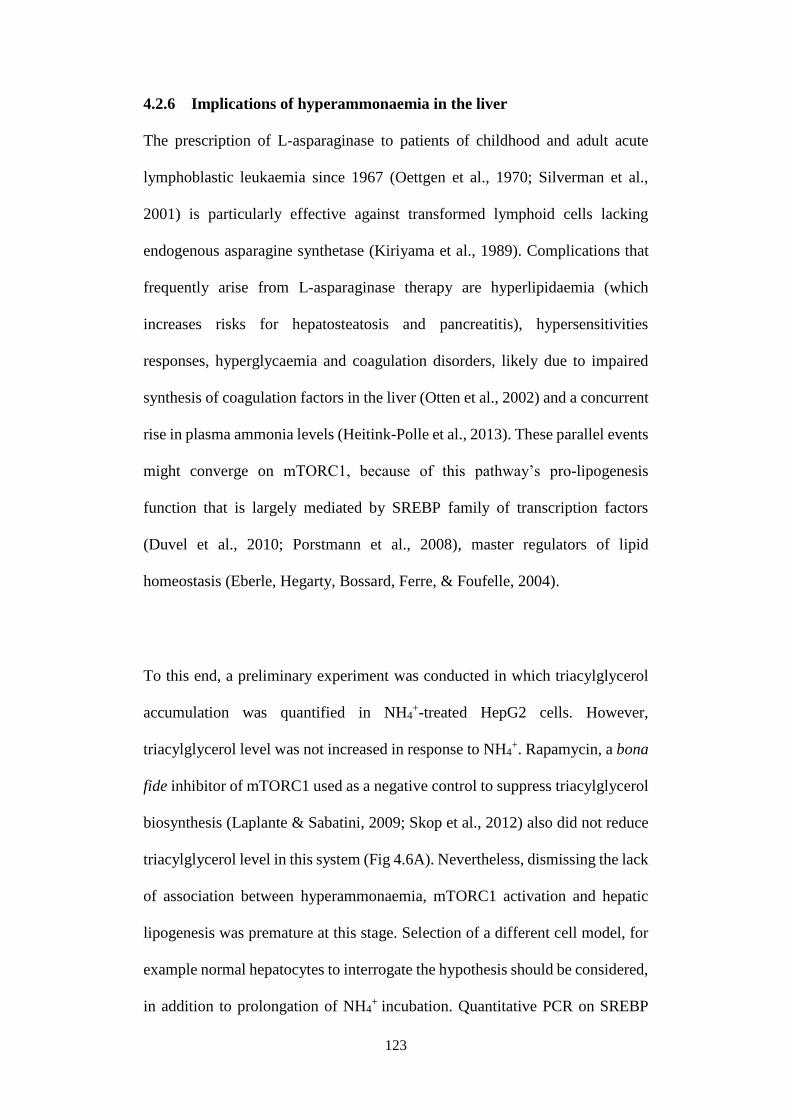
123
4.2.6 Implications of hyperammonaemia in the liver
The prescription of L-asparaginase to patients of childhood and adult acute
lymphoblastic leukaemia since 1967 (Oettgen et al., 1970; Silverman et al.,
2001) is particularly effective against transformed lymphoid cells lacking
endogenous asparagine synthetase (Kiriyama et al., 1989). Complications that
frequently arise from L-asparaginase therapy are hyperlipidaemia (which
increases risks for hepatosteatosis and pancreatitis), hypersensitivities
responses, hyperglycaemia and coagulation disorders, likely due to impaired
synthesis of coagulation factors in the liver (Otten et al., 2002) and a concurrent
rise in plasma ammonia levels (Heitink-Polle et al., 2013). These parallel events
might converge on mTORC1, because of this pathway’s pro-lipogenesis
function that is largely mediated by SREBP family of transcription factors
(Duvel et al., 2010; Porstmann et al., 2008), master regulators of lipid
homeostasis (Eberle, Hegarty, Bossard, Ferre, & Foufelle, 2004).
To this end, a preliminary experiment was conducted in which triacylglycerol
accumulation was quantified in NH4+-treated HepG2 cells. However,
triacylglycerol level was not increased in response to NH4+. Rapamycin, a bona
fide inhibitor of mTORC1 used as a negative control to suppress triacylglycerol
biosynthesis (Laplante & Sabatini, 2009; Skop et al., 2012) also did not reduce
triacylglycerol level in this system (Fig 4.6A). Nevertheless, dismissing the lack
of association between hyperammonaemia, mTORC1 activation and hepatic
lipogenesis was premature at this stage. Selection of a different cell model, for
example normal hepatocytes to interrogate the hypothesis should be considered,
in addition to prolongation of NH4+ incubation. Quantitative PCR on SREBP
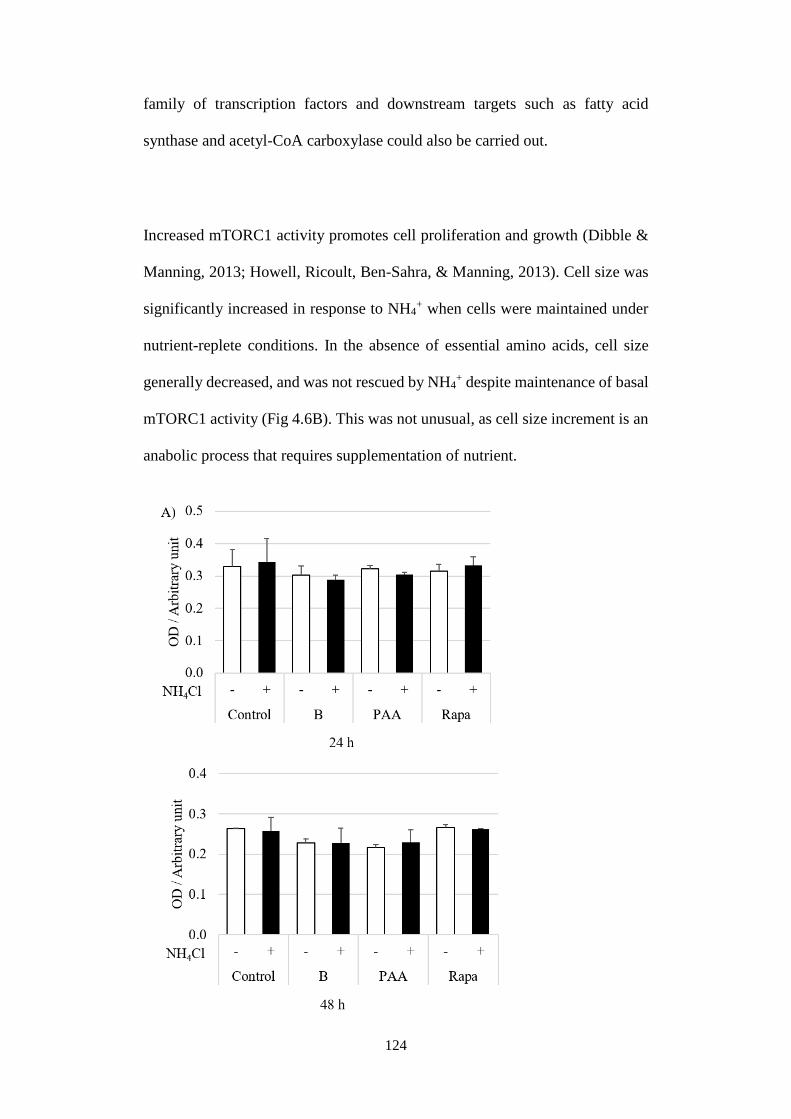
124
family of transcription factors and downstream targets such as fatty acid
synthase and acetyl-CoA carboxylase could also be carried out.
Increased mTORC1 activity promotes cell proliferation and growth (Dibble &
Manning, 2013; Howell, Ricoult, Ben-Sahra, & Manning, 2013). Cell size was
significantly increased in response to NH4+ when cells were maintained under
nutrient-replete conditions. In the absence of essential amino acids, cell size
generally decreased, and was not rescued by NH4+ despite maintenance of basal
mTORC1 activity (Fig 4.6B). This was not unusual, as cell size increment is an
anabolic process that requires supplementation of nutrient.
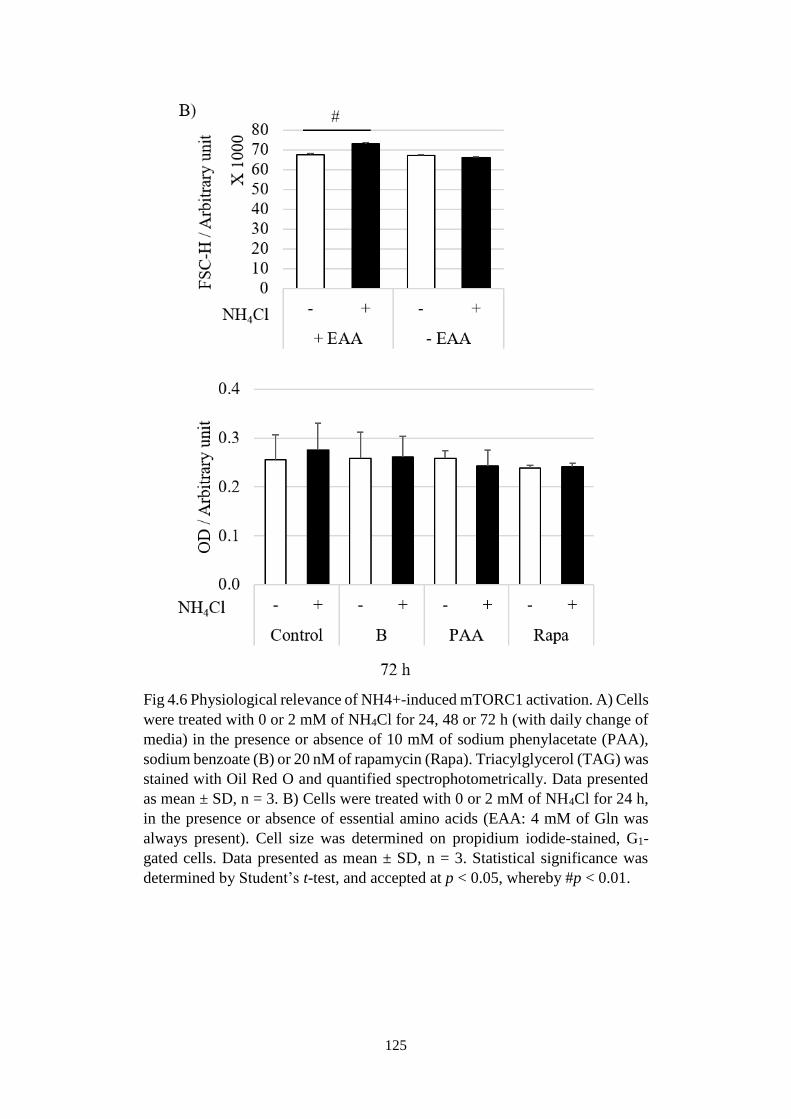
125
Fig 4.6 Physiological relevance of NH4+-induced mTORC1 activation. A) Cells
were treated with 0 or 2 mM of NH4Cl for 24, 48 or 72 h (with daily change of
media) in the presence or absence of 10 mM of sodium phenylacetate (PAA),
sodium benzoate (B) or 20 nM of rapamycin (Rapa). Triacylglycerol (TAG) was
stained with Oil Red O and quantified spectrophotometrically. Data presented
as mean ± SD, n = 3. B) Cells were treated with 0 or 2 mM of NH4Cl for 24 h,
in the presence or absence of essential amino acids (EAA: 4 mM of Gln was
always present). Cell size was determined on propidium iodide-stained, G1-
gated cells. Data presented as mean ± SD, n = 3. Statistical significance was
determined by Student’s t-test, and accepted at p < 0.05, whereby #p < 0.01.
126
4.3 Discussion
Across several cancer cell lines tested in this study, NH4+ activated mTORC1
signalling when supplied in millimolar doses in culture media. This is
pathological because 1) plasma ammonia is usually maintained at a low basal
of 40 μM (Walker, 2012), and 2) such concentrations are found in interstitial
fluid surrounding solid tumours (Chance et al., 1989; Chance et al., 1988; C. H.
Eng et al., 2010). Under fed conditions, NH4+ enhanced mTORC1 activity. Even
during essential amino acids starvation (with glutamine supplementation), NH4+
could sustain mTORC1 activity (Fig 4.3A and B). Sensitising mTORC1 to
anabolic stimuli (nutrients and growth factors) could be advantageous in an
oncogenic setting, as it enables growth and survival even under stressed
conditions (Laplante & Sabatini, 2012).
It is still unknown how cells sense NH4+ to influence cell signalling. pH
modulation is thought to be important as salts of NH4+ are weak bases. High
concentrations of NH4Cl have been found to significantly increase lysosomal
pH to the extent of inhibiting lysosomal enzymes, a reason why studies of NH4+
metabolism is often coupled to autophagy induction (Cardelli, Richardson, &
Miears, 1989; Cheong et al., 2011; Y. Hu et al., 2016). Indeed, cells treated with
NH4+ maintained under essential amino acids-starved conditions exhibited
increase in endogenous essential amino acids pool (Fig 4.4C and D). Whether
autophagy had taken place warranted further investigation, by 1) analysing
conversion ratio of LC3-I to LC3-II to measure autophagy flux, 2) quantifying
green fluorescence protein (GFP)-LC3 punctate (Mizushima, Yoshimori, &
Levine, 2010) and 3) inhibiting autophagy with pharmacological agents
127
bafilomycin A or chloroquine (Cheong et al., 2012) to assess loss of endogenous
essential amino acids pool replenishment and abrogation of basal mTORC1
activities. If autophagy did take place, it is also prudent to determine whether
NH4Cl or withdrawal of essential amino acids from culture media was the
predominant autophagy inducer. Another target of NH4+ is glutaminase,
specifically GLS2, which activities are upregulated by NH4+ (S. K. Joseph &
McGivan, 1978; Szweda & Atkinson, 1990). Identifying other candidate
proteins that interact with NH4+ is key to understanding how mTORC1 is
subsequently activated. Results collected in this thesis thus far suggested that
they could 1) bind to NH4+ or activity was modulated directly by NH4
+, and 2)
signal to Src/Akt.
Another report presenting similar conclusions was published in parallel (Merhi,
Delree, & Marini, 2017). The authors supplied NH4+ as NH4Cl or ammonium
hydroxide (NH4OH), though at a higher concentration of 5 mM. In addition to
also observing an upregulation in Akt/mTORC1 signalling axis, they further
deduced the role of mTORC2 and Src kinase family members, specifically Yes1
and Fak as upstream regulators of Akt/mTORC1. These findings are in
accordance with evidence presented here 1) as phosphorylation of Akt (S473)
used as a readout in this study is a phosphosite targeted by mTORC2, and 2)
NH4+-induced mTORC1 activation was sensitive to Src kinase inhibitors, PP1
and PP2 (Fig 4.5B). The authors proceeded to suggest NH4+ itself a positive
regulator of mTORC1 and cell growth. This thesis proposed that NH4+ played a
role in sensitising mTORC1 to amino acids- and growth factor-mediated
signalling.
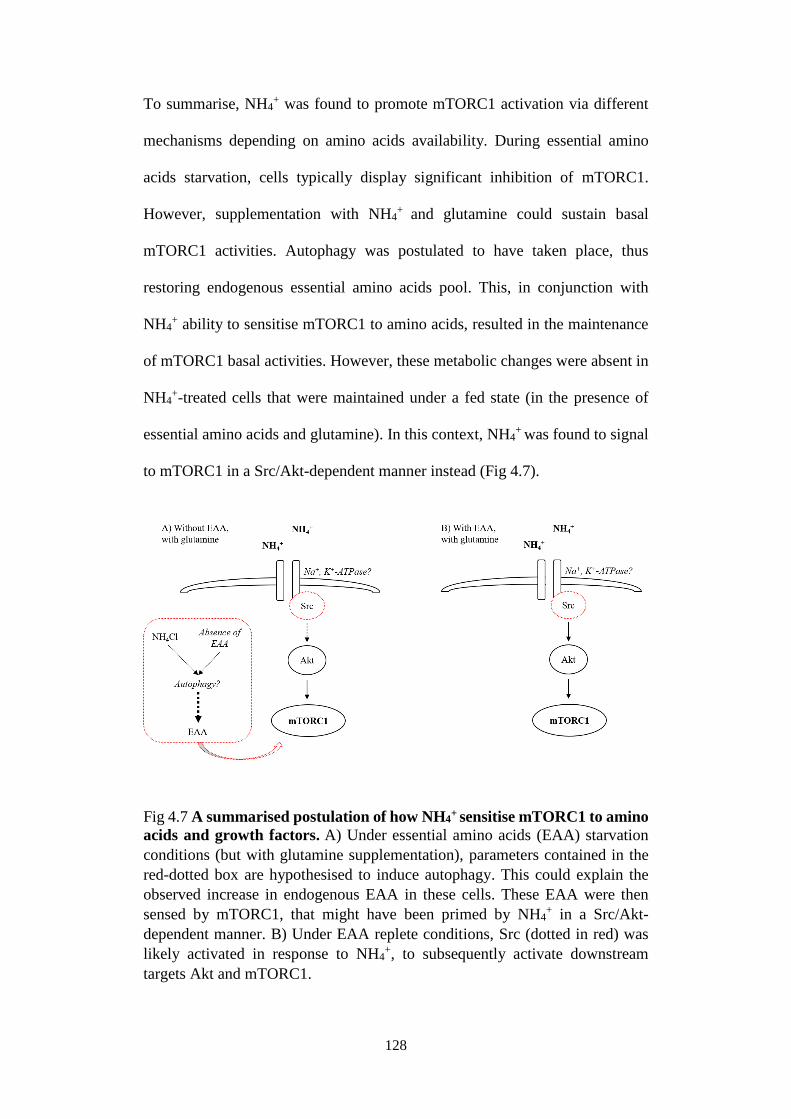
128
To summarise, NH4+ was found to promote mTORC1 activation via different
mechanisms depending on amino acids availability. During essential amino
acids starvation, cells typically display significant inhibition of mTORC1.
However, supplementation with NH4+ and glutamine could sustain basal
mTORC1 activities. Autophagy was postulated to have taken place, thus
restoring endogenous essential amino acids pool. This, in conjunction with
NH4+ ability to sensitise mTORC1 to amino acids, resulted in the maintenance
of mTORC1 basal activities. However, these metabolic changes were absent in
NH4+-treated cells that were maintained under a fed state (in the presence of
essential amino acids and glutamine). In this context, NH4+ was found to signal
to mTORC1 in a Src/Akt-dependent manner instead (Fig 4.7).
Fig 4.7 A summarised postulation of how NH4+ sensitise mTORC1 to amino
acids and growth factors. A) Under essential amino acids (EAA) starvation
conditions (but with glutamine supplementation), parameters contained in the
red-dotted box are hypothesised to induce autophagy. This could explain the
observed increase in endogenous EAA in these cells. These EAA were then
sensed by mTORC1, that might have been primed by NH4+ in a Src/Akt-
dependent manner. B) Under EAA replete conditions, Src (dotted in red) was
likely activated in response to NH4+, to subsequently activate downstream
targets Akt and mTORC1.
129
CHAPTER 5: Asparagine regulates mTORC1 signalling as an amino acid
exchange factor and mediator of endogenous amino acid sensing
5.1 Introduction
The bulk of ammonia generated in vivo is derived from glutaminolysis
(Schneider et al., 1996). This event is further upregulated in cancers to the extent
of incurring significant weight loss in the hosts (Le, Potter, Busch, Heidelberger,
& Hurlbert, 1952) to provide nitrogen and carbon precursors to sustain
hyperproliferation of cancer cells (C. V. Dang, 2010). However, even under
normal physiological conditions, glutamine is still a key signalling molecule,
although it largely signals to mTORC1 machinery without necessarily
dependent on its catabolism (Jewell et al., 2015; Krall et al., 2016; Nicklin et
al., 2009). Much less is known about the other amidic amino acid, asparagine.
Owing to their structural and biochemistry similarities, it is possible that
asparagine could also modulate mTORC1 in a glutamine-like manner.
5.2 Results
5.2.1 Asparagine did not alter intracellular amino acid profile
I first sought to establish the impact of asparagine metabolism on mTORC1
signalling. When HepG2 cells were treated with increasing concentration of
asparagine, mTORC1 activity was increased in a dose-dependent manner, as
demonstrated by increased phosphorylation of downstream targets p70S6K and
ribosomal protein S6 (Fig 5.1A). To determine if derivative metabolites were
responsible for activating mTORC1, cells were next supplemented with
aspartate, a product of asparagine deamination by asparaginase. Aspartate was
130
supplied in two forms, 1) sodium salt of aspartic acid (Na.Asp), or 2) membrane
permeable ester of aspartic acid (P.Asp). Neither sodium salt or ester of
aspartate increased mTORC1 activity (Fig 5.1A), suggesting that mTORC1 was
likely responsive to the amide asparagine itself. To further confirm if
assimilation of asparagine into amino acid metabolism was not required for
mTORC1 activation, cells treated with or without asparagine were subjected to
metabolomics analysis. The general amino acids profile between both
conditions was comparable, except that of asparagine and aspartate (increased
by 28.1- and 5.4-fold, respectively) (Fig 5.1B)
As presence of amino acids is prerequisite for optimal mTORC1 activation, I
next investigated to what extent amino acids could affect asparagine-dependent
mTORC1 regulation. Intriguingly, asparagine could substitute for glutamine in
maintaining basal mTORC1 activity, although to a weaker degree (Fig 5.1C),
likely due to in vitro preconditioning to glutamine metabolism after numerous
passaging in growth media containing 4 mM of glutamine, but none of
asparagine. Asparagine could also substitute glutamine in mediating insulin-
induced mTORC1 activation (Fig 5.1C). To summarise, evidences thus far
indicated that asparagine signalled to mTORC1 independently of metabolic
modulations, and in a manner typically displayed by glutamine.
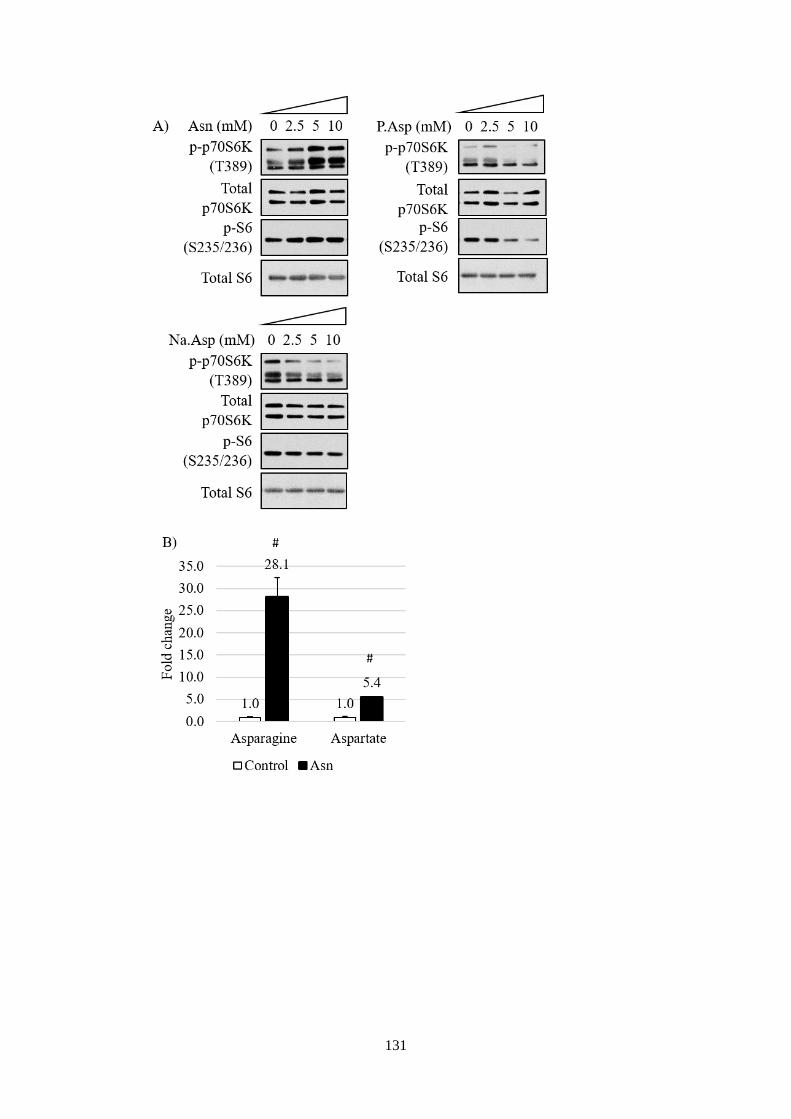
131
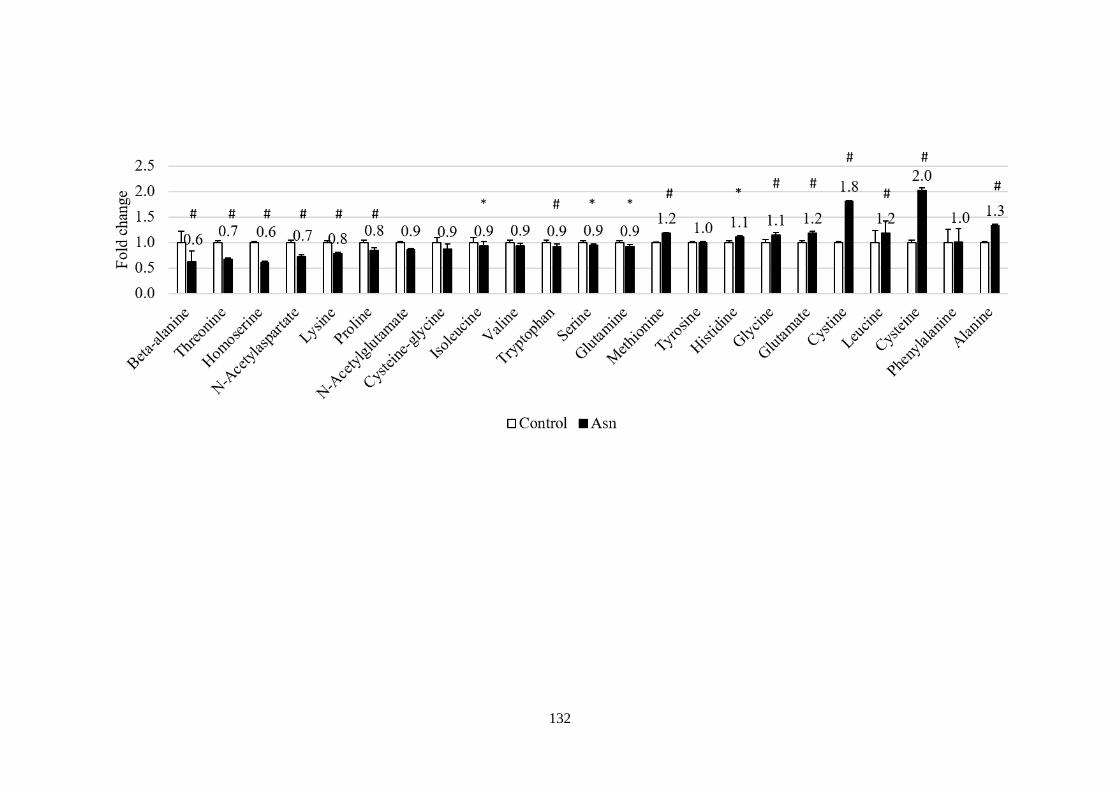
132
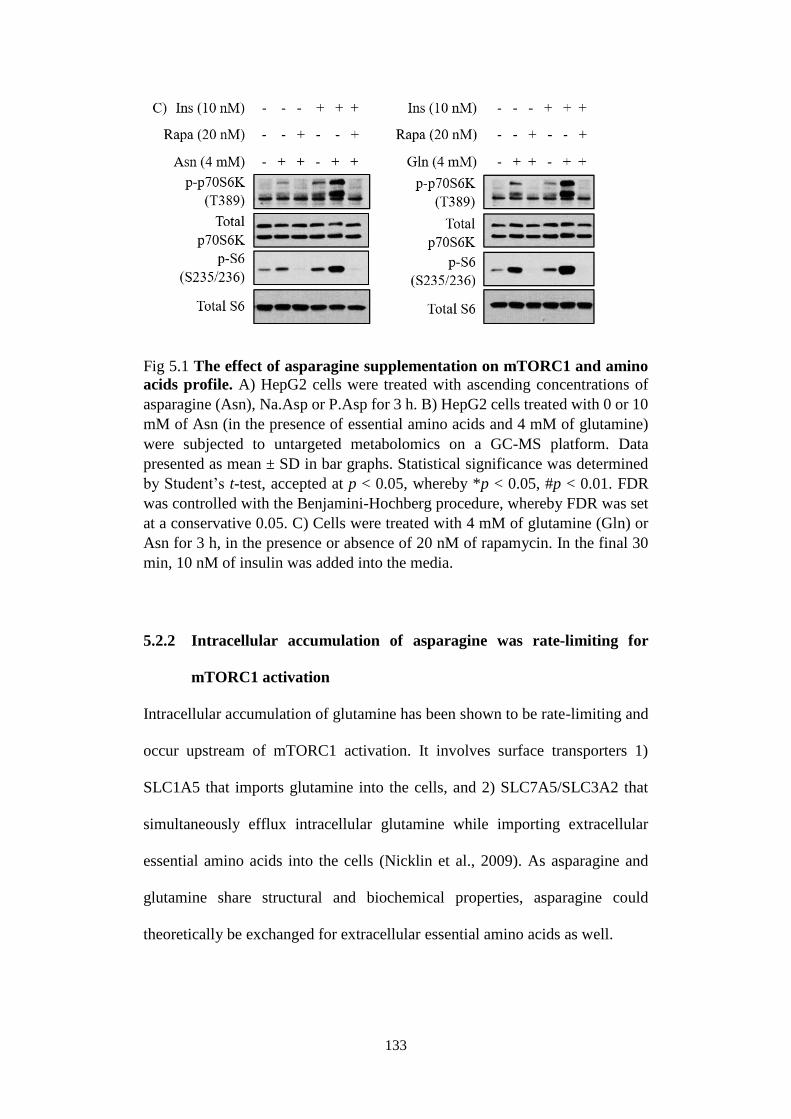
133
Fig 5.1 The effect of asparagine supplementation on mTORC1 and amino
acids profile. A) HepG2 cells were treated with ascending concentrations of
asparagine (Asn), Na.Asp or P.Asp for 3 h. B) HepG2 cells treated with 0 or 10
mM of Asn (in the presence of essential amino acids and 4 mM of glutamine)
were subjected to untargeted metabolomics on a GC-MS platform. Data
presented as mean ± SD in bar graphs. Statistical significance was determined
by Student’s t-test, accepted at p < 0.05, whereby *p < 0.05, #p < 0.01. FDR
was controlled with the Benjamini-Hochberg procedure, whereby FDR was set
at a conservative 0.05. C) Cells were treated with 4 mM of glutamine (Gln) or
Asn for 3 h, in the presence or absence of 20 nM of rapamycin. In the final 30
min, 10 nM of insulin was added into the media.
5.2.2 Intracellular accumulation of asparagine was rate-limiting for
mTORC1 activation
Intracellular accumulation of glutamine has been shown to be rate-limiting and
occur upstream of mTORC1 activation. It involves surface transporters 1)
SLC1A5 that imports glutamine into the cells, and 2) SLC7A5/SLC3A2 that
simultaneously efflux intracellular glutamine while importing extracellular
essential amino acids into the cells (Nicklin et al., 2009). As asparagine and
glutamine share structural and biochemical properties, asparagine could
theoretically be exchanged for extracellular essential amino acids as well.
134
To this end, cells were preloaded with asparagine or glutamine (positive control)
in the absence of essential amino acids for 3 h. Upon reintroduction of essential
amino acids, a difference in the kinetics of mTORC1 reactivation was observed
between preloaded and non-preloaded cells. With preloading, mTORC1 was
reactivated within 10 min of essential amino acids repletion, compared to 30
min without preloading (Fig 5.2A). In a separate experiment, essential amino
acids and the amides were introduced in the reverse sequence. Cells preloaded
with essential amino acids did not reactivate mTORC1 upon introduction of
asparagine or glutamine, although co-treatment of cells with asparagine or
glutamine and essential amino acids could (Fig 5.2B). This indicated that the
amide should first be accumulated intracellularly for subsequent mTORC1
reactivation in response to essential amino acids. These observations agree with
the previously reported role of glutamine as an exchange factor for essential
amino acids necessary for mTORC1 activation (Nicklin et al., 2009).
It was still unknown if asparagine or glutamine mediate influx of any specific
essential amino acids that was potent enough to regulate mTORC1. One of the
extracellular essential amino acids that SLC7A5/SLC3A2 could transport is
leucine, a branched chain amino acid known to be a potent stimulator of
mTORC1 activities. Indeed, when preloaded cells were repleted with an
essential amino acids cocktail that did not contain leucine, the extent of
mTORC1 reactivation was severely hampered (Fig 5.2C). Although these
readouts indicated the importance of leucine as the proximal mediator of
mTORC1, it did not discount the significance of other amino acids particularly
serine, arginine and histidine (Krall et al., 2016). To further investigate which,
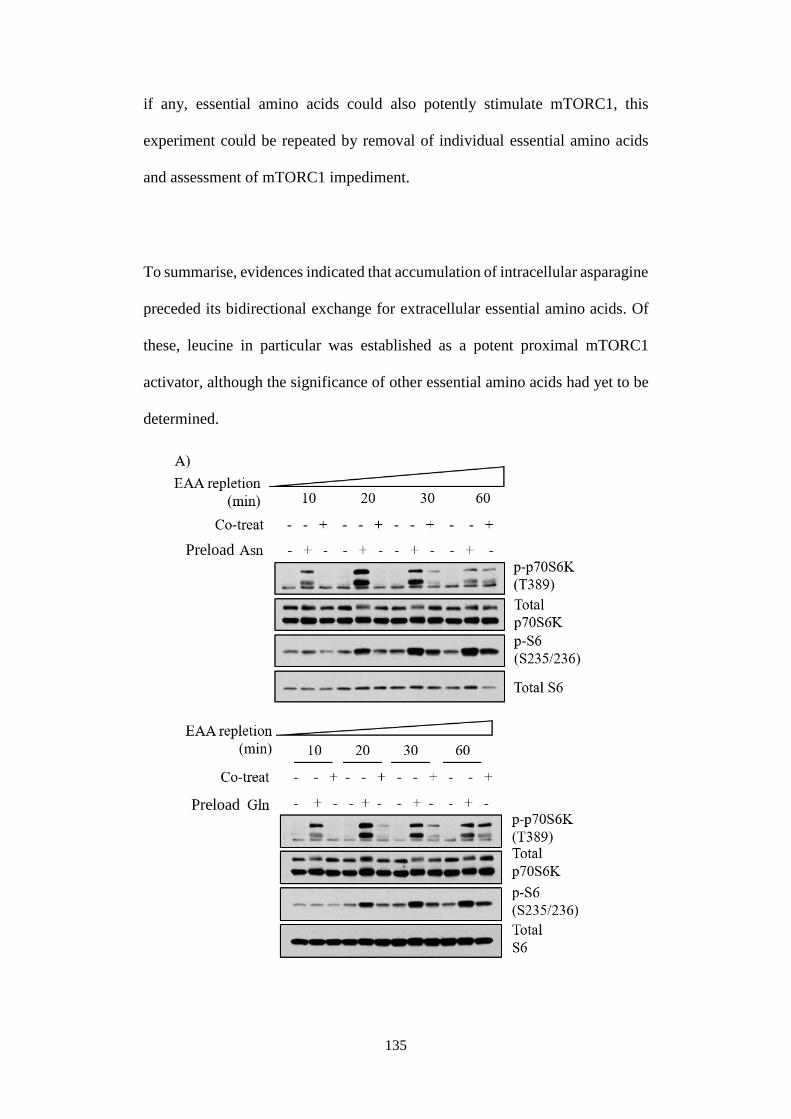
135
if any, essential amino acids could also potently stimulate mTORC1, this
experiment could be repeated by removal of individual essential amino acids
and assessment of mTORC1 impediment.
To summarise, evidences indicated that accumulation of intracellular asparagine
preceded its bidirectional exchange for extracellular essential amino acids. Of
these, leucine in particular was established as a potent proximal mTORC1
activator, although the significance of other essential amino acids had yet to be
determined.
Preload
Preload
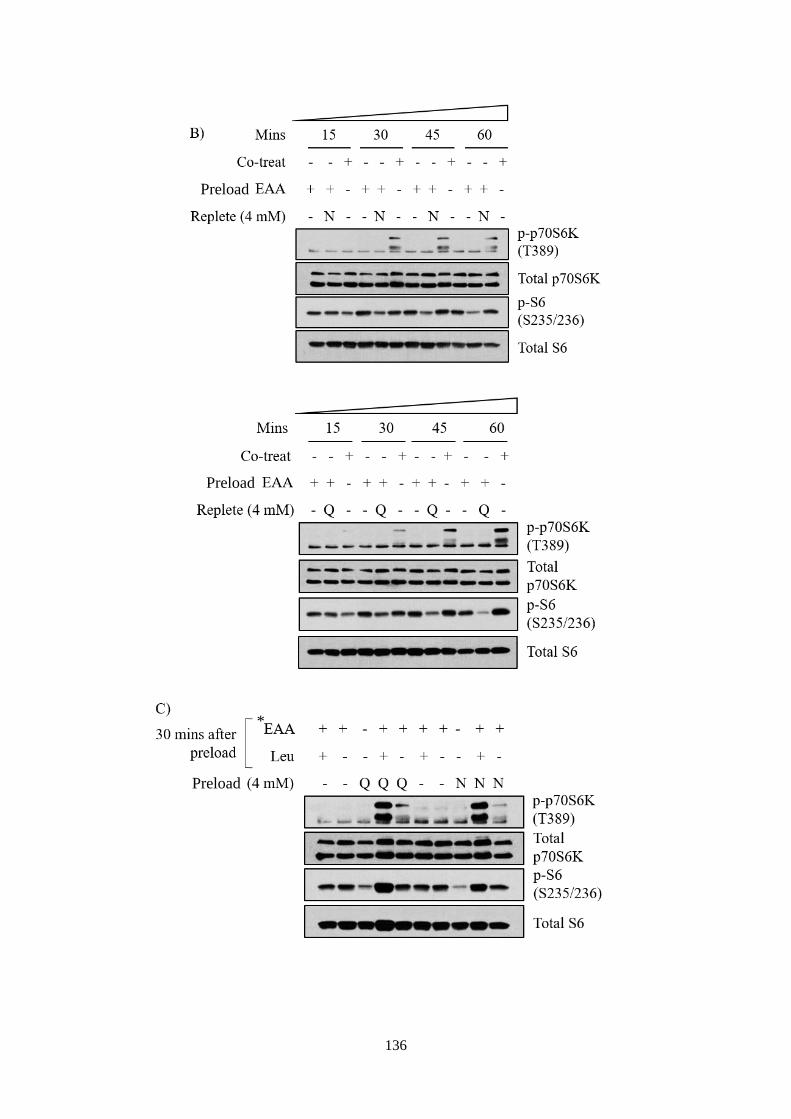
136
Preload
Preload
*
Preload
137
Fig 5.2 The significance of intracellular accumulation of amidic amino
acids. A) Cells were preloaded with 4 mM of Asn or Gln for 3 h and then
supplemented with essential amino acids (EAA) for different durations, or
cotreated with Asn or Gln with EAA for 4 h. B) In reverse, cells were preloaded
with EAA for 3 h and then supplemented with 4 mM or Asn or Gln for different
durations, or cotreated with Asn or Gln with EAA for 4 h. C) Cells were
preloaded with 4 mM of Gln (Q) or Asn (N) for 3 h, and supplemented with *EAA (essential amino acids but without leucine), with or without exogenous
leucine supplementation (Leu, 0.4 mM) for 30 min.
5.2.3 The role of asparagine or glutamine as an amino acid exchange
factor was independent of small GTPase Arf1
In recent years, there is growing interest in understanding how mTORC1 detect
amino acids to subsequently promote anabolism. Glutamine has gained much
attention due to their plasma abundance (Bergstrom et al., 1974) and preference
for cancers to metabolise them as fuel (C. V. Dang, 2010; Wise et al., 2008).
Although the exact mechanisms have not been delineated, Arf1 GTPases have
been implicated in glutamine-dependent mTORC1 activation (Jewell et al.,
2015; Li et al., 2010).
Owing to similarities in structures and biochemistries between asparagine and
glutamine, I next asked if asparagine signal to mTORC1 in an Arf1-dependent
manner as well. To this end, Arf1 was inhibited with a small molecule inhibitor
Brefeldin A. This inhibition is uncompetitive, as Brefeldin A binds to a
transient, cytoplasm-localised Arf1-GDP-Sec7d complex to render Arf1
“stuck” in its GDP-loaded conformation (Robert, Cherfils, Mouawad, &
Perahia, 2004). In both asparagine- or glutamine-treated cells, Brefeldin A
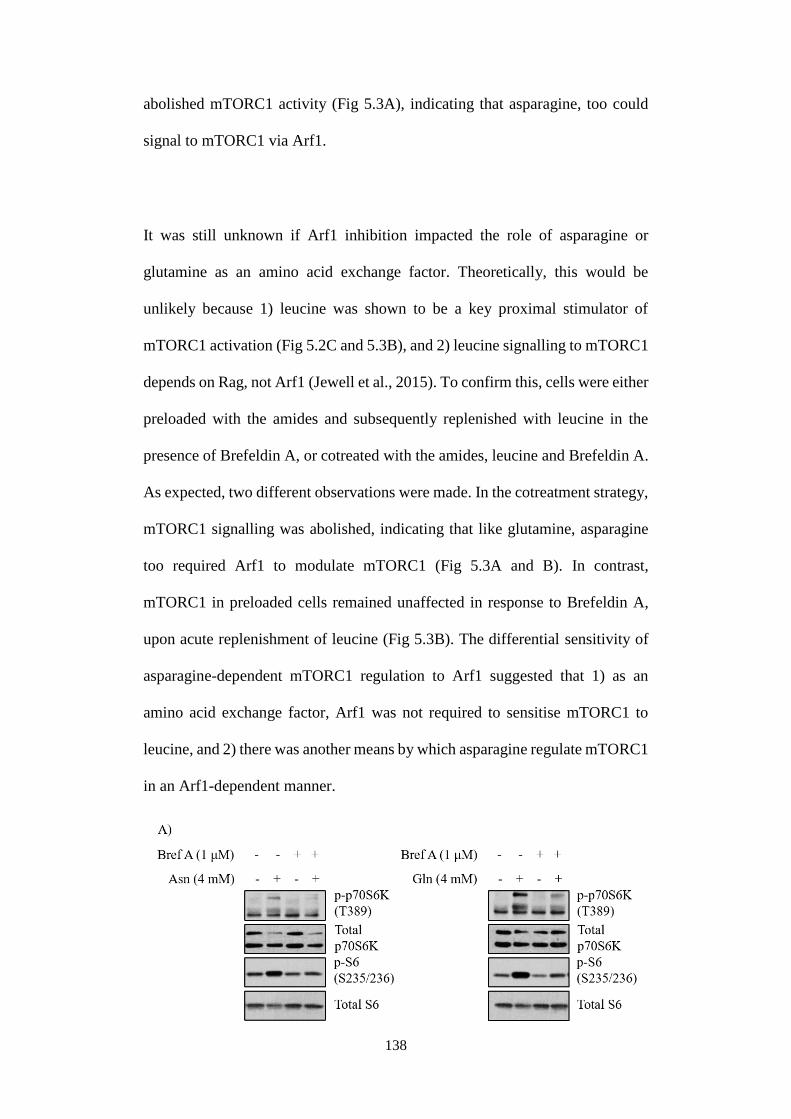
138
abolished mTORC1 activity (Fig 5.3A), indicating that asparagine, too could
signal to mTORC1 via Arf1.
It was still unknown if Arf1 inhibition impacted the role of asparagine or
glutamine as an amino acid exchange factor. Theoretically, this would be
unlikely because 1) leucine was shown to be a key proximal stimulator of
mTORC1 activation (Fig 5.2C and 5.3B), and 2) leucine signalling to mTORC1
depends on Rag, not Arf1 (Jewell et al., 2015). To confirm this, cells were either
preloaded with the amides and subsequently replenished with leucine in the
presence of Brefeldin A, or cotreated with the amides, leucine and Brefeldin A.
As expected, two different observations were made. In the cotreatment strategy,
mTORC1 signalling was abolished, indicating that like glutamine, asparagine
too required Arf1 to modulate mTORC1 (Fig 5.3A and B). In contrast,
mTORC1 in preloaded cells remained unaffected in response to Brefeldin A,
upon acute replenishment of leucine (Fig 5.3B). The differential sensitivity of
asparagine-dependent mTORC1 regulation to Arf1 suggested that 1) as an
amino acid exchange factor, Arf1 was not required to sensitise mTORC1 to
leucine, and 2) there was another means by which asparagine regulate mTORC1
in an Arf1-dependent manner.
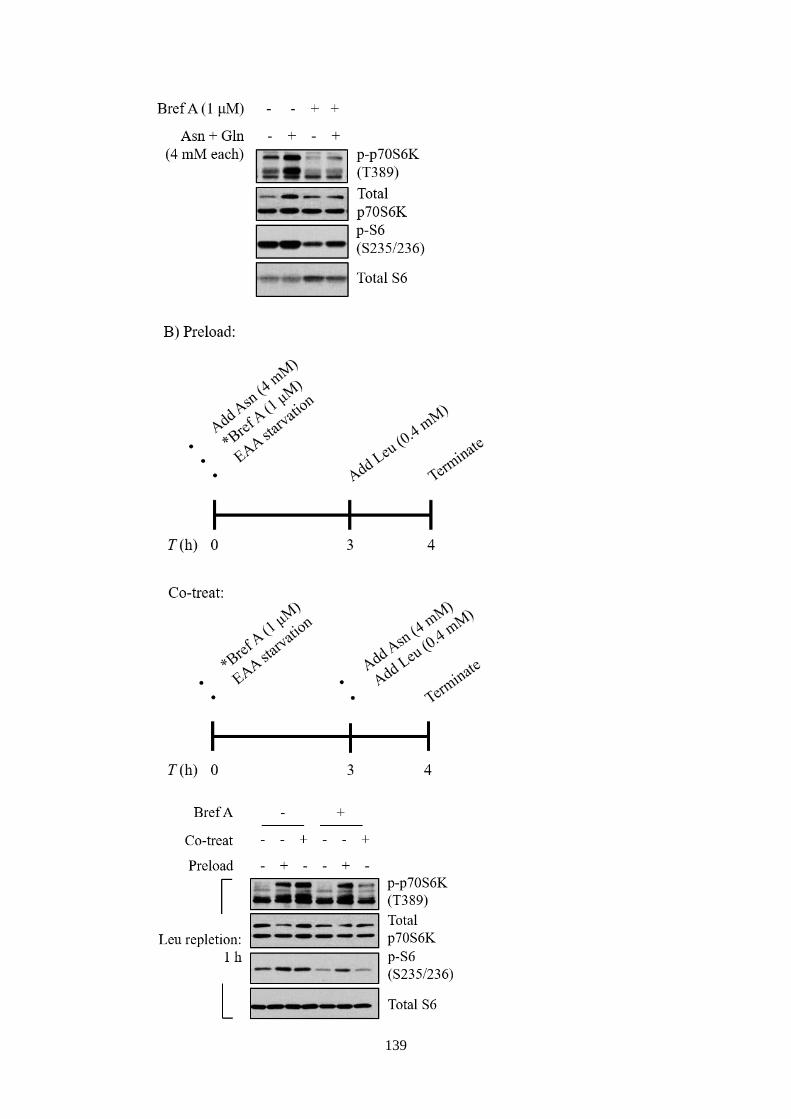
139
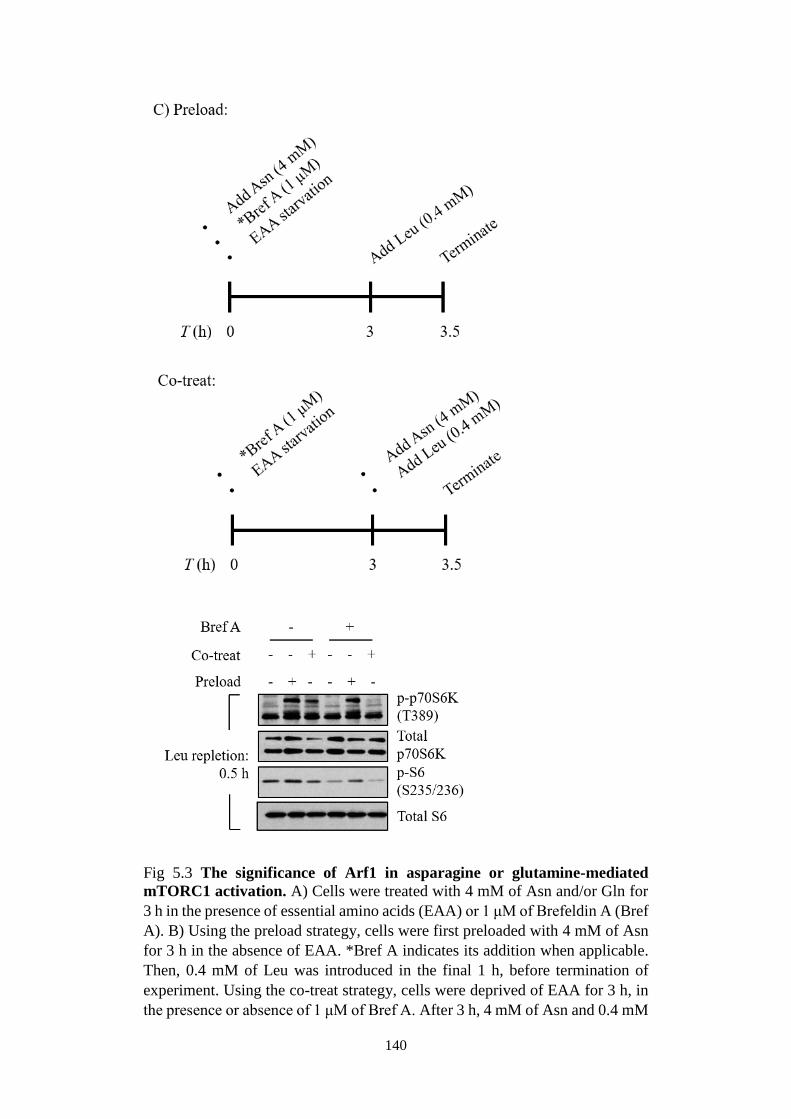
140
Fig 5.3 The significance of Arf1 in asparagine or glutamine-mediated
mTORC1 activation. A) Cells were treated with 4 mM of Asn and/or Gln for
3 h in the presence of essential amino acids (EAA) or 1 μM of Brefeldin A (Bref
A). B) Using the preload strategy, cells were first preloaded with 4 mM of Asn
for 3 h in the absence of EAA. *Bref A indicates its addition when applicable.
Then, 0.4 mM of Leu was introduced in the final 1 h, before termination of
experiment. Using the co-treat strategy, cells were deprived of EAA for 3 h, in
the presence or absence of 1 μM of Bref A. After 3 h, 4 mM of Asn and 0.4 mM
141
of Leu were added for 1 h, before termination of experiment. C) Experiments
were carried out as in (B), but terminated 30 min earlier.
5.2.4 Asparagine or glutamine mediated mTORC1 in sensing endogenous
amino acids, in an Akt and Arf1-dependent manner
Results discussed so far describe how 1) mTORC1 was activated by
extracellular essential amino acids that required intracellular accumulation of
asparagine or glutamine beforehand, and 2) Arf1 was dispensable in that
context. However, in a fed state when cells were not dependent on extracellular
essential amino acids for mTORC1 reactivation, the role of Arf1 became more
prominent. It was unknown if Arf1 was required to mediate mTORC1 sensing
of endogenous amino acids. To test the hypothesis, a system had to be first
established in which intracellular amino acids could be 1) manipulated readily,
and 2) quickly replenished without exogenous supplementation. To this end
cycloheximide, an inhibitor of global protein translation was employed. It is a
bacterially-produced toxin that binds to the E-site of 60S ribosomal subunit to
inhibit eukaryotic translation elongation factor (eEF)-2 mediated tRNA
translocation. By inhibiting ribosomal protein translation, amino acids are not
used for peptide synthesis thus increasing their endogenous pool (Watanabe-
Asano, Kuma, & Mizushima, 2014).
In HepG2 cells preloaded with asparagine under essential amino acids-starved
conditions, mTORC1 was reactivated upon cycloheximide introduction. This
was demonstrated by increased phosphorylation of mTORC1 direct targets,
p70S6K (T389), ULK1 (S757) and 4E-BP1 (S37/46) (Hara et al., 1998; J. Kim
142
et al., 2011). This was not observed in non-preloaded cells (Fig 5.4A). In this
experiment, it was noteworthy that cells were not exposed to extracellular
essential amino acids at any point in time, thus supporting the postulation that
asparagine or glutamine could also signal to mTORC1 via a second mechanism
that did not require their exchange for extracellular essential amino acids. It
could also be inferred that intracellular asparagine or glutamine aided mTORC1
sensing of endogenous amino acids. These observations were replicable in
HuH7 and human breast cancer cells MCF7. Preloading with glutamine also
achieved similar degree of mTORC1 activation in the presence of
cycloheximide (Fig 5.4B).
However, substituting asparagine and glutamine with aspartate or glutamate,
respectively could not reactivate mTORC1 (Fig 5.4C), demonstrating that only
their amides could mediate this signalling. Reactivation of mTORC1 upon
cycloheximide treatment in preloaded cells was abrogated when Arf1 was
inhibited (Fig 5.4D). This observation supported the hypothesis that Arf1 was
involved in asparagine and glutamine-dependent mTORC1 sensing of
endogenous amino acids.
Besides Arf1, Akt was also likely to play a role as well. Immunoblot analysis
indicated that under essential amino acids-starved conditions, Akt
phosphorylation was sustained in cells preloaded with asparagine or glutamine,
compared to non-preloaded ones (Fig 5.4A). Inhibition of Akt with MK2206
partially downregulated mTORC1 activities in this system (Fig 5.4F). A more
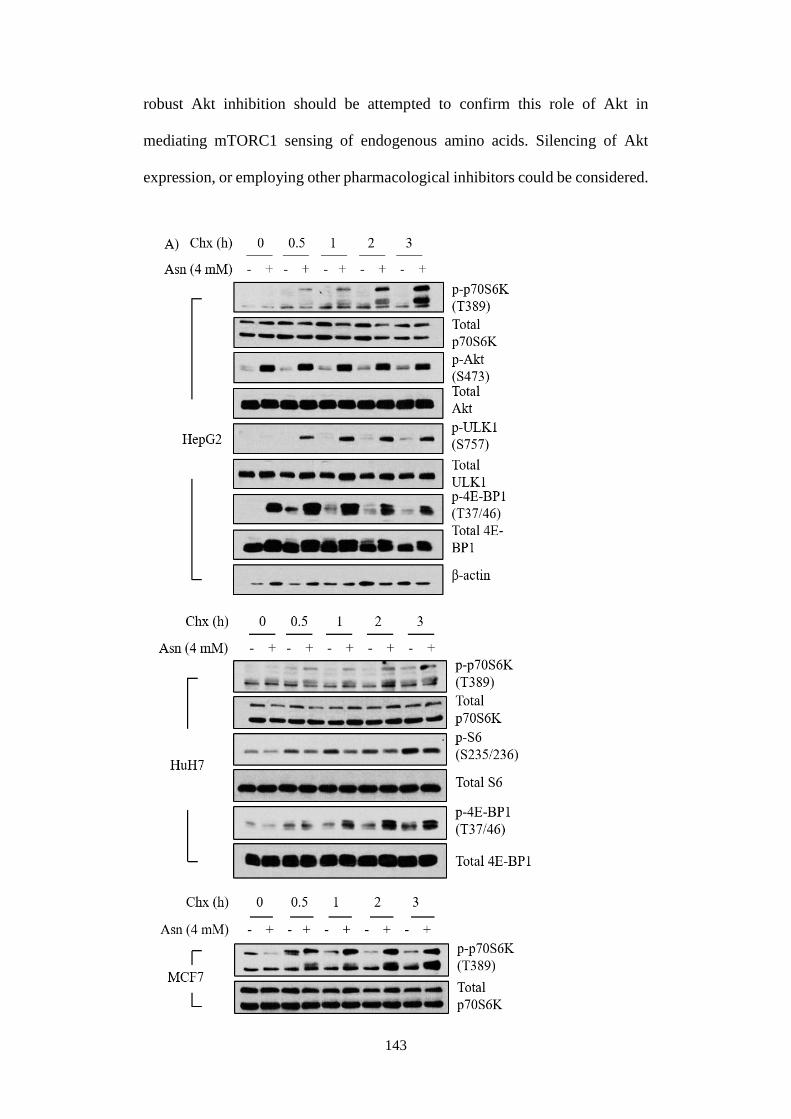
143
robust Akt inhibition should be attempted to confirm this role of Akt in
mediating mTORC1 sensing of endogenous amino acids. Silencing of Akt
expression, or employing other pharmacological inhibitors could be considered.
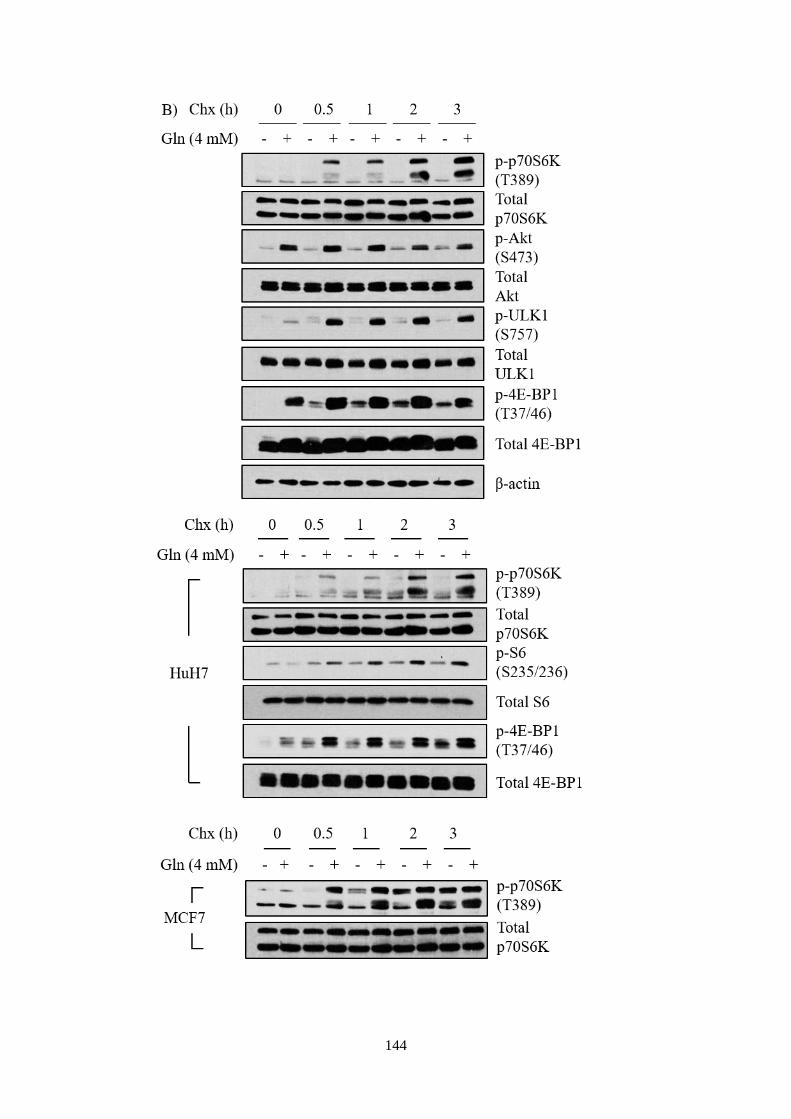
144
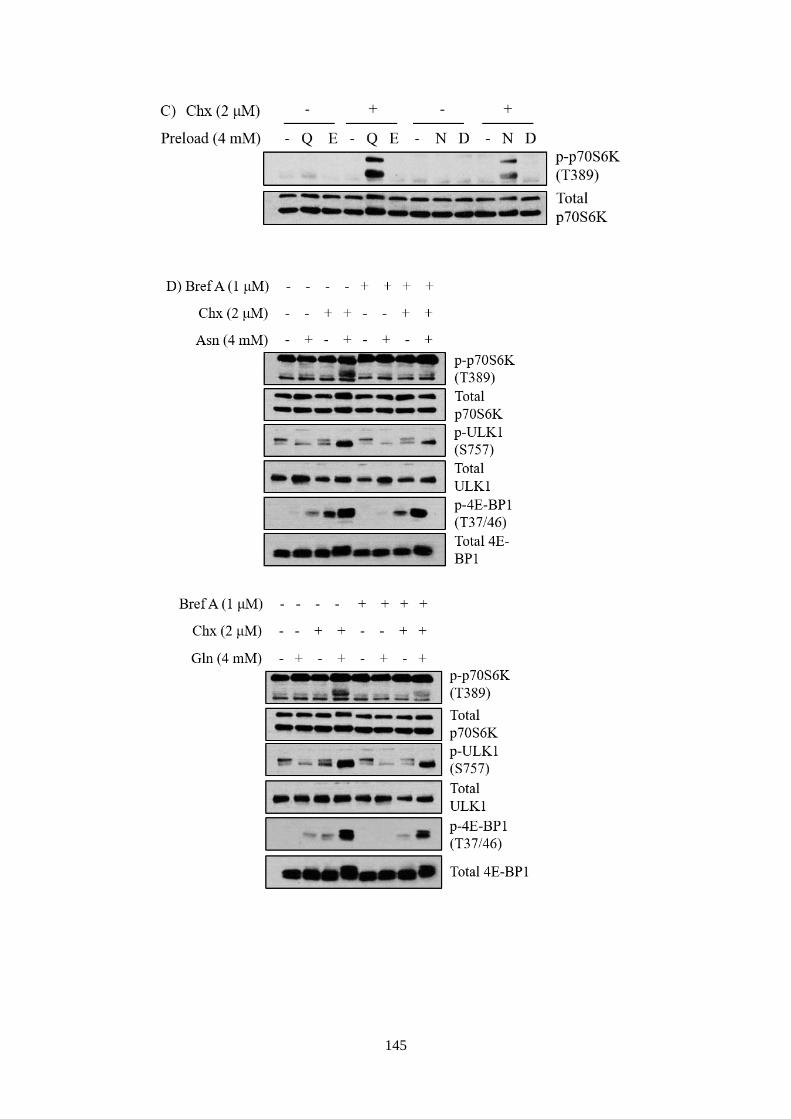
145
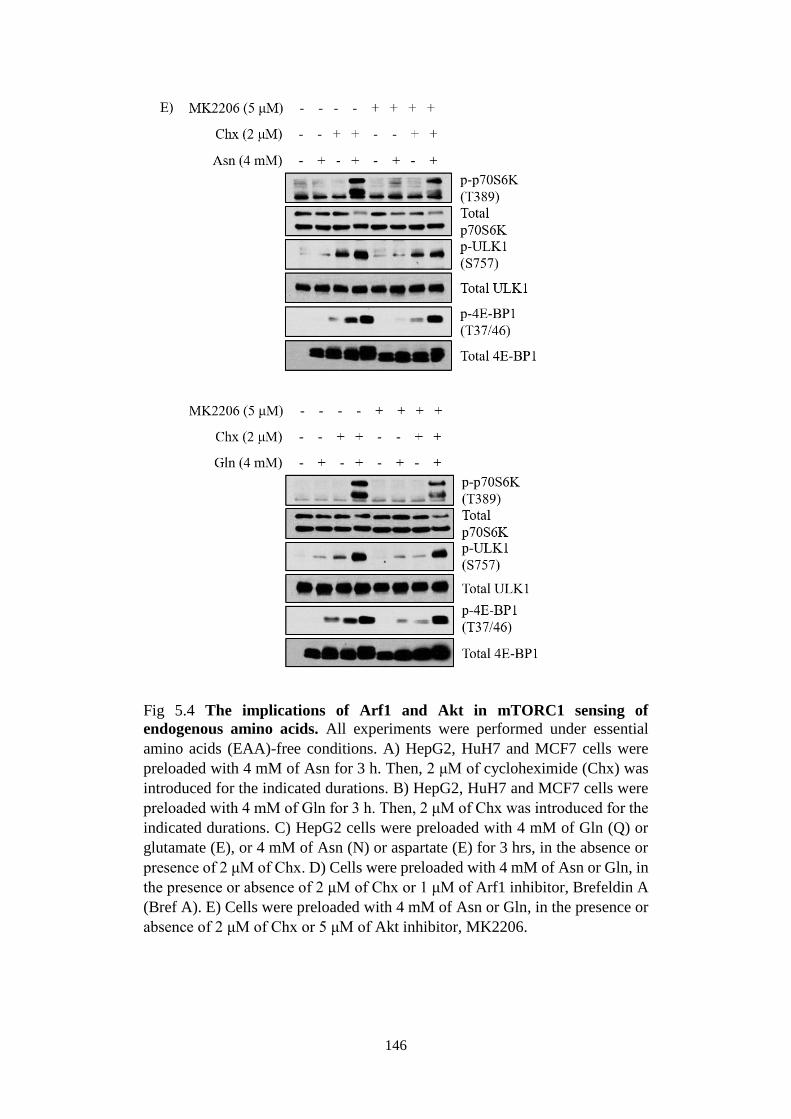
146
Fig 5.4 The implications of Arf1 and Akt in mTORC1 sensing of
endogenous amino acids. All experiments were performed under essential
amino acids (EAA)-free conditions. A) HepG2, HuH7 and MCF7 cells were
preloaded with 4 mM of Asn for 3 h. Then, 2 μM of cycloheximide (Chx) was
introduced for the indicated durations. B) HepG2, HuH7 and MCF7 cells were
preloaded with 4 mM of Gln for 3 h. Then, 2 μM of Chx was introduced for the
indicated durations. C) HepG2 cells were preloaded with 4 mM of Gln (Q) or
glutamate (E), or 4 mM of Asn (N) or aspartate (E) for 3 hrs, in the absence or
presence of 2 μM of Chx. D) Cells were preloaded with 4 mM of Asn or Gln, in
the presence or absence of 2 μM of Chx or 1 μM of Arf1 inhibitor, Brefeldin A
(Bref A). E) Cells were preloaded with 4 mM of Asn or Gln, in the presence or
absence of 2 μM of Chx or 5 μM of Akt inhibitor, MK2206.
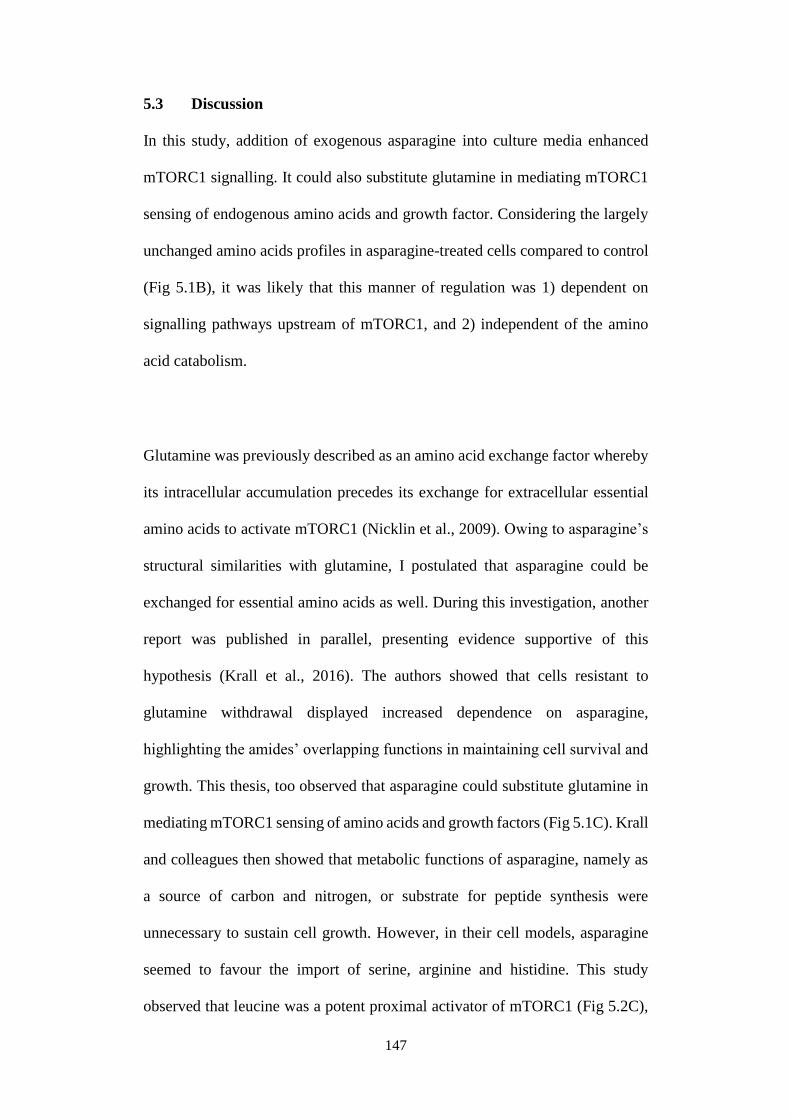
147
5.3 Discussion
In this study, addition of exogenous asparagine into culture media enhanced
mTORC1 signalling. It could also substitute glutamine in mediating mTORC1
sensing of endogenous amino acids and growth factor. Considering the largely
unchanged amino acids profiles in asparagine-treated cells compared to control
(Fig 5.1B), it was likely that this manner of regulation was 1) dependent on
signalling pathways upstream of mTORC1, and 2) independent of the amino
acid catabolism.
Glutamine was previously described as an amino acid exchange factor whereby
its intracellular accumulation precedes its exchange for extracellular essential
amino acids to activate mTORC1 (Nicklin et al., 2009). Owing to asparagine’s
structural similarities with glutamine, I postulated that asparagine could be
exchanged for essential amino acids as well. During this investigation, another
report was published in parallel, presenting evidence supportive of this
hypothesis (Krall et al., 2016). The authors showed that cells resistant to
glutamine withdrawal displayed increased dependence on asparagine,
highlighting the amides’ overlapping functions in maintaining cell survival and
growth. This thesis, too observed that asparagine could substitute glutamine in
mediating mTORC1 sensing of amino acids and growth factors (Fig 5.1C). Krall
and colleagues then showed that metabolic functions of asparagine, namely as
a source of carbon and nitrogen, or substrate for peptide synthesis were
unnecessary to sustain cell growth. However, in their cell models, asparagine
seemed to favour the import of serine, arginine and histidine. This study
observed that leucine was a potent proximal activator of mTORC1 (Fig 5.2C),
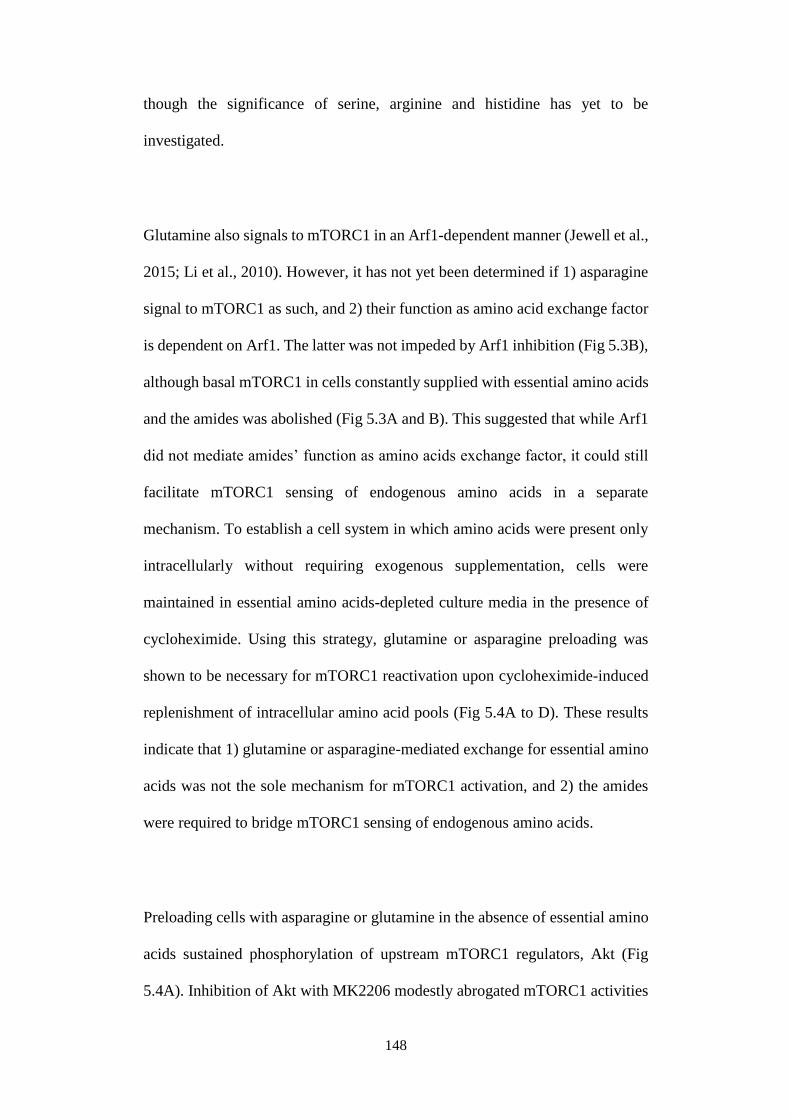
148
though the significance of serine, arginine and histidine has yet to be
investigated.
Glutamine also signals to mTORC1 in an Arf1-dependent manner (Jewell et al.,
2015; Li et al., 2010). However, it has not yet been determined if 1) asparagine
signal to mTORC1 as such, and 2) their function as amino acid exchange factor
is dependent on Arf1. The latter was not impeded by Arf1 inhibition (Fig 5.3B),
although basal mTORC1 in cells constantly supplied with essential amino acids
and the amides was abolished (Fig 5.3A and B). This suggested that while Arf1
did not mediate amides’ function as amino acids exchange factor, it could still
facilitate mTORC1 sensing of endogenous amino acids in a separate
mechanism. To establish a cell system in which amino acids were present only
intracellularly without requiring exogenous supplementation, cells were
maintained in essential amino acids-depleted culture media in the presence of
cycloheximide. Using this strategy, glutamine or asparagine preloading was
shown to be necessary for mTORC1 reactivation upon cycloheximide-induced
replenishment of intracellular amino acid pools (Fig 5.4A to D). These results
indicate that 1) glutamine or asparagine-mediated exchange for essential amino
acids was not the sole mechanism for mTORC1 activation, and 2) the amides
were required to bridge mTORC1 sensing of endogenous amino acids.
Preloading cells with asparagine or glutamine in the absence of essential amino
acids sustained phosphorylation of upstream mTORC1 regulators, Akt (Fig
5.4A). Inhibition of Akt with MK2206 modestly abrogated mTORC1 activities
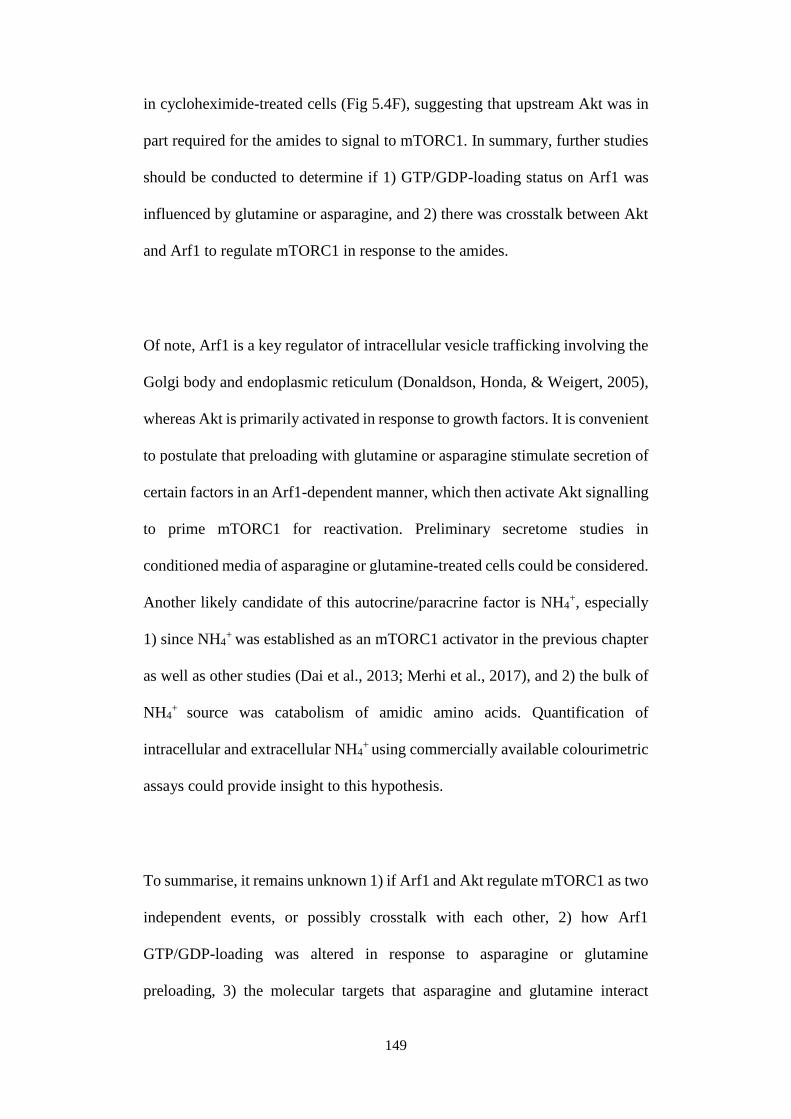
149
in cycloheximide-treated cells (Fig 5.4F), suggesting that upstream Akt was in
part required for the amides to signal to mTORC1. In summary, further studies
should be conducted to determine if 1) GTP/GDP-loading status on Arf1 was
influenced by glutamine or asparagine, and 2) there was crosstalk between Akt
and Arf1 to regulate mTORC1 in response to the amides.
Of note, Arf1 is a key regulator of intracellular vesicle trafficking involving the
Golgi body and endoplasmic reticulum (Donaldson, Honda, & Weigert, 2005),
whereas Akt is primarily activated in response to growth factors. It is convenient
to postulate that preloading with glutamine or asparagine stimulate secretion of
certain factors in an Arf1-dependent manner, which then activate Akt signalling
to prime mTORC1 for reactivation. Preliminary secretome studies in
conditioned media of asparagine or glutamine-treated cells could be considered.
Another likely candidate of this autocrine/paracrine factor is NH4+, especially
1) since NH4+ was established as an mTORC1 activator in the previous chapter
as well as other studies (Dai et al., 2013; Merhi et al., 2017), and 2) the bulk of
NH4+ source was catabolism of amidic amino acids. Quantification of
intracellular and extracellular NH4+ using commercially available colourimetric
assays could provide insight to this hypothesis.
To summarise, it remains unknown 1) if Arf1 and Akt regulate mTORC1 as two
independent events, or possibly crosstalk with each other, 2) how Arf1
GTP/GDP-loading was altered in response to asparagine or glutamine
preloading, 3) the molecular targets that asparagine and glutamine interact
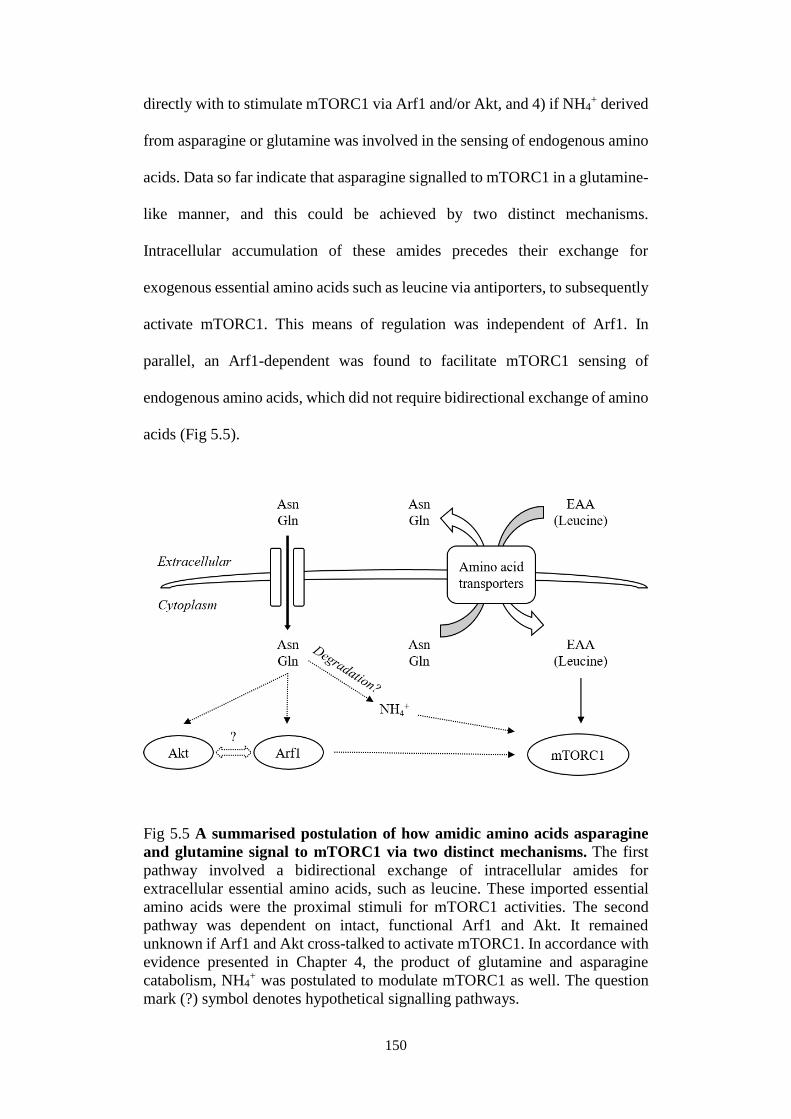
150
directly with to stimulate mTORC1 via Arf1 and/or Akt, and 4) if NH4+ derived
from asparagine or glutamine was involved in the sensing of endogenous amino
acids. Data so far indicate that asparagine signalled to mTORC1 in a glutamine-
like manner, and this could be achieved by two distinct mechanisms.
Intracellular accumulation of these amides precedes their exchange for
exogenous essential amino acids such as leucine via antiporters, to subsequently
activate mTORC1. This means of regulation was independent of Arf1. In
parallel, an Arf1-dependent was found to facilitate mTORC1 sensing of
endogenous amino acids, which did not require bidirectional exchange of amino
acids (Fig 5.5).
Fig 5.5 A summarised postulation of how amidic amino acids asparagine
and glutamine signal to mTORC1 via two distinct mechanisms. The first
pathway involved a bidirectional exchange of intracellular amides for
extracellular essential amino acids, such as leucine. These imported essential
amino acids were the proximal stimuli for mTORC1 activities. The second
pathway was dependent on intact, functional Arf1 and Akt. It remained
unknown if Arf1 and Akt cross-talked to activate mTORC1. In accordance with
evidence presented in Chapter 4, the product of glutamine and asparagine
catabolism, NH4+ was postulated to modulate mTORC1 as well. The question
mark (?) symbol denotes hypothetical signalling pathways.
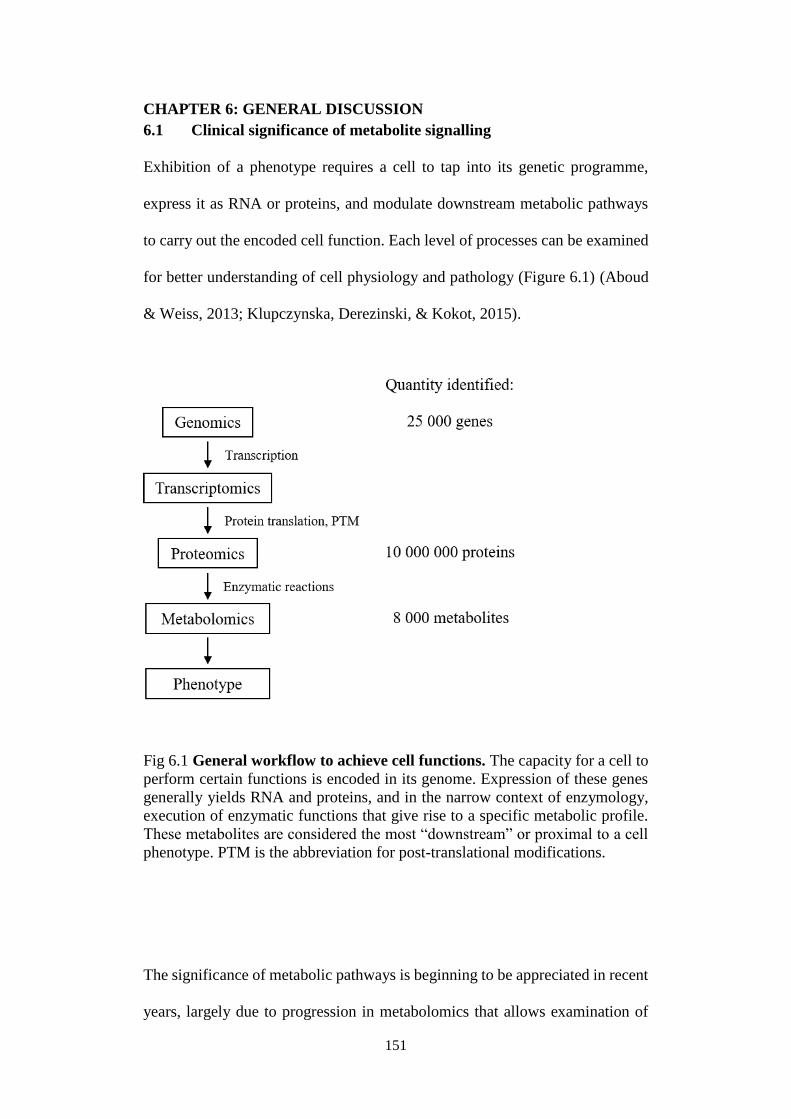
151
CHAPTER 6: GENERAL DISCUSSION
6.1 Clinical significance of metabolite signalling
Exhibition of a phenotype requires a cell to tap into its genetic programme,
express it as RNA or proteins, and modulate downstream metabolic pathways
to carry out the encoded cell function. Each level of processes can be examined
for better understanding of cell physiology and pathology (Figure 6.1) (Aboud
& Weiss, 2013; Klupczynska, Derezinski, & Kokot, 2015).
Fig 6.1 General workflow to achieve cell functions. The capacity for a cell to
perform certain functions is encoded in its genome. Expression of these genes
generally yields RNA and proteins, and in the narrow context of enzymology,
execution of enzymatic functions that give rise to a specific metabolic profile.
These metabolites are considered the most “downstream” or proximal to a cell
phenotype. PTM is the abbreviation for post-translational modifications.
The significance of metabolic pathways is beginning to be appreciated in recent
years, largely due to progression in metabolomics that allows examination of
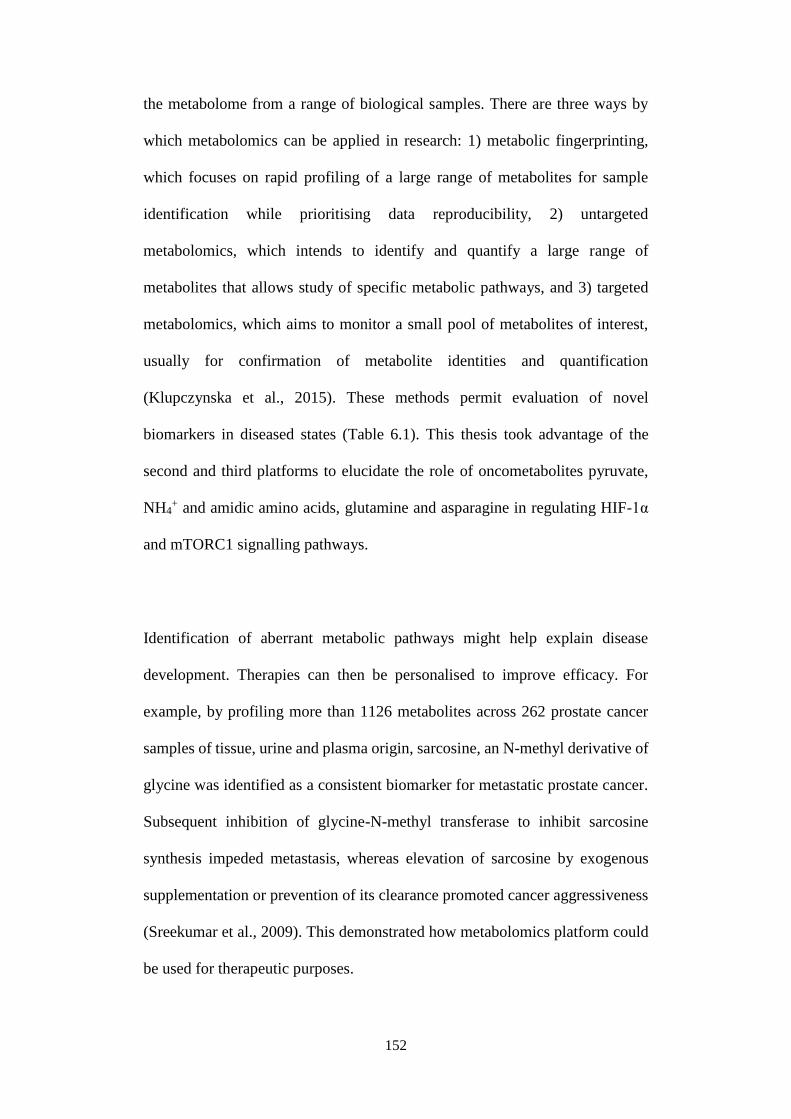
152
the metabolome from a range of biological samples. There are three ways by
which metabolomics can be applied in research: 1) metabolic fingerprinting,
which focuses on rapid profiling of a large range of metabolites for sample
identification while prioritising data reproducibility, 2) untargeted
metabolomics, which intends to identify and quantify a large range of
metabolites that allows study of specific metabolic pathways, and 3) targeted
metabolomics, which aims to monitor a small pool of metabolites of interest,
usually for confirmation of metabolite identities and quantification
(Klupczynska et al., 2015). These methods permit evaluation of novel
biomarkers in diseased states (Table 6.1). This thesis took advantage of the
second and third platforms to elucidate the role of oncometabolites pyruvate,
NH4+ and amidic amino acids, glutamine and asparagine in regulating HIF-1α
and mTORC1 signalling pathways.
Identification of aberrant metabolic pathways might help explain disease
development. Therapies can then be personalised to improve efficacy. For
example, by profiling more than 1126 metabolites across 262 prostate cancer
samples of tissue, urine and plasma origin, sarcosine, an N-methyl derivative of
glycine was identified as a consistent biomarker for metastatic prostate cancer.
Subsequent inhibition of glycine-N-methyl transferase to inhibit sarcosine
synthesis impeded metastasis, whereas elevation of sarcosine by exogenous
supplementation or prevention of its clearance promoted cancer aggressiveness
(Sreekumar et al., 2009). This demonstrated how metabolomics platform could
be used for therapeutic purposes.
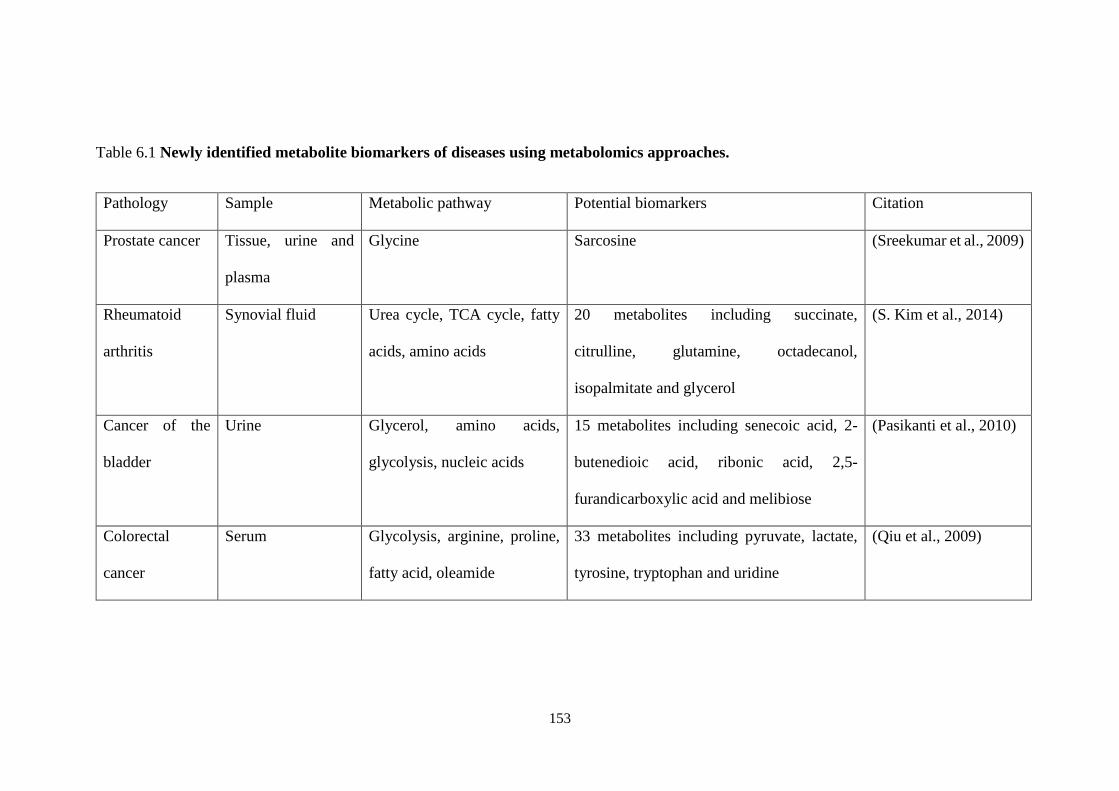
153
Table 6.1 Newly identified metabolite biomarkers of diseases using metabolomics approaches.
Pathology Sample Metabolic pathway Potential biomarkers Citation
Prostate cancer Tissue, urine and
plasma
Glycine Sarcosine (Sreekumar et al., 2009)
Rheumatoid
arthritis
Synovial fluid Urea cycle, TCA cycle, fatty
acids, amino acids
20 metabolites including succinate,
citrulline, glutamine, octadecanol,
isopalmitate and glycerol
(S. Kim et al., 2014)
Cancer of the
bladder
Urine Glycerol, amino acids,
glycolysis, nucleic acids
15 metabolites including senecoic acid, 2-
butenedioic acid, ribonic acid, 2,5-
furandicarboxylic acid and melibiose
(Pasikanti et al., 2010)
Colorectal
cancer
Serum Glycolysis, arginine, proline,
fatty acid, oleamide
33 metabolites including pyruvate, lactate,
tyrosine, tryptophan and uridine
(Qiu et al., 2009)
154
HCC Serum, urine Bile acids, free fatty acids,
glycolysis, urea cycle,
methionine
Bile acids, histidine, inosine (T. Chen et al., 2011)
Diabetes Urine, plasma,
tissue
Amino acids (particularly
BCAA)
Isoleucine, leucine, valine, tyrosine and
phenylalanine
(Friedrich, 2012)
155
On its own, metabolomics are largely restricted to 1) distinguishing pathological
states from normal basal, 2) identifying metabolic pathways implicated in
disease development, and 3) being used for designing interventions. To obtain
a more holistic understanding of cell physiology, metabolomics must be read in
parallel with other “-omics”. Although metabolites are frequently perceived as
downstream “consequences”, evidences suggest that they function as upstream
stimuli capable of manipulating cell functions. Histone modifiers such as TET
and lysine demethylase 4C (KDM4C) enzymes belonging to the 2-oxoglutarate
dependent dioxygenase family are amenable to fluctuations to endogenous
abundance of α-KG and its structural analogues, resulting in changes to gene
expression and epigenetics landscape (Harris, 2015; Vissers, Kuiper, & Dachs,
2014). Ammonia derived from glutaminolysis have been shown to stimulate
autophagy to ensure survival under nutrient and energy stress conditions
(Cheong et al., 2011; C. H. Eng & Abraham, 2010). Relying on metabolomics
alone prevents assessment of such crosstalk, although this shortcoming can be
circumvented by integrating the various “-omics”.
6.2 Conclusion
This thesis illustrates how oncometabolites function as signalling molecules to
induce oncogenic signalling pathways. Pyruvate increased HIF-1α protein level
by downregulating the activities of PHDs, a key component of HIF-1α
degradation machinery. This was independent of ROS and intracellular oxygen
deprivation (Fig 3.2). GC-MS analysis showed that abundance of
oncometabolites that are structural analogues of α-KG, in addition to α-KG itself
was robustly upregulated in pyruvate-treated cells (Fig 3.4). Thus, competitive
156
inhibition of PHDs was unlikely. Despite the near 9-fold increase in α-KG level,
further addition of α-KG relieved HIF-1α stabilisation, implying that α-KG was
somehow limiting to the PHDs (Fig 3.5). This paradox may be reconciled should
α-KG be sequestered in the mitochondria, away from the largely cytoplasmic
and nuclear PHDs. However, technical difficulties prevented accurate profiling
of α-KG in mitochondrial and cytoplasmic compartments. Pyruvate-induced
HIF-1α stabilisation could be reversed by supplementing cells with 1) malate,
or 2) lysine. This rescue effect was likely achieved by two distinct mechanisms.
Malate activated the malate-aspartate shuttle and robustly reduced HIF-1α
protein level to low basal without changes to metabolic profiles, further
suggesting that allocation of α-KG, not net abundance of α-KG was important
in regulating PHDs activities in this cell context (Fig 3.6). Lysine on the other
hand restored TCA cycle homeostasis by scavenging excess α-KG, thus
relieving metabolic stress that induced HIF-1α stabilisation (Fig 3.7).
Incubating cells with NH4+ at low millimolar concentrations that are correlated
with pathological states in vivo sensitised mTORC1 to amino acids and growth
factor (Fig 4.2). This catalyst-like property sustained basal mTORC1 activity
even in the absence of essential amino acids (with glutamine supplementation)
(Fig 4.3). In these cells, GC-MS detected partial replenishment of essential
amino acids pool, a possible indication of autophagy induction (Onodera &
Ohsumi, 2005) (Fig 4.4). Whether autophagy was triggered by essential amino
acids withdrawal or NH4+ remained to be investigated. Data also suggested that
a functional upstream Src/Akt signalling axis was required to mediate NH4+-
induced mTORC1 activation (Fig 4.5), although more work should be done to
157
confirm 1) if Src/Akt itself was upregulated in response to NH4+, and 2) the role
of Na+, K+-ATPase in binding extracellular NH4+ to initiate downstream
mTORC1 activation.
Accumulation of intracellular asparagine and glutamine was also found to be
necessary for mTORC1 to “sense” amino acids and growth factors. It was still
unknown if their catabolism and subsequent release of free ammonia was
required for this function. These amides mediated mTORC1 activation by 1)
exchanging with extracellular essential amino acids such as leucine, in an Arf1-
independent manner (Fig 5.2 and 5.3), or 2) promoting sensing of endogenous
amino acids in an Arf1- and Akt-dependent manner (Fig 5.4). The collective
findings are summarised in Fig 6.2.
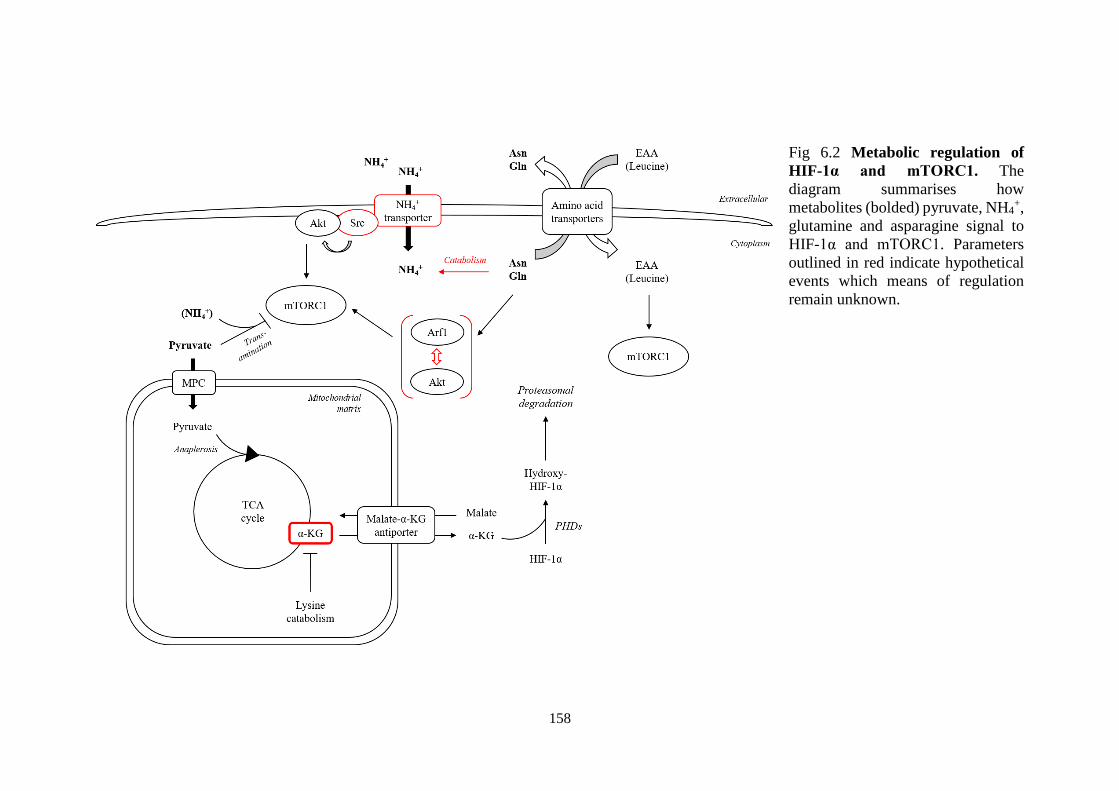
158
Fig 6.2 Metabolic regulation of
HIF-1α and mTORC1. The
diagram summarises how
metabolites (bolded) pyruvate, NH4+,
glutamine and asparagine signal to
HIF-1α and mTORC1. Parameters
outlined in red indicate hypothetical
events which means of regulation
remain unknown.
159
6.3 Future work
The mechanisms reported in this thesis are proof-of-concept of how carbon and
nitrogen metabolites could influence cell signalling. To fully encapsulate the
impact of these metabolites in a more physiological manner, reproducibility of
these results should be attempted across a range of biological models. Cancer
cell lines known to harbour higher levels of these endogenous metabolites, or
genetically modified to mimic these conditions could be used. For example,
cells engineered to overexpress pyruvate carboxylase, or silencing of α-KGDH
could be used to artificially raise mitochondrial α-KG levels to study its effects
on HIF-1α stabilisation. Certain subtypes of breast, lung and liver cancers are
known to harbour high expression levels of pyruvate carboxylase (Fan et al.,
2009; Forbes et al., 2006; K. J. Liu et al., 1991), thus could also be adopted as
cell models. Tumours addicted to glutaminolysis, addition of asparaginase or
glutaminase in culture media, or genetically modified to overexpress those
enzymes might also be representative of hyperammonaemic, NH4+-treated cells
(Chance et al., 1988; Harder et al., 2014; Heitink-Polle et al., 2013).
These experiments could then be attempted in an in vivo system. This is
important because 1) metabolic pathways are rarely localised or unique to a
specific organ or tissue, 2) metabolites are circulated to distal locations, and 3)
interorgan metabolism is central to proper whole-body function. Thus,
investigating metabolic events in a viable organism might lead to discovery of
previously undetectable phenotypes, compared to when tests were restricted to
a homogenous cell culture environment.
160
Understanding cancer biology from a metabolism angle offers insights into
cotreatment strategies. Currently, very few FDA-approved cancer therapies
target metabolic pathways, due to inadequate understanding of cancer
metabolism and the dangers presented by targeting them, as metabolic
reprogramming also happens in non-transformed but highly proliferative cells
(Galluzzi, Kepp, Vander Heiden, & Kroemer, 2013). It is possible that with
careful optimisation, reduced toxicity and a more targeted approach could be
achieved when used in concert with therapies targeting oncogenic signalling
pathways. Because oncometabolites can influence distant cells in a paracrine or
autocrine manner, impeding these signals might also reduce cancer
aggressiveness.
161
REFERENCES
Aboud, O. A., & Weiss, R. H. (2013). New opportunities from the cancer
metabolome. Clin Chem, 59(1), 138-146.
doi:10.1373/clinchem.2012.184598
Alessi, D. R., James, S. R., Downes, C. P., Holmes, A. B., Gaffney, P. R., Reese,
C. B., & Cohen, P. (1997). Characterization of a 3-phosphoinositide-
dependent protein kinase which phosphorylates and activates protein
kinase Balpha. Curr Biol, 7(4), 261-269.
Aruoma, O. I., Halliwell, B., Hoey, B. M., & Butler, J. (1989). The antioxidant
action of N-acetylcysteine: its reaction with hydrogen peroxide,
hydroxyl radical, superoxide, and hypochlorous acid. Free Radic Biol
Med, 6(6), 593-597.
Averous, J., Lambert-Langlais, S., Mesclon, F., Carraro, V., Parry, L., Jousse,
C., . . . Fafournoux, P. (2016). GCN2 contributes to mTORC1 inhibition
by leucine deprivation through an ATF4 independent mechanism. Sci
Rep, 6, 27698. doi:10.1038/srep27698
Baddela, V. S., Baufeld, A., Yenuganti, V. R., Vanselow, J., & Singh, D. (2014).
Suitable housekeeping genes for normalization of transcript abundance
analysis by real-time RT-PCR in cultured bovine granulosa cells during
hypoxia and differential cell plating density. Reprod Biol Endocrinol,
12, 118. doi:10.1186/1477-7827-12-118
Balasubramanian, M. N., Butterworth, E. A., & Kilberg, M. S. (2013).
Asparagine synthetase: regulation by cell stress and involvement in
tumor biology. Am J Physiol Endocrinol Metab, 304(8), E789-799.
doi:10.1152/ajpendo.00015.2013
Bar-Peled, L., Chantranupong, L., Cherniack, A. D., Chen, W. W., Ottina, K.
A., Grabiner, B. C., . . . Sabatini, D. M. (2013). A Tumor suppressor
complex with GAP activity for the Rag GTPases that signal amino acid
sufficiency to mTORC1. Science, 340(6136), 1100-1106.
doi:10.1126/science.1232044
Bar-Peled, L., & Sabatini, D. M. (2014). Regulation of mTORC1 by amino
acids. Trends Cell Biol, 24(7), 400-406. doi:10.1016/j.tcb.2014.03.003
Bar-Peled, L., Schweitzer, L. D., Zoncu, R., & Sabatini, D. M. (2012). Ragulator
is a GEF for the rag GTPases that signal amino acid levels to mTORC1.
Cell, 150(6), 1196-1208. doi:10.1016/j.cell.2012.07.032
Bergstrom, J., Furst, P., Noree, L. O., & Vinnars, E. (1974). Intracellular free
amino acid concentration in human muscle tissue. J Appl Physiol, 36(6),
693-697.
Bernardi, P., Angrilli, A., & Azzone, G. F. (1990). A gated pathway for
electrophoretic Na+ fluxes in rat liver mitochondria. Regulation by
surface Mg2+. Eur J Biochem, 188(1), 91-97.
Bierl, C., Voetsch, B., Jin, R. C., Handy, D. E., & Loscalzo, J. (2004).
Determinants of human plasma glutathione peroxidase (GPx-3)
expression. J Biol Chem, 279(26), 26839-26845.
doi:10.1074/jbc.M401907200
162
Birsoy, K., Wang, T., Chen, W. W., Freinkman, E., Abu-Remaileh, M., &
Sabatini, D. M. (2015). An Essential Role of the Mitochondrial Electron
Transport Chain in Cell Proliferation Is to Enable Aspartate Synthesis.
Cell, 162(3), 540-551. doi:10.1016/j.cell.2015.07.016
Blaustein, M. P., Juhaszova, M., & Golovina, V. A. (1998). The cellular
mechanism of action of cardiotonic steroids: a new hypothesis. Clin Exp
Hypertens, 20(5-6), 691-703.
Boll, M., Foltz, M., Rubio-Aliaga, I., Kottra, G., & Daniel, H. (2002).
Functional characterization of two novel mammalian electrogenic
proton-dependent amino acid cotransporters. J Biol Chem, 277(25),
22966-22973. doi:10.1074/jbc.M200374200
Brand, M. D., & Nicholls, D. G. (2011). Assessing mitochondrial dysfunction
in cells. Biochem J, 435(2), 297-312. doi:10.1042/BJ20110162
Bricker, D. K., Taylor, E. B., Schell, J. C., Orsak, T., Boutron, A., Chen, Y. C.,
. . . Rutter, J. (2012). A mitochondrial pyruvate carrier required for
pyruvate uptake in yeast, Drosophila, and humans. Science, 337(6090),
96-100. doi:10.1126/science.1218099
Brunelle, J. K., Bell, E. L., Quesada, N. M., Vercauteren, K., Tiranti, V.,
Zeviani, M., . . . Chandel, N. S. (2005). Oxygen sensing requires
mitochondrial ROS but not oxidative phosphorylation. Cell Metab, 1(6),
409-414. doi:10.1016/j.cmet.2005.05.002
Bunney, T. D., & Katan, M. (2010). Phosphoinositide signalling in cancer:
beyond PI3K and PTEN. Nat Rev Cancer, 10(5), 342-352.
doi:10.1038/nrc2842
Calvisi, D. F., Wang, C., Ho, C., Ladu, S., Lee, S. A., Mattu, S., . . . Evert, M.
(2011). Increased lipogenesis, induced by AKT-mTORC1-RPS6
signaling, promotes development of human hepatocellular carcinoma.
Gastroenterology, 140(3), 1071-1083.
doi:10.1053/j.gastro.2010.12.006
Capiaumont, J., Legrand, C., Carbonell, D., Dousset, B., Belleville, F., & Nabet,
P. (1995). Methods for reducing the ammonia in hybridoma cell
cultures. J Biotechnol, 39(1), 49-58.
Cardelli, J. A., Richardson, J., & Miears, D. (1989). Role of acidic intracellular
compartments in the biosynthesis of Dictyostelium lysosomal enzymes.
The weak bases ammonium chloride and chloroquine differentially
affect proteolytic processing and sorting. J Biol Chem, 264(6), 3454-
3463.
Carrascosa, J. M., Martinez, P., & Nunez de Castro, I. (1982). [Blood ammonia
in mice bearing Ehrlich ascites tumors]. Rev Esp Fisiol, 38 Suppl, 195-
198.
Carrascosa, J. M., Martinez, P., & Nunez de Castro, I. (1984). Nitrogen
movement between host and tumor in mice inoculated with Ehrlich
ascitic tumor cells. Cancer Res, 44(9), 3831-3835.
Carreau, A., El Hafny-Rahbi, B., Matejuk, A., Grillon, C., & Kieda, C. (2011).
Why is the partial oxygen pressure of human tissues a crucial parameter?
Small molecules and hypoxia. J Cell Mol Med, 15(6), 1239-1253.
doi:10.1111/j.1582-4934.2011.01258.x
Cha, S. T., Chen, P. S., Johansson, G., Chu, C. Y., Wang, M. Y., Jeng, Y. M., .
. . Kuo, M. L. (2010). MicroRNA-519c suppresses hypoxia-inducible
163
factor-1alpha expression and tumor angiogenesis. Cancer Res, 70(7),
2675-2685. doi:10.1158/0008-5472.CAN-09-2448
Chance, W. T., Cao, L., Foley-Nelson, T., Nelson, J. L., & Fischer, J. E. (1989).
Possible role of ammonia in experimental cancer anorexia. Brain Res,
486(2), 316-324.
Chance, W. T., Cao, L., Nelson, J. L., Foley-Nelson, T., & Fischer, J. E. (1988).
Hyperammonemia in anorectic tumor-bearing rats. Life Sci, 43(1), 67-
74.
Chandel, N. S., McClintock, D. S., Feliciano, C. E., Wood, T. M., Melendez, J.
A., Rodriguez, A. M., & Schumacker, P. T. (2000). Reactive oxygen
species generated at mitochondrial complex III stabilize hypoxia-
inducible factor-1alpha during hypoxia: a mechanism of O2 sensing. J
Biol Chem, 275(33), 25130-25138. doi:10.1074/jbc.M001914200
Chauvin, C., Koka, V., Nouschi, A., Mieulet, V., Hoareau-Aveilla, C., Dreazen,
A., . . . Pende, M. (2014). Ribosomal protein S6 kinase activity controls
the ribosome biogenesis transcriptional program. Oncogene, 33(4), 474-
483. doi:10.1038/onc.2012.606
Chen, T., Xie, G., Wang, X., Fan, J., Qiu, Y., Zheng, X., . . . Jia, W. (2011).
Serum and urine metabolite profiling reveals potential biomarkers of
human hepatocellular carcinoma. Mol Cell Proteomics, 10(7), M110
004945. doi:10.1074/mcp.M110.004945
Chen, Z., Kennedy, D. J., Wake, K. A., Zhuang, L., Ganapathy, V., & Thwaites,
D. T. (2003). Structure, tissue expression pattern, and function of the
amino acid transporter rat PAT2. Biochem Biophys Res Commun,
304(4), 747-754.
Cheong, H., Lindsten, T., Wu, J., Lu, C., & Thompson, C. B. (2011). Ammonia-
induced autophagy is independent of ULK1/ULK2 kinases. Proc Natl
Acad Sci U S A, 108(27), 11121-11126. doi:10.1073/pnas.1107969108
Cheong, H., Lu, C., Lindsten, T., & Thompson, C. B. (2012). Therapeutic
targets in cancer cell metabolism and autophagy. Nat Biotechnol, 30(7),
671-678. doi:10.1038/nbt.2285
Chin, R. M., Fu, X., Pai, M. Y., Vergnes, L., Hwang, H., Deng, G., . . . Huang,
J. (2014). The metabolite alpha-ketoglutarate extends lifespan by
inhibiting ATP synthase and TOR. Nature, 510(7505), 397-401.
doi:10.1038/nature13264
Chiu, M. I., Katz, H., & Berlin, V. (1994). RAPT1, a mammalian homolog of
yeast Tor, interacts with the FKBP12/rapamycin complex. Proc Natl
Acad Sci U S A, 91(26), 12574-12578.
Christen, S., Lorendeau, D., Schmieder, R., Broekaert, D., Metzger, K., Veys,
K., . . . Fendt, S. M. (2016). Breast Cancer-Derived Lung Metastases
Show Increased Pyruvate Carboxylase-Dependent Anaplerosis. Cell
Rep, 17(3), 837-848. doi:10.1016/j.celrep.2016.09.042
CST (2015a). Phospho-Raptor (Ser792) Antibody. Retrieved from Cell
Signaling Technology website:
https://media.cellsignal.com/pdf/2083.pdf
CST (2015b). Phospho-ULK1 (Ser757) (D7O6U) Rabbit mAb. Retrieved from
Cell Signaling Technology website:
https://media.cellsignal.com/pdf/6888.pdf
164
CST (2015c). p70 S6 Kinase (49D7) Rabbit mAb. Retrieved from Cell
Signaling Technology website:
https://media.cellsignal.com/pdf/2708.pdf
CST (2015d). S6 Ribosomal Protein (5G10) Rabbit mAb. Retrieved from Cell
Signaling Technology website:
https://media.cellsignal.com/pdf/2217.pdf
CST (2016a). Phospho-AS160 (Thr642) (D27E6) Rabbit mAb. Retrieved from
Cell Signaling Technology website:
https://media.cellsignal.com/pdf/8881.pdf
CST (2016b). Phospho-p70 S6 Kinase (Thr389) (108D2) Rabbit mAb.
Retrieved from Cell Signaling Technology website:
https://media.cellsignal.com/pdf/9234.pdf
CST (2016c). Phospho-S6 Ribosomal Protein (Ser235/236) (D57.2.2E) XP®
Rabbit mAb. Retrieved from Cell Signaling Technology website:
https://media.cellsignal.com/pdf/4858.pdf
CST (2016d). Phospho-Tuberin/TSC2 (Thr1462) (5B12) Rabbit
mAb. Retrieved from Cell Signaling Technology website:
https://media.cellsignal.com/pdf/3617.pdf
CST (2016e). Akt (pan) (C67E7) Rabbit mAb. Retrieved from Cell Signaling
Technology website: https://media.cellsignal.com/pdf/4691.pdf
CST (2016f). Tuberin/TSC2 (D93F12) XP® Rabbit mAb. Retrieved from Cell
Signaling Technology website:
https://media.cellsignal.com/pdf/4308.pdf
CST (2016g). ULK1 (D8H5) Rabbit mAb. Retrieved from Cell Signaling
Technology website: https://media.cellsignal.com/pdf/8054.pdf
CST (2017a). Hydroxy-HIF-1α (Pro564) (D43B5) XP® Rabbit mAb. Retrieved
from Cell Signaling Technology website:
https://media.cellsignal.com/pdf/3434.pdf
CST (2017b). Phospho-4E-BP1 (Thr37/46) (236B4) Rabbit mAb. Retrieved
from Cell Signaling Technology website:
https://media.cellsignal.com/pdf/2855.pdf
CST (2017c). Phospho-Akt (Ser473) (D9E) XP® Rabbit mAb. Retrieved from
Cell Signaling Technology website:
https://media.cellsignal.com/pdf/9271.pdf
CST (2017d). Phospho-AMPKα (Thr172) (D4D6D) Rabbit mAb. Retrieved
from Cell Signaling Technology website:
https://media.cellsignal.com/pdf/2535.pdf
CST (2017e). 4E-BP1 (53H11) Rabbit mAb. Retrieved from Cell Signaling
Technology website: https://media.cellsignal.com/pdf/9644.pdf
CST (2017f). β-Actin (13E5) Rabbit mAb. Retrieved from Cell Signaling
Technology website: https://media.cellsignal.com/pdf/8457.pdf
CST Antibody Validation Principles. (n.d.). Retrieved January 02, 2018, from
https://www.cellsignal.com/contents/our-approach/cst-antibody-
validation-principles/ourapproach-validation-principles
Cummins, E. P., Berra, E., Comerford, K. M., Ginouves, A., Fitzgerald, K. T.,
Seeballuck, F., . . . Taylor, C. T. (2006). Prolyl hydroxylase-1 negatively
regulates IkappaB kinase-beta, giving insight into hypoxia-induced
NFkappaB activity. Proc Natl Acad Sci U S A, 103(48), 18154-18159.
doi:10.1073/pnas.0602235103
165
Curi, R., Lagranha, C. J., Doi, S. Q., Sellitti, D. F., Procopio, J., Pithon-Curi, T.
C., . . . Newsholme, P. (2005). Molecular mechanisms of glutamine
action. J Cell Physiol, 204(2), 392-401. doi:10.1002/jcp.20339
Curthoys, N. P., & Watford, M. (1995). Regulation of glutaminase activity and
glutamine metabolism. Annu Rev Nutr, 15, 133-159.
doi:10.1146/annurev.nu.15.070195.001025
Dai, H., Song, D., Xu, J., Li, B., Hertz, L., & Peng, L. (2013). Ammonia-induced
Na,K-ATPase/ouabain-mediated EGF receptor transactivation,
MAPK/ERK and PI3K/AKT signaling and ROS formation cause
astrocyte swelling. Neurochem Int, 63(6), 610-625.
doi:10.1016/j.neuint.2013.09.005
Dalgard, C. L., Lu, H., Mohyeldin, A., & Verma, A. (2004). Endogenous 2-
oxoacids differentially regulate expression of oxygen sensors. Biochem
J, 380(Pt 2), 419-424. doi:10.1042/BJ20031647
Dang, C. V. (2010). Glutaminolysis: supplying carbon or nitrogen or both for
cancer cells? Cell Cycle, 9(19), 3884-3886. doi:10.4161/cc.9.19.13302
Dang, L., White, D. W., Gross, S., Bennett, B. D., Bittinger, M. A., Driggers,
E. M., . . . Su, S. M. (2009). Cancer-associated IDH1 mutations produce
2-hydroxyglutarate. Nature, 462(7274), 739-744.
doi:10.1038/nature08617
Deschoemaeker, S., Di Conza, G., Lilla, S., Martin-Perez, R., Mennerich, D.,
Boon, L., . . . Mazzone, M. (2015). PHD1 regulates p53-mediated
colorectal cancer chemoresistance. EMBO Mol Med, 7(10), 1350-1365.
doi:10.15252/emmm.201505492
DeYoung, M. P., Horak, P., Sofer, A., Sgroi, D., & Ellisen, L. W. (2008).
Hypoxia regulates TSC1/2-mTOR signaling and tumor suppression
through REDD1-mediated 14-3-3 shuttling. Genes Dev, 22(2), 239-251.
doi:10.1101/gad.1617608
Dibble, C. C., Elis, W., Menon, S., Qin, W., Klekota, J., Asara, J. M., . . .
Manning, B. D. (2012). TBC1D7 is a third subunit of the TSC1-TSC2
complex upstream of mTORC1. Mol Cell, 47(4), 535-546.
doi:10.1016/j.molcel.2012.06.009
Dibble, C. C., & Manning, B. D. (2013). Signal integration by mTORC1
coordinates nutrient input with biosynthetic output. Nat Cell Biol, 15(6),
555-564. doi:10.1038/ncb2763
Diers, A. R., Broniowska, K. A., Chang, C. F., & Hogg, N. (2012). Pyruvate
fuels mitochondrial respiration and proliferation of breast cancer cells:
effect of monocarboxylate transporter inhibition. Biochem J, 444(3),
561-571. doi:10.1042/BJ20120294
Domchek, S. M., Auger, K. R., Chatterjee, S., Burke, T. R., Jr., & Shoelson, S.
E. (1992). Inhibition of SH2 domain/phosphoprotein association by a
nonhydrolyzable phosphonopeptide. Biochemistry, 31(41), 9865-9870.
Donaldson, J. G., Honda, A., & Weigert, R. (2005). Multiple activities for Arf1
at the Golgi complex. Biochim Biophys Acta, 1744(3), 364-373.
doi:10.1016/j.bbamcr.2005.03.001
Dong, J., Qiu, H., Garcia-Barrio, M., Anderson, J., & Hinnebusch, A. G. (2000).
Uncharged tRNA activates GCN2 by displacing the protein kinase
moiety from a bipartite tRNA-binding domain. Mol Cell, 6(2), 269-279.
Du, J., Cleghorn, W. M., Contreras, L., Lindsay, K., Rountree, A. M., Chertov,
A. O., . . . Hurley, J. B. (2013). Inhibition of mitochondrial pyruvate
166
transport by zaprinast causes massive accumulation of aspartate at the
expense of glutamate in the retina. J Biol Chem, 288(50), 36129-36140.
doi:10.1074/jbc.M113.507285
Duckwall, C. S., Murphy, T. A., & Young, J. D. (2013). Mapping cancer cell
metabolism with(13)C flux analysis: Recent progress and future
challenges. J Carcinog, 12, 13. doi:10.4103/1477-3163.115422
Dunlop, E. A., Hunt, D. K., Acosta-Jaquez, H. A., Fingar, D. C., & Tee, A. R.
(2011). ULK1 inhibits mTORC1 signaling, promotes multisite Raptor
phosphorylation and hinders substrate binding. Autophagy, 7(7), 737-
747.
Duran, R. V., MacKenzie, E. D., Boulahbel, H., Frezza, C., Heiserich, L.,
Tardito, S., . . . Gottlieb, E. (2013). HIF-independent role of prolyl
hydroxylases in the cellular response to amino acids. Oncogene, 32(38),
4549-4556. doi:10.1038/onc.2012.465
Duran, R. V., Oppliger, W., Robitaille, A. M., Heiserich, L., Skendaj, R.,
Gottlieb, E., & Hall, M. N. (2012). Glutaminolysis activates Rag-
mTORC1 signaling. Mol Cell, 47(3), 349-358.
doi:10.1016/j.molcel.2012.05.043
Duvel, K., Yecies, J. L., Menon, S., Raman, P., Lipovsky, A. I., Souza, A. L., .
. . Manning, B. D. (2010). Activation of a metabolic gene regulatory
network downstream of mTOR complex 1. Mol Cell, 39(2), 171-183.
doi:10.1016/j.molcel.2010.06.022
Eberle, D., Hegarty, B., Bossard, P., Ferre, P., & Foufelle, F. (2004). SREBP
transcription factors: master regulators of lipid homeostasis. Biochimie,
86(11), 839-848. doi:10.1016/j.biochi.2004.09.018
Eng, C. H., & Abraham, R. T. (2010). Glutaminolysis yields a metabolic by-
product that stimulates autophagy. Autophagy, 6(7), 968-970.
doi:10.4161/auto.6.7.13082
Eng, C. H., Yu, K., Lucas, J., White, E., & Abraham, R. T. (2010). Ammonia
derived from glutaminolysis is a diffusible regulator of autophagy. Sci
Signal, 3(119), ra31. doi:10.1126/scisignal.2000911
Eng, C. P., Sehgal, S. N., & Vezina, C. (1984). Activity of rapamycin (AY-
22,989) against transplanted tumors. J Antibiot (Tokyo), 37(10), 1231-
1237.
Erecinska, M., & Nelson, D. (1990). Activation of glutamate dehydrogenase by
leucine and its nonmetabolizable analogue in rat brain synaptosomes. J
Neurochem, 54(4), 1335-1343.
Erez, N., Milyavsky, M., Eilam, R., Shats, I., Goldfinger, N., & Rotter, V.
(2003). Expression of prolyl-hydroxylase-1 (PHD1/EGLN2) suppresses
hypoxia inducible factor-1alpha activation and inhibits tumor growth.
Cancer Res, 63(24), 8777-8783.
Fan, T. W., Lane, A. N., Higashi, R. M., Farag, M. A., Gao, H., Bousamra, M.,
& Miller, D. M. (2009). Altered regulation of metabolic pathways in
human lung cancer discerned by (13)C stable isotope-resolved
metabolomics (SIRM). Mol Cancer, 8, 41. doi:10.1186/1476-4598-8-41
Ferguson, S. M., & Williams, G. R. (1966). The effect of malate and other
dicarboxylic acids on mitochondrial isocitrate metabolism. J Biol Chem,
241(16), 3696-3700.
Forbes, N. S., Meadows, A. L., Clark, D. S., & Blanch, H. W. (2006). Estradiol
stimulates the biosynthetic pathways of breast cancer cells: detection by
167
metabolic flux analysis. Metab Eng, 8(6), 639-652.
doi:10.1016/j.ymben.2006.06.005
Forissier, M., & Baverel, G. (1981). The conversion of alanine into glutamine
in guinea-pig renal cortex. Essential role of pyruvate carboxylase.
Biochem J, 200(1), 27-33.
Forsythe, J. A., Jiang, B. H., Iyer, N. V., Agani, F., Leung, S. W., Koos, R. D.,
& Semenza, G. L. (1996). Activation of vascular endothelial growth
factor gene transcription by hypoxia-inducible factor 1. Mol Cell Biol,
16(9), 4604-4613.
Friedrich, N. (2012). Metabolomics in diabetes research. J Endocrinol, 215(1),
29-42. doi:10.1530/JOE-12-0120
Fu, X., Chin, R. M., Vergnes, L., Hwang, H., Deng, G., Xing, Y., . . . Huang, J.
(2015). 2-Hydroxyglutarate Inhibits ATP Synthase and mTOR
Signaling. Cell Metab, 22(3), 508-515. doi:10.1016/j.cmet.2015.06.009
Fukuda, R., Zhang, H., Kim, J. W., Shimoda, L., Dang, C. V., & Semenza, G.
L. (2007). HIF-1 regulates cytochrome oxidase subunits to optimize
efficiency of respiration in hypoxic cells. Cell, 129(1), 111-122.
doi:10.1016/j.cell.2007.01.047
Galluzzi, L., Kepp, O., Vander Heiden, M. G., & Kroemer, G. (2013). Metabolic
targets for cancer therapy. Nat Rev Drug Discov, 12(11), 829-846.
doi:10.1038/nrd4145
Ganapathy, V., Thangaraju, M., Gopal, E., Martin, P. M., Itagaki, S., Miyauchi,
S., & Prasad, P. D. (2008). Sodium-coupled monocarboxylate
transporters in normal tissues and in cancer. AAPS J, 10(1), 193-199.
doi:10.1208/s12248-008-9022-y
Gao, P., Tchernyshyov, I., Chang, T. C., Lee, Y. S., Kita, K., Ochi, T., . . . Dang,
C. V. (2009). c-Myc suppression of miR-23a/b enhances mitochondrial
glutaminase expression and glutamine metabolism. Nature, 458(7239),
762-765. doi:10.1038/nature07823
Garayoa, M., Martinez, A., Lee, S., Pio, R., An, W. G., Neckers, L., . . . Cuttitta,
F. (2000). Hypoxia-inducible factor-1 (HIF-1) up-regulates
adrenomedullin expression in human tumor cell lines during oxygen
deprivation: a possible promotion mechanism of carcinogenesis. Mol
Endocrinol, 14(6), 848-862. doi:10.1210/mend.14.6.0473
Gatenby, R. A., & Gillies, R. J. (2004). Why do cancers have high aerobic
glycolysis? Nat Rev Cancer, 4(11), 891-899. doi:10.1038/nrc1478
Goldberg, M. A., Dunning, S. P., & Bunn, H. F. (1988). Regulation of the
erythropoietin gene: evidence that the oxygen sensor is a heme protein.
Science, 242(4884), 1412-1415.
Greenbaum, N. L., & Wilson, D. F. (1985). The distribution of inorganic
phosphate and malate between intra- and extramitochondrial spaces.
Relationship with the transmembrane pH difference. J Biol Chem,
260(2), 873-879.
Guertin, D. A., & Sabatini, D. M. (2007). Defining the role of mTOR in cancer.
Cancer Cell, 12(1), 9-22. doi:10.1016/j.ccr.2007.05.008
Guzy, R. D., Hoyos, B., Robin, E., Chen, H., Liu, L., Mansfield, K. D., . . .
Schumacker, P. T. (2005). Mitochondrial complex III is required for
hypoxia-induced ROS production and cellular oxygen sensing. Cell
Metab, 1(6), 401-408. doi:10.1016/j.cmet.2005.05.001
168
Gwinn, D. M., Shackelford, D. B., Egan, D. F., Mihaylova, M. M., Mery, A.,
Vasquez, D. S., . . . Shaw, R. J. (2008). AMPK phosphorylation of raptor
mediates a metabolic checkpoint. Mol Cell, 30(2), 214-226.
doi:10.1016/j.molcel.2008.03.003
Hagen, T., Taylor, C. T., Lam, F., & Moncada, S. (2003). Redistribution of
intracellular oxygen in hypoxia by nitric oxide: effect on HIF1alpha.
Science, 302(5652), 1975-1978. doi:10.1126/science.1088805
Hallen, A., Jamie, J. F., & Cooper, A. J. (2013). Lysine metabolism in
mammalian brain: an update on the importance of recent discoveries.
Amino Acids, 45(6), 1249-1272. doi:10.1007/s00726-013-1590-1
Han, J. M., Jeong, S. J., Park, M. C., Kim, G., Kwon, N. H., Kim, H. K., . . .
Kim, S. (2012). Leucyl-tRNA synthetase is an intracellular leucine
sensor for the mTORC1-signaling pathway. Cell, 149(2), 410-424.
doi:10.1016/j.cell.2012.02.044
Hanahan, D., & Weinberg, R. A. (2000). The hallmarks of cancer. Cell, 100(1),
57-70.
Hanahan, D., & Weinberg, R. A. (2011). Hallmarks of cancer: the next
generation. Cell, 144(5), 646-674. doi:10.1016/j.cell.2011.02.013
Hara, K., Yonezawa, K., Weng, Q. P., Kozlowski, M. T., Belham, C., & Avruch,
J. (1998). Amino acid sufficiency and mTOR regulate p70 S6 kinase and
eIF-4E BP1 through a common effector mechanism. J Biol Chem,
273(23), 14484-14494.
Harder, L. M., Bunkenborg, J., & Andersen, J. S. (2014). Inducing autophagy:
a comparative phosphoproteomic study of the cellular response to
ammonia and rapamycin. Autophagy, 10(2), 339-355.
doi:10.4161/auto.26863
Harris, A. L. (2015). A New Hydroxy Metabolite of 2-Oxoglutarate Regulates
Metabolism in Hypoxia. Cell Metab, 22(2), 198-200.
doi:10.1016/j.cmet.2015.07.016
Hayashi, M., Sakata, M., Takeda, T., Yamamoto, T., Okamoto, Y., Sawada, K.,
. . . Murata, Y. (2004). Induction of glucose transporter 1 expression
through hypoxia-inducible factor 1alpha under hypoxic conditions in
trophoblast-derived cells. J Endocrinol, 183(1), 145-154.
doi:10.1677/joe.1.05599
Heintzman, N. D., Stuart, R. K., Hon, G., Fu, Y., Ching, C. W., Hawkins, R. D.,
. . . Ren, B. (2007). Distinct and predictive chromatin signatures of
transcriptional promoters and enhancers in the human genome. Nat
Genet, 39(3), 311-318. doi:10.1038/ng1966
Heitink-Polle, K. M., Prinsen, B. H., de Koning, T. J., van Hasselt, P. M., &
Bierings, M. B. (2013). High incidence of symptomatic
hyperammonemia in children with acute lymphoblastic leukemia
receiving pegylated asparaginase. JIMD Rep, 7, 103-108.
doi:10.1007/8904_2012_156
Hensley, C. T., Wasti, A. T., & DeBerardinis, R. J. (2013). Glutamine and
cancer: cell biology, physiology, and clinical opportunities. J Clin
Invest, 123(9), 3678-3684. doi:10.1172/JCI69600
Hermanova, I., Zaliova, M., Trka, J., & Starkova, J. (2012). Low expression of
asparagine synthetase in lymphoid blasts precludes its role in sensitivity
to L-asparaginase. Exp Hematol, 40(8), 657-665.
doi:10.1016/j.exphem.2012.04.005
169
Hettmer, S., Schinzel, A. C., Tchessalova, D., Schneider, M., Parker, C. L.,
Bronson, R. T., . . . Wagers, A. J. (2015). Functional genomic screening
reveals asparagine dependence as a metabolic vulnerability in sarcoma.
Elife, 4. doi:10.7554/eLife.09436
Hirao, A., & Hoshii, T. (2013). Mechanistic / mammalian target protein of
rapamycin signaling in hematopoietic stem cells and leukemia. Cancer
Sci, 104(8), 977-982. doi:10.1111/cas.12189
Hirose, E., Nakashima, N., Sekiguchi, T., & Nishimoto, T. (1998). RagA is a
functional homologue of S. cerevisiae Gtr1p involved in the Ran/Gsp1-
GTPase pathway. J Cell Sci, 111 ( Pt 1), 11-21.
Holecek, M. (2013). Branched-chain amino acids and ammonia metabolism in
liver disease: therapeutic implications. Nutrition, 29(10), 1186-1191.
doi:10.1016/j.nut.2013.01.022
Holm, L. M., Jahn, T. P., Moller, A. L., Schjoerring, J. K., Ferri, D., Klaerke,
D. A., & Zeuthen, T. (2005). NH3 and NH4+ permeability in aquaporin-
expressing Xenopus oocytes. Pflugers Arch, 450(6), 415-428.
doi:10.1007/s00424-005-1399-1
Hong, C. S., Graham, N. A., Gu, W., Espindola Camacho, C., Mah, V., Maresh,
E. L., . . . Christofk, H. R. (2016). MCT1 Modulates Cancer Cell
Pyruvate Export and Growth of Tumors that Co-express MCT1 and
MCT4. Cell Rep, 14(7), 1590-1601. doi:10.1016/j.celrep.2016.01.057
Howell, J. J., Ricoult, S. J., Ben-Sahra, I., & Manning, B. D. (2013). A growing
role for mTOR in promoting anabolic metabolism. Biochem Soc Trans,
41(4), 906-912. doi:10.1042/BST20130041
Hu, J., Stiehl, D. P., Setzer, C., Wichmann, D., Shinde, D. A., Rehrauer, H., . .
. Gorr, T. A. (2011). Interaction of HIF and USF signaling pathways in
human genes flanked by hypoxia-response elements and E-box
palindromes. Mol Cancer Res, 9(11), 1520-1536. doi:10.1158/1541-
7786.MCR-11-0090
Hu, R., Dai, A., & Tan, S. (2002). Hypoxia-inducible factor 1 alpha upregulates
the expression of inducible nitric oxide synthase gene in pulmonary
arteries of hyposic rat. Chin Med J (Engl), 115(12), 1833-1837.
Hu, S., Wang, J., Ji, E. H., Christison, T., Lopez, L., & Huang, Y. (2015).
Targeted Metabolomic Analysis of Head and Neck Cancer Cells Using
High Performance Ion Chromatography Coupled with a Q Exactive HF
Mass Spectrometer. Anal Chem, 87(12), 6371-6379.
doi:10.1021/acs.analchem.5b01350
Hu, Y., Carraro-Lacroix, L. R., Wang, A., Owen, C., Bajenova, E., Corey, P.
N., . . . Voronov, I. (2016). Lysosomal pH Plays a Key Role in
Regulation of mTOR Activity in Osteoclasts. J Cell Biochem, 117(2),
413-425. doi:10.1002/jcb.25287
Hulsewe, K. W., van der Hulst, R. R., Ramsay, G., van Berlo, C. L., Deutz, N.
E., & Soeters, P. B. (2003). Pulmonary glutamine production: effects of
sepsis and pulmonary infiltrates. Intensive Care Med, 29(10), 1833-
1836. doi:10.1007/s00134-003-1909-6
Husted, A. S., Trauelsen, M., Rudenko, O., Hjorth, S. A., & Schwartz, T. W.
(2017). GPCR-Mediated Signaling of Metabolites. Cell Metab, 25(4),
777-796. doi:10.1016/j.cmet.2017.03.008
170
Inoki, K., Li, Y., Zhu, T., Wu, J., & Guan, K. L. (2002). TSC2 is phosphorylated
and inhibited by Akt and suppresses mTOR signalling. Nat Cell Biol,
4(9), 648-657. doi:10.1038/ncb839
Inoki, K., Zhu, T., & Guan, K. L. (2003). TSC2 mediates cellular energy
response to control cell growth and survival. Cell, 115(5), 577-590.
Jamur, M. C., & Oliver, C. (2010). Permeabilization of cell membranes.
Methods Mol Biol, 588, 63-66. doi:10.1007/978-1-59745-324-0_9
Jankowska-Anyszka, M., Lamphear, B. J., Aamodt, E. J., Harrington, T.,
Darzynkiewicz, E., Stolarski, R., & Rhoads, R. E. (1998). Multiple
isoforms of eukaryotic protein synthesis initiation factor 4E in
Caenorhabditis elegans can distinguish between mono- and
trimethylated mRNA cap structures. J Biol Chem, 273(17), 10538-
10542.
Jensen, M. V., Joseph, J. W., Ronnebaum, S. M., Burgess, S. C., Sherry, A. D.,
& Newgard, C. B. (2008). Metabolic cycling in control of glucose-
stimulated insulin secretion. Am J Physiol Endocrinol Metab, 295(6),
E1287-1297. doi:10.1152/ajpendo.90604.2008
Jewell, J. L., Kim, Y. C., Russell, R. C., Yu, F. X., Park, H. W., Plouffe, S. W.,
. . . Guan, K. L. (2015). Metabolism. Differential regulation of mTORC1
by leucine and glutamine. Science, 347(6218), 194-198.
doi:10.1126/science.1259472
Jose, C., Bellance, N., & Rossignol, R. (2011). Choosing between glycolysis
and oxidative phosphorylation: a tumor's dilemma? Biochim Biophys
Acta, 1807(6), 552-561. doi:10.1016/j.bbabio.2010.10.012
Joseph, J. W., Jensen, M. V., Ilkayeva, O., Palmieri, F., Alarcon, C., Rhodes, C.
J., & Newgard, C. B. (2006). The mitochondrial citrate/isocitrate carrier
plays a regulatory role in glucose-stimulated insulin secretion. J Biol
Chem, 281(47), 35624-35632. doi:10.1074/jbc.M602606200
Joseph, S. K., & McGivan, J. D. (1978). The effects of ammonium chloride and
bicarbonate on the activity of glutaminase in isolated liver mitochondria.
Biochem J, 176(3), 837-844.
Kaplon, J., Zheng, L., Meissl, K., Chaneton, B., Selivanov, V. A., Mackay, G.,
. . . Peeper, D. S. (2013). A key role for mitochondrial gatekeeper
pyruvate dehydrogenase in oncogene-induced senescence. Nature,
498(7452), 109-112. doi:10.1038/nature12154
Kato, Y., Ozawa, S., Miyamoto, C., Maehata, Y., Suzuki, A., Maeda, T., &
Baba, Y. (2013). Acidic extracellular microenvironment and cancer.
Cancer Cell Int, 13(1), 89. doi:10.1186/1475-2867-13-89
Kaur, J., & Debnath, J. (2015). Autophagy at the crossroads of catabolism and
anabolism. Nat Rev Mol Cell Biol, 16(8), 461-472.
doi:10.1038/nrm4024
Kim, J., Kundu, M., Viollet, B., & Guan, K. L. (2011). AMPK and mTOR
regulate autophagy through direct phosphorylation of Ulk1. Nat Cell
Biol, 13(2), 132-141. doi:10.1038/ncb2152
Kim, L. C., Cook, R. S., & Chen, J. (2017). mTORC1 and mTORC2 in cancer
and the tumor microenvironment. Oncogene, 36(16), 2191-2201.
doi:10.1038/onc.2016.363
Kim, S., Hwang, J., Xuan, J., Jung, Y. H., Cha, H. S., & Kim, K. H. (2014).
Global metabolite profiling of synovial fluid for the specific diagnosis
171
of rheumatoid arthritis from other inflammatory arthritis. PLoS One,
9(6), e97501. doi:10.1371/journal.pone.0097501
Kim, S. Y., Choi, J. S., Park, C., & Jeong, J. W. (2010). Ethyl pyruvate stabilizes
hypoxia-inducible factor 1 alpha via stimulation of the TCA cycle.
Cancer Lett, 295(2), 236-241. doi:10.1016/j.canlet.2010.03.006
King, A., Selak, M. A., & Gottlieb, E. (2006). Succinate dehydrogenase and
fumarate hydratase: linking mitochondrial dysfunction and cancer.
Oncogene, 25(34), 4675-4682. doi:10.1038/sj.onc.1209594
Kiriyama, Y., Kubota, M., Takimoto, T., Kitoh, T., Tanizawa, A., Akiyama, Y.,
& Mikawa, H. (1989). Biochemical characterization of U937 cells
resistant to L-asparaginase: the role of asparagine synthetase. Leukemia,
3(4), 294-297.
Klupczynska, A., Derezinski, P., & Kokot, Z. J. (2015). Metabolomics in
Medical Sciences--Trends, Challenges and Perspectives. Acta Pol
Pharm, 72(4), 629-641.
Knepper, M. A., Packer, R., & Good, D. W. (1989). Ammonium transport in the
kidney. Physiol Rev, 69(1), 179-249.
Koivunen, P., Hirsila, M., Remes, A. M., Hassinen, I. E., Kivirikko, K. I., &
Myllyharju, J. (2007). Inhibition of hypoxia-inducible factor (HIF)
hydroxylases by citric acid cycle intermediates: possible links between
cell metabolism and stabilization of HIF. J Biol Chem, 282(7), 4524-
4532. doi:10.1074/jbc.M610415200
Kovacina, K. S., Park, G. Y., Bae, S. S., Guzzetta, A. W., Schaefer, E.,
Birnbaum, M. J., & Roth, R. A. (2003). Identification of a proline-rich
Akt substrate as a 14-3-3 binding partner. J Biol Chem, 278(12), 10189-
10194. doi:10.1074/jbc.M210837200
Krall, A. S., & Christofk, H. R. (2015). Rethinking glutamine addiction. Nat
Cell Biol, 17(12), 1515-1517. doi:10.1038/ncb3278
Krall, A. S., Xu, S., Graeber, T. G., Braas, D., & Christofk, H. R. (2016).
Asparagine promotes cancer cell proliferation through use as an amino
acid exchange factor. Nat Commun, 7, 11457.
doi:10.1038/ncomms11457
Kristiansen, K. A., Jensen, P. E., Moller, I. M., & Schulz, A. (2009). Monitoring
reactive oxygen species formation and localisation in living cells by use
of the fluorescent probe CM-H(2)DCFDA and confocal laser
microscopy. Physiol Plant, 136(4), 369-383. doi:10.1111/j.1399-
3054.2009.01243.x
Kubasiak, L. A., Hernandez, O. M., Bishopric, N. H., & Webster, K. A. (2002).
Hypoxia and acidosis activate cardiac myocyte death through the Bcl-2
family protein BNIP3. Proc Natl Acad Sci U S A, 99(20), 12825-12830.
doi:10.1073/pnas.202474099
Kunz, J., Henriquez, R., Schneider, U., Deuter-Reinhard, M., Movva, N. R., &
Hall, M. N. (1993). Target of rapamycin in yeast, TOR2, is an essential
phosphatidylinositol kinase homolog required for G1 progression. Cell,
73(3), 585-596.
Lacey, J. M., & Wilmore, D. W. (1990). Is glutamine a conditionally essential
amino acid? Nutr Rev, 48(8), 297-309.
Land, S. C., & Tee, A. R. (2007). Hypoxia-inducible factor 1alpha is regulated
by the mammalian target of rapamycin (mTOR) via an mTOR signaling
172
motif. J Biol Chem, 282(28), 20534-20543.
doi:10.1074/jbc.M611782200
Laplante, M., & Sabatini, D. M. (2009). An emerging role of mTOR in lipid
biosynthesis. Curr Biol, 19(22), R1046-1052.
doi:10.1016/j.cub.2009.09.058
Laplante, M., & Sabatini, D. M. (2012). mTOR signaling in growth control and
disease. Cell, 149(2), 274-293. doi:10.1016/j.cell.2012.03.017
Le, P. G., Potter, V. R., Busch, H., Heidelberger, C., & Hurlbert, R. B. (1952).
Growth of carcinoma implants in fed and fasted rats. Cancer Res, 12(2),
153-157.
Lee, G., Won, H. S., Lee, Y. M., Choi, J. W., Oh, T. I., Jang, J. H., . . . Lim, J.
H. (2016). Oxidative Dimerization of PHD2 is Responsible for its
Inactivation and Contributes to Metabolic Reprogramming via HIF-
1alpha Activation. Sci Rep, 6, 18928. doi:10.1038/srep18928
Li, L., Kim, E., Yuan, H., Inoki, K., Goraksha-Hicks, P., Schiesher, R. L., . . .
Guan, K. L. (2010). Regulation of mTORC1 by the Rab and Arf
GTPases. J Biol Chem, 285(26), 19705-19709.
doi:10.1074/jbc.C110.102483
Lin, A. P., Abbas, S., Kim, S. W., Ortega, M., Bouamar, H., Escobedo, Y., . . .
Aguiar, R. C. (2015). D2HGDH regulates alpha-ketoglutarate levels and
dioxygenase function by modulating IDH2. Nat Commun, 6, 7768.
doi:10.1038/ncomms8768
Lin, C., McGough, R., Aswad, B., Block, J. A., & Terek, R. (2004). Hypoxia
induces HIF-1alpha and VEGF expression in chondrosarcoma cells and
chondrocytes. J Orthop Res, 22(6), 1175-1181.
doi:10.1016/j.orthres.2004.03.002
Linster, C. L., Van Schaftingen, E., & Hanson, A. D. (2013). Metabolite damage
and its repair or pre-emption. Nat Chem Biol, 9(2), 72-80.
doi:10.1038/nchembio.1141
Liu, K. J., Kleps, R., Henderson, T., & Nyhus, L. (1991). 13C NMR study of
hepatic pyruvate carboxylase activity in tumor rats. Biochem Biophys
Res Commun, 179(1), 366-371.
Liu, Y. L., Ang, S. O., Weigent, D. A., Prchal, J. T., & Bloomer, J. R. (2004).
Regulation of ferrochelatase gene expression by hypoxia. Life Sci,
75(17), 2035-2043. doi:10.1016/j.lfs.2004.03.027
Loewith, R., & Hall, M. N. (2011). Target of rapamycin (TOR) in nutrient
signaling and growth control. Genetics, 189(4), 1177-1201.
doi:10.1534/genetics.111.133363
Lok, C. N., & Ponka, P. (1999). Identification of a hypoxia response element in
the transferrin receptor gene. J Biol Chem, 274(34), 24147-24152.
Long, X., Lin, Y., Ortiz-Vega, S., Yonezawa, K., & Avruch, J. (2005). Rheb
binds and regulates the mTOR kinase. Curr Biol, 15(8), 702-713.
doi:10.1016/j.cub.2005.02.053
Loseke, S., Grage-Griebenow, E., Wagner, A., Gehlhar, K., & Bufe, A. (2003).
Differential expression of IFN-alpha subtypes in human PBMC:
evaluation of novel real-time PCR assays. J Immunol Methods, 276(1-
2), 207-222.
Lu, C. W., Lin, S. C., Chen, K. F., Lai, Y. Y., & Tsai, S. J. (2008). Induction of
pyruvate dehydrogenase kinase-3 by hypoxia-inducible factor-1
173
promotes metabolic switch and drug resistance. J Biol Chem, 283(42),
28106-28114. doi:10.1074/jbc.M803508200
Lu, H., Dalgard, C. L., Mohyeldin, A., McFate, T., Tait, A. S., & Verma, A.
(2005). Reversible inactivation of HIF-1 prolyl hydroxylases allows cell
metabolism to control basal HIF-1. J Biol Chem, 280(51), 41928-41939.
doi:10.1074/jbc.M508718200
Lu, H., Forbes, R. A., & Verma, A. (2002). Hypoxia-inducible factor 1
activation by aerobic glycolysis implicates the Warburg effect in
carcinogenesis. J Biol Chem, 277(26), 23111-23115.
doi:10.1074/jbc.M202487200
Lu, J., Tan, M., & Cai, Q. (2015). The Warburg effect in tumor progression:
mitochondrial oxidative metabolism as an anti-metastasis mechanism.
Cancer Lett, 356(2 Pt A), 156-164. doi:10.1016/j.canlet.2014.04.001
Lu, S., Gu, X., Hoestje, S., & Epner, D. E. (2002). Identification of an additional
hypoxia responsive element in the glyceraldehyde-3-phosphate
dehydrogenase gene promoter. Biochim Biophys Acta, 1574(2), 152-
156.
Luo, W., Hu, H., Chang, R., Zhong, J., Knabel, M., O'Meally, R., . . . Semenza,
G. L. (2011). Pyruvate kinase M2 is a PHD3-stimulated coactivator for
hypoxia-inducible factor 1. Cell, 145(5), 732-744.
doi:10.1016/j.cell.2011.03.054
Lushchak, V. I. (2015). Free Radicals, Reactive Oxygen Species, Oxidative
Stresses and Their Classifications. Ukr Biochem J, 87(6), 11-18.
Ma, S., Jiang, B., Deng, W., Gu, Z. K., Wu, F. Z., Li, T., . . . Guan, K. L. (2015).
D-2-hydroxyglutarate is essential for maintaining oncogenic property of
mutant IDH-containing cancer cells but dispensable for cell growth.
Oncotarget, 6(11), 8606-8620. doi:10.18632/oncotarget.3330
Maddocks, O. D., Berkers, C. R., Mason, S. M., Zheng, L., Blyth, K., Gottlieb,
E., & Vousden, K. H. (2013). Serine starvation induces stress and p53-
dependent metabolic remodelling in cancer cells. Nature, 493(7433),
542-546. doi:10.1038/nature11743
Maehama, T., & Dixon, J. E. (1998). The tumor suppressor, PTEN/MMAC1,
dephosphorylates the lipid second messenger, phosphatidylinositol
3,4,5-trisphosphate. J Biol Chem, 273(22), 13375-13378.
Marino, G., Pietrocola, F., Eisenberg, T., Kong, Y., Malik, S. A.,
Andryushkova, A., . . . Kroemer, G. (2014). Regulation of autophagy by
cytosolic acetyl-coenzyme A. Mol Cell, 53(5), 710-725.
doi:10.1016/j.molcel.2014.01.016
Masson, N., Singleton, R. S., Sekirnik, R., Trudgian, D. C., Ambrose, L. J.,
Miranda, M. X., . . . Ratcliffe, P. J. (2012). The FIH hydroxylase is a
cellular peroxide sensor that modulates HIF transcriptional activity.
EMBO Rep, 13(3), 251-257. doi:10.1038/embor.2012.9
Mates, J. M., Segura, J. A., Martin-Rufian, M., Campos-Sandoval, J. A.,
Alonso, F. J., & Marquez, J. (2013). Glutaminase isoenzymes as key
regulators in metabolic and oxidative stress against cancer. Curr Mol
Med, 13(4), 514-534.
Mathupala, S. P., Rempel, A., & Pedersen, P. L. (2001). Glucose catabolism in
cancer cells: identification and characterization of a marked activation
response of the type II hexokinase gene to hypoxic conditions. J Biol
Chem, 276(46), 43407-43412. doi:10.1074/jbc.M108181200
174
Mayers, J. R., & Vander Heiden, M. G. (2015). Famine versus feast:
understanding the metabolism of tumors in vivo. Trends Biochem Sci,
40(3), 130-140. doi:10.1016/j.tibs.2015.01.004
McKeown, S. R. (2014). Defining normoxia, physoxia and hypoxia in tumours-
implications for treatment response. Br J Radiol, 87(1035), 20130676.
doi:10.1259/bjr.20130676
Merhi, A., Delree, P., & Marini, A. M. (2017). The metabolic waste ammonium
regulates mTORC2 and mTORC1 signaling. Sci Rep, 7, 44602.
doi:10.1038/srep44602
Meyer, R. A., Dudley, G. A., & Terjung, R. L. (1980). Ammonia and IMP in
different skeletal muscle fibers after exercise in rats. J Appl Physiol
Respir Environ Exerc Physiol, 49(6), 1037-1041.
Mihaylova, M. M., & Shaw, R. J. (2011). The AMPK signalling pathway
coordinates cell growth, autophagy and metabolism. Nat Cell Biol,
13(9), 1016-1023. doi:10.1038/ncb2329
Minchenko, A., Leshchinsky, I., Opentanova, I., Sang, N., Srinivas, V.,
Armstead, V., & Caro, J. (2002). Hypoxia-inducible factor-1-mediated
expression of the 6-phosphofructo-2-kinase/fructose-2,6-
bisphosphatase-3 (PFKFB3) gene. Its possible role in the Warburg
effect. J Biol Chem, 277(8), 6183-6187. doi:10.1074/jbc.M110978200
Mizushima, N., Yoshimori, T., & Levine, B. (2010). Methods in mammalian
autophagy research. Cell, 140(3), 313-326.
doi:10.1016/j.cell.2010.01.028
Mole, D. R., Blancher, C., Copley, R. R., Pollard, P. J., Gleadle, J. M.,
Ragoussis, J., & Ratcliffe, P. J. (2009). Genome-wide association of
hypoxia-inducible factor (HIF)-1alpha and HIF-2alpha DNA binding
with expression profiling of hypoxia-inducible transcripts. J Biol Chem,
284(25), 16767-16775. doi:10.1074/jbc.M901790200
Moon, E. J., Sonveaux, P., Porporato, P. E., Danhier, P., Gallez, B., Batinic-
Haberle, I., . . . Dewhirst, M. W. (2010). NADPH oxidase-mediated
reactive oxygen species production activates hypoxia-inducible factor-1
(HIF-1) via the ERK pathway after hyperthermia treatment. Proc Natl
Acad Sci U S A, 107(47), 20477-20482. doi:10.1073/pnas.1006646107
Moreno-Sanchez, R., Rodriguez-Enriquez, S., Marin-Hernandez, A., &
Saavedra, E. (2007). Energy metabolism in tumor cells. FEBS J, 274(6),
1393-1418. doi:10.1111/j.1742-4658.2007.05686.x
Mukhopadhyay, C. K., Mazumder, B., & Fox, P. L. (2000). Role of hypoxia-
inducible factor-1 in transcriptional activation of ceruloplasmin by iron
deficiency. J Biol Chem, 275(28), 21048-21054.
doi:10.1074/jbc.M000636200
Muller, H. J., & Boos, J. (1998). Use of L-asparaginase in childhood ALL. Crit
Rev Oncol Hematol, 28(2), 97-113.
Murphy, M. P. (2009). How mitochondria produce reactive oxygen species.
Biochem J, 417(1), 1-13. doi:10.1042/BJ20081386
Myers, M. G., Jr., Backer, J. M., Sun, X. J., Shoelson, S., Hu, P., Schlessinger,
J., . . . White, M. F. (1992). IRS-1 activates phosphatidylinositol 3'-
kinase by associating with src homology 2 domains of p85. Proc Natl
Acad Sci U S A, 89(21), 10350-10354.
Myllyharju, J. (2003). Prolyl 4-hydroxylases, the key enzymes of collagen
biosynthesis. Matrix Biol, 22(1), 15-24.
175
Myllyharju, J. (2013). Prolyl 4-hydroxylases, master regulators of the hypoxia
response. Acta Physiol (Oxf), 208(2), 148-165. doi:10.1111/apha.12096
Nada, S., Hondo, A., Kasai, A., Koike, M., Saito, K., Uchiyama, Y., & Okada,
M. (2009). The novel lipid raft adaptor p18 controls endosome dynamics
by anchoring the MEK-ERK pathway to late endosomes. EMBO J,
28(5), 477-489. doi:10.1038/emboj.2008.308
Nicklin, P., Bergman, P., Zhang, B., Triantafellow, E., Wang, H., Nyfeler, B., .
. . Murphy, L. O. (2009). Bidirectional transport of amino acids regulates
mTOR and autophagy. Cell, 136(3), 521-534.
doi:10.1016/j.cell.2008.11.044
Nielsen, T. T., Stottrup, N. B., Lofgren, B., & Botker, H. E. (2011). Metabolic
fingerprint of ischaemic cardioprotection: importance of the malate-
aspartate shuttle. Cardiovasc Res, 91(3), 382-391.
doi:10.1093/cvr/cvr051
Odegaard, M. L., Joseph, J. W., Jensen, M. V., Lu, D., Ilkayeva, O.,
Ronnebaum, S. M., . . . Newgard, C. B. (2010). The mitochondrial 2-
oxoglutarate carrier is part of a metabolic pathway that mediates
glucose- and glutamine-stimulated insulin secretion. J Biol Chem,
285(22), 16530-16537. doi:10.1074/jbc.M109.092593
Oettgen, H. F., Tallal, L., Tan, C. C., Murphy, M. L., Clarkson, B. D., Golbey,
R. D., . . . Burchenal, H. J. (1970). Clinical experience with L-
asparaginase. Recent Results Cancer Res, 33, 219-235.
Oh, W. J., & Jacinto, E. (2011). mTOR complex 2 signaling and functions. Cell
Cycle, 10(14), 2305-2316. doi:10.4161/cc.10.14.16586
Oldham, W. M., Clish, C. B., Yang, Y., & Loscalzo, J. (2015). Hypoxia-
Mediated Increases in L-2-hydroxyglutarate Coordinate the Metabolic
Response to Reductive Stress. Cell Metab, 22(2), 291-303.
doi:10.1016/j.cmet.2015.06.021
Olenchock, B. A., & Vander Heiden, M. G. (2013). Pyruvate as a pivot point
for oncogene-induced senescence. Cell, 153(7), 1429-1430.
doi:10.1016/j.cell.2013.06.001
Onodera, J., & Ohsumi, Y. (2005). Autophagy is required for maintenance of
amino acid levels and protein synthesis under nitrogen starvation. J Biol
Chem, 280(36), 31582-31586. doi:10.1074/jbc.M506736200
Otten, J., Philippe, N., Suciu, S., Behar, C., Babin-Boilletot, A., Thyss, A., . . .
Group, E. C. L. (2002). The Children Leukemia Group: 30 years of
research and achievements. Eur J Cancer, 38 Suppl 4, S44-49.
Palmer, T. N., Caldecourt, M. A., Snell, K., & Sugden, M. C. (1985). Alanine
and inter-organ relationships in branched-chain amino and 2-oxo acid
metabolism. Review. Biosci Rep, 5(12), 1015-1033.
Papa, S., & Paradies, G. (1974). On the mechanism of translocation of pyruvate
and other monocarboxylic acids in rat-liver mitochondria. Eur J
Biochem, 49(1), 265-274.
Paprocka, J., & Jamroz, E. (2012). Hyperammonemia in children: on the
crossroad of different disorders. Neurologist, 18(5), 261-265.
doi:10.1097/NRL.0b013e318266f58a
Pasikanti, K. K., Esuvaranathan, K., Ho, P. C., Mahendran, R., Kamaraj, R.,
Wu, Q. H., . . . Chan, E. C. (2010). Noninvasive urinary metabonomic
diagnosis of human bladder cancer. J Proteome Res, 9(6), 2988-2995.
doi:10.1021/pr901173v
176
Pavlova, N. N., & Thompson, C. B. (2016). The Emerging Hallmarks of Cancer
Metabolism. Cell Metab, 23(1), 27-47. doi:10.1016/j.cmet.2015.12.006
Phannasil, P., Thuwajit, C., Warnnissorn, M., Wallace, J. C., MacDonald, M. J.,
& Jitrapakdee, S. (2015). Pyruvate Carboxylase Is Up-Regulated in
Breast Cancer and Essential to Support Growth and Invasion of MDA-
MB-231 Cells. PLoS One, 10(6), e0129848.
doi:10.1371/journal.pone.0129848
Pientka, F. K., Hu, J., Schindler, S. G., Brix, B., Thiel, A., Johren, O., . . .
Depping, R. (2012). Oxygen sensing by the prolyl-4-hydroxylase PHD2
within the nuclear compartment and the influence of
compartmentalisation on HIF-1 signalling. J Cell Sci, 125(Pt 21), 5168-
5176. doi:10.1242/jcs.109041
Plumley, D. A., Souba, W. W., Hautamaki, R. D., Martin, T. D., Flynn, T. C.,
Rout, W. R., & Copeland, E. M., 3rd. (1990). Accelerated lung amino
acid release in hyperdynamic septic surgical patients. Arch Surg, 125(1),
57-61.
Porstmann, T., Santos, C. R., Griffiths, B., Cully, M., Wu, M., Leevers, S., . . .
Schulze, A. (2008). SREBP activity is regulated by mTORC1 and
contributes to Akt-dependent cell growth. Cell Metab, 8(3), 224-236.
doi:10.1016/j.cmet.2008.07.007
Post, R. L., & Jolly, P. C. (1957). The linkage of sodium, potassium, and
ammonium active transport across the human erythrocyte membrane.
Biochim Biophys Acta, 25(1), 118-128.
Proteintech (n.d.-a). Purified Mouse Anti-Human HIF-1α. Retrieved from
Proteintech website:
http://www.bdbiosciences.com/ds/pm/tds/610959.pdf
Proteintech (n.d.-b). REDD1 specific Polyclonal ANTIBODY. Retrieved from
Proteintech website:
https://www.ptglab.com/Products/Pictures/pdf/10638-1-AP.pdf
Protti, A., Carre, J., Frost, M. T., Taylor, V., Stidwill, R., Rudiger, A., & Singer,
M. (2007). Succinate recovers mitochondrial oxygen consumption in
septic rat skeletal muscle. Crit Care Med, 35(9), 2150-2155.
Qing, G., Li, B., Vu, A., Skuli, N., Walton, Z. E., Liu, X., . . . Simon, M. C.
(2012). ATF4 regulates MYC-mediated neuroblastoma cell death upon
glutamine deprivation. Cancer Cell, 22(5), 631-644.
doi:10.1016/j.ccr.2012.09.021
Qiu, Y., Cai, G., Su, M., Chen, T., Zheng, X., Xu, Y., . . . Jia, W. (2009). Serum
metabolite profiling of human colorectal cancer using GC-TOFMS and
UPLC-QTOFMS. J Proteome Res, 8(10), 4844-4850.
doi:10.1021/pr9004162
Reinhard, L., Tidow, H., Clausen, M. J., & Nissen, P. (2013). Na(+),K (+)-
ATPase as a docking station: protein-protein complexes of the Na(+),K
(+)-ATPase. Cell Mol Life Sci, 70(2), 205-222. doi:10.1007/s00018-
012-1039-9
Ren, H., Liu, N. Y., Song, X. F., Ma, Y. S., & Zhai, X. Y. (2011). A novel
specific application of pyruvate protects the mouse retina against white
light damage: differential stabilization of HIF-1alpha and HIF-2alpha.
Invest Ophthalmol Vis Sci, 52(6), 3112-3118. doi:10.1167/iovs.10-5605
Rich, P. R. (2003). The molecular machinery of Keilin's respiratory chain.
Biochem Soc Trans, 31(Pt 6), 1095-1105. doi:10.1042/
177
Riddle, S. R., Ahmad, A., Ahmad, S., Deeb, S. S., Malkki, M., Schneider, B.
K., . . . White, C. W. (2000). Hypoxia induces hexokinase II gene
expression in human lung cell line A549. Am J Physiol Lung Cell Mol
Physiol, 278(2), L407-416.
Robert, C. H., Cherfils, J., Mouawad, L., & Perahia, D. (2004). Integrating three
views of Arf1 activation dynamics. J Mol Biol, 337(4), 969-983.
doi:10.1016/j.jmb.2004.01.052
Roskoski, R., Jr. (2015). Src protein-tyrosine kinase structure, mechanism, and
small molecule inhibitors. Pharmacol Res, 94, 9-25.
doi:10.1016/j.phrs.2015.01.003
Rutter, J., Winge, D. R., & Schiffman, J. D. (2010). Succinate dehydrogenase -
Assembly, regulation and role in human disease. Mitochondrion, 10(4),
393-401. doi:10.1016/j.mito.2010.03.001
Rzem, R., Vincent, M. F., Van Schaftingen, E., & Veiga-da-Cunha, M. (2007).
L-2-hydroxyglutaric aciduria, a defect of metabolite repair. J Inherit
Metab Dis, 30(5), 681-689. doi:10.1007/s10545-007-0487-0
Sagne, C., Agulhon, C., Ravassard, P., Darmon, M., Hamon, M., El Mestikawy,
S., . . . Giros, B. (2001). Identification and characterization of a
lysosomal transporter for small neutral amino acids. Proc Natl Acad Sci
U S A, 98(13), 7206-7211. doi:10.1073/pnas.121183498
Sahin, F., Kannangai, R., Adegbola, O., Wang, J., Su, G., & Torbenson, M.
(2004). mTOR and P70 S6 kinase expression in primary liver
neoplasms. Clin Cancer Res, 10(24), 8421-8425. doi:10.1158/1078-
0432.CCR-04-0941
Sancak, Y., Bar-Peled, L., Zoncu, R., Markhard, A. L., Nada, S., & Sabatini, D.
M. (2010). Ragulator-Rag complex targets mTORC1 to the lysosomal
surface and is necessary for its activation by amino acids. Cell, 141(2),
290-303. doi:10.1016/j.cell.2010.02.024
Sancak, Y., Peterson, T. R., Shaul, Y. D., Lindquist, R. A., Thoreen, C. C., Bar-
Peled, L., & Sabatini, D. M. (2008). The Rag GTPases bind raptor and
mediate amino acid signaling to mTORC1. Science, 320(5882), 1496-
1501. doi:10.1126/science.1157535
Sanchez-Lopez, E., Lopez, A. F., Esteban, V., Yague, S., Egido, J., Ruiz-Ortega,
M., & Alvarez-Arroyo, M. V. (2005). Angiotensin II regulates vascular
endothelial growth factor via hypoxia-inducible factor-1alpha induction
and redox mechanisms in the kidney. Antioxid Redox Signal, 7(9-10),
1275-1284. doi:10.1089/ars.2005.7.1275
Sangai, T., Akcakanat, A., Chen, H., Tarco, E., Wu, Y., Do, K. A., . . . Meric-
Bernstam, F. (2012). Biomarkers of response to Akt inhibitor MK-2206
in breast cancer. Clin Cancer Res, 18(20), 5816-5828.
doi:10.1158/1078-0432.CCR-12-1141
Sawyer, T., Boyce, B., Dalgarno, D., & Iuliucci, J. (2001). Src inhibitors:
genomics to therapeutics. Expert Opin Investig Drugs, 10(7), 1327-
1344. doi:10.1517/13543784.10.7.1327
Schneider, M., Marison, I. W., & von Stockar, U. (1996). The importance of
ammonia in mammalian cell culture. J Biotechnol, 46(3), 161-185.
Schroedl, C., McClintock, D. S., Budinger, G. R., & Chandel, N. S. (2002).
Hypoxic but not anoxic stabilization of HIF-1alpha requires
mitochondrial reactive oxygen species. Am J Physiol Lung Cell Mol
Physiol, 283(5), L922-931. doi:10.1152/ajplung.00014.2002
178
Schurmann, A., Brauers, A., Massmann, S., Becker, W., & Joost, H. G. (1995).
Cloning of a novel family of mammalian GTP-binding proteins (RagA,
RagBs, RagB1) with remote similarity to the Ras-related GTPases. J
Biol Chem, 270(48), 28982-28988.
Sekiguchi, T., Hirose, E., Nakashima, N., Ii, M., & Nishimoto, T. (2001). Novel
G proteins, Rag C and Rag D, interact with GTP-binding proteins, Rag
A and Rag B. J Biol Chem, 276(10), 7246-7257.
doi:10.1074/jbc.M004389200
Sellers, K., Fox, M. P., Bousamra, M., 2nd, Slone, S. P., Higashi, R. M., Miller,
D. M., . . . Fan, T. W. (2015). Pyruvate carboxylase is critical for non-
small-cell lung cancer proliferation. J Clin Invest, 125(2), 687-698.
doi:10.1172/JCI72873
Semenza, G. L. (2003). Targeting HIF-1 for cancer therapy. Nat Rev Cancer,
3(10), 721-732. doi:10.1038/nrc1187
Semenza, G. L. (2007). HIF-1 mediates the Warburg effect in clear cell renal
carcinoma. J Bioenerg Biomembr, 39(3), 231-234. doi:10.1007/s10863-
007-9081-2
Semenza, G. L. (2013). HIF-1 mediates metabolic responses to intratumoral
hypoxia and oncogenic mutations. J Clin Invest, 123(9), 3664-3671.
doi:10.1172/JCI67230
Semenza, G. L., Jiang, B. H., Leung, S. W., Passantino, R., Concordet, J. P.,
Maire, P., & Giallongo, A. (1996). Hypoxia response elements in the
aldolase A, enolase 1, and lactate dehydrogenase A gene promoters
contain essential binding sites for hypoxia-inducible factor 1. J Biol
Chem, 271(51), 32529-32537.
Semenza, G. L., Nejfelt, M. K., Chi, S. M., & Antonarakis, S. E. (1991).
Hypoxia-inducible nuclear factors bind to an enhancer element located
3' to the human erythropoietin gene. Proc Natl Acad Sci U S A, 88(13),
5680-5684.
Shackelford, D. B., Vasquez, D. S., Corbeil, J., Wu, S., Leblanc, M., Wu, C. L.,
. . . Shaw, R. J. (2009). mTOR and HIF-1alpha-mediated tumor
metabolism in an LKB1 mouse model of Peutz-Jeghers syndrome. Proc
Natl Acad Sci U S A, 106(27), 11137-11142.
doi:10.1073/pnas.0900465106
Shoshani, T., Faerman, A., Mett, I., Zelin, E., Tenne, T., Gorodin, S., . . .
Feinstein, E. (2002). Identification of a novel hypoxia-inducible factor
1-responsive gene, RTP801, involved in apoptosis. Mol Cell Biol, 22(7),
2283-2293.
Silverman, L. B., Gelber, R. D., Dalton, V. K., Asselin, B. L., Barr, R. D.,
Clavell, L. A., . . . Sallan, S. E. (2001). Improved outcome for children
with acute lymphoblastic leukemia: results of Dana-Farber Consortium
Protocol 91-01. Blood, 97(5), 1211-1218.
Simon, F., Bockhorn, M., Praha, C., Baba, H. A., Broelsch, C. E., Frilling, A.,
& Weber, F. (2010). Deregulation of HIF1-alpha and hypoxia-regulated
pathways in hepatocellular carcinoma and corresponding non-malignant
liver tissue--influence of a modulated host stroma on the prognosis of
HCC. Langenbecks Arch Surg, 395(4), 395-405. doi:10.1007/s00423-
009-0590-9
Simon, M. P., Tournaire, R., & Pouyssegur, J. (2008). The angiopoietin-2 gene
of endothelial cells is up-regulated in hypoxia by a HIF binding site
179
located in its first intron and by the central factors GATA-2 and Ets-1. J
Cell Physiol, 217(3), 809-818. doi:10.1002/jcp.21558
Skop, V., Cahova, M., Papackova, Z., Palenickova, E., Dankova, H.,
Baranowski, M., . . . Kazdova, L. (2012). Autophagy-lysosomal
pathway is involved in lipid degradation in rat liver. Physiol Res, 61(3),
287-297.
Smirnova, N. A., Hushpulian, D. M., Speer, R. E., Gaisina, I. N., Ratan, R. R.,
& Gazaryan, I. G. (2012). Catalytic mechanism and substrate specificity
of HIF prolyl hydroxylases. Biochemistry (Mosc), 77(10), 1108-1119.
doi:10.1134/S0006297912100033
Sreekumar, A., Poisson, L. M., Rajendiran, T. M., Khan, A. P., Cao, Q., Yu, J.,
. . . Chinnaiyan, A. M. (2009). Metabolomic profiles delineate potential
role for sarcosine in prostate cancer progression. Nature, 457(7231),
910-914. doi:10.1038/nature07762
Stacey, D. W. (2003). Cyclin D1 serves as a cell cycle regulatory switch in
actively proliferating cells. Curr Opin Cell Biol, 15(2), 158-163.
Starkov, A. A., & Fiskum, G. (2003). Regulation of brain mitochondrial H2O2
production by membrane potential and NAD(P)H redox state. J
Neurochem, 86(5), 1101-1107.
Stegink, L. D., Filer, L. J., Jr., Brummel, M. C., Baker, G. L., Krause, W. L.,
Bell, E. F., & Ziegler, E. E. (1991). Plasma amino acid concentrations
and amino acid ratios in normal adults and adults heterozygous for
phenylketonuria ingesting a hamburger and milk shake meal. Am J Clin
Nutr, 53(3), 670-675.
Stein, W. H., & Moore, S. (1954). The free amino acids of human blood plasma.
J Biol Chem, 211(2), 915-926.
Su, N., Pan, Y. X., Zhou, M., Harvey, R. C., Hunger, S. P., & Kilberg, M. S.
(2008). Correlation between asparaginase sensitivity and asparagine
synthetase protein content, but not mRNA, in acute lymphoblastic
leukemia cell lines. Pediatr Blood Cancer, 50(2), 274-279.
doi:10.1002/pbc.21213
Suda, T., Takubo, K., & Semenza, G. L. (2011). Metabolic regulation of
hematopoietic stem cells in the hypoxic niche. Cell Stem Cell, 9(4), 298-
310. doi:10.1016/j.stem.2011.09.010
Sullivan, L. B., Martinez-Garcia, E., Nguyen, H., Mullen, A. R., Dufour, E.,
Sudarshan, S., . . . Chandel, N. S. (2013). The proto-oncometabolite
fumarate binds glutathione to amplify ROS-dependent signaling. Mol
Cell, 51(2), 236-248. doi:10.1016/j.molcel.2013.05.003
Summerskill, W. H., & Wolpert, E. (1970). Ammonia metabolism in the gut.
Am J Clin Nutr, 23(5), 633-639.
Szweda, L. I., & Atkinson, D. E. (1990). Response of rat liver glutaminase to
pH, ammonium, and citrate. Possible regulatory role of glutaminase in
ureagenesis. J Biol Chem, 265(34), 20869-20873.
Tacchini, L., Dansi, P., Matteucci, E., & Desiderio, M. A. (2001). Hepatocyte
growth factor signalling stimulates hypoxia inducible factor-1 (HIF-1)
activity in HepG2 hepatoma cells. Carcinogenesis, 22(9), 1363-1371.
Talks, K. L., Turley, H., Gatter, K. C., Maxwell, P. H., Pugh, C. W., Ratcliffe,
P. J., & Harris, A. L. (2000). The expression and distribution of the
hypoxia-inducible factors HIF-1alpha and HIF-2alpha in normal human
180
tissues, cancers, and tumor-associated macrophages. Am J Pathol,
157(2), 411-421.
Tardito, S., Uggeri, J., Bozzetti, C., Bianchi, M. G., Rotoli, B. M., Franchi-
Gazzola, R., . . . Bussolati, O. (2007). The inhibition of glutamine
synthetase sensitizes human sarcoma cells to L-asparaginase. Cancer
Chemother Pharmacol, 60(5), 751-758. doi:10.1007/s00280-007-0421-
z
Taylor, L., & Curthoys, N. P. (2004). Glutamine metabolism: Role in acid-base
balance*. Biochem Mol Biol Educ, 32(5), 291-304.
doi:10.1002/bmb.2004.494032050388
Thirstrup, K., Christensen, S., Moller, H. A., Ritzen, A., Bergstrom, A. L.,
Sager, T. N., & Jensen, H. S. (2011). Endogenous 2-oxoglutarate levels
impact potencies of competitive HIF prolyl hydroxylase inhibitors.
Pharmacol Res, 64(3), 268-273. doi:10.1016/j.phrs.2011.03.017
Ullah, M. S., Davies, A. J., & Halestrap, A. P. (2006). The plasma membrane
lactate transporter MCT4, but not MCT1, is up-regulated by hypoxia
through a HIF-1alpha-dependent mechanism. J Biol Chem, 281(14),
9030-9037. doi:10.1074/jbc.M511397200
van de Poll, M. C., Soeters, P. B., Deutz, N. E., Fearon, K. C., & Dejong, C. H.
(2004). Renal metabolism of amino acids: its role in interorgan amino
acid exchange. Am J Clin Nutr, 79(2), 185-197.
Vandesompele, J., De Preter, K., Pattyn, F., Poppe, B., Van Roy, N., De Paepe,
A., & Speleman, F. (2002). Accurate normalization of real-time
quantitative RT-PCR data by geometric averaging of multiple internal
control genes. Genome Biol, 3(7), RESEARCH0034.
Vanhaesebroeck, B., & Alessi, D. R. (2000). The PI3K-PDK1 connection: more
than just a road to PKB. Biochem J, 346 Pt 3, 561-576.
Varma, S., & Cohen, H. J. (1997). Co-transactivation of the 3' erythropoietin
hypoxia inducible enhancer by the HIF-1 protein. Blood Cells Mol Dis,
23(2), 169-176.
Vaupel, P., & Mayer, A. (2007). Hypoxia in cancer: significance and impact on
clinical outcome. Cancer Metastasis Rev, 26(2), 225-239.
doi:10.1007/s10555-007-9055-1
Vezina, C., Kudelski, A., & Sehgal, S. N. (1975). Rapamycin (AY-22,989), a
new antifungal antibiotic. I. Taxonomy of the producing streptomycete
and isolation of the active principle. J Antibiot (Tokyo), 28(10), 721-726.
Villar, V. H., Merhi, F., Djavaheri-Mergny, M., & Duran, R. V. (2015).
Glutaminolysis and autophagy in cancer. Autophagy, 11(8), 1198-1208.
doi:10.1080/15548627.2015.1053680
Vissers, M. C., Kuiper, C., & Dachs, G. U. (2014). Regulation of the 2-
oxoglutarate-dependent dioxygenases and implications for cancer.
Biochem Soc Trans, 42(4), 945-951. doi:10.1042/BST20140118
Voccoli, V., Tonazzini, I., Signore, G., Caleo, M., & Cecchini, M. (2014). Role
of extracellular calcium and mitochondrial oxygen species in
psychosine-induced oligodendrocyte cell death. Cell Death Dis, 5,
e1529. doi:10.1038/cddis.2014.483
Walker, V. (2012). Severe hyperammonaemia in adults not explained by liver
disease. Ann Clin Biochem, 49(Pt 3), 214-228.
doi:10.1258/acb.2011.011206
181
Walker, V. (2014). Ammonia metabolism and hyperammonemic disorders. Adv
Clin Chem, 67, 73-150. doi:10.1016/bs.acc.2014.09.002
Wang, J. B., Erickson, J. W., Fuji, R., Ramachandran, S., Gao, P., Dinavahi, R.,
. . . Cerione, R. A. (2010). Targeting mitochondrial glutaminase activity
inhibits oncogenic transformation. Cancer Cell, 18(3), 207-219.
doi:10.1016/j.ccr.2010.08.009
Wang, X., Campbell, L. E., Miller, C. M., & Proud, C. G. (1998). Amino acid
availability regulates p70 S6 kinase and multiple translation factors.
Biochem J, 334 ( Pt 1), 261-267.
Warburg, O. (1956a). On respiratory impairment in cancer cells. Science,
124(3215), 269-270.
Warburg, O. (1956b). On the origin of cancer cells. Science, 123(3191), 309-
314.
Warburg, O., Wind, F., & Negelein, E. (1927). The Metabolism of Tumors in
the Body. J Gen Physiol, 8(6), 519-530.
Wasserstrom, J. A., & Aistrup, G. L. (2005). Digitalis: new actions for an old
drug. Am J Physiol Heart Circ Physiol, 289(5), H1781-1793.
doi:10.1152/ajpheart.00707.2004
Watanabe-Asano, T., Kuma, A., & Mizushima, N. (2014). Cycloheximide
inhibits starvation-induced autophagy through mTORC1 activation.
Biochem Biophys Res Commun, 445(2), 334-339.
doi:10.1016/j.bbrc.2014.01.180
Wilkinson, D. J., Smeeton, N. J., & Watt, P. W. (2010). Ammonia metabolism,
the brain and fatigue; revisiting the link. Prog Neurobiol, 91(3), 200-
219. doi:10.1016/j.pneurobio.2010.01.012
Wise, D. R., DeBerardinis, R. J., Mancuso, A., Sayed, N., Zhang, X. Y., Pfeiffer,
H. K., . . . Thompson, C. B. (2008). Myc regulates a transcriptional
program that stimulates mitochondrial glutaminolysis and leads to
glutamine addiction. Proc Natl Acad Sci U S A, 105(48), 18782-18787.
doi:10.1073/pnas.0810199105
Wright, G., Noiret, L., Olde Damink, S. W., & Jalan, R. (2011). Interorgan
ammonia metabolism in liver failure: the basis of current and future
therapies. Liver Int, 31(2), 163-175. doi:10.1111/j.1478-
3231.2010.02302.x
Xie, L., Pi, X., Mishra, A., Fong, G., Peng, J., & Patterson, C. (2012). PHD3-
dependent hydroxylation of HCLK2 promotes the DNA damage
response. J Clin Invest, 122(8), 2827-2836. doi:10.1172/JCI62374
Xiong, G., Deng, L., Zhu, J., Rychahou, P. G., & Xu, R. (2014). Prolyl-4-
hydroxylase alpha subunit 2 promotes breast cancer progression and
metastasis by regulating collagen deposition. BMC Cancer, 14, 1.
doi:10.1186/1471-2407-14-1
Xu, W., Yang, H., Liu, Y., Yang, Y., Wang, P., Kim, S. H., . . . Xiong, Y. (2011).
Oncometabolite 2-hydroxyglutarate is a competitive inhibitor of alpha-
ketoglutarate-dependent dioxygenases. Cancer Cell, 19(1), 17-30.
doi:10.1016/j.ccr.2010.12.014
Yamashita, K., Discher, D. J., Hu, J., Bishopric, N. H., & Webster, K. A. (2001).
Molecular regulation of the endothelin-1 gene by hypoxia. Contributions
of hypoxia-inducible factor-1, activator protein-1, GATA-2, AND
p300/CBP. J Biol Chem, 276(16), 12645-12653.
doi:10.1074/jbc.M011344200
182
Yap, T. A., Yan, L., Patnaik, A., Fearen, I., Olmos, D., Papadopoulos, K., . . .
Tolcher, A. W. (2011). First-in-man clinical trial of the oral pan-AKT
inhibitor MK-2206 in patients with advanced solid tumors. J Clin Oncol,
29(35), 4688-4695. doi:10.1200/JCO.2011.35.5263
Yilmaz, O. H., Valdez, R., Theisen, B. K., Guo, W., Ferguson, D. O., Wu, H.,
& Morrison, S. J. (2006). Pten dependence distinguishes haematopoietic
stem cells from leukaemia-initiating cells. Nature, 441(7092), 475-482.
doi:10.1038/nature04703
Yu, J., Li, J., Zhang, S., Xu, X., Zheng, M., Jiang, G., & Li, F. (2012). IGF-1
induces hypoxia-inducible factor 1alpha-mediated GLUT3 expression
through PI3K/Akt/mTOR dependent pathways in PC12 cells. Brain Res,
1430, 18-24. doi:10.1016/j.brainres.2011.10.046
Zeczycki, T. N., Maurice, M. S., & Attwood, P. V. (2010). Inhibitors of
Pyruvate Carboxylase. Open Enzym Inhib J, 3, 8-26.
doi:10.2174/1874940201003010008
Zeller, K. I., Zhao, X., Lee, C. W., Chiu, K. P., Yao, F., Yustein, J. T., . . . Wei,
C. L. (2006). Global mapping of c-Myc binding sites and target gene
networks in human B cells. Proc Natl Acad Sci U S A, 103(47), 17834-
17839. doi:10.1073/pnas.0604129103
Zhang, J., Grindley, J. C., Yin, T., Jayasinghe, S., He, X. C., Ross, J. T., . . . Li,
L. (2006). PTEN maintains haematopoietic stem cells and acts in lineage
choice and leukaemia prevention. Nature, 441(7092), 518-522.
doi:10.1038/nature04747
Zhang, Q., Gu, J., Li, L., Liu, J., Luo, B., Cheung, H. W., . . . Bommi-Reddy,
A. (2009). Control of cyclin D1 and breast tumorigenesis by the EglN2
prolyl hydroxylase. Cancer Cell, 16(5), 413-424.
doi:10.1016/j.ccr.2009.09.029
Zhao, S., Lin, Y., Xu, W., Jiang, W., Zha, Z., Wang, P., . . . Xiong, Y. (2009).
Glioma-derived mutations in IDH1 dominantly inhibit IDH1 catalytic
activity and induce HIF-1alpha. Science, 324(5924), 261-265.
doi:10.1126/science.1170944
Zheng, S. S., Chen, X. H., Yin, X., & Zhang, B. H. (2013). Prognostic
significance of HIF-1alpha expression in hepatocellular carcinoma: a
meta-analysis. PLoS One, 8(6), e65753.
doi:10.1371/journal.pone.0065753


![· Web viewHirotaka et al studies on human placenta have shown HIF-1α induces . hTERT . promoter activity and enhances endogenous TERT expression under hypoxic conditions [36]](https://img.pdfslide.tips/doc/110x75/5d3deed488c9938d248d59d6/-web-viewhirotaka-et-al-studies-on-human-placenta-have-shown-hif-1-induces-.jpg)