Embed Size (px)
DESCRIPTION
Lecturer
Citation preview
Proceedings of the Second Middle East Turbomachinery Symposium 17 – 20 March 2013, Doha, Qatar
Copyright 8 2013 by Turbomachinery Laboratory, Texas A&M University
Investigation of Corrosion Fatigue Phenomena in Transient Zone of Mechanical
Drive Steam Turbines and its Preventive Measures
by
Satoshi Hata Engineering and Design Division
Mitsubishi Heavy Industries, Compressor Corporation
Naoyuki Nagai Hiroshima Research & Development Center
Mitsubishi Heavy Industries, Ltd.
Norihito Fujimura MCO Saudi Arabia, LCC. (MCOSA)
Mitsubishi Heavy Industries, Compressor Corporation
Satoshi Hata Satoshi Hata is a Group Manager within the Turbo Machinery Engineering Department, Mitsubishi Heavy Industries, Ltd., in Hiroshima, Japan. He has 30 year experience in R&D for nuclear uranium centrifuges, turbomolecular pumps, heavy-duty gas turbines, steam turbines and compressors. Mr. Hata has B.S., M.S. and Ph.D. degrees (in Mechanical Engineering) from Kyusyu Institute of Technology.
Naoyuki Nagai Naoyuki Nagai is a Research Manager in the Research & Development Center, at Mitsubishi Heavy Industries, Ltd., in Hiroshima Japan. He has 27 year experience in R&D and troubleshooting for rotor dynamics, torsional dynamics involved in electromagnetic, control and aerodynamic coupling regarding about compressor, steam turbine and driving system. Mr. Nagai received his B.S. and M.S. degrees from Kyushu Institute of Technology and Ph.D. from Hiroshima University (in Mech. Engineering).
Norihito Fujimura Norihito Fujimura is an application engineer of Engineering Department in Global Marketing & Sales Division, Mitsubishi Heavy Industries, Compressor Corporation, in Tokyo, Japan. He has eight years’ experience in designing compressors and steam turbines. Mr. Fujimura has B.S and M.S degrees in Mechanical Engineering from Oita University
ABSTRACT
For mechanical drive steam turbines, the investigation results of corrosion fatigue phenomena in the transient zone are introduced, including basic phenomena on expansion line and actual design and damage experience. These results were analyzed from the standpoint of stress intensity during the start of cracking. In order to resolve such problems, preventive coating and blade design methods against fouling and corrosive environments are developed. Detailed evaluation test results are given for coating performance using a unique test procedure simulating fouling phenomena and washing conditions. Finally, the results of the successful modification of internals and on-line washing results on site are introduced. INTRODUCTION In petrochemical plants, the flow path of process gas compressor drive steam turbines have several kinds of potential damage(1)such as erosion and corrosion, resulting in deterioration of performance and a decrease in strength margin. Especially, in the process of steam expansion, depending on steam pressure and temperature, corrosive chemicals in very low levels of concentration tend to be enriched to a high level. These enriched chemicals deposit on the internal parts of the steam turbine and cause a decrease in strength or blade failure(2). In this paper, the authors investigate the relationship between this enrichment zone, strength safety margin, and blade failure, and the root causes according to analysis of actual blade failures. Based on these investigation results, the authors introduce blade structure improvements in order to increase the safety margin for corrosion fatigue. As one of the factors related to performance deterioration and operation restriction, fouling on nozzle and blade profiles has to be highlighted, and it is necessary to think of some improvements for the prevention of fouling. The authors study surface treatment methods applicable to
Proceedings of the Second Middle East Turbomachinery Symposium 17 – 20 March 2013, Doha, Qatar
Copyright 8 2013 by Turbomachinery Laboratory, Texas A&M University
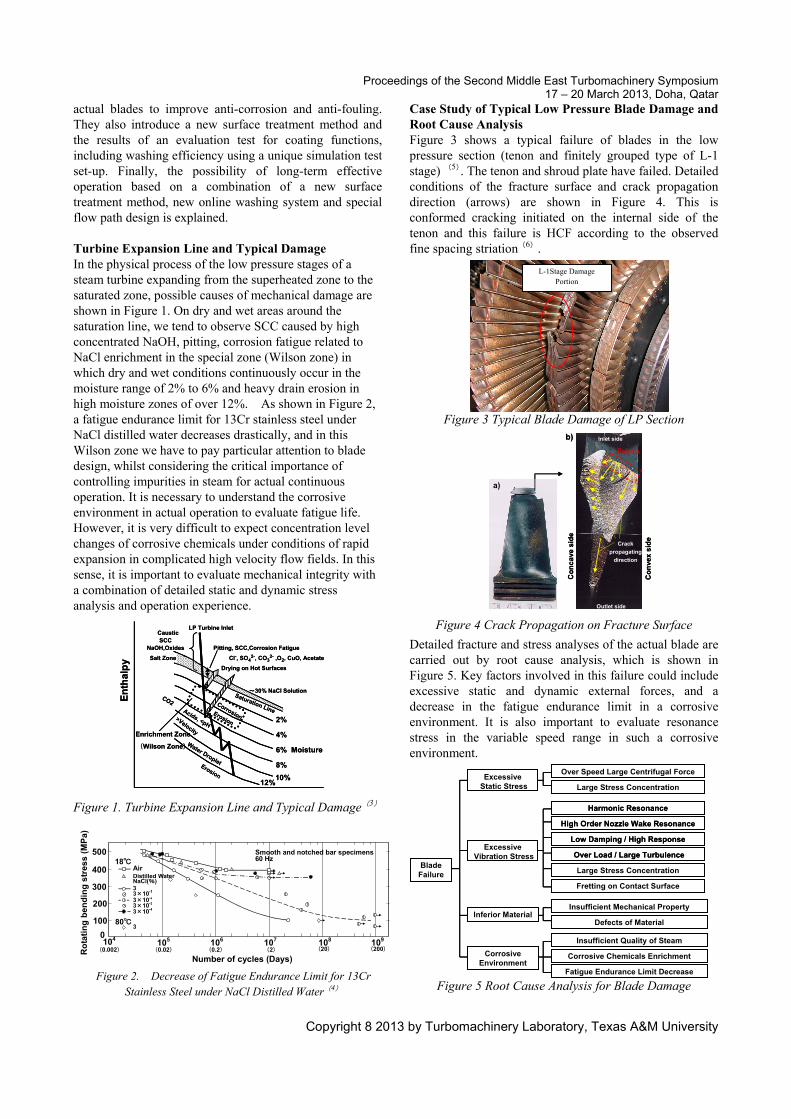
actual blades to improve anti-corrosion and anti-fouling. They also introduce a new surface treatment method and the results of an evaluation test for coating functions, including washing efficiency using a unique simulation test set-up. Finally, the possibility of long-term effective operation based on a combination of a new surface treatment method, new online washing system and special flow path design is explained. Turbine Expansion Line and Typical Damage In the physical process of the low pressure stages of a steam turbine expanding from the superheated zone to the saturated zone, possible causes of mechanical damage are shown in Figure 1. On dry and wet areas around the saturation line, we tend to observe SCC caused by high concentrated NaOH, pitting, corrosion fatigue related to NaCl enrichment in the special zone (Wilson zone) in which dry and wet conditions continuously occur in the moisture range of 2% to 6% and heavy drain erosion in high moisture zones of over 12%. As shown in Figure 2, a fatigue endurance limit for 13Cr stainless steel under NaCl distilled water decreases drastically, and in this Wilson zone we have to pay particular attention to blade design, whilst considering the critical importance of controlling impurities in steam for actual continuous operation. It is necessary to understand the corrosive environment in actual operation to evaluate fatigue life. However, it is very difficult to expect concentration level changes of corrosive chemicals under conditions of rapid expansion in complicated high velocity flow fields. In this sense, it is important to evaluate mechanical integrity with a combination of detailed static and dynamic stress analysis and operation experience.
Figure 1. Turbine Expansion Line and Typical Damage(3)
Case Study of Typical Low Pressure Blade Damage and Root Cause Analysis Figure 3 shows a typical failure of blades in the low pressure section (tenon and finitely grouped type of L-1 stage) (5). The tenon and shroud plate have failed. Detailed conditions of the fracture surface and crack propagation direction (arrows) are shown in Figure 4. This is conformed cracking initiated on the internal side of the tenon and this failure is HCF according to the observed fine spacing striation(6).
Figure 3 Typical Blade Damage of LP Section
Figure 4 Crack Propagation on Fracture Surface
Detailed fracture and stress analyses of the actual blade are carried out by root cause analysis, which is shown in Figure 5. Key factors involved in this failure could include excessive static and dynamic external forces, and a decrease in the fatigue endurance limit in a corrosive environment. It is also important to evaluate resonance stress in the variable speed range in such a corrosive environment.
Figure 5 Root Cause Analysis for Blade Damage
Figure 2. Decrease of Fatigue Endurance Limit for 13Cr Stainless Steel under NaCl Distilled Water(4)
En
thal
py
Moisture
2%
4%
6%
8%
10%12%
Saturation Line
Enrichment Zone
(Wilson Zone)
LP Turbine InletCaustic SCC
NaOH,Oxides
Salt Zone
CorrosionErosion
CO2
Acids, <pH>Velocity
Water DropletErosion
~30% NaCl Solution
Drying on Hot Surfaces
Pitting, SCC,Corrosion Fatigue
Cl-, SO42-, CO3
2- ,O2, CuO, Acetate
500 18℃
Ro
tati
ng
ben
din
g s
tres
s (
MP
a)
Smooth and notched bar specimens60 Hz
400
300
200
100
0 104 105 106 107 108 109
80℃
Air Distilled Water NaCl(%) 3 3×10⁻¹ 3×10⁻² 3×10⁻³ 3×10⁻⁴
3
(0.002)
Number of cycles (Days) (0.02) (0.2) (2) (20) (200)
L-1Stage Damage Portion
Co
nve
x s
ide
Co
nc
ave
sid
e
b)
Point A
Crack
propagating
direction
Outlet side
Inlet side
a)
Co
nve
x s
ide
Co
nc
ave
sid
e
b)
Point A
Crack
propagating
direction
Outlet side
Inlet side
Point A
Crack
propagating
direction
Outlet side
Inlet side
a)
Blade Failure
Insufficient Quality of Steam
Insufficient Mechanical Property
Defects of Material
Over Speed Large Centrifugal Force
Harmonic Resonance
Large Stress Concentration
Large Stress Concentration
High Order Nozzle Wake Resonance
Low Damping / High Response
Fretting on Contact Surface
Corrosive Chemicals Enrichment
Over Load / Large Turbulence
Fatigue Endurance Limit Decrease
Corrosive Environment
Inferior Material
ExcessiveStatic Stress
ExcessiveVibration Stress
Proceedings of the Second Middle East Turbomachinery Symposium 17 – 20 March 2013, Doha, Qatar
Copyright 8 2013 by Turbomachinery Laboratory, Texas A&M University
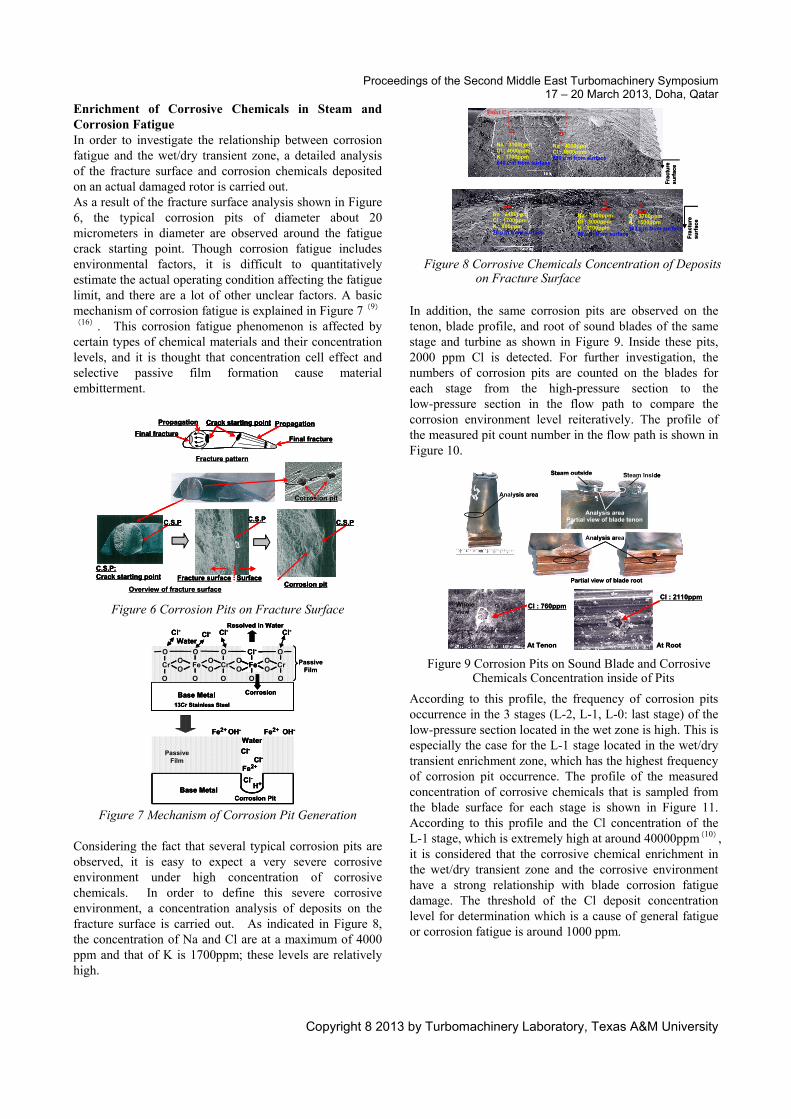
Enrichment of Corrosive Chemicals in Steam and Corrosion Fatigue In order to investigate the relationship between corrosion fatigue and the wet/dry transient zone, a detailed analysis of the fracture surface and corrosion chemicals deposited on an actual damaged rotor is carried out. As a result of the fracture surface analysis shown in Figure 6, the typical corrosion pits of diameter about 20 micrometers in diameter are observed around the fatigue crack starting point. Though corrosion fatigue includes environmental factors, it is difficult to quantitatively estimate the actual operating condition affecting the fatigue limit, and there are a lot of other unclear factors. A basic mechanism of corrosion fatigue is explained in Figure 7(9)
(16). This corrosion fatigue phenomenon is affected by certain types of chemical materials and their concentration levels, and it is thought that concentration cell effect and selective passive film formation cause material embitterment.
Figure 6 Corrosion Pits on Fracture Surface
Figure 7 Mechanism of Corrosion Pit Generation Considering the fact that several typical corrosion pits are observed, it is easy to expect a very severe corrosive environment under high concentration of corrosive chemicals. In order to define this severe corrosive environment, a concentration analysis of deposits on the fracture surface is carried out. As indicated in Figure 8, the concentration of Na and Cl are at a maximum of 4000 ppm and that of K is 1700ppm; these levels are relatively high.
In addition, the same corrosion pits are observed on the tenon, blade profile, and root of sound blades of the same stage and turbine as shown in Figure 9. Inside these pits, 2000 ppm Cl is detected. For further investigation, the numbers of corrosion pits are counted on the blades for each stage from the high-pressure section to the low-pressure section in the flow path to compare the corrosion environment level reiteratively. The profile of the measured pit count number in the flow path is shown in Figure 10.
According to this profile, the frequency of corrosion pits occurrence in the 3 stages (L-2, L-1, L-0: last stage) of the low-pressure section located in the wet zone is high. This is especially the case for the L-1 stage located in the wet/dry transient enrichment zone, which has the highest frequency of corrosion pit occurrence. The profile of the measured concentration of corrosive chemicals that is sampled from the blade surface for each stage is shown in Figure 11. According to this profile and the Cl concentration of the L-1 stage, which is extremely high at around 40000ppm(10), it is considered that the corrosive chemical enrichment in the wet/dry transient zone and the corrosive environment have a strong relationship with blade corrosion fatigue damage. The threshold of the Cl deposit concentration level for determination which is a cause of general fatigue or corrosion fatigue is around 1000 ppm.
Figure 8 Corrosive Chemicals Concentration of Deposits on Fracture Surface
Figure 9 Corrosion Pits on Sound Blade and Corrosive Chemicals Concentration inside of Pits
C.S.P:Crack starting point
C.S.P
Corrosion pit
C.S.P
SurfaceFracture surface
C.S.P
Corrosion pit
Overview of fracture surface
Fracture pattern
Final fracture
Propagation
Final fracture
Propagation Crack starting point
C.S.P:Crack starting point
C.S.P
Corrosion pit
C.S.P
SurfaceFracture surface
C.S.P
Corrosion pit
C.S.P:Crack starting point
C.S.P
Corrosion pit
C.S.P
SurfaceFracture surface
C.S.P
Corrosion pit
Overview of fracture surface
Fracture pattern
Final fracture
Propagation
Final fracture
Propagation Crack starting point
Fracture pattern
Final fracture
Propagation
Final fracture
Propagation Crack starting pointCrack starting point
Base Metal
Cl-
Cl-
WaterOH-
Fe2+
H+
OH-Fe2+ Fe2+
Cl-
Corrosion Pit
13Cr Stainless Steel
Base Metal
O
Cl-
Cr Fe
Cl-OO O
Cl-Cl-
Fe Cr Cr
O OO O O
O OO OO OO O
Cl-
Water
Resolved in Water
Corrosion
Passive Film
Passive Film
Base Metal
Cl-
Cl-
WaterOH-
Fe2+
H+
OH-Fe2+ Fe2+
Cl-
Corrosion PitBase Metal
Cl-
Cl-
WaterOH-
Fe2+
H+
OH-Fe2+ Fe2+
Cl-
Corrosion Pit
13Cr Stainless Steel
Base Metal
O
Cl-
Cr Fe
Cl-OO O
Cl-Cl-
Fe Cr Cr
O OO O O
O OO OO OO O
Cl-
Water
Resolved in Water
Corrosion
13Cr Stainless Steel
Base Metal
O
Cl-
Cr Fe
Cl-OO O
Cl-Cl-
Fe Cr Cr
O OO O O
O OO OO OO O
Cl-
Water
Resolved in Water
Corrosion
Passive Film
Passive Film
g kh
j i Na : 3100ppmCl : 4000ppm K : 1700ppm 640μm from surface
Na : 4000ppm Cl : 1800ppm 890μm from surface
Na : 2400ppmCl : 1700ppm K : 800ppm 70μm from surface
Na : 1900ppm Cl : 3000ppm K : 1100ppm 69μm from surface
Cl : 3700ppmK : 1500ppm 103μm from surface
Point C
Fra
ctu
re
su
rfac
e
Fra
ctu
re
surf
ace
At Tenon
Cl : 760ppmCl : 2110ppm
At Root
Whole view
Analysis area
Partial view of blade tenon
Steam outside Steam inside
Partial view of blade root
Analysis area
Analysis area
At Tenon
Cl : 760ppmCl : 2110ppm
At Root
Whole view
Analysis area
Partial view of blade tenon
Steam outside Steam inside
Partial view of blade root
Analysis area
Analysis area
Proceedings of the Second Middle East Turbomachinery Symposium 17 – 20 March 2013, Doha, Qatar
Copyright 8 2013 by Turbomachinery Laboratory, Texas A&M University
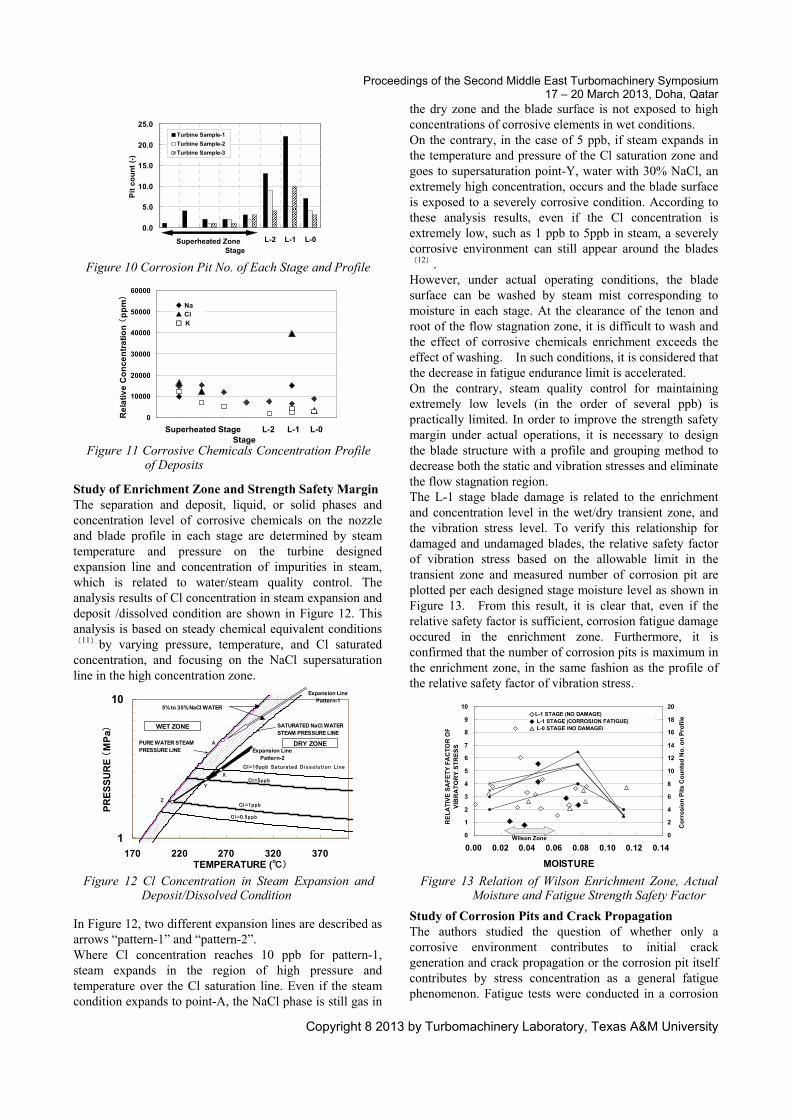
Study of Enrichment Zone and Strength Safety Margin The separation and deposit, liquid, or solid phases and concentration level of corrosive chemicals on the nozzle and blade profile in each stage are determined by steam temperature and pressure on the turbine designed expansion line and concentration of impurities in steam, which is related to water/steam quality control. The analysis results of Cl concentration in steam expansion and deposit /dissolved condition are shown in Figure 12. This analysis is based on steady chemical equivalent conditions(11)by varying pressure, temperature, and Cl saturated concentration, and focusing on the NaCl supersaturation line in the high concentration zone. In Figure 12, two different expansion lines are described as arrows “pattern-1” and “pattern-2”. Where Cl concentration reaches 10 ppb for pattern-1, steam expands in the region of high pressure and temperature over the Cl saturation line. Even if the steam condition expands to point-A, the NaCl phase is still gas in
the dry zone and the blade surface is not exposed to high concentrations of corrosive elements in wet conditions. On the contrary, in the case of 5 ppb, if steam expands in the temperature and pressure of the Cl saturation zone and goes to supersaturation point-Y, water with 30% NaCl, an extremely high concentration, occurs and the blade surface is exposed to a severely corrosive condition. According to these analysis results, even if the Cl concentration is extremely low, such as 1 ppb to 5ppb in steam, a severely corrosive environment can still appear around the blades(12). However, under actual operating conditions, the blade surface can be washed by steam mist corresponding to moisture in each stage. At the clearance of the tenon and root of the flow stagnation zone, it is difficult to wash and the effect of corrosive chemicals enrichment exceeds the effect of washing. In such conditions, it is considered that the decrease in fatigue endurance limit is accelerated. On the contrary, steam quality control for maintaining extremely low levels (in the order of several ppb) is practically limited. In order to improve the strength safety margin under actual operations, it is necessary to design the blade structure with a profile and grouping method to decrease both the static and vibration stresses and eliminate the flow stagnation region. The L-1 stage blade damage is related to the enrichment and concentration level in the wet/dry transient zone, and the vibration stress level. To verify this relationship for damaged and undamaged blades, the relative safety factor of vibration stress based on the allowable limit in the transient zone and measured number of corrosion pit are plotted per each designed stage moisture level as shown in Figure 13. From this result, it is clear that, even if the relative safety factor is sufficient, corrosion fatigue damage occured in the enrichment zone. Furthermore, it is confirmed that the number of corrosion pits is maximum in the enrichment zone, in the same fashion as the profile of the relative safety factor of vibration stress.
Study of Corrosion Pits and Crack Propagation The authors studied the question of whether only a corrosive environment contributes to initial crack generation and crack propagation or the corrosion pit itself contributes by stress concentration as a general fatigue phenomenon. Fatigue tests were conducted in a corrosion
Figure 12 Cl Concentration in Steam Expansion andDeposit/Dissolved Condition
Figure 13 Relation of Wilson Enrichment Zone, Actual Moisture and Fatigue Strength Safety Factor
Figure 10 Corrosion Pit No. of Each Stage and Profile
Figure 11 Corrosive Chemicals Concentration Profile of Deposits
0.0
5.0
10.0
15.0
20.0
25.0
L-2 L-1 L-0
Pit
co
un
t (-
)Turbine Sample-1
Turbine Sample-2
Turbine Sample-3
StageSuperheated Zone
0.0
5.0
10.0
15.0
20.0
25.0
L-2 L-1 L-0
Pit
co
un
t (-
)Turbine Sample-1
Turbine Sample-2
Turbine Sample-3
StageSuperheated Zone
0
10000
20000
30000
40000
50000
60000
0 1 2 3 4 5 6 7 8Stage
Re
lati
ve
Co
nc
en
tra
tio
n (
pp
m)
◆ Na▲ Cl□ K
StageL-2 L-0L-1Superheated Stage
0
10000
20000
30000
40000
50000
60000
0 1 2 3 4 5 6 7 8Stage
Re
lati
ve
Co
nc
en
tra
tio
n (
pp
m)
◆ Na▲ Cl□ K
StageL-2 L-0L-1Superheated Stage
1
10
170 220 270 320 370TEMPERATURE (℃)
PR
ES
SU
RE
(M
Pa)
PURE WATER STEAMPRESSURE LINE
WET ZONE SATURATED NaCl WATERSTEAM PRESSURE LINE
Expansion LinePattern-1
X
Y
Z
A
Expansion LinePattern-2
DRY ZONE
Cl=10ppb Saturated Dissolution Li ne
Cl=5ppb
Cl=1ppb
Cl=0.5ppb
5% to 35% NaCl WATER
0
1
2
3
4
5
6
7
8
9
10
0.00 0.02 0.04 0.06 0.08 0.10 0.12 0.14
MOISTURE
RE
LA
TIV
E S
AF
ET
Y F
AC
TO
R O
FV
IBR
AT
OR
Y S
TR
ES
S
0
2
4
6
8
10
12
14
16
18
20
Co
rro
sio
n P
its
Co
un
ted
No
. on
Pro
file
◇L-1 STAGE (NO DAMAGE)
◆ L-1 STAGE (CORROSION FATIGUE)
△ L-0 STAGE (NO DAMAGE)
Wilson Zone0
1
2
3
4
5
6
7
8
9
10
0.00 0.02 0.04 0.06 0.08 0.10 0.12 0.14
MOISTURE
RE
LA
TIV
E S
AF
ET
Y F
AC
TO
R O
FV
IBR
AT
OR
Y S
TR
ES
S
0
2
4
6
8
10
12
14
16
18
20
Co
rro
sio
n P
its
Co
un
ted
No
. on
Pro
file
◇L-1 STAGE (NO DAMAGE)
◆ L-1 STAGE (CORROSION FATIGUE)
△ L-0 STAGE (NO DAMAGE)
Wilson Zone
Proceedings of the Second Middle East Turbomachinery Symposium 17 – 20 March 2013, Doha, Qatar
Copyright 8 2013 by Turbomachinery Laboratory, Texas A&M University
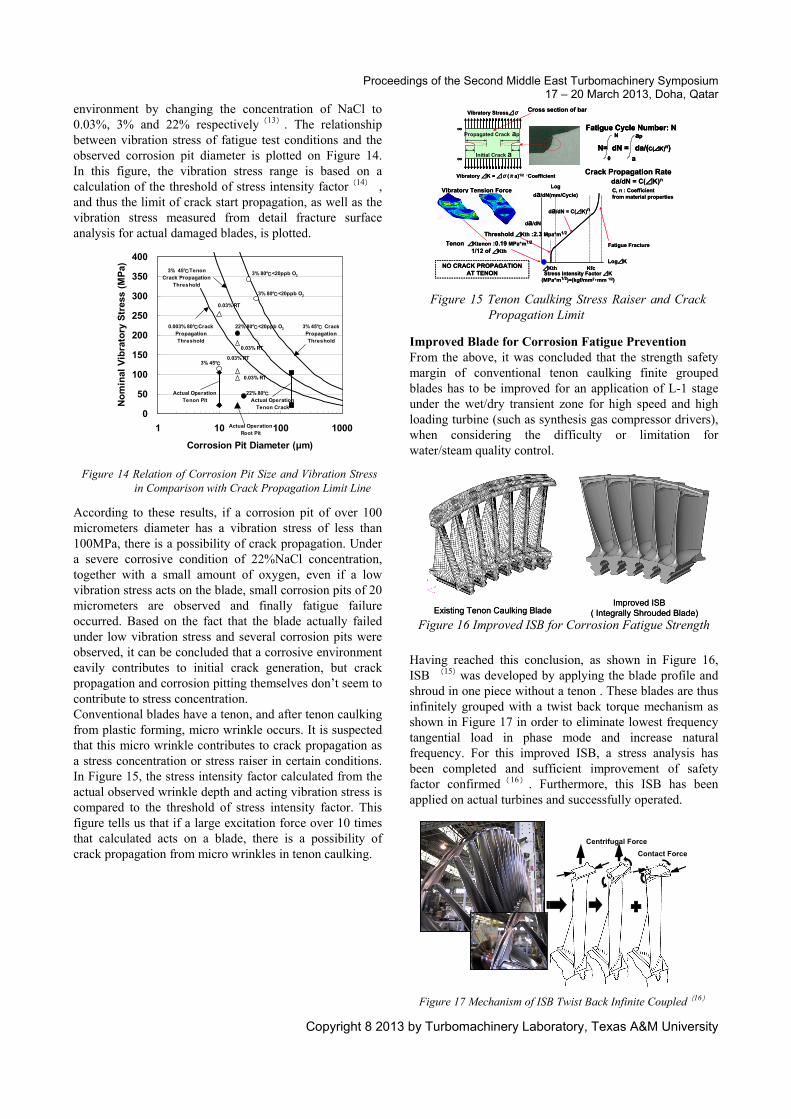
environment by changing the concentration of NaCl to 0.03%, 3% and 22% respectively(13). The relationship between vibration stress of fatigue test conditions and the observed corrosion pit diameter is plotted on Figure 14. In this figure, the vibration stress range is based on a calculation of the threshold of stress intensity factor(14) , and thus the limit of crack start propagation, as well as the vibration stress measured from detail fracture surface analysis for actual damaged blades, is plotted.
According to these results, if a corrosion pit of over 100 micrometers diameter has a vibration stress of less than 100MPa, there is a possibility of crack propagation. Under a severe corrosive condition of 22%NaCl concentration, together with a small amount of oxygen, even if a low vibration stress acts on the blade, small corrosion pits of 20 micrometers are observed and finally fatigue failure occurred. Based on the fact that the blade actually failed under low vibration stress and several corrosion pits were observed, it can be concluded that a corrosive environment eavily contributes to initial crack generation, but crack propagation and corrosion pitting themselves don’t seem to contribute to stress concentration. Conventional blades have a tenon, and after tenon caulking from plastic forming, micro wrinkle occurs. It is suspected that this micro wrinkle contributes to crack propagation as a stress concentration or stress raiser in certain conditions. In Figure 15, the stress intensity factor calculated from the actual observed wrinkle depth and acting vibration stress is compared to the threshold of stress intensity factor. This figure tells us that if a large excitation force over 10 times that calculated acts on a blade, there is a possibility of crack propagation from micro wrinkles in tenon caulking.
Improved Blade for Corrosion Fatigue Prevention From the above, it was concluded that the strength safety margin of conventional tenon caulking finite grouped blades has to be improved for an application of L-1 stage under the wet/dry transient zone for high speed and high loading turbine (such as synthesis gas compressor drivers), when considering the difficulty or limitation for water/steam quality control.
Figure 16 Improved ISB for Corrosion Fatigue Strength
Having reached this conclusion, as shown in Figure 16, ISB (15)was developed by applying the blade profile and shroud in one piece without a tenon . These blades are thus infinitely grouped with a twist back torque mechanism as shown in Figure 17 in order to eliminate lowest frequency tangential load in phase mode and increase natural frequency. For this improved ISB, a stress analysis has been completed and sufficient improvement of safety factor confirmed(16) . Furthermore, this ISB has been applied on actual turbines and successfully operated.
Figure 17 Mechanism of ISB Twist Back Infinite Coupled(16)
Figure 14 Relation of Corrosion Pit Size and Vibration Stress in Comparison with Crack Propagation Limit Line
Figure 15 Tenon Caulking Stress Raiser and Crack Propagation Limit
0
50
100
150
200
250
300
350
400
1 10 100 1000
Corrosion Pit Diameter (μm)
No
min
al V
ibra
tory
Str
ess
(MP
a)
0.03% RT
3% 80℃<20ppb O2
3% 80℃<20ppb O2
22% 80℃<20ppb O2
0.03% RT
0.03% RT
0.03% RT
3% 45℃
22% 80℃Actual OperationTenon Pit
0.003% 80℃CrackPropagationThreshold
3% 45℃ CrackPropagationThreshold
3% 45℃TenonCrack Propagation
Threshold
Actual OperationTenon Crack
Actual OperationRoot Pit
Threshold ⊿Kth :2.3 Mpa*m1/2
Fatigue Cycle Number: N
N= dN = da/(C(⊿K)n)0
N
a
ap
Crack Propagation Rateda/dN = C(⊿K)n
Stress Intensity Factor ⊿K(MPa*m1/2)=(kgf/mm2・mm 1/2)
Log⊿K
Log
da/dN(mm/Cycle)
⊿Kth Kfc
da/dN = C(⊿K)n
Fatigue Fracture
da/dN
Tenon ⊿Ktenon :0.19 MPa*m1/2
1/12 of ⊿Kth
NO CRACK PROPAGATIONAT TENON
Vibratory Stress⊿σ
Initial Crack a
Propagated Crack ap
Vibratory ⊿K = ⊿σ(πa)1/2 ・Coefficient
∞
∞
Vibratory Tension Force C, n : Coefficientfrom material properties
Cross section of bar
Threshold ⊿Kth :2.3 Mpa*m1/2
Fatigue Cycle Number: N
N= dN = da/(C(⊿K)n)0
N
a
apFatigue Cycle Number: N
N= dN = da/(C(⊿K)n)0
N
a
ap
Crack Propagation Rateda/dN = C(⊿K)n
Stress Intensity Factor ⊿K(MPa*m1/2)=(kgf/mm2・mm 1/2)
Log⊿K
Log
da/dN(mm/Cycle)
⊿Kth Kfc
da/dN = C(⊿K)n
Fatigue Fracture
da/dN
Tenon ⊿Ktenon :0.19 MPa*m1/2
1/12 of ⊿Kth
NO CRACK PROPAGATIONAT TENON
Vibratory Stress⊿σ
Initial Crack a
Propagated Crack ap
Vibratory ⊿K = ⊿σ(πa)1/2 ・Coefficient
∞
∞
Vibratory Tension Force C, n : Coefficientfrom material properties
Cross section of bar
Existing Tenon Caulking Blade ( Integrally Shrouded Blade)Improved ISB
Existing Tenon Caulking Blade ( Integrally Shrouded Blade)Improved ISB
Centrifugal Force
Contact Force
Centrifugal Force
Contact Force
Proceedings of the Second Middle East Turbomachinery Symposium 17 – 20 March 2013, Doha, Qatar
Copyright 8 2013 by Turbomachinery Laboratory, Texas A&M University
Surface Treatment Methods and Features for Prevention of Flow Path Damage The authors have introduced blade structure improvements in order to increase the safety margin for corrosion fatigue. A key factor related to performance deterioration and operation restriction needing emphasis is fouling on nozzle and blade profiles. It is necessary to think of some improvement for the prevention of such fouling. Accordingly. the authors have studied surface treatment methods applied to actual blades to improve anti-corrosion and anti-fouling. Applicable surface treatments for rotating machines to prevent classified damage phases are shown in Table 1. Several surface treatment methods corresponding to operation environment have been applied for prevention of erosion damage by solid particles and water droplets, fouling on the flow path, and corrosion fatigue. Recently developed and improved methods are boronizing, ion plating, plasma transfer arc welding, and radical notarization plus Nickel Phosphate multilayer hybrid coating. These methods are introduced in this paper.
Furthermore, multilayer hybrid spray coating is applied for compressor impeller assemblies to prevent or relax fouling of internals as shown in Table 2. However, the bonding strength for this type of coating is generally low and it is difficult to maintain the initial coating function during long-term operation.
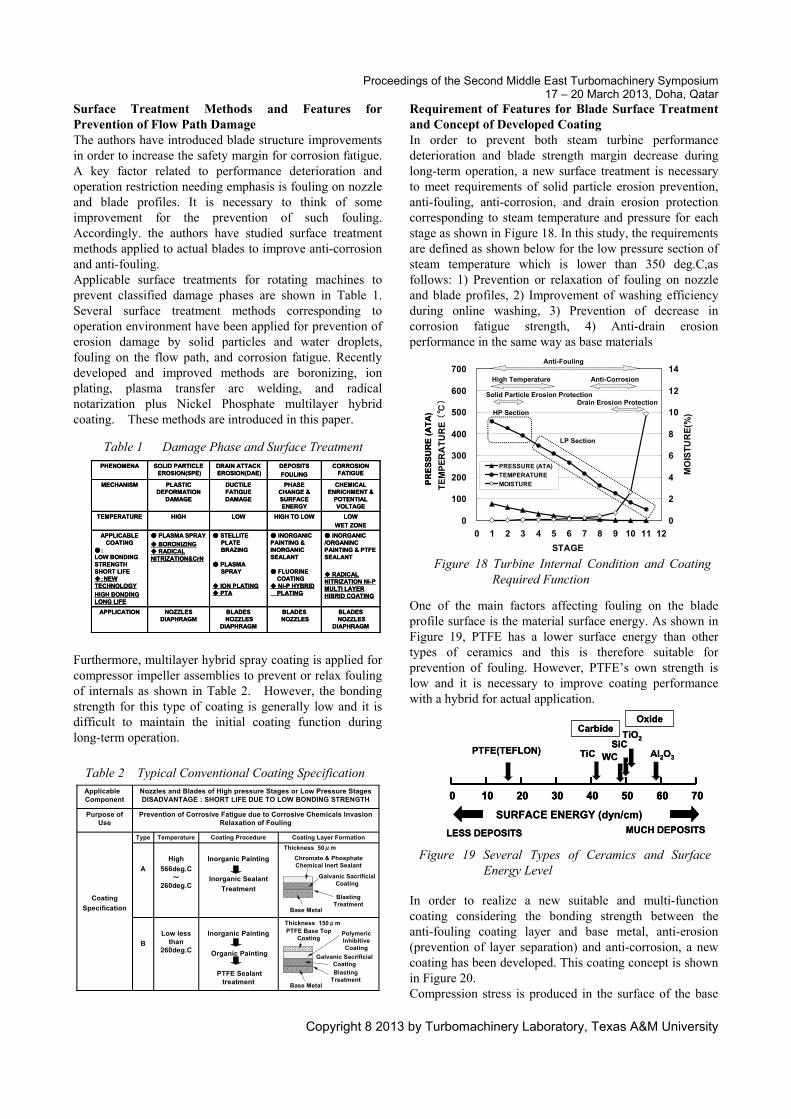
Requirement of Features for Blade Surface Treatment and Concept of Developed Coating In order to prevent both steam turbine performance deterioration and blade strength margin decrease during long-term operation, a new surface treatment is necessary to meet requirements of solid particle erosion prevention, anti-fouling, anti-corrosion, and drain erosion protection corresponding to steam temperature and pressure for each stage as shown in Figure 18. In this study, the requirements are defined as shown below for the low pressure section of steam temperature which is lower than 350 deg.C,as follows: 1) Prevention or relaxation of fouling on nozzle and blade profiles, 2) Improvement of washing efficiency during online washing, 3) Prevention of decrease in corrosion fatigue strength, 4) Anti-drain erosion performance in the same way as base materials
One of the main factors affecting fouling on the blade profile surface is the material surface energy. As shown in Figure 19, PTFE has a lower surface energy than other types of ceramics and this is therefore suitable for prevention of fouling. However, PTFE’s own strength is low and it is necessary to improve coating performance with a hybrid for actual application.
In order to realize a new suitable and multi-function coating considering the bonding strength between the anti-fouling coating layer and base metal, anti-erosion (prevention of layer separation) and anti-corrosion, a new coating has been developed. This coating concept is shown in Figure 20. Compression stress is produced in the surface of the base
Table 1 Damage Phase and Surface Treatment
Figure 18 Turbine Internal Condition and Coating Required Function
Figure 19 Several Types of Ceramics and Surface Energy Level
BLADESNOZZLES
DIAPHRAGM
BLADESNOZZLES
BLADESNOZZLES
DIAPHRAGM
NOZZLESDIAPHRAGM
APPLICATION
● INORGANIC /ORGANINC PAINTING & PTFE SEALANT
◆ RADICAL NITRIZATION Ni-P MULTI LAYER HIBRID COATING
LOW
WET ZONE
CHEMICAL ENRICHMENT &
POTENTIAL VOLTAGE
CORROSION FATIGUE
● INORGANIC PAINTING & INORGANIC SEALANT
● FLUORINECOATING
◆ Ni-P HYBRID PLATING
● STELLITEPLATEBRAZING
● PLASMASPRAY
◆ ION PLATING◆ PTA
● PLASMA SPRAY
◆ BORONIZING◆ RADICAL NITRIZATION&CrN
APPLICABLECOATING
●:LOW BONDING STRENGTH SHORT LIFE ◆:NEW TECHNOLOGY
HIGH BONDING LONG LIFE
HIGH TO LOWLOWHIGHTEMPERATURE
PHASE CHANGE & SURFACE ENERGY
DUCTILE FATIGUE DAMAGE
PLASTIC DEFORMATION
DAMAGE
MECHANISM
DEPOSITS
FOULING
DRAIN ATTACKEROSION(DAE)
SOLID PARTICLE EROSION(SPE)
PHENOMENA
BLADESNOZZLES
DIAPHRAGM
BLADESNOZZLES
BLADESNOZZLES
DIAPHRAGM
NOZZLESDIAPHRAGM
APPLICATION
● INORGANIC /ORGANINC PAINTING & PTFE SEALANT
◆ RADICAL NITRIZATION Ni-P MULTI LAYER HIBRID COATING
LOW
WET ZONE
CHEMICAL ENRICHMENT &
POTENTIAL VOLTAGE
CORROSION FATIGUE
● INORGANIC PAINTING & INORGANIC SEALANT
● FLUORINECOATING
◆ Ni-P HYBRID PLATING
● STELLITEPLATEBRAZING
● PLASMASPRAY
◆ ION PLATING◆ PTA
● PLASMA SPRAY
◆ BORONIZING◆ RADICAL NITRIZATION&CrN
APPLICABLECOATING
●:LOW BONDING STRENGTH SHORT LIFE ◆:NEW TECHNOLOGY
HIGH BONDING LONG LIFE
HIGH TO LOWLOWHIGHTEMPERATURE
PHASE CHANGE & SURFACE ENERGY
DUCTILE FATIGUE DAMAGE
PLASTIC DEFORMATION
DAMAGE
MECHANISM
DEPOSITS
FOULING
DRAIN ATTACKEROSION(DAE)
SOLID PARTICLE EROSION(SPE)
PHENOMENA
Inorganic Painting
Organic Painting
PTFE Sealant treatment
Low less than
260deg.CB
Inorganic Painting
Inorganic Sealant
Treatment
High
566deg.C ~
260deg.C
A
Coating Layer FormationCoating ProcedureTemperatureType
Coating
Specification
Prevention of Corrosive Fatigue due to Corrosive Chemicals Invasion Relaxation of Fouling
Purpose of Use
Nozzles and Blades of High pressure Stages or Low Pressure StagesDISADVANTAGE : SHORT LIFE DUE TO LOW BONDING STRENGTH
Applicable Component
Blasting Treatment
Chromate & Phosphate Chemical Inert Sealant
Galvanic Sacrificial Coating
Base Metal
Thickness 50μm
Thickness 150μm
Blasting Treatment
Galvanic Sacrificial Coating
Base Metal
PTFE Base Top Coating
Polymeric Inhibitive Coating
0
100
200
300
400
500
600
700
0 1 2 3 4 5 6 7 8 9 10 11 12
STAGE
TE
MP
ER
AT
UR
E (
℃)
0
2
4
6
8
10
12
14
MO
IST
UR
E(%
)
PRESSURE (ATA)
TEMPERATURE
MOISTURE
Anti-Fouling
Anti-CorrosionHigh Temperature
Solid Particle Erosion ProtectionDrain Erosion Protection
HP Section
LP Section
PR
ES
SU
RE
(A
TA
)
0
100
200
300
400
500
600
700
0 1 2 3 4 5 6 7 8 9 10 11 12
STAGE
TE
MP
ER
AT
UR
E (
℃)
0
2
4
6
8
10
12
14
MO
IST
UR
E(%
)
PRESSURE (ATA)
TEMPERATURE
MOISTURE
Anti-Fouling
Anti-CorrosionHigh Temperature
Solid Particle Erosion ProtectionDrain Erosion Protection
HP Section
LP Section
PR
ES
SU
RE
(A
TA
)
0 10 20 30 40 50 60 70
SURFACE ENERGY (dyn/cm)
PTFE(TEFLON) TiC WCSiC
TiO2
Al2O3
CarbideOxide
LESS DEPOSITS MUCH DEPOSITS
0 10 20 30 40 50 60 700 10 20 30 40 50 60 70
SURFACE ENERGY (dyn/cm)
PTFE(TEFLON) TiC WCSiC
TiO2
Al2O3
CarbideOxide
LESS DEPOSITS MUCH DEPOSITS
Table 2 Typical Conventional Coating Specification
Proceedings of the Second Middle East Turbomachinery Symposium 17 – 20 March 2013, Doha, Qatar
Copyright 8 2013 by Turbomachinery Laboratory, Texas A&M University
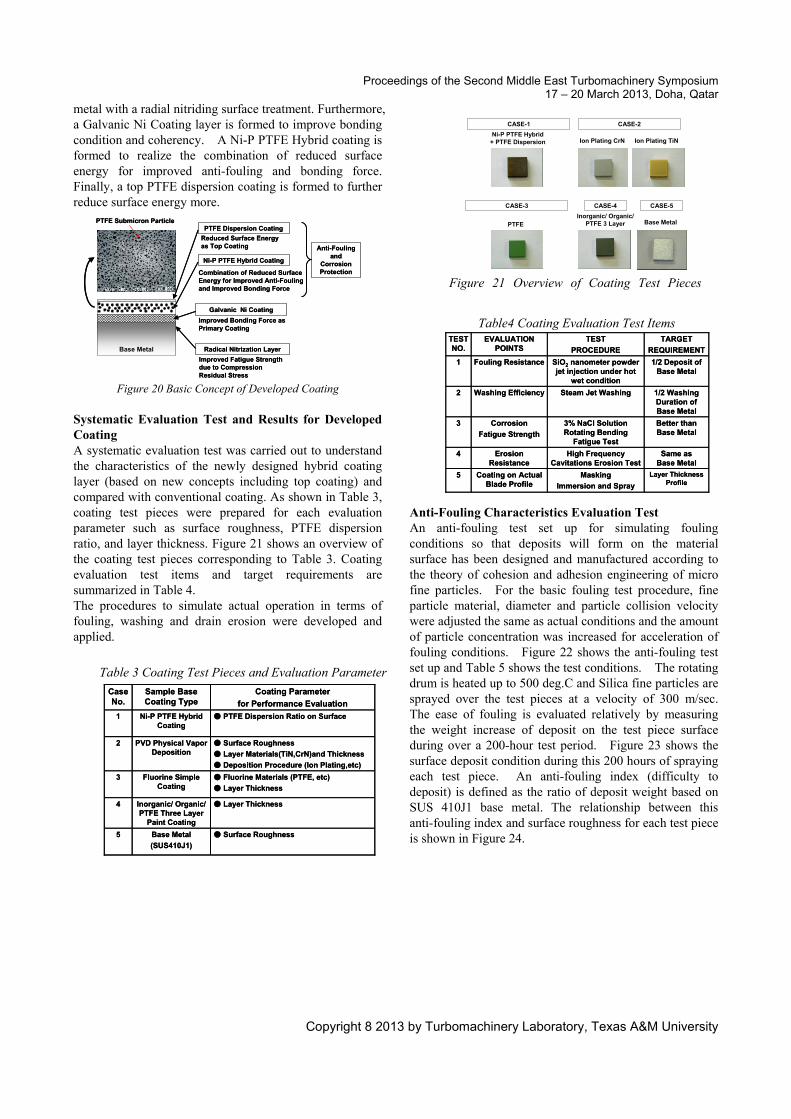
metal with a radial nitriding surface treatment. Furthermore, a Galvanic Ni Coating layer is formed to improve bonding condition and coherency. A Ni-P PTFE Hybrid coating is formed to realize the combination of reduced surface energy for improved anti-fouling and bonding force. Finally, a top PTFE dispersion coating is formed to further reduce surface energy more.
Figure 20 Basic Concept of Developed Coating
Systematic Evaluation Test and Results for Developed Coating A systematic evaluation test was carried out to understand the characteristics of the newly designed hybrid coating layer (based on new concepts including top coating) and compared with conventional coating. As shown in Table 3, coating test pieces were prepared for each evaluation parameter such as surface roughness, PTFE dispersion ratio, and layer thickness. Figure 21 shows an overview of the coating test pieces corresponding to Table 3. Coating evaluation test items and target requirements are summarized in Table 4. The procedures to simulate actual operation in terms of fouling, washing and drain erosion were developed and applied.
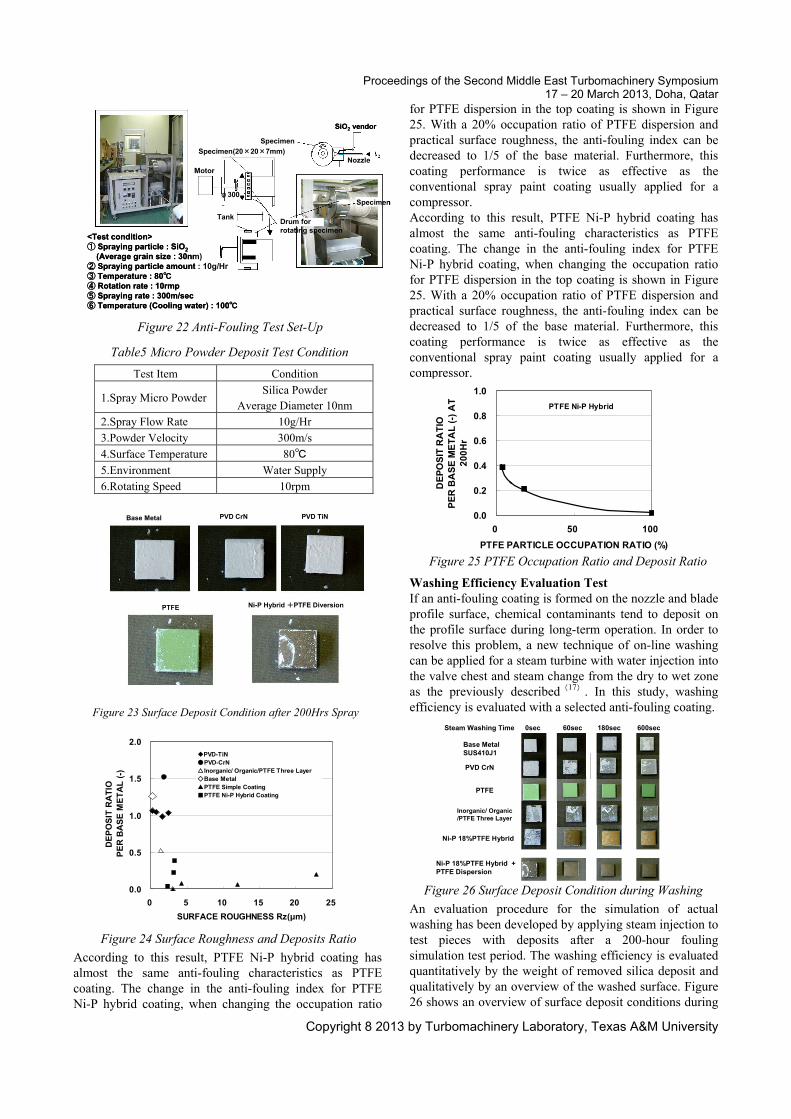
Anti-Fouling Characteristics Evaluation Test An anti-fouling test set up for simulating fouling conditions so that deposits will form on the material surface has been designed and manufactured according to the theory of cohesion and adhesion engineering of micro fine particles. For the basic fouling test procedure, fine particle material, diameter and particle collision velocity were adjusted the same as actual conditions and the amount of particle concentration was increased for acceleration of fouling conditions. Figure 22 shows the anti-fouling test set up and Table 5 shows the test conditions. The rotating drum is heated up to 500 deg.C and Silica fine particles are sprayed over the test pieces at a velocity of 300 m/sec. The ease of fouling is evaluated relatively by measuring the weight increase of deposit on the test piece surface during over a 200-hour test period. Figure 23 shows the surface deposit condition during this 200 hours of spraying each test piece. An anti-fouling index (difficulty to deposit) is defined as the ratio of deposit weight based on SUS 410J1 base metal. The relationship between this anti-fouling index and surface roughness for each test piece is shown in Figure 24.
Table 3 Coating Test Pieces and Evaluation Parameter
Table4 Coating Evaluation Test Items
Radical Nitrization LayerBase Metal
Galvanic Ni Coating
Ni-P PTFE Hybrid Coating
PTFE Dispersion Coating
Improved Fatigue Strength due to Compression Residual Stress
Improved Bonding Force as Primary Coating
Combination of Reduced Surface Energy for Improved Anti-Fouling and Improved Bonding Force
Reduced Surface Energy as Top Coating
PTFE Submicron Particle
Anti-Fouling and
Corrosion Protection
Radical Nitrization LayerBase MetalBase Metal
Galvanic Ni Coating
Ni-P PTFE Hybrid Coating
PTFE Dispersion Coating
Improved Fatigue Strength due to Compression Residual Stress
Improved Bonding Force as Primary Coating
Combination of Reduced Surface Energy for Improved Anti-Fouling and Improved Bonding Force
Reduced Surface Energy as Top Coating
PTFE Submicron Particle
Anti-Fouling and
Corrosion Protection
● Surface Roughness Base Metal
(SUS410J1)
5
● Layer ThicknessInorganic/ Organic/PTFE Three Layer
Paint Coating
4
● Fluorine Materials (PTFE, etc)
● Layer Thickness
Fluorine Simple Coating
3
● Surface Roughness
● Layer Materials(TiN,CrN)and Thickness
● Deposition Procedure (Ion Plating,etc)
PVD Physical Vapor Deposition
2
● PTFE Dispersion Ratio on SurfaceNi-P PTFE Hybrid Coating
1
Coating Parameter
for Performance Evaluation
Sample Base Coating Type
Case No.
Ni-P PTFE Hybrid + PTFE Dispersion
CASE-1
Ion Plating CrN Ion Plating TiN
CASE-2
PTFE
CASE-3
Inorganic/ Organic/PTFE 3 Layer
CASE-4
Base Metal
CASE-5
Layer Thickness Profile
Masking
Immersion and Spray
Coating on Actual Blade Profile
5
Same as Base Metal
High Frequency Cavitations Erosion Test
Erosion Resistance
4
Better than Base Metal
3% NaCl Solution Rotating Bending
Fatigue Test
Corrosion
Fatigue Strength
3
1/2 Washing Duration of Base Metal
Steam Jet WashingWashing Efficiency2
1/2 Deposit of Base Metal
SiO2 nanometer powder jet injection under hot
wet condition
Fouling Resistance1
TARGET
REQUIREMENT
TEST
PROCEDURE
EVALUATION POINTS
TEST NO.
Figure 21 Overview of Coating Test Pieces
Proceedings of the Second Middle East Turbomachinery Symposium 17 – 20 March 2013, Doha, Qatar
Copyright 8 2013 by Turbomachinery Laboratory, Texas A&M University
According to this result, PTFE Ni-P hybrid coating has almost the same anti-fouling characteristics as PTFE coating. The change in the anti-fouling index for PTFE Ni-P hybrid coating, when changing the occupation ratio
for PTFE dispersion in the top coating is shown in Figure 25. With a 20% occupation ratio of PTFE dispersion and practical surface roughness, the anti-fouling index can be decreased to 1/5 of the base material. Furthermore, this coating performance is twice as effective as the conventional spray paint coating usually applied for a compressor. According to this result, PTFE Ni-P hybrid coating has almost the same anti-fouling characteristics as PTFE coating. The change in the anti-fouling index for PTFE Ni-P hybrid coating, when changing the occupation ratio for PTFE dispersion in the top coating is shown in Figure 25. With a 20% occupation ratio of PTFE dispersion and practical surface roughness, the anti-fouling index can be decreased to 1/5 of the base material. Furthermore, this coating performance is twice as effective as the conventional spray paint coating usually applied for a compressor. Washing Efficiency Evaluation Test If an anti-fouling coating is formed on the nozzle and blade profile surface, chemical contaminants tend to deposit on the profile surface during long-term operation. In order to resolve this problem, a new technique of on-line washing can be applied for a steam turbine with water injection into the valve chest and steam change from the dry to wet zone as the previously described(17). In this study, washing efficiency is evaluated with a selected anti-fouling coating.
An evaluation procedure for the simulation of actual washing has been developed by applying steam injection to test pieces with deposits after a 200-hour fouling simulation test period. The washing efficiency is evaluated quantitatively by the weight of removed silica deposit and qualitatively by an overview of the washed surface. Figure 26 shows an overview of surface deposit conditions during
Figure 22 Anti-Fouling Test Set-Up
Figure 23 Surface Deposit Condition after 200Hrs Spray
Table5 Micro Powder Deposit Test Condition
Specimen(20×20×7mm)
Motor
Tank
Specimen
Nozzle
Drum for rotating specimen
φ300Specimen
SiO2 vendor
<Test condition>① Spraying particle : SiO2
(Average grain size : 30nm)② Spraying particle amount : 10g/Hr③ Temperature : 80℃④ Rotation rate : 10rmp⑤ Spraying rate : 300m/sec⑥ Temperature (Cooling water) : 100℃
Test Item Condition
1.Spray Micro Powder Silica Powder
Average Diameter 10nm
2.Spray Flow Rate 10g/Hr
3.Powder Velocity 300m/s
4.Surface Temperature 80℃ 5.Environment Water Supply
6.Rotating Speed 10rpm
PVD CrN PVD TiNBase Metal
PTFE Ni-P Hybrid +PTFE Diversion
0.0
0.2
0.4
0.6
0.8
1.0
0 50 100
PTFE PARTICLE OCCUPATION RATIO (%)
DE
PO
SIT
RA
TIO
PE
R B
AS
E M
ET
AL
(-)
AT
20
0H
r
PTFE Ni-P Hybrid
60sec 180sec 600sec0sec
Base Metal SUS410J1
PVD CrN
PTFE
Steam Washing Time
Ni-P 18%PTFE Hybrid + PTFE Dispersion
Ni-P 18%PTFE Hybrid
Inorganic/ Organic/PTFE Three Layer
Figure 24 Surface Roughness and Deposits Ratio
0.0
0.5
1.0
1.5
2.0
0 5 10 15 20 25
SURFACE ROUGHNESS Rz(μm)
DE
PO
SIT
RA
TIO
PE
R B
AS
E M
ET
AL
(-)
◆PVD-TiN●PVD-CrN△Inorganic/ Organic/PTFE Three Layer◇Base Metal▲PTFE Simple Coating■PTFE Ni-P Hybrid Coating
Figure 26 Surface Deposit Condition during Washing
Figure 25 PTFE Occupation Ratio and Deposit Ratio
Proceedings of the Second Middle East Turbomachinery Symposium 17 – 20 March 2013, Doha, Qatar
Copyright 8 2013 by Turbomachinery Laboratory, Texas A&M University
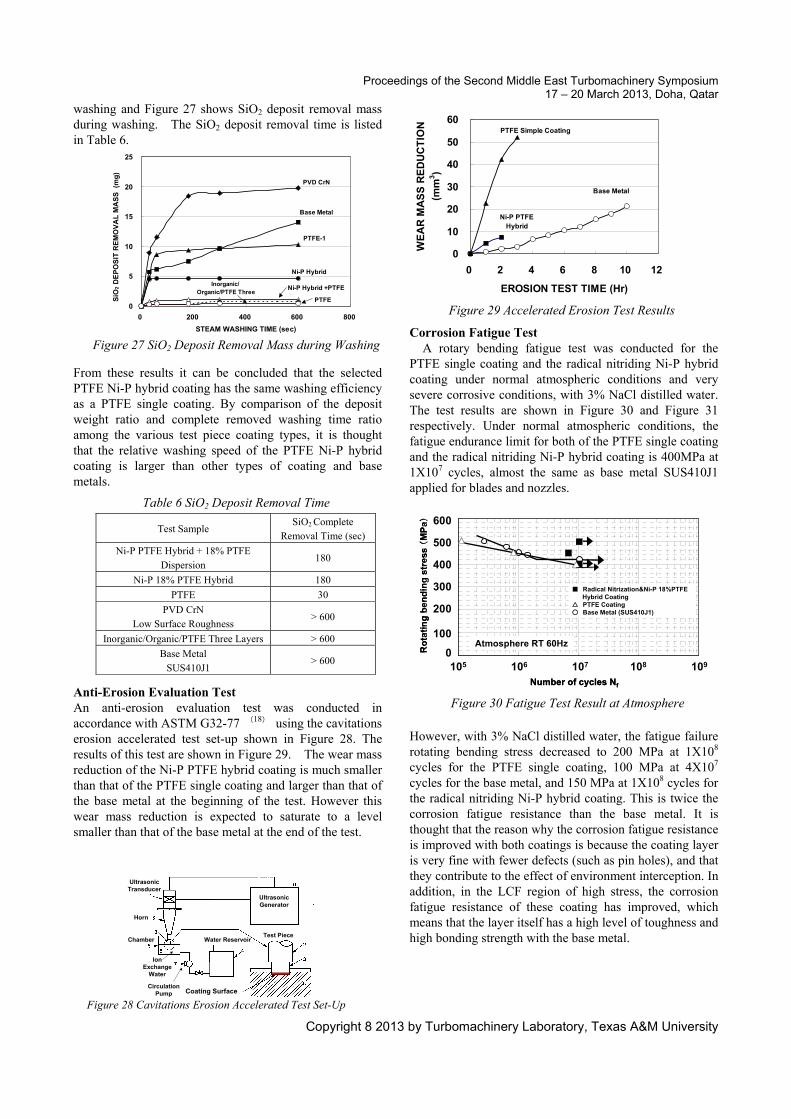
washing and Figure 27 shows SiO2 deposit removal mass during washing. The SiO2 deposit removal time is listed in Table 6.
From these results it can be concluded that the selected PTFE Ni-P hybrid coating has the same washing efficiency as a PTFE single coating. By comparison of the deposit weight ratio and complete removed washing time ratio among the various test piece coating types, it is thought that the relative washing speed of the PTFE Ni-P hybrid coating is larger than other types of coating and base metals. Anti-Erosion Evaluation Test An anti-erosion evaluation test was conducted in accordance with ASTM G32-77 (18) using the cavitations erosion accelerated test set-up shown in Figure 28. The results of this test are shown in Figure 29. The wear mass reduction of the Ni-P PTFE hybrid coating is much smaller than that of the PTFE single coating and larger than that of the base metal at the beginning of the test. However this wear mass reduction is expected to saturate to a level smaller than that of the base metal at the end of the test.
Corrosion Fatigue Test A rotary bending fatigue test was conducted for the PTFE single coating and the radical nitriding Ni-P hybrid coating under normal atmospheric conditions and very severe corrosive conditions, with 3% NaCl distilled water. The test results are shown in Figure 30 and Figure 31 respectively. Under normal atmospheric conditions, the fatigue endurance limit for both of the PTFE single coating and the radical nitriding Ni-P hybrid coating is 400MPa at 1X10⁷ cycles, almost the same as base metal SUS410J1 applied for blades and nozzles.
However, with 3% NaCl distilled water, the fatigue failure rotating bending stress decreased to 200 MPa at 1X10⁸ cycles for the PTFE single coating, 100 MPa at 4X10⁷ cycles for the base metal, and 150 MPa at 1X10⁸ cycles for the radical nitriding Ni-P hybrid coating. This is twice the corrosion fatigue resistance than the base metal. It is thought that the reason why the corrosion fatigue resistance is improved with both coatings is because the coating layer is very fine with fewer defects (such as pin holes), and that they contribute to the effect of environment interception. In addition, in the LCF region of high stress, the corrosion fatigue resistance of these coating has improved, which means that the layer itself has a high level of toughness and high bonding strength with the base metal.
Figure 27 SiO2 Deposit Removal Mass during Washing
Table 6 SiO2 Deposit Removal Time
Figure 29 Accelerated Erosion Test Results
Figure 30 Fatigue Test Result at Atmosphere
0
5
10
15
20
25
0 200 400 600 800
STEAM WASHING TIME (sec)
SiO
2 D
EP
OS
IT R
EM
OV
AL
MA
SS
(m
g)
PVD CrN
Base Metal
PTFE-1
Ni-P Hybrid
Ni-P Hybrid +PTFE
PTFE
Inorganic/ Organic/PTFE Three
Test Sample SiO2 Complete
Removal Time (sec)
Ni-P PTFE Hybrid + 18% PTFE Dispersion
180
Ni-P 18% PTFE Hybrid 180
PTFE 30
PVD CrN Low Surface Roughness
> 600
Inorganic/Organic/PTFE Three Layers > 600
Base Metal SUS410J1
> 600
Coating Surface
Ultrasonic Transducer
Horn
Test PieceWater Reservoir
Ion Exchange
Water
Circulation Pump
Chamber
Ultrasonic Generator
Figure 28 Cavitations Erosion Accelerated Test Set-Up
0
10
20
30
40
50
60
0 2 4 6 8 10 12
EROSION TEST TIME (Hr)
WE
AR
MA
SS
RE
DU
CT
ION
(mm
3)
PTFE Simple Coating
Ni-P PTFEHybrid
Base Metal
Number of cycles Nf
0
100
200
300
400
500
600
1.E+05 1.E+06 1.E+07 1.E+08 1.E+09105 106 107 108 109
100
0
200
300
400
500
600
Ro
tati
ng
ben
din
g s
tres
s (M
Pa)
■ Radical Nitrization&Ni-P 18%PTFE Hybrid Coating△ PTFE Coating○ Base Metal (SUS410J1)
Atmosphere RT 60Hz
Number of cycles Nf
0
100
200
300
400
500
600
1.E+05 1.E+06 1.E+07 1.E+08 1.E+09105 106 107 108 109
100
0
200
300
400
500
600
Ro
tati
ng
ben
din
g s
tres
s (M
Pa)
■ Radical Nitrization&Ni-P 18%PTFE Hybrid Coating△ PTFE Coating○ Base Metal (SUS410J1)
Atmosphere RT 60Hz
Proceedings of the Second Middle East Turbomachinery Symposium 17 – 20 March 2013, Doha, Qatar
Copyright 8 2013 by Turbomachinery Laboratory, Texas A&M University
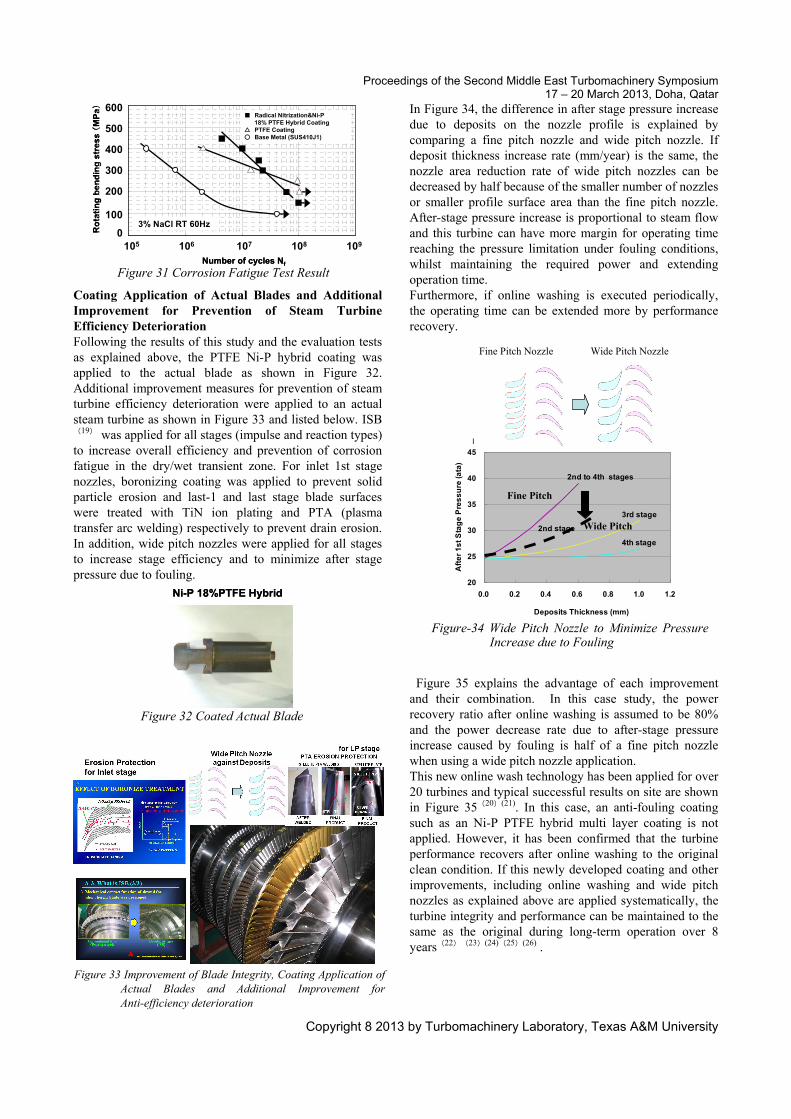
Coating Application of Actual Blades and Additional Improvement for Prevention of Steam Turbine Efficiency Deterioration Following the results of this study and the evaluation tests as explained above, the PTFE Ni-P hybrid coating was applied to the actual blade as shown in Figure 32. Additional improvement measures for prevention of steam turbine efficiency deterioration were applied to an actual steam turbine as shown in Figure 33 and listed below. ISB(19) was applied for all stages (impulse and reaction types) to increase overall efficiency and prevention of corrosion fatigue in the dry/wet transient zone. For inlet 1st stage nozzles, boronizing coating was applied to prevent solid particle erosion and last-1 and last stage blade surfaces were treated with TiN ion plating and PTA (plasma transfer arc welding) respectively to prevent drain erosion. In addition, wide pitch nozzles were applied for all stages to increase stage efficiency and to minimize after stage pressure due to fouling.
In Figure 34, the difference in after stage pressure increase due to deposits on the nozzle profile is explained by comparing a fine pitch nozzle and wide pitch nozzle. If deposit thickness increase rate (mm/year) is the same, the nozzle area reduction rate of wide pitch nozzles can be decreased by half because of the smaller number of nozzles or smaller profile surface area than the fine pitch nozzle. After-stage pressure increase is proportional to steam flow and this turbine can have more margin for operating time reaching the pressure limitation under fouling conditions, whilst maintaining the required power and extending operation time. Furthermore, if online washing is executed periodically, the operating time can be extended more by performance recovery. Figure 35 explains the advantage of each improvement and their combination. In this case study, the power recovery ratio after online washing is assumed to be 80% and the power decrease rate due to after-stage pressure increase caused by fouling is half of a fine pitch nozzle when using a wide pitch nozzle application. This new online wash technology has been applied for over 20 turbines and typical successful results on site are shown in Figure 35(20)(21). In this case, an anti-fouling coating such as an Ni-P PTFE hybrid multi layer coating is not applied. However, it has been confirmed that the turbine performance recovers after online washing to the original clean condition. If this newly developed coating and other improvements, including online washing and wide pitch nozzles as explained above are applied systematically, the turbine integrity and performance can be maintained to the same as the original during long-term operation over 8 years(22)(23)(24)(25)(26) .
Figure 31 Corrosion Fatigue Test Result
Figure 32 Coated Actual Blade
Figure 33 Improvement of Blade Integrity, Coating Application of Actual Blades and Additional Improvement for Anti-efficiency deterioration
Figure-34 Wide Pitch Nozzle to Minimize Pressure Increase due to Fouling
Number of cycles Nf
0
100
200
300
400
500
600
1.E+05 1.E+06 1.E+07 1.E+08 1.E+09
3% NaCl RT 60Hz
105 106
■ Radical Nitrization&Ni-P18% PTFE Hybrid Coating
△ PTFE Coating○ Base Metal (SUS410J1)
107 108 109
100
0
200
300
400
500
600R
ota
tin
g b
en
din
g s
tres
s (
MP
a)
Number of cycles Nf
0
100
200
300
400
500
600
1.E+05 1.E+06 1.E+07 1.E+08 1.E+09
3% NaCl RT 60Hz
105 106
■ Radical Nitrization&Ni-P18% PTFE Hybrid Coating
△ PTFE Coating○ Base Metal (SUS410J1)
107 108 109
100
0
200
300
400
500
600R
ota
tin
g b
en
din
g s
tres
s (
MP
a)
Ni-P 18%PTFE HybridNi-P 18%PTFE Hybrid
KT-1302 Deposits Thickness vs After Stage Pressure
20
25
30
35
40
45
0.0 0.2 0.4 0.6 0.8 1.0 1.2
Deposits Thickness (mm)
Aft
er
1s
t S
tag
e P
res
su
re (a
ta)
2nd to 4th stages
2nd stage
3rd stage
4th stage
Wide Pitch
Fine Pitch Nozzle
Fine Pitch
Wide Pitch Nozzle
Proceedings of the Second Middle East Turbomachinery Symposium 17 – 20 March 2013, Doha, Qatar
Copyright 8 2013 by Turbomachinery Laboratory, Texas A&M University
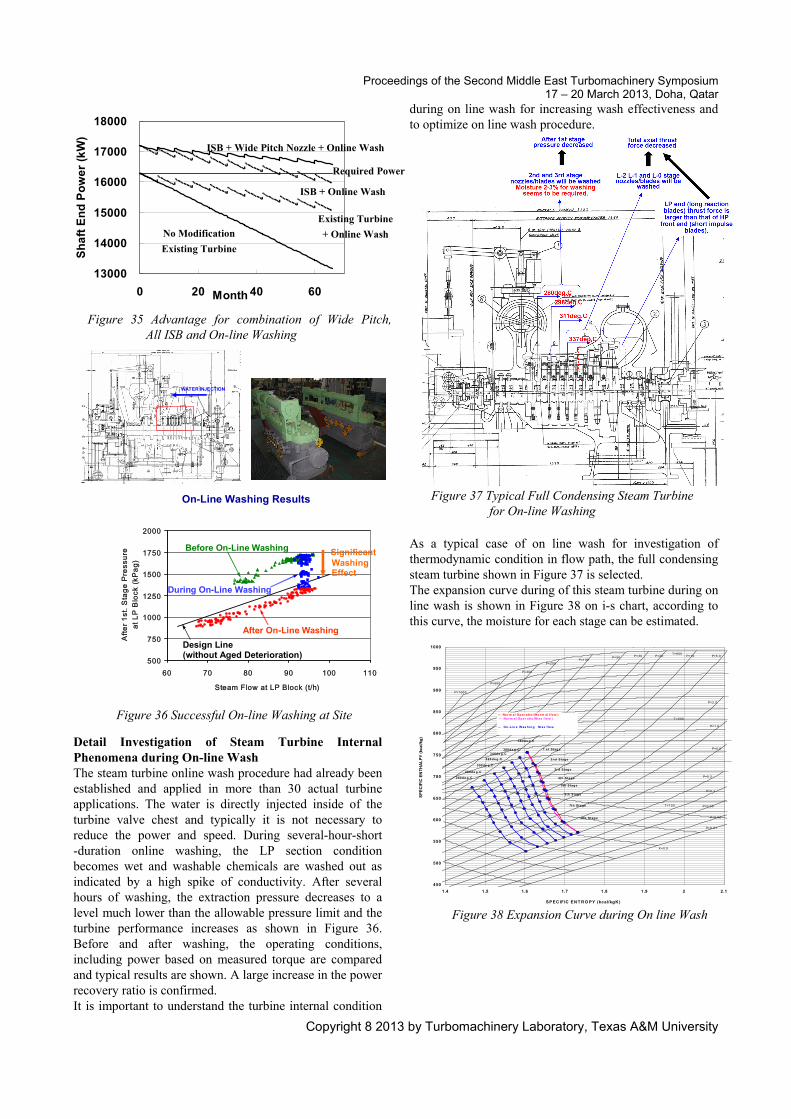
Detail Investigation of Steam Turbine Internal Phenomena during On-line Wash The steam turbine online wash procedure had already been established and applied in more than 30 actual turbine applications. The water is directly injected inside of the turbine valve chest and typically it is not necessary to reduce the power and speed. During several-hour-short -duration online washing, the LP section condition becomes wet and washable chemicals are washed out as indicated by a high spike of conductivity. After several hours of washing, the extraction pressure decreases to a level much lower than the allowable pressure limit and the turbine performance increases as shown in Figure 36. Before and after washing, the operating conditions, including power based on measured torque are compared and typical results are shown. A large increase in the power recovery ratio is confirmed. It is important to understand the turbine internal condition
during on line wash for increasing wash effectiveness and to optimize on line wash procedure. As a typical case of on line wash for investigation of thermodynamic condition in flow path, the full condensing steam turbine shown in Figure 37 is selected. The expansion curve during of this steam turbine during on line wash is shown in Figure 38 on i-s chart, according to this curve, the moisture for each stage can be estimated.
Figure 35 Advantage for combination of Wide Pitch, All ISB and On-line Washing
Figure 37 Typical Full Condensing Steam Turbine for On-line Washing
Figure 38 Expansion Curve during On line Wash
13000
14000
15000
16000
17000
18000
0 20 40 60Month
Sh
aft
En
d P
ow
er
(kW
)
No Modification
Existing Turbine
ISB + Online Wash
Existing Turbine
+ Online Wash
ISB + Wide Pitch Nozzle + Online Wash
Required Power
WATER INJECTIONWATER INJECTION
On-Line Washing Results
500
750
1000
1250
1500
1750
2000
60 70 80 90 100 110
Steam Flow at LP Block (t/h)
Afte
r 1st
. Sta
ge P
ress
ure
at L
P B
lock
(kP
ag)
After On-Line Washing
Before On-Line Washing
During On-Line Washing
SignificantWashingEffect
(without Aged Deterioration)Design Line
Figure 36 Successful On-line Washing at Site
450
500
550
600
650
700
750
800
850
900
950
1000
1.4 1.5 1.6 1.7 1.8 1.9 2 2.1
SP EC IFIC EN T R O PY (kcal/kgK )
SP
EC
IFIC
EN
TH
AL
PY
(kc
al/k
g)
T=800
T=500
P=1000
P=500
P=300
P=200P=100
P=50 P=30 P=20 P=10 P=5.0
P=2.0
P=1.0
P=0.5
X=0.9
― No r m al Op e r at io i(No r m al f lo w ) ― No r m al Op e r at io (M ax f lo w )
― On -L in e W as h in g M ax f lo w
T=100
P=0.2
P=0.1
P=0.05
P=0.02
P=0.01
K e m c o r / Alto n a P e tro c h em ica l C o . L td E th an C rac k e r S te a m T u rb in e T C -7 01 -X (T 1 2 29 )
1 s t Stag e
2n d Stag e
3r d Stag e
4th Stag e
5th Stag e
6th Stag e
380d e g .C
360d e g .C340d e g .C
320d e g .C
300d e g .C
280d e g .C
260d e g .C
7th Stag e
8th Stag e
Proceedings of the Second Middle East Turbomachinery Symposium 17 – 20 March 2013, Doha, Qatar
Copyright 8 2013 by Turbomachinery Laboratory, Texas A&M University
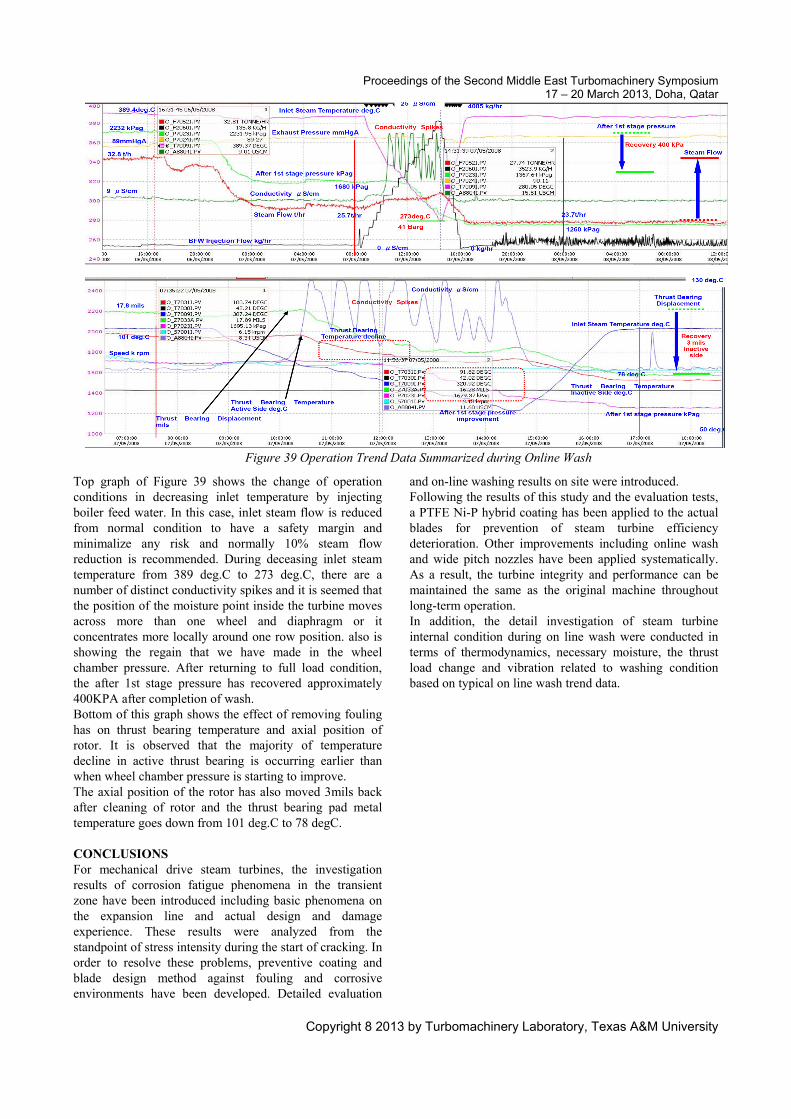
Top graph of Figure 39 shows the change of operation conditions in decreasing inlet temperature by injecting boiler feed water. In this case, inlet steam flow is reduced from normal condition to have a safety margin and minimalize any risk and normally 10% steam flow reduction is recommended. During deceasing inlet steam temperature from 389 deg.C to 273 deg.C, there are a number of distinct conductivity spikes and it is seemed that the position of the moisture point inside the turbine moves across more than one wheel and diaphragm or it concentrates more locally around one row position. also is showing the regain that we have made in the wheel chamber pressure. After returning to full load condition, the after 1st stage pressure has recovered approximately 400KPA after completion of wash. Bottom of this graph shows the effect of removing fouling has on thrust bearing temperature and axial position of rotor. It is observed that the majority of temperature decline in active thrust bearing is occurring earlier than when wheel chamber pressure is starting to improve. The axial position of the rotor has also moved 3mils back after cleaning of rotor and the thrust bearing pad metal temperature goes down from 101 deg.C to 78 degC. CONCLUSIONS For mechanical drive steam turbines, the investigation results of corrosion fatigue phenomena in the transient zone have been introduced including basic phenomena on the expansion line and actual design and damage experience. These results were analyzed from the standpoint of stress intensity during the start of cracking. In order to resolve these problems, preventive coating and blade design method against fouling and corrosive environments have been developed. Detailed evaluation
test results for coating performance use a unique test procedure simulating fouling phenomena and washing conditions. Finally a successful modification of internals and on-line washing results on site were introduced. Following the results of this study and the evaluation tests, a PTFE Ni-P hybrid coating has been applied to the actual blades for prevention of steam turbine efficiency deterioration. Other improvements including online wash and wide pitch nozzles have been applied systematically. As a result, the turbine integrity and performance can be maintained the same as the original machine throughout long-term operation. In addition, the detail investigation of steam turbine internal condition during on line wash were conducted in terms of thermodynamics, necessary moisture, the thrust load change and vibration related to washing condition based on typical on line wash trend data.
Figure 39 Operation Trend Data Summarized during Online Wash
Proceedings of the Second Middle East Turbomachinery Symposium 17 – 20 March 2013, Doha, Qatar
Copyright 8 2013 by Turbomachinery Laboratory, Texas A&M University
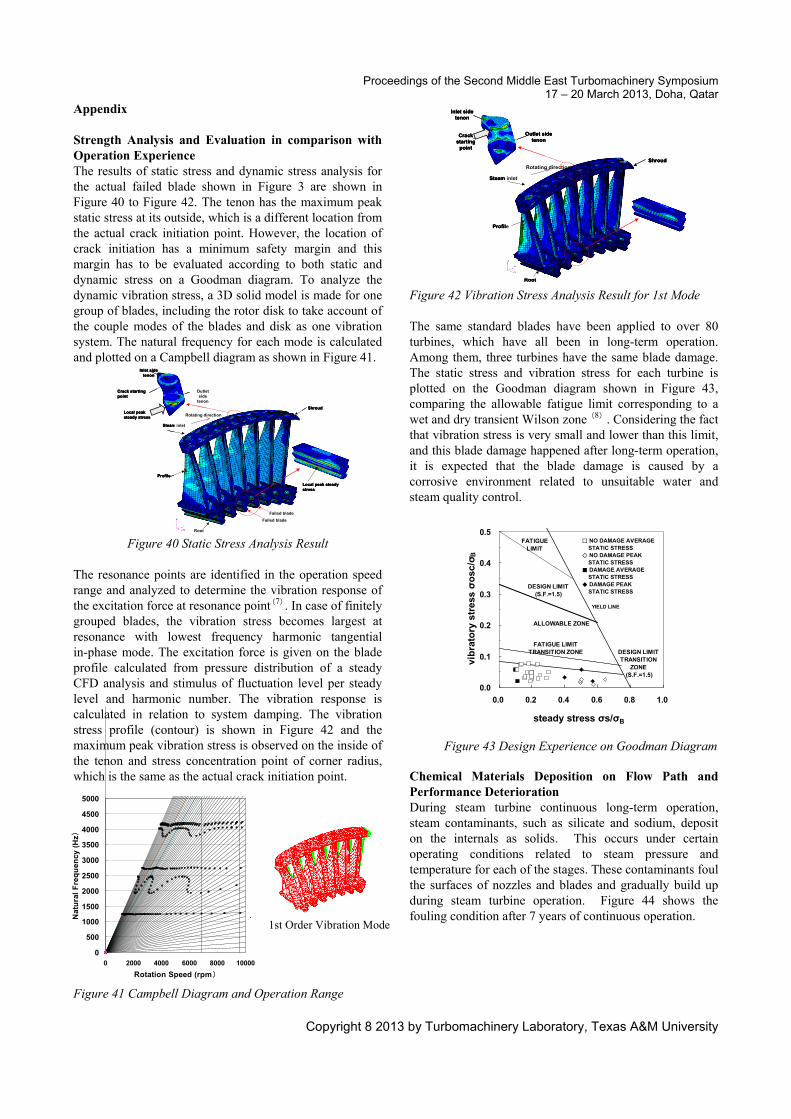
Appendix Strength Analysis and Evaluation in comparison with Operation Experience The results of static stress and dynamic stress analysis for the actual failed blade shown in Figure 3 are shown in Figure 40 to Figure 42. The tenon has the maximum peak static stress at its outside, which is a different location from the actual crack initiation point. However, the location of crack initiation has a minimum safety margin and this margin has to be evaluated according to both static and dynamic stress on a Goodman diagram. To analyze the dynamic vibration stress, a 3D solid model is made for one group of blades, including the rotor disk to take account of the couple modes of the blades and disk as one vibration system. The natural frequency for each mode is calculated and plotted on a Campbell diagram as shown in Figure 41.
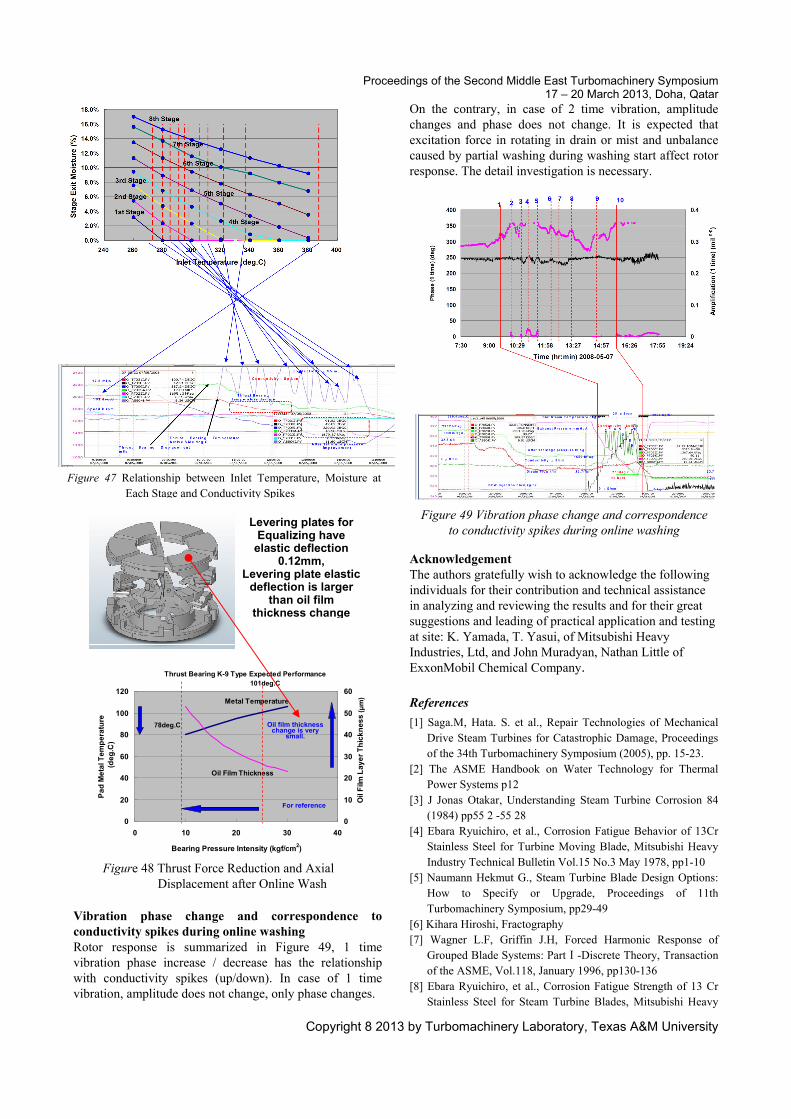
Figure 40 Static Stress Analysis Result The resonance points are identified in the operation speed range and analyzed to determine the vibration response of the excitation force at resonance point(7). In case of finitely grouped blades, the vibration stress becomes largest at resonance with lowest frequency harmonic tangential in-phase mode. The excitation force is given on the blade profile calculated from pressure distribution of a steady CFD analysis and stimulus of fluctuation level per steady level and harmonic number. The vibration response is calculated in relation to system damping. The vibration stress profile (contour) is shown in Figure 42 and the maximum peak vibration stress is observed on the inside of the tenon and stress concentration point of corner radius, which is the same as the actual crack initiation point. Figure 41 Campbell Diagram and Operation Range
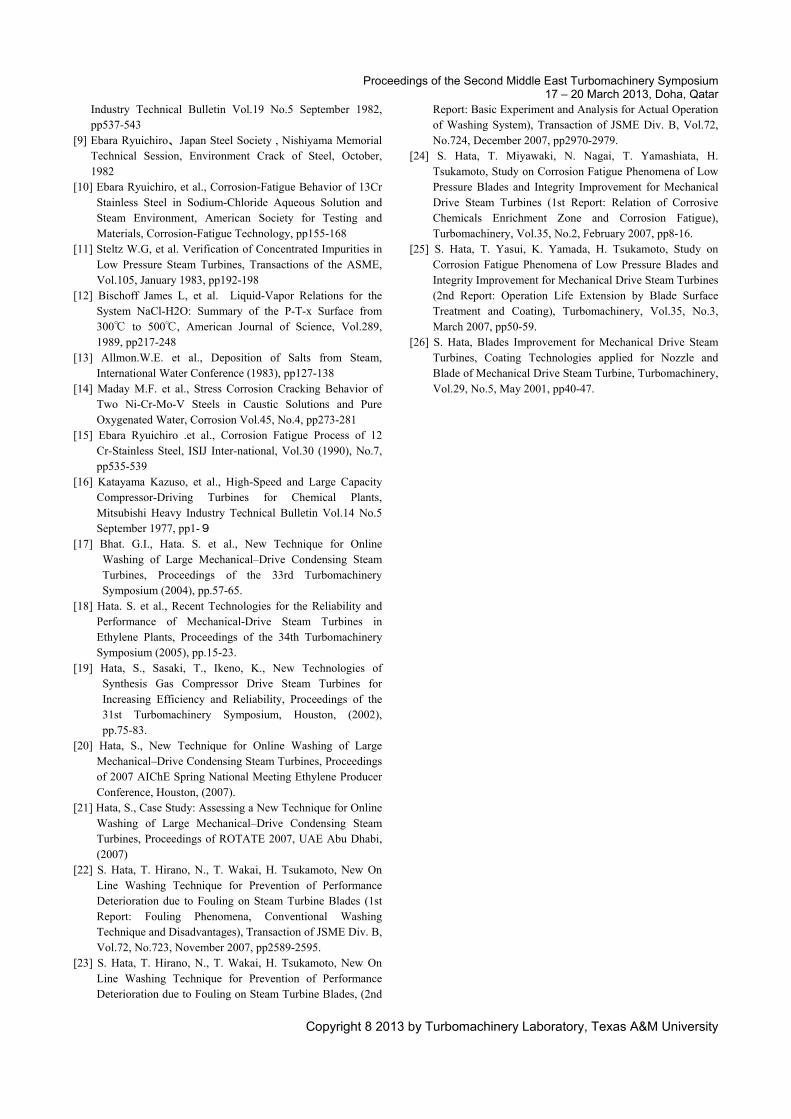
Figure 42 Vibration Stress Analysis Result for 1st Mode The same standard blades have been applied to over 80 turbines, which have all been in long-term operation. Among them, three turbines have the same blade damage. The static stress and vibration stress for each turbine is plotted on the Goodman diagram shown in Figure 43, comparing the allowable fatigue limit corresponding to a wet and dry transient Wilson zone(8). Considering the fact that vibration stress is very small and lower than this limit, and this blade damage happened after long-term operation, it is expected that the blade damage is caused by a corrosive environment related to unsuitable water and steam quality control.
Chemical Materials Deposition on Flow Path and Performance Deterioration During steam turbine continuous long-term operation, steam contaminants, such as silicate and sodium, deposit on the internals as solids. This occurs under certain operating conditions related to steam pressure and temperature for each of the stages. These contaminants foul the surfaces of nozzles and blades and gradually build up during steam turbine operation. Figure 44 shows the fouling condition after 7 years of continuous operation.
Figure 43 Design Experience on Goodman Diagram
Rotating direction
Profile
Shroud
Failed blade
Failed blade
Steam inlet
Root
Local peak steady stress
Inlet side tenon
Outlet side
tenon
Crack starting point
Local peak steady stress Rotating direction
Profile
Shroud
Failed blade
Failed blade
Steam inlet
Root
Local peak steady stress
Rotating direction
Profile
Shroud
Failed blade
Failed blade
Steam inlet
Root
Local peak steady stress
Inlet side tenon
Outlet side
tenon
Crack starting point
Local peak steady stress
Inlet side tenon
Outlet side
tenon
Crack starting point
Local peak steady stress
0
500
1000
1500
2000
2500
3000
3500
4000
4500
5000
0 2000 4000 6000 8000 10000
Rotation Speed (rpm)
Nat
ura
l F
req
uen
cy (
Hz)
1st Order Vibration Mode
Rotating direction
Profile
Shroud
Root
Steam inlet
Inlet side tenon
Crack starting
point
Outlet side tenon
Rotating direction
Profile
Shroud
Root
Steam inlet
Rotating direction
Profile
Shroud
Root
Steam inlet
Inlet side tenon
Crack starting
point
Outlet side tenon
Inlet side tenon
Crack starting
point
Outlet side tenon
0.0
0.1
0.2
0.3
0.4
0.5
0.0 0.2 0.4 0.6 0.8 1.0
steady stress σs/σB
vib
rato
ry s
tres
s σ
osc
/σB
FATIGUELIMIT
DESIGN LIMIT(S.F.=1.5)
DESIGN LIMITTRANSITION
ZONE (S.F.=1.5)
FATIGUE LIMITTRANSITION ZONE
YIELD LINE
ALLOWABLE ZONE
□ NO DAMAGE AVERAGE STATIC STRESS◇ NO DAMAGE PEAK STATIC STRESS■ DAMAGE AVERAGE STATIC STRESS◆ DAMAGE PEAK STATIC STRESS

Proceedings of the Second Middle East Turbomachinery Symposium 17 – 20 March 2013, Doha, Qatar
Copyright 8 2013 by Turbomachinery Laboratory, Texas A&M University
Figure 44 Deposit Condition of LP Section
The composition and characteristics of the fouling
materials are different along the steam path from the high-pressure stages to the low-pressure side. Under these fouling conditions, the pressure profiles across the nozzles, blades, and throat areas increase. These profiles in turn result in the deterioration of turbine performance, and it will continue to do so over time if left unattended. The authors have calculated the relationship between after stage pressure increase and efficiency change (loss) due to the fouling thickness within the high and low pressure sections. When fouling happens and the nozzle profile has deposits, the nozzle area is reduced, and the nozzle exit speed and velocity ratio per stage change. This velocity ratio is directly related to stage efficiency and overall efficiency of the HP and LP section. The typical calculation result for the HP section is shown in Figure 45. According to this thermodynamic calculation and analysis, the HP section efficiency is more sensitive than that of the LP section where each stage profile has the same fouling thickness. Overall efficiency change and after stage pressure change depend on what stage has deposits and its fouling thickness.
Moisture Profile during Reduction of Inlet Temperature Figure 46 shows the calculated moisture change of internals when inlet temperature deceases from normal to the lowest during washing. At the normal inlet steam temperature, only 6th to 8th stage locate on wet zone and maximum moisture is about 9%. In case of the lowest inlet temperature 260deg.C, all stages are located lower than saturated line and the maximum moisture of last stage becomes 17%. The on line wash condition have to be
optimized in considering what stage has the fouling and what is the allowable limit of high moisture in terms of erosion damage and countermeasures for protection such as ceramics coating, PTA power welding and stainless steel diaphragms . Relationship between Inlet Temperature, Moisture at Each Stage and Conductivity Spikes In Figure 47, these relations are shown including time delay of axial thrust displacement decrease (thrust force decrease) and after 1st stage pressure recovery. In case of Inlet temperature going down to about 340 deg.C, L-2 L-1 and L-0 stage nozzles/blades are washed, in addition, LP end (long reaction blades) thrust force is larger than that of HP front end (short impulse blades). Accordingly, total axial thrust force decreases. After 1st stage pressure is dominantly affected by the 2nd and 3rd stage nozzles/blades area reduction. In case of Inlet temperature going down to the range of about 310 to 280 deg.C, the 2nd and 3rd stage nozzles/blades are washed and in this inlet temperature range, after 1st stage pressure decreased. Minimum moisture for washing is expected 2 to 3% and when moisture of each stage increases cross this threshold, conductivity spike occurred. Thrust Force Reduction and Axial Displacement after Online Wash Figure 48 shows change of axial displacement and pad metal temperature related to thrust bearing performance. We expect thrust force deceases from 20-25 kgf/cm2 of bearing pressure (intensity) to 10 kgf/cm2 of normal as designed. Almost change of axial displacement (about 100 micron meter) is elastic deflection of leveling plates and oil film thickness increases by 30 micron meter as your pointing out.
Figure 46 Moisture Profile during Reduction of Inlet Temperature
45
50
55
60
65
70
75
80
85
90
0 1 2 3 4
High Pressure Section Stage No.
Hig
h P
res
su
re S
ecti
on
Sta
ge
Eff
icie
ncy
(%
)
0
1
2
3
4
5
6
7
8
9
Ve
loc
ity
Ra
tio
Co
/U
0.0
0.1
0.2
0.3
0.4
0.5
0.6
0.0
0.1
0.2
0.3
0.4
0.5
0.6
0.0mm
Deposit Thickness
0.6mm
0.6mm
0.0mm
Deposit Thickness
Stage Efficiency
Velocity Ratio
Deposit Thickness
GoverningValve
Figure 45 Blade Design, Efficiency affected by Fouling in Each Stage
K em cor T X-701-X M o istu re dur ing O nline W ashin g
0 %
2 %
4 %
6 %
8 %
10 %
12 %
14 %
16 %
18 %
0 5 10 15 20 25
AF TER PR ESSU IR E OF EA C H STA G ES (KG /C M 2A )
ST
AG
E E
XIT
MO
ISTU
RE
(%
)
38 0 3 6 0 3 40
32 0 3 0 0 2 80
26 0
T u rb ine In let T e mp .(d eg .C )
6 th S ta ge
5 th S tag e
4 th S ta ge
3 rd S ta ge2 nd S ta ge
1 st S ta ge
26 0 de g.C
2 80 de g.C3 00 de g.C32 0 de g .C
34 0 de g .C3 60 de g .C
3 80 de g .C
7 th S tag e
8 th S ta ge
Proceedings of the Second Middle East Turbomachinery Symposium 17 – 20 March 2013, Doha, Qatar
Copyright 8 2013 by Turbomachinery Laboratory, Texas A&M University
Vibration phase change and correspondence to conductivity spikes during online washing Rotor response is summarized in Figure 49, 1 time vibration phase increase / decrease has the relationship with conductivity spikes (up/down). In case of 1 time vibration, amplitude does not change, only phase changes.
On the contrary, in case of 2 time vibration, amplitude changes and phase does not change. It is expected that excitation force in rotating in drain or mist and unbalance caused by partial washing during washing start affect rotor response. The detail investigation is necessary.
Acknowledgement The authors gratefully wish to acknowledge the following individuals for their contribution and technical assistance in analyzing and reviewing the results and for their great suggestions and leading of practical application and testing at site: K. Yamada, T. Yasui, of Mitsubishi Heavy Industries, Ltd, and John Muradyan, Nathan Little of ExxonMobil Chemical Company.
References
[1] Saga.M, Hata. S. et al., Repair Technologies of Mechanical Drive Steam Turbines for Catastrophic Damage, Proceedings of the 34th Turbomachinery Symposium (2005), pp. 15-23.
[2] The ASME Handbook on Water Technology for Thermal Power Systems p12
[3] J Jonas Otakar, Understanding Steam Turbine Corrosion 84 (1984) pp55 2 -55 28
[4] Ebara Ryuichiro, et al., Corrosion Fatigue Behavior of 13Cr Stainless Steel for Turbine Moving Blade, Mitsubishi Heavy Industry Technical Bulletin Vol.15 No.3 May 1978, pp1-10
[5] Naumann Hekmut G., Steam Turbine Blade Design Options: How to Specify or Upgrade, Proceedings of 11th Turbomachinery Symposium, pp29-49
[6] Kihara Hiroshi, Fractography [7] Wagner L.F, Griffin J.H, Forced Harmonic Response of
Grouped Blade Systems: PartⅠ-Discrete Theory, Transaction of the ASME, Vol.118, January 1996, pp130-136
[8] Ebara Ryuichiro, et al., Corrosion Fatigue Strength of 13 Cr Stainless Steel for Steam Turbine Blades, Mitsubishi Heavy
Figure 47 Relationship between Inlet Temperature, Moisture at Each Stage and Conductivity Spikes
Figure 48 Thrust Force Reduction and Axial
Displacement after Online Wash
Figure 49 Vibration phase change and correspondence to conductivity spikes during online washing
Thrust Bearing K-9 Type Expected Performance
0
20
40
60
80
100
120
0 10 20 30 40
Bearing Pressure Intensity (kgf/cm2)
Pa
d M
eta
l Tem
per
atu
re(d
eg
.C)
0
10
20
30
40
50
60
Oil
Film
Lay
er
Th
ick
nes
s(μ
m)Metal Temperature
Oil Film Thickness
101deg.C
78deg.C Oil film thickness change is very
small.
For reference
Levering plates for Equalizing have
elastic deflection 0.12mm,
Levering plate elastic deflection is larger
than oil film thickness change
Proceedings of the Second Middle East Turbomachinery Symposium 17 – 20 March 2013, Doha, Qatar
Copyright 8 2013 by Turbomachinery Laboratory, Texas A&M University
Industry Technical Bulletin Vol.19 No.5 September 1982, pp537-543
[9] Ebara Ryuichiro、Japan Steel Society , Nishiyama Memorial Technical Session, Environment Crack of Steel, October, 1982
[10] Ebara Ryuichiro, et al., Corrosion-Fatigue Behavior of 13Cr Stainless Steel in Sodium-Chloride Aqueous Solution and Steam Environment, American Society for Testing and Materials, Corrosion-Fatigue Technology, pp155-168
[11] Steltz W.G, et al. Verification of Concentrated Impurities in Low Pressure Steam Turbines, Transactions of the ASME, Vol.105, January 1983, pp192-198
[12] Bischoff James L, et al. Liquid-Vapor Relations for the System NaCl-H2O: Summary of the P-T-x Surface from 300℃ to 500℃, American Journal of Science, Vol.289, 1989, pp217-248
[13] Allmon.W.E. et al., Deposition of Salts from Steam, International Water Conference (1983), pp127-138
[14] Maday M.F. et al., Stress Corrosion Cracking Behavior of Two Ni-Cr-Mo-V Steels in Caustic Solutions and Pure Oxygenated Water, Corrosion Vol.45, No.4, pp273-281
[15] Ebara Ryuichiro .et al., Corrosion Fatigue Process of 12 Cr-Stainless Steel, ISIJ Inter-national, Vol.30 (1990), No.7, pp535-539
[16] Katayama Kazuso, et al., High-Speed and Large Capacity Compressor-Driving Turbines for Chemical Plants, Mitsubishi Heavy Industry Technical Bulletin Vol.14 No.5 September 1977, pp1-9
[17] Bhat. G.I., Hata. S. et al., New Technique for Online Washing of Large Mechanical–Drive Condensing Steam Turbines, Proceedings of the 33rd Turbomachinery Symposium (2004), pp.57-65.
[18] Hata. S. et al., Recent Technologies for the Reliability and Performance of Mechanical-Drive Steam Turbines in Ethylene Plants, Proceedings of the 34th Turbomachinery Symposium (2005), pp.15-23.
[19] Hata, S., Sasaki, T., Ikeno, K., New Technologies of Synthesis Gas Compressor Drive Steam Turbines for Increasing Efficiency and Reliability, Proceedings of the 31st Turbomachinery Symposium, Houston, (2002), pp.75-83.
[20] Hata, S., New Technique for Online Washing of Large Mechanical–Drive Condensing Steam Turbines, Proceedings of 2007 AIChE Spring National Meeting Ethylene Producer Conference, Houston, (2007).
[21] Hata, S., Case Study: Assessing a New Technique for Online Washing of Large Mechanical–Drive Condensing Steam Turbines, Proceedings of ROTATE 2007, UAE Abu Dhabi, (2007)
[22] S. Hata, T. Hirano, N., T. Wakai, H. Tsukamoto, New On Line Washing Technique for Prevention of Performance Deterioration due to Fouling on Steam Turbine Blades (1st Report: Fouling Phenomena, Conventional Washing Technique and Disadvantages), Transaction of JSME Div. B, Vol.72, No.723, November 2007, pp2589-2595.
[23] S. Hata, T. Hirano, N., T. Wakai, H. Tsukamoto, New On Line Washing Technique for Prevention of Performance Deterioration due to Fouling on Steam Turbine Blades, (2nd
Report: Basic Experiment and Analysis for Actual Operation of Washing System), Transaction of JSME Div. B, Vol.72, No.724, December 2007, pp2970-2979.
[24] S. Hata, T. Miyawaki, N. Nagai, T. Yamashiata, H. Tsukamoto, Study on Corrosion Fatigue Phenomena of Low Pressure Blades and Integrity Improvement for Mechanical Drive Steam Turbines (1st Report: Relation of Corrosive Chemicals Enrichment Zone and Corrosion Fatigue), Turbomachinery, Vol.35, No.2, February 2007, pp8-16.
[25] S. Hata, T. Yasui, K. Yamada, H. Tsukamoto, Study on Corrosion Fatigue Phenomena of Low Pressure Blades and Integrity Improvement for Mechanical Drive Steam Turbines (2nd Report: Operation Life Extension by Blade Surface Treatment and Coating), Turbomachinery, Vol.35, No.3, March 2007, pp50-59.
[26] S. Hata, Blades Improvement for Mechanical Drive Steam Turbines, Coating Technologies applied for Nozzle and Blade of Mechanical Drive Steam Turbine, Turbomachinery, Vol.29, No.5, May 2001, pp40-47.

![P U opp y METS 7 - njwsxx.com fileGH IJ R W w X 4 l &' E~A1 >e2" Bo U4PO a33 Zb 4U]H A METS ^ = kR>4 Mm# 12" _ P @ METS >4](https://img.pdfslide.tips/doc/110x75/5d61319888c993d14a8b96b9/p-u-opp-y-mets-7-ij-r-w-w-x-4-l-ea1-e2-bo-u4po-a33-zb-4uh-a-mets-kr4.jpg)