Embed Size (px)
Citation preview
Microstructure-Resolved Degradation Simulation of Lithium-Ion Batteries in SpaceApplications
Linda J. Bolaya,b, Tobias Schmitta,b, Simon Heina,b, Omar S. Mendoza-Hernandezd, Eiji Hosonof, Daisuke Asakurag,Koichi Kinoshitag, Hirofumi Matsudag, Minoru Umedah, Yoshitsugu Soned,e, Arnulf Latza,b,c, Birger Horstmanna,b,c,∗
aInstitute of Engineering Thermodynamics, German Aerospace Center (DLR), Pfaffenwaldring 38-40, 70569 Stuttgart, GermanybHelmholtz Institute Ulm (HIU), Helmholtzstraße 11, 89081 Ulm, Germany
cInstitute of Electrochemistry, University of Ulm, Albert-Einstein-Allee 47, 89081 Ulm, GermanydInstitute of Space and Astronautical Science, Japan Aerospace Exploration Agency (JAXA), 3-1-1 Yoshinodai, Chou-ku, Sagamihara,
Kanagawa 252-5210, JapaneThe Graduate University of Advanced Studies (SOKENDAI), 3-1-1 Yoshinodai, Chou-ku, Sagamihara, Kanagawa 252-5210, JapanfGlobal Zero Emission Research Center, National Institute of Advanced Industrial Science and Technology (AIST), 1-1-1 Umezono,
Tsukuba, Ibaraki 305-8568, JapangResearch Institute of Energy Conservation, National Institute of Advanced Industrial Science and Technology (AIST), 1-1-1 Umezono,
Tsukuba, Ibaraki 305-8568, JapanhDepartment of Materials Science and Technology, Nagaoka University of Technology, 1603-1 Kamitomioka, Nagaoka, Niigata 940-2188,
Japan
Abstract
In-orbit satellite REIMEI, developed by the Japan Aerospace Exploration Agency, has been relying on off-the-shelf Li-ionbatteries since its launch in 2005. The performance and durability of Li-ion batteries is impacted by various degradationmechanisms, one of which is the growth of the solid-electrolyte interphase (SEI). In this article, we analyse the REIMEIbattery and parameterize a full-cell model with electrochemical cycling data, computer tomography images, and capacityfading experiments using image processing and surrogate optimization. We integrate a recent model for SEI growth into afull-cell model and simulate the degradation of batteries during cycling. To validate our model, we use experimental andin-flight data of the satellite batteries. Our combination of SEI growth model and microstructure-resolved 3D simulationshows, for the first time, experimentally observed inhomogeneities in the SEI thickness throughout the negative electrodefor the degraded cells.
Keywords: Li-ion battery, solid-electrolyte interphase, REIMEI satellite, degradation model, microstructure-resolvedsimulation, parameter identification
1. Introduction
Lithium-ion batteries are the technology of choice forvarious applications like laptops, smartphones and electricvehicles. Since the early 2000s they are considered applica-ble for space missions or more precisely for low earth orbit(LEO) missions. The requirements for batteries in a LEOmission are to be reliable for about 5 years with 30,000cycles when charged for ca. 60 minutes and discharged forca. 30 minutes. [1, 2, 3, 4]. Battery reliability is hamperedby the harsh conditions they have to withstand. Alreadyduring lift-off they experience severe vibrations. In spacethey suffer from extreme temperatures, radiation, vacuum,and microgravity [5, 6]. Thus, battery satellites are quitecostly (for a small scientific satellite: 4 million US dollar[7]).
Failure of battery satellites may abort the satellite mis-sion and can endanger other missions through space debris.
∗Corresponding authorEmail address: [email protected] (Birger Horstmann)
Therefore, determination and prediction of battery state-of-health during operation is necessary. This is only possi-ble by remote control of the satellite system from a controlstation on earth. The antenna receives the telemetry dataof the battery and transmits operation commands, whilethe satellite passes the ground station during a small timewindow [7].
Typically, the cells are tested extensively prior to themission start. Cycling experiments are conducted overlong periods of time, adjusted to the planned mission. Ad-ditionally, the cells undergo various abuse tests. This en-sures safe operability during the whole mission.
If the mission changes for unforeseen reasons, the pre-dictions for the aging of the cells have to be adjusted. Along time might have passed, however, since the start ofthe mission. Access to cells of the same kind than thoseused in the mission might be difficult. For these reasons, itis essential to have physics-based models available, whichcan predict the performance and degradation of the cellsfor any given operation of the satellite. These models arebased on short term experiments. This yields the addi-
Preprint submitted to Elsevier February 7, 2022
arX
iv:2
111.
0285
6v2
[ph
ysic
s.ch
em-p
h] 4
Feb
202
2
tional benefit of shortening the time for tests prior to themission start.
The major degradation process taking place in Li-ionbatteries is the growth of the solid-electrolyte interphase(SEI). This passivation layer builds on the anode surfaceduring the first cycles of the cell, when solvents from theelectrolyte react with Li-ions and electrons. This processprevents the electrolyte from further reaction but doesnot passivate the reaction completely. The SEI is grow-ing continuously during storage as well as during cycling.Thereby, Li-ions are consumed irreversibly, which causescapacity loss of the cell.
The growth of the SEI is discussed extensively in lit-erature, both in experiment and in theory. Usually, eithershort-term growth, which considers growth behavior dur-ing the first cycle, or long-term growth, which considerscontinuous growth over months and years, is investigated.In this work, only long-term degradation is discussed.
In experiments, a square-root-of-time (√t) behavior is
observed for long-term growth [8, 5]. Furthermore, exper-iments show that SEI growth is accelerated during cyclingcompared to storage [8]. Attia et al. show that the SEIis especially growing faster during charging of the cell [9].Another aspect is the inhomogeneous growth of the SEI,which is investigated on nanoscale [10, 11, 12] and on celllevel [13].
Short-term SEI growth, i.e. the initial build-up of theSEI during the first cycles, is addressed by atomistic theo-ries like density functional theory and molecular dynamicsimulations [14, 15]. The long-term growth behavior of theSEI can be described with empirical models [16, 17]. But abetter understanding of the internal processes is given byphysics-based models. For these, several transport mech-anisms are considered as the rate-limiting process. Themost important are electron conduction [18, 19], electrontunneling [20, 21], reaction kinetics [22, 23], radical diffu-sion [24, 25], and solvent diffusion [26, 27, 28, 29]. Singleet al. compared all of these transport processes to storageexperiments and show that the most probable mechanismfor SEI growth during storage is radical diffusion [24]. Daset al. model the asymmetric growth behavior which wasshown in Ref. [9] by coupling SEI growth to the Li-ion con-centration in the SEI [19]. Von Kolzenberg et al. extendedthe model of radical diffusion in Ref. [24] by an electronmigration effect during cycling, which also reproduces theasymmetric growth. They describe the transitions betweentransport- and reaction-limited growth and with that givea consistent explanation for the short-term and long-termgrowth behavior [30]. A comprehensive review of SEI mod-els is given by Horstmann et al. in Ref. [31].
Until recently, electrode level continuum models hadnot reproduced the experimentally observed SEI hetero-geneity [26, 32]. In his PhD thesis, Schmitt implementeda preliminary version of the model of Ref. [30] in the soft-ware BEST [33] and simulated the growth behavior in a 3Dresolved microstructure. Thereby, it was shown that theSEI is growing inhomogeneously [34]. This was the first
time that experimentally observed inhomogeneities in theSEI thickness could be shown with a physics-based model.Considering reaction-limited growth, such heterogeneousSEI growth has also been recently analyzed by Chouchaneet al. [23].
In this article, we discuss how to incorporate the modelof von Kolzenberg et al. into the physics-based model forLi-ion batteries of Latz et al. [35] and simulate the SEIgrowth in a pseudo-two-dimensional (P2D) framework andin 3D. We are the first to show inhomogeneous long-termgrowth of the SEI in microstructural-resolved simulations.To validate our model, we make use of experiments andin-flight data of satellite REIMEI’s battery cells.
REIMEI is a small scientific satellite developed by theJapanese Aerospace Exploration Agency (JAXA). It waslaunched in 2005 with the main scientific mission to ob-serve the aurora and demonstrate advanced satellite tech-nology, one of which is Li-ion batteries that use off-the-shelf pouch cells. In 2013 the aurora observation was ter-minated. The satellite operation was extended with themain focus shifted to the prediction of performance andlifetime of the on-board Li-ion batteries [6, 36].
For a profound analysis of the battery state, a physics-based model that describes the cell degradation is required.However, only little is known about the cells parameters,as a long time has passed since the start of the mission.This makes the modeling a challenging task.
One part of this challenge is the parameterization ofthe P2D model. This is addressed by different optimiza-tion approaches, where the error between experiment andmodel simulation, depending on the parameters, is to beminimized. Different approaches can be found in the lit-erature. Forman et al. use a genetic algorithm to identifythe parameters [37]. Rahman et al. use a particle swarmoptimization algorithm [38]. Here, we extract some param-eters from CT images by image processing. The remainingparameters are determined with a surrogate optimization.To the best of our knowledge, this optimization methodhas not yet been used for battery models.
In sec. 2, we give a brief overview of REIMEI and itsbatteries. After that, we describe the SEI model in detailin sec. 3, which we then use for simulating the cycling andthe degradation of the cells. For this purpose, in sec. 4,we first determine the parameters of the fresh cell with anoptimization approach. Subsequently, in sec. 5 we deter-mine the parameters of the degradation model and discussthe results of the degradation and SEI growth simulation.
2. Experimental Data of REIMEI Batteries
Satellite REIMEI, which flies on a polar low Earth orbit(LEO), has an orbital period of 96 minutes. During thesunlight period, the batteries get charged via the solarpanels, while they discharge during the eclipse period topower the loads [5]. This results in 15 cycles a day. Toensure a reliable operability of 3 - 5 years, the temperature
2
of the batteries is maintained at 19 − 22◦C [7, 6] and thedepth of discharge around 20 % [5].
Two identical batteries are connected in parallel onboard of the satellite REIMEI, each consisting of sevenpouch cells connected in series. The lithium-ion cells areproduced by NEC-Tokin Corporation. The positive ac-tive material is spinel lithium manganese oxide (LMO)and the negative electrode consists of graphite. The liq-uid electrolyte is 1 M LiPF6 in EC/DEC (3:7 by wt%)with additives [6, 5]. The cells have a voltage range of3.0 V - 4.1 V (4.2 V). Their nominal capacity is 3 Ah. [8]
The in-flight operation of the cells depend on the loadsin use. Given by the on-board devices, the cells reach theirend of life when the end-of-discharge voltage (EoDV) fallsbelow 3.75 V [5].
For the parameterization of the models, two kinds ofterrestrial measurements are used. The electric battery re-sponse was measured after the mission began (see sec. 2.1).We identify parameters of the cell microstructure from CTimages (see sec. 2.2).
2.1. Terrestrial electrochemical measurements
Accompanying the REIMEI mission, Uno et al. per-formed terrestrial cycling experiments [5] with the samekind of cells as those of the satellite. The experimentsspan about 27,000 cycles, which is equivalent to five years.They charged and discharged several cells with a cyclingprotocol similar to the one of the satellite. To track thedegradation of the cell, they measured the remaining ca-pacity and the EoDV of the cells.
In the experiments, the cells get discharged with aconstant current (CC) of 1 A for 35 minutes, which cor-responds to approximately 20 % DOD. Then they getcharged for 65 minutes with a constant current - constantvoltage (CC-CV) profile. The charging is performed at1.5 A to the upper voltage limit of 4.1 V. After each dis-charging, the EoDV is measured. As the cells are degrad-ing, the EoDV falls below 3.75 V after several thousandcycles. At that point, the upper voltage limit for the charg-ing gets changed to 4.2 V to prolong the remaining usefullife of the cells. Before and during the cycling, they mea-sure the remaining capacity of the cells several times bydischarging it with a CC of 1 A to 3.0 V. We use theseelectrochemical measurements of Uno et al. in sec. 4.1 toparameterize the P2D model. For the model we assumeconstant temperature and constant pressure throughoutthe cell. This assumption is based on the experiments inRef. [5] and on the in-flight data as can be seen in Ref. [39].In sec. 5.1, the measurements are used to parameterize thedegradation.
In 2008, Brown et al. conducted comprehensive terres-trial experiments at JAXA. They investigated the degra-dation of cycled and calendaric aged cells under variousconditions. For the cycling, they use the same cyclingprotocol than Uno et al. and vary it regarding tempera-tures and discharge currents respectively the depth of dis-charge (DOD). They examined full and half cells before,
during and after the aging process. Furthermore, theymeasured open-circuit voltage (OCV) curves for both elec-trodes [8, 40]. The OCV curve measurements of Brownet al. are used in sec. 4.1 for the P2D model. Further-more, our cycling protocols in sec. 5.2 are based on thoseof Browns et al.
2.2. Computer tomography
One of the pouch cells of the kind used in the satellitewas stored by JAXA. Several years after the start of themission, CT images of the cell, which was stored at roomtemperature, were taken in various resolutions. Examplesof the CT images can be found in Fig. B.1 in the support-ing information. From the CT images we extract severalparameters of the cell structure. These are the thicknessesand porosities of the cell layers and the specific surfacearea of the electrodes. These values are necessary to pa-rameterize the model described in sec. 3.
The thickness L of the layers is determined using theCT images with 1 µm and 3.5 µm resolution. To separatethe layers, we consider grayvalues of voxels in the threedimensional CT image. Every type of layer in the cell hasa specific grayvalue distribution. We assign the median ofgrayvalues to every voxel layer parallel to the cell layers.Hereby, we get a one dimensional signal which is perpen-dicular to the cell layers. The changes of grayvalue medi-ans are determined by signal processing methods. Theserepresent the boundaries between cell layers. The thick-ness is then averaged over several layers.
The porosities ε of the different electrodes are deter-mined from a representative section of the 1 µm resolutionCT image. The histogram of grayvalues within this volumeis determined and approximated by three normal distribu-tions. For the cathode, the histogram and the correspond-ing distribution approximation can be seen in Fig. B.2 inthe supporting information. The integral of these distri-butions yield the volume fractions of the phases in theelectrode, the pore space, the active solid phase, and thepassive solid phase, which consists of binder and conduc-tive material. From the distributions, we get a binarizationof the electrode volume using k-means clustering. We usea simplified version of the method described in Ref. [41].Here, we only want to classify the voxels as pore space orsolid phase. The classification is assumed sufficient, whenthe grayvalue distributions classes have the same integralthan the approximated distributions. The binarization isthen used to determine the specific surface area Aspec ofthe electrodes. This is done with the software GeoDict[42].
In the case of the separator, we proceed in the sameway. However, here the histogram of the grayvalues is ap-proximated by only two normal distributions. The poros-ity is then again obtained from the integral of the distri-butions.
For the full cell area Acell, the width, length, and num-ber of cell layers are needed. The length is taken fromthe CT image with 140 µm resolution, which shows the
3
whole cell. The width and number of layers are takenfrom the CT image with 24 µm resolution, which showsthe upper part of the cell. We get Acell = 0.139 m2. Theother identified parameters can be found in Table B.2 inthe supporting information.
3. Computational Model
In order to understand and simulate the processes tak-ing place in the cell, a physics-based model for the short-term cycling as well as the long-term degradation behav-ior of the cells is necessary. The long-term degradationof the cell is mainly determined by capacity fading, whichis caused by the loss of Li-ion inventory. To quantify thelong-term capacity fading under cycling as well as understorage conditions, a new physics-based model has beendeveloped. Von Kolzenberg et al. describe the model indetail in Ref. [30]. Here, we summarize it and embed itinto the thermodynamic consistent transport theory forLi-ion batteries of Latz et al. [35].
This theory models transport and reactions of Li-ionsin electrolyte and electrode particles on the microstruc-tural scale of batteries. Several equations describe howthe inner states, like Li-ion concentration or electrical po-tential, are distributed in the cell and how they evolveover time. The corresponding equations can be found inthe supporting information [35]. For the microstructure-resolved simulations, first, the morphology of the elec-trodes needs to be reconstructed from tomographic imagedata or simulated with given morphology characteristics.For example, this is done with stochastic geometry meth-ods by Hein et al. [43]. In our research group, this 3Drepresentation of the Li-ion cell is then used with the soft-ware BEST to perform spatially resolved electrochemicalsimulations [33, 44]. In Ref. [45] Hein et al. use these sim-ulations to study and analyze the heterogeneous surfaceeffects (see also sec. 5).
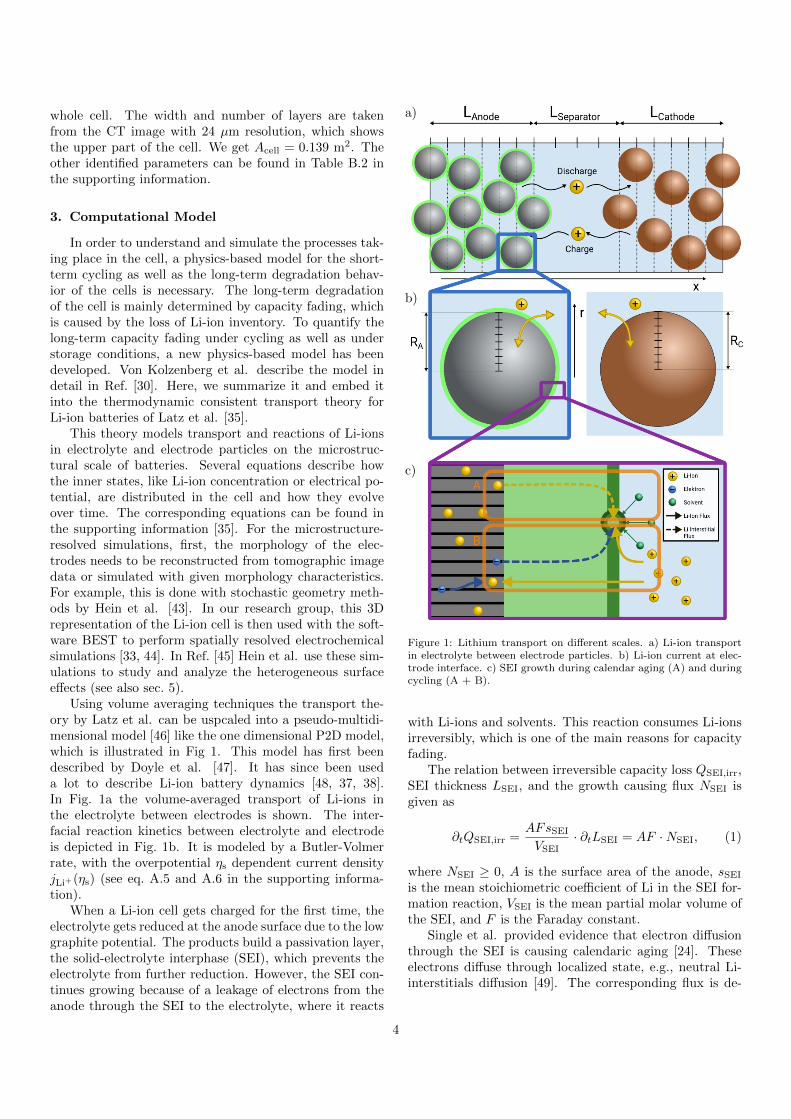
Using volume averaging techniques the transport the-ory by Latz et al. can be uspcaled into a pseudo-multidi-mensional model [46] like the one dimensional P2D model,which is illustrated in Fig 1. This model has first beendescribed by Doyle et al. [47]. It has since been useda lot to describe Li-ion battery dynamics [48, 37, 38].In Fig. 1a the volume-averaged transport of Li-ions inthe electrolyte between electrodes is shown. The inter-facial reaction kinetics between electrolyte and electrodeis depicted in Fig. 1b. It is modeled by a Butler-Volmerrate, with the overpotential ηs dependent current densityjLi+(ηs) (see eq. A.5 and A.6 in the supporting informa-tion).
When a Li-ion cell gets charged for the first time, theelectrolyte gets reduced at the anode surface due to the lowgraphite potential. The products build a passivation layer,the solid-electrolyte interphase (SEI), which prevents theelectrolyte from further reduction. However, the SEI con-tinues growing because of a leakage of electrons from theanode through the SEI to the electrolyte, where it reacts
a)
b)
c)
Figure 1: Lithium transport on different scales. a) Li-ion transportin electrolyte between electrode particles. b) Li-ion current at elec-trode interface. c) SEI growth during calendar aging (A) and duringcycling (A + B).
with Li-ions and solvents. This reaction consumes Li-ionsirreversibly, which is one of the main reasons for capacityfading.
The relation between irreversible capacity loss QSEI,irr,SEI thickness LSEI, and the growth causing flux NSEI isgiven as
∂tQSEI,irr =AFsSEI
VSEI· ∂tLSEI = AF ·NSEI, (1)
where NSEI ≥ 0, A is the surface area of the anode, sSEI
is the mean stoichiometric coefficient of Li in the SEI for-mation reaction, VSEI is the mean partial molar volume ofthe SEI, and F is the Faraday constant.
Single et al. provided evidence that electron diffusionthrough the SEI is causing calendaric aging [24]. Theseelectrons diffuse through localized state, e.g., neutral Li-interstitials diffusion [49]. The corresponding flux is de-
4
duced from Fick’s law and is given as
NSEI,diff = De- · ce-
LSEI, (2)
where De- is the diffusion coefficient and ce-
is the inter-stitial concentration at the anode-SEI interface, which isdependent on the electrochemical potential of the anoderelative to Li. This process is depicted as process A inFig. 1c.
The capacity loss increases when the cell is cycled. At-tia et al. show that the SEI grows almost exclusively dur-ing lithiation of the anode [9]. This phenomenon is alsomodeled by an electron flux, which is influenced by the Li-ion current through the SEI. This can be seen in Fig. 1cprocess B. To take the influence of the Li-ion current intoaccount, an electron migration flux is incorporated and theSEI flux is derived from the Nernst-Planck equation
NSEI = De- · ce-
LSEI− zFκe-
SEI∇Φ, (3)
with the valence z = −1, the conductivity of the localizedelectrons κe-
SEI, and the potential gradient ∇Φ in the SEIcaused by the Li-ion flux. According to [24], the electronconcentration in the SEI is approximated by
ce-
= ce-
0 · exp
(− F
RTηSEI
), (4)
with the interstitial concentration ce-
0 at 0V anode poten-tial, the universal gas constant R, and the temperature T .Furthermore, the potential gradient is approximated by
∇Φ =−USEI
LSEI, (5)
where the potential drop is defined as
USEI =LSEI
κSEILi+· jLi+ , (6)
with the conductivity κSEILi+
of Li-ions in the SEI.With the help of the Nernst-Einstein equation, the con-
ductivity κe-
SEI is approximated by the diffusion coefficient
De- = RTκe-
SEI/ce- ≈ 2RTκe-
SEI/ce-
0 (7)
and eq. 3 is rearranged to
NSEI =De- · ce-0
LSEI· exp
(− F
RTηSEI
)·(
1− F
2RTUSEI
).
(8)
The overpotential for the reaction is given as
ηSEI = Φs − ϕe − USEI, (9)
where Φs is the anode potential and ϕe is the electrochem-ical potential of the electrolyte.
The growth of the SEI not only affects the cells capacitybut also its inner resistance. This is taken into account inthe Butler-Volmer rate for the intercalation into graphite,where the overpotential is supplemented by the potentialdrop in the SEI and becomes
ηs = ηs − USEI. (10)
The overpotential of the Butler-Volmer term is given inRef. [35] (see also eq. A.6 in the supporting information).
4. Battery Cycling
We simulate battery cycling with the volume-averagedP2D model. Several battery parameters are required forthis. The parameters describing the microstructure mor-phologies are extracted from CT data (see sec. 2.2). Theconcentration-dependent electrolyte parameters are takenfrom Ref. [50]. The OCV curves are fitted to the mea-sured curves in Ref. [40] (see eq. A.8 and A.9 in the sup-porting information). The remaining cell parameters aredetermined with an optimization algorithm, where exper-imental data of a fresh cell from Ref. [5] are used. Theparameters can be found in Table B.1 and B.2 in the sup-porting information.
4.1. Parameterization
The parameters of the cell model, that are not knownfrom literature or measurements, are determined by anoptimization, where the deviation between experiment andsimulation, given as an objective function, is minimized.
Those parameters are the initial SOC on the anode sideand for both electrodes the maximal concentration of Li-ions in the active material cs,max, the diffusion coefficient ofLi-ions in the active material Ds, and the rate constant k.
The optimization algorithm should find the global min-imum and preferably it is parallelizable as the evaluationof the time-evolution of our physics-based model is time-consuming. To this aim, Forman et al. [37] used a geneticalgorithm to identify the parameters of the P2D modeland Rahman et al. [38] used particle swarm optimization.
Here, we will use the surrogate optimization, which isa stochastic optimization algorithm. The benefits of thisalgorithm are that its convergence to the global optimumis proven and that it can run in parallel [51]. To the bestof our knowledge, this is the first time that the surrogateoptimization has been used to identify the parameters ofthe P2D model.
4.1.1. Surrogate optimization
We briefly outline the algorithm for surrogate optimiza-tion. For further details, we refer to Refs. [51, 52]. In afirst phase, the algorithm evaluates the objective functionfor a given number of points, which are randomly chosen inthe given parameter space. These points get interpolatedby radial basis functions to build a surrogate function. Inthe next phase, the point with the smallest value is found.
5
Around this point, multiple points are sampled and an ad-ditional merit function is evaluated at these points. Themerit function consists of the surrogate and a functionthat describes the distance of sampled points to alreadyevaluated points. This ensures that the surrogate func-tion is minimized while searching in new regions. At thepoint, where the merit function has its minimal value, theobjective function is evaluated and the surrogate functionis updated. This procedure is repeated until a stoppingcriterion is reached. Subsequently, the surrogate gets re-jected and a new surrogate is created with new randompoints, while the best fit of the previous surrogate is keptfor comparison. This overall procedure of generating newsurrogate functions can be repeated until the global op-timum is found. Usually the search for the optimum isstopped after a predefined time.
4.1.2. Fitting
The objective function for the optimization is a weight-ed sum of the discharge curve error errV and the EoDVerror errEoDV. Here, we chose the L1-Norm to measurethe discharge curve error:
errV(θ) =
∫T
|Vexp(t)− Vsim(t; θ)|dt, (11)
where Vexp is the experimental voltage and Vsim is thevoltage output of the simulation over the discharge timeT for a given parameter vector θ. The EoDV error getsmeasured after a few cycles, since the cycling range has tolevel off after full discharge in the experiment as well as inthe simulation.
The parameters are optimized in a reasonable param-eter space. The results of the fitting can be found in Ta-ble B.2 in the supporting information. As the algorithmstopped due to a time stopping criterion, it cannot be as-sumed that the resulting parameters are the optimal pa-rameters. Also, it has not been shown yet that the param-eters of the P2D model are identifiable at all. Bizeray etal. showed the identifiability for the single particle model,which is a reduced version of the P2D model, in Ref. [53].In Ref. [54], Li et al. analysed the sensitivity of the P2Dmodel parameters. They showed that only part of the pa-rameters is identifiable.
The parameters of the battery cycling and those of thedegradation are correlated. Thus, the parameterization ofboth models needs to be linked to each other. For that pur-pose, the degradation parameters are taken into accountin this section.
4.2. Simulation and validation with in-flight data
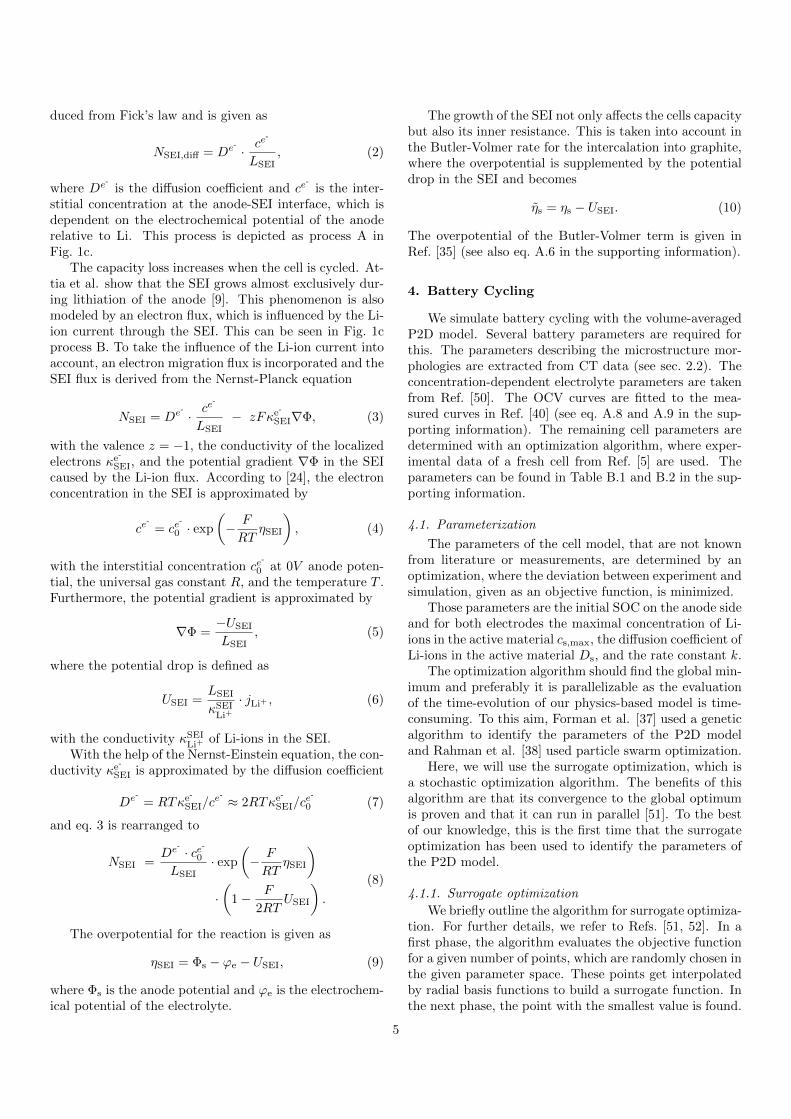
To validate the determined parameters, the satellitein-flight data are used. On orbit, the cells get charged viathe solar panels with a CC-CV profile. During the eclipseperiod, they get discharged to power the cameras for theaurora observation. There are two different discharge pro-files, depending on whether the aurora of the north or the
Figure 2: Three cycles of satellite REIMEI’s battery. In-flight dataand simulation corresponding to the satellite cycling protocol.
south pole is observed. The cycling protocols are describedin detail in Ref. [8].
In Fig. 2 the simulation of the in-flight data is depicted.The data were taken from the early life of the battery in2005. The cycling protocol, that has been used duringthis period of satellite operation, was for north pole ob-servation. It can also be found in Table 1 (P1). In thefigure we show the agreement between simulation and ex-periment over the cause of three cycles. It can be seenthat the discharge voltage curve is met by the simulation.
5. Battery Degradation
To determine the parameters of the degradation model,long-term cycling is simulated with the volume-averagedP2D model (see sec. 5.1). Subsequently, 3D simulationsare performed with the determined parameters. Differ-ent cycling protocols are used to examine the influence ofcharge and discharge currents on the SEI growth in themicrostructure (see sec. 5.2).
Protocol Charge (CC-CV) Discharge (CC) Temperature
P1 1.5 A / 4.1 V 0.88 A 0.74 A 20°C
(in-flight) 63 min 15 min 19 min
P2 1.5 A / 4.1 V (4.2 V) 1.0 A 25°C
(P2D) 65 min 35 min
P3 1.5 A / 4.1 V 1.0 A 25°C
(3D) 65 min 35 min
P4 1.5 A / 4.1 V 2.0 A 25°C
(3D) 65 min 35 min
P5 3.0 A / 4.1 V 2.0 A 25°C
(3D) 65 min 35 min
Table 1: Cycling protocols used in experiments and simulations.
6
The degradation with the P2D model is implementedin MATLAB [55]. The 3D model is implemented with thesoftware BEST [33]. Both kinds of simulations are run onthe high performance computer cluster JUSTUS 2 whichbelongs to the bwHPC.
5.1. Parameterization with P2D model
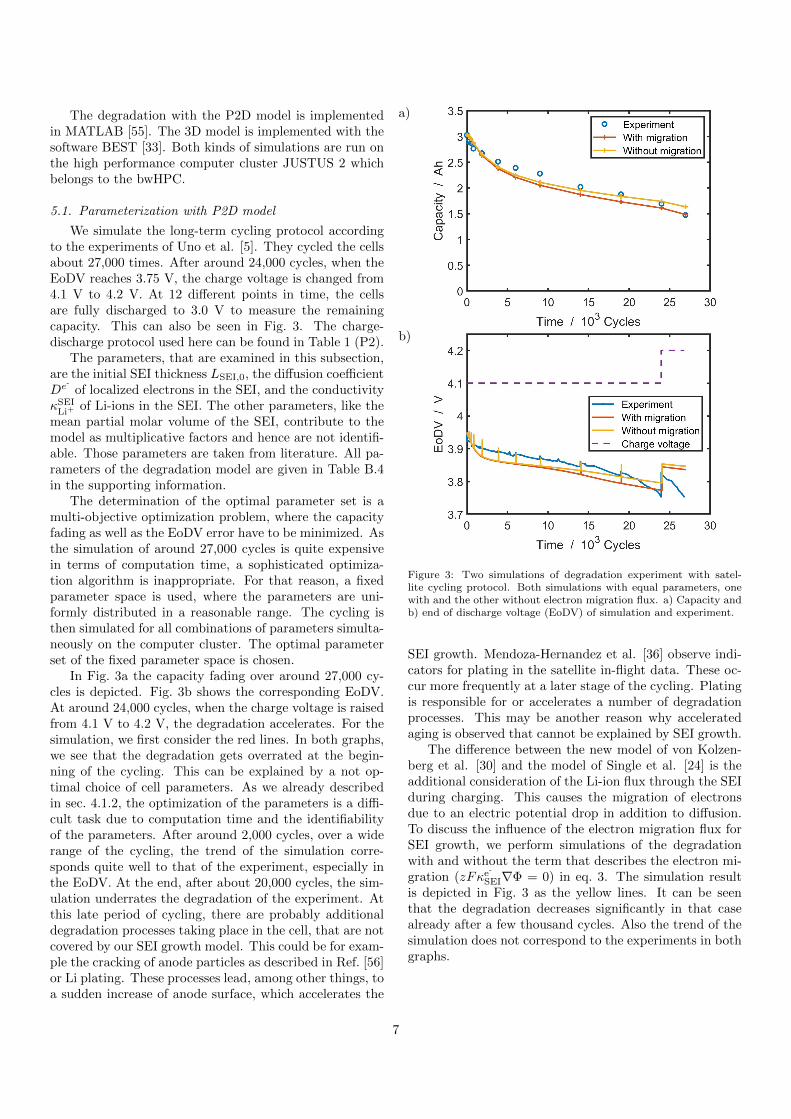
We simulate the long-term cycling protocol accordingto the experiments of Uno et al. [5]. They cycled the cellsabout 27,000 times. After around 24,000 cycles, when theEoDV reaches 3.75 V, the charge voltage is changed from4.1 V to 4.2 V. At 12 different points in time, the cellsare fully discharged to 3.0 V to measure the remainingcapacity. This can also be seen in Fig. 3. The charge-discharge protocol used here can be found in Table 1 (P2).
The parameters, that are examined in this subsection,are the initial SEI thickness LSEI,0, the diffusion coefficientDe- of localized electrons in the SEI, and the conductivityκSEI
Li+of Li-ions in the SEI. The other parameters, like the
mean partial molar volume of the SEI, contribute to themodel as multiplicative factors and hence are not identifi-able. Those parameters are taken from literature. All pa-rameters of the degradation model are given in Table B.4in the supporting information.
The determination of the optimal parameter set is amulti-objective optimization problem, where the capacityfading as well as the EoDV error have to be minimized. Asthe simulation of around 27,000 cycles is quite expensivein terms of computation time, a sophisticated optimiza-tion algorithm is inappropriate. For that reason, a fixedparameter space is used, where the parameters are uni-formly distributed in a reasonable range. The cycling isthen simulated for all combinations of parameters simulta-neously on the computer cluster. The optimal parameterset of the fixed parameter space is chosen.
In Fig. 3a the capacity fading over around 27,000 cy-cles is depicted. Fig. 3b shows the corresponding EoDV.At around 24,000 cycles, when the charge voltage is raisedfrom 4.1 V to 4.2 V, the degradation accelerates. For thesimulation, we first consider the red lines. In both graphs,we see that the degradation gets overrated at the begin-ning of the cycling. This can be explained by a not op-timal choice of cell parameters. As we already describedin sec. 4.1.2, the optimization of the parameters is a diffi-cult task due to computation time and the identifiabilityof the parameters. After around 2,000 cycles, over a widerange of the cycling, the trend of the simulation corre-sponds quite well to that of the experiment, especially inthe EoDV. At the end, after about 20,000 cycles, the sim-ulation underrates the degradation of the experiment. Atthis late period of cycling, there are probably additionaldegradation processes taking place in the cell, that are notcovered by our SEI growth model. This could be for exam-ple the cracking of anode particles as described in Ref. [56]or Li plating. These processes lead, among other things, toa sudden increase of anode surface, which accelerates the
a)
b)
Figure 3: Two simulations of degradation experiment with satel-lite cycling protocol. Both simulations with equal parameters, onewith and the other without electron migration flux. a) Capacity andb) end of discharge voltage (EoDV) of simulation and experiment.
SEI growth. Mendoza-Hernandez et al. [36] observe indi-cators for plating in the satellite in-flight data. These oc-cur more frequently at a later stage of the cycling. Platingis responsible for or accelerates a number of degradationprocesses. This may be another reason why acceleratedaging is observed that cannot be explained by SEI growth.
The difference between the new model of von Kolzen-berg et al. [30] and the model of Single et al. [24] is theadditional consideration of the Li-ion flux through the SEIduring charging. This causes the migration of electronsdue to an electric potential drop in addition to diffusion.To discuss the influence of the electron migration flux forSEI growth, we perform simulations of the degradationwith and without the term that describes the electron mi-gration (zFκe-
SEI∇Φ = 0) in eq. 3. The simulation resultis depicted in Fig. 3 as the yellow lines. It can be seenthat the degradation decreases significantly in that casealready after a few thousand cycles. Also the trend of thesimulation does not correspond to the experiments in bothgraphs.
7
a)
b)
c)
d)
e)
f)
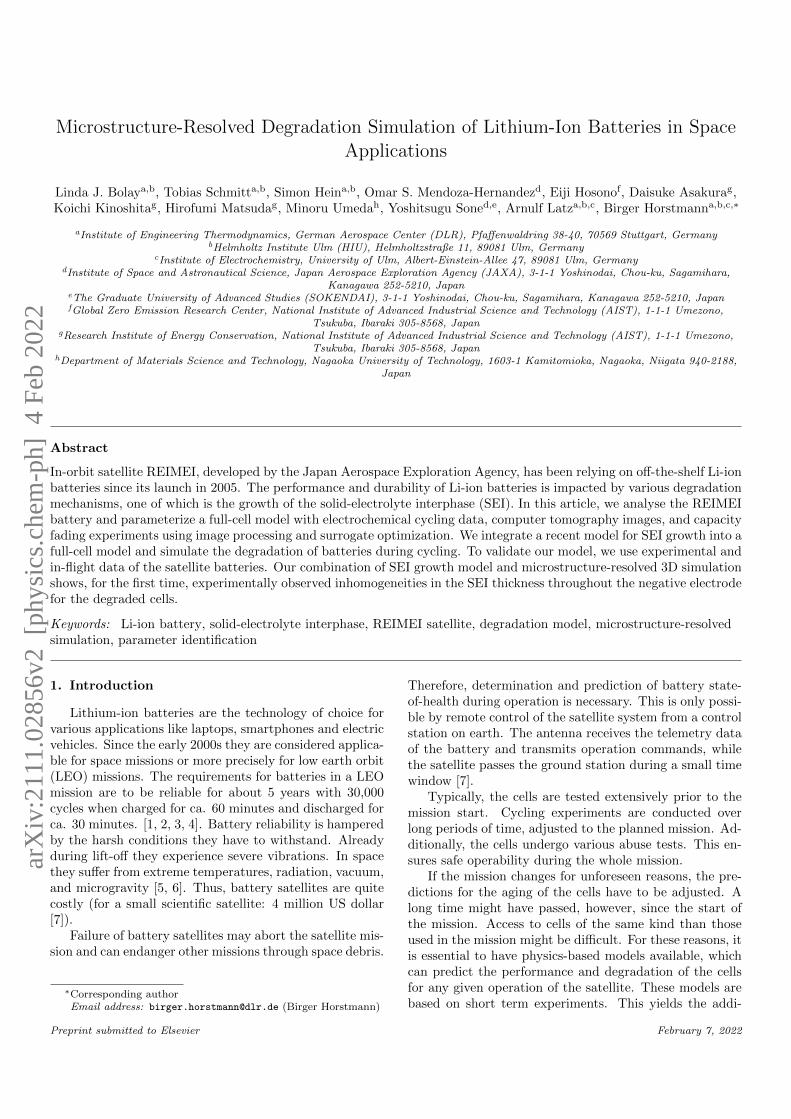
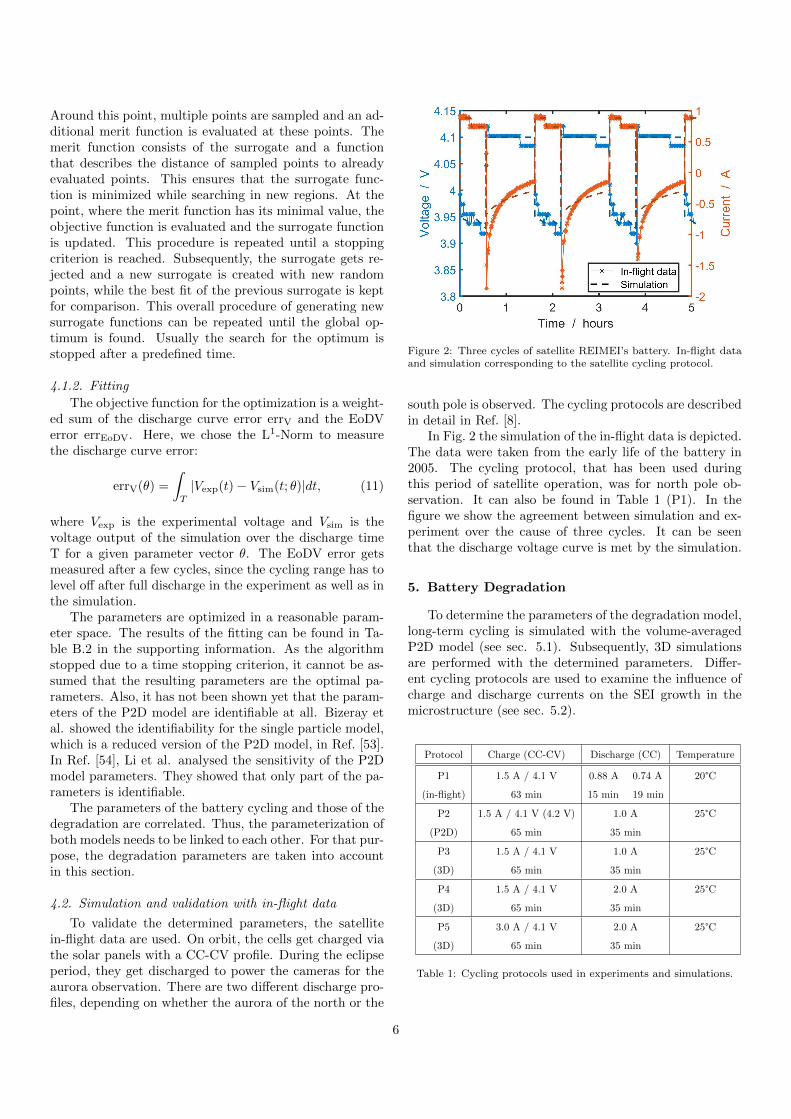
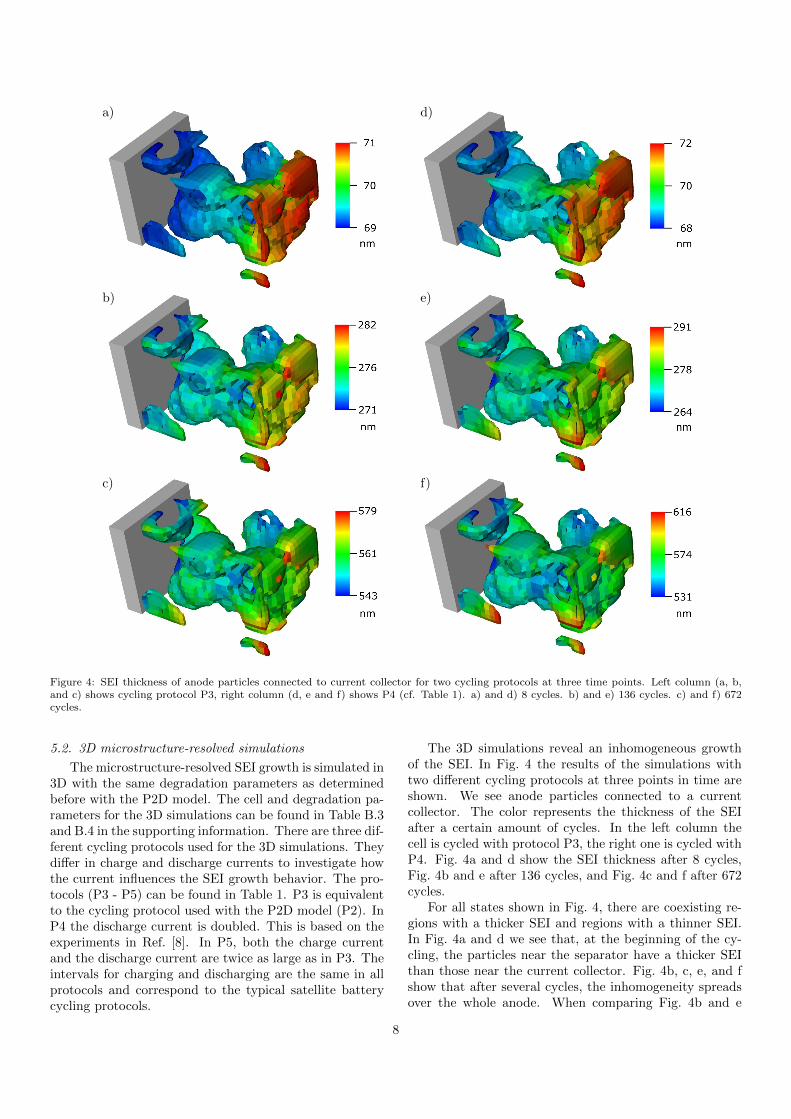
Figure 4: SEI thickness of anode particles connected to current collector for two cycling protocols at three time points. Left column (a, b,and c) shows cycling protocol P3, right column (d, e and f) shows P4 (cf. Table 1). a) and d) 8 cycles. b) and e) 136 cycles. c) and f) 672cycles.
5.2. 3D microstructure-resolved simulations
The microstructure-resolved SEI growth is simulated in3D with the same degradation parameters as determinedbefore with the P2D model. The cell and degradation pa-rameters for the 3D simulations can be found in Table B.3and B.4 in the supporting information. There are three dif-ferent cycling protocols used for the 3D simulations. Theydiffer in charge and discharge currents to investigate howthe current influences the SEI growth behavior. The pro-tocols (P3 - P5) can be found in Table 1. P3 is equivalentto the cycling protocol used with the P2D model (P2). InP4 the discharge current is doubled. This is based on theexperiments in Ref. [8]. In P5, both the charge currentand the discharge current are twice as large as in P3. Theintervals for charging and discharging are the same in allprotocols and correspond to the typical satellite batterycycling protocols.
The 3D simulations reveal an inhomogeneous growthof the SEI. In Fig. 4 the results of the simulations withtwo different cycling protocols at three points in time areshown. We see anode particles connected to a currentcollector. The color represents the thickness of the SEIafter a certain amount of cycles. In the left column thecell is cycled with protocol P3, the right one is cycled withP4. Fig. 4a and d show the SEI thickness after 8 cycles,Fig. 4b and e after 136 cycles, and Fig. 4c and f after 672cycles.
For all states shown in Fig. 4, there are coexisting re-gions with a thicker SEI and regions with a thinner SEI.In Fig. 4a and d we see that, at the beginning of the cy-cling, the particles near the separator have a thicker SEIthan those near the current collector. Fig. 4b, c, e, and fshow that after several cycles, the inhomogeneity spreadsover the whole anode. When comparing Fig. 4b and e
8
or Fig. 4c and f, we see that this happens sooner for theprotocol with the higher discharge current.
After many cycles, there are particular domains of theanode, where the SEI is noticeably thicker. In Fig. 4f,we observe that these are the thinner parts of the anode.Especially the peak-like structures have the thickest SEI.
The inhomogeneous growth is caused by the varyingSOCs through the anode and consequently varying over-potentials at the anode SEI interface. The thinner partsof the particles reach higher SOCs faster, when chargingthe cell.
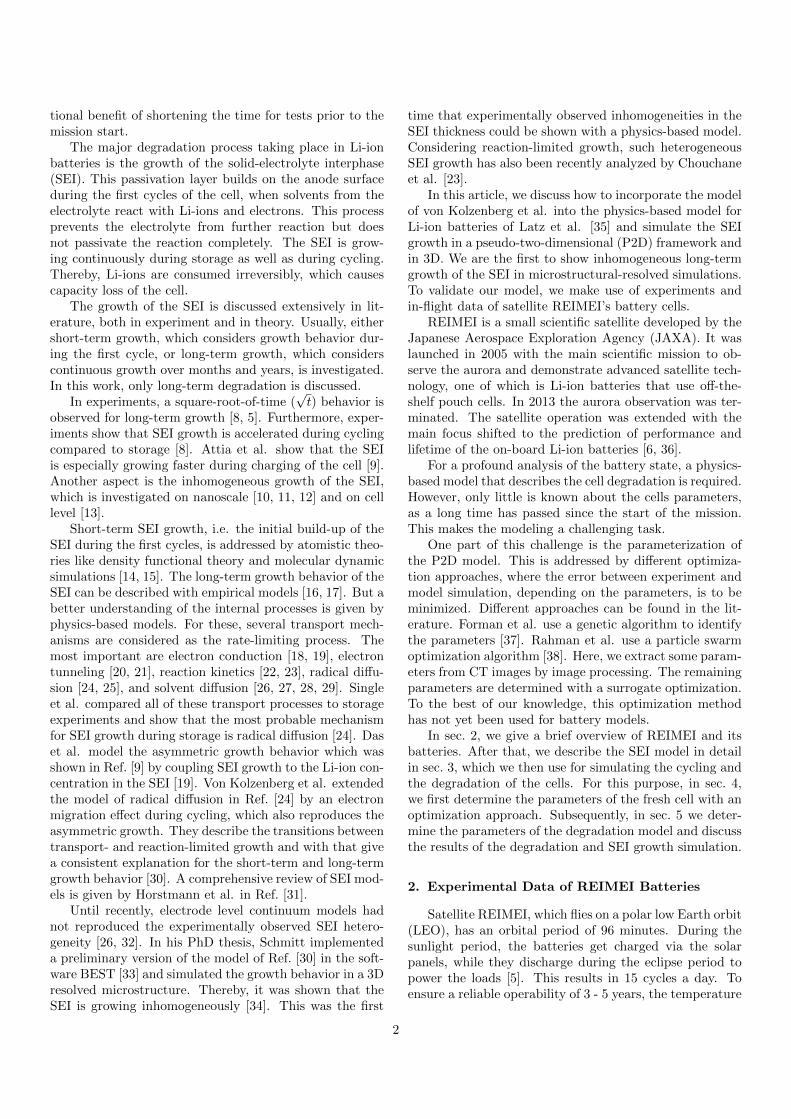
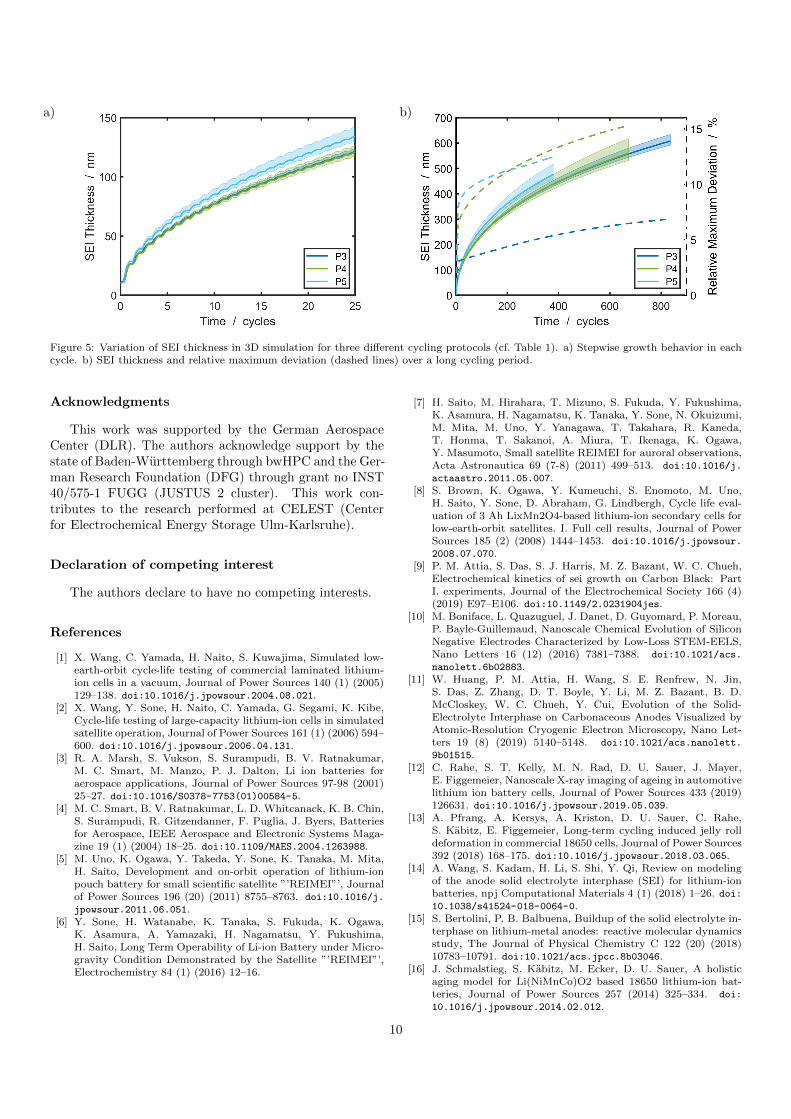
For a quantitative analysis of the growth and varia-tion of SEI thickness, its mean, minimum, and maximum,throughout the anode, at every computed time step, isdepicted in Fig. 5. We investigate here the three cyclingprotocols P3 - P5 at a short period of 25 cycles, which cor-responds to about two days, and a long period of 400 - 800cycles, which corresponds to approximately 1 - 2 months.
When regarding the SEI thickness at the short period,as shown in Fig. 5a, we observe a stepwise growth behav-ior. During charging of the cell or more precisely duringlithiation of the anode, the SEI is growing faster than dur-ing delithiation. These simulations reflect that the growthrate depends on the current density, which has been ob-served experimentally in Ref. [9].
Furthermore, when comparing the cycling protocols inFig. 5a, we note differences in SEI thickness and its inho-mogeneity. This becomes even clearer in the longer periodin Fig. 5b. The differences in the total length of the cyclingsimulations are due to numerical instabilities, when usinghigher currents. When comparing the mean SEI thicknessof the different protocols, we observe that for P3 and P4,which differ in the discharge current, there is no significantdifference in the thickness. In contrast, the SEI is growingfaster for P5, which has a higher charge current than theother two protocols. This is also in accordance with thegrowth behavior observed in Ref. [9] and rationalized inRef. [30].
The relative maximum deviation, i.e. the differencebetween minimum and maximum divided by the mean ofthe thickness, is shown as dashed lines in Fig. 5b. Thesimulations with doubled currents (P4 and P5) show asignificantly larger deviation, i.e. a more inhomogeneousSEI growth. We also see that the deviation is already re-markable for the first few cycles and increases only slightlythereafter.
6. Conclusion
In this work, we present models for the short-term cy-cling and the long-term degradation behavior of a Li-ioncell. The modeling is based on experimental work andin-flight data of the batteries of small scientific satelliteREIMEI, which was developed by JAXA. To describe thecycling behavior of the cell, we determine the parametersof the thermodynamic consistent transport theory of Latz
et al. [35], which we incorporate in a P2D model. Theparameters are determined with a surrogate optimization,in order to fit cycling experiments of the batteries. Sub-sequently, the model is validated by the satellite in-flightdata. We could show that the surrogate optimization isappropriate to find parameters to fit simulation and ex-periments of a few cycles. But this method has the samelimitation as other optimization methods, which lies in theunidentifiability of a few parameters of the P2D model.One could use the surrogate optimization to fit a widerrange of the experiment, e.g., the first 1000 cycles. Thisshould improve the accuracy of the estimated parameters,and all degradation parameters could also be included inthe optimization process. However, this would need sig-nificantly longer computation times.
Furthermore, we give an overview of a model for thecell degradation, caused by SEI growth during storage aswell as during cycling. This model describes the increasedgrowth rate during lithiation of the anode. We determinethe unknown parameters of the model with the help oflong-term satellite battery experiments, where we focus oncapacity fading and end-of-discharge voltage of the cells.
With the same model and parameters, we simulate celldegradation in 3D. The simulations show an inhomoge-neous growth of the SEI, which depends on the cyclingcurrents. This provides a deeper understanding of the pro-cesses, which take place in a Li-ion battery.
Apart from the capacity fading due to SEI growth,there are more degradation mechanisms, which have notbeen considered in this work. A degradation mechanism,which can cause severe damages in the cell and also con-tributes to capacity fading, is the deposition of metalliclithium on the anode surface. It is referred to as Li plat-ing. In Ref. [36], Mendoza et al. analyse the battery in-flight data of satellite REIMEI over an interval of 14 years.They observe a knee in the discharge voltage curves, whichthey suggest to be due to plating. Hein et al. modeledLi plating and simulated it in a microstructure-resolvedframework [45].
In this study we chose physics-based continuum modelsfor our simulations as these are able to reproduce the pro-cesses taking place in Li-ion batteries and make them morecomprehensible. Apart from that, there are a lot more ap-proaches to model the battery behavior. In Ref. [57] Shi etal. give a comprehensive overview on multi-scale compu-tation methods. Similarly, Wang et al. review multi-scalemodels of SEI formation [14]. To parameterize our con-tinuum models, we employ experiments, since atomisticmodels do not yet provide the necessary accuracy.
In future work, we will incorporate plating into ourmodel. This work can be the foundation for performingstate estimation and reliably predicting the state of healthof satellite batteries in orbit.
9
a) b)
Figure 5: Variation of SEI thickness in 3D simulation for three different cycling protocols (cf. Table 1). a) Stepwise growth behavior in eachcycle. b) SEI thickness and relative maximum deviation (dashed lines) over a long cycling period.
Acknowledgments
This work was supported by the German AerospaceCenter (DLR). The authors acknowledge support by thestate of Baden-Wurttemberg through bwHPC and the Ger-man Research Foundation (DFG) through grant no INST40/575-1 FUGG (JUSTUS 2 cluster). This work con-tributes to the research performed at CELEST (Centerfor Electrochemical Energy Storage Ulm-Karlsruhe).
Declaration of competing interest
The authors declare to have no competing interests.
References
[1] X. Wang, C. Yamada, H. Naito, S. Kuwajima, Simulated low-earth-orbit cycle-life testing of commercial laminated lithium-ion cells in a vacuum, Journal of Power Sources 140 (1) (2005)129–138. doi:10.1016/j.jpowsour.2004.08.021.
[2] X. Wang, Y. Sone, H. Naito, C. Yamada, G. Segami, K. Kibe,Cycle-life testing of large-capacity lithium-ion cells in simulatedsatellite operation, Journal of Power Sources 161 (1) (2006) 594–600. doi:10.1016/j.jpowsour.2006.04.131.
[3] R. A. Marsh, S. Vukson, S. Surampudi, B. V. Ratnakumar,M. C. Smart, M. Manzo, P. J. Dalton, Li ion batteries foraerospace applications, Journal of Power Sources 97-98 (2001)25–27. doi:10.1016/S0378-7753(01)00584-5.
[4] M. C. Smart, B. V. Ratnakumar, L. D. Whitcanack, K. B. Chin,S. Surampudi, R. Gitzendanner, F. Puglia, J. Byers, Batteriesfor Aerospace, IEEE Aerospace and Electronic Systems Maga-zine 19 (1) (2004) 18–25. doi:10.1109/MAES.2004.1263988.
[5] M. Uno, K. Ogawa, Y. Takeda, Y. Sone, K. Tanaka, M. Mita,H. Saito, Development and on-orbit operation of lithium-ionpouch battery for small scientific satellite ”’REIMEI”’, Journalof Power Sources 196 (20) (2011) 8755–8763. doi:10.1016/j.
jpowsour.2011.06.051.[6] Y. Sone, H. Watanabe, K. Tanaka, S. Fukuda, K. Ogawa,
K. Asamura, A. Yamazaki, H. Nagamatsu, Y. Fukushima,H. Saito, Long Term Operability of Li-ion Battery under Micro-gravity Condition Demonstrated by the Satellite ”’REIMEI”’,Electrochemistry 84 (1) (2016) 12–16.
[7] H. Saito, M. Hirahara, T. Mizuno, S. Fukuda, Y. Fukushima,K. Asamura, H. Nagamatsu, K. Tanaka, Y. Sone, N. Okuizumi,M. Mita, M. Uno, Y. Yanagawa, T. Takahara, R. Kaneda,T. Honma, T. Sakanoi, A. Miura, T. Ikenaga, K. Ogawa,Y. Masumoto, Small satellite REIMEI for auroral observations,Acta Astronautica 69 (7-8) (2011) 499–513. doi:10.1016/j.
actaastro.2011.05.007.[8] S. Brown, K. Ogawa, Y. Kumeuchi, S. Enomoto, M. Uno,
H. Saito, Y. Sone, D. Abraham, G. Lindbergh, Cycle life eval-uation of 3 Ah LixMn2O4-based lithium-ion secondary cells forlow-earth-orbit satellites. I. Full cell results, Journal of PowerSources 185 (2) (2008) 1444–1453. doi:10.1016/j.jpowsour.
2008.07.070.[9] P. M. Attia, S. Das, S. J. Harris, M. Z. Bazant, W. C. Chueh,
Electrochemical kinetics of sei growth on Carbon Black: PartI. experiments, Journal of the Electrochemical Society 166 (4)(2019) E97–E106. doi:10.1149/2.0231904jes.
[10] M. Boniface, L. Quazuguel, J. Danet, D. Guyomard, P. Moreau,P. Bayle-Guillemaud, Nanoscale Chemical Evolution of SiliconNegative Electrodes Characterized by Low-Loss STEM-EELS,Nano Letters 16 (12) (2016) 7381–7388. doi:10.1021/acs.
nanolett.6b02883.[11] W. Huang, P. M. Attia, H. Wang, S. E. Renfrew, N. Jin,
S. Das, Z. Zhang, D. T. Boyle, Y. Li, M. Z. Bazant, B. D.McCloskey, W. C. Chueh, Y. Cui, Evolution of the Solid-Electrolyte Interphase on Carbonaceous Anodes Visualized byAtomic-Resolution Cryogenic Electron Microscopy, Nano Let-ters 19 (8) (2019) 5140–5148. doi:10.1021/acs.nanolett.
9b01515.[12] C. Rahe, S. T. Kelly, M. N. Rad, D. U. Sauer, J. Mayer,
E. Figgemeier, Nanoscale X-ray imaging of ageing in automotivelithium ion battery cells, Journal of Power Sources 433 (2019)126631. doi:10.1016/j.jpowsour.2019.05.039.
[13] A. Pfrang, A. Kersys, A. Kriston, D. U. Sauer, C. Rahe,S. Kabitz, E. Figgemeier, Long-term cycling induced jelly rolldeformation in commercial 18650 cells, Journal of Power Sources392 (2018) 168–175. doi:10.1016/j.jpowsour.2018.03.065.
[14] A. Wang, S. Kadam, H. Li, S. Shi, Y. Qi, Review on modelingof the anode solid electrolyte interphase (SEI) for lithium-ionbatteries, npj Computational Materials 4 (1) (2018) 1–26. doi:10.1038/s41524-018-0064-0.
[15] S. Bertolini, P. B. Balbuena, Buildup of the solid electrolyte in-terphase on lithium-metal anodes: reactive molecular dynamicsstudy, The Journal of Physical Chemistry C 122 (20) (2018)10783–10791. doi:10.1021/acs.jpcc.8b03046.
[16] J. Schmalstieg, S. Kabitz, M. Ecker, D. U. Sauer, A holisticaging model for Li(NiMnCo)O2 based 18650 lithium-ion bat-teries, Journal of Power Sources 257 (2014) 325–334. doi:
10.1016/j.jpowsour.2014.02.012.
10
[17] K. A. Severson, P. M. Attia, N. Jin, N. Perkins, B. Jiang,Z. Yang, M. H. Chen, M. Aykol, P. K. Herring, D. Fraggedakis,M. Z. Bazant, S. J. Harris, W. C. Chueh, R. D. Braatz, Data-driven prediction of battery cycle life before capacity degra-dation, Nature Energy 4 (5) (2019) 383–391. doi:10.1038/
s41560-019-0356-8.[18] F. Roder, R. D. Braatz, U. Krewer, Multi-scale simulation of
heterogeneous surface film growth mechanisms in lithium-ionbatteries, Journal of the Electrochemical Society 164 (11) (2017)E3335–E3344. doi:10.1149/2.0241711jes.
[19] S. Das, P. M. Attia, W. C. Chueh, M. Z. Bazant, Electrochem-ical kinetics of sei growth on carbon black: Part II. Modeling,Journal of the Electrochemical Society 166 (4) (2019) E107–E118. doi:10.1149/2.0241904jes.
[20] Y. X. Lin, Z. Liu, K. Leung, L. Q. Chen, P. Lu, Y. Qi, Con-necting the irreversible capacity loss in Li-ion batteries with theelectronic insulating properties of solid electrolyte interphase(SEI) components, Journal of Power Sources 309 (2016) 221–230. doi:10.1016/j.jpowsour.2016.01.078.
[21] D. Li, D. Danilov, Z. Zhang, H. Chen, Y. Yang, P. H. L.Notten, Modeling the SEI-Formation on Graphite Electrodesin LiFePO4 Batteries, Journal of The Electrochemical Society162 (6) (2015) A858–A869. doi:10.1149/2.0161506jes.
[22] M. Heinrich, N. Wolff, N. Harting, V. Laue, F. Roder, S. Seitz,U. Krewer, Physico-Chemical Modeling of a Lithium-Ion Bat-tery: An Ageing Study with Electrochemical Impedance Spec-troscopy, Batteries and Supercaps 2 (6) (2019) 530–540. doi:
10.1002/batt.201900011.[23] M. Chouchane, O. Arcelus, A. A. Franco, Heterogeneous Solid-
Electrolyte Interphase in Graphite Electrodes Assessed by 4D-Resolved Computational Simulations, Batteries & Supercaps 4.doi:10.1002/batt.202100030.
[24] F. Single, A. Latz, B. Horstmann, Identifying the Mecha-nism of Continued Growth of the Solid-Electrolyte Interphase,ChemSusChem 11 (12) (2018) 1950–1955. doi:10.1002/cssc.
201800077.[25] F. A. Soto, Y. Ma, J. M. Martinez De La Hoz, J. M. Sem-
inario, P. B. Balbuena, Formation and Growth Mechanismsof Solid-Electrolyte Interphase Layers in Rechargeable Batter-ies, Chemistry of Materials 27 (23) (2015) 7990–8000. doi:
10.1021/acs.chemmater.5b03358.[26] M. B. Pinson, M. Z. Bazant, Theory of SEI formation in
rechargeable batteries: Capacity fade, accelerated aging andlifetime prediction, Journal of the Electrochemical Society160 (2) (2013) A243–A250. doi:10.1149/2.044302jes.
[27] H. J. Ploehn, P. Ramadass, R. E. White, Solvent DiffusionModel for Aging of Lithium-Ion Battery Cells, Journal of TheElectrochemical Society 151 (3) (2004) A456–A462. doi:10.
1149/1.1644601.[28] H. Ekstrom, G. Lindbergh, A Model for Predicting Capacity
Fade due to SEI Formation in a Commercial Graphite/LiFePO4 Cell , Journal of The Electrochemical Society 162 (6) (2015)A1003–A1007. doi:10.1149/2.0641506jes.
[29] F. Roder, R. D. Braatz, U. Krewer, Multi-Scale Modeling ofSolid Electrolyte Interface Formation in Lithium-Ion Batter-ies, in: Computer Aided Chemical Engineering, Vol. 38, El-sevier, 2016, pp. 157–162. doi:10.1016/B978-0-444-63428-3.
50031-X.[30] L. von Kolzenberg, A. Latz, B. Horstmann, Solid–Electrolyte
Interphase During Battery Cycling: Theory of Growth Regimes,ChemSusChem 13 (15) (2020) 3901–3910. arXiv:2004.01458,doi:10.1002/cssc.202000867.
[31] B. Horstmann, F. Single, A. Latz, Review on multi-scale mod-els of solid-electrolyte interphase formation, Current Opinionin Electrochemistry 13 (2019) 61–69. doi:10.1016/j.coelec.
2018.10.013.[32] A. A. Tahmasbi, T. Kadyk, M. H. Eikerling, Statistical physics-
based model of solid electrolyte interphase growth in lithium ionbatteries, Journal of The Electrochemical Society 164 (6) (2017)A1307–A1313. doi:10.1149/2.1581706jes.
[33] ITWM, BEST - Battery and Electrochemistry Simulation Tool,
http://itwm.fraunhofer.de/best (2020).[34] T. Schmitt, Degradation models and simulation tools for lithium
and zinc batteries, Ph.D. thesis, Universitat Ulm (2020).[35] A. Latz, J. Zausch, Thermodynamic consistent transport theory
of Li-ion batteries, Journal of Power Sources 196 (6) (2011)3296–3302. doi:10.1016/j.jpowsour.2010.11.088.
[36] O. S. Mendoza-Hernandez, L. J. Bolay, B. Horstmann, A. Latz,E. Hosono, D. Asakura, H. Matsuda, M. Itagaki, M. Umeda,Y. Sone, Durability analysis of the reimei satellite li-ion batter-ies after more than 14 years of operation in space, Electrochem-istry 88 (4) (2020) 300–304. doi:10.5796/electrochemistry.
20-00046.[37] J. C. Forman, S. J. Moura, J. L. Stein, H. K. Fathy, Genetic
identification and fisher identifiability analysis of the Doyle-Fuller-Newman model from experimental cycling of a LiFePO4 cell, Journal of Power Sources 210 (2012) 263–275. doi:
10.1016/j.jpowsour.2012.03.009.[38] A. Rahman, S. Anwar, A. Izadian, Electrochemical model pa-
rameter identification of a lithium-ion battery using particleswarm optimization method, Journal of Power Sources 307(2016) 86–97. doi:10.1016/j.jpowsour.2015.12.083.
[39] Y. Sone, H. Watanabe, K. Tanaka, O. Mendoza-Hernandez,S. Fukuda, M. Itagaki, K. Ogawa, K. Asamura, A. Yamazaki,H. Nagamatsu, Y. Fukushima, H. Saito, Internal Impedance ofthe Lithium-Ion Secondary Cells Used for Reimei Satellite afterthe Eleven Years Operation in Space, E3S Web of Conferences16 (3) (2017) 4–8. doi:10.1051/e3sconf/20171607005.
[40] S. Brown, K. Ogawa, Y. Kumeuchi, S. Enomoto, M. Uno,H. Saito, Y. Sone, D. Abraham, G. Lindbergh, Cycle life eval-uation of 3 Ah LixMn2O4-based lithium-ion secondary cellsfor low-earth-orbit satellites. II. Harvested electrode exami-nation, Journal of Power Sources 185 (2) (2008) 1454–1464.doi:10.1016/j.jpowsour.2008.07.070.
[41] B. Prifling, A. Ridder, A. Hilger, M. Osenberg, I. Manke, K. P.Birke, V. Schmidt, Analysis of structural and functional ag-ing of electrodes in lithium-ion batteries during rapid chargeand discharge rates using synchrotron tomography, Journal ofPower Sources 443 (2019) 227259. doi:10.1016/j.jpowsour.
2019.227259.[42] Math2Market GmbH, Deutschland, GeoDict 2019, https://
www.math2market.com/.[43] S. Hein, J. Feinauer, D. Westhoff, I. Manke, V. Schmidt,
A. Latz, Stochastic microstructure modeling and electrochemi-cal simulation of lithium-ion cell anodes in 3D, Journal of PowerSources 336 (2016) 161–171. doi:10.1016/j.jpowsour.2016.
10.057.[44] A. Latz, J. Zausch, Multiscale modeling of lithium ion batter-
ies: Thermal aspects, Beilstein Journal of Nanotechnology 6 (1)(2015) 987–1007. doi:10.3762/bjnano.6.102.
[45] S. Hein, A. Latz, Influence of local lithium metal depositionin 3D microstructures on local and global behavior of Lithium-ion batteries, Electrochimica Acta 201 (2016) 354–365. doi:
10.1016/j.electacta.2016.01.220.[46] T. Schmitt, A. Latz, B. Horstmann, Derivation of a local
volume-averaged model and a stable numerical algorithm formulti-dimensional simulations of conversion batteries, Elec-trochimica Acta 333 (2020) 135491. doi:10.1016/J.ELECTACTA.2019.135491.
[47] M. Doyle, T. F. Fuller, J. Newman, Modeling of GalvanostaticCharge and Discharge of the Lithium/Polymer/Insertion Cell,Journal of The Electrochemical Society 140 (6) (1993) 1526–1533. doi:10.1149/1.2221597.
[48] A. M. Bizeray, S. Zhao, S. R. Duncan, D. A. Howey, Lithium-ionbattery thermal-electrochemical model-based state estimationusing orthogonal collocation and a modified extended Kalmanfilter, Journal of Power Sources 296 (2015) 400–412. arXiv:
1506.08689, doi:10.1016/j.jpowsour.2015.07.019.[49] S. Shi, P. Lu, Z. Liu, Y. Qi, L. G. Hector, H. Li, S. J. Harris,
Direct calculation of li-ion transport in the solid electrolyte in-terphase, Journal of the American Chemical Society 134 (37)(2012) 15476–15487. doi:10.1021/ja305366r.
11
[50] A. Ehrl, J. Landesfeind, W. A. Wall, H. A. Gasteiger, Determi-nation of Transport Parameters in Liquid Binary Lithium IonBattery Electrolytes, Journal of The Electrochemical Society164 (4) (2017) A826–A836. doi:10.1149/2.1131704jes.
[51] R. G. Regis, C. A. Shoemaker, A Stochastic Radial Basis Func-tion Method for the Global Optimization of Expensive Func-tions, INFORMS Journal on Computing 19 (4) (2007) 497–509.doi:10.1287/ijoc.1060.0182.
[52] Y. Wang, C. A. Shoemaker, A General Stochastic Algorith-mic Framework for Minimizing Expensive Black Box ObjectiveFunctions Based on Surrogate Models and Sensitivity Analysis,arXiv preprint arXiv:1410.6271 (2014) .
[53] A. M. Bizeray, J. H. Kim, S. R. Duncan, D. A. Howey, Identifia-bility and Parameter Estimation of the Single Particle Lithium-Ion Battery Model, IEEE Transactions on Control SystemsTechnology 27 (5) (2019) 1862–1877. doi:10.1109/TCST.2018.
2838097.[54] W. Li, D. Cao, D. Jost, F. Ringbeck, M. Kuipers, F. Frie, D. U.
Sauer, Parameter sensitivity analysis of electrochemical model-based battery management systems for lithium-ion batteries,Applied Energy 269 (2020) 115104. doi:10.1016/j.apenergy.
2020.115104.[55] The MathWorks, Inc., Natick, Massachusetts, MATLAB 2020a,
https://www.mathworks.com/products/matlab.html.[56] J. M. Reniers, G. Mulder, D. A. Howey, Review and Perfor-
mance Comparison of Mechanical-Chemical Degradation Mod-els for Lithium-Ion Batteries, Journal of The Electrochemi-cal Society 166 (14) (2019) A3189–A3200. doi:10.1149/2.
0281914jes.[57] S. Shi, J. Gao, Y. Liu, Y. Zhao, Q. Wu, W. Ju, C. Ouyang,
R. Xiao, Multi-scale computation methods: Their applica-tions in lithium-ion battery research and development, ChinesePhysics B 25 (1) (2016) 018212. doi:10.1088/1674-1056/25/
1/018212.
12