Embed Size (px)
Citation preview
8/7/2019 Mindtree Utilization
http://slidepdf.com/reader/full/mindtree-utilization 1/14MindTree Ltd ACMIIL
C O M P A N Y R E P O R T
MindTree Ltd
AnalystHardik Shah
Tel: (022) 2858 3409
Key Data (INR)CMP 573
Target Price 588
Key Data
Bloomberg Code MTCL IN
Reuters Code MINT.BO
BSE Code 532819
NSE Code MINDTREE
Face Value (INR) 10
Market Cap. (INR Bn.) 22.5
52 Week High (INR) 729
52 Week Low (INR) 423
Avg. Daily Volume (6m) 92039
Shareholding %
Promoters 32.4
Mutual Funds / Bank/ FI 15.6
Foreign Institutional Investors 9.6
Bodies Corporate/Individuals/others 42.4
Total 100
INR mn FY10 FY11E FY12E
Revenues 12,959.8 14,976.0 18,105.1
Operating Income 2,455.6 2,247.7 3,026.4
Net Profi t 2,148.4 1,637.1 1,981.3
Net Prof it Margins 16.6% 10.9% 10.9%
EPS (INR.) 54.4 41.4 50.1
Book value (INR) 169.7 207.6 254.2
15 July, 2010
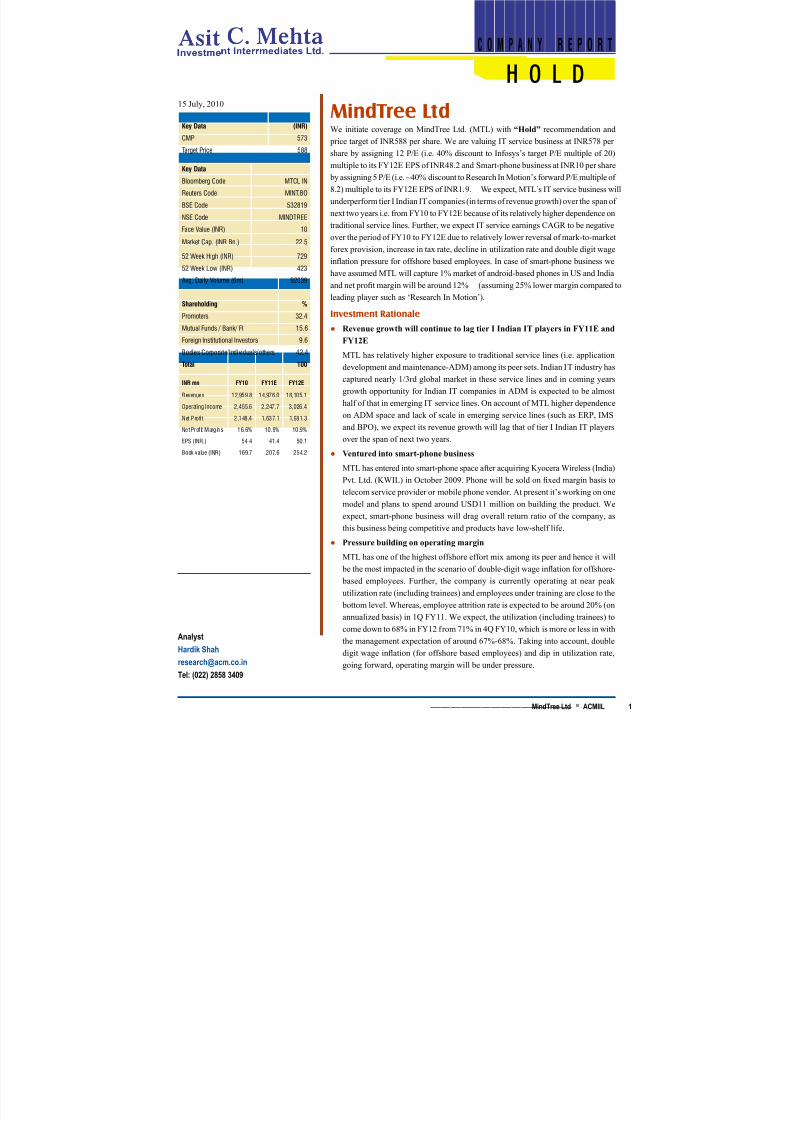
We initiate coverage on MindTree Ltd. (MTL) with “Hold” recommendation andprice target of INR588 per share. We are valuing IT service business at INR578 per
share by assigning 12 P/E (i.e. 40% discount to Infosys’s target P/E multiple of 20)
multiple to its FY12E EPS of INR48.2 and Smart-phone business at INR10 per share
by assigning 5 P/E (i.e. ~40% discount to Research In Motion’s forward P/E multiple of
8.2) multiple to its FY12E EPS of INR1.9. We expect, MTL’s IT service business will
underperform tier I Indian IT companies (in terms of revenue growth) over the span of
next two years i.e. from FY10 to FY12E because of its relatively higher dependence on
traditional service lines. Further, we expect IT service earnings CAGR to be negative
over the period of FY10 to FY12E due to relatively lower reversal of mark-to-market
forex provision, increase in tax rate, decline in utilization rate and double digit wage
ination pressure for offshore based employees. In case of smart-phone business we
have assumed MTL will capture 1% market of android-based phones in US and India
and net prot margin will be around 12% (assuming 25% lower margin compared to
leading player such as ‘Research In Motion’).
Investment Rationale
Revenue growth will continue to lag tier I Indian IT players in FY11E and
FY12E
MTL has relatively higher exposure to traditional service lines (i.e. application
development and maintenance-ADM) among its peer sets. Indian IT industry has
captured nearly 1/3rd global market in these service lines and in coming yearsgrowth opportunity for Indian IT companies in ADM is expected to be almost
half of that in emerging IT service lines. On account of MTL higher dependence
on ADM space and lack of scale in emerging service lines (such as ERP, IMS
and BPO), we expect its revenue growth will lag that of tier I Indian IT players
over the span of next two years.
Ventured into smart-phone business
MTL has entered into smart-phone space after acquiring Kyocera Wireless (India)
Pvt. Ltd. (KWIL) in October 2009. Phone will be sold on xed margin basis to
telecom service provider or mobile phone vendor. At present it’s working on one
model and plans to spend around USD11 million on building the product. We
expect, smart-phone business will drag overall return ratio of the company, as
this business being competitive and products have low-shelf life.
Pressure building on operating margin
MTL has one of the highest offshore effort mix among its peer and hence it will
be the most impacted in the scenario of double-digit wage ination for offshore-
based employees. Further, the company is currently operating at near peak
utilization rate (including trainees) and employees under training are close to the
bottom level. Whereas, employee attrition rate is expected to be around 20% (on
annualized basis) in 1Q FY11. We expect, the utilization (including trainees) to
come down to 68% in FY12 from 71% in 4Q FY10, which is more or less in with
the management expectation of around 67%-68%. Taking into account, double
digit wage ination (for offshore based employees) and dip in utilization rate,
going forward, operating margin will be under pressure.
●
●
●
H O L D
8/7/2019 Mindtree Utilization
http://slidepdf.com/reader/full/mindtree-utilization 2/14MindTree Ltd ACMIIL 2
C O M P A N Y R E P O R T
Company background
MindTree Ltd. (MTL), incorporated in 1999 by ten IT professionals, provides end-to-
end IT services. The company has a team of 8300 professionals serving 258 clients
across geographies and industries.Business model
MTL has presence across service lines i.e. traditional service lines as well as emerging
service lines. Within emerging service lines it offers consulting, ERP implementation,
testing and infrastructure management services (IMS). The company has recently
forayed into knowledge process outsourcing (KPO), however so far it has been unable
to make any signicant headway in this space.
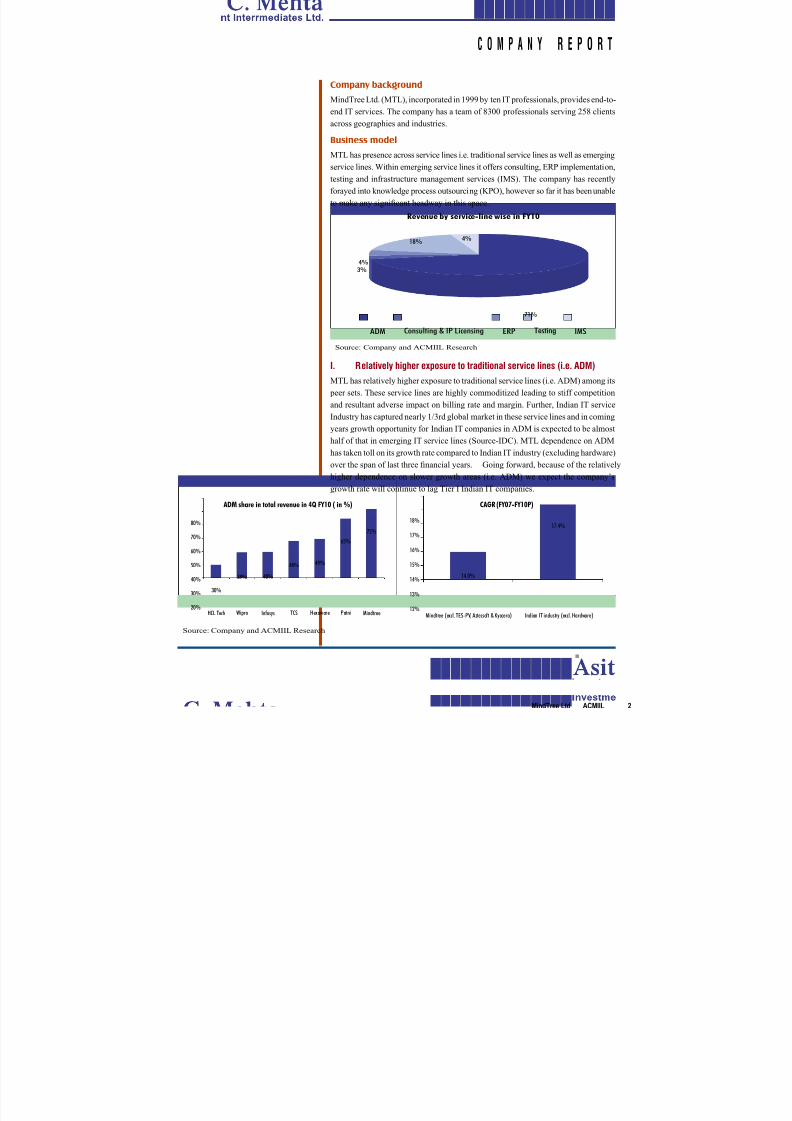
I. Relatively higher exposure to traditional service lines (i.e. ADM)
MTL has relatively higher exposure to traditional service lines (i.e. ADM) among itspeer sets. These service lines are highly commoditized leading to stiff competition
and resultant adverse impact on billing rate and margin. Further, Indian IT service
Industry has captured nearly 1/3rd global market in these service lines and in coming
years growth opportunity for Indian IT companies in ADM is expected to be almost
half of that in emerging IT service lines (Source-IDC). MTL dependence on ADM
has taken toll on its growth rate compared to Indian IT industry (excluding hardware)
over the span of last three nancial years. Going forward, because of the relatively
higher dependence on slower growth areas (i.e. ADM) we expect the company’s
growth rate will continue to lag Tier I Indian IT companies.
Revenue by service-line wise in FY10
ADM Consulting & IP Licensing ERP Testing IMS
71%
3%4%
18%4%
Source: Company and ACMIIL Research
ADM share in total revenue in 4Q FY10 ( in %)
20%
30%
40%
50%
60%
70%
80%
HCL Tech Wipro Infosys TCS Hexaware Patni Mindtree
30%
39% 40%
48% 49%
65%
72%
14.0%
17.4%
12%
13%
14%
15%
16%
17%
18%
Mindtree (excl. TES-PV, Aztecsoft & Kyocera) Indian IT industry (excl. Hardware)
CAGR (FY07-FY10P)
Source: Company and ACMIIL Research

8/7/2019 Mindtree Utilization
http://slidepdf.com/reader/full/mindtree-utilization 3/14MindTree Ltd ACMIIL 3
C O M P A N Y R E P O R T
II. Adopted inorganic route for diversifying into emerging service lines
The company has adopted ‘string of pearls’ acquisition strategy to diversify from
traditional service lines to emerging areas.
Service line Company acquired Year ofacquisition
Purchase consideration(in INR mn)
ERP ASAP Solutions Pvt. Ltd. FY05 32
Linc Sof tware Services Pvt. Ltd. FY06 306
Product engineering TES-Purple Vision FY08 259
Testing Aztec soft Ltd. FY09 3194
Smar t-phone business Kyocera Wireless India Pvt. Ltd. FY10 436
Infrastructure ManagementServices (IMS)
7Strata FY11 72
Source- Company and ACMIIL Research.
Despite company’s effort to diversify into non-ADM space through acquisition, it
has been unable to signicantly increase revenue share from non-ADM space excepttesting service lines.
Lacks scale in testing compared to leading player
MTL acquired Aztecsoft in FY09 to strengthen its presence in Independent
testing and to be among the top ve Indian IT companies in testing space (in
terms of revenue). The company was aiming that the acquisition will give them
signicant capability to bid for much larger deals in that space and win new
customers. However, it continues to lag in terms of size compared to leading
player (i.e. Wipro) and this factor is continuing to impact its performance (interms of revenue growth).
●
In 4Q FY10 In 4Q FY09 YoY growth
-5%
0%
5%
10%
15%
Mindtree Wipro0
50
100
150
InU S Dmn
137.6
124.5
12.7 12.9
11%
-2%
Revenue from testing services
Without Aztecsoft acquisition Including Aztecsoft acquisition-
10.0
20.0
30.0
40.0
50.0
13.2
39.1
Revenue from testing service (in USD mn) in FY09
Source: Company and ACMIIL Research
Revenue by service offering (non-ADM space)
FY07 FY08 FY09 FY10
Consulting & IP Licensing ERP Testing IMS0%
5%
10%
15%
20%
6%
3% 3%2%
4% 4%5%
3%4% 4%
18%
3%3%
4%
18%
4%
Source: Company and ACMIIL Research
8/7/2019 Mindtree Utilization
http://slidepdf.com/reader/full/mindtree-utilization 4/14MindTree Ltd ACMIIL 4
C O M P A N Y R E P O R T
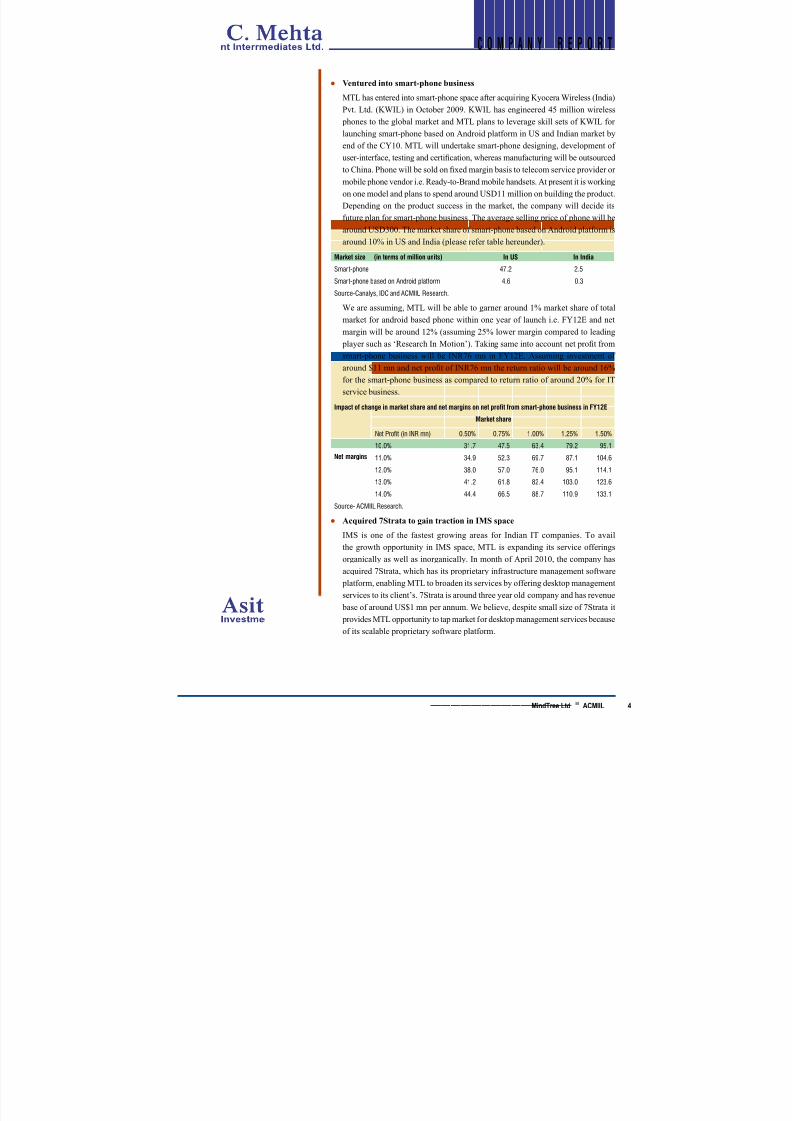
Ventured into smart-phone business
MTL has entered into smart-phone space after acquiring Kyocera Wireless (India)
Pvt. Ltd. (KWIL) in October 2009. KWIL has engineered 45 million wireless
phones to the global market and MTL plans to leverage skill sets of KWIL for
launching smart-phone based on Android platform in US and Indian market by
end of the CY10. MTL will undertake smart-phone designing, development of
user-interface, testing and certication, whereas manufacturing will be outsourced
to China. Phone will be sold on xed margin basis to telecom service provider or
mobile phone vendor i.e. Ready-to-Brand mobile handsets. At present it is working
on one model and plans to spend around USD11 million on building the product.
Depending on the product success in the market, the company will decide its
future plan for smart-phone business. The average selling price of phone will be
around USD300. The market share of smart-phone based on Android platform is
around 10% in US and India (please refer table hereunder).
Market size (in terms of million units) In US In India
Smart-phone 47.2 2.5
Smart-phone based on Android platform 4.6 0.3
Source-Canalys, IDC and ACMIIL Research.
We are assuming, MTL will be able to garner around 1% market share of total
market for android based phone within one year of launch i.e. FY12E and net
margin will be around 12% (assuming 25% lower margin compared to leading
player such as ‘Research In Motion’). Taking same into account net prot from
smart-phone business will be INR76 mn in FY12E. Assuming investment of
around $11 mn and net prot of INR76 mn the return ratio will be around 16%
for the smart-phone business as compared to return ratio of around 20% for ITservice business.
Impact of change in market share and net margins on net profit from smart-phone business in FY12E
Net margins
Market share
Net Profit (in INR mn) 0.50% 0.75% 1.00% 1.25% 1.50%
10.0% 31.7 47.5 63.4 79.2 95.1
11.0% 34.9 52.3 69.7 87.1 104.6
12.0% 38.0 57.0 76.0 95.1 114.1
13.0% 41.2 61.8 82.4 103.0 123.6
14.0% 44.4 66.5 88.7 110.9 133.1
Source- ACMIIL Research.Acquired 7Strata to gain traction in IMS space
IMS is one of the fastest growing areas for Indian IT companies. To avail
the growth opportunity in IMS space, MTL is expanding its service offerings
organically as well as inorganically. In month of April 2010, the company has
acquired 7Strata, which has its proprietary infrastructure management software
platform, enabling MTL to broaden its services by offering desktop management
services to its client’s. 7Strata is around three year old company and has revenue
base of around US$1 mn per annum. We believe, despite small size of 7Strata it
provides MTL opportunity to tap market for desktop management services because
of its scalable proprietary software platform.
●
●
8/7/2019 Mindtree Utilization
http://slidepdf.com/reader/full/mindtree-utilization 5/14MindTree Ltd ACMIIL 5
C O M P A N Y R E P O R T
Concern
Possibility of signicant decline in business from Kyocera Group
MTL acquired Kyocera Wireless (India) Pvt. Ltd. (KWIL) from Kyocera Wireless
Corporation (KWC) for around USD6 million. KWIL was captive division of KWC and had revenue of around USD18 million p.a. and net margin of around
15%. We believe KWIL was acquired at throwaway valuation of around 2.2x
P/E (assuming revenue of USD18 million p.a. and net margin of 15%). However,
lower valuation is justied to an extent because there is no revenue commitment
from KWC (normally in case of captive acquisition parent company gives revenue
commitment- case in point is CGSL acquisition by TCS from Citi along with
ten years revenue commitment by Citi). Lower valuation and lack of revenue
commitment point towards possibility of scaling down of business by KWC.
This is further corroborated by 3.4% (QoQ) decline in revenue from KWC in 4Q
FY10 and MTL has shifted around 200 employees of KWIL for the development
of smart phone.
Aggressive accounting policy
MTL follows the practice of setting off the goodwill arising on amalgamation
against the securities premium account. However, prudent accounting treatment
requires amortization of goodwill through prot and loss account over the span
of ve years. In comparison to standard accounting practice of amortization
of goodwill, the accounting policy followed by the company has inated both
earnings and return ratios of the company.
Companies amalgamated with MTL Amount adjusted against securitiespremium a/c (in INR mn)
Financial Year
Linc Software Services Pvt. Ltd. 251.7 FY07
TES-Purple Vision 214.3 FY09
Aztec soft Ltd. 1407.2 FY10
Source- Company and ACMIIL Research
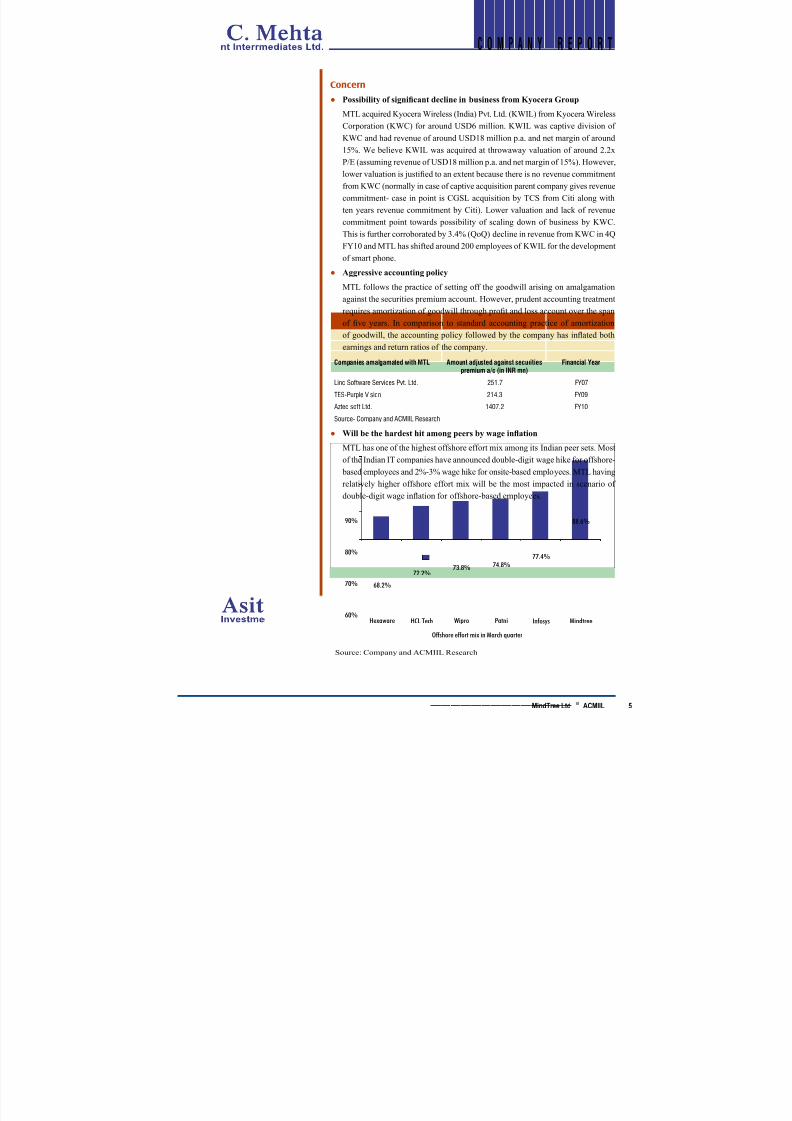
Will be the hardest hit among peers by wage ination
MTL has one of the highest offshore effort mix among its Indian peer sets. Most
of the Indian IT companies have announced double-digit wage hike for offshore-
based employees and 2%-3% wage hike for onsite-based employees. MTL having
relatively higher offshore effort mix will be the most impacted in scenario of
double-digit wage ination for offshore-based employees.
●
●
●
Offshore effort mix in March quarter
Hexaware HCL Tech Wipro Patni Infosys Mindtree60%
70%
80%
90%
68.2%
72.2%73.8% 74.8%
77.4%
88.6%
Source: Company and ACMIIL Research

8/7/2019 Mindtree Utilization
http://slidepdf.com/reader/full/mindtree-utilization 6/14MindTree Ltd ACMIIL
C O M P A N Y R E P O R T
High attrition rate will create pressure on current peak utilization rate
MTL is currently operating at near peak utilization rate (including trainees).
Further, employees under training are close to the bottom level. Whereas, employee
attrition rate is expected to be around 20% (on annualized basis) in 1Q FY11.
We believe the company will increase number of people under training to take
benet of improvement in environment and to reduce pressure on bench strength
caused by the high attrition rate. We expect, utilization (including trainees) to come
down to 68% in FY12 from 71% in 4Q FY10, which is more or less in with the
management expectation of around 67%-68%.
●
Utilization rate (incl. Trainees) % of employees under training
50%
55%
60%
65%
70%
75%
0%
3%
6%
9%
1QFY08
2QFY08
3QFY08
4QFY08
1QFY09
2QFY09
3QFY09
4QFY09
1QFY10
2QFY10
3QFY10
4QFY10
65%
62%60%
63%66%
70%70%
65%
61%
65%
71% 71%
0%
7%
8%
0%1%
2% 2%1%
2% 1%
4%3%
Source: Company and ACMIIL Research
8/7/2019 Mindtree Utilization
http://slidepdf.com/reader/full/mindtree-utilization 7/14MindTree Ltd ACMIIL
C O M P A N Y R E P O R T
Financials
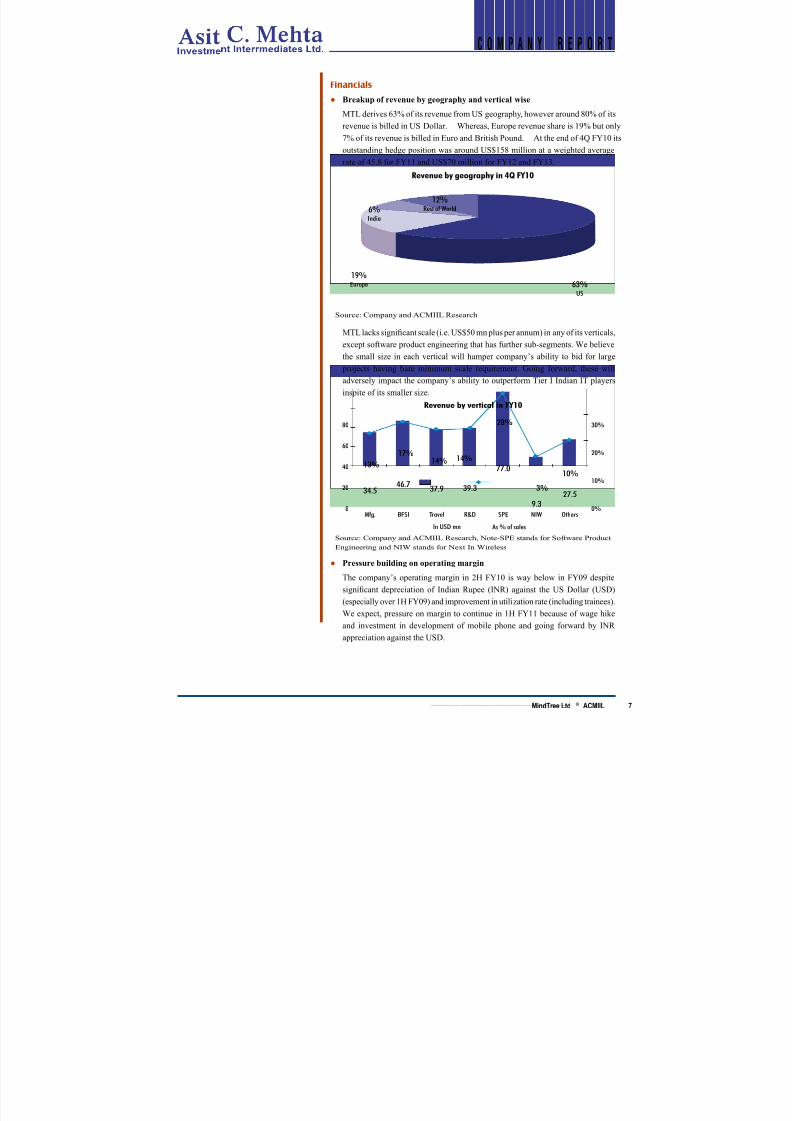
Breakup of revenue by geography and vertical wise
MTL derives 63% of its revenue from US geography, however around 80% of its
revenue is billed in US Dollar. Whereas, Europe revenue share is 19% but only7% of its revenue is billed in Euro and British Pound. At the end of 4Q FY10 its
outstanding hedge position was around US$158 million at a weighted average
rate of 45.8 for FY11 and US$70 million for FY12 and FY13.
MTL lacks signicant scale (i.e. US$50 mn plus per annum) in any of its verticals,
except software product engineering that has further sub-segments. We believe
the small size in each vertical will hamper company’s ability to bid for large
projects having bare minimum scale requirement. Going forward, these will
adversely impact the company’s ability to outperform Tier I Indian IT playersinspite of its smaller size.
Pressure building on operating margin
The company’s operating margin in 2H FY10 is way below in FY09 despite
signicant depreciation of Indian Rupee (INR) against the US Dollar (USD)
(especially over 1H FY09) and improvement in utilization rate (including trainees).
We expect, pressure on margin to continue in 1H FY11 because of wage hike
and investment in development of mobile phone and going forward by INR
appreciation against the USD.
●
●
Revenue by geography in 4Q FY10
63%US
19%Europe
6%India
12%Rest of World
Source: Company and ACMIIL Research
In USD mn As % of sales
Mfg. BFSI Travel R&D SPE NIW Others0
20
40
60
80
0%
10%
20%
30%
34.546.7
37.9 39.3
77.0
27.59.3
13%
17%14% 14%
3%
10%
28%
Revenue by vertical in FY10
Source: Company and ACMIIL Research, Note-SPE stands for Software Product
Engineering and NIW stands for Next In Wireless
8/7/2019 Mindtree Utilization
http://slidepdf.com/reader/full/mindtree-utilization 8/14MindTree Ltd ACMIIL 8
C O M P A N Y R E P O R T
Signicant revenue comes from SEZ
MTL’s around 40% revenue comes from SEZ and most of its STPI units have
come out of 10 years tax benet. The management expects major portion of itsincremental revenue to come from SEZ enabling it to maintain tax rate of around
17% and 18% in FY11 and FY12, respectively.
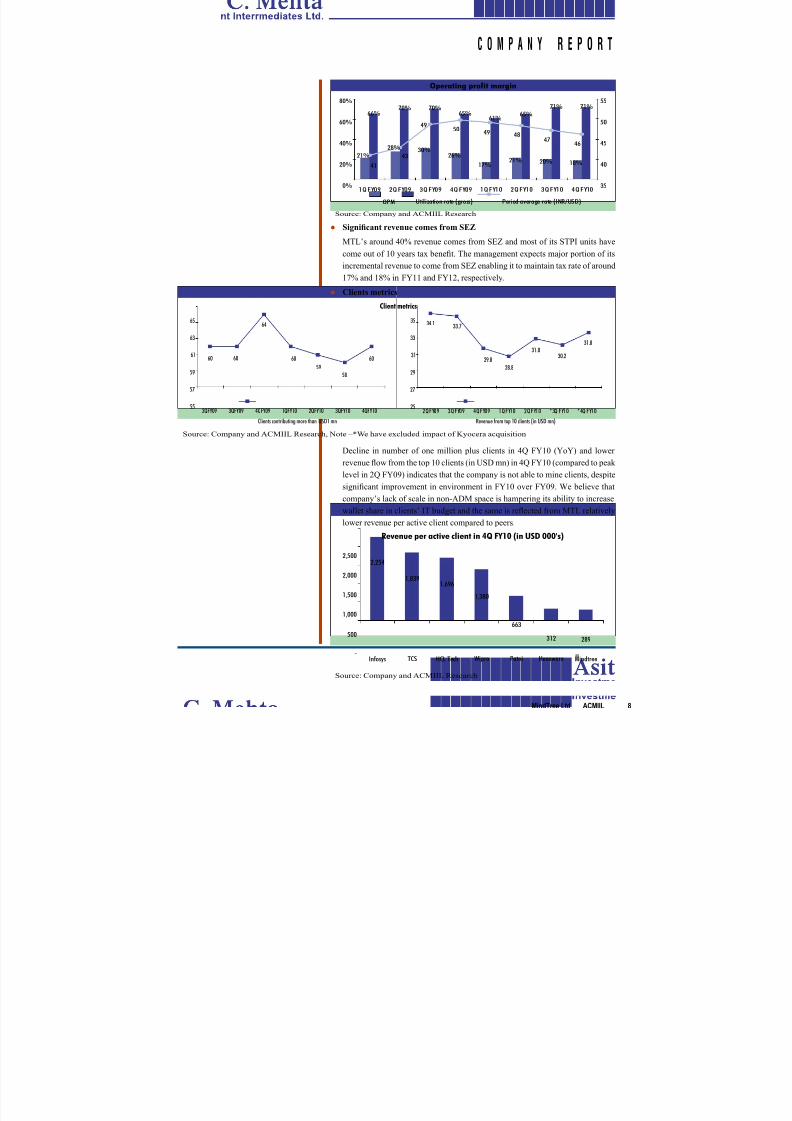
Clients metrics
Decline in number of one million plus clients in 4Q FY10 (YoY) and lower
revenue ow from the top 10 clients (in USD mn) in 4Q FY10 (compared to peak
level in 2Q FY09) indicates that the company is not able to mine clients, despite
signicant improvement in environment in FY10 over FY09. We believe that
company’s lack of scale in non-ADM space is hampering its ability to increase
wallet share in clients’ IT budget and the same is reected from MTL relativelylower revenue per active client compared to peers.
●
●
Revenue per active client in 4Q FY10 (in USD 000's)
-
500
1,000
1,500
2,000
2,500
Infosys TCS HCL Tech Wipro Patni Hexaware Mindtree
2,254
1,8391,696
1,380
663
312 289
Source: Company and ACMIIL Research
Operating profit margin
OPM Utilization rate (gross) Period average rate (INR/USD)
0%
20%
40%
60%
80%
35
40
45
50
55
1Q FY09 2Q FY09 3Q FY09 4Q FY09 1Q FY10 2Q FY10 3Q FY10 4Q FY10
21%
28% 30%26%
17%21% 20% 18%
66%70% 70%
65%61%
65%71% 71%
4647
48495049
41
43
Source: Company and ACMIIL Research
Client
Clients contributing more than USD1 mn
55
57
59
61
63
65
2QFY09 3QFY09 4QFY09 1QFY10 2QFY10 3QFY10 4QFY10
60 60 60
58
60
59
64
Revenue from top 10 clients (in USD mn)
25
27
29
31
33
35
2Q FY09 3Q FY09 4Q FY09 1Q FY10 2Q FY10 *3Q FY10 *4Q FY10
34.1 33.7
28.8
30.2
31.831.0
29.8
metrics
Source: Company and ACMIIL Research, Note –*We have excluded impact of Kyocera acquisition
8/7/2019 Mindtree Utilization
http://slidepdf.com/reader/full/mindtree-utilization 9/14MindTree Ltd ACMIIL 9
C O M P A N Y R E P O R T
Outlook and Valuation
We initiate coverage on MindTree Ltd. (MTL) with “Hold” recommendation and
price target of INR588 per share. We are valuing IT service business at INR578 per
share by assigning 12 P/E (i.e. 40% discount to Infosys’s target P/E multiple of 20)multiple to its FY12E EPS of INR48.2 and Smart-phone business at INR10 per share
by assigning 5 P/E (i.e. ~40% discount to Research In Motion’s forward P/E multiple of
8.2) multiple to its FY12E EPS of INR1.9. We expect, MTL’s IT service business will
underperform tier I Indian IT companies (in terms of revenue growth) over the span of
next two years i.e. from FY10 to FY12E because of its relatively higher dependence on
traditional service lines. Further, we expect IT service earnings CAGR to be negative
over the period of FY10 to FY12E due to relatively lower reversal of mark-to-market
forex provision, increase in tax rate, decline in utilization rate and double digit wage
ination pressure for offshore based employees. In case of smart-phone business we
have assumed MTL will capture 1% market of android-based phones in US and India
and net prot margin will be around 12% (assuming 25% lower margin compared toleading player such as ‘Research In Motion’).
8/7/2019 Mindtree Utilization
http://slidepdf.com/reader/full/mindtree-utilization 10/14MindTree Ltd ACMIIL 0
C O M P A N Y R E P O R T
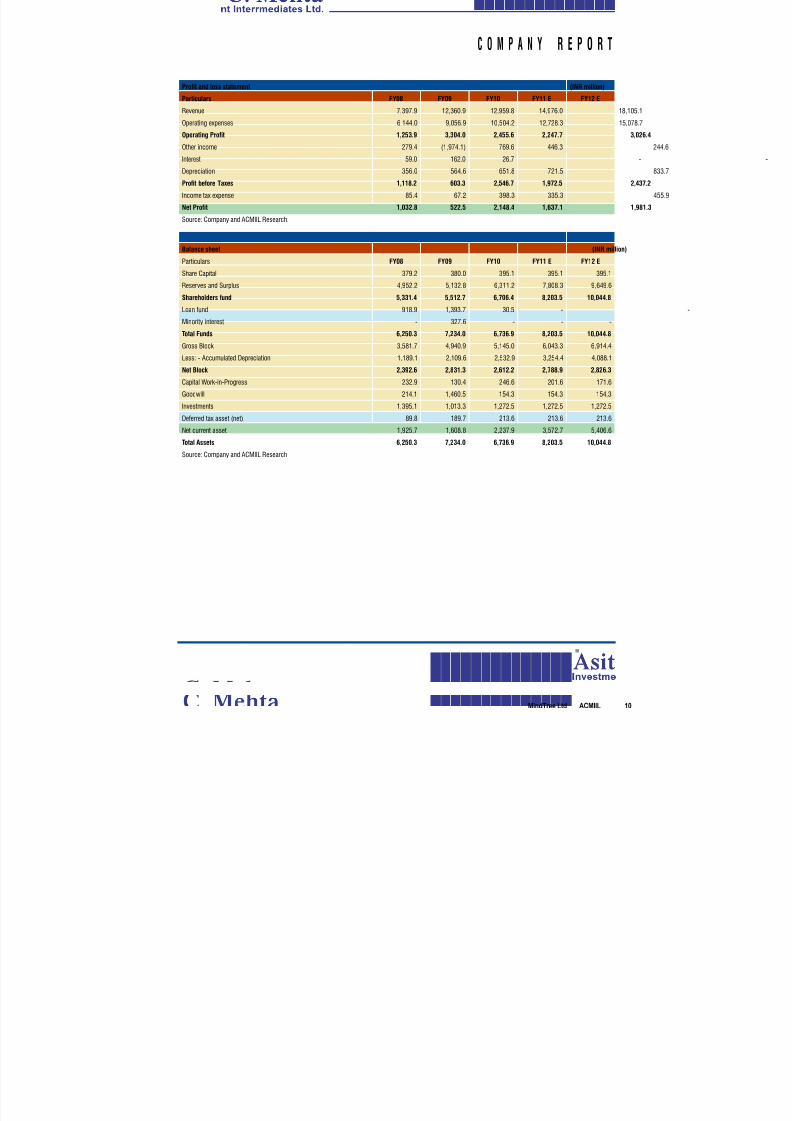
Profit and loss statement (INR million)
Particulars FY08 FY09 FY10 FY11 E FY12 E
Revenue 7,397.9 12,360.9 12,959.8 14,976.0 18,105.1
Operating expenses 6,144.0 9,056.9 10,504.2 12,728.3 15,078.7
Operating Profit 1,253.9 3,304.0 2,455.6 2,247.7 3,026.4
Other income 279.4 (1,974.1) 769.6 446.3
Interest 59.0 162.0 26.7 -
Depreciation 356.0 564.6 651.8 721.5
Profit before Taxes 1,118.2 603.3 2,546.7 1,972.5 2,437.2
Income tax expense 85.4 67.2 398.3 335.3
Net Profit 1,032.8 522.5 2,148.4 1,637.1 1,981.3
Source: Company and ACMIIL Research.
Balance sheet (INR million)
Particulars FY08 FY09 FY10 FY11 E FY12 E
Share Capital 379.2 380.0 395.1 395.1 395.1
Reserves and Surplus 4,952.2 5,132.8 6,311.2 7,808.3 9,649.6
Shareholders fund 5,331.4 5,512.7 6,706.4 8,203.5 10,044.8
Loan fund 918.9 1,393.7 30.5 -
Minority interest - 327.6 - - -
Total Funds 6,250.3 7,234.0 6,736.9 8,203.5 10,044.8
Gross Block 3,581.7 4,940.9 5,145.0 6,043.3 6,914.4
Less: - Accumulated Depreciation 1,189.1 2,109.6 2,532.9 3,254.4 4,088.1
Net Block 2,392.6 2,831.3 2,612.2 2,788.9 2,826.3
Capital Work-in-Progress 232.9 130.4 246.6 201.6 171.6
Goodwill 214.1 1,460.5 154.3 154.3 154.3
Investments 1,395.1 1,013.3 1,272.5 1,272.5 1,272.5
Deferred tax asset (net) 89.8 189.7 213.6 213.6 213.6
Net current asset 1,925.7 1,608.8 2,237.9 3,572.7 5,406.6
Total Assets 6,250.3 7,234.0 6,736.9 8,203.5 10,044.8
Source: Company and ACMIIL Research
8/7/2019 Mindtree Utilization
http://slidepdf.com/reader/full/mindtree-utilization 11/14MindTree Ltd ACMIIL
C O M P A N Y R E P O R T
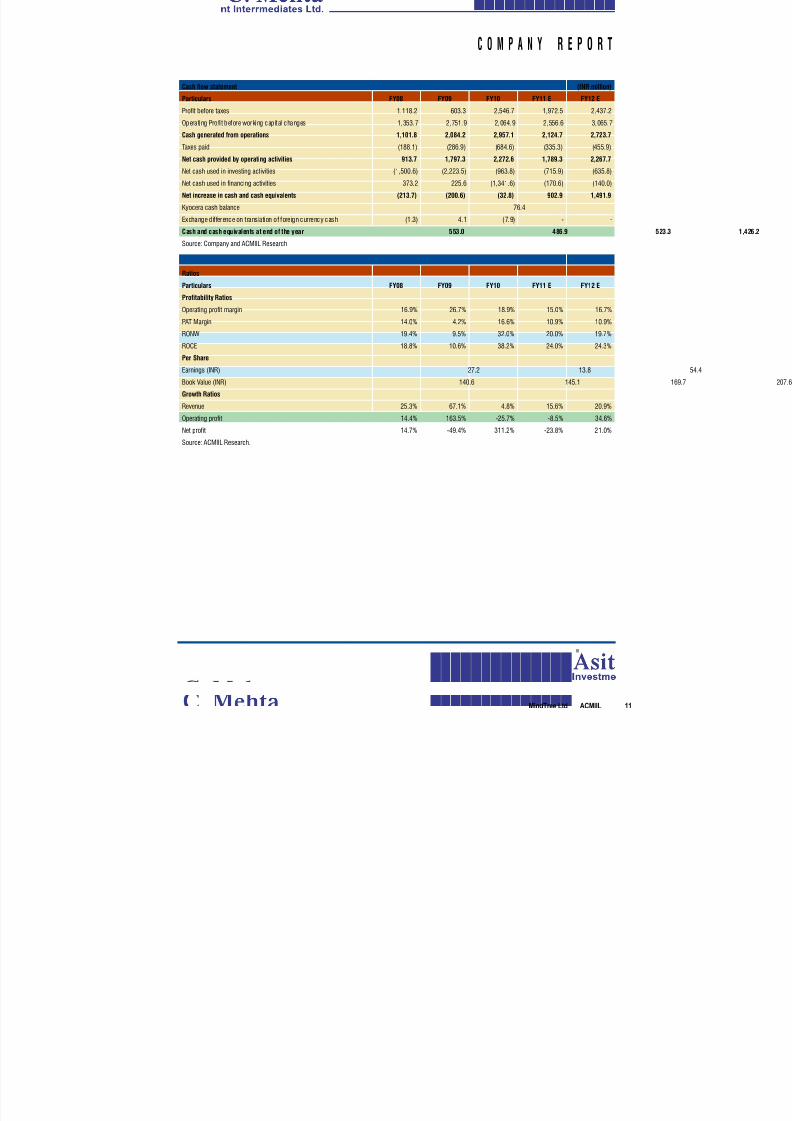
Cash flow statement (INR million)
Particulars FY08 FY09 FY10 FY11 E FY12 E
Profit before taxes 1,118.2 603.3 2,546.7 1,972.5 2,437.2
Operating Profit before working capital changes 1,353.7 2,751.9 2,064.9 2,556.6 3,065.7
Cash generated from operations 1,101.8 2,084.2 2,957.1 2,124.7 2,723.7
Taxes paid (188.1) (286.9) (684.6) (335.3) (455.9)
Net cash provided by operating activities 913.7 1,797.3 2,272.6 1,789.3 2,267.7
Net cash used in investing activities (1,500.6) (2,223.5) (963.8) (715.9) (635.8)
Net cash used in financing activities 373.2 225.6 (1,341.6) (170.6) (140.0)
Net increase in cash and cash equivalents (213.7) (200.6) (32.8) 902.9 1,491.9
Kyocera cash balance 76.4
Exchange dif ference on translation of foreign currency cash (1.3) 4.1 (7.9) - -
Cash and cash equivalents at end of the year 553.0 486.9
Source: Company and ACMIIL Research
Ratios
Particulars FY08 FY09 FY10 FY11 E FY12 E
Profitability Ratios
Operating profit margin 16.9% 26.7% 18.9% 15.0% 16.7%
PAT Margin 14.0% 4.2% 16.6% 10.9% 10.9%
RONW 19.4% 9.5% 32.0% 20.0% 19.7%
ROCE 18.8% 10.6% 38.2% 24.0% 24.3%
Per Share
Earnings (INR) 27.2 13.8
Book Value (INR) 140.6 145.1
Growth Ratios
Revenue 25.3% 67.1% 4.8% 15.6% 20.9%
Operating profit 14.4% 163.5% -25.7% -8.5% 34.6%
Net profit 14.7% -49.4% 311.2% -23.8% 21.0%
Source: ACMIIL Research.
8/7/2019 Mindtree Utilization
http://slidepdf.com/reader/full/mindtree-utilization 12/14MindTree Ltd ACMIIL 2
C O M P A N Y R E P O R T
Industry Outlook
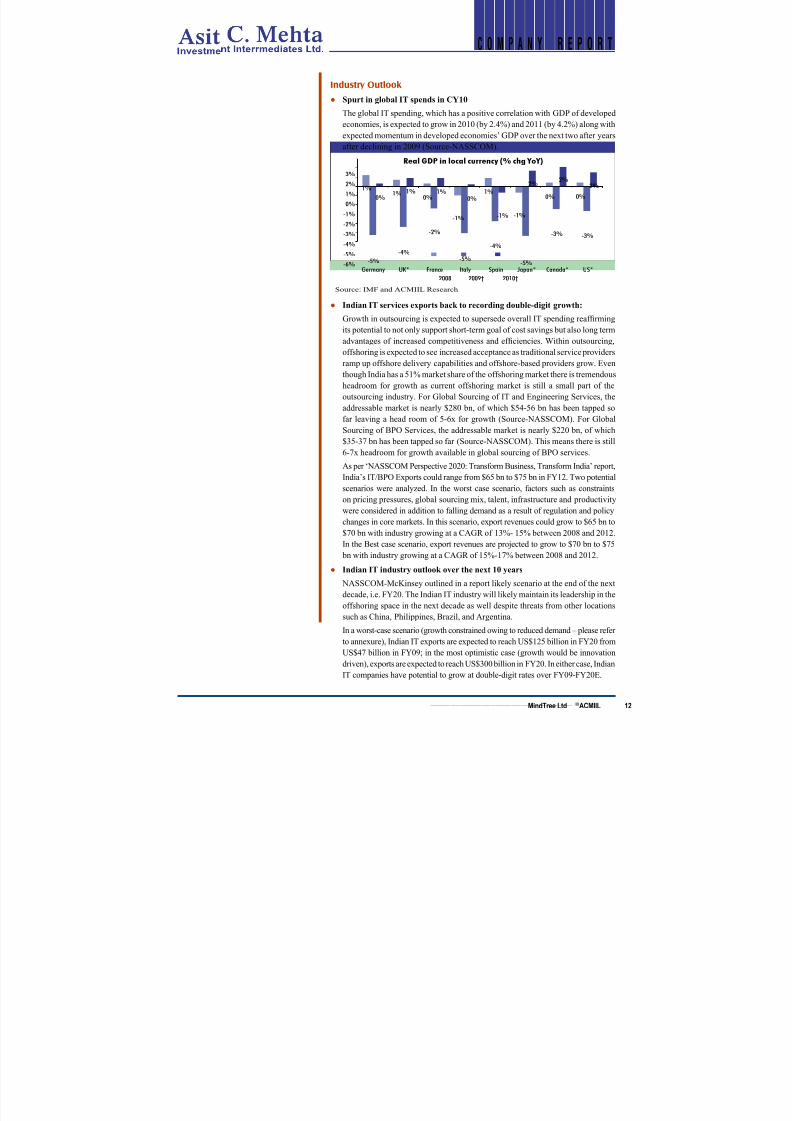
Spurt in global IT spends in CY10
The global IT spending, which has a positive correlation with GDP of developed
economies, is expected to grow in 2010 (by 2.4%) and 2011 (by 4.2%) along withexpected momentum in developed economies’ GDP over the next two after years
after declining in 2009 (Source-NASSCOM).
Indian IT services exports back to recording double-digit growth:
Growth in outsourcing is expected to supersede overall IT spending reafrming
its potential to not only support short-term goal of cost savings but also long term
advantages of increased competitiveness and efciencies. Within outsourcing,
offshoring is expected to see increased acceptance as traditional service providers
ramp up offshore delivery capabilities and offshore-based providers grow. Even
though India has a 51% market share of the offshoring market there is tremendous
headroom for growth as current offshoring market is still a small part of the
outsourcing industry. For Global Sourcing of IT and Engineering Services, the
addressable market is nearly $280 bn, of which $54-56 bn has been tapped so
far leaving a head room of 5-6x for growth (Source-NASSCOM). For Global
Sourcing of BPO Services, the addressable market is nearly $220 bn, of which
$35-37 bn has been tapped so far (Source-NASSCOM). This means there is still
6-7x headroom for growth available in global sourcing of BPO services.
As per ‘NASSCOM Perspective 2020: Transform Business, Transform India’ report,
India’s IT/BPO Exports could range from $65 bn to $75 bn in FY12. Two potential
scenarios were analyzed. In the worst case scenario, factors such as constraints
on pricing pressures, global sourcing mix, talent, infrastructure and productivity
were considered in addition to falling demand as a result of regulation and policychanges in core markets. In this scenario, export revenues could grow to $65 bn to
$70 bn with industry growing at a CAGR of 13%- 15% between 2008 and 2012.
In the Best case scenario, export revenues are projected to grow to $70 bn to $75
bn with industry growing at a CAGR of 15%-17% between 2008 and 2012.
Indian IT industry outlook over the next 10 years
NASSCOM-McKinsey outlined in a report likely scenario at the end of the next
decade, i.e. FY20. The Indian IT industry will likely maintain its leadership in the
offshoring space in the next decade as well despite threats from other locations
such as China, Philippines, Brazil, and Argentina.
In a worst-case scenario (growth constrained owing to reduced demand – please refer
to annexure), Indian IT exports are expected to reach US$125 billion in FY20 from
US$47 billion in FY09; in the most optimistic case (growth would be innovation
driven), exports are expected to reach US$300 billion in FY20. In either case, Indian
IT companies have potential to grow at double-digit rates over FY09-FY20E.
●
●
●
Real GDP in local currency (% chg YoY)
-6%-5%
-4%
-3%
-2%
-1%
0%
1%
2%
3%
1%1%
0%1%
0% 0%0%1% 1%
0%
2%2%
2%
-1%-1%
-5%-4%
-2%
-5%
-4%
-5%
-3% -3%
-1%
Germany UK* France Italy Spain Japan* Canada* US*
2008 2009† 2010†
Source: IMF and ACMIIL Research
8/7/2019 Mindtree Utilization
http://slidepdf.com/reader/full/mindtree-utilization 13/14MindTree Ltd ACMIIL 3
C O M P A N Y R E P O R T
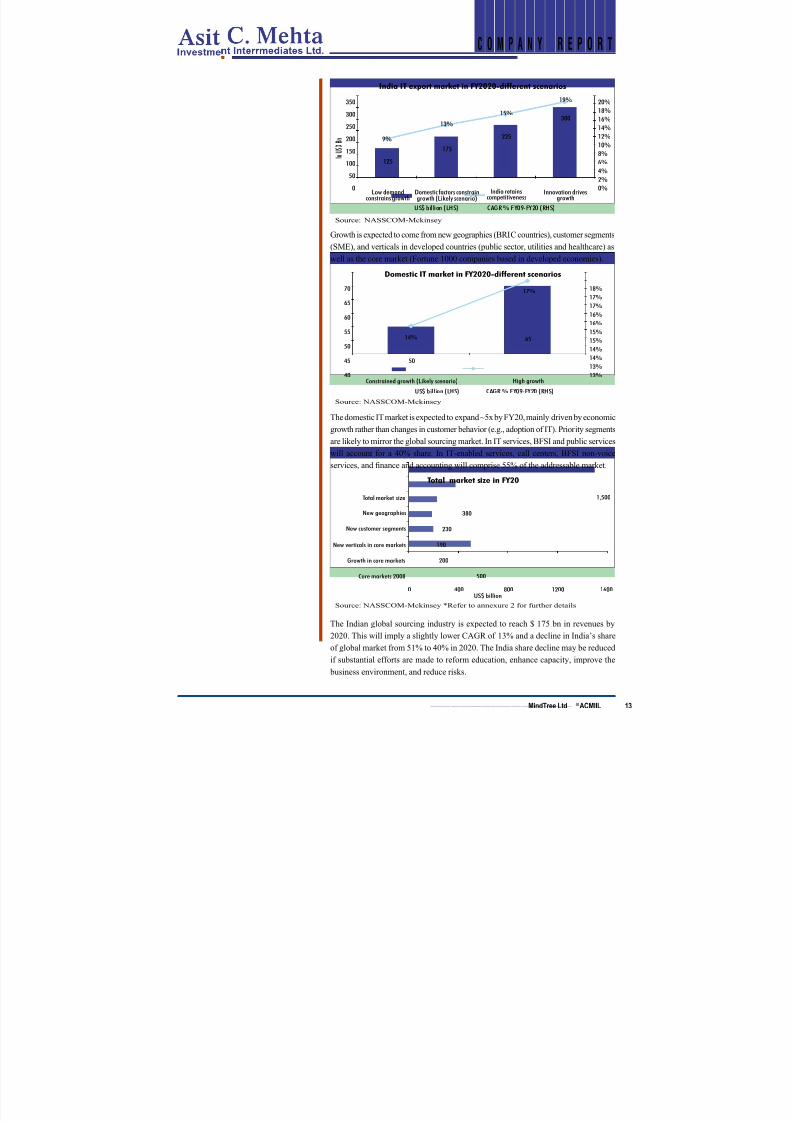
Domestic IT market in FY2020-different scenarios
40
45
50
55
60
65
70
13%
13%
14%
14%
15%
15%
16%
16%
17%
17%
18%
65
50
14%
17%
Constrained growth (Likely scenario) High growthUS$ billion (LHS) CAGR % FY09-FY20 (RHS)
Source: NASSCOM-Mckinsey
In
U S D
Bn
0%
2%
4%
6%
8%
10%
12%14%
16%
18%
20%
0
50
100
150
200
250
300
350
Low demandconstrains growth
Domestic factors constraingrowth (Likely scenario)
India retainscompetitiveness
Innovation drivesgrowth
US$ billion (LHS) CAGR % FY09-FY20 (RHS)
225
300
175
125
9%
13%
15%
19%
India IT export market in FY2020-different scenarios
Source: NASSCOM-Mckinsey
Total market size in FY20
Core markets 2008
Growth in core markets
New verticals in core markets
New customer segments
New geographies
Total market size
500
200
190
230
380
1,500
0 400 800 1200 1600US$ billion
Source: NASSCOM-Mckinsey *Refer to annexure 2 for further details
Growth is expected to come from new geographies (BRIC countries), customer segments
(SME), and verticals in developed countries (public sector, utilities and healthcare) as
well as the core market (Fortune 1000 companies based in developed economies).
The domestic IT market is expected to expand ~5x by FY20, mainly driven by economic
growth rather than changes in customer behavior (e.g., adoption of IT). Priority segments
are likely to mirror the global sourcing market. In IT services, BFSI and public services
will account for a 40% share. In IT-enabled services, call centers, BFSI non-voice
services, and nance and accounting will comprise 55% of the addressable market.
The Indian global sourcing industry is expected to reach $ 175 bn in revenues by
2020. This will imply a slightly lower CAGR of 13% and a decline in India’s shareof global market from 51% to 40% in 2020. The India share decline may be reduced
if substantial efforts are made to reform education, enhance capacity, improve the
business environment, and reduce risks.
8/7/2019 Mindtree Utilization
http://slidepdf.com/reader/full/mindtree-utilization 14/14
C O M P A N Y R E P O R T
Disclaimer:
This report is based on information that we consider reliable, but we do not represent that it is accurate or complete and it should not be relied upon such. ACMIIL or
any of its afliates or employees shall not be in any way responsible for any loss or damage that may arise to any person from any inadvertent error in the informationcontained in the report. ACMIIL and/or its afliates and/or employees may have interests/positions, nancial or otherwise in the securities mentioned in this report.
To enhance transparency we have incorporated a Disclosure of Interest Statement in this document. This should however not be treated as endorsement of the views
expressed in the report
Disclosure of Interest MindTree Ltd
1. Analyst ownership of the stock NO
2. Broking Relationship with the company covered NO
3. Investment Banking relationship with the company covered NO
4. Discretionary Portfolio Management Services NO
This document has been prepared by the Research Desk of Asit C Mehta Investment Interrmediates Ltd. and is meant for use of the recipient only and is not for
circulation. This document is not to be reported or copied or made available to others. It should not be considered as an offer to sell or a solicitation to buy any security.The information contained herein is from sources believed reliable. We do not represent that it is accurate or complete and it should not be relied upon as such. We
may from time to time have positions in and buy and sell securities referred to herein.
SEBI Regn No: BSE INB 010607233 (Cash); INF 010607233 (F&O), NSE INB 230607239 (Cash); INF 230607239 (F&O)
Notes:
Institutional Sales:
Ravindra Nath, Tel: +91 22 2858 3400
Kirti Bagri, Tel: +91 22 2858 3731
Himanshu Varia, Tel: +91 22 2858 3732
Email: [email protected]
Institutional Dealing:
Email: [email protected]