Embed Size (px)
Citation preview

© Enspire Learning and Harvard Business School
1 © Enspire Learning and Harvard Business School (revised Dec 2010)
Week 14:
MIS 3537: Internet and Supply Chains
Global Supply Chain Simulation
Review

© Enspire Learning and Harvard Business School
2 © Enspire Learning and Harvard Business School (revised Dec 2010)
End of Class Schedule
• Today: – Extra Credit Assignment Due – Global Supply Chain Simulation Due – Global SC Simulation Debrief – Summary Lecture – What did you learn? – Some Personal Insights (Free? Advice)
• April 28: Exam 2 – Similar in format to Exam 1 – Focus on content since Exam 1 – Not Open Book – 6 pages of notes allowed
© Enspire Learning and Harvard Business School
3 © Enspire Learning and Harvard Business School (revised Dec 2010)
Global SC Sim: Learning Objectives
• Real World (uncertain) like simulation of Supply Chain Decisions
• Evaluate forecasting methods and interpret dynamics of a forecasting team
• Learn trade-offs of Supply Chain flexibility, cost, benefits and profitability
• Evaluate and learn from process performance measures

© Enspire Learning and Harvard Business School
4 © Enspire Learning and Harvard Business School (revised Dec 2010)
Grading
• Thoughtful Decision Making
• Integration of Lessons Learned from the Course
• Continual learning, Improvement over 4 year span of the simulation
• Long Term Results (Profitability)
© Enspire Learning and Harvard Business School
5 © Enspire Learning and Harvard Business School (revised Dec 2010)
Global Supply Chain Management Simulation
Debrief Slides

© Enspire Learning and Harvard Business School
6 © Enspire Learning and Harvard Business School (revised Dec 2010)
What did you learn from the Global Supply Chain Simulation?
© Enspire Learning and Harvard Business School
7 © Enspire Learning and Harvard Business School (revised Dec 2010) 7
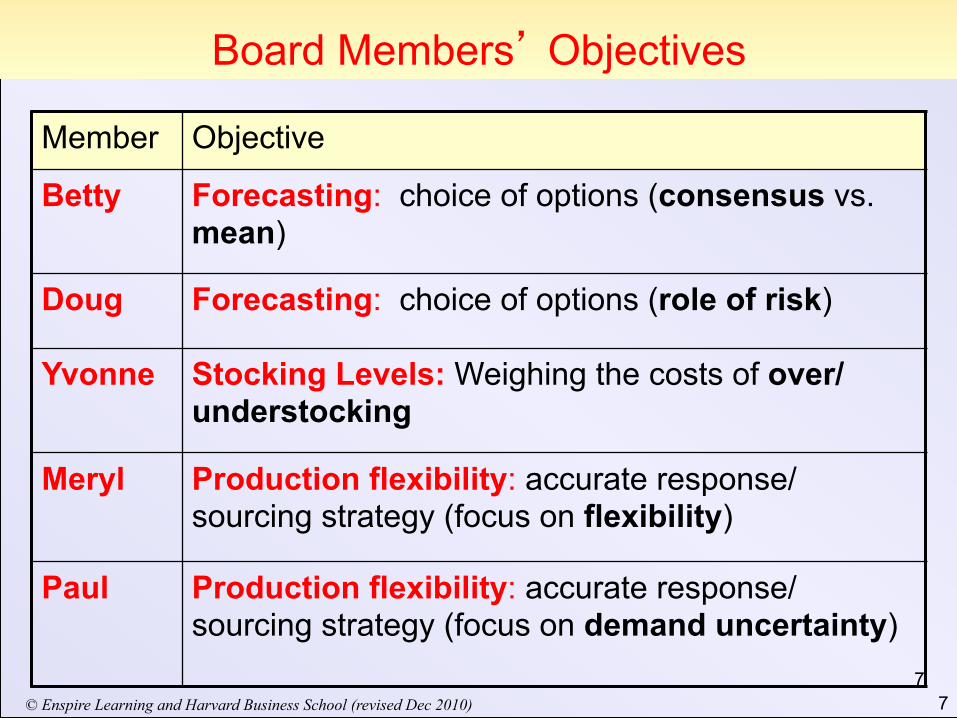
Board Members’ Objectives
Member Objective
Betty Forecasting: choice of options (consensus vs. mean)
Doug Forecasting: choice of options (role of risk)
Yvonne Stocking Levels: Weighing the costs of over/understocking
Meryl Production flexibility: accurate response/ sourcing strategy (focus on flexibility)
Paul Production flexibility: accurate response/ sourcing strategy (focus on demand uncertainty)

© Enspire Learning and Harvard Business School
8 © Enspire Learning and Harvard Business School (revised Dec 2010) 8
1. Betty?
© Enspire Learning and Harvard Business School
9 © Enspire Learning and Harvard Business School (revised Dec 2010) 9
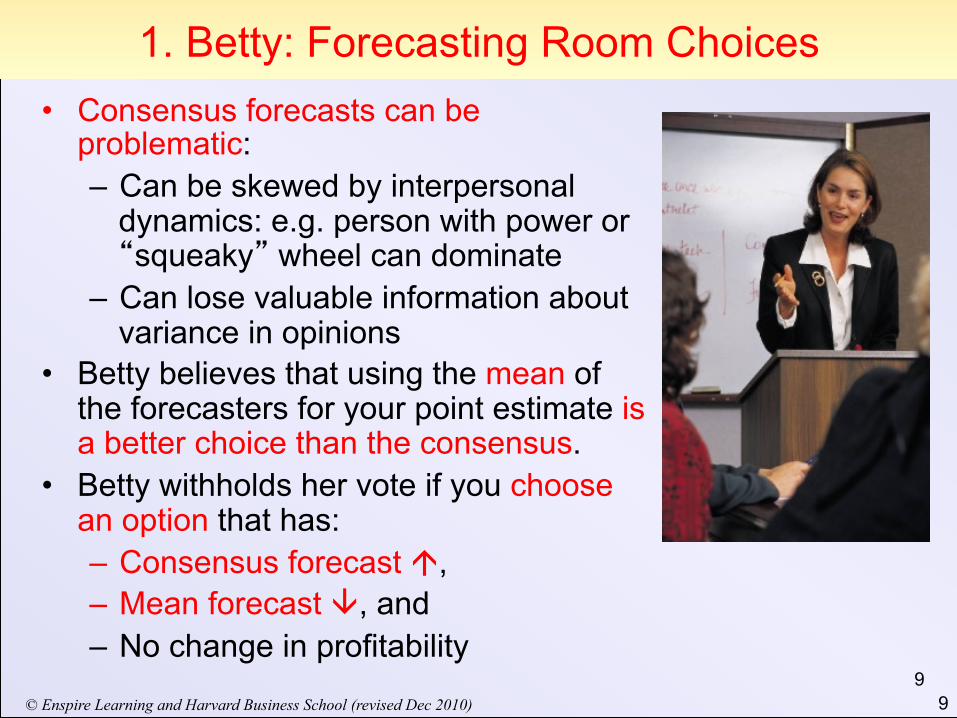
1. Betty: Forecasting Room Choices • Consensus forecasts can be
problematic: – Can be skewed by interpersonal
dynamics: e.g. person with power or “squeaky” wheel can dominate
– Can lose valuable information about variance in opinions
• Betty believes that using the mean of the forecasters for your point estimate is a better choice than the consensus.
• Betty withholds her vote if you choose an option that has: – Consensus forecast á, – Mean forecast â, and – No change in profitability

© Enspire Learning and Harvard Business School
10 © Enspire Learning and Harvard Business School (revised Dec 2010) 10
The Details: Betty’s Criteria
Betty withholds her vote if you choose a High Consensus/Low Mean option.
There were 6 such options (Model A):
Year Option Margin Cons. Mean Std Dev1 Color $0 1 -4 92 Battery $0 2 -3 83 Battery $0 2 -3 63 Anti-Theft $0 3 -2 64 Anti-Theft $0 2 -2 74 DVD $0 3 -2 6
Demand EstimatesHigh Consensus/Low Mean

© Enspire Learning and Harvard Business School
11 © Enspire Learning and Harvard Business School (revised Dec 2010) 11
2. Doug?

© Enspire Learning and Harvard Business School
12 © Enspire Learning and Harvard Business School (revised Dec 2010) 12
2. Doug: Forecasting Room Choices
• It is critical to consider forecast variance when making product design decisions and production planning decisions.
• High variance among forecasters is often a sign of demand uncertainty. Doug believes the slight increase in demand may not be worth the associated risk.
• Doug withholds his vote if you choose an option that has: – High risk (high standard deviation
among forecasters) – Low (or no) increase in demand – No change in profitability
© Enspire Learning and Harvard Business School
13 © Enspire Learning and Harvard Business School (revised Dec 2010) 13
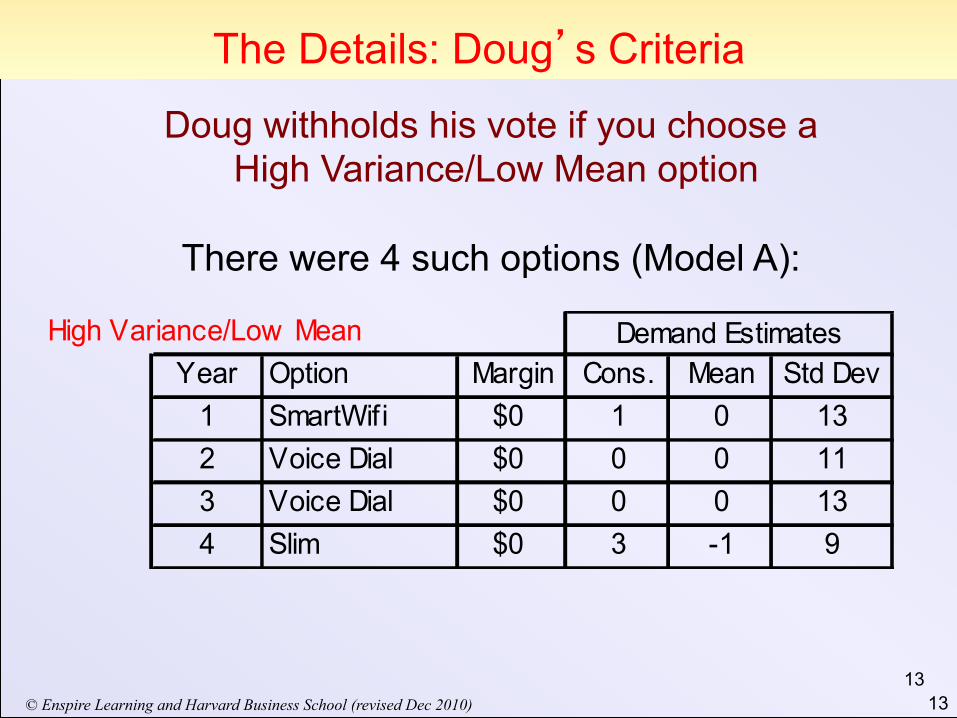
The Details: Doug’s Criteria
Doug withholds his vote if you choose a High Variance/Low Mean option
There were 4 such options (Model A):
Year Option Margin Cons. Mean Std Dev1 SmartWifi $0 1 0 132 Voice Dial $0 0 0 113 Voice Dial $0 0 0 134 Slim $0 3 -1 9
High Variance/Low Mean Demand Estimates
© Enspire Learning and Harvard Business School
14 © Enspire Learning and Harvard Business School (revised Dec 2010) 14
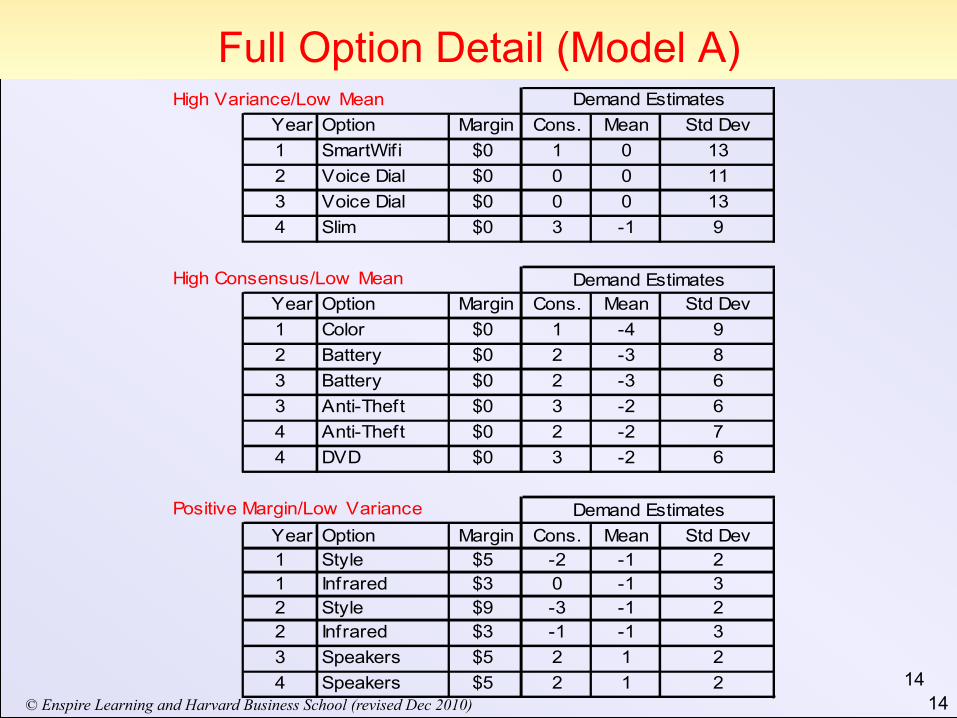
Full Option Detail (Model A) Year Option Margin Cons. Mean Std Dev1 SmartWifi $0 1 0 132 Voice Dial $0 0 0 113 Voice Dial $0 0 0 134 Slim $0 3 -1 9
Year Option Margin Cons. Mean Std Dev1 Color $0 1 -4 92 Battery $0 2 -3 83 Battery $0 2 -3 63 Anti-Theft $0 3 -2 64 Anti-Theft $0 2 -2 74 DVD $0 3 -2 6
Year Option Margin Cons. Mean Std Dev1 Style $5 -2 -1 21 Infrared $3 0 -1 32 Style $9 -3 -1 22 Infrared $3 -1 -1 33 Speakers $5 2 1 24 Speakers $5 2 1 2
Demand Estimates
Demand Estimates
Demand Estimates
High Consensus/Low Mean
High Variance/Low Mean
Positive Margin/Low Variance

© Enspire Learning and Harvard Business School
15 © Enspire Learning and Harvard Business School (revised Dec 2010) 15
3. Yvonne?

© Enspire Learning and Harvard Business School
16 © Enspire Learning and Harvard Business School (revised Dec 2010) 16
3. Yvonne: Risks of Over- and Underproduction • When planning production levels, it is
important to weigh all costs. • “Indirect costs” such as stockout and
markdown or liquidation costs are often not obvious on a P & L, but can be significant.
• “Newsvendor problem” in complex setting
• Yvonne looks at your expected ending inventory. You get her vote if you choose to:
– Overproduce when the markdown cost < stockout cost
– Underproduce when the markdown cost > stockout cost
© Enspire Learning and Harvard Business School
17 © Enspire Learning and Harvard Business School (revised Dec 2010) 17
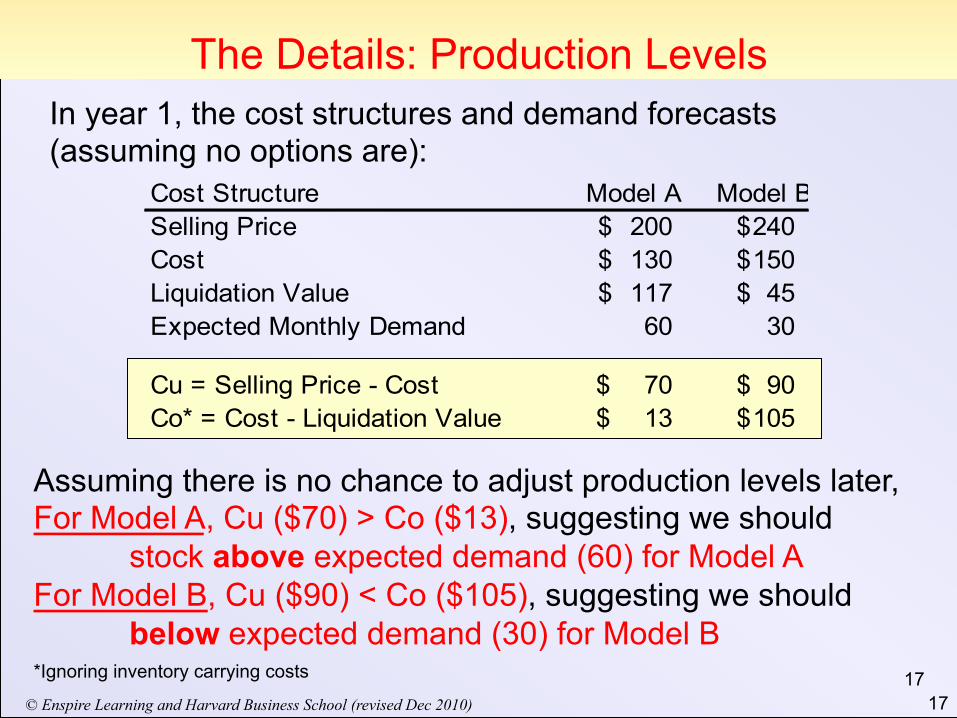
The Details: Production Levels In year 1, the cost structures and demand forecasts (assuming no options are):
Assuming there is no chance to adjust production levels later, For Model A, Cu ($70) > Co ($13), suggesting we should
stock above expected demand (60) for Model A For Model B, Cu ($90) < Co ($105), suggesting we should
below expected demand (30) for Model B
Cost Structure Model A Model BSelling Price 200$ 240$ Cost 130$ 150$ Liquidation Value 117$ 45$ Expected Monthly Demand 60 30
Cu = Selling Price - Cost 70$ 90$ Co* = Cost - Liquidation Value 13$ 105$
*Ignoring inventory carrying costs
© Enspire Learning and Harvard Business School
18 © Enspire Learning and Harvard Business School (revised Dec 2010) 18
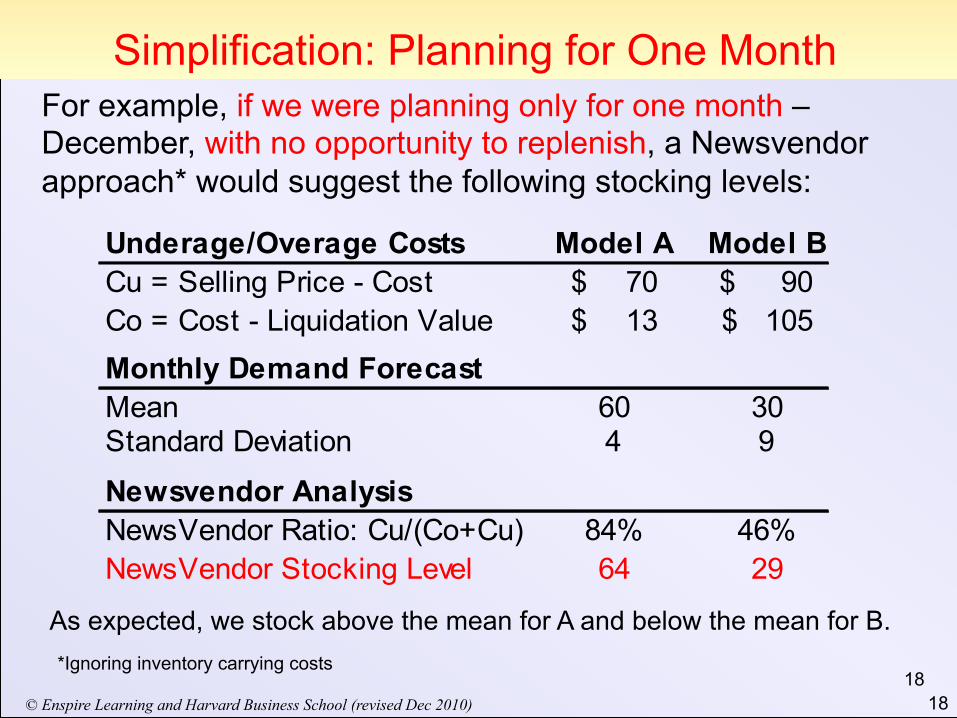
Simplification: Planning for One Month For example, if we were planning only for one month – December, with no opportunity to replenish, a Newsvendor approach* would suggest the following stocking levels:
*Ignoring inventory carrying costs
As expected, we stock above the mean for A and below the mean for B.
Underage/Overage Costs Model A Model BCu = Selling Price - Cost 70$ 90$ Co = Cost - Liquidation Value 13$ 105$ Monthly Demand ForecastMean 60 30Standard Deviation 4 9
Newsvendor AnalysisNewsVendor Ratio: Cu/(Co+Cu) 84% 46%NewsVendor Stocking Level 64 29
© Enspire Learning and Harvard Business School
19 © Enspire Learning and Harvard Business School (revised Dec 2010) 19
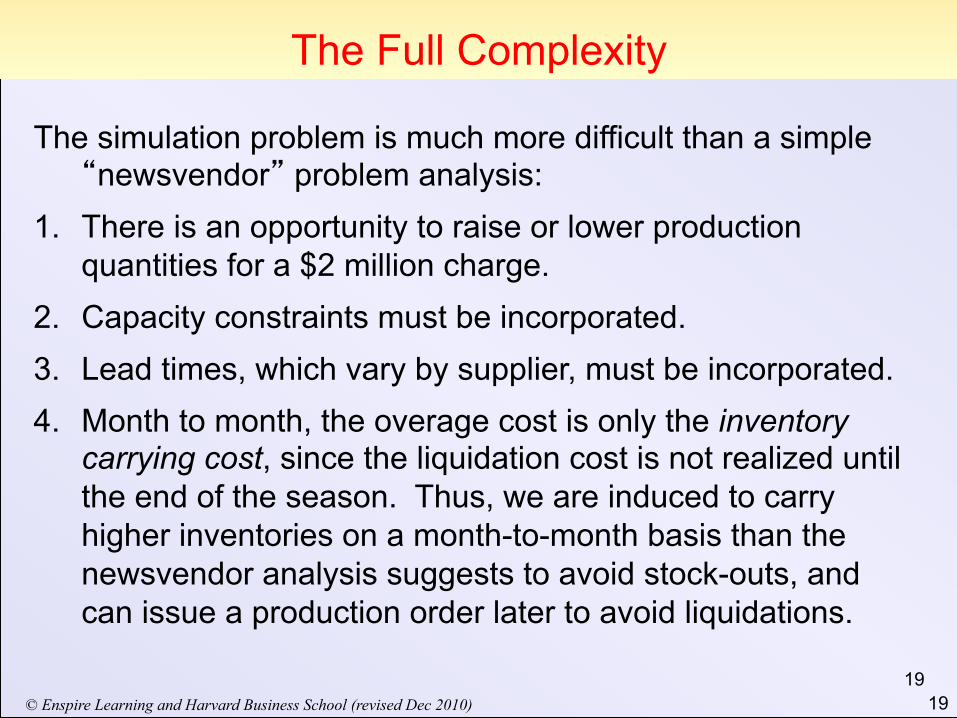
The Full Complexity
The simulation problem is much more difficult than a simple “newsvendor” problem analysis:
1. There is an opportunity to raise or lower production quantities for a $2 million charge.
2. Capacity constraints must be incorporated. 3. Lead times, which vary by supplier, must be incorporated. 4. Month to month, the overage cost is only the inventory
carrying cost, since the liquidation cost is not realized until the end of the season. Thus, we are induced to carry higher inventories on a month-to-month basis than the newsvendor analysis suggests to avoid stock-outs, and can issue a production order later to avoid liquidations.

© Enspire Learning and Harvard Business School
20 © Enspire Learning and Harvard Business School (revised Dec 2010) 20
4. Meryl?

© Enspire Learning and Harvard Business School
21 © Enspire Learning and Harvard Business School (revised Dec 2010) 21
4. Meryl: Accurate Response/Sourcing Strategy • When demand is uncertain, a hybrid
production strategy using a combination of slow, low-cost capacity and fast, more expensive capacity can increase profits by decreasing indirect costs (markdowns and stockouts) while keeping direct costs (e.g. labor costs) relatively low.
• Meryl believes it is worth investing in production flexibility and adjusting production after real demand patterns are observed
• Meryl gives her vote if: – You source some, but not all, of your
production with the more responsive reactive suppliers and
– You issue a change order after some demand is observed, but early enough to make an impact large enough to justify the cost

© Enspire Learning and Harvard Business School
22 © Enspire Learning and Harvard Business School (revised Dec 2010) 22
5. Paul?
© Enspire Learning and Harvard Business School
23 © Enspire Learning and Harvard Business School (revised Dec 2010) 23
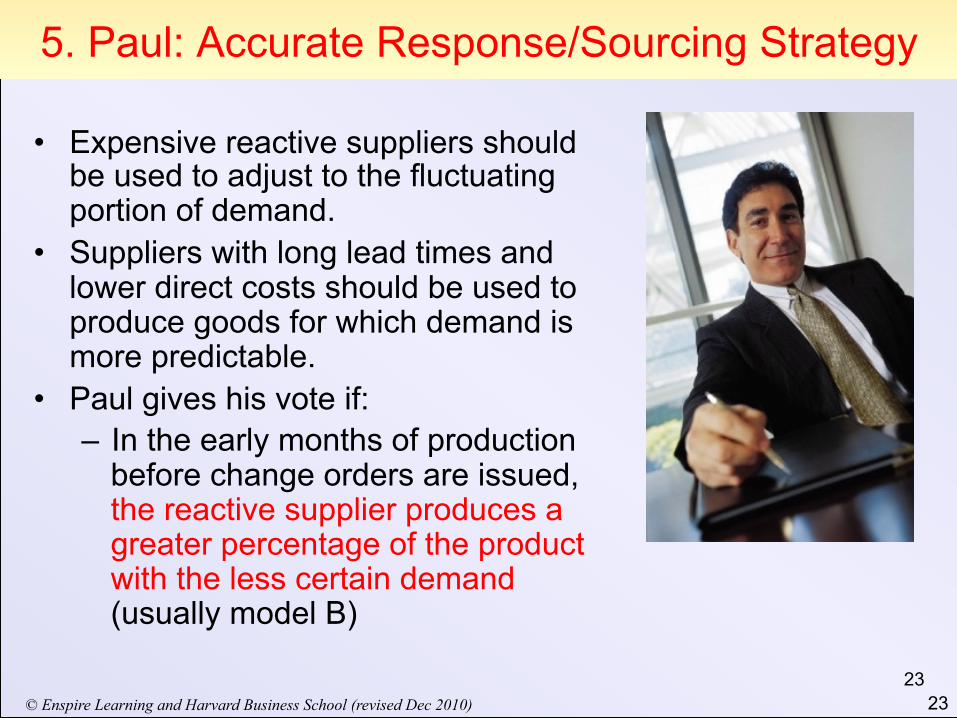
5. Paul: Accurate Response/Sourcing Strategy
• Expensive reactive suppliers should be used to adjust to the fluctuating portion of demand.
• Suppliers with long lead times and lower direct costs should be used to produce goods for which demand is more predictable.
• Paul gives his vote if: – In the early months of production
before change orders are issued, the reactive supplier produces a greater percentage of the product with the less certain demand (usually model B)

© Enspire Learning and Harvard Business School
24 © Enspire Learning and Harvard Business School (revised Dec 2010) 24
-
100
200
300
400
500
600
700
800
May Jun Jul Aug Sep Oct Nov Dec
Month
Units
M odel A Forecasts:Mean + Std. Dev.
Mean - Std. Dev.
Mean
M odel B Forecasts:Mean + Std. Dev.
Mean - Std. Dev.
Mean
Model B Actual
Model A Actual
MODELS A - Y1 B - Y1Fcst Avg 60 30 Act Avg 54 35
Act Over Fcst 89% 117%
Demand Analysis, Year 1

© Enspire Learning and Harvard Business School
25 © Enspire Learning and Harvard Business School (revised Dec 2010) 25
-
100
200
300
400
500
600
700
800
May Jun Jul Aug Sep Oct Nov Dec
Month
Units
M odel A Forecasts:Mean + Std. Dev.
Mean - Std. Dev.
Mean
M odel B Forecasts:Mean + Std. Dev.
Mean - Std. Dev.
Mean
Model B Actual
Model A Actual
MODELS A - Y2 B - Y2Fcst Avg 57 34
Actual Avg 68 24 Act Over Fcst 119% 70%
Demand Analysis, Year 2

© Enspire Learning and Harvard Business School
26 © Enspire Learning and Harvard Business School (revised Dec 2010) 26
-
100
200
300
400
500
600
700
800
May Jun Jul Aug Sep Oct Nov Dec
Month
Units
M odel A Forecasts:Mean + Std. Dev.
Mean - Std. Dev.
Mean
M odel B Forecasts:Mean + Std. Dev.
Mean - Std. Dev.
Mean
Model B Actual
Model A Actual
MODELS A - Y3 B - Y3Fcst Avg 64 28
Actual Avg 62 22 Act Over Fcst 97% 78%
Demand Analysis, Year 3
© Enspire Learning and Harvard Business School
27 © Enspire Learning and Harvard Business School (revised Dec 2010) 27
-
100
200
300
400
500
600
700
800
May Jun Jul Aug Sep Oct Nov Dec
Month
Units
M odel A Forecasts:Mean + Std. Dev.
Mean - Std. Dev.
Mean
M odel B Forecasts:Mean + Std. Dev.
Mean - Std. Dev.
Mean
Model B Actual
Model A Actual
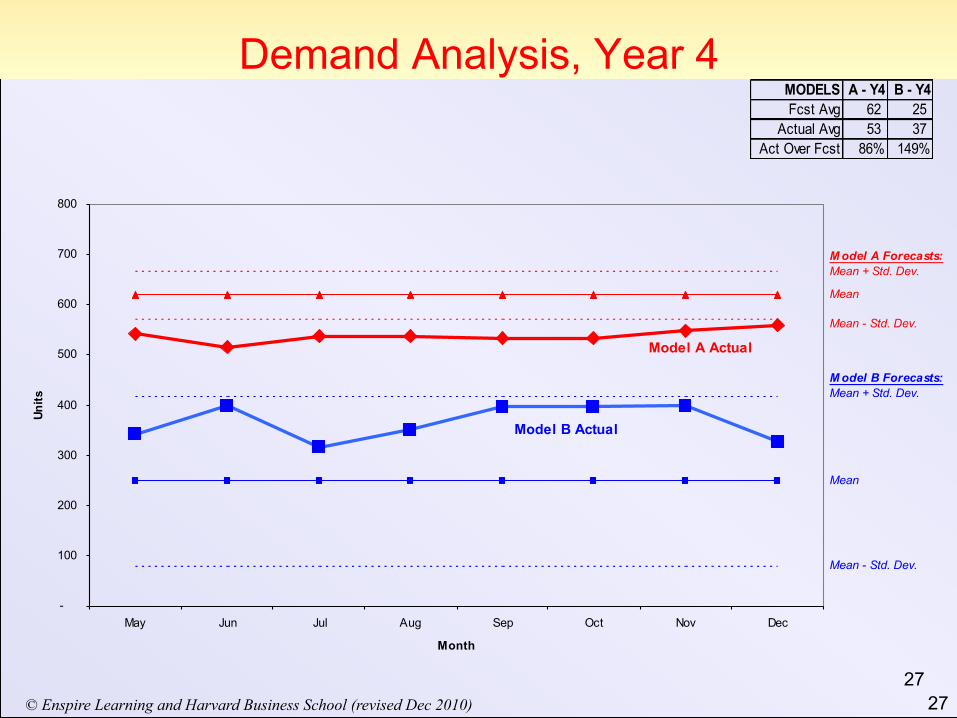
MODELS A - Y4 B - Y4Fcst Avg 62 25
Actual Avg 53 37 Act Over Fcst 86% 149%
Demand Analysis, Year 4

© Enspire Learning and Harvard Business School
28 © Enspire Learning and Harvard Business School (revised Dec 2010) 28
Other Simulation Data
(optional)

© Enspire Learning and Harvard Business School
29 © Enspire Learning and Harvard Business School (revised Dec 2010)
SFF: Student Feedback Forms
• Value v Your feedback already (after test, etc.) has
already helped me improve the class v Better class for subsequent students and to FOX MIS
in total
• Request v Have you received the e-SFF e-mail?? v Take 10-15 minutes to complete – NOW! v http://esff.temple.edu

© Enspire Learning and Harvard Business School
30 © Enspire Learning and Harvard Business School (revised Dec 2010) 30
Event Data
Year 1 Year 2 Year 3 Year 4
Jan
Feb
Mar Celldex Celldex Celldex Celldex
Apr
May
Jun
Jul Price war Senior citizens
AugHigh end gadgets
take off Cancer scare
SepMultiple phone
sales -- stockouts
OctBacklash leads to cell phone bans
NovBack-to-basics
Xmas Technophobe cults
Dec
© Enspire Learning and Harvard Business School
31 © Enspire Learning and Harvard Business School (revised Dec 2010) 31
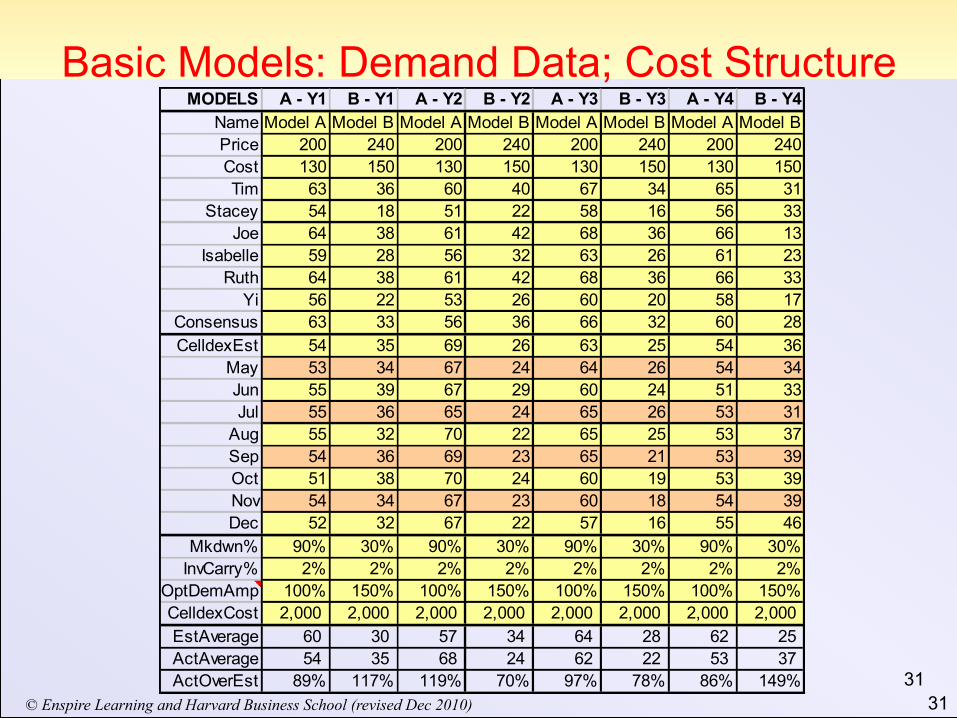
Basic Models: Demand Data; Cost Structure MODELS A - Y1 B - Y1 A - Y2 B - Y2 A - Y3 B - Y3 A - Y4 B - Y4
Name Model A Model B Model A Model B Model A Model B Model A Model BPrice 200 240 200 240 200 240 200 240Cost 130 150 130 150 130 150 130 150Tim 63 36 60 40 67 34 65 31
Stacey 54 18 51 22 58 16 56 33Joe 64 38 61 42 68 36 66 13
Isabelle 59 28 56 32 63 26 61 23Ruth 64 38 61 42 68 36 66 33
Yi 56 22 53 26 60 20 58 17Consensus 63 33 56 36 66 32 60 28CelldexEst 54 35 69 26 63 25 54 36
May 53 34 67 24 64 26 54 34Jun 55 39 67 29 60 24 51 33Jul 55 36 65 24 65 26 53 31
Aug 55 32 70 22 65 25 53 37Sep 54 36 69 23 65 21 53 39Oct 51 38 70 24 60 19 53 39Nov 54 34 67 23 60 18 54 39Dec 52 32 67 22 57 16 55 46
Mkdwn% 90% 30% 90% 30% 90% 30% 90% 30%InvCarry% 2% 2% 2% 2% 2% 2% 2% 2%
OptDemAmp 100% 150% 100% 150% 100% 150% 100% 150%CelldexCost 2,000 2,000 2,000 2,000 2,000 2,000 2,000 2,000 EstAverage 60 30 57 34 64 28 62 25 ActAverage 54 35 68 24 62 22 53 37 ActOverEst 89% 117% 119% 70% 97% 78% 86% 149%

© Enspire Learning and Harvard Business School
32 © Enspire Learning and Harvard Business School (revised Dec 2010) 32
Option Data : Demand Data; Cost Structure
OPTIONS O1 -Y1 O2-Y1 O3-Y1 O4-Y1 O1-Y2 O2-Y2 O3-Y2 O4-Y2 O1-Y3 O2-Y3 O3-Y3 O4-Y3 O1-Y4 O2-Y4 O3-Y4 O4-Y4
Name Wifi Color Stylish Infrared Stylish InfraredExtra Battery
Voice Dial
Extra Battery
Voice Dial
AntiTheft
Speakers
AntiTheft
Speakers
Super-slim
Mini-DVD
Type 3 2 1 1 1 1 2 3 2 3 2 1 2 1 3 2PriceAdj 30 15 10 5 12 5 20 15 14 11 40 15 35 12 25 50
CostAdjust 30 15 5 2 3 2 20 15 14 11 40 10 35 7 25 50Tim 10 4 -2 -3 -3 -1 7 10 -13 12 -12 -1 -10 -1 10 -12
Stacey -12 6 2 2 3 1 5 -12 4 -13 6 4 6 6 13 6Joe 13 -14 -4 -4 -4 -3 -13 -8 -9 11 -10 -2 6 -4 -12 -10
Isabelle -8 12 -3 -4 -2 -2 -11 13 8 -7 8 0 -10 0 -8 8Ruth -5 1 -3 -1 -2 -3 -8 -5 -8 -5 -7 -1 -7 -1 -5 -7
Yi 2 -9 4 4 2 2 2 2 0 2 3 6 3 6 -4 3Consens 1 1 -2 0 -3 -1 2 0 2 0 3 2 2 2 3 3
ActAverage 0 -4 -1 -1 -1 -1 -3 0 -3 0 -2 1 -2 1 0 -2EstAverage 0 0 -1 -1 -1 -1 -3 0 -3 0 -2 1 -2 1 -1 -2

© Enspire Learning and Harvard Business School
33 © Enspire Learning and Harvard Business School (revised Dec 2010) 33
Supplier Data
FarFarAway FarAway Pretty Close Ve-Ri-FasSet-up Cost 1,000,000$ 2,000,000$ 1,000,000$ 2,000,000$
Incremental Unit Cost - - 10$ 10$ Leadtime (months) 4 3 0 0Monthly Capacity 60,000 60,000 35,000 40,000
Min Prod'n Level 60% 60% 60% 60%Prod'n Change Cost 2,000 2,000 2,000 2,000