Embed Size (px)
Citation preview

C 2015/8 May 2014
QR
www.fao.org.
A
6132015
20122013
Boyd Haight
+39 (06) 5705 5324

C 2015/8
6–132015
__________________________
20122013
2014


5 C 2015/8 Programme Implementation Report 2012-13
7
11 14
16 201516 18 19 21 24
24 26
30
34
39
43
47
51
55
59
63
66
70

C 2015/8 Programme Implementation Report 2012-13 6
75 75
80 85
89
93
98 101 107
107 107 111 121 –127 –131 –133 –135
135 137
138 139
1141 2142 3146 4 5
7 C 2015/8 Programme Implementation Report 2012-13
20122013
2011
–
201420152012
2013
6.8
2013
20142015
20122013

C 2015/8 Programme Implementation Report 2012-13 8
2012
202012
20142015
20 2012

9 C 2015/8 Programme Implementation Report 2012-13
2013
2025
2013
20252006
1990 2015
–
–
2015

C 2015/8 Programme Implementation Report 2012-13 10

11 C 2015/8 Programme Implementation Report 2012-13
1
2
2015
2013
3
4

C 2015/8 Programme Implementation Report 2012-13 12
5 20102013
5420122013
6 20122013
7
8
9 80 174
21 12 137
20102011
10

13 C 2015/8 Programme Implementation Report 2012-13
11 201220132.5258920102011211
99 1 005.6
12 71.6
13
135
14 2013
15 2012
20072013
:
:
20122013 .
:
20122013

C 2015/8 Programme Implementation Report 2012-13 14
16 20122013
17 2010201320121
18 20102013 2009
19 20122013
1 2 3
4 5
1 PC 113/5-FC 148/9.

15 C 2015/8 Programme Implementation Report 2012-13
120102013

C 2015/8 Programme Implementation Report 2012-13 16
2015
20 2015، 2015100
11201320
201420152015 21
2015
22
23
2012– 2013 4 2013
24 2013
15

17 C 2015/8 Programme Implementation Report 2012-13
25
20152013
2015.
26 1414
27
20152013
–
28 2015mdg/-2015-www.fao.org/post(2013
2015
29
30 2012

C 2015/8 Programme Implementation Report 2012-13 18
31
20
32
33
11 64014017

19 C 2015/8 Programme Implementation Report 2012-13
34 2013
35
2012
36 201323
2013
37 2004

C 2015/8 Programme Implementation Report 2012-13 20
20252011
38 2013 20252013 2025 2014

21 C 2015/8 Programme Implementation Report 2012-13
39 20122013
40
41
42
43 44
45
46
201320122013

C 2015/8 Programme Implementation Report 2012-13 22
47 20122013
10.4
31 48
49
50 20122013
71.6 51 135243
52 47.3
27.220.1

23 C 2015/8 Programme Implementation Report 2012-13
53
1234

C 2015/8 Programme Implementation Report 2012-13 24
54 20122013 11 20102013
55
4
56 2012201380 174
417620102011
57 21174
131776
71
162857

25 C 2015/8 Programme Implementation Report 2012-13
1354
58
120122013
15141 93%
99 100%
17152 88%
15141 93%
17134 76%
12111 92%
98 1 89%
16151 94%
972 78%
761 86%
75 2 71%
28167 5 57%
1371 5 54%
17414021 13 80%

C 2015/8 Programme Implementation Report 2012-13 26
71
59
59 92050
6036 2035
20
01
60
451821
61 2011
2012201321
02
27 C 2015/8 Programme Implementation Report 2012-13
62 59
60 102009
63
64
65 71
03
66
67 8
14620111542013

C 2015/8 Programme Implementation Report 2012-13 28
675520102011
68 2013
69
04–
70
2011
71 201161311933
17
73
72
73

29 C 2015/8 Programme Implementation Report 2012-13
5.2
87 4451 20
2023

C 2015/8 Programme Implementation Report 2012-13 30
FEEDIPEDIA
74 7043
20
75
1
76
125 30
5012
77 2012 FEEDIPEDIA

31 C 2015/8 Programme Implementation Report 2012-13
20130002400 1000 25
78 15
2
79 2
. 110
80 H7N9 1H5N في
801997
650
2

C 2015/8 Programme Implementation Report 2012-13 32
1.78.5 2004 2.5
3
81
33
50
82
2012
83 2007
17
4
84 201344
12World Livestock 2013: Changing Disease Landscapes
70

33 C 2015/8 Programme Implementation Report 2012-13

C 2015/8 Programme Implementation Report 2012-13 34
20112012 4.2
6152953.5
85 17
12
3050
86
01
87
88

35 C 2015/8 Programme Implementation Report 2012-13
2009
89 20122013 20 2012
2015
90
4001
20
91 2012
02
92
93 20122013

C 2015/8 Programme Implementation Report 2012-13 36
94
2.42011–
2009
2013
300

37 C 2015/8 Programme Implementation Report 2012-13
03–
95
2011201220112012
75
96
32
04
97
30
20 40
98

C 2015/8 Programme Implementation Report 2012-13 38
05
99
100
101
102 90
06
10312
35420112012
4.2 6.1 52.953.5

39 C 2015/8 Programme Implementation Report 2012-13
49
52
104
105
01
106
107 186 49 6927
My Codex

C 2015/8 Programme Implementation Report 2012-13 40
02
108
109
03
110
111

41 C 2015/8 Programme Implementation Report 2012-13
112 20
20
113
04
114
115 30 11
116

C 2015/8 Programme Implementation Report 2012-13 42
2012 20
25
2013
2014

43 C 2015/8 Programme Implementation Report 2012-13
60
117 100
20
118
01
119
120201120122013
121 20122013

C 2015/8 Programme Implementation Report 2012-13 44
2014
02
122 129
40201020112510
5
123 20 500
21
03
124 20122013
125 53 20112012
2012

45 C 2015/8 Programme Implementation Report 2012-13
0001
04
126 3525208010
15
127
50
128
GlobAllomeTree

C 2015/8 Programme Implementation Report 2012-13 46
05
129 10
28
06
130
6017
131
2014
132

47 C 2015/8 Programme Implementation Report 2012-13
133
134
01
135
2015

C 2015/8 Programme Implementation Report 2012-13 48
136
02
137
AQUASTAT)
138
34
03
139
04
3 MASSCOTE. 4 AquaCrop.

49 C 2015/8 Programme Implementation Report 2012-13
140 2012
000 100
20
05
141

C 2015/8 Programme Implementation Report 2012-13 50
142
68
.
06
143
2012
000 2100
144 26

51 C 2015/8 Programme Implementation Report 2012-13
3025
145
2013
146
01
147

C 2015/8 Programme Implementation Report 2012-13 52
148 3025
2012
34
25
02
12نتيجة -149
150 20122013
20122013000 25
80

53 C 2015/8 Programme Implementation Report 2012-13
2013
20142015
03
151 11 13
20
152
AgVance Africa

C 2015/8 Programme Implementation Report 2012-13 54
04
153
154 2011
2012

55 C 2015/8 Programme Implementation Report 2012-13
155 –30
156
01
157
158

C 2015/8 Programme Implementation Report 2012-13 56
02
159 12
160
1612015
03
162
163

57 C 2015/8 Programme Implementation Report 2012-13
164 2014
2013
7003
04
165
52
2010151
28
166
167
1
168

C 2015/8 Programme Implementation Report 2012-13 58
ADePT
05
169 450
4.67 41
170 ''20112012
100 182
171
16
2025

59 C 2015/8 Programme Implementation Report 2012-13
172 2012357157
102012186 5
173
01
174
2013 3735 24
5 .html2012_sigma_natcat_20130327http://www.swissre.com/media/news_releases/nr_

C 2015/8 Programme Implementation Report 2012-13 60
1752013Resilient Livelihoods: Disaster Risk Reduction for Food and Nutrition Security
02
176 45505
2014
177 100

61 C 2015/8 Programme Implementation Report 2012-13
2013
722013000 44
80084
03
178
179 20092013 125 41 250
180 2012
2013

C 2015/8 Programme Implementation Report 2012-13 62
181
182
183

63 C 2015/8 Programme Implementation Report 2012-13
14
184 6 720102011
2012
01
185 8 Women Watch
14
2013
14
6 http://www.fao.org/docrep/meeting/023/mc027E.pdf 7 PC 108/5 و PC 108/5 Sup.1 و PC 114/5 و PC 114/5 Sup.1 8

C 2015/8 Programme Implementation Report 2012-13 64
Women Watch
02
186
2013
187 28
188
189 20
37
190 1100

65 C 2015/8 Programme Implementation Report 2012-13
03
191 152010
192 2012
04
193
194
2014

C 2015/8 Programme Implementation Report 2012-13 66
195
01–
196 2012300
99
197 24

67 C 2015/8 Programme Implementation Report 2012-13
198
2012
199
120
200
02
201

C 2015/8 Programme Implementation Report 2012-13 68
25
03–
202 4.20.52012201368
86
20122013 91 802471
88
203
204 621

69 C 2015/8 Programme Implementation Report 2012-13
317
230
205 201238 112 240
206

C 2015/8 Programme Implementation Report 2012-13 70
42
207
01
208
209
210 2012

71 C 2015/8 Programme Implementation Report 2012-13
02
211
212
213
214 my.fao.org
700 1
03
215

C 2015/8 Programme Implementation Report 2012-13 72
216 42
RabobankEataly
217
218
219
4.67
20122013

73 C 2015/8 Programme Implementation Report 2012-13
220
2013
04
221
222 2013 232
2
223 20122013
224 56

C 2015/8 Programme Implementation Report 2012-13 74
225 59 18
31
144 162
46
20122013.9
9 FC 148/16 والوثيقة FC 154/13.

75 C 2015/8 Programme Implementation Report 2012-13
–
226- 20122013123
4
227
73
42485425
20
228 32
20112013
229
19 10

C 2015/8 Programme Implementation Report 2012-13 76
230
231
2014
232 32
233
234 71513
235 100
500 227275 1

77 C 2015/8 Programme Implementation Report 2012-13
236
237
36
70 75
238 18
239
20142015
240

C 2015/8 Programme Implementation Report 2012-13 78
241
242
243 .
244 250
2014

79 C 2015/8 Programme Implementation Report 2012-13
245 2014
50
246 520142015
247 20142015

C 2015/8 Programme Implementation Report 2012-13 80
248
249 20122013123
4 5
250
251 20
252
2012

81 C 2015/8 Programme Implementation Report 2012-13
253
254
255 80 90
256
257 1 2
34
.

C 2015/8 Programme Implementation Report 2012-13 82
258
259
260
261
H7N9
262 1
2

83 C 2015/8 Programme Implementation Report 2012-13
263 90140
264 2013
20142015
256 12
266
267

C 2015/8 Programme Implementation Report 2012-13 84
268 750
269
95
270
271
272
273 2014
.

85 C 2015/8 Programme Implementation Report 2012-13
2742012201312
34 5
6
275
2013
276

C 2015/8 Programme Implementation Report 2012-13 86
277 19
278
279
20122013200

87 C 2015/8 Programme Implementation Report 2012-13
280 14
281
282
1 2 3 4
5 6
283

C 2015/8 Programme Implementation Report 2012-13 88
284
285
286

89 C 2015/8 Programme Implementation Report 2012-13
287 201220131 2 3 4
20142025
288
289 17243301214
290

C 2015/8 Programme Implementation Report 2012-13 90
291 2012
292
293
20122021 7860
294
21 50
2017

91 C 2015/8 Programme Implementation Report 2012-13
295 Huanglongbing
10
2025
296 2005
2025 2013
297
298 12

C 2015/8 Programme Implementation Report 2012-13 92
299 20142015
300
301
302

93 C 2015/8 Programme Implementation Report 2012-13
303
304
305 201220131 2
3 4 5
306
307

C 2015/8 Programme Implementation Report 2012-13 94
308
309
310
4080
000117 000
311
312

95 C 2015/8 Programme Implementation Report 2012-13
313
314
20122013
315

C 2015/8 Programme Implementation Report 2012-13 96
316
317
Tuta Absoluta
318
319 502050
320 2013

97 C 2015/8 Programme Implementation Report 2012-13
15
321
20132014

C 2015/8 Programme Implementation Report 2012-13 98
322 201213
2012 1 0 10.4
31
323- 201213
324
103 149 46
325
10 CL 144/REP 25 ؛ CL 144/3.

99 C 2015/8 Programme Implementation Report 2012-13
326
327 201213
328
23
60:401 1
329
330 شأن
11 2013

C 2015/8 Programme Implementation Report 2012-13 100
331 201213
332
20122013
333
334 2013
335 201213

101 C 2015/8 Programme Implementation Report 2012-13
336 12
337
338
339 1
2
340 2013
12 31.
C 2015/8 Programme Implementation Report 2012-13 102
341
342
343 2010
2013
344
2012

103 C 2015/8 Programme Implementation Report 2012-13
345
346 438 119.9 426117.820102011
220122013
78.1 236 0.331 65
10.1 27 0376 9
9.5 25 0.378 8
2.7 6 0.443 2
19.5 144 0.135 16
119.9 438 0.274 100 98
80
34720122013
3
46.7 153 39
10.0 39 8
29.1 110 24
11.7 46 10
2.7 6 2
19.7 84 17
119.9 438 100
348 2012
2013
C 2015/8 Programme Implementation Report 2012-13 104
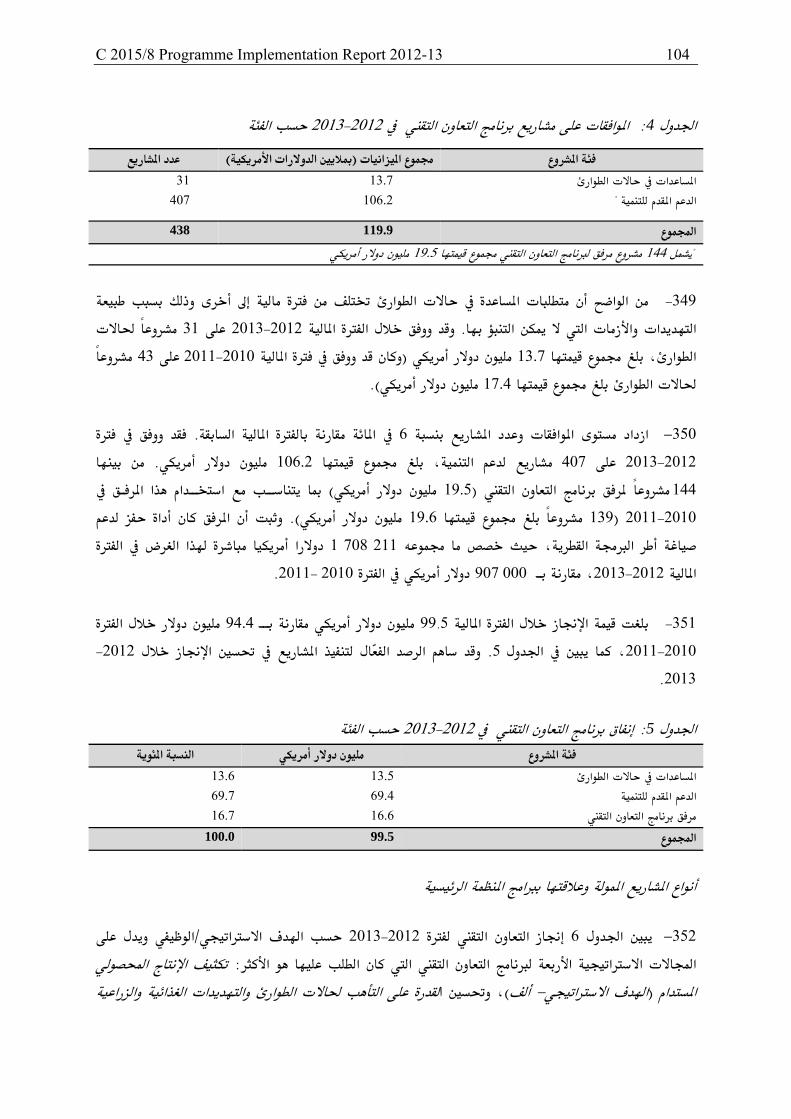
420122013
13.7 31
106.2 407
119.9 438 14419.5
349
201220133113.720102011 43
17.4
350 6 20122013 407 106.2 144 19.5
2010201113919.6 2117081 2012201300090720102011
351 99594.420102011 5 20122013
520122013
13.5 13.6
69.4 69.7
16.6 16.7
99.5 100.0
352 6 20122013

105 C 2015/8 Programme Implementation Report 2012-13
620122013
2012-2013
18.1 18.2
9.3 9.4
7.8 7.8
2.3 2.3
9.0 9.0
8.1 8.1
5.1 5.1
11.0 11.1
14.5 14.6
0.3 0.3
2.0 2.0
12.0 12.1
99.5 100.0

C 2015/8 Programme Implementation Report 2012-13 106
353 2010
2013 2013
20131 3
354
20142015
13 http://www.fao.org/docrep/meeting/029/mi537e.pdf.

107 C 2015/8 Programme Implementation Report 2012-13
355 20122013
.
.
356
357

C 2015/8 Programme Implementation Report 2012-13 108
1
358
359 2013
300
2013
360
361
20122.8 2
362

109 C 2015/8 Programme Implementation Report 2012-13
363
3
364
3
365 2013
366
367 2013
2014
368
6120132012learning@fao
C 2015/8 Programme Implementation Report 2012-13 110

111 C 2015/8 Programme Implementation Report 2012-13
258920122013
9900561
369
479220122013258920102011
370 7
371- 6.81
74.2
20102011201220138
372- 2645
16710

C 2015/8 Programme Implementation Report 2012-13 112
7
20102011
20122013
201220131 005.6
991.8 996.0 4.2 0%
38.1 35.8 (2.3) (%6)
109.3 112.2 2.9 %3
16.5 18.2 1.7 %10
(18.3) (10.7 7.6 (%41)
(12.6) (20.2) (7.6) %60
(20.4) (20.0) 0.4 (%2)
1,104.4 1,111.2 6.8 %1
887.6 580.9 (306.7) (%35)
744.5 786.7 42.2 %6
2,736.5 2,478.8 (257.7) 9% *201220138.720102011
52011 **
. *****211
1 4
14 312007
2008 20122013
211

113 C 2015/8 Programme Implementation Report 2012-13
820122013 20102011 20122013
54.2 65.5 11.3
(65.5) (76.8) (11.3)
- 4.1 4.1
(6.1) - 6.1
- - -
(0.8) (3.4) (2.6)
(18.3) (10.7) 7.6
–
373
20122013
374 9 20122013
201220131 52011920121 6
375
20122013
991 005.6 9.6201420157/2013
15 C 2011/3.
16 CL 145/3.

C 2015/8 Programme Implementation Report 2012-13 114
376 45 2013201220131 7
9
377 1 8 127 9
17 151/7 182012–
2013.

115 C 2015/8 Programme Implementation Report 2012-13
920122013
60,19159,607584262,504 229,888 32,616 322,695289,495 33,200
37,14535,6761,469 131,214 149,333 (18,119)168,359185,009 (16,650)
67,61463,822 3,792 86,092 78,641 7,451 153,706142,463 11,243
33,02231,136 1,886 17,576 21,295 (3,719)50,59852,431 (1,833)
51,41049,228 2,182 57,254 77,293 (20,039)108,664126,521 (17,857)
72,25069,391 2,859 112,004 169,718 (57,714)184,254239,109 (54,855)
48,22347,920303 34,712 62,709 (27,997)82,935110,629 (27,694)
95,19692,186 3,010 116,047 180,794 (64,747)211,243272,980 (61,737)
8,1778,056121401,675 337,299 64,376 409,852345,355 64,497
21,75619,947 1,809 9,972 13,284 (3,312)31,72833,231 (1,503)
39,88541,281(1,396)81,896 74,829 7,067 121,781116,110 5,671
207,784207,04274233,687 63,229 (29,542)241,471270,271 (28,800)
95,111103,445(8,334)47,128 59,433 (12,305)142,239162,878 (20,639)
116,027116,0270 0 0 0 116,027116,027 0
6000 6000 0 0 6000 600
26,43926,4390 0 0 0 26,43926,439 0
24,80924,8090 1,139 2,579(1,440)25,94827,388 (1,440)
1,005,639996,011 9,628 1,392,898 1,520,323(127,425)2,398,5392,516,336 (117,797)
1213201220138.720102011

C 2015/8 Programme Implementation Report 2012-13 116
52011

117 C 2015/8 Programme Implementation Report 2012-13
378 652012-2013 )2(32010201110122010–
201120122013
220122013
379 320122013
380 20122013464201020114246
493516
المقر الرئيسي 65%
ممثليات منظمة األغذية والزراعة
12%
مكاتب التنسيق واالتصال
1%
المكاتب اإلقليمية9%
-المكاتب اإلقليميةالفرعية4%
البرنامج العادي برامج ميدانية
8%

C 2015/8 Programme Implementation Report 2012-2013 118
3 مصروفات : 201213
381 10، 1 450.1 256.7
20102011211مقارنة 2008-2009 2013-2012، زادت المصروفات من خارج الميزانية في الفترة
223.2
البرنامج العادي 42%
برنامج (البرنامج العادي برنامج / التعاون التقني
)األمن الغذائي4%
مشاريع الطوارئ الممولة الميزانيةمن خارج
49%
المشاريع الميدانية الممولة الميزانية من خارج
)باستثناء حاالت الطوارئ(35%
الميزانية الدعم من خارج للبرنامج العادي
16%
الميزانيةخارج من 54%

119 C 2015/8 Programme Implementation Report 2012-2013
10 20082009 20102011 20122013
8.2 3.34.7
- 9.84.9
8.2 13.19.6
319.9 401.6388.8
14.0 15.010.9
133.7 94.3108.3
9.1 14.516.3
0.4 211.20.0
16.3 71.466.3
13.7 1510.1
3.8 3.44.1
37.7 63.389.4
548.2 889.7694.2
– 558.7 673.1607.2
- 30.431.3
- 6.67.3
- 5.59.7
558.7 715.6655.6
1,106.9 1,605.31,349.8
1,226.9 1,706.81,359.4
109.8 72.478.6
- 15.812.1
2.0 0.2
111.8 88.490.7
1,218.7 1,703.51,450.1
* **20102011
20082009

C 2015/8 Programme Implementation Report 2012-2013 120
382 11 201220132012201326108795002
15751
11: 2008-09 2010-11 2012-13
189.7 414.2 195.4
0.4 211.2 5.2
116.3 135.7 197.6
81.4 160.0 116.3
64.7 142.7 76.0
63.4 86.6 72.3
56.6 96.0 65.1
24.2 31.5 60.1
24.8 46.8 53.8
57.1 58.9 42.7
10.1 21.7 39.7
28.9 32.5 37.4
7.2 27.4 28.5
19.4 25.4 27.0
28.7 20.3 22.5
56.9 26.9 22.2
12.3 13.5 19.6
25.9 27.8 14.4
12.2 18.3 15.5
33.4 20.1 12.7
10.2 22.8 9.7
20 923.4 1,402.10 1,128.6
138.3 162.3 161.9
41.9 42.8 19.8
11.6 11.4 49.0
191.8 216.5 230.8
1,115.20 1,618.60 1,359.4
*

121 C 2015/8 Programme Implementation Report 2012-2013
383 3
1 9
2 0 1
2
.
384 .
:
385 20102011201220131048
9946169
19 (TCP)(SPFS) 20 (GCP)(UTF)(UNDP)

C 2015/8 Programme Implementation Report 2012-2013 122
12 20102011
20122013
1 706.8 1 450.1
104.8 99.4
6.1% 6.9%
.
386 994
.276 20122013297 20102011 .
278 201220132832010201127520082009
387 282012
20131322620102011 38 35
2234
39

123 C 2015/8 Programme Implementation Report 2012-2013
1320122013
(%)
(%)
(%)
(%)
27 41 42 34
28 44 35 34
27 54 33 32
16 30 26 21
15 33 41 23
29 35 43 33
22 36 52 26
22 33 34 27
31 52 47 33
20 44 37 30
26 61 34 39
14 0 14
21 24 27 24
1 3 7 4
22 38 35 28
388
2012201367445
201020112 1 33 201220135520102011
21 C 2013/817

C 2015/8 Programme Implementation Report 2012-2013 124
420122013
389 535
3020122013
520122013
منظمة الممثليات الفاو22%
المقر الرئيسي33%
المكاتب اإلقليمية28%
المكاتب اإلقليمية الفرعية17%
0%
10%
20%
30%
40%
50%
60%
70%
Africa Asia and thePacific
Europe andCentral Asia
Latin Americaand the
Caribbean
Near East andNorth Africa
Total
FAORs Regional Office Sub‐regional Office
أوروبا وآسياالوسطىط ل
آسيا والمحيط الھادي
أمريكا الالتينية أفريقيا والبحر الكاريبي
الشرق األدنى وشمال أفريقيا
المجموع
المنظمةالمكاتب اإلقليمية المكاتب اإلقليمية الفرعية ممثليات

125 C 2015/8 Programme Implementation Report 2012-2013
390 2 2
391 201220131394238201020111499
20122013 16 20082009
14
20082009
20102011
20122013
144.1 163.2 139.4
106.9 137.8 125.4
37.2 25.4 14.0
%74.2 %84.4 %90.0
392 15
2010
20119616
22
FC 93/4

C 2015/8 Programme Implementation Report 2012-2013 126
15
20082009
20102011
20122013
1 226.9 1 706.8 1 450.1
29.1 32.0 24.6
115.0 131.2 114.8
144.1163.2 139.4
%11.8%9.6%9.6
.
393 23
20122013
201220132013
10.1 6.3 1.91.9
23 67

127 C 2015/8 Programme Implementation Report 2012-2013
1.7 2012
2013
2013
t
394
2012201317
20122013
395
16
20102011
20122013
280 295 %5 564 671 %19 804 735 %9-
1,648 1,701 %3
396 5 19
20122013 20102011 916
C 2015/8 Programme Implementation Report 2012-2013 128
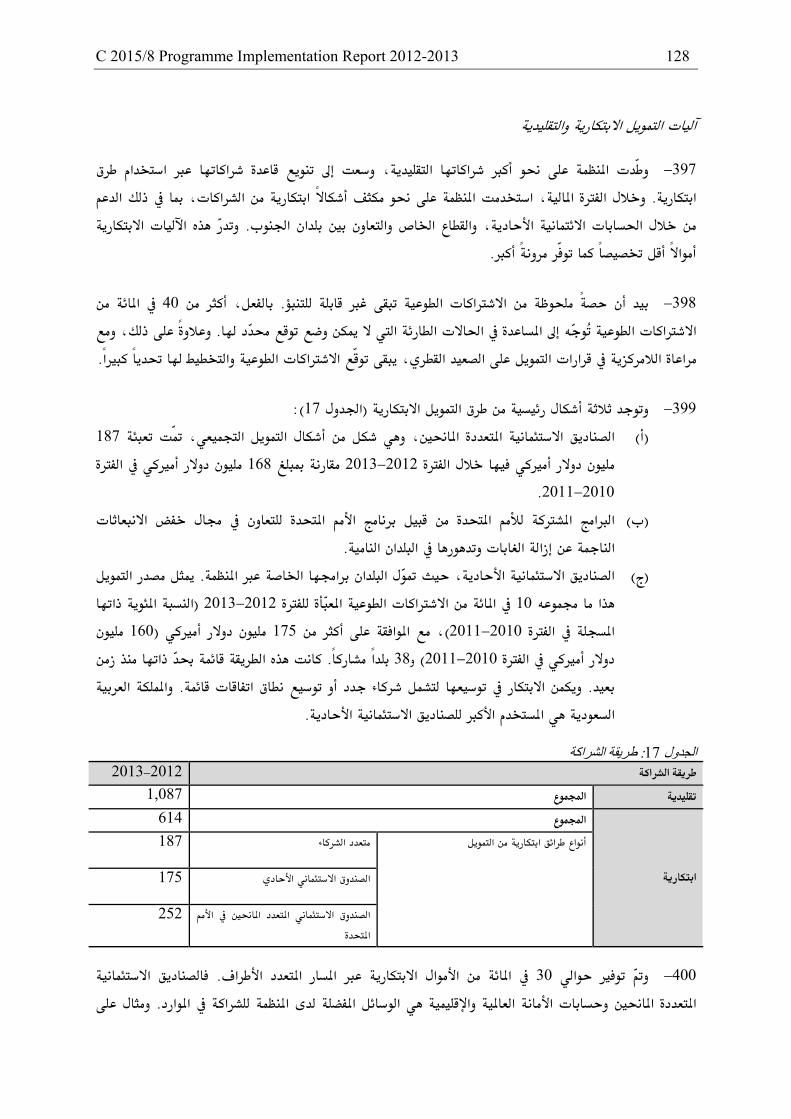
397
398 40
399 17
18720122013168
20102011
1020122013 20102011175160
2010201138
: طريقة الشراكة17الجدول 20122013
1,087
614
187
175
252
400 30

129 C 2015/8 Programme Implementation Report 2012-2013
2012 2013
2013
401 185089
402 1900
403

C 2015/8 Programme Implementation Report 2012-2013 130
18201020132013
2010 2011 2010-20112012 2013 2012-
2013 116 121 237 151 176 327 110 67 176 86 59 145 24 14 37 41 82 124
2 454 39 94 47 36 83
47 38 85 20 48 68 7 1 9 58 7 65
32 38 70 34 25 59 13 1 14 20 29 49
18 31 50 11 36 47 21 7 28 10 32 43 27 20 46 12 22 33 33 23 55 22 11 33 19 16 35 12 15 27 1 6 8 7 17 24 10 26 37 20 4 24 9 3 12 16 8 23 74 22 95 12 8 20
4 9 13 5 14 19 75 93 168 75 112 188
24 1 25 0 1 1
37 78 114 46 62 108 105 168 273 113 78 191 835822 1,657818 882 1,701
30
24

131 C 2015/8 Programme Implementation Report 2012-2013
404102003.2012–2013
405 201213
406
201220122013100
407 201213
12014
408

C 2015/8 Programme Implementation Report 2012-2013 132
409 Windows 7Windows XP
410 2014
2014
411 Intranet(
PartnerNet 210) بنجاح، وأنشئ ما مجموعه100FAO.org2013
FAO.org
412
201213
77,00020131700122

133 C 2015/8 Programme Implementation Report 2012-2013
413 52005
414
415 2012201333
416
417 87
418 20201219222013
17132012201315
12

C 2015/8 Programme Implementation Report 2012-2013 134
419
420 –
421
422
20122013

135 C 2015/8 Programme Implementation Report 2012-2013
423
20122013716
4920102011.
135
424 52011 201220131 005.6 34.5 26.5 20122013
61 2012201371.6 49 2010201148
2008-200935.1
425 20122013 515 20.1
42624.3 20122013 2011 201220132 52012201220132 6 135 24.3
2.1
.CL 143/3 25
. CL 144/3 26

C 2015/8 Programme Implementation Report 2012-2013 136
427 7
428 6.5
429 4.6
430 4.3
431 2.8
0.81
0.40.6
432 2

137 C 2015/8 Programme Implementation Report 2012-2013
43320.1 2011
2011
10.1 20122013 4
6
434 20122013
435 2012 51443 CO2( 06142
–
436
45 2013 000280
9

C 2015/8 Programme Implementation Report 2012-2013 138
437
438 20134.5
4720112013350
20142200019.
439
440 2012 200720132 7
91 274
– –
–
27 C 2013/26

139 C 2015/8 Programme Implementation Report 2012-2013
–
441
2013
442- 20102011 201220134.5
20122013 6.8 2012201311.3
.
443-
2012
2013 .
444- 193.32014201572013

C 2015/8 Programme Implementation Report 2012-2013 140
1920122013 20122013
29CL 145/3(
1
2.0 1.8
2
.
1.0 0.2
3 2012
2
6.0 4.6
420 2015
2.0 1.3
5.
0.3 0.0
11.3 8.0

141 C 2015/8 Programme Implementation Report 2012-2013
1
445 20102011،
446 20102 8201120102013
20142017
28 1C2013/8.

C 2015/8 Programme Implementation Report 2012-2013 142
2
447
448 1999
449 20122013157
20102011 109 35 74 11205
www.fao.org/pir 255 20122013 5
20
20082009 20102011 20122013
171 171 157
14 15 11
38 55 35
53 57 74
248 268 255
127 134 147
121 134 108
248 268 255
%49 %50 %42

143 C 2015/8 Programme Implementation Report 2012-2013
450 6 20122013 24
8 3225
6
451 20122013 7451 38269153
12155339
0
5
10
15
20
25
30
35
40
45
50
Monolingual Bilingual Trilingual Fourlanguages
Five or sixlanguageslanguages
2008-09
2010-11
2012-13
لغتان لغة واحدة خمس أو ست أربع لغات ثالث لغات لغات

C 2015/8 Programme Implementation Report 2012-2013 144
452 FAO.org 20122013 FAO.org2013
00059422118982
453 20122013Term Portal 721
2014
FAOTERM وھي16
454 7002
455

145 C 2015/8 Programme Implementation Report 2012-2013
7FAOTERM
21FAOTERM
20062007 72 000 71 0007 000050 00052 000 11 000 500 8 000
2008 2009 83 000 79 00076 00055 50054 000 11 000 2 400 9 000
2010 2011 100 000 97 00094 0007 000060 000 11 000 5 500 19 500
20122013 167 051 144 046110 18871 71564 452 11429 20 659 19 247
0
20000
40000
60000
80000
100000
120000
140000
160000
180000
2006-07
2008-09
2010-11
2012-13

C 2015/8 Programme Implementation Report 2012-2013 146
3
456 2013
201020133820
457 22 2013
526717391544
24165251325
523
22313201
112%50
99%0
292635%26
1185371%25
2889117%24
586252338%25
4164318482%34
3161157318%51
29158149%61
1 *7101741%
5097951 304%39
75106181%41
201333%61
95119214%44
7181230%60
615242194%78

147 C 2015/8 Programme Implementation Report 2012-2013
532081401%80
4354123477%74
3187148335%56
221117138%15
1235%40
1 0545261 580%67
1 6861 5293 21552%
458 211996432013
18388
8199621
2013.
8
0%
5%
10%
15%
20%
25%
30%
35%
40%
45%
1996 1997 1998 1999 2000 2001 2002 2003 2004 2005 2006 2007 2008 2009 2010 2011 2012 2013
المقر الرئيسي المكاتب األخرى القائمة الجميع

C 2015/8 Programme Implementation Report 2012-2013 148
459 2010 222013
141
460
461 2003405
55 2003
2011
462 20112013
20112 9 9 12312013417
402331201324
312013
463
29 20112010
2011C2013/8http://www.fao.org/docrep/meeting/025/md692e.pdf

149 C 2015/8 Programme Implementation Report 2012-2013
LinkedInDevelopmentaid و Devex
23312013

C 2015/8 Programme Implementation Report 2012-2013 150
24
312011
2 1 5 4 3 2 1
2 2 2 2 4 12 3 6 11 2
112 2 6 2 2 244 3 1 14 123 2 1 9
1 1 1 1 12 3 1 1 1 1 1184 14 4 1 5 1 1 11 1 2 5 1 1 2 11 2 262 2 1 13 2 2 4
112 1 1 6 1 1 2 2 2 31 2 6 1388 4 1 1 26
1 1 22 2 6 12236 4 2 20 122 1 1 7 1 1 12 3
1 1 2
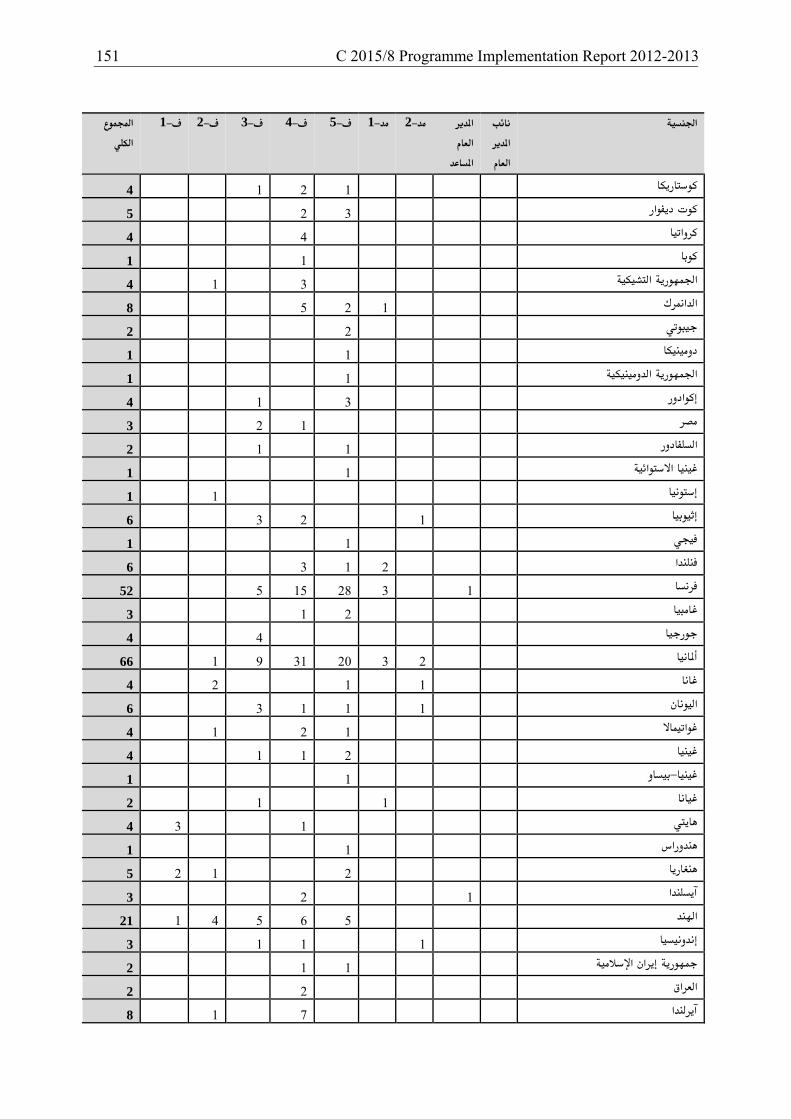
151 C 2015/8 Programme Implementation Report 2012-2013
2 1 5 4 3 2 1
12 1 4 32 5 4 4 1 1
3 1 4 125 8 2 2 1 1 1 1 3 1 4
1 2 3 1 1 2
1 1 1 1 12 3 6 1 1 213 6 132815 5 52 21 3 4 4 232031 9 1 66 11 2 4 111 3 6 12 1 4
21 1 4 1 1 1 1 2 1 3 4
1 1 2 1 2 5
12 3 56 5 4 1 21
11 1 3 11 2
2 2 7 1 8

C 2015/8 Programme Implementation Report 2012-2013 152
2 1 5 4 3 2 1
2 2 272139 138 90 3 3 11348 101 28
11 2 24 1 7
11 1 3 1 1
212 2 7 2 2 1 1
11 1 3 1 1 2 1 1 11 2 111 1 4 1 1
13 1 5 2 2 1154 2 1 14 11 1 1 4 2 2 1142 8 111 3 1 1 2 1 3 1610 1 18 111 1 1 5 2 1 3 31 1 5 1211 1 6 21 2 5 1 1
13 1 5 1 1
1 1

153 C 2015/8 Programme Implementation Report 2012-2013
2 1 5 4 3 2 1
23 1 6 5 5 1 1 2 4 1122 1 7 11 1 3
11 3 2 1 8 111 3
1 1 1 1 1 1 112 4 1 1 2 1 1 2 1 3 2 2 1 1 1 1
11 3 5 1255 7 7 27
1 1 2 2 1 1 15 1 7 73 1 1 12
11 2 4 2 1 3 111 2 5 1 1 2
2 2 2 2 1 1 2
2 1 3 1111 2 6 113 1 1 7 2 1 3 3 3

C 2015/8 Programme Implementation Report 2012-2013 154
2 1 5 4 3 2 1
342112 112 53 1494240 325 1 134
2 1 3 1 1 2 1 1 1 1 2 2 2
1 1 2 1 3 11 2 1 1 6
293565285 364 19962 16 1 037