Embed Size (px)
Citation preview

M AGYA R N EMZETI BA N K
MNB HANDBOOKSNo. 12.
April 2017
BALÁZS KÓCZIÁN – PÉTER KOROKNAI
Balance of Payments


MNB Handbooks
Balázs Kóczián – Péter Koroknai
Balance of Payments
MAGYAR NEMZETI BANK

Published by the Magyar Nemzeti Bank
Publisher in charge: Eszter Hergár
H-1054 Budapest, Szabadság tér 9.
www.mnb.hu
ISSN 2498-8413 (Print)
ISSN 2498-8421 (Online)
MNB Handbooks
Balance of Payments
Written by Balázs Kóczián – Péter Koroknai
(Directorate Monetary Policy and Financial Analysis, Magyar Nemzeti Bank)
This Handbook was approved for publication by Barnabás Virág, Executive Director

Contents
1 Introduction 7
1.1 Defining balance of payments 10
1.2 Main definitions 11
1.3 Relevance of balance of payments statistics 12
2 Theoretical overview 15
2.1 Elasticity theory 17
2.2 Absorption theory 18
2.3 Monetary theory 19
2.4 Intertemporal approach to the current account 20
3 Analytical framework 21
3.1 Real economy approach 23
3.2 Financing approach 29
3.3 Co-movement of the two approaches and the difference between them 34
3.4 Preparation of balance of payments data for analysis 37
4 Case studies 40
4.1 Impact of the 2008 crisis in Hungary 40
4.2 Balance of payments crises – international examples 44
4.3 Puzzles of international economics 50
References 54
Annex: Hungary’s balance of payments statistics 2007–2010 56


The purpose of our handbook is to provide assistance in the analysis and deeper understanding of the data included in the balance of payments. We hope that with the help of our publication it will be easier for the readers to find their way in the labyrinth of balance of payments statistics, and perhaps we will succeed in highlighting the main items, in order to facilitate the understanding of the deeper trends of the economy in the future. As for the structure of this publication, it starts with an introductory section, which presents why the balance of payments is important. This is followed by a theoretical overview, in which we describe the main theoretical considerations related to the balance of payments in an easy-to-understand manner. The next chapter discusses the analysis of data, allowing us to better understand economic developments. Finally, the publication ends with case studies of past balance of payments crises. The manuscript of this handbook was submitted on the 9th of February, 2017.


Introduction | 7
1 Introduction
Developments in the balance of payments constitute one of the most important features of open economies. Our Handbook focuses on the balance of payments, which ultimately presents in a statistical manner the entirety of the interactions of the economy with the rest of the world. However, before reviewing this, we should first make it clear what constitute transactions related to the rest of the world.1 A closed economy does not conduct trade outside its borders, it does not receive and does not give transfers, or pay incomes to abroad. However, these days it is almost impossible to find an economy that is closed to this degree (perhaps North Korea’s system comes closest, but even that country has significant foreign trade turnover, mainly with China). By contrast, an open economy is characterised by trading with the rest of the world and capital flows between countries. Participants in an open economy can not only use the produced income for investment or consumption, but – if needed – the savings of the rest of the world are also available to them (and the opposite is also true).
1 For the sake of simplicity, reference is made to domestic and foreign actors instead of the statistically precise resident and non-resident actors.
In Hungary, the liberalisation of transactions affecting the balance of payments started with foreign trade items, in a process lasting more than a decade. In order to facilitate the convergence of the economy, first the barriers related to the items of the balance of trade were removed. The liberalisation of imports started in 1989, and 90% of consumer goods were no longer subject to licensing by 1992. Following the political transformation, instead of ‘manual controls’, the state tried to influence imports by customs duties, the reduction of which occurred in line with the obligations undertaken in commercial treaties as well as the EU Association Agreement and later the Accession Treaty.
Box 1
Degrees of economic openness through the example of the Hungarian liberalisation

8 | MNB Handbooks • Balance of Payments
Accordingly, in an open economy – if necessary – profitable investment can be implemented even using the savings of the rest of the world, and thus more investment can take place than what is typical of a closed economy, providing higher potential growth for the country. In an economy, domestic absorption that exceeds the income produced results in a current account deficit, although it is also important to underline that this phenomenon in general is not necessarily harmful. For example, in the case of a small, developing economy that has a relatively poor capital stock, foreign capital may also contribute to raising the potential level of economic growth, because investment that can be implemented from domestic savings may only be able to finance part of the profitable investment. This can stem from the fact that in relatively less developed countries, where the per capita GDP is lower, the current account deficit is typically higher (Chart 1). At the same time, the marginal utility of the capital provided by the rest of the world continues to be relatively high, and is able to significantly increase the productivity of the given economy. Consequently, the deficit of the balance of
2 Foreign direct investment means foreigners’ acquisition of ownership in companies, entailing the acquisi-tion of influence. Simply said, it means that a foreign party purchases a share in a company, thus making an investment in the given country.
The removal of barriers to foreign direct investment, which affect the financing side of the balance of payments, occurred in parallel with the liberalisation of foreign trade. The laws on economic associations and the transformation of economic organisations and economic associations already allowed the free establishment of companies in 1989. Later, the laws guaranteeing the safety of invested capital as well as the liberalisation of prices and wages also contributed to the acceleration of FDI inflows.2
Deregulation of the payment system started in the late 1990s, following the liberalisation of foreign trade. In the first round, partial convertibility of the forint was implemented, concerning the balance of payments items related to foreign trade and income transfers. As a result, on 1 January 1996, forint-based cards became usable abroad as well, and the FX sheet, which served for keeping records of purchased foreign currency, was terminated, and it was allowed to take foreign currency out of the country without permission up to the limit of fifty thousand forints. The forint became fully convertible in 2001, when the limitations on the movements of capital items were also terminated. With this step, the liberalisation of transactions concerning the balance of payments was completed.

Introduction | 9
payments may allow a permanently higher growth path, as a result of which the external debt indicators do not grow too high either in proportion to the size of the economy, especially if investment is not realised with foreign credit, but with the help of equity-type liabilities, which do not add to external debt, i.e. through foreign direct investment (FDI). However, it is also worth noting that the impact of the increase in external debt may be similar to that of direct investment, to the extent that it serves the financing of productive investment.
Data suggest that, in the countries of the European Union, the degree of external imbalance strongly depends on per capita GDP. Following from the characteristics of the balance of payments discussed later, in countries where per capita GDP is higher, net lending (combined current and capital account balance) is also higher. Presumably, this is attributable to the fact that in countries with higher per capita GDP higher income entails higher savings, and thus the need for the involvement of foreign funds is lower. At the same time, it is also true that higher capital stocks accumulated in relatively richer countries, while in poorer countries the marginal utility of capital may still be higher. As a result, due to the higher return, capital tends to flow into these countries (see details later).
Chart 1Correlation between the level of development and external balance
BE
BG
CZ
DK
DE
EE
IE
GR
ES
FR
CR
IT
CY
LV
LT
LU
HU MT
NL
AT
PL
PTRO
SL
SK
FI
SE
UK
IS
NO
y = 0.28x–9,43 R2=0.48
–25
–20
–15
–10
–5
0
5
10
15
20
0 10,000 20,000 30,000 40,000 50,000 60,000 70,000
Curr
ent a
ccou
nt su
rplu
s(a
vera
ge o
f 200
4–20
08, p
erce
nt o
f GDP
)
GDP per capita (2008, PPS)

10 | MNB Handbooks • Balance of Payments
The following presents a brief overview of exactly what data are contained in balance of payments statistics and why they are important. We then briefly discuss some basic terms that aid in the further interpretation of the Handbook, followed by the main body of the text.
1.1 Defining balance of payments
The balance of payments summarizes the real economic and financial transactions conducted between residents and non-residents. In brief, it is worth mentioning in the introduction what we mean by the balance of payments. According to the definition in an MNB publication ‘The balance of payments is a flow-oriented statistical statement for recording economic and financial transactions between resident3 and non-resident institutional units of an economy in a given period of time’ (MNB, 2006). With a little simplification, when we talk about balance of payments, we usually think of flow-type data,4 and thus, for example, the balance of trade of the balance of payments means the amount reached by net foreign trade (sales abroad less purchases) of residents in the given period. In addition, the balance of payments also shows the financing in connection with conducting payment transactions related to foreign trade. Accordingly, it reveals, for example, whether foreign currency was paid for the goods bought from abroad or they were purchased on credit, and in relation to that it also becomes known whether the amount of foreign investment increased in a given economy and whether the change was more related to capital investments or loans as well as how the country’s FX reserves changed.
The balance of payments data are accrual-based statistics, and thus the transactions are recorded upon change of ownership. In connection with the balance of payments data, it is important to emphasise that we are talking about accrual-based – i.e. not cash-based – statistics. In the case of
3 Natural persons that have been habitually residing in Hungary for at least one year as well as legal entit-ies and organisations without legal personality pursuing economic activities in Hungary are considered residents. Source: www.fma.mnb.hu
4 It is worth noting that here we are discussing the balance of payments as flow-type data. At the same time, the international investment position, which presents the stocks vis-à-vis the rest of the world (receivables and payables), is also a part of the balance of payments statistics.

Introduction | 11
cash-based accounting, the data in the statistics would be related to the financial settlement, i.e. the time of the concrete monetary movements, and thus, for example, tangible assets given without consideration would not be accounted for, and many services (e.g. tourism) would not be accounted for at the time when they were used by the economic agent. By contrast, the basis of the accrual-based accounting is the change of ownership, and thus the transactions are settled simultaneously with the transfer of ownership. In addition, for example, in the accrual-based accounting, interest payments also appear in an even manner. Accordingly, the balance of payments contains transactions that show the flow; information about stock statistics may be given by the data of the net international investment position (NIIP) (another MNB Handbook deals with the indicators of debt vis-à-vis the rest of the world).
1.2 Main definitions
Based on balance of payments data, it is possible to obtain a picture of various economic developments. At the same time, before looking at the balance of payments in a more detailed manner, it is a good idea to familiarise ourselves with some terms that are also used in everyday language as well.
The first one is the current account, the balance of which shows the sum total of a given country’s economic transactions with the rest of the world: within that, a distinction is made between goods and services turnover (trade balance), employees’ and investors’ incomes (income balance) as well as unrequited current incomes (current transfers). Besides, the current account balance also equals the difference between the savings of economic sectors and the investment implemented in the economy (see details below).
The capital account is also a major item in the balance of payments. Basically, the turnover of two types of ‘products’ is booked here: the turnover of capital transfers and that of non-produced, non-financial goods. For Hungary, the former is more important, as it includes the capital transfers from the European Union, which essentially support investment; an example for the latter may be the sale of copyrights.

12 | MNB Handbooks • Balance of Payments
Another important concept is the balance of payments surplus, often referred to as the net lending of the economy. Net lending is the sum of the current and capital account balance. If this amount is negative, the economy has a net borrowing position, i.e. economic agents must inject capital corresponding to that amount, whereas in the case of a positive value we can speak of net lending.
Theoretically, the balance of the financial account also equals the sum of the current and capital account balance,5 and represents the mirror image of real economy developments appearing in financial transactions.
Finally, the net international investment position is worth mentioning; it represents the payables and receivables stemming from the financial account developments.
1.3 Relevance of balance of payments statistics
Following the crisis, more attention was paid to the balance of payments statistics once again, as several indicators proved to be of utmost importance. In the years following the crisis in particular, more emphasis was placed on the balance of payments statistics and the importance of the conclusions that can be drawn from the data included in them. While in the pre-crisis years, when liquidity was ample, the importance of external debt and balance indicators was neglected, the 2008–2009 financial crisis and the subsequent debt crisis in the Mediterranean countries cast more light upon the importance of these indicators. This is reflected, for example, in the Macroeconomic Imbalances Procedure (MIP) as well, which was introduced by the European Commission, and which monitors various indicators originating from the balance of payments statistics.
5 This also holds true for the 6th edition of the IMF Balance of Payments Manual, which describes the methodology of the balance of payments and is presented in this Handbook. Nevertheless, for example in the previous edition, the sum total of the current and capital account balance and the balance of the financial account amounted to zero; or more exactly, it presented the balance of the statistical error.

Introduction | 13
Several indicators of the balance of payments may be good indicators of the vulnerability of countries. Since the crisis, increased attention has been paid to the external vulnerability of economies. One of its most important indicators is the short-term external debt based on residual maturity, which constitutes a part of the balance of payments and international investment position statistics. In addition, the vulnerability of a country may also be indicated by a significant current account deficit, as for example in Turkey during the tapering in 2013. At that time, when the reduction of the Fed’s liquidity expansion programme received increased attention, investments that were considered riskier suffered greater weakening. The underlying reason may have been that investors may have thought that the current account deficit of the Turkish economy was too high, which could only be financed at increasing costs. As a result, the Turkish lira also depreciated considerably in the FX market. By contrast, the tapering only had a lower impact in Hungary, where the current account surplus was already significant.
The balance of payments may also indicate the competitiveness of economies. In addition to vulnerability, the balance of payments can function as an indicator of the competitiveness of the economy as well. This is because the products that are produced in a country where labour is relatively cheap and well-trained may have an advantage in foreign trade, and thus the given country’s goods balance (which is a part of the current account) may show a persistent and significant surplus. On the other hand, a persistent and significant current account deficit may indicate the competitive disadvantage of the economy.6
In addition to the above, the financial account, which is a part of the balance of payments, may also indicate the economy’s ability to attract capital. Namely, in addition to foreign trade and debt indicators, the balance of payments statistics also record the given country’s flows of money. For example, a country that is considered an attractive target for investment typically has a financial account deficit, as foreign investors acquire ownership
6 However, we also consider it important to note that – as we will see later – a deficit may also evolve because the given country uses external funds to implement investment that contributes to higher economic growth and thus also to the repayment of foreign loans borrowed earlier.

14 | MNB Handbooks • Balance of Payments
in companies or bonds, taking account of the attractive risk–yield relations. At the same time, it is worth noting that domestic sectors may also play an important role in the inflows or outflows of funds. In Hungary, for example, the decline in external debt in 2013 and 2014 took place in parallel with domestic actors’ (banks and households) increasing government securities purchases, which allowed the state to repay external debt that had previously been accumulated.

Theoretical overview | 15
2 Theoretical overview
In this section, we provide a more detailed explanation of the differences between an open economy and a closed economy. In the case of a closed economy, disposable income (Y) consists exclusively of goods produced within the country, and the income can only be spent on domestic absorption, i.e. consumption (C), investment (I) and government expenditures (G):
Y = C + I +G (1)
As savings (S) by definition equals the economy’s income not spent on consumption, i.e.
S =Y −C −G (2)
it is also clear that in the case of a closed economy, investment can only materialise from the internal savings of the economy:
I = S (3)
By contrast, in an open economy, where foreign trade allows the exports and imports of goods, disposable incomes are affected by the balance of trade7 (X-M) as well. In other words, disposable income is increased by export revenues as well, and the income can also be spent on foreign products. Consequently,
Y = C + I +G+ X −M (4)
In a small, open economy, the adjustment of the interest rate to the external interest rate will bring about a trade deficit or surplus. In a closed economy, the equilibrium interest rate is determined by the investment that can be financed from the given savings (rz). However, in the case of an open economy, the interest rate complies with the external interest rate, which may result in a different investment level compared to what is realised in a closed economy. Then investment, which deviates from the domestic savings, results
7 For the sake of simplicity, in this section we assume that the current account only consists of the balance of trade, while the size of the income balance and transfer balance is negligible.

16 | MNB Handbooks • Balance of Payments
in a trade surplus or deficit, on the basis of the deviation of the external rate from the domestic equilibrium interest rate. If the external interest rate is lower than the domestic interest rate (r’), a trade deficit will evolve due to the higher investment, while if the external rate is higher (r*), a trade surplus will develop.
There are various theories concerning what factors have an impact on changes in the balance of trade. Of them, the elasticity, absorption, monetary and intertemporal approaches are described below. As has already been described briefly, net lending – which is a determinant in terms of the developments in the net lending – and the current account balance are produced as the sum of various items (trade balance, income balance and transfer balance). At the same time, the theories related to the
Chart 2Balance of trade and various external interest rates
Interestrate S (r)I (r)
Trade surplus
Trade deficit
Savings, Investments
r*
rz
r’

Theoretical overview | 17
balance of payments usually and primarily focus on the developments in the balance of trade as the most important element of the economic relations between domestic and non-resident actors, which may be attributable to two considerations. Firstly, if a country’s economy is not significantly indebted, the outflow of funds through the income balance does not reach a considerable level, while the size of capital transfers is typically also not significant. Secondly, income flows are mainly influenced by the size of the outstanding liabilities accumulated in the past and the interest paid on such, and economic policy only has a minor effect on their developments, while the influence of the transfer balance is possible to an even lesser extent. Nevertheless, balance of payments theories search for an answer as to whether the devaluation of the nominal exchange rate improves the balance of trade, which may be of crucial importance for economic policy decision-makers. It is worth mentioning that in the first two theories the real economy variables, the items of foreign trade are considered autonomous items, to which the capital flows that finance them adjust themselves, while in the case of the monetary approach, foreign trade adapts itself to the capital flows. It is also worth underlining that the intertemporal approach is closer to the stochastic general equilibrium models, and thus it examines the developments in the balance of payments in a more complex manner.
2.1 Elasticity theory
The elasticity theory of the balance of payments states that the impact of depreciation on the balance of trade depends on the price elasticity of products. Depreciation of the exchange rate basically results in an increase in the prices of products expressed in the domestic currency.
• Accordingly, in the case of exports, exporters’ income would ceteris paribus increase, i.e. the given enterprise may reduce its prices expressed in foreign currency, which leads to a rise in export volumes in the case of normal goods.8
8 The theory assumes that in the case of the export products, changes in demand do not affect the prices, they are fixed, and thus the relative prices can only be influenced by the nominal exchange rate.

18 | MNB Handbooks • Balance of Payments
• The logic is similar to the above in the case of imports as well, where, in turn – in addition to the size of the decline in demand due to the rise in the prices of products expressed in forints – it is also important that the price effect clearly impairs the balance of trade, as the price of the imported product expressed in forints increases. This is because what is relevant is the joint impact of the price effect, which impairs the trade balance, and of the volume effect, which improves it.
The aggregate effect of depreciation on the balance of payments is ultimately stated by the Marshall–Lerner condition: depreciation improves the trade balance if the sum of the price elasticities of the demand for export and import goods is greater than 1 (provided that the income does not change in the meantime). Accordingly, the impact of changes in the exchange rate on the trade balance depends on the sensitivity of exports and imports to the exchange rate. Based on empirical research, it seems that while over the short run depreciation may even impair the trade balance, exports and imports behave in a more flexible manner over the longer run, i.e. the Marshall–Lerner condition tends to be met, which is also called J-curve effect. There may be various underlying reasons for the delay: changes in consumer habits, increasing of production and the prevailing of lower prices also require some time (pass-through).
2.2 Absorption theory
The absorption theory of the balance of payments states that depreciation improves the trade balance if it adds more to the national income than to domestic absorption. One of the disadvantages of the elasticity theory is that it looks at the balance of trade as the difference between exports and imports, focusing only on the direct effects, without taking into account that with their changes the income of the economy and thus domestic absorption also change. The need for taking account of the indirect effects is satisfied by the absorption theory, according to which the trade balance equals the difference between the income produced and the income spent, also known as absorption, the end result of which is, of course, similar to that of the elasticity theory. Namely, if Y = C + I + G + X – M, then

Theoretical overview | 19
X – M = Y – (C + I + G). Accordingly, change in the trade balance depends on whether the depreciation has a greater impact on the national income or on domestic absorption (i.e. whether on the right side of the equation it changes the income or the items in brackets to a greater degree). It helps in the decision if we examine whether the economy is operating at full capacity utilisation, because if there is full employment, income cannot be increased even with depreciation, and thus the improvement in the trade balance requires the reduction of absorption (e.g. the reduction of fiscal expenditures). However, if the economy has not utilised its full capacities earlier, and thus it is able to increase production, upon analysing the impact of depreciation, the income effect also has to be taken into account in addition to the absorption effect.
2.3 Monetary theory
According to the monetary theory of the balance of payments, the imbalance of the balance of payments stems from the imbalance of the money market, and the price level evens out internationally as well through foreign trade. According to the monetary theory, there is a deficit in the balance of trade if money supply exceeds the demand for money. In this case, through an increase in consumption, the additional money supply results in a decline in the goods balance due to rising imports. In addition, the theory suggests that depreciation of the exchange rate does not affect the balance of payments over the longer run, as the price level also increases in the economy. Nevertheless, domestic products become temporarily more competitive following depreciation, resulting in rising demand for the domestic currency and thus appreciation pressure. At the same time, intervention carried out in order to avoid appreciation entails an increase in money supply, adding to the price level as well through the growth in domestic demand. As a result, the competitive advantage that developed from the depreciation ceases to exist, i.e. the improvement in the trade balance proves to be only temporary. Overall, there is an automatism that equilibrates the balance of payments: depreciation results in a rise in the price level. Of course, it assumes an intervention carried out in order to avoid appreciation; a failure to do so equilibrates the balance of payments through revaluation of the domestic currency as well.

20 | MNB Handbooks • Balance of Payments
2.4 Intertemporal approach to the current account
Intertemporal decisions may also lead to a current account surplus, although based on models it may evolve as a joint result of several factors. According to the intertemporal theory, the balance of the current account is based on savings–investment trade-off decisions determined on the basis of the time preference of spending the money. In other words, the present current account surplus will increase the economy’s future investment, and vice versa. According to the deduction of Obstfeld and Rogoff (1994), the current account balance depends on a number of factors: the current world market interest rate, the equilibrium interest rate as well as the accumulated savings/liabilities of the economy, the output gap and the value of the impatience9 parameter. At the same time, they emphasise that the intertemporal balance of payments theories allows for the dynamic adjustment of budget constraints, i.e. a hypothetically low investment level is financed by the government’s spending from the surplus of the future balance of payments, while becoming indebted in the present. In addition, they point out that by combining the intertemporal balance of payments model with the model of generations that live together it is easier to understand, for example, how the surplus of the balance of payments of Japan may decline in the future.
After becoming familiar with the correlations and main theories, in the next chapter we discuss the theoretical frameworks that support the analyses. We present what partial items the balance of payments has, how they are grouped for analytical purposes and how this grouping facilitates the understanding of the economic developments reflected in the balance of payments.
9 In several models, this parameter captures what trade-off households are willing to accept for postpo-ning their present consumption to the future.

Analytical framework | 21
3 Analytical framework
Developments in the external balance can be analysed from the side of the real economy, on the basis of the structure of financing as well as according to individual sectors’ financial savings. Fundamentally speaking, the balance of payments statistics provide data on the external balance. According to the real economy approach (net lending calculated using the top-down approach), ultimately the unspent part of income (and spending in excess of income) is reflected in the current and capital account. By contrast, relying upon the financial account of the balance of payments statistics, the financing (bottom-up) approach shows what foreign funds the economy used to finance its spending in excess of its income (in the case of net borrowing), and on what financial assets vis-à-vis the rest of the world it spent its remaining income (in the case of net lending). At the same time, financial transactions related to the rest of the world appear among the financial accounts as well. As a result, developments in the external balance can also be analysed with the help of the change in the financial savings of individual sectors (Chart 3). Actually, net lending means the portion of income produced in the sectors of the economy that is not spent on consumption or accumulation. Accordingly, adding up the net financial savings of individual sectors (households, corporations, general government10) shows the net lending of the country. A separate MNB Handbook will be devoted to financial savings, and thus the external balance is not analysed here in this respect.
Theoretically, the three approaches lead to the same net lending. Nevertheless, in practice, some differences are seen between the various approaches. Theoretically, real economy developments are precisely reflected in the developments in financing as well: if, for example, the current and capital account balance show a surplus, which has been typical of the Hungarian economy in the recent years, it appears in the sectors’ positive
10 Of the financial corporations, in view of its nature, it is worth treating the MNB as part of the general government. The joint treatment of the two sectors simplifies the analyses significantly, as, for example, when the state borrows from abroad, the MNB’s FX reserves increase, i.e. the net external position of the consolidated general government including the MNB remains unchanged. In line with that, herei-nafter general government generally means the consolidated general government including the MNB.

22 | MNB Handbooks • Balance of Payments
savings position as well, while the financial account indicates an outflow of funds. It means that the data originating from different approaches should be the same. However, temporary differences can be caused by the fact that the data are from various sources (non-integrated data sources), the observation is not comprehensive, and the treatments of exchange rates may vary (in one of the data sources the value of an export product might be recorded at an exchange rate other than its value upon the monetary movements), which is shown in the ‘Net errors and omissions’ item. However, it is important to know that developments in the real economy and in financing tend to be broadly similar over the longer term.
Chart 3Diagram of net lending according to various approaches
Real economy approach Sectors’ savingapproach Financing approach
Lend
ing
(cur
rent
and
cap
ital a
ccou
nt)
Net
lend
ing
(net
savi
ngs p
ositi
on, e
xter
nal o
utflo
ws)
Currentaccount
Tradebalance
GovernmentGovernment
Bankingsystem
Debt
Foreigndirect
investments(FDI)
Households
CorporatesCorporates
Net errors and omissionsCapitalaccount
Transfers
Incomebalance
The chart only refers to the correlations between the sum totals of each column. The order of the boxes is of no importance, and the position of net errors and omissions is also accidental and does not mean that the financing approach contains any mistake.
Analytical framework | 23
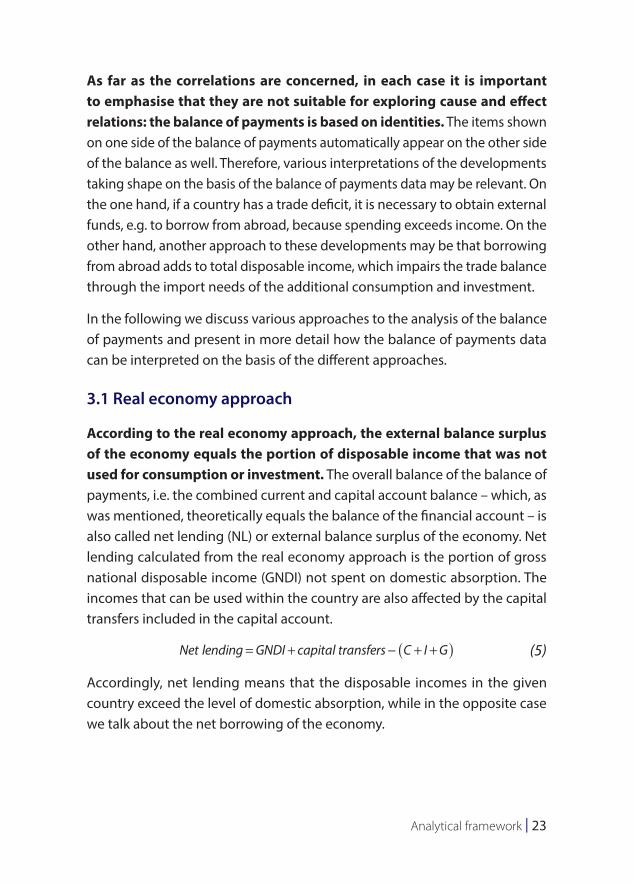
As far as the correlations are concerned, in each case it is important to emphasise that they are not suitable for exploring cause and effect relations: the balance of payments is based on identities. The items shown on one side of the balance of payments automatically appear on the other side of the balance as well. Therefore, various interpretations of the developments taking shape on the basis of the balance of payments data may be relevant. On the one hand, if a country has a trade deficit, it is necessary to obtain external funds, e.g. to borrow from abroad, because spending exceeds income. On the other hand, another approach to these developments may be that borrowing from abroad adds to total disposable income, which impairs the trade balance through the import needs of the additional consumption and investment.
In the following we discuss various approaches to the analysis of the balance of payments and present in more detail how the balance of payments data can be interpreted on the basis of the different approaches.
3.1 Real economy approach
According to the real economy approach, the external balance surplus of the economy equals the portion of disposable income that was not used for consumption or investment. The overall balance of the balance of payments, i.e. the combined current and capital account balance – which, as was mentioned, theoretically equals the balance of the financial account – is also called net lending (NL) or external balance surplus of the economy. Net lending calculated from the real economy approach is the portion of gross national disposable income (GNDI) not spent on domestic absorption. The incomes that can be used within the country are also affected by the capital transfers included in the capital account.
Net lending =GNDI + capital transfers− C + I +G( ) (5)
Accordingly, net lending means that the disposable incomes in the given country exceed the level of domestic absorption, while in the opposite case we talk about the net borrowing of the economy.

24 | MNB Handbooks • Balance of Payments
For the deduction of net lending according to the real economy approach, we may use the equations of the national disposable income and the national income:
GNDI = GDP +net foreign incomes+ current transfers (6)
GDP = C + I +G+ X −M (7)
And the statement of the real economy approach also follows from equations (5) (6) and (7):
NKF = C + I +G+ X −M+net foreign incomes+ current transfers
+capital transfers− C + I +G( ) (8)
Which, in a simplified manner, contains the following correlation:
NKF = C + I +G+ X −M+net foreign incomes+ current transfers+capital transfers− C + I +G( )
(9)
NL=X −M+ incomes+ currenttransfers+capital transfer
NL = current account + capital account (10)
Accordingly, the net lending of a country equals its trade balance, the balance of primary incomes (income transfers related to the rest of the world), the balance of secondary incomes (current unrequited transfers) and the amount of the balance of capital transfers.
Let us illustrate the correlation between the real economy approach and the overall balance of the balance of payments using an example as well and examine in the meantime what happens to the net lending of the economy. According to the real economy approach, when a company deals with exports, the trade balance expands as a result of the increase in net exports. It also adds to the net lending of the economy. Likewise, the given company’s exports will also increase the financial account, as the company’s income will grow by the value of the export product, which shows that the two approaches lead to the same result. However, this is discussed in the part that deals with the financial account.
Box 2
A practical example of the appearance of a transaction in the balance of payments I
NL=X −M+ incomes+ currenttransfers+capital transfer
NL = current account + capital account
NL=X −M+ incomes+ currenttransfers+capital transfer
NL = current account + capital account
NL=X −M+ incomes+ currenttransfers+capital transfer
NL = current account + capital account
Analytical framework | 25
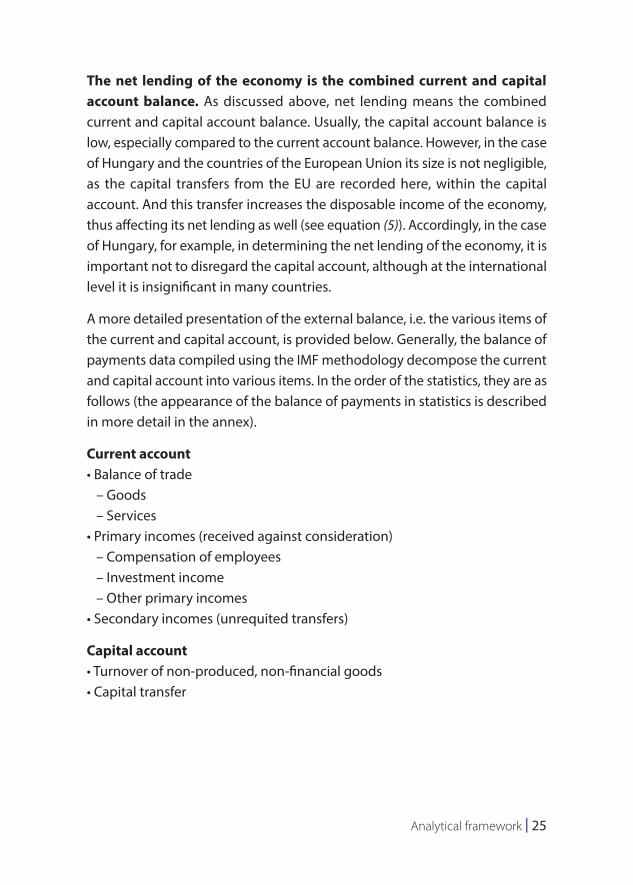
The net lending of the economy is the combined current and capital account balance. As discussed above, net lending means the combined current and capital account balance. Usually, the capital account balance is low, especially compared to the current account balance. However, in the case of Hungary and the countries of the European Union its size is not negligible, as the capital transfers from the EU are recorded here, within the capital account. And this transfer increases the disposable income of the economy, thus affecting its net lending as well (see equation (5)). Accordingly, in the case of Hungary, for example, in determining the net lending of the economy, it is important not to disregard the capital account, although at the international level it is insignificant in many countries.
A more detailed presentation of the external balance, i.e. the various items of the current and capital account, is provided below. Generally, the balance of payments data compiled using the IMF methodology decompose the current and capital account into various items. In the order of the statistics, they are as follows (the appearance of the balance of payments in statistics is described in more detail in the annex).
Current account • Balance of trade
– Goods– Services
• Primary incomes (received against consideration)– Compensation of employees– Investment income– Other primary incomes
• Secondary incomes (unrequited transfers)
Capital account• Turnover of non-produced, non-financial goods• Capital transfer

26 | MNB Handbooks • Balance of Payments
Basically, the turnover of goods and services between residents and non-residents is taken into account among the goods and services. Goods turnover is measured by the Hungarian Central Statistical Office, partly on the basis of customs statistics data and partly on the basis of larger companies’ individual reports regarding foreign trade. The value of foreign trade is taken into account in the balance of payments at the value including delivery to the border of the exporting country. However, the resulting data are modified by the MNB with the size of the adjustment related to VAT residents.11 The source of the data relating to business services is the corporate questionnaire survey of the HCSO, while data on tourism originate from the HCSO’s frontier traffic surveys. The data source for services not mentioned above is the statistics compiled from companies’ reports. In summary, the trade balance includes, for example, the goods exports and imports of companies as well as accommodation services used by foreigners in Hungary.
Primary incomes also consist of several sub-items. Firstly, they contain the gross earned incomes of foreigners working in the given country and of this country’s residents working abroad (i.e. employees who stay abroad for less than one year and do not habitually reside abroad). In connection with this, it is worth mentioning that those who stay abroad (habitually) for more than a year are considered foreign residents in the balance of payments, and the incomes repatriated by them are recorded among unrequited transfers (secondary incomes). Secondly, they contain the incomes from investment, also covering the dividends received after equities as well as the paid interests on loans granted and received. In the case of interest incomes, with regard to financial enterprises they are measured on the basis of actual data, while in the case of other non-financial corporations the measurement is based on estimation. Until the receipt of the corporate tax returns, incomes from direct investment are based on estimates, which are then replaced with actual data. Finally, other primary incomes, which used to be included among the current unrequited transfers according to the previous methodology, mainly contain product and production taxes, subsidies and rents. (Prior to June 2014, Hungary’s balance of payments statistics was compiled according to
11 For more details see: http://www.mnb.hu/Root/Dokumentumtar/MNB/Statisztika/mnbhu_statkozle-meny/mnbhu_fizetesi_merleg/fizm08q2_hu.pdf

Analytical framework | 27
the BPM5 methodology developed by the IMF. In line with the international methodological changeover, it was replaced by BPM6 from June 2014.)
Secondary incomes comprise the current unrequited transfers: these are items that are considered unilateral transfers, i.e. no other type of receivable is generated against the payment transactions. It increases the receiving party’s income, while reducing the ‘sender’s’ disposable income. The most significant part of this item is EU transfers. Payments by the general government to the EU budget are also accounted for here, while they are more than offset by the transfers from the social fund and the guarantee section of the agricultural fund. In addition, taxes to be paid on the dividends received on non-residents’ capital investments are also accounted for here.
In the capital account, the turnover of non-produced, non-financial goods primarily contains the accounting of incomes from the sale of copyrights, high-value inheritance as well as damage claims arising after disasters, while capital transfer in the case of Hungary almost entirely consists of the capital transfers received from the EU.
In its various publications, the MNB treats these items slightly differently; it aggregates certain items, while using different names for other items in the interests of interpretability. Accordingly, the following categories are used in the analyses prepared by the MNB.
• Balance of goods and services• Income balance• Transfer balance
Under balance of goods and services, the item with the same name of the current account is presented; consequently, it completely corresponds to what is presented by the official statistics.
Taking into account the aspects of the analysis, in the income balance we slightly deviate from the official statistics: only primary incomes are taken into account here with the exception of other primary incomes, as secondary incomes and other primary incomes are basically unrequited transfers and are accounted for in the transfer balance, because most of these incomes contain

28 | MNB Handbooks • Balance of Payments
EU transfers, which, in economic terms, mean unrequited transfers, similarly to the capital account and transfers.
In the transfer balance, the balance of the capital account is included, in addition to other primary and secondary incomes, as the transfer balance almost exclusively consists of capital transfers, and the turnover of non-produced non-financial goods is usually negligible compared to the balance of other items of the balance of payments.12
12 For the precise calculation, see the MNB publication entitled Hungary’s balance of payments and international investment position statistics 2012.
Due to the application of accrual accounting, the amounts of EU transfers in the balance of payments may be different from the transfers examined on a cash basis, influencing the size of FX reserves. Nevertheless, longer-term developments show a similar picture. The balance of payments data are accrual-based statistics; therefore, these data usually do not correspond to the cash-based data. The same is reflected in the accounting of the transfers from the European Commission. While in the cash-based approach we can see what amount is transferred for the given period, the accrual-based approach allows a conclusion concerning the amount of transfers that have been utilised. Chart 4 shows Hungary’s four-quarter transfer use and the four-quarter changes in transfers. Expansion is observed in both the use and transfer of funds. In certain periods, however, there is a significant difference between the two items. In 2008, for example, the value of transfers considerably exceeded absorption, while in 2010 and 2013 absorption exceeded the amount of cash-based transfers.
The separation of the transfer and absorption of EU funds stems from the specific prefinancing of EU projects as well. Already transferred but not used EU funds are put in a settlement account. Accordingly, although for administrative reasons there may be shorter interruptions in the transfer of EU funds, the previously transferred but not yet used funds may ensure the continuity of the utilisation of the awarded funding.
Box 3
Accounting of EU transfers in the balance of payments

Analytical framework | 29
3.2 Financing approach
Another possible way of analysing the balance of payments is the examination of the financial account, which reflects the financial implication of real economy transactions. The financial account contains the financial transactions of residents with the rest of the world. First, the items of the financial account are also presented on the basis of the official statistics, and then we also discuss how we group the various items of the financial account in our analyses.
Financial account• Direct investment
– Equity capital– Debt instruments
Chart 4EU transfers according to the accrual-based and the cash-based approach(four-quarter values)
0
1
2
3
4
5
6
7
8 Billion euro
EU-transfer in the BOPCash flow of EU-transfer
2008
Q1
2008
Q2
2008
Q3
2008
Q4
2007
Q1
2007
Q2
2007
Q3
2007
Q4
2006
Q1
2006
Q2
2006
Q3
2006
Q4
2009
Q1
2009
Q2
2009
Q3
2009
Q4
2010
Q1
2010
Q2
2010
Q3
2010
Q4
2011
Q1
2011
Q2
2011
Q3
2011
Q4
2012
Q1
2012
Q2
2012
Q3
2012
Q4
2013
Q1
2013
Q2
2013
Q3
2013
Q4
2014
Q1
2014
Q2
2014
Q3
2014
Q4
2015
Q1
2015
Q2
2015
Q3
2015
Q4
2016
Q1

30 | MNB Handbooks • Balance of Payments
• Portfolio investments– Shares and mutual fund shares– Debt securities
• Financial derivatives• Other investments• Reserve assets
The clearest way to understand the financing approach or its relation to the real economy approach is if we recall our aforementioned example of a company’s exports and examine its impact on the financial account. Accordingly, if we assumed that a domestic company deals with exports, as a result of that the net lending of the economy increases through the rise in the trade balance. Its mirror image is found in the financial account as well, since the company’s export revenue adds to the company’s foreign financial assets (as it is related to export activity, we assume that the company receives the value of the exports in foreign currency), and thus the company’s receivables from the rest of the world increase, which raises the net lending of the economy in the financial account as well. Accordingly, while from the real economy side the higher net lending of the economy is reflected in the expansion of net exports, on the side of the financial account it is seen in the change in foreign financial assets (or perhaps in the decline in foreign financial assets if the company spends the income received for the exports on the repayment of foreign loans previously borrowed).
We can also imagine what happens when a household purchases a product from abroad, e.g. through an online shop. In this case, the imports of the economy are increased by the value of the goods, which impairs the balance of payments calculated according to the real economy approach. On the other hand, assuming that this is the way of paying the value of the product, the household reduces the balance of its bank account by the price of the product purchased. Assuming that the household has a forint account, the foreign currency is provided by its bank and transferred to the seller’s account. Strictly from the aspect of the balance of payments the consequence will be that the banking sector’s (other) receivables from the rest of the world will decline by the paid price of the product, which will reduce the overall balance of the balance of payments calculated according to the financing approach to the same extent.
We can also examine the effect of the foreign currency bonds issued by the state on the overall balance of the balance of payments. In Hungary, foreign currency bonds
Box 4
Practical examples for the appearance of a transaction in the balance of payments II

Analytical framework | 31
Under foreign direct investment, non-residents’ investments in Hungary (and residents’ investments abroad) are accounted for, where the fundamental purpose is to have a determining, permanent participation in the voting rights in a company. At the same time, affiliates’ investments representing more than 10 per cent of the votes also belong here. Two important subcategories of direct investments are distinguished: equities and debt instruments. In the statistics, equities can be further broken down into shares and other equity as well as produced and reinvested income. Intercompany loans – although in a strict sense they represent debt, in practice they are similar to equity-type liabilities in terms of numerous characteristics – are accounted for under the debt instruments.
are typically and mostly purchased by foreign investors. Therefore, the issuance of a foreign currency bond increases the portfolio liabilities of the resident sector (the state at the sector level), and thus it means an inflow of funds. At the same time, the amount of the receivables of the consolidated general government (i.e. the combined position of the state and the MNB) from the rest of the world will increase to the same extent as that of the rise in debt. This is because the foreign exchange received as a result of the foreign currency bond issue represents a receivable from the rest of the world, and thus the foreign currency bond issuance in itself does not have an impact on the overall balance of the balance of payments: it adds to both the gross debt originating from abroad as well as the gross receivables vis-à-vis the rest of the world. Consequently, the transaction also does not affect net lending, which would not necessarily be true if we examined the government debt.
Since various features of intercompany loans indicate that companies do not consider them debt liabilities, they are classified as non-debt liabilities for economic considerations. As the above listing also reveals, debt instruments that are among direct investments are included among non-debt liabilities in the statistics. It is mainly loans between parent companies and subsidiaries within multinational companies that belong here. With intercompany loans, companies usually have access to funds under different – generally more favourable – conditions than market conditions, which can partly be explained by the lower counterparty risk as well. In
Box 5
On the accounting of intercompany loans

32 | MNB Handbooks • Balance of Payments
spite of the fact that, on the basis of our previous interpretation, it would be considered a debt liability, for economic considerations the MNB still considers it non-debt liability, as an intercompany loan has much lower roll-over, interest and exchange rate risks than an average loan from abroad. It is also worth mentioning that recently foreign analysts have also started to separate intercompany loans from external debt.
From the shifts between equities and debt instruments, it is also inferred that companies look at the two liabilities being similar. In addition, the accounting of intercompany loans among direct investments is corroborated by the data as well: in the recent years we have observed that within direct investment there is almost a trade-off relationship between debt instruments and equities. Accordingly, changes in intercompany loans did not entail a change in another debt instrument, but rather a shift in foreign direct investments in the opposite direction. This also indicates that companies may consider the two types of liabilities as similar/substitutes for one another.
Chart 5Intercompany loans and FDI (four-quarter transactions)
–20
–15
–10
–5
0
5
10
15
20
–20
–15
–10
–5
0
5
10
15
20
2004 2005 2006 2007 2008 2009 2010 2011 2012 2013 2014 2015
Billion euro Billion euro
Net equities and reinvested earningsNet intercompany loansNet FDI

Analytical framework | 33
Under portfolio investments, investments purchased in financial instruments traded at organised and other financial markets are accounted for. Two main subcategories are worth mentioning here as well: firstly, listed shares and mutual fund shares (also including smaller equities obtained on foreign stock markets as well as investments in foreign investment funds), and secondly, debt securities (mainly investments in bonds).
Various forward deals (e.g. forward interest rate transactions, swap transactions) and option contracts are also accounted for under financial derivatives.
Other investments include all investments that cannot be classified into the above categories and do not constitute a part of the reserves. Inter alia, deposits, commercial and other credits, insurances and guarantees are also accounted for in this category. For example, the loans borrowed by Hungary from international organisations in 2008 were also accounted for here.
Under reserve assets, the changes in the international reserves of monetary authorities, i.e. the changes in FX reserves, are accounted for. These are the assets that are available for the monetary institutions to ease tensions and problems in the case of a possible balance of payments or foreign currency crisis, and they also serve the purpose of covering the foreign currency needs related to the financing of the state.
The items of the financial account are usually classified by the MNB’s analyses into three main categories: debt-type liabilities, non-debt liabilities and derivative liabilities. Similarly to the real economy side, for analytical purposes the items of the financial account are also examined in a breakdown that is somewhat different from the official statistics. Basically, together with the classification according to the official statistics the items listed are distinguished depending on whether they represent debt-type liabilities, derivative liabilities or non-debt liabilities. Those items are considered debt-type liabilities that entail repayment obligations (with the exception of intercompany loans), while non-debt liabilities are usually related to equity, shares or mutual fund shares. Accordingly, the items of the financial account are usually classified into the following categories:

34 | MNB Handbooks • Balance of Payments
• non-debt type financing: including direct investments (equity-type liabilities and debt-type instruments – for more details, see the box on intercompany loans) and of portfolio investments the financing realised through shares and mutual fund shares;
• debt-type financing: including other investments (foreign credit as well as funds received by Hungarian banks from their parent banks),13 and of portfolio investments the debt securities and the change in reserve assets (as one of the most significant receivables vis-à-vis the rest of the world, typically invested in government bonds with high credit ratings14);
• derivative instruments: forward-type (interest rate swaps, forward rate agreements and various foreign-exchange futures) and option-type derivative transactions.15
3.3 Co-movement of the two approaches and the difference between them
In the balance of payments, data are recorded in two items on the basis of the principle of double-entry accounting. Therefore, theoretically, the overall balance of the balance of payments according to the two approaches is always the same. As also seen in the example describing the effects of corporate export activities presented above, the balance of payments is built on the principle of double-entry accounting. Accordingly, each transaction appears in two lines of the balance of payments, thus modifying the overall balance of the balance of payments, provided that the two items are included in the current and capital account as well as in the financial account. This also means, for example, that a company’s export activity changes the current account balance, in parallel with which the ‘counterpart’ of this transaction appears in the financial account as well, i.e.
13 In the case of financial enterprises, it is not possible to clearly decide about the loan received from the owner whether it is an intercompany loan or simple bank loan; therefore, the statistical methodology records it completely among bank loans.
14 MNB, Annual Report 2014.15 Financial derivatives are not considered debt, as no repayment obligation is attached to them and no
interest income is produced on them. For more details, see the MNB publication entitled ‘Hungary’s balance of payments and international investment position statistics 2012’.

Analytical framework | 35
the two sides of the balance of payments change to the same extent. However, it may also occur that both items are listed in the financial account, but with opposite signs.
Due to the differences in the timing and accounting of the different data sources, over the short run the overall balance of the balance of payments may be dissimilar, but over the long term the two approaches show a similar picture. In connection with the balance of payments, it is also worth mentioning that the items entered in the individual legs do not necessarily correspond to one another. This is a consequence of the fact that the balance of payments is compiled from different databases (as we have indicated before, e.g. a major part of the real economy balance originates from the HCSO, while a significant portion of the financial account data are collected directly by the MNB). Therefore, due to the data sources that are different in terms of time and perhaps evaluation as well, the two sides of the balance of payments only theoretically correspond to one another. In practice, the equilibrium between the two balances is created by the Net errors and omissions (NEO). It is important to note, however, that while in the short run the two balances may deviate from one another, their developments are very similar over the long term.
For example, a neutral transaction for the overall balance of the balance of payments may also be if a company pays back its foreign credit from shares purchased by foreigners. In this case, the repayment of the foreign credit would mean an outflow of funds on other capital investments account, while foreigners’ stock purchase would mean an inflow of funds on the portfolio investments account. As the sizes of the two transactions are identical, they would be neutral in terms of the balance of payments.
Box 6
A practical example for the appearance of a transaction in the balance of payments III

36 | MNB Handbooks • Balance of Payments
Chart 6Development of the balance of payments according to various approaches(values as a proportion of GDP)
–10
–8
–6
–4
–2
0
2
4
6
8
10
–10
–12 –12
–8
–6
–4
–2
0
2
4
6
8
10
2004 2005 2006 2007 2008 2009 2010 2011 2012 2013 2014 2015
Per cent Per cent
Net errors and omissionsNet lending (from real economy’s side)Net lending (from financing side)
According to the new balance of payments methodology, the sign of the financial account corresponds to the sign of the current and capital account balance. As mentioned above, the balance of payments statistics were renewed in Hungary and in most of the EU in June 2014, when the previous BPM5 methodology was replaced by the latest BPM6. The new methodology brought several changes to the statistics; one of the most important changes concerned the balance of the financial account. Previously, adding the balance of the financial account to the combined current and capital account balance resulted in zero (more exactly in an error of the balance of payments), which also meant that the inflow of funds was shown on the two sides of the balance with contrasting signs. For example, while fund inflows entailed a negative sign of the net lending calculated from the real economy side, in the case of the financial account the inflow of funds entailed a positive sign of the balance. By contrast, in the new methodology, the combined current and capital account balance equals the balance of the financial account. It makes the analysis of the balance of payments data much easier, as from now on, fund inflows are indicated by the negative sign of the balances of both sides.
Box 7
Changes in the BPM6

Analytical framework | 37
3.4 Preparation of balance of payments data for analysis
In the case of the real economy approach, it is sensible to carry out a seasonal adjustment of the balance of payments data. It is worth performing a seasonal adjustment of certain items of the real economy approach and its balance, because seasonality has a significant impact on the goods or services balance, for example. This is very important because there have been many cases when – due to the seasonal effects of the quarter – seasonally adjusted and unadjusted data showed different developments in the economy. This is attributable, inter alia, to the fact that a significant portion of agricultural products is exported during the summer and autumn months. At the same time, it is also worth mentioning that following the crisis the reweighting of economic sectors – with electronics losing out and the automotive industry gaining weight, as a result of their different seasonalities – had an impact on the seasonality of economic developments as well. In respect of services, thinking of the turnover of tourism/catering, it seems clear that the examination of seasonally unadjusted data could be extremely misleading. By contrast, with the application of seasonal adjustment we can observe and analyse the changes in underlying developments. It may also occur that for some reason a seasonal adjustment cannot be made (e.g. too short time series). In this case, we usually examine four-quarter cumulative indicators. Compared to raw quarterly data, this has the advantage of eliminating the effect of seasonality. However, one disadvantage is that the data content of the last quarter is reduced by the other three quarters, and thus only limited statements can be made about the latest quarter. In fact, in this case what we examine is to what extent the data of the quarter under review deviate from the data of the same quarter of the previous year, i.e. the quarter that has a seasonally identical factor. It is also worth emphasising that it is advisable to look at the balance of payments data – especially in international comparisons – taking into account the size, usually the GDP, of the given economies.

38 | MNB Handbooks • Balance of Payments
The data of the financing approach do not have seasonality, as its degree depends on capital flows. Financial account data typically have no seasonality, contrary to real economy data. At the same time, there are certain sub-items of the financial account where significant and stable seasonality is observed, e.g. reinvested earnings. Companies’ income is produced continuously during the year, and before it is paid to non-resident investors, it increases non-residents’ capital investments in Hungary as reinvested earnings, i.e. it leads to a gradual inflow of funds. Companies typically decide on the dividends to be paid during the second quarter. Accordingly, non-residents’ profit repatriation is related to this period, which also implies a decline in reinvested earnings (or even a decrease in stock investment when high dividends are disbursed).
Chart 7Seasonally unadjusted and adjusted net lending and foreign trade(as a proportion of GDP)
–10
–8
–6
–4
–2
0
2
4
6
8
10
–10
–8
–6
–4
–2
0
2
4
6
8
10
Per cent Per cent
Trade balanca (sa)
Net lending (sa)Net lendindg (nsa)
Trade balance (nsa)
2008
Q1
2008
Q2
2008
Q3
2008
Q4
2007
Q1
2007
Q2
2007
Q3
2007
Q4
2006
Q1
2006
Q2
2006
Q3
2006
Q4
2009
Q1
2009
Q2
2009
Q3
2009
Q4
2010
Q1
2010
Q2
2010
Q3
2010
Q4
2011
Q1
2011
Q2
2011
Q3
2011
Q4
2012
Q1
2012
Q2
2012
Q3
2012
Q4
2013
Q1
2013
Q2
2013
Q3
2013
Q4
2014
Q1
2014
Q2
2014
Q3
2014
Q4
2015
Q1
2015
Q2
2015
Q3
2015
Q4

Analytical framework | 39
Now that we have reviewed the theoretical and analytical frameworks as well as the items of the balance of payments, the next section presents some examples related to balance of payments crises, and we also discuss some of the ‘puzzles’ of international economics, attempting to approach them from the aspect of the balance of payments.
40 | MNB Handbooks • Balance of Payments
4 Case studies
4.1 Impact of the 2008 crisis in Hungary
Prior to the outbreak of the 2008 financial crisis, the Hungarian economy was characterised by a significant deficit in the balance of payments. However, whereas in the early 2000s this was mainly financed by FDI inflows, in the pre-crisis years external indebtedness became increasingly typical. Prior to the crisis, Hungary’s current account deficit was high, similarly to that of converging economies, as due to the economic transformation and the economic environment with its relative shortage of capital, there was demand for higher investment than what could be achieved from domestic savings. In addition, the increase in credit borrowing as a result of the easing of liquidity constraints also allowed for an expansion in consumption exceeding the income. Funding for the trade deficit stemming from the above was first provided by direct investments of non-resident economic agents, and then by an increase in foreign loans in parallel with an upturn in FX lending to households (Chart 8). Moreover, the profits on non-residents’ equities in Hungary and the interest paid on foreign loans, in addition to the trade deficit, further impaired the current account balance of the Hungarian economy through the deficit of the income balance. An increasing portion of the loans borrowed from abroad (which were channelled by the banking sector to households in the form of foreign currency loans) was spent on consumption, i.e. not on investment that adds to potential growth. Therefore, loans from abroad did not improve the debt servicing ability of the country. Overall, the Hungarian economy was in an extremely unfavourable situation upon the outbreak of the 2008 crisis, as the functioning of the economy depended on the inflows of external funds, while due to the previous years’ balance of payments deficits the external indebtedness of the country was unusually high.

Case studies | 41
The exhaustion of external funding following the outbreak of the crisis forced the Hungarian economy to adjust, which resulted in a significant improvement in the trade balance. As a result of the sharp increase in uncertainty during the financial crisis, external sources of funding dried up. Therefore, the state had to borrow from the IMF and the EU, and domestic banks were also no longer able to channel external funds to the private sector. However, in parallel with that, it is also true that the corporate sector was unwilling to borrow because of the fall in external and domestic demand, while the household sector refrained from borrowing in view of rising unemployment, falling incomes and higher instalments resulting from the depreciation of currency rates as well as the increasing uncertainty. In parallel with the financing crisis due to the exhaustion of external funds, the real economy also faced a serious crisis. As a result of the decline in incomes and increase in uncertainty, the downturn in lending reached a level when both the household and corporate sectors became net loan repayers, while both household consumption and investment declined (Chart 9). The fall in
Chart 8Financing the net borrowing(as a proportion of GDP)
–10
–8
–6
–4
–2
0
2
4
6
8
10
12
14
–10
–8
–6
–4
–2
0
2
4
6
8
10
12
14 Per cent Per cent
Net lending = Outflow of funds
Net borrowing = Inflow of funds
1998
1999
2000
2001
2002
2003
2004
2005
2006
2007
2008
2009
2010
2011
2012
2013
2014
2015
Debt-type fundsNon-debt type funds
DerivativesNet borrowing (from financing side)

42 | MNB Handbooks • Balance of Payments
domestic absorption led to a significant decrease in imports, considerably improving the trade balance. Another aspect of the effects of the crisis was that households’ savings increased in parallel with the downturn in consumption, already allowing domestics savings to satisfy investment, which had declined as a result of the crisis, and all this suggested that the current account deficit, which had previously been substantial, may cease to exist.
In addition to the improvement in the trade balance, the decline in profits during the crisis and the increase in EU transfers also contributed to the fact that the previously significant net borrowing turned into net lending, which allowed the repayment of foreign loans borrowed prior to the crisis to start. In addition to the adjustment of the Hungarian economy, the crisis improved the current account balance via the reduction of the deficit on the income balance as well. This was because the decline in corporate profitability due to the crisis also affected the profits of foreign-owned companies operating in Hungary, as a result of which the deficit on the income balance
Chart 9Household consumption expenditure and fixed capital formation(1997 = 100)
100
110
120
130
140
150
160
100
110
120
130
140
150
160
1997
1998
1999
2000
2001
2002
2003
2004
2005
2006
2007
2008
2009
2010
2011
2012
2013
2014
2015
Per cent Per cent
Consumtpion expenditure of householdsGross capital formation
Source: HCSO

Case studies | 43
declined (Chart 8). In addition, a trend that was independent of the crisis also improved the net lending of the Hungarian economy to a considerable extent: the new EU budget cycle between 2007 and 2013 brought much more EU funds to Hungary than the previous period. Accordingly, following the outbreak of the crisis, net lending increased steadily, and the country became a net creditor (Chart 10). From the financing side, this trend meant that the significant inflows of external funds, which had been typical before, were followed by the repayment of foreign loans, i.e. external indebtedness, which was especially responsible for the impacts of the crisis faced by Hungary, could start to decline (the repayment of the external debt is shown in Chart 8 by the shift in debt-type items into the negative range).
We consider it important to repeatedly call the attention to the fact that due to the identity of the developments indicated by the balance of payments, various interpretations are possible in connection with the
Chart 10Factors of net lending(as a proportion of GDP)
–10
–5
0
5
10
15
–10
–5
0
5
10
15
1998
1999
2000
2001
2002
2003
2004
2005
2006
2007
2008
2009
2010
2011
2012
2013
2014
2015
Per centPer cent
Balance of goods and servicesTransfer balance
Income balanceNet lending

44 | MNB Handbooks • Balance of Payments
developments that took place in the Hungarian economy during the crisis. As we explained above, on the one hand, we can say that as a result of the trade surplus that evolved, the sectors were able to start repaying their foreign loans. On the other hand, it is also true that as the household and corporate sectors could not or did not want to borrow due to the increasing uncertainty and shortage of funds during the financial crisis, consumption and investment remained low, and as a result, with subdued imports the previously typical trade deficit turned into a surplus.
4.2 Balance of payments crises – international examples
As mentioned in the introduction as well, the balance of payments crises of past decades also underlined the importance of the analysis of statistics. The following section presents some events from past decades, relying upon one of the studies of the MNB. A common phenomenon in the crises of individual countries is that the current account deficit was financed for an extended period of time by inflows of foreign funds without any problem, and then, as a result of a change in the external environment or the questioning of the belief in the sustainability of domestic economic developments, the inflow of foreign funds declined, forcing an adjustment process in the economy of the given country and simultaneously causing a real economy crisis as well.
4.2.1 Mexico, 1995
The crisis in Mexico evolved following the deregulation and consolidation that took place in the late 1980s. The exchange rate of the peso was pegged to the US dollar, which significantly increased the inflows of FDI-type funds and debt-type liabilities. The predictable exchange rate increasingly directed companies and households towards indebtedness in foreign currency. The considerably easing fiscal discipline, the unexpected and significant interest rate hike by the Fed as well as the instability that evolved within the country all contributed to the depreciation of the peso. In addition, due to the high inflation, the appreciation of the real exchange rate led to a major deficit on the goods balance. All of this resulted in a substantial deficit on the balance of

Case studies | 45
payments, as imported products were relatively cheap compared to domestic goods. The central bank used the reserves to protect the currency of the country, and the state issued short-term government securities tied to the US dollar exchange rate, by which it also replaced some peso-denominated securities, thus taking a significant foreign-exchange risk. However, due to the aforementioned risks and the Fed’s interest rate hike, foreign capital started to leave the country, and thus the roll-over of the expiring government debt became a serious problem for the budget. In the end, the Mexican central bank was unable to keep the exchange rate of the peso within the band, and only the credit granted jointly by the IMF and the World Bank was able to provide a permanent solution to the problem.
4.2.2 Argentina, 2002
In the early 2000s, the Argentine economy also experienced a similar crisis period. Starting from the 1990s, a currency board operated in Argentina. However, due to the relatively small openness of the economy, by the late 1990s it became more of a burden than help for the economy. This was exacerbated by the depreciation of the currency of Brazil, an important trading partner of Argentina, while the US dollar continued to strengthen. For lack of domestic adjustment, this shock proved to be persistent, resulting in a downturn in capital inflows. In 2001, the purchasing of government bonds by banks became mandatory, and thus the problems with the state’s solvency seriously affected the banking sector as well. The loss of domestic depositors’ confidence resulted in deposit withdrawals and a bank panic, also making foreign investors decide to pull their investments. Due to the increase in government debt resulting from the depreciation, the state declared itself insolvent, in spite of the help received from the IMF.
4.2.3 Czech Republic and Slovakia, 1998
The symptoms observed in 1997 and 1998 in the Czech Republic were less serious, but typical of balance of payments crises. Although the budget was balanced, the high state ownership in the banking sector and the insolvency of companies that accumulated significant arrears caused difficulties. Basically, these problems developed due to the inadequate restructuring of the government sector, which had previously been larger. The high investment
46 | MNB Handbooks • Balance of Payments
rate entailed a balance of payments deficit, financed mainly by foreign loans; moreover, their maturities were shorter and shorter. However, during the Asian and Russian crises, foreign capital practically stopped flowing in, resulting in a major depreciation of the country’s currency.
A similar, minor crisis took place in Slovakia as well in the late 1990s. It was also caused by the bad portfolio quality of the loans of the banking sector as well as by the significant net borrowing position of the state and the private sector (mainly companies). At the same time, following the events in Asia, Russia and the Czech Republic, spending by the government and private sectors could no longer rely upon foreign funds, and thus internal adjustment by the sectors of the economy was necessary. Although later the balance of payments deficit was significant again, by then the balance of payments deficit had evolved in parallel with higher FDI inflows and lower debt repayment, indicating a more sustainable structure.
4.2.4 The internal balance of payments crisis of the euro area
Although the current account of the European Union was roughly balanced in the pre-crisis years, this was the result of northern countries’ significant surplus and Mediterranean countries’ considerable deficit. Following the 2008 financial crisis, the balance of payments imbalances that evolved within the European Union played a role in the deepening of the crisis of European countries. Prior to the crisis, the balance of the EU28 member countries vis-à-vis the rest of the world was balanced, at close to zero, although within the area significant differences in current accounts were observed across countries and country groups. It means that within the Union the deficit of certain countries may largely be compared to the surplus of other countries of the Union. While in the pre-crisis years the balances of the ‘northern’ countries (Finland, Sweden, Denmark and Germany) showed significant surpluses, in the southern countries (Portugal, Italy, Greece and Spain) the current account deficit was high already in the early 2000s, and grew further in the pre-crisis years, in parallel with an increase in external debt.

Case studies | 47
Accordingly, the financial crisis affected individual euro-area countries in different ways, and managing the crisis posed a challenge to the common monetary policy. The outbreak of the financial crisis entailed a decline in the willingness to take risks, making it more difficult for countries with high net borrowing to access funds. As of 2009, in the ‘northern’ countries the current account surplus continued to be significant, while the deficit of the southern countries started to decline in parallel with the adjustment of domestic sectors (decrease in consumption and investment).
Chart 11Current account balances of the northern and Mediterranean countries of the Union and EU member countries(as a proportion of GDP)
–8
–6
–4
–2
0
2
4
6
8
–8
–6
–4
–2
0
2
4
6
8
2002 2003 2004 2005 2006 2007 2008 2009 2010 2011 2012 2013 2014 2015
Per cent Per cent
Mediterranian countriesNorthern countriesBalance of EU28 countries with other countries

48 | MNB Handbooks • Balance of Payments
Considerable adjustment took place in the Mediterranean countries in the years following the crisis, and current account balances turned into surplus, which took place in parallel with a fall in domestic absorption. As of 2010, increased emphasis on the debt crisis and unfinanceable government debts required further adjustment of the domestic sectors, while the budget deficit declined continuously in the southern countries. As a result, by 2013 the southern countries of the European Union also recorded current account surpluses. Looking at the current EU28 member countries, in the years following the outbreak of the financial crisis, like in other countries of the world, the current account balance – similarly to the pre-crisis period – rose to close to zero again and already showed a surplus in 2012 and 2013.
Based on the experiences of the crisis, the European Commission realised that imbalances should be analysed in a more complex manner, as a result of which the Macroeconomic Imbalance Procedure (MIP) was developed. The crisis highlighted that although no problem was seen concerning the
Chart 12Budget deficit, investment and consumption volumes of the Mediterranean countries of the Union
–14
–12
–10
–8
–6
–4
–2
0
2
4
6
–14
–12
–10
–8
–6
–4
–2
0
2
4
6
2006 2007 2008 2009 2010 2011 2012 2013 2014 2015
Per cent Per cent
Consumption expenditure of households’Gross capital formationGovernment’s deficit

Case studies | 49
EU as a whole, the balance of the current account plays an considerably important role within the Union as well. Reacting to the crisis, stricter supervision of Member States’ fiscal policies was introduced, and in 2011 the European Commission elaborated a macroeconomic imbalance procedure, the objectives of which include the economic and financial assessment of EU Member States as well as the early identification and adjustment of excessive imbalances. As a part of this procedure, in order to identify potential imbalances, every year the European Commission prepares a report with the help of a scoreboard that contains important economic indicators, examining, inter alia, the countries’ balances of payments positions.
Data suggest that in the countries of the European Union net lending changes in proportion to per capita GDP. However, in the years following the crisis, tighter fiscal policy and lower consumption by domestic sectors entailed an increase in net savings. Following from the characteristics of the balance of payments discussed earlier, in countries where the per capita GDP is higher, the overall balance of the balance of payments (combined current and capital account balance) is also higher. This is presumably attributable to the fact that in the countries where the per capita GDP is higher, capital accumulation exceeds that of lower-GDP countries. This correlation remained true in the pre- and post-crisis years as well. At the same time, significant adjustment was observed during the crisis: in the Mediterranean and CEE countries, which had previously had substantial external deficits and had become increasingly indebted abroad, these developments decelerated considerably in the years following the crisis. Moreover, in many cases there was a shift to a high net lending position, i.e. debt repayments. In the southern countries, this was mainly the result of a tightening of the previously loose fiscal policy, which, for example in Hungary, was supported by significant debt repayments by the private sector and in particular by the household sector. Accordingly, while previously these liabilities had been built up in these countries, their decline was observed in the post-crisis years.

50 | MNB Handbooks • Balance of Payments
4.3 Puzzles of international economics
There are a number of assumptions and problems in international economics for which complete explanations corroborated by models have not yet been found and which constitute further areas of development for those interested. Closing our handbook, we highlight some of these kinds of ‘puzzles’ of international economics related to the balance of payments.
4.3.1 Global balance of payments deficit
Theoretically, the result of adding up the current account balances of all the countries should be zero, as the exports of a country appear as imports in another country, and capital flows as well as income transfers behave in a similar manner. Nevertheless, the facts show something else: in 2012, for example, the total balance of payments surplus of the world amounted to nearly 400 billion dollars. The issue of the global imbalance of the balance of payments is also especially interesting because the surplus, which amounted
Chart 13Correlation between the level of development and net lending
BE
CZ
DKDE
EE
IE
ES
FR
CR
IT
LV
LT
HU
MT
NL
AT
PL
PTRO
SL
SK
FI
SE
UK
BECZ
DKDE
EE
IEES FR
CR
IT
LV LT
HU
MT
NL
AT
PLPT
RO
SL
SK FI
SE
UK
–15
–12
–9
–6
–3
0
3
6
9
12
0 5,000 10,000 15,000 20,000GDP per capita (PPS)
25,000 30,000 35,000 40,000
Net
lend
ing
(in p
erce
nt o
f GDP
)
Average of 2004–2008Average of 2009–2015

Case studies | 51
to nearly one half of a per cent of global GDP in 2012, replaced a similar-sized deficit from the early 2000s, i.e. adding up the balances of individual countries resulted in a globally similar degree of deficit. Usually, measurement errors are mentioned as the reasons for the imbalance: for example, it is probably easier to identify the exports of financial and legal services than their imports (as service provider companies are bigger than the users, and become more easily included in the surveys measuring foreign trade). The delayed appearance of deliveries also justifies the global surplus: for example, items on the way in December may already increase Chinese exports, but as they have not arrived in the receiving country, they do not yet appear on the import side.
4.3.2 The Feldstein–Horioka puzzle
Assuming open economies, one could think that investment projects in the world are implemented where they bring the highest profits. With open economies, this is made possible by the balance of payments surplus and deficit: namely, in open economies the disposable and thus spendable incomes do not correspond to the produced incomes of the economy; they are increased or reduced by the overall balance of the balance of payments. Accordingly, one could think that in developed economies the correlation between savings and investment is relatively weak. Nevertheless, Feldstein and Horioka observed that in the 1960s and 1970s there was an almost unit correlation between the investment and savings rates, i.e. investment depends on the savings of the economy to a great degree. Various explanations were given for the high coefficient; inter alia, differences in tax systems and information asymmetries may also result in high correlation. At the same time, recent studies pointed out that in the past decades this correlation has declined, in parallel with an increase in the mobility of capital.
4.3.3 Home bias in foreign trade
The issue was raised upon the examination of the magnitude of the trade relations between Canada and certain states of the United States. It was found that the states within Canada continue to trade with one another to a much greater extent than with their neighbours located in the United States even after the introduction of the free trade agreement, taking account of other explanatory variables as well. Basically, a solution to the puzzle is
52 | MNB Handbooks • Balance of Payments
fundamentally justified by the commercial costs, the lack of market knowledge and by consumers’ willingness to trade off.
4.3.4 Home bias in share portfolios
At the end of the 1980s, French and Poterba observed that in spite of the openness of international capital markets, investors invest in foreign financial assets to a much lower degree than what is calculated to be optimal by the models developed for determining it. In that period, 94 per cent of US investments and nearly 98 per cent of Japanese investments were related to the home country. Firstly, the lower rate of investing abroad may be explained by the distances of the investments. Secondly, domestic investments are often in small companies that do not participate in foreign trade; the relevant explanation is usually found in information asymmetry. In addition, the tax systems of certain countries also encourage investors to invest at home.
4.3.5 Correlation of consumption across nations
As seen above, investors of a country mostly purchase the shares of their own country, and over the long run the investment and savings rates are also not different in the territory of a country. At the same time, it would also be logical if investors kept their assets diversified in the world, thus eliminating the shocks occurring in individual countries and smoothing out their respective consumption paths over the time horizon. This would result in a high correlation of the consumption paths observed in countries, as due to the diversification the shocks that affect only certain countries would affect not only the inhabitants of the given country but the inhabitants of the other countries as well in a similar manner. Of course, a global shock would also affect everybody to the same degree. Contrary to this expectation, empirical findings are that there is much lower correlation between the domestic consumption of individual countries.
4.3.6 Direction of capital flows
Although one could consider it logical that capital flows from richer countries to poorer countries, in reality it is not necessarily so. The original assumption is corroborated by the declining size of the marginal product of capital, i.e. with a higher amount of capital, one unit of capital increase produces less

Case studies | 53
surplus product. Therefore, assuming that in richer countries the amount of accumulated capital is higher, the question arises as to how it is still possible that many of the largest economies have balance of payments deficits. However, when looking at the marginal product of capital, it is also important to take into account human capital, the available technologies and the level of technological development. Taking account of these, it seems less strange that, for example, the United States is financed with large amounts by China. Another possible explanation is the cautiousness of investors. Countries that are less equipped with capital are often less stable at the same time, and political tensions – more rarely even riots – may occur more frequently. Accordingly, for a risk-averse investor the safety of its investment may also have a significant weight when making the investment decision.

54 | MNB Handbooks • Balance of Payments
References
Coval, J. D. – Moskowitz, T. J.: Home bias at home: Local equity preference in domestic portfolios. The University of Chicago Graduate School of Business, Selected Paper no. 85
Farkas, P. (2011): Haladó nemzetközi pénzügyek (Advanced international fi-nances). Széchenyi István University, Győr
The Economist (2011): Exports to Mars – Official statistics probably exaggerate global current-account imbalances. The Economist, 12 November. http://www.economist.com/node/21538100
Giannone, D. – Lenza, M. (2008): The Feldstein–Horioka fact, ECB Working Pa-per Series, No. 873., February. https://www.ecb.europa.eu/pub/pdf/scpwps/ecbwp873.pdf
Hamar, J. (2000): Magyarország külkereskedelmének 1988–1998 közötti alakulása és az EU-csatlakozás várható hatásai (Hungarian foreign trade be-tween 1988–1998 and prospects after the EU accession). MTA Közgazdaságtu-dományi Kutatóközpont (Centre for Economic and Regional Studies, Hungar-ian Academy of Sciences)
Hoffmann, M. – Kóczián, B. – Koroknai, P. (2013): Developments in the exter-nal balance of the Hungarian economy: indebtedness and adjustment. MNB Bulletin Special Issue, October https://www.mnb.hu/letoltes/hoffmann-koc-zian-koroknai.pdf
IMF (2014): IMF Committee on balance of payments statistics 2013 Annual Report. International Monetary Fund. June, http://www.imf.org/external/pubs/ft/bop/2013/ar/bopcom13.pdf
IMF (2009): Balance of Payments and International Investment Position Manual Sixth Edition (BPM6). International Monetary Fund. Washington D.C. https://www.imf.org/external/pubs/ft/bop/2007/pdf/bpm6.pdf
Krugman, P. R. – Obstfeld, M. (2003): Nemzetközi gazdaságtan – Elmélet és gazdaságpolitika (International Economics: Theory and Policy). Budapest, Panem Könyvkiadó.

Case studies | 55
Mankiw, G. N. (2010): Macroeconomics, 7th Edition. Worth Publishers.
MNB (2012): Hungary’s balance of payments and international investment position statistics (international methodology and national practice) 2012. Magyar Nemzeti Bank. https://www.mnb.hu/letoltes/hungary-s-balance-of-payments-2012-final-1.pdf
MNB (2014): Hungary’s balance of payments and international investment po-sition statistics (revised international methodology and national practice), 2014 Magyar Nemzeti Bank. https://www.mnb.hu/letoltes/hungary-s-balance-of-pay-ments-and-international-investment-position-statistics-2014hungary-1.pdf
MNB (2014): Report on the Balance of Payments. Magyar Nemzeti Bank. April https://www.mnb.hu/letoltes/report-on-the-balance-of-payments.pdf
MNB (2014): Report on the Balance of Payments. Magyar Nemzeti Bank. July https://www.mnb.hu/letoltes/bop-report-2014q1-web.pdf
MNB (2015): Annual Report, 2014. Magyar Nemzeti Bank. https://www.mnb.hu/letoltes/mnb-annual-report-2014.pdf
Molnár, L. (2003): Az alulértékelt valutaárfolyam hatása a foglalkoztatottságra (Impact of the undervalued currency rate on employment). Faculty of Eco-nomics and Social Studies, College of Nyíregyháza
Obstfeld, M. – Rogoff, K. (2001): The Six Major Puzzles in International Macro-economics: Is There a Common Cause?, NBER Macroeconomics Annual 2000, Volume 15, January pp.: 339–412http://www.nber.org/chapters/c11059.pdf
Obstfeld, M. – Rogoff, K. (1994): The intertemporal approach to the current account. NBER Working Paper, No. 4893, Octoberhttp://www.nber.org/papers/w4893.pdf
Tóth, M. B. (2005): Jelentős külső egyensúlytalanságok következményei – nemz-etközi tapasztalatok (Consequences of significant external imbalances – inter-national experiences), MNB Háttértanulmányok (Background Studies), 2005/5, August, Magyar Nemzeti Bank https://www.mnb.hu/letoltes/ht2005-5.pdf
Benke, D. (2008): Amikor a forint “nagykorú” lett (When the forint “came of age”). Világgazdaság, 16 Dec 2008http://www.vg.hu/penzugy/vg_online/penzugyek_-_belfold/081216_kontvetibilis_253080

56 | MNB Handbooks • Balance of Payments
Annex: Hungary’s balance of payments statistics 2007–2010
Million euros 2007 2008 2009 2010 2014. Q1.
1. CURRENT ACCOUNT, NET (1.A+1.B+1.C) –7 219 –7 620 –754 274 984
1.A. Goods and Services, net 504 386 3 796 5 260 1 989
Exports 77 714 85 798 70 132 80 780 22 714
Imports 77 210 85 412 66 336 75 519 20 725
1.A.a. Goods, net –402 –924 2 622 2 616 1 158
Exports 65 291 71 845 56 831 66 130 18 865
Imports 65 694 72 770 54 209 63 514 17 707
1.A.b. Services, net 907 1 310 1 174 2 644 831
Exports 12 423 13 952 13 301 14 650 3 849
Imports 11 516 12 642 12 127 12 005 3 018
1.B. Primary income, net –6 567 –6 712 –4 296 –4 623 –775
1.B.1. Compensation of employees, net 726 719 310 622 223
1.B.2. Investment income, net –7 946 –8 162 –5 648 –6 251 –1 312
1.B.2.1. Direct investment income, net –5 640 –5 009 –3 357 –4 264 –751
1.B.2.2. Portfolio investment income, net –1 681 –2 280 –1 673 –1 637 –521
1.B.2.3. Other investment income, net –624 –1 592 –1 359 –1 153 –191
1.B.2.4. Reserve assets, net 0 719 742 802 151
1.B.3. Other primary income, net 653 731 1 042 1 006 314
1.C. Secondary income, net –1 157 –1 293 –255 –364 –229
-of which: EU transfers –733 –413 13 99 12
2. CAPITAL ACCOUNT, NET 708 1 032 1 654 1 796 569
-of which: EU transfers 846 921 1 603 2 193 552
3. FINANCIAL ACCOUNT (NET ASSETS) (3.1+3.2+3.3+3.4+3.5)
–6 149 –8 979 251 1 105 1 328
3.1. Direct investment (net assets) 286 –2 411 –153 –762 –636
3.1.k. Abroad (net assets) 3 138 1 781 1 324 906 596
3.1.1.k Equity (net assets) 3 008 1 801 838 976 595
3.1.1.1.ki Equity other than reinvestment of earnings (net assets)
2 264 2 535 766 870 382
3.1.1.2.ki Reinvestment of earnings (net assets)
745 –734 72 106 213

Annex | 57
Million euros 2007 2008 2009 2010 2014. Q1.
3.1.2.ki Debt instruments (net assets) 129 –20 486 –70 1
3.1.2.1.ki Assets 115 147 764 –125 –20
3.1.2.2.ki Liabilities –15 167 278 –55 –21
3.1.t In Hungary (net liabilities) 2 852 4 192 1 477 1 668 1 232
3.1.1.t Equity (net liabilities) 3 118 4 167 –1 810 2 968 1 024
3.1.1.1.be Equity other than reinvestment of earnings (net liabilities)
844 3 272 –1 618 3 155 355
3.1.1.2.be Reinvestment of earnings (net liabilities)
2 274 895 –192 –186 669
3.1.2.be Debt instruments (net liabilities) –266 25 3 287 –1 300 208
3.1.2.1.be Assets 3 744 2 268 4 074 –255 598
3.1.2.2.be Liabilities 3 478 2 293 7 362 –1 555 806
3.2. Portfolio investment (net assets) 1 627 2 529 3 590 264 –903
3.2.k Assets 2 125 2 517 736 380 162
3.2.t Liabilities 498 –12 –2 854 116 1 064
3.3. Financial derivatives (other than reserves), net assets
–838 671 –641 –625 5
3.3.k Assets –4 616 –7 888 –5 627 –4 919 –841
3.3.t Liabilities –3 778 –8 560 –4 986 –4 294 –847
3.4. Other investment (net assets) –7 357 –17 445 –9 112 –790 446
3.4.k Assets 3 911 2 288 404 –74 –239
3.4.t Liabilities 11 269 19 733 9 516 716 –685
3.5. Reserve assets 134 7 676 6 567 3 018 2 416
Memorandum:
Net external financing capacity
Net external financing capacity (CA and Capital account)
–6 511 –6 588 900 2 070 1 554
Financial account balance –6 149 –8 979 251 1 105 1 328
Difference (Net errors and omissions) 362 –2 391 –649 –965 –226
Reserve assets (stock) 16 385 24 040 30 677 33 674 36 197
Gross external debt denominated in foreign currencies (excl. direct investment debt instruments)
58 600 83 607 91 184 92 386 63 849
-o/w: General government and Central bank (S.13+S.121)
19 387 28 454 37 217 40 555 32 144
Net external debt denominated in foreign currencies (excl. direct investment debt instruments)
28 312 40 701 41 183 39 284 12 769
-o/w: General government and Central bank (S.13+S.121)
2 540 3 966 6 074 6 547 –4 696


MNB HANDBOOKS
BALANCE OF PAYMENTS
Print: Pauker–Prospektus–SPL consortium
H-8200 Veszprém, Tartu u. 6.