Embed Size (px)
Citation preview
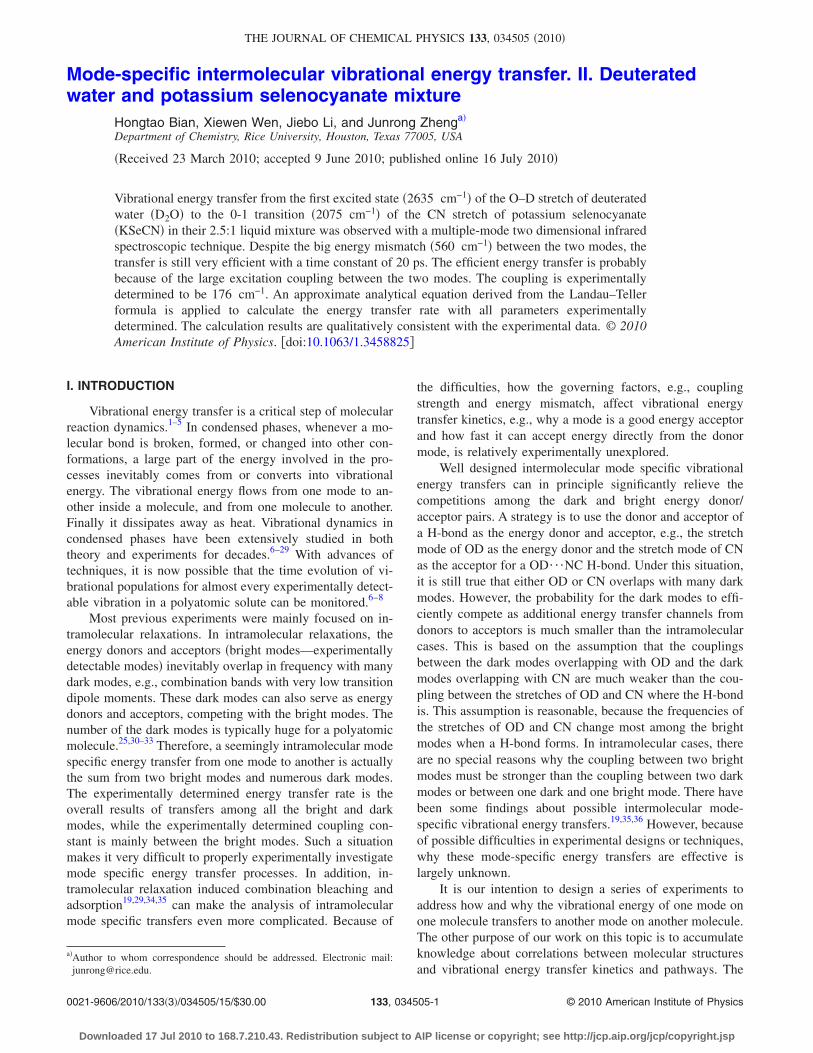
Mode-specific intermolecular vibrational energy transfer. II. Deuteratedwater and potassium selenocyanate mixture
Hongtao Bian, Xiewen Wen, Jiebo Li, and Junrong Zhenga�
Department of Chemistry, Rice University, Houston, Texas 77005, USA
�Received 23 March 2010; accepted 9 June 2010; published online 16 July 2010�
Vibrational energy transfer from the first excited state �2635 cm−1� of the O–D stretch of deuteratedwater �D2O� to the 0-1 transition �2075 cm−1� of the CN stretch of potassium selenocyanate�KSeCN� in their 2.5:1 liquid mixture was observed with a multiple-mode two dimensional infraredspectroscopic technique. Despite the big energy mismatch �560 cm−1� between the two modes, thetransfer is still very efficient with a time constant of 20 ps. The efficient energy transfer is probablybecause of the large excitation coupling between the two modes. The coupling is experimentallydetermined to be 176 cm−1. An approximate analytical equation derived from the Landau–Tellerformula is applied to calculate the energy transfer rate with all parameters experimentallydetermined. The calculation results are qualitatively consistent with the experimental data. © 2010American Institute of Physics. �doi:10.1063/1.3458825�
I. INTRODUCTION
Vibrational energy transfer is a critical step of molecularreaction dynamics.1–5 In condensed phases, whenever a mo-lecular bond is broken, formed, or changed into other con-formations, a large part of the energy involved in the pro-cesses inevitably comes from or converts into vibrationalenergy. The vibrational energy flows from one mode to an-other inside a molecule, and from one molecule to another.Finally it dissipates away as heat. Vibrational dynamics incondensed phases have been extensively studied in boththeory and experiments for decades.6–29 With advances oftechniques, it is now possible that the time evolution of vi-brational populations for almost every experimentally detect-able vibration in a polyatomic solute can be monitored.6–8
Most previous experiments were mainly focused on in-tramolecular relaxations. In intramolecular relaxations, theenergy donors and acceptors �bright modes—experimentallydetectable modes� inevitably overlap in frequency with manydark modes, e.g., combination bands with very low transitiondipole moments. These dark modes can also serve as energydonors and acceptors, competing with the bright modes. Thenumber of the dark modes is typically huge for a polyatomicmolecule.25,30–33 Therefore, a seemingly intramolecular modespecific energy transfer from one mode to another is actuallythe sum from two bright modes and numerous dark modes.The experimentally determined energy transfer rate is theoverall results of transfers among all the bright and darkmodes, while the experimentally determined coupling con-stant is mainly between the bright modes. Such a situationmakes it very difficult to properly experimentally investigatemode specific energy transfer processes. In addition, in-tramolecular relaxation induced combination bleaching andadsorption19,29,34,35 can make the analysis of intramolecularmode specific transfers even more complicated. Because of
the difficulties, how the governing factors, e.g., couplingstrength and energy mismatch, affect vibrational energytransfer kinetics, e.g., why a mode is a good energy acceptorand how fast it can accept energy directly from the donormode, is relatively experimentally unexplored.
Well designed intermolecular mode specific vibrationalenergy transfers can in principle significantly relieve thecompetitions among the dark and bright energy donor/acceptor pairs. A strategy is to use the donor and acceptor ofa H-bond as the energy donor and acceptor, e.g., the stretchmode of OD as the energy donor and the stretch mode of CNas the acceptor for a OD¯NC H-bond. Under this situation,it is still true that either OD or CN overlaps with many darkmodes. However, the probability for the dark modes to effi-ciently compete as additional energy transfer channels fromdonors to acceptors is much smaller than the intramolecularcases. This is based on the assumption that the couplingsbetween the dark modes overlapping with OD and the darkmodes overlapping with CN are much weaker than the cou-pling between the stretches of OD and CN where the H-bondis. This assumption is reasonable, because the frequencies ofthe stretches of OD and CN change most among the brightmodes when a H-bond forms. In intramolecular cases, thereare no special reasons why the coupling between two brightmodes must be stronger than the coupling between two darkmodes or between one dark and one bright mode. There havebeen some findings about possible intermolecular mode-specific vibrational energy transfers.19,35,36 However, becauseof possible difficulties in experimental designs or techniques,why these mode-specific energy transfers are effective islargely unknown.
It is our intention to design a series of experiments toaddress how and why the vibrational energy of one mode onone molecule transfers to another mode on another molecule.The other purpose of our work on this topic is to accumulateknowledge about correlations between molecular structuresand vibrational energy transfer kinetics and pathways. The
a�Author to whom correspondence should be addressed. Electronic mail:[email protected].
THE JOURNAL OF CHEMICAL PHYSICS 133, 034505 �2010�
0021-9606/2010/133�3�/034505/15/$30.00 © 2010 American Institute of Physics133, 034505-1
Downloaded 17 Jul 2010 to 168.7.210.43. Redistribution subject to AIP license or copyright; see http://jcp.aip.org/jcp/copyright.jsp
knowledge will be indispensable for nonlinear IR techniques,e.g., two dimensional �2D� IR, to determine static or tran-sient molecular structures on three dimensions, if one daythese techniques are mature enough to do the job. In ourprevious work,37 we found that the energy transfer betweentwo modes with an energy mismatch of 97 cm−1 is very slow��330 ps� despite the relatively big excitation coupling be-tween the two modes ��18 cm−1�. Quasiresonant energytransfers with smaller couplings are ten times faster.19,35 Thehuge rate difference implies the significant effect of energymismatch on the transfer rate. To further investigate how thecoupling strength and energy mismatch interplay, in thiswork, we designed a system which has one of the strongestintermolecular interactions—ion/water interaction but with avery big energy mismatch �560 cm−1� between the energydonor and acceptor. In the system—a saturated KSeCN D2Osolution with a molecular ratio D2O /KSeCN�2.5 /1 �theCN stretch of KSeCN has a very long vibrational lifetime,which is probably because of the arguable heavy atomeffect31,37,38�, the OD stretch 0-1 transition �2635 cm−1� isthe energy donor and the CN stretch 0-1 transition�2075 cm−1� of SeCN− is the acceptor. In addition, the sys-tem is also a very good example to demonstrate how inter-molecular vibrational couplings, energy transfers and relax-ations, heat, or photoproducts affect the appearances of pureabsorptive 2D IR spectra.
II. EXPERIMENTS
The optical setup is described previously.37 Briefly, a pi-cosecond amplifier and a femtosecond amplifier are synchro-nized with the same seed pulse. The synchronization jitter issmaller than 150 fs, as measured from the cross correlationof the two amplifiers’ outputs. The picosecond amplifierpumps an optical parametric amplifier �OPA� to produce�1 ps mid-IR pulses with a bandwidth of �21 cm−1 �tun-able� in a tunable frequency range from 900 to 4000 cm−1
with energy of 10–40 �J /pulse at 1 KHz. The femtosecondamplifier pumps another OPA to produce �140 fs mid-IRpulses with a bandwidth of �200 cm−1 in a tunable fre-quency range from 900 to 4000 cm−1 with energy of10–40 �J /pulse at 1 KHz. In 2D IR and pump/probe ex-periments, the picosecond IR pulse is the pump beam �pumppower is adjusted based on need�. The femtosecond IR pulseis the probe beam which is frequency resolved by a spec-trograph yielding the probe axis of a 2D IR spectrum. Scan-ning the pump frequency yields the other axis of the spec-trum. Two polarizers are added into the probe beam path toselectively measure the parallel or perpendicular polarizedsignal relative to the pump beam.39,40 Vibrational lifetimesare obtained from the rotation-free 1-2 transition signalPlife= P� +2� P�, where P� , P� are parallel and perpendicu-lar data, respectively. Rotational relaxation times are ac-quired from �= P� − P� / P� +2� P�. Viscosities were mea-sured with a Cannon–Fenske kinematic viscosity tubes,American Society for Testing and Materials �ASTM� size 25,at 23 °C under which the ultrafast experiments were con-ducted.
All chemicals were purchased from Aldrich and used as
received. Temperature dependent Fourier transform infraredspectroscopy �FTIR� measurements were performed with aThermoFisher FTIR spectrometer and a temperature control-ler from Harrick Scientific.
The structures were determined with density functionaltheory �DFT� calculations.41 The DFT calculations were car-ried out as implemented in the GAUSSIAN 98 program suite.The level and basis set used were Becke’s three-parameterhybrid functional combined with the Lee–Yang–Parr correc-tion functional, abbreviated as B3LYP, and 6-31+G�d,p�.All results reported here do not include the surrounding sol-vent and therefore are for the isolated molecules.
III. RESULTS AND DISCUSSION
A. Static information of the D2O/SeCN− complex insolution
1. Vibrational frequency of OD associated with SeCN−
ion
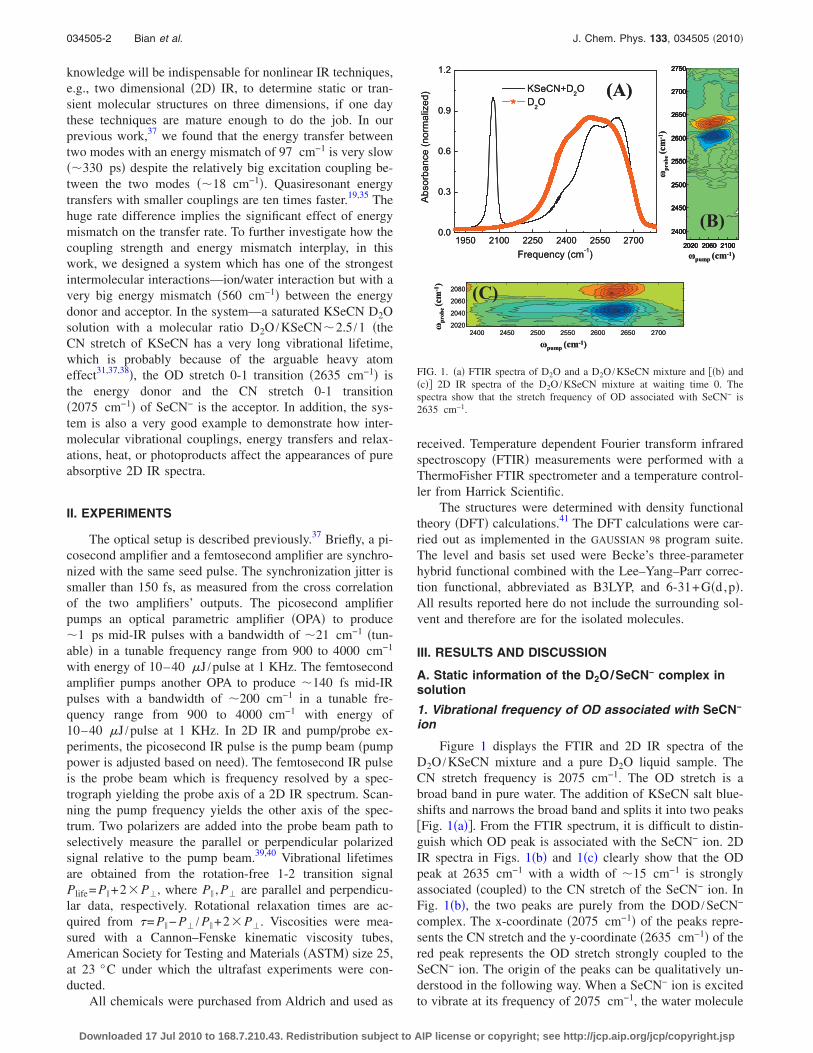
Figure 1 displays the FTIR and 2D IR spectra of theD2O /KSeCN mixture and a pure D2O liquid sample. TheCN stretch frequency is 2075 cm−1. The OD stretch is abroad band in pure water. The addition of KSeCN salt blue-shifts and narrows the broad band and splits it into two peaks�Fig. 1�a��. From the FTIR spectrum, it is difficult to distin-guish which OD peak is associated with the SeCN− ion. 2DIR spectra in Figs. 1�b� and 1�c� clearly show that the ODpeak at 2635 cm−1 with a width of �15 cm−1 is stronglyassociated �coupled� to the CN stretch of the SeCN− ion. InFig. 1�b�, the two peaks are purely from the DOD /SeCN−
complex. The x-coordinate �2075 cm−1� of the peaks repre-sents the CN stretch and the y-coordinate �2635 cm−1� of thered peak represents the OD stretch strongly coupled to theSeCN− ion. The origin of the peaks can be qualitatively un-derstood in the following way. When a SeCN− ion is excitedto vibrate at its frequency of 2075 cm−1, the water molecule
1950 2100 2250 2400 2550 27000.0
0.3
0.6
0.9
1.2
Absorbance(normalized)
Frequency (cm-1)
KSeCN+D2OD2O
(A)
2020 2060 2100
2400
2450
2500
2550
2600
2650
2700
2750
(B)
2400 2450 2500 2550 2600 2650 27002020
2040
2060
2080 (C)
�pump (cm-1)
�probe(cm-1)
�pump (cm-1)
�probe(cm-1)
1950 2100 2250 2400 2550 27000.0
0.3
0.6
0.9
1.2
Absorbance(normalized)
Frequency (cm-1)
KSeCN+D2OD2O
(A)
2020 2060 2100
2400
2450
2500
2550
2600
2650
2700
2750
2020 2060 2100
2400
2450
2500
2550
2600
2650
2700
2750
2020 2060 2100
2400
2450
2500
2550
2600
2650
2700
2750
2020 2060 2100
2400
2450
2500
2550
2600
2650
2700
2750
(B)
2400 2450 2500 2550 2600 2650 27002020
2040
2060
2080 (C)
�pump (cm-1)
�probe(cm-1)
�pump (cm-1)
�probe(cm-1)
FIG. 1. �a� FTIR spectra of D2O and a D2O /KSeCN mixture and ��b� and�c�� 2D IR spectra of the D2O /KSeCN mixture at waiting time 0. Thespectra show that the stretch frequency of OD associated with SeCN− is2635 cm−1.
034505-2 Bian et al. J. Chem. Phys. 133, 034505 �2010�
Downloaded 17 Jul 2010 to 168.7.210.43. Redistribution subject to AIP license or copyright; see http://jcp.aip.org/jcp/copyright.jsp
associated with it immediately feels the CN vibration andchanges its vibrational frequency from 2635 to 2605 cm−1
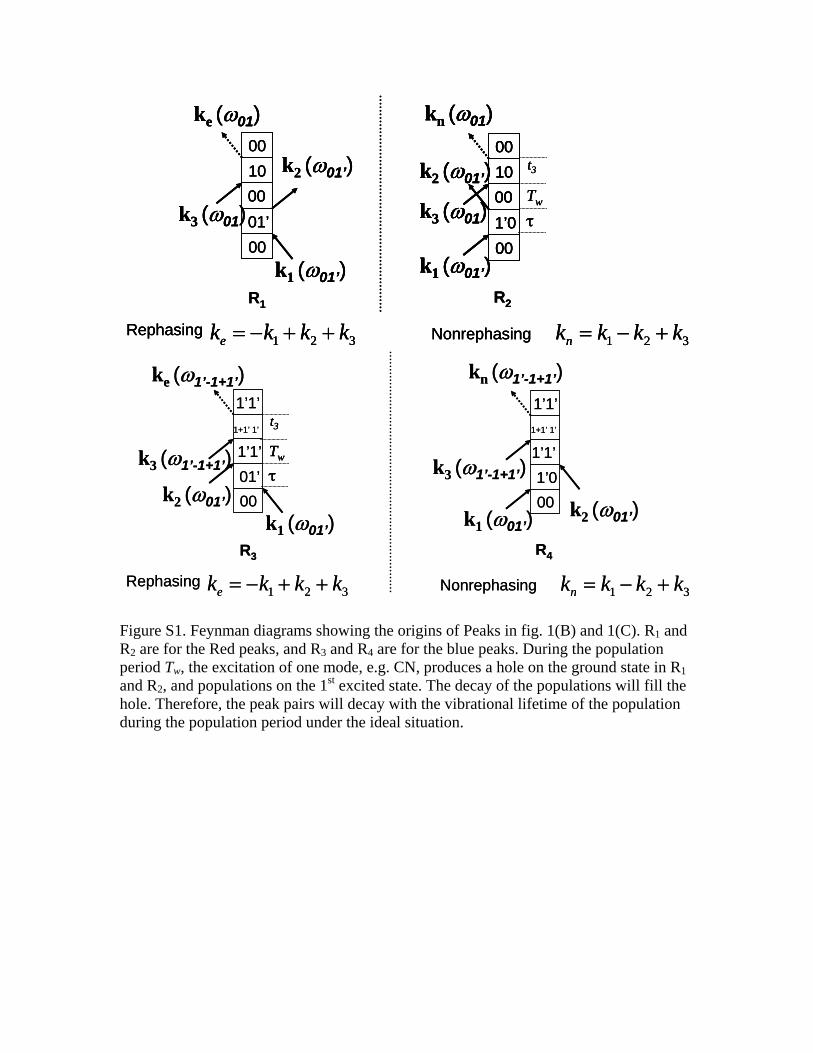
and produces a new absorption at this new frequency �theblue peak�. At the same time, the water frequency shiftleaves a ground state hole which allows more IR radiation atthe old frequency of 2635 cm−1 to go through the sample�the red peak�. More rigorously speaking, the red peak comesfrom the combination band �OD+CN� ground state bleach-ing, and the blue peak is from the combination bandabsorption.42,43 The Feynman diagrams showing the originsof the peaks are in the supporting materials. A similar expla-nation is applied to Fig. 1�c�. The difference is that in Fig.1�c�, the excitation �pump� is OD and the sensor �probe� ofthe excitation is CN.
2. Possible structure of D2O/SeCN− complex
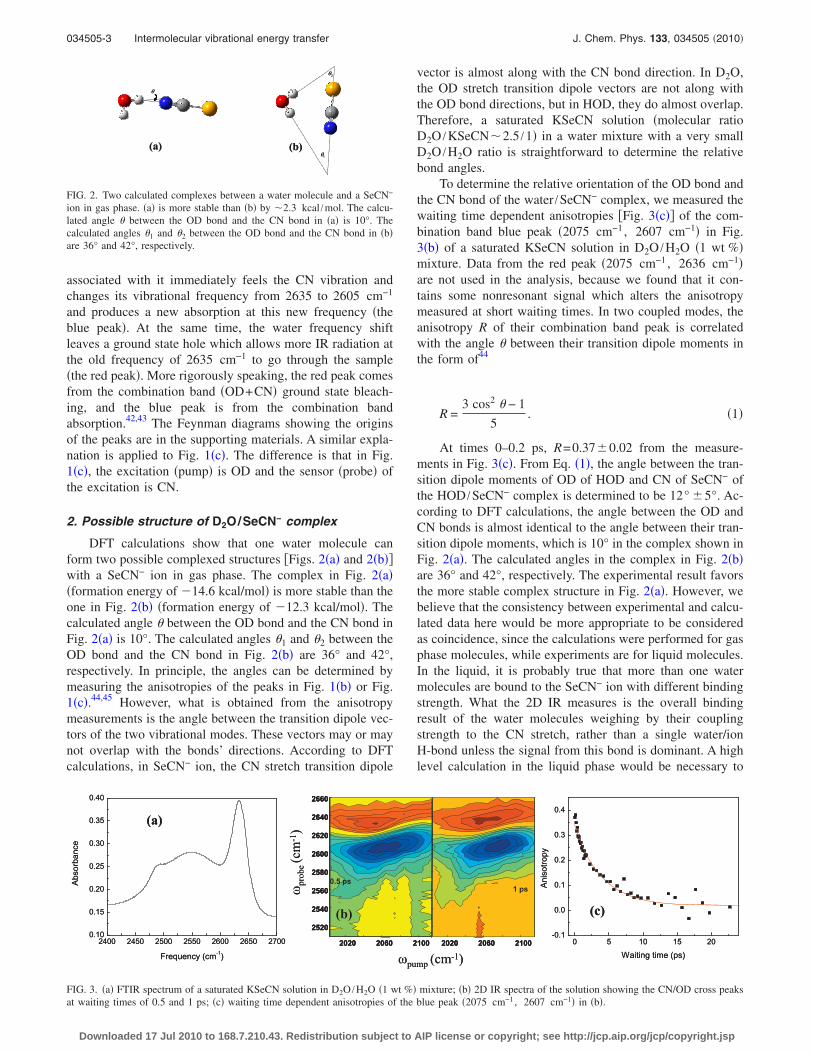
DFT calculations show that one water molecule canform two possible complexed structures �Figs. 2�a� and 2�b��with a SeCN− ion in gas phase. The complex in Fig. 2�a��formation energy of �14.6 kcal/mol� is more stable than theone in Fig. 2�b� �formation energy of �12.3 kcal/mol�. Thecalculated angle � between the OD bond and the CN bond inFig. 2�a� is 10°. The calculated angles �1 and �2 between theOD bond and the CN bond in Fig. 2�b� are 36° and 42°,respectively. In principle, the angles can be determined bymeasuring the anisotropies of the peaks in Fig. 1�b� or Fig.1�c�.44,45 However, what is obtained from the anisotropymeasurements is the angle between the transition dipole vec-tors of the two vibrational modes. These vectors may or maynot overlap with the bonds’ directions. According to DFTcalculations, in SeCN− ion, the CN stretch transition dipole
vector is almost along with the CN bond direction. In D2O,the OD stretch transition dipole vectors are not along withthe OD bond directions, but in HOD, they do almost overlap.Therefore, a saturated KSeCN solution �molecular ratioD2O /KSeCN�2.5 /1� in a water mixture with a very smallD2O /H2O ratio is straightforward to determine the relativebond angles.
To determine the relative orientation of the OD bond andthe CN bond of the water /SeCN− complex, we measured thewaiting time dependent anisotropies �Fig. 3�c�� of the com-bination band blue peak �2075 cm−1 , 2607 cm−1� in Fig.3�b� of a saturated KSeCN solution in D2O /H2O �1 wt %�mixture. Data from the red peak �2075 cm−1 , 2636 cm−1�are not used in the analysis, because we found that it con-tains some nonresonant signal which alters the anisotropymeasured at short waiting times. In two coupled modes, theanisotropy R of their combination band peak is correlatedwith the angle � between their transition dipole moments inthe form of44
R =3 cos2 � − 1
5. �1�
At times 0–0.2 ps, R=0.37�0.02 from the measure-ments in Fig. 3�c�. From Eq. �1�, the angle between the tran-sition dipole moments of OD of HOD and CN of SeCN− ofthe HOD /SeCN− complex is determined to be 12° �5°. Ac-cording to DFT calculations, the angle between the OD andCN bonds is almost identical to the angle between their tran-sition dipole moments, which is 10° in the complex shown inFig. 2�a�. The calculated angles in the complex in Fig. 2�b�are 36° and 42°, respectively. The experimental result favorsthe more stable complex structure in Fig. 2�a�. However, webelieve that the consistency between experimental and calcu-lated data here would be more appropriate to be consideredas coincidence, since the calculations were performed for gasphase molecules, while experiments are for liquid molecules.In the liquid, it is probably true that more than one watermolecules are bound to the SeCN− ion with different bindingstrength. What the 2D IR measures is the overall bindingresult of the water molecules weighing by their couplingstrength to the CN stretch, rather than a single water/ionH-bond unless the signal from this bond is dominant. A highlevel calculation in the liquid phase would be necessary to
�
2�
1�(a) (b)
�
2�
1�
�
2�
1�(a) (b)
FIG. 2. Two calculated complexes between a water molecule and a SeCN−
ion in gas phase. �a� is more stable than �b� by �2.3 kcal /mol. The calcu-lated angle � between the OD bond and the CN bond in �a� is 10°. Thecalculated angles �1 and �2 between the OD bond and the CN bond in �b�are 36° and 42°, respectively.
1 ps0.5 ps
2020 2060 2100
2520
2540
2560
2580
2600
2620
2640
2660
2400 2450 2500 2550 2600 2650 27000.10
0.15
0.20
0.25
0.30
0.35
0.40
Absorbance
Frequency (cm-1)
(a)
(b) (c)
0 5 10 15 20-0.1
0.0
0.1
0.2
0.3
0.4
Anisotropy
Waiting time (ps)�pump (cm-1)
�probe(cm-1)
2020 2060 2100
1 ps1 ps0.5 ps
2020 2060 21002020 2060 2100
2520
2540
2560
2580
2600
2620
2640
2660
2520
2540
2560
2580
2600
2620
2640
2660
2400 2450 2500 2550 2600 2650 27000.10
0.15
0.20
0.25
0.30
0.35
0.40
Absorbance
Frequency (cm-1)
(a)
(b) (c)
0 5 10 15 20-0.1
0.0
0.1
0.2
0.3
0.4
Anisotropy
Waiting time (ps)�pump (cm-1)
�probe(cm-1)
2020 2060 21002020 2060 2100
FIG. 3. �a� FTIR spectrum of a saturated KSeCN solution in D2O /H2O �1 wt %� mixture; �b� 2D IR spectra of the solution showing the CN/OD cross peaksat waiting times of 0.5 and 1 ps; �c� waiting time dependent anisotropies of the blue peak �2075 cm−1 , 2607 cm−1� in �b�.
034505-3 Intermolecular vibrational energy transfer J. Chem. Phys. 133, 034505 �2010�
Downloaded 17 Jul 2010 to 168.7.210.43. Redistribution subject to AIP license or copyright; see http://jcp.aip.org/jcp/copyright.jsp
further explore the water structures on the ion surface. None-theless, the comparison between this simple DFT calculationand experimental data provides us a qualitative picture abouta possible major H-bond structure of the SeCN− /D2O com-plex.
From Fig. 3�c�, the randomization time constant of thetransition dipole cross angle of the HOD /SeCN− complex is4.0�1 ps. This constant is very close to, but a little fasterthan, the rotational time constants of the two components ofthe complex. The rotational time constant of HOD is deter-mined to be 5.8�1 ps. The rotational time constant ofSeCN− is determined to be 4.5�0.6 ps �data, see Fig. 5�.
3. Coupling strength between OD and CN
The vibrational energy transfer from the OD stretch 0-1transition to the CN 0-1 transition is largely determined bythe coupling between the initial state and the final state�OD−CN= �1OD0CNV0OD1CN= �1ODV1CN. This couplingcan be experimentally determined assuming transition dipolecoupling mechanism, based on 2D IR measurements and anexcitation exchange model.46 According to the model,26,46,47
the coupling is correlated with the anharmonicities of the ODstretch OD=OD1-2−OD0-1=85 cm−1, the CN stretch CN
=CN1-2−CN0-1=33 cm−1, and the OD/CN combination
2100
2200
2300
2400
2500
2600
2700
2000 2100 2200 2300 2400 2500 2600 2700
0 ps
�pump (cm-1)
�probe(cm-1)
0.5 ps
(a)
12
34
56
78
2100 2200 2300 2400 2500 2600 2700
2100
2200
2300
2400
2500
2600
2700
2000 2100 2200 2300 2400 2500 2600 27002000 2100 2200 2300 2400 2500 2600 2700
0 ps0 ps
�pump (cm-1)
�probe(cm-1)
0.5 ps0.5 ps
(a)
12
34
56
78
2100 2200 2300 2400 2500 2600 2700
2075 cm-1
2042 cm-1
2635 cm-1
2550 cm-1
2605 cm-12045 cm-1
(b)
00
1CN
2CN1OD
2OD
1 1CN OD
Peak 1&7Peak 3&5
Peak 2
Peak 4
Peak 6Peak 8
20 ps
Peak 9
2075 cm-1
2042 cm-1
2635 cm-1
2550 cm-1
2605 cm-12045 cm-1
(b)
00
1CN
2CN1OD
2OD
1 1CN OD
Peak 1&7Peak 3&5
Peak 2
Peak 4
Peak 6Peak 8
20 ps
Peak 9
IR
(((( ))))(((( ))))(((( ))))
I
W
I
W
1 ~ 20psk
))))(((( ))))((((
(c)
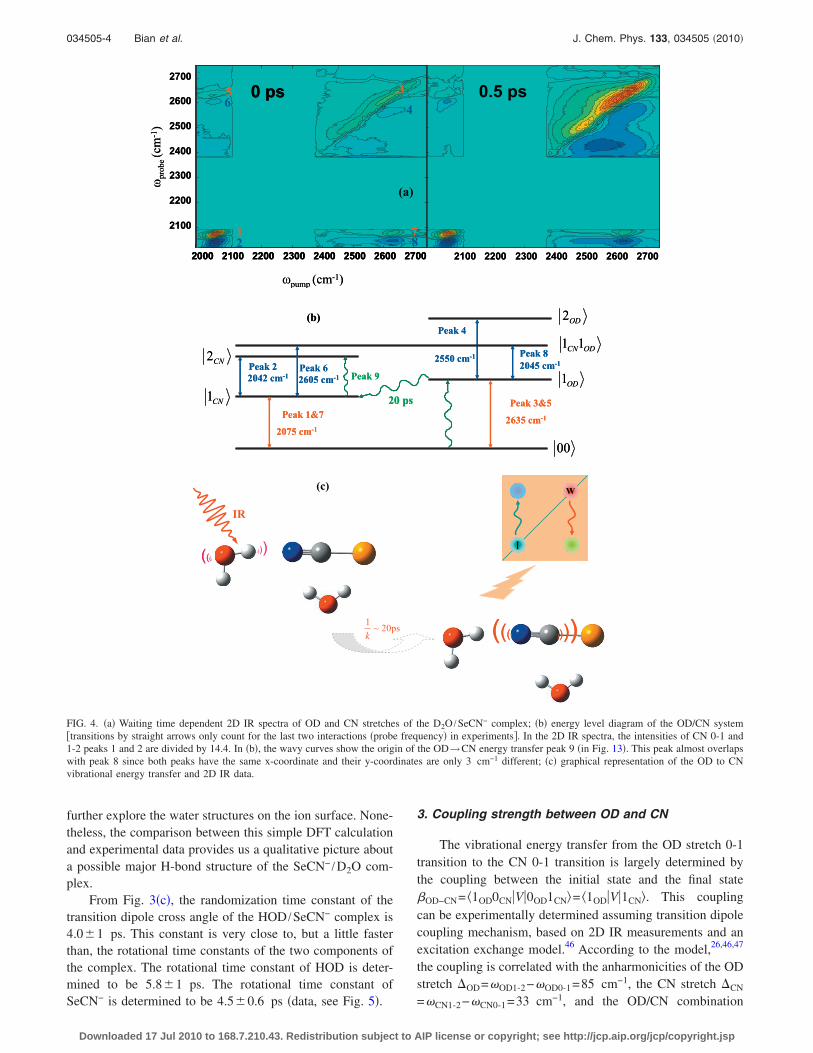
FIG. 4. �a� Waiting time dependent 2D IR spectra of OD and CN stretches of the D2O /SeCN− complex; �b� energy level diagram of the OD/CN system�transitions by straight arrows only count for the last two interactions �probe frequency� in experiments�. In the 2D IR spectra, the intensities of CN 0-1 and1-2 peaks 1 and 2 are divided by 14.4. In �b�, the wavy curves show the origin of the OD→CN energy transfer peak 9 �in Fig. 13�. This peak almost overlapswith peak 8 since both peaks have the same x-coordinate and their y-coordinates are only 3 cm−1 different; �c� graphical representation of the OD to CNvibrational energy transfer and 2D IR data.
034505-4 Bian et al. J. Chem. Phys. 133, 034505 �2010�
Downloaded 17 Jul 2010 to 168.7.210.43. Redistribution subject to AIP license or copyright; see http://jcp.aip.org/jcp/copyright.jsp

band shift OD/CN=CN0-1−1OD−OD/CN=30 cm−1, and their0-1 transition frequencies OD0-1=2635 cm−1, and CN0-1
=2075 cm−1 with the following equation:
OD/CN =2�OD−CN
2�OD + CN��OD0-1 − CN0-1��OD0-1 − CN0-1�
. �2�
The derivation of Eq. �2� is provided in the supportingmaterials. All parameters in Eq. �2� for the D2O /SeCN−
complex are experimentally determined, see Fig. 4. Theequation yields �OD−CN=200 cm−1. A more precise treat-ment to obtain the coupling constant in the local mode basiscan be obtained by directly diagonalizing the Hamiltonianmatrix of the system �see supporting materials�. The OD/CNcombination band shift OD/CN=CN0-1−1OD−OD/CN
=30 cm−1 is determined by the position difference betweenthe red peaks and blue peaks along the probe axis at an earlywaiting time before the spectral diffusion occurs in Figs. 1�b�and 1�c�. The full width at half maximum of CN is 36 cm−1
from FTIR measurement in Fig. 1�a�. The peak width alongthe pump axis is a little bigger than this value in Fig. 1�b�because of the bandwidth of the pump pulse. The CN band is
inhomogeneously broadened, as we can see from the elon-gated line shapes of peaks in Figs. 1�b� and 3�b� and spectraat early waiting times in Fig. 6. The homogeneous linewidthof CN is only �15 cm−1 from the early waiting time �e.g., 0ps� 2D IR spectra in Fig. 6.
B. Dynamic information
In the D2O /SeCN− mixture, several fast dynamics arecoupled and affect the 2D IR signal: the spectral diffusion,the exchange between ion-bound and unbound water mol-ecules, the vibrational energy exchange between the asym-metric and symmetric stretches of D2O, heating from thevibrational relaxation, rotational relaxation of molecules, andthe energy exchange between the OD stretch and the CNstretch of the two molecules. To quantitatively analyze themode specific vibrational energy transfer dynamics betweenOD and CN, the effects and kinetics of other dynamic pro-cesses listed above must be known beforehand.
0 10 20 30 40-0.1
0.0
0.1
0.2
0.3
0.4
t = 1.7 ps
Anisotropy
Waiting time (ps)
(a)
(c)
-2 0 2 4 6 8 10 12 14 16
-0.05
0.00
0.05
0.10
0.15
0.20
0.25
0.30
t = 5.8 ps
Anisotropy
Waiting time (ps)
(b)
(d)
0 10 20 30 40 50 60-0.05
0.00
0.05
0.10
0.15
0.20
0.25
0.30
0.35
0-1 transitionAnisotropy
Time Delay (ps)0 20 40 60 80 100
-0.05
0.00
0.05
0.10
0.15
0.20
0.25
0.30
0.35
0.40
0-1 transition
Anisotropy
Time Delay (ps)
FIG. 5. Anisotropy decays of ion-bound OD in a D2O /KSeCN 2.5/1 mixture �a�, in a H2O /KSeCN 2.5/1 mixture with 1% D2O �b�, and CN in a D2O /KSeCN2.5/1 mixture �c�, and in a 0.2% KSeCN D2O solution �d�.
034505-5 Intermolecular vibrational energy transfer J. Chem. Phys. 133, 034505 �2010�
Downloaded 17 Jul 2010 to 168.7.210.43. Redistribution subject to AIP license or copyright; see http://jcp.aip.org/jcp/copyright.jsp

1. Rotational dynamics and self vibrationalexchanges
The rotational dynamics of the ion-bound OD can not beobtained directly from the anisotropy measurements in theD2O /KSeCN mixture, because the resonant or quasiresonantvibrational energy transfers among ODs can facilitate aniso-tropy decay.48 Separating OD from each other with H2O canremove the effect of energy transfers and recover the rota-tional dynamics. Figure 5 displays the anisotropy decays ofion-bound OD in a D2O /KSeCN 2.5/1 mixture �a�, in aH2O /KSeCN 2.5/1 mixture with 1% D2O �b�, and CN in aD2O /KSeCN 2.5/1 mixture �c�, and in a 0.2% KSeCN D2Osolution �d�. From Fig. 5�a�, the OD anisotropy decays witha time constant of 1.7�0.1 ps in the pure D2O salt solution,while in a dilute OD solution �Fig. 5�b��, it is 5.8�1 ps. The5.8 ps is the rotational time constant of the ion-bound OD,which is consistent with a recent measurement on anothersalt solution.49 The results also indicate that the vibrationalenergy exchange among the ODs in the pure D2O salt solu-tion is �1.7 ps. The energy exchange can be seen clearlyfrom the growth of red cross peaks in Fig. 7. Situations aredifferent on the CN side. In the D2O /KSeCN 2.5/1 mixture�c�, the anisotropy decay of CN is 4.5�0.6 ps. In a 0.2%KSeCN D2O solution, it decays faster, with a time constantof 4.0�0.3 ps. The viscosity of the D2O /KSeCN 2.5/1 mix-ture is about 30% higher than that of the 0.2% KSeCN /D2Osolution. The viscosity difference counts for the differencebetween the anisotropy decays. The decay constants also im-ply that the resonance energy transfer among SeCN− ions isnot fast. It should be slower than 4.5�0.6 ps �if any�, in theD2O /KSeCN 2.5/1 mixture. This result is not very surprisingsince the ions are surrounded and separated by water mol-ecules. All the inertial anisotropy values in Fig. 5 are smallerthan 0.4. There are two possible reasons. The first one is apossible ultrafast inertial rotational decay component �within200 fs�, whose amplitude is dependent on the angular poten-tial of the molecule.50,51 The ultrafast inertial rotational de-cay component is frequency dependent. The slow rotationaldecay time constant ��1 ps� is independent of the inertial
decay amplitude.50,51 The second is the nature of the narrow-pump/broad-probe scheme of our experiments, a significantportion of the inertial signal from time zero is from delays of200–300 fs. The two possible reasons �especially the ul-trafast inertial decay� can make the structure determined byEq. �1� have a very big uncertainty range. Another possiblereason for the small inertial anisotropy values, overpumping,is ruled out by the power dependent measurements. Data arein the supporting materials.
The molecular rotations make the 2D IR signal smaller,which can add complexity in analyzing the OD/CN vibra-tional energy transfer.35 Experimentally, we can manage toobtain rotation free data �Plife= P� +2� P�� so that rotation isnot an issue in our energy transfer kinetics analysis anymore.The resonance energy transfer �if any� among SeCN− ionsdoes not affect the 2D IR signal, since the transfer is shortrange �nanometer� while the signal spot size is much bigger��200 �m�. It can be omitted in the OD/CN vibrationalexchange analysis. The energy transfers among ODs do af-fect the 2D IR signal. It will reduce the population of theion-bound OD excitation, because all OD stretches span�200 cm−1 broad while the bandwidth of the excited ion-bonded OD is only �15 cm−1. The effect can be simplytreated as an apparent vibrational decay of OD in analyzingthe OD/CN energy transfer kinetics, because 1.7 ps is muchfaster than the transfer from OD to CN �20 ps, in the kineticsanalysis part�.
2. Spectral diffusion and OD chemical exchange
The spectral diffusion characterizes frequency fluctua-tions caused by molecular motions of the solvent. Because ofthe spectral diffusion, the line shape of a diagonal peak in a2D IR spectrum evolves from elongated along the diagonalto round �or the slope is from 45° to 0°� with time.52–54 Sucha peak shape evolution can be utilized to obtain the spectraldiffusion time.52,54 Figures 6 and 7 display the time evolu-tions of the CN and OD diagonal peaks of the D2O /KSeCN2.5/1 mixture. Figure 8 displays time evolutions of the ODdiagonal peaks of the H2O /KSeCN 2.5/1 mixture with 1%
0 ps 1 ps 2 ps 5 ps 10 ps
100 ps 200 ps 300 ps 500 ps 1000 ps
2020
2040
2060
2080�probe(cm-1)
2010 2030 2050 2070 2090 2110
�pump (cm-1)2030 2050 2070 2090 2110 2030 2050 2070 2090 2110 2030 2050 2070 2090 2110 2030 2050 2070 2090 2110
2010 2030 2050 2070 2090 2110
�pump (cm-1)2030 2050 2070 2090 2110 2030 2050 2070 2090 2110 2030 2050 2070 2090 2110 2030 2050 2070 2090 2110
2020
2040
2060
2080
�probe(cm-1)
0 ps 1 ps 2 ps 5 ps 10 ps
100 ps 200 ps 300 ps 500 ps 1000 ps
2020
2040
2060
2080�probe(cm-1)
2020
2040
2060
2080�probe(cm-1)
2010 2030 2050 2070 2090 2110
�pump (cm-1)2030 2050 2070 2090 2110 2030 2050 2070 2090 2110 2030 2050 2070 2090 2110 2030 2050 2070 2090 21102010 2030 2050 2070 2090 21102010 2030 2050 2070 2090 2110
�pump (cm-1)2030 2050 2070 2090 21102030 2050 2070 2090 2110 2030 2050 2070 2090 21102030 2050 2070 2090 2110 2030 2050 2070 2090 21102030 2050 2070 2090 2110 2030 2050 2070 2090 21102030 2050 2070 2090 2110
2020
2040
2060
2080
�probe(cm-1)
2020
2040
2060
2080
�probe(cm-1)
FIG. 6. Time dependent 2D IR spectra of a D2O /KSeCN 2.5/1 mixture showing the CN stretch 0-1 and 1-2 transitions. The peaks correspond to peaks 1 and2 in Fig. 4�a�. The frequency shifts of the peaks with time are caused by heat from the CN vibrational relaxation.
034505-6 Bian et al. J. Chem. Phys. 133, 034505 �2010�
Downloaded 17 Jul 2010 to 168.7.210.43. Redistribution subject to AIP license or copyright; see http://jcp.aip.org/jcp/copyright.jsp
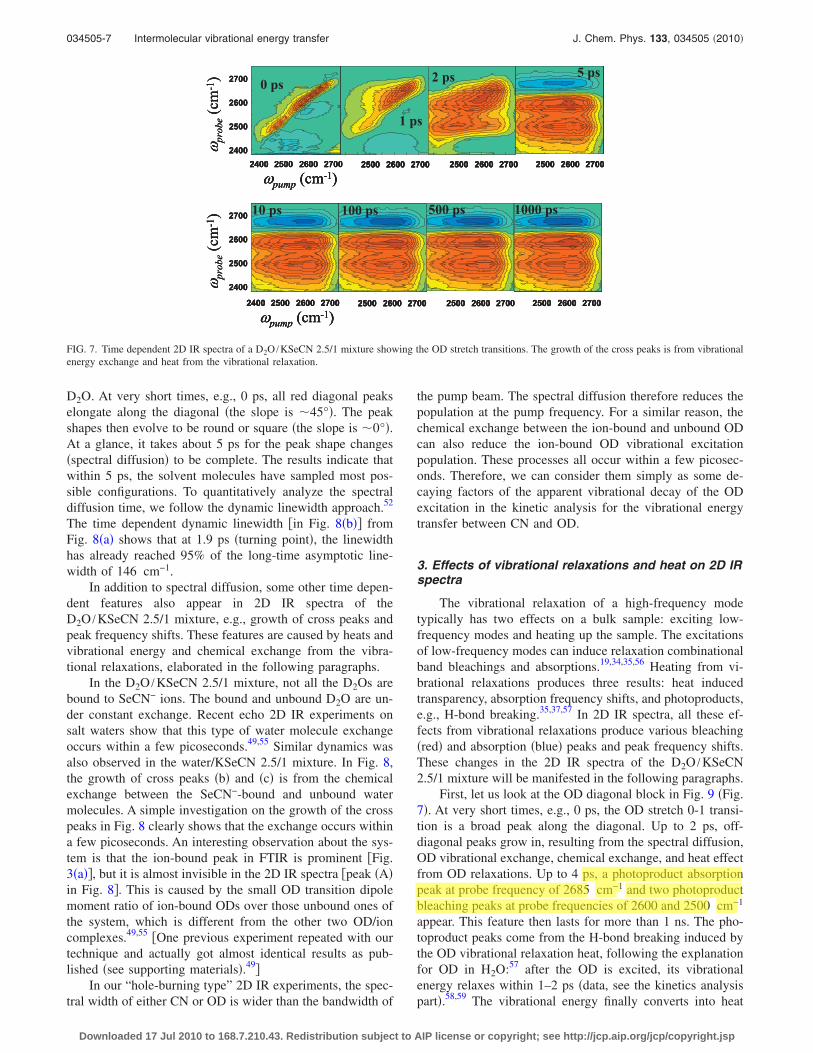
D2O. At very short times, e.g., 0 ps, all red diagonal peakselongate along the diagonal �the slope is �45°�. The peakshapes then evolve to be round or square �the slope is �0°�.At a glance, it takes about 5 ps for the peak shape changes�spectral diffusion� to be complete. The results indicate thatwithin 5 ps, the solvent molecules have sampled most pos-sible configurations. To quantitatively analyze the spectraldiffusion time, we follow the dynamic linewidth approach.52
The time dependent dynamic linewidth �in Fig. 8�b�� fromFig. 8�a� shows that at 1.9 ps �turning point�, the linewidthhas already reached 95% of the long-time asymptotic line-width of 146 cm−1.
In addition to spectral diffusion, some other time depen-dent features also appear in 2D IR spectra of theD2O /KSeCN 2.5/1 mixture, e.g., growth of cross peaks andpeak frequency shifts. These features are caused by heats andvibrational energy and chemical exchange from the vibra-tional relaxations, elaborated in the following paragraphs.
In the D2O /KSeCN 2.5/1 mixture, not all the D2Os arebound to SeCN− ions. The bound and unbound D2O are un-der constant exchange. Recent echo 2D IR experiments onsalt waters show that this type of water molecule exchangeoccurs within a few picoseconds.49,55 Similar dynamics wasalso observed in the water/KSeCN 2.5/1 mixture. In Fig. 8,the growth of cross peaks �b� and �c� is from the chemicalexchange between the SeCN−-bound and unbound watermolecules. A simple investigation on the growth of the crosspeaks in Fig. 8 clearly shows that the exchange occurs withina few picoseconds. An interesting observation about the sys-tem is that the ion-bound peak in FTIR is prominent �Fig.3�a��, but it is almost invisible in the 2D IR spectra �peak �A�in Fig. 8�. This is caused by the small OD transition dipolemoment ratio of ion-bound ODs over those unbound ones ofthe system, which is different from the other two OD/ioncomplexes.49,55 �One previous experiment repeated with ourtechnique and actually got almost identical results as pub-lished �see supporting materials�.49�
In our “hole-burning type” 2D IR experiments, the spec-tral width of either CN or OD is wider than the bandwidth of
the pump beam. The spectral diffusion therefore reduces thepopulation at the pump frequency. For a similar reason, thechemical exchange between the ion-bound and unbound ODcan also reduce the ion-bound OD vibrational excitationpopulation. These processes all occur within a few picosec-onds. Therefore, we can consider them simply as some de-caying factors of the apparent vibrational decay of the ODexcitation in the kinetic analysis for the vibrational energytransfer between CN and OD.
3. Effects of vibrational relaxations and heat on 2D IRspectra
The vibrational relaxation of a high-frequency modetypically has two effects on a bulk sample: exciting low-frequency modes and heating up the sample. The excitationsof low-frequency modes can induce relaxation combinationalband bleachings and absorptions.19,34,35,56 Heating from vi-brational relaxations produces three results: heat inducedtransparency, absorption frequency shifts, and photoproducts,e.g., H-bond breaking.35,37,57 In 2D IR spectra, all these ef-fects from vibrational relaxations produce various bleaching�red� and absorption �blue� peaks and peak frequency shifts.These changes in the 2D IR spectra of the D2O /KSeCN2.5/1 mixture will be manifested in the following paragraphs.
First, let us look at the OD diagonal block in Fig. 9 �Fig.7�. At very short times, e.g., 0 ps, the OD stretch 0-1 transi-tion is a broad peak along the diagonal. Up to 2 ps, off-diagonal peaks grow in, resulting from the spectral diffusion,OD vibrational exchange, chemical exchange, and heat effectfrom OD relaxations. Up to 4 ps, a photoproduct absorptionpeak at probe frequency of 2685 cm−1 and two photoproductbleaching peaks at probe frequencies of 2600 and 2500 cm−1
appear. This feature then lasts for more than 1 ns. The pho-toproduct peaks come from the H-bond breaking induced bythe OD vibrational relaxation heat, following the explanationfor OD in H2O:57 after the OD is excited, its vibrationalenergy relaxes within 1–2 ps �data, see the kinetics analysispart�.58,59 The vibrational energy finally converts into heat
0 ps
1 ps
2 ps 5 ps
10 ps 100 ps 500 ps 1000 ps
2400
2500
2600
2700
�probe(cm-1)
2400 2500 2600 2700
�pump (cm-1)2500 2600 2700 2500 2600 2700 2500 2600 2700
2400 2500 2600 2700
�pump (cm-1)2500 2600 2700 2500 2600 2700 2500 2600 2700
2400
2500
2600
2700�probe(cm-1)
0 ps
1 ps
2 ps 5 ps
10 ps 100 ps 500 ps 1000 ps10 ps 100 ps 500 ps 1000 ps
2400
2500
2600
2700
�probe(cm-1)
2400
2500
2600
2700
�probe(cm-1)
2400 2500 2600 2700
�pump (cm-1)2500 2600 2700 2500 2600 2700 2500 2600 27002400 2500 2600 2700
�pump (cm-1)2400 2500 2600 2700
�pump (cm-1)2500 2600 27002500 2600 2700 2500 2600 27002500 2600 2700 2500 2600 27002500 2600 2700
2400 2500 2600 2700
�pump (cm-1)2500 2600 2700 2500 2600 2700 2500 2600 27002400 2500 2600 2700
�pump (cm-1)2400 2500 2600 2700
�pump (cm-1)2500 2600 27002500 2600 2700 2500 2600 27002500 2600 2700 2500 2600 27002500 2600 2700
2400
2500
2600
2700�probe(cm-1)
2400
2500
2600
2700�probe(cm-1)
FIG. 7. Time dependent 2D IR spectra of a D2O /KSeCN 2.5/1 mixture showing the OD stretch transitions. The growth of the cross peaks is from vibrationalenergy exchange and heat from the vibrational relaxation.
034505-7 Intermolecular vibrational energy transfer J. Chem. Phys. 133, 034505 �2010�
Downloaded 17 Jul 2010 to 168.7.210.43. Redistribution subject to AIP license or copyright; see http://jcp.aip.org/jcp/copyright.jsp
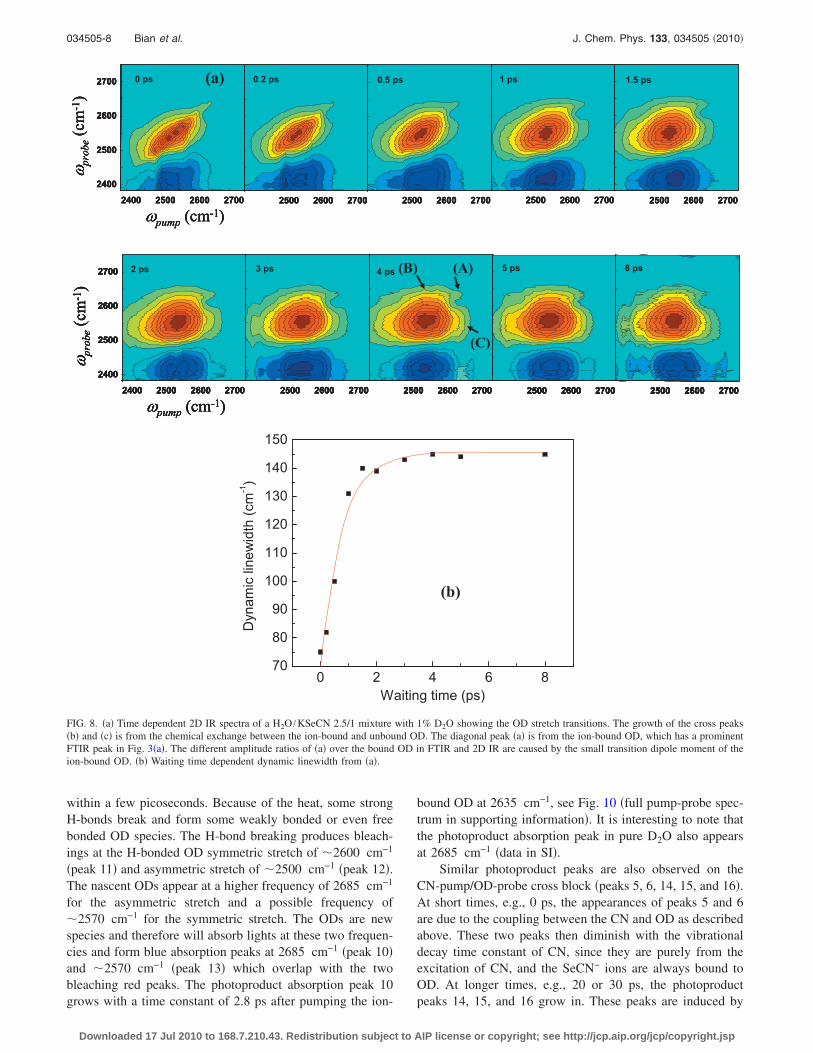
within a few picoseconds. Because of the heat, some strongH-bonds break and form some weakly bonded or even freebonded OD species. The H-bond breaking produces bleach-ings at the H-bonded OD symmetric stretch of �2600 cm−1
�peak 11� and asymmetric stretch of �2500 cm−1 �peak 12�.The nascent ODs appear at a higher frequency of 2685 cm−1
for the asymmetric stretch and a possible frequency of�2570 cm−1 for the symmetric stretch. The ODs are newspecies and therefore will absorb lights at these two frequen-cies and form blue absorption peaks at 2685 cm−1 �peak 10�and �2570 cm−1 �peak 13� which overlap with the twobleaching red peaks. The photoproduct absorption peak 10grows with a time constant of 2.8 ps after pumping the ion-
bound OD at 2635 cm−1, see Fig. 10 �full pump-probe spec-trum in supporting information�. It is interesting to note thatthe photoproduct absorption peak in pure D2O also appearsat 2685 cm−1 �data in SI�.
Similar photoproduct peaks are also observed on theCN-pump/OD-probe cross block �peaks 5, 6, 14, 15, and 16�.At short times, e.g., 0 ps, the appearances of peaks 5 and 6are due to the coupling between the CN and OD as describedabove. These two peaks then diminish with the vibrationaldecay time constant of CN, since they are purely from theexcitation of CN, and the SeCN− ions are always bound toOD. At longer times, e.g., 20 or 30 ps, the photoproductpeaks 14, 15, and 16 grow in. These peaks are induced by
1 ps 1.5 ps0 ps 0.5 ps0.2 ps
2400
2500
2600
2700�probe(cm-1)
2400 2500 2600 2700
�pump (cm-1)2500 2600 2700 2500 2600 2700 2500 2600 2700 2500 2600 2700
8 ps5 ps4 ps3 ps2 ps (A)(B)
(C)
2400 2500 2600 2700
�pump (cm-1)2500 2600 2700 2500 2600 2700 2500 2600 2700 2500 2600 2700
2400
2500
2600
2700
�probe(cm-1)
(a) 1 ps 1.5 ps0 ps 0.5 ps0.2 ps
2400
2500
2600
2700�probe(cm-1)
2400 2500 2600 2700
�pump (cm-1)2500 2600 2700 2500 2600 2700 2500 2600 2700 2500 2600 2700
8 ps5 ps4 ps3 ps2 ps (A)(B)
(C)
2400 2500 2600 2700
�pump (cm-1)2500 2600 2700 2500 2600 2700 2500 2600 2700 2500 2600 2700
2400
2500
2600
2700
�probe(cm-1)
1 ps1 ps 1.5 ps1.5 ps0 ps 0.5 ps0.5 ps0.2 ps0.2 ps
2400
2500
2600
2700�probe(cm-1)
2400
2500
2600
2700�probe(cm-1)
2400 2500 2600 2700
�pump (cm-1)2400 2500 2600 2700
�pump (cm-1)2500 2600 27002500 2600 2700 2500 2600 27002500 2600 2700 2500 2600 27002500 2600 2700 2500 2600 27002500 2600 2700
8 ps5 ps4 ps3 ps2 ps (A)(B)
(C)
2400 2500 2600 2700
�pump (cm-1)2500 2600 2700 2500 2600 2700 2500 2600 2700 2500 2600 2700
2400
2500
2600
2700
�probe(cm-1)
8 ps8 ps5 ps5 ps4 ps4 ps3 ps3 ps2 ps2 ps (A)(B)
(C)
2400 2500 2600 2700
�pump (cm-1)2400 2500 2600 2700
�pump (cm-1)2500 2600 27002500 2600 2700 2500 2600 27002500 2600 2700 2500 2600 27002500 2600 2700 2500 2600 27002500 2600 2700
2400
2500
2600
2700
�probe(cm-1)
2400
2500
2600
2700
�probe(cm-1)
(a)
0 2 4 6 870
80
90
100
110
120
130
140
150
Dynamiclinewidth(cm-1)
Waiting time (ps)
(b)
FIG. 8. �a� Time dependent 2D IR spectra of a H2O /KSeCN 2.5/1 mixture with 1% D2O showing the OD stretch transitions. The growth of the cross peaks�b� and �c� is from the chemical exchange between the ion-bound and unbound OD. The diagonal peak �a� is from the ion-bound OD, which has a prominentFTIR peak in Fig. 3�a�. The different amplitude ratios of �a� over the bound OD in FTIR and 2D IR are caused by the small transition dipole moment of theion-bound OD. �b� Waiting time dependent dynamic linewidth from �a�.
034505-8 Bian et al. J. Chem. Phys. 133, 034505 �2010�
Downloaded 17 Jul 2010 to 168.7.210.43. Redistribution subject to AIP license or copyright; see http://jcp.aip.org/jcp/copyright.jsp
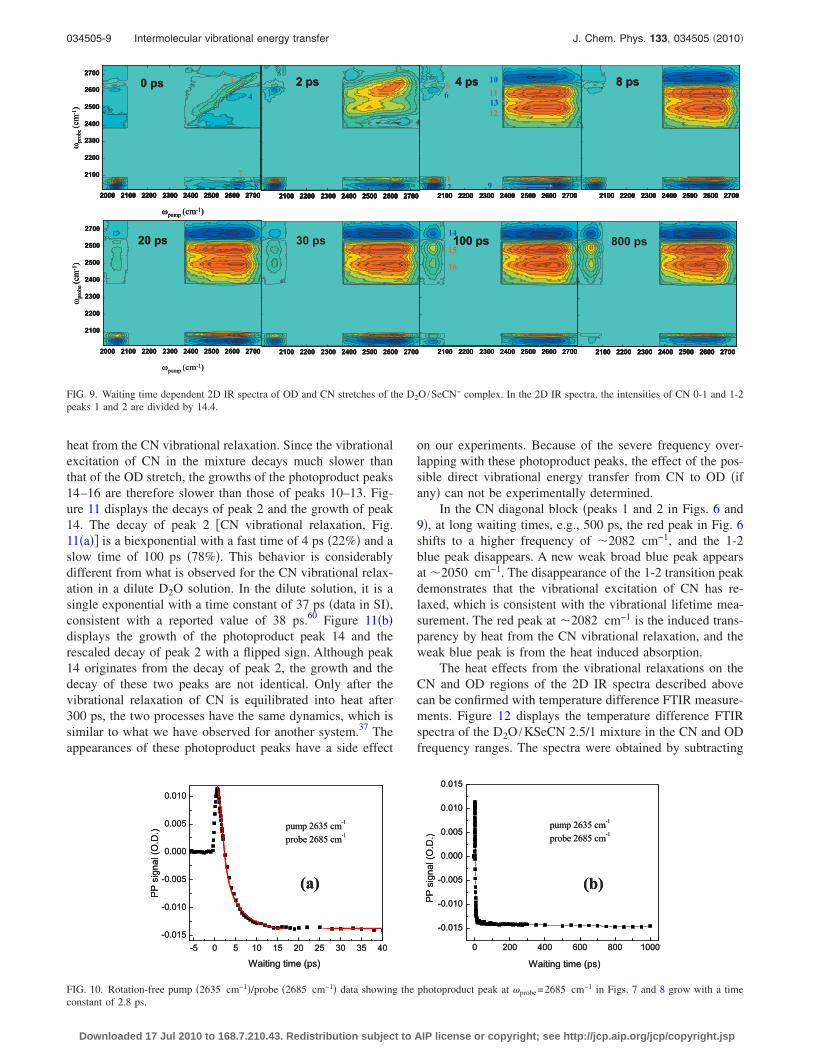
heat from the CN vibrational relaxation. Since the vibrationalexcitation of CN in the mixture decays much slower thanthat of the OD stretch, the growths of the photoproduct peaks14–16 are therefore slower than those of peaks 10–13. Fig-ure 11 displays the decays of peak 2 and the growth of peak14. The decay of peak 2 �CN vibrational relaxation, Fig.11�a�� is a biexponential with a fast time of 4 ps �22%� and aslow time of 100 ps �78%�. This behavior is considerablydifferent from what is observed for the CN vibrational relax-ation in a dilute D2O solution. In the dilute solution, it is asingle exponential with a time constant of 37 ps �data in SI�,consistent with a reported value of 38 ps.60 Figure 11�b�displays the growth of the photoproduct peak 14 and therescaled decay of peak 2 with a flipped sign. Although peak14 originates from the decay of peak 2, the growth and thedecay of these two peaks are not identical. Only after thevibrational relaxation of CN is equilibrated into heat after300 ps, the two processes have the same dynamics, which issimilar to what we have observed for another system.37 Theappearances of these photoproduct peaks have a side effect
on our experiments. Because of the severe frequency over-lapping with these photoproduct peaks, the effect of the pos-sible direct vibrational energy transfer from CN to OD �ifany� can not be experimentally determined.
In the CN diagonal block �peaks 1 and 2 in Figs. 6 and9�, at long waiting times, e.g., 500 ps, the red peak in Fig. 6shifts to a higher frequency of �2082 cm−1, and the 1-2blue peak disappears. A new weak broad blue peak appearsat �2050 cm−1. The disappearance of the 1-2 transition peakdemonstrates that the vibrational excitation of CN has re-laxed, which is consistent with the vibrational lifetime mea-surement. The red peak at �2082 cm−1 is the induced trans-parency by heat from the CN vibrational relaxation, and theweak blue peak is from the heat induced absorption.
The heat effects from the vibrational relaxations on theCN and OD regions of the 2D IR spectra described abovecan be confirmed with temperature difference FTIR measure-ments. Figure 12 displays the temperature difference FTIRspectra of the D2O /KSeCN 2.5/1 mixture in the CN and ODfrequency ranges. The spectra were obtained by subtracting
0 ps
2100
2200
2300
2400
2500
2600
2700�probe(cm-1)
8 ps
20 ps 30 ps 100 ps
4 ps
12
3 5
7
4 6
8
1011
12
15
13
9
16
14
2 ps
�pump (cm-1)
2000 2100 2200 2300 2400 2500 2600 2700 2100 2200 2300 2400 2500 2600 2700 2100 2200 2300 2400 2500 2600 2700 2100 2200 2300 2400 2500 2600 2700
�pump (cm-1)
2000 2100 2200 2300 2400 2500 2600 2700 2100 2200 2300 2400 2500 2600 2700 2100 2200 2300 2400 2500 2600 2700
2100
2200
2300
2400
2500
2600
2700
�probe(cm-1)
800 ps
2100 2200 2300 2400 2500 2600 2700
0 ps0 ps
2100
2200
2300
2400
2500
2600
2700�probe(cm-1)
2100
2200
2300
2400
2500
2600
2700�probe(cm-1)
8 ps8 ps8 ps
20 ps20 ps20 ps 30 ps30 ps 100 ps100 ps100 ps
4 ps4 ps4 ps
12
3 5
7
4 6
8
1011
12
15
13
9
16
14
2 ps2 ps2 ps
�pump (cm-1)
2000 2100 2200 2300 2400 2500 2600 2700 2100 2200 2300 2400 2500 2600 2700 2100 2200 2300 2400 2500 2600 2700 2100 2200 2300 2400 2500 2600 2700
�pump (cm-1)
2000 2100 2200 2300 2400 2500 2600 2700 2100 2200 2300 2400 2500 2600 2700 2100 2200 2300 2400 2500 2600 2700 2100 2200 2300 2400 2500 2600 27002000 2100 2200 2300 2400 2500 2600 27002000 2100 2200 2300 2400 2500 2600 2700 2100 2200 2300 2400 2500 2600 27002100 2200 2300 2400 2500 2600 2700 2100 2200 2300 2400 2500 2600 27002100 2200 2300 2400 2500 2600 2700 2100 2200 2300 2400 2500 2600 27002100 2200 2300 2400 2500 2600 2700
�pump (cm-1)
2000 2100 2200 2300 2400 2500 2600 27002000 2100 2200 2300 2400 2500 2600 2700 2100 2200 2300 2400 2500 2600 27002100 2200 2300 2400 2500 2600 2700 2100 2200 2300 2400 2500 2600 27002100 2200 2300 2400 2500 2600 2700
2100
2200
2300
2400
2500
2600
2700
�probe(cm-1)
2100
2200
2300
2400
2500
2600
2700
�probe(cm-1)
800 ps
2100 2200 2300 2400 2500 2600 2700
800 ps800 ps
2100 2200 2300 2400 2500 2600 27002100 2200 2300 2400 2500 2600 2700
FIG. 9. Waiting time dependent 2D IR spectra of OD and CN stretches of the D2O /SeCN− complex. In the 2D IR spectra, the intensities of CN 0-1 and 1-2peaks 1 and 2 are divided by 14.4.
0 200 400 600 800 1000
-0.015
-0.010
-0.005
0.000
0.005
0.010
0.015
pump 2635 cm-1
probe 2685 cm-1
PPsignal(O.D.)
Waiting time (ps)
-5 0 5 10 15 20 25 30 35 40-0.015
-0.010
-0.005
0.000
0.005
0.010
pump 2635 cm-1
probe 2685 cm-1
PPsignal(O.D.)
Waiting time (ps)
(a) (b)
0 200 400 600 800 1000
-0.015
-0.010
-0.005
0.000
0.005
0.010
0.015
pump 2635 cm-1
probe 2685 cm-1
PPsignal(O.D.)
Waiting time (ps)
-5 0 5 10 15 20 25 30 35 40-0.015
-0.010
-0.005
0.000
0.005
0.010
pump 2635 cm-1
probe 2685 cm-1
PPsignal(O.D.)
Waiting time (ps)
(a) (b)
FIG. 10. Rotation-free pump �2635 cm−1�/probe �2685 cm−1� data showing the photoproduct peak at probe=2685 cm−1 in Figs. 7 and 8 grow with a timeconstant of 2.8 ps.
034505-9 Intermolecular vibrational energy transfer J. Chem. Phys. 133, 034505 �2010�
Downloaded 17 Jul 2010 to 168.7.210.43. Redistribution subject to AIP license or copyright; see http://jcp.aip.org/jcp/copyright.jsp

the room temperature �24 °C� spectrum from higher tem-perature spectra. In Fig. 12�a�, increasing temperature pro-duces a strong bleaching at �2082 cm−1 and a weak absorp-tion at �2050 cm−1. In Fig. 12�b�, increasing temperatureproduces two bleachings at �2600 and 2500 cm−1 and oneabsorption at �2685 cm−1. These observations are consis-tent with what is demonstrated from 2D IR spectra. Accord-ing to our experimental conditions, the temperature increasein the 2D IR measurement is estimated to be �10 °C.
Heat effects on peaks 7–9 are similar to what are on theCN peaks 1 and 2. The appearances of heat induced trans-parency and absorption appear earlier at peaks 7–9 �Fig. 13�than peaks 1 and 2 �Fig. 6�, since heats on peaks 7–9 arefrom the OD vibrational relaxations, which are much fasterthan the CN decay. In addition to the heat effect, the directvibrational energy transfer from OD to CN also producescross peaks in the positions of peaks 7–9. It will be elabo-rated in next paragraphs.
4. Energy transfer from OD to CN
Three possible mechanisms can generate cross peaks�Fig. 13� in the positions of peaks 7 and 8, resulting from theOD-pump/CN-probe. The first one is the coupling betweenthe OD and CN modes. The coupling produces the groundstate bleaching peak 7 and the combination band absorptionpeak 8 even at time 0. Feynman diagrams �in SI� show thatthese two peaks must decay with the apparent ion-bound ODvibrational lifetime of 1.5 ps �data in the kinetics analysis
part�. The apparent vibrational lifetime is the result of vibra-tional decay, energy transfers, spectral diffusions, and chemi-cal exchanges. If this was the only origin of peaks on theposition, we should not see any peaks after 5 ps. In Fig. 13,peaks are still clearly visible, demonstrating that there mustbe some other origins for the peaks. The second possibleorigin of the cross peaks is heating from the vibrational re-laxation of OD. The heat induced peaks must grow at thesame rate of heat generation whose time constant is 2.8 ps�from Fig. 10�. The appearances of these heat induced peaksmust be similar to those in Fig. 6 at long times, e.g., 1000 ps.In other words, if coupling and heating are the only originsfor the cross peaks in Fig. 13, we should see peaks after 5 psin Fig. 13 similar to the one at 1000 ps in Fig. 6. The exis-tence of peak at �2635 cm−1 , 2042 cm−1� up to 200 ps inFig. 13 demonstrates that there must be a third origin for thepeaks. The origin is the mode specific vibrational energytransfer from OD to CN. Feynman diagrams �in SI� showthat peaks from this energy transfer origin grow at the energytransfer rate and decay with the CN vibrational lifetime. Thisis the reason that even at 200 ps, peak at�2635 cm−1 , 2042 cm−1� is still visible in Fig. 13.
From the above analysis, peaks on the positions of peaks7 and 8 have three origins. These peaks are severely over-lapped: peak 7 �2635 cm−1 , 2075 cm−1� and peak 8�2635 cm−1 , 2045 cm−1� are from coupling; peak 17�2635 cm−1 , 2082 cm−1� and peak 18 �2635 cm−1 ,2050 cm−1� are from heating; peak 7 �2635 cm−1 , 2075
0 200 400 600 800 1000
-0.6
-0.5
-0.4
-0.3
-0.2
-0.1
0.0
Peak 2
PPsignal(O.D.)
Waiting Time (ps)
(a)
0 200 400 600 800 1000
-0.030
-0.025
-0.020
-0.015
-0.010
-0.005
0.000
0.005
PPsignal(O.D.)
Waiting time (ps)
Peak 2Peak 14
(b)
FIG. 11. �a� The vibrational decay of peak 2 in Fig. 9; �b� the growth of the photoproduct peak 14 and the rescaled decay of peak 2 with a flipped sign.
2000 2020 2040 2060 2080 2100 2120-0.18
-0.16
-0.14
-0.12
-0.10
-0.08
-0.06
-0.04
-0.02
0.00
0.02
DifferenceAbsorbance(O.D.)
Frequency (cm-1)
dT =4 0C11 0C16 0C21 0C26 0C36 0C46 0C56 0C (a)
2400 2500 2600 2700 2800
-0.05
0.00
0.05
0.10
dT =4 0C11 0C16 0C21 0C26 0C36 0C46 0C56 0C
DifferenceAbsorbance(O.D.)
Frequency (cm-1)
(b)
FIG. 12. Temperature difference FTIR spectra of the D2O /KSeCN 2.5/1 mixture in the CN �a� and OD �b� frequency ranges. Positive values representabsorption and negative values represent bleaching.
034505-10 Bian et al. J. Chem. Phys. 133, 034505 �2010�
Downloaded 17 Jul 2010 to 168.7.210.43. Redistribution subject to AIP license or copyright; see http://jcp.aip.org/jcp/copyright.jsp
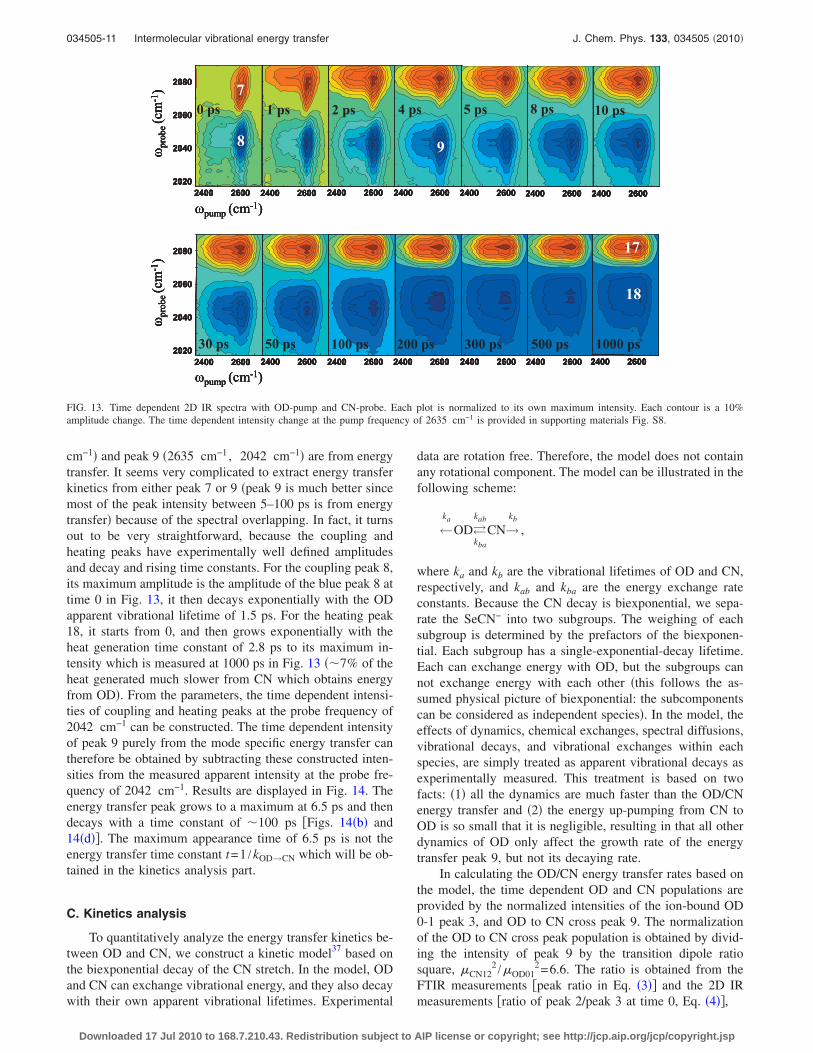
cm−1� and peak 9 �2635 cm−1 , 2042 cm−1� are from energytransfer. It seems very complicated to extract energy transferkinetics from either peak 7 or 9 �peak 9 is much better sincemost of the peak intensity between 5–100 ps is from energytransfer� because of the spectral overlapping. In fact, it turnsout to be very straightforward, because the coupling andheating peaks have experimentally well defined amplitudesand decay and rising time constants. For the coupling peak 8,its maximum amplitude is the amplitude of the blue peak 8 attime 0 in Fig. 13, it then decays exponentially with the ODapparent vibrational lifetime of 1.5 ps. For the heating peak18, it starts from 0, and then grows exponentially with theheat generation time constant of 2.8 ps to its maximum in-tensity which is measured at 1000 ps in Fig. 13 ��7% of theheat generated much slower from CN which obtains energyfrom OD�. From the parameters, the time dependent intensi-ties of coupling and heating peaks at the probe frequency of2042 cm−1 can be constructed. The time dependent intensityof peak 9 purely from the mode specific energy transfer cantherefore be obtained by subtracting these constructed inten-sities from the measured apparent intensity at the probe fre-quency of 2042 cm−1. Results are displayed in Fig. 14. Theenergy transfer peak grows to a maximum at 6.5 ps and thendecays with a time constant of �100 ps �Figs. 14�b� and14�d��. The maximum appearance time of 6.5 ps is not theenergy transfer time constant t=1 /kOD→CN which will be ob-tained in the kinetics analysis part.
C. Kinetics analysis
To quantitatively analyze the energy transfer kinetics be-tween OD and CN, we construct a kinetic model37 based onthe biexponential decay of the CN stretch. In the model, ODand CN can exchange vibrational energy, and they also decaywith their own apparent vibrational lifetimes. Experimental
data are rotation free. Therefore, the model does not containany rotational component. The model can be illustrated in thefollowing scheme:
←ka
OD�kba
kab
CN→kb
,
where ka and kb are the vibrational lifetimes of OD and CN,respectively, and kab and kba are the energy exchange rateconstants. Because the CN decay is biexponential, we sepa-rate the SeCN− into two subgroups. The weighing of eachsubgroup is determined by the prefactors of the biexponen-tial. Each subgroup has a single-exponential-decay lifetime.Each can exchange energy with OD, but the subgroups cannot exchange energy with each other �this follows the as-sumed physical picture of biexponential: the subcomponentscan be considered as independent species�. In the model, theeffects of dynamics, chemical exchanges, spectral diffusions,vibrational decays, and vibrational exchanges within eachspecies, are simply treated as apparent vibrational decays asexperimentally measured. This treatment is based on twofacts: �1� all the dynamics are much faster than the OD/CNenergy transfer and �2� the energy up-pumping from CN toOD is so small that it is negligible, resulting in that all otherdynamics of OD only affect the growth rate of the energytransfer peak 9, but not its decaying rate.
In calculating the OD/CN energy transfer rates based onthe model, the time dependent OD and CN populations areprovided by the normalized intensities of the ion-bound OD0-1 peak 3, and OD to CN cross peak 9. The normalizationof the OD to CN cross peak population is obtained by divid-ing the intensity of peak 9 by the transition dipole ratiosquare, �CN12
2 /�OD012=6.6. The ratio is obtained from the
FTIR measurements �peak ratio in Eq. �3�� and the 2D IRmeasurements �ratio of peak 2/peak 3 at time 0, Eq. �4��,
500 ps300 ps200 ps100 ps50 ps30 ps 1000 ps
10 ps8 ps5 ps4 ps2 ps1 ps0 ps
2400 2600
�pump (cm-1)
2020
2040
2060
2080
�probe(cm-1)
2020
2040
2060
2080
�probe(cm-1)
2400 2600 2400 2600 2400 26002400 2600 2400 2600 2400 2600
2400 2600 2400 2600 2400 26002400 26002400 26002400 2600 2400 2600
�pump (cm-1)
7
8 9
18
17
500 ps300 ps200 ps100 ps50 ps30 ps 1000 ps
10 ps8 ps5 ps4 ps2 ps1 ps0 ps
2400 2600
�pump (cm-1)
2020
2040
2060
2080
�probe(cm-1)
2020
2040
2060
2080
�probe(cm-1)
2400 2600 2400 2600 2400 26002400 2600 2400 2600 2400 2600
2400 2600 2400 2600 2400 26002400 26002400 26002400 2600 2400 2600
�pump (cm-1)
7
8 9
500 ps300 ps200 ps100 ps50 ps30 ps 1000 ps
10 ps8 ps5 ps4 ps2 ps1 ps0 ps
2400 2600
�pump (cm-1)
2020
2040
2060
2080
�probe(cm-1)
2020
2040
2060
2080
�probe(cm-1)
2400 2600 2400 2600 2400 26002400 2600 2400 2600 2400 2600
2400 2600 2400 2600 2400 26002400 26002400 26002400 2600 2400 2600
�pump (cm-1)
500 ps300 ps200 ps100 ps50 ps30 ps 1000 ps500 ps300 ps200 ps100 ps50 ps30 ps 1000 ps
10 ps8 ps5 ps4 ps2 ps1 ps0 ps
2400 26002400 2600
�pump (cm-1)
2020
2040
2060
2080
�probe(cm-1)
2020
2040
2060
2080
�probe(cm-1)
2020
2040
2060
2080
�probe(cm-1)
2020
2040
2060
2080
�probe(cm-1)
2400 26002400 2600 2400 26002400 2600 2400 26002400 26002400 26002400 2600 2400 26002400 2600 2400 26002400 2600
2400 26002400 2600 2400 26002400 2600 2400 26002400 26002400 26002400 26002400 26002400 26002400 26002400 2600 2400 26002400 2600
�pump (cm-1)
7
8 9
18
17
FIG. 13. Time dependent 2D IR spectra with OD-pump and CN-probe. Each plot is normalized to its own maximum intensity. Each contour is a 10%amplitude change. The time dependent intensity change at the pump frequency of 2635 cm−1 is provided in supporting materials Fig. S8.
034505-11 Intermolecular vibrational energy transfer J. Chem. Phys. 133, 034505 �2010�
Downloaded 17 Jul 2010 to 168.7.210.43. Redistribution subject to AIP license or copyright; see http://jcp.aip.org/jcp/copyright.jsp
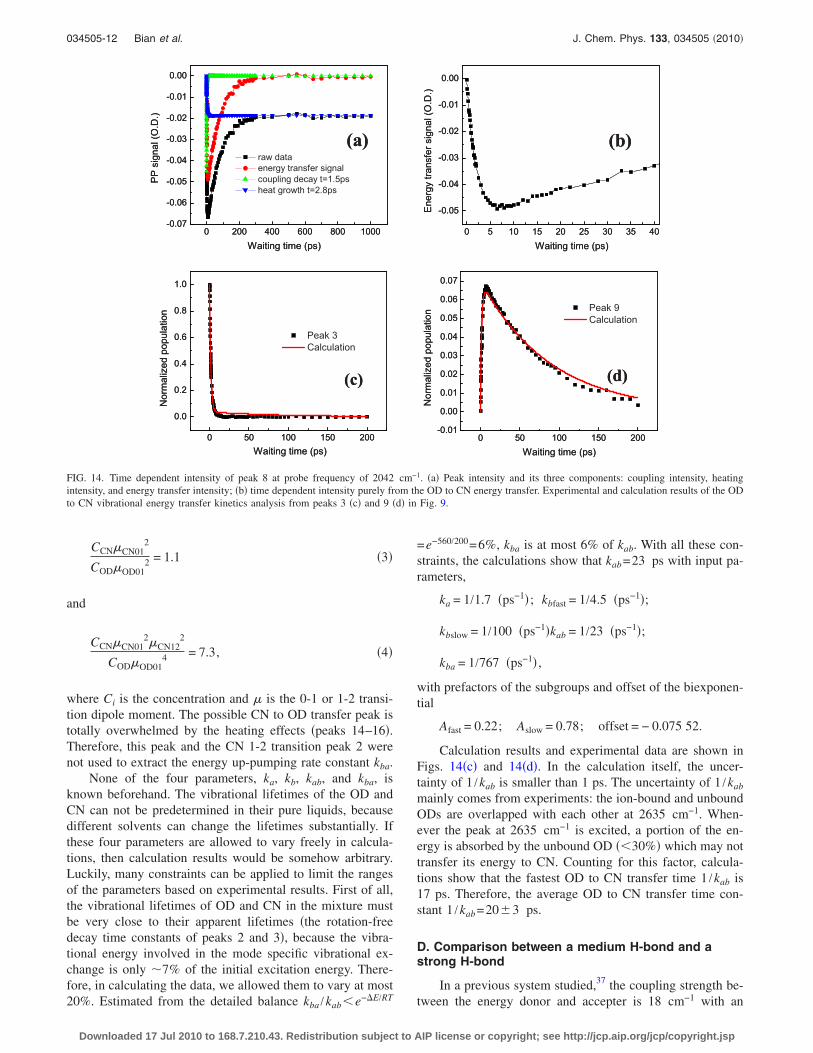
CCN�CN012
COD�OD012 = 1.1 �3�
and
CCN�CN012�CN12
2
COD�OD014 = 7.3, �4�
where Ci is the concentration and � is the 0-1 or 1-2 transi-tion dipole moment. The possible CN to OD transfer peak istotally overwhelmed by the heating effects �peaks 14–16�.Therefore, this peak and the CN 1-2 transition peak 2 werenot used to extract the energy up-pumping rate constant kba.
None of the four parameters, ka, kb, kab, and kba, isknown beforehand. The vibrational lifetimes of the OD andCN can not be predetermined in their pure liquids, becausedifferent solvents can change the lifetimes substantially. Ifthese four parameters are allowed to vary freely in calcula-tions, then calculation results would be somehow arbitrary.Luckily, many constraints can be applied to limit the rangesof the parameters based on experimental results. First of all,the vibrational lifetimes of OD and CN in the mixture mustbe very close to their apparent lifetimes �the rotation-freedecay time constants of peaks 2 and 3�, because the vibra-tional energy involved in the mode specific vibrational ex-change is only �7% of the initial excitation energy. There-fore, in calculating the data, we allowed them to vary at most20%. Estimated from the detailed balance kba /kab�e−E/RT
=e−560/200=6%, kba is at most 6% of kab. With all these con-straints, the calculations show that kab=23 ps with input pa-rameters,
ka = 1/1.7 �ps−1�; kbfast = 1/4.5 �ps−1�;
kbslow = 1/100 �ps−1�kab = 1/23 �ps−1�;
kba = 1/767 �ps−1� ,
with prefactors of the subgroups and offset of the biexponen-tial
Afast = 0.22; Aslow = 0.78; offset = − 0.075 52.
Calculation results and experimental data are shown inFigs. 14�c� and 14�d�. In the calculation itself, the uncer-tainty of 1 /kab is smaller than 1 ps. The uncertainty of 1 /kab
mainly comes from experiments: the ion-bound and unboundODs are overlapped with each other at 2635 cm−1. When-ever the peak at 2635 cm−1 is excited, a portion of the en-ergy is absorbed by the unbound OD ��30%� which may nottransfer its energy to CN. Counting for this factor, calcula-tions show that the fastest OD to CN transfer time 1 /kab is17 ps. Therefore, the average OD to CN transfer time con-stant 1 /kab=20�3 ps.
D. Comparison between a medium H-bond and astrong H-bond
In a previous system studied,37 the coupling strength be-tween the energy donor and accepter is 18 cm−1 with an
0 200 400 600 800 1000-0.07
-0.06
-0.05
-0.04
-0.03
-0.02
-0.01
0.00
PPsignal(O.D.)
Waiting time (ps)
raw dataenergy transfer signalcoupling decay t=1.5psheat growth t=2.8ps
(a)
0 50 100 150 200
0.0
0.2
0.4
0.6
0.8
1.0
Normalizedpopulation
Waiting time (ps)
Peak 3Calculation
(c)
0 200 400 600 800 1000-0.07
-0.06
-0.05
-0.04
-0.03
-0.02
-0.01
0.00
PPsignal(O.D.)
Waiting time (ps)
raw dataenergy transfer signalcoupling decay t=1.5psheat growth t=2.8ps
(a)
0 50 100 150 200
0.0
0.2
0.4
0.6
0.8
1.0
Normalizedpopulation
Waiting time (ps)
Peak 3Calculation
(c)
0 5 10 15 20 25 30 35 40
-0.05
-0.04
-0.03
-0.02
-0.01
0.00
Energytransfersignal(O.D.)
Waiting time (ps)
(b)
0 50 100 150 200-0.01
0.00
0.01
0.02
0.03
0.04
0.05
0.06
0.07
Normalizedpopulation
Waiting time (ps)
Peak 9Calculation
(d)
0 5 10 15 20 25 30 35 40
-0.05
-0.04
-0.03
-0.02
-0.01
0.00
Energytransfersignal(O.D.)
Waiting time (ps)
(b)
0 50 100 150 200-0.01
0.00
0.01
0.02
0.03
0.04
0.05
0.06
0.07
Normalizedpopulation
Waiting time (ps)
Peak 9Calculation
(d)
FIG. 14. Time dependent intensity of peak 8 at probe frequency of 2042 cm−1. �a� Peak intensity and its three components: coupling intensity, heatingintensity, and energy transfer intensity; �b� time dependent intensity purely from the OD to CN energy transfer. Experimental and calculation results of the ODto CN vibrational energy transfer kinetics analysis from peaks 3 �c� and 9 �d� in Fig. 9.
034505-12 Bian et al. J. Chem. Phys. 133, 034505 �2010�
Downloaded 17 Jul 2010 to 168.7.210.43. Redistribution subject to AIP license or copyright; see http://jcp.aip.org/jcp/copyright.jsp
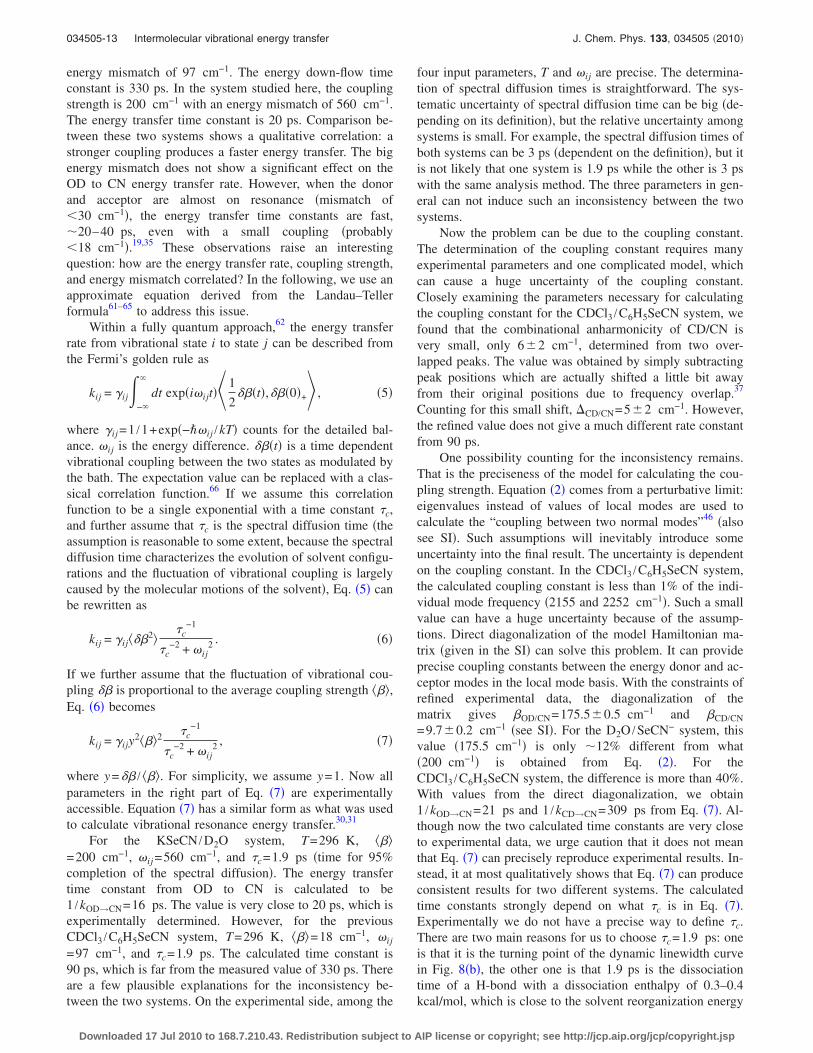
energy mismatch of 97 cm−1. The energy down-flow timeconstant is 330 ps. In the system studied here, the couplingstrength is 200 cm−1 with an energy mismatch of 560 cm−1.The energy transfer time constant is 20 ps. Comparison be-tween these two systems shows a qualitative correlation: astronger coupling produces a faster energy transfer. The bigenergy mismatch does not show a significant effect on theOD to CN energy transfer rate. However, when the donorand acceptor are almost on resonance �mismatch of�30 cm−1�, the energy transfer time constants are fast,�20–40 ps, even with a small coupling �probably�18 cm−1�.19,35 These observations raise an interestingquestion: how are the energy transfer rate, coupling strength,and energy mismatch correlated? In the following, we use anapproximate equation derived from the Landau–Tellerformula61–65 to address this issue.
Within a fully quantum approach,62 the energy transferrate from vibrational state i to state j can be described fromthe Fermi’s golden rule as
kij = ij�−�
�
dt exp�iijt�� 1
2���t�,���0�+ , �5�
where ij =1 /1+exp�−�ij /kT� counts for the detailed bal-ance. ij is the energy difference. ���t� is a time dependentvibrational coupling between the two states as modulated bythe bath. The expectation value can be replaced with a clas-sical correlation function.66 If we assume this correlationfunction to be a single exponential with a time constant �c,and further assume that �c is the spectral diffusion time �theassumption is reasonable to some extent, because the spectraldiffusion time characterizes the evolution of solvent configu-rations and the fluctuation of vibrational coupling is largelycaused by the molecular motions of the solvent�, Eq. �5� canbe rewritten as
kij = ij���2�c
−1
�c−2 + ij
2 . �6�
If we further assume that the fluctuation of vibrational cou-pling �� is proportional to the average coupling strength ��,Eq. �6� becomes
kij = ijy2��2 �c
−1
�c−2 + ij
2 , �7�
where y=�� / ��. For simplicity, we assume y=1. Now allparameters in the right part of Eq. �7� are experimentallyaccessible. Equation �7� has a similar form as what was usedto calculate vibrational resonance energy transfer.30,31
For the KSeCN /D2O system, T=296 K, ��=200 cm−1, ij =560 cm−1, and �c=1.9 ps �time for 95%completion of the spectral diffusion�. The energy transfertime constant from OD to CN is calculated to be1 /kOD→CN=16 ps. The value is very close to 20 ps, which isexperimentally determined. However, for the previousCDCl3 /C6H5SeCN system, T=296 K, ��=18 cm−1, ij
=97 cm−1, and �c=1.9 ps. The calculated time constant is90 ps, which is far from the measured value of 330 ps. Thereare a few plausible explanations for the inconsistency be-tween the two systems. On the experimental side, among the
four input parameters, T and ij are precise. The determina-tion of spectral diffusion times is straightforward. The sys-tematic uncertainty of spectral diffusion time can be big �de-pending on its definition�, but the relative uncertainty amongsystems is small. For example, the spectral diffusion times ofboth systems can be 3 ps �dependent on the definition�, but itis not likely that one system is 1.9 ps while the other is 3 pswith the same analysis method. The three parameters in gen-eral can not induce such an inconsistency between the twosystems.
Now the problem can be due to the coupling constant.The determination of the coupling constant requires manyexperimental parameters and one complicated model, whichcan cause a huge uncertainty of the coupling constant.Closely examining the parameters necessary for calculatingthe coupling constant for the CDCl3 /C6H5SeCN system, wefound that the combinational anharmonicity of CD/CN isvery small, only 6�2 cm−1, determined from two over-lapped peaks. The value was obtained by simply subtractingpeak positions which are actually shifted a little bit awayfrom their original positions due to frequency overlap.37
Counting for this small shift, CD/CN=5�2 cm−1. However,the refined value does not give a much different rate constantfrom 90 ps.
One possibility counting for the inconsistency remains.That is the preciseness of the model for calculating the cou-pling strength. Equation �2� comes from a perturbative limit:eigenvalues instead of values of local modes are used tocalculate the “coupling between two normal modes”46 �alsosee SI�. Such assumptions will inevitably introduce someuncertainty into the final result. The uncertainty is dependenton the coupling constant. In the CDCl3 /C6H5SeCN system,the calculated coupling constant is less than 1% of the indi-vidual mode frequency �2155 and 2252 cm−1�. Such a smallvalue can have a huge uncertainty because of the assump-tions. Direct diagonalization of the model Hamiltonian ma-trix �given in the SI� can solve this problem. It can provideprecise coupling constants between the energy donor and ac-ceptor modes in the local mode basis. With the constraints ofrefined experimental data, the diagonalization of thematrix gives �OD/CN=175.5�0.5 cm−1 and �CD/CN
=9.7�0.2 cm−1 �see SI�. For the D2O /SeCN− system, thisvalue �175.5 cm−1� is only �12% different from what�200 cm−1� is obtained from Eq. �2�. For theCDCl3 /C6H5SeCN system, the difference is more than 40%.With values from the direct diagonalization, we obtain1 /kOD→CN=21 ps and 1 /kCD→CN=309 ps from Eq. �7�. Al-though now the two calculated time constants are very closeto experimental data, we urge caution that it does not meanthat Eq. �7� can precisely reproduce experimental results. In-stead, it at most qualitatively shows that Eq. �7� can produceconsistent results for two different systems. The calculatedtime constants strongly depend on what �c is in Eq. �7�.Experimentally we do not have a precise way to define �c.There are two main reasons for us to choose �c=1.9 ps: oneis that it is the turning point of the dynamic linewidth curvein Fig. 8�b�, the other one is that 1.9 ps is the dissociationtime of a H-bond with a dissociation enthalpy of 0.3–0.4kcal/mol, which is close to the solvent reorganization energy
034505-13 Intermolecular vibrational energy transfer J. Chem. Phys. 133, 034505 �2010�
Downloaded 17 Jul 2010 to 168.7.210.43. Redistribution subject to AIP license or copyright; see http://jcp.aip.org/jcp/copyright.jsp
�activation energy for spectral diffusion�.40,67,68 On the theo-retical side, the assumptions we make in order to obtain Eq.�7� can be problematic. It is not clear how the spectral diffu-sion time is correlated with the vibrational coupling correla-tion time, especially when the spectral diffusion time is slow�in viscous liquids or solids�. It is not clear either how thefluctuation of coupling strength is correlated with thestrength itself. The correlations can be system dependent.Nonetheless, the results show that some simple equation likeEq. �7� has the potential to give some reasonable estimationfor vibrational energy transfer rates.69 We believe that withmore experimental data available in the future, the equationshould be able to be refined to the quantitative level.
In practice, an analytical equation similar to Eq. �7�which can provide reasonable estimations about energytransfer rates based on some easily accessible parameterswill be extremely useful, even if it is empirical and at a verycrude level. It will save researchers lots of time and re-sources in experimental designs �from our own experience�.
IV. CONCLUDING REMARKS
Mode specific vibrational energy transfer from the ODstretch first excited state of D2O to the first excited of CNstretch of SeCN− is observed in a D2O /SeCN− 2.5/1 liquidmixture at room temperature. The coupling between the ODand CN stretches is determined to be 176 cm−1, based on anexciton exchange model. The energy transfer time constant isdetermined to be 20�3 ps, despite the big energy mismatchof −560 cm−1 between the two modes. The energy transferrate is substantially slower than the energy transfer betweenthe ion-bound and unbound OD ��1.7 ps�. With experimen-tal determined parameters, an approximate analytical equa-tion derived from the Landau—Teller formula qualitativelyreproduces the energy transfer rates for two different sys-tems.
ACKNOWLEDGMENTS
The work was supported by the Rice University Start-uppackage and the Welch foundation through the NormanHackerman-Welch Young Investigator award to J.Z. Profes-sor Fayer’s insightful discussions on the inertial anisotropyvalues are deeply appreciated. Dr. Jianping Lin, Dr. XinChen, and Dr. Wei Zhuang’s insightful discussions on thetheoretical part are deeply appreciated.
1 C. B. Harris, D. E. Smith, and D. J. Russell, Chem. Rev. �Washington,D.C.� 90, 481 �1990�.
2 A. H. Zewail, J. Phys. Chem. A 104, 5660 �2000�.3 C. G. Elles and F. F. Crim, Annu. Rev. Phys. Chem. 57, 273 �2006�.4 L. K. Iwaki and D. D. Dlott, J. Phys. Chem. A 104, 9101 �2000�.5 F. F. Crim, Proc. Natl. Acad. Sci. U.S.A. 105, 12654 �2008�.6 D. D. Dlott, Chem. Phys. 266, 149 �2001�.7 Z. H. Wang, A. Pakoulev, and D. D. Dlott, Science 296, 2201 �2002�.8 J. C. Deak, Y. Pang, T. D. Sechler, Z. Wang, and D. D. Dlott, Science
306, 473 �2004�.9 V. M. Kenkre, A. Tokmakoff, and M. D. Fayer, J. Chem. Phys. 101,10618 �1994�.
10 E. J. Heilweil, M. P. Casassa, R. R. Cavanagh, and J. C. Stephenson, J.Chem. Phys. 85, 5004 �1986�.
11 E. J. Heilweil, R. R. Cavanagh, and J. C. Sephenson, J. Chem. Phys. 89,230 �1988�.
12 D. W. Miller and S. A. Adelman, Int. Rev. Phys. Chem. 13, 359 �1994�.13 A. Tokmakoff, B. Sauter, and M. D. Fayer, J. Chem. Phys. 100, 9035
�1994�.14 J. C. Deàk, L. K. Iwaki, S. T. Rhea, and D. D. Dlott, J. Raman Spectrosc.
31, 263 �2000�.15 A. Ma and R. M. Stratt, J. Chem. Phys. 121, 11217 �2004�.16 P. B. Graham, K. J. M. Matus, and R. M. Stratt, J. Chem. Phys. 121,
5348 �2004�.17 H. Graener, R. Zurl, and M. Hofmann, J. Phys. Chem. B 101, 1745
�1997�.18 R. Rey and J. T. Hynes, J. Chem. Phys. 104, 2356 �1996�.19 G. Seifert, R. Zurl, T. Patzlaff, and H. Graener, J. Chem. Phys. 112, 6349
�2000�.20 M. Tuckerman and B. J. Berne, J. Chem. Phys. 98, 7301 �1993�.21 E. L. Sibert and R. Rey, J. Chem. Phys. 116, 237 �2002�.22 H. Fujisaki, K. Yagi, J. E. Straub, and G. Stock, Int. J. Quantum Chem.
109, 2047 �2009�.23 D. M. Leitner, Annu. Rev. Phys. Chem. 59, 233 �2008�.24 G. Hanna and E. Geva, J. Phys. Chem. B 112, 15793 �2008�.25 S. G. Ramesh and E. L. Sibert, J. Chem. Phys. 125, 244512 �2006�.26 I. V. Rubtsov and R. M. Hochstrasser, J. Phys. Chem. B 106, 9165
�2002�.27 M. Schade, A. Moretto, M. Crisma, C. Toniolo, and P. Hamm, J. Phys.
Chem. B 113, 13393 �2009�.28 V. M. Kasyanenko, Z. W. Lin, G. I. Rubtsov, J. P. Donahue, and I. V.
Rubtsov, J. Chem. Phys. 131, 154508 �2009�.29 D. V. Kurochkin, S. R. G. Naraharisetty, and I. V. Rubtsov, Proc. Natl.
Acad. Sci. U.S.A. 104, 14209 �2007�.30 D. E. Logan and P. G. Wolynes, J. Chem. Phys. 93, 4994 �1990�.31 A. A. Stuchebrukhov and R. A. Marcus, J. Chem. Phys. 98, 6044 �1993�.32 T. Uzer and W. H. Miller, Phys. Rep., Phys. Lett. 199, 73 �1991�.33 R. A. Marcus, Faraday Discuss. 75, 103 �1983�.34 H. J. Bakker, P. C. M. Planken, and A. Lagendijk, Nature �London� 347,
745 �1990�.35 H. T. Bian, W. Zhao, and J. R. Zheng, J. Chem. Phys. 131, 124501
�2009�.36 X. Y. Hong, S. Chen, and D. D. Dlott, J. Phys. Chem. 99, 9102 �1995�.37 H. Bian, J. Li, X. Wen, and J. R. Zheng, J. Chem. Phys. 132, 184505
�2010�.38 E. R. T. Kerstel, K. K. Lehmann, T. F. Mentel, B. H. Pate, and G. Scoles,
J. Phys. Chem. 95, 8282 �1991�.39 H.-S. Tan, I. R. Piletic, and M. D. Fayer, J. Opt. Soc. Am. B 22, 2009
�2005�.40 J. Zheng and M. D. Fayer, J. Phys. Chem. B 112, 10221 �2008�.41 R. G. Parr and W. Yang, Density Functional Theory of Atoms and Mol-
ecules �Oxford University Press, New York, 1989�.42 M. Khalil, N. Demirdoven, and A. Tokmakoff, J. Phys. Chem. A 107,
5258 �2003�.43 V. Cervetto, J. Helbing, J. Bredenbeck, and P. Hamm, J. Chem. Phys.
121, 5935 �2004�.44 O. F. A. Larsen, P. Bodis, W. J. Buma, J. S. Hannam, D. A. Leigh, and S.
Woutersen, Proc. Natl. Acad. Sci. U.S.A. 102, 13378 �2005�.45 I. V. Rubtsov, K. Kumar, and R. M. Hochstrasser, Chem. Phys. Lett. 402,
439 �2005�.46 Ultrafast Infrared and Raman Spectroscopy, edited by M. D. Fayer �Mar-
cel Dekker, New York, 2001�, Vol. 26.47 P. Hamm, M. Lim, and R. M. Hochstrasser, J. Phys. Chem. B 102, 6123
�1998�.48 S. Woutersen and H. J. Bakker, Nature �London� 402, 507 �1999�.49 D. E. Moilanen, D. Wong, D. E. Rosenfeld, E. E. Fenn, and M. D. Fayer,
Proc. Natl. Acad. Sci. U.S.A. 106, 375 �2009�.50 D. E. Rosenfeld, Z. Gengeliczki, and M. D. Fayer, J. Phys. Chem. B 113,
13300 �2009�.51 D. E. Moilanen, E. E. Fenn, Y. S. Lin, J. L. Skinner, B. Bagchi, and M.
D. Fayer, Proc. Natl. Acad. Sci. U.S.A. 105, 5295 �2008�.52 J. B. Asbury, T. Steinel, C. Stromberg, S. A. Corcelli, C. P. Lawrence, J.
L. Skinner, and M. D. Fayer, J. Phys. Chem. A 108, 1107 �2004�.53 J. Zheng, K. Kwak, J. B. Asbury, X. Chen, I. Piletic, and M. D. Fayer,
Science 309, 1338 �2005�.54 S. T. Roberts, J. J. Loparo, and A. Tokmakoff, J. Chem. Phys. 125,
084502 �2006�.55 S. Park, M. Odelius, and K. J. Gaffney, J. Phys. Chem. B 113, 7825
�2009�.56 S. R. G. Naraharisetty, V. M. Kasyanenko, and I. V. Rubtsov, J. Chem.
034505-14 Bian et al. J. Chem. Phys. 133, 034505 �2010�
Downloaded 17 Jul 2010 to 168.7.210.43. Redistribution subject to AIP license or copyright; see http://jcp.aip.org/jcp/copyright.jsp
Phys. 128, 104502 �2008�.57 T. Steinel, J. B. Asbury, J. R. Zheng, and M. D. Fayer, J. Phys. Chem. A
108, 10957 �2004�.58 Z. H. Wang, A. Pakoulev, Y. Pang, and D. D. Dlott, J. Phys. Chem. A
108, 9054 �2004�.59 Z. H. Wang, Y. S. Pang, and D. D. Dlott, J. Phys. Chem. A 111, 3196
�2007�.60 V. Lenchenkov, C. X. She, and T. Q. Lian, J. Phys. Chem. B 110, 19990
�2006�.61 R. M. Whitnell, K. R. Wilson, and J. T. Hynes, J. Chem. Phys. 96, 5354
�1992�.62 R. Rey and J. T. Hynes, J. Chem. Phys. 108, 142 �1998�.
63 D. W. Oxtoby, Annu. Rev. Phys. Chem. 32, 77 �1981�.64 S. Z. Li, J. R. Schmidt, and J. L. Skinner, J. Chem. Phys. 125, 244507
�2006�.65 S. Z. Li, J. R. Schmidt, S. A. Corcelli, C. P. Lawrence, and J. L. Skinner,
J. Chem. Phys. 124, 11 �2006�.66 D. W. Oxtoby, Adv. Chem. Phys. 47, 487 �1981�.67 J. Zheng, K. Kwak, X. Chen, J. B. Asbury, and M. D. Fayer, J. Am.
Chem. Soc. 128, 2977 �2006�.68 J. R. Zheng and M. D. Fayer, J. Am. Chem. Soc. 129, 4328 �2007�.69 See supplementary material at http://dx.doi.org/10.1063/1.3458825 for
more figures and texts to further support and explain conclusions in themain text, and mathematical details of calculations.
034505-15 Intermolecular vibrational energy transfer J. Chem. Phys. 133, 034505 �2010�
Downloaded 17 Jul 2010 to 168.7.210.43. Redistribution subject to AIP license or copyright; see http://jcp.aip.org/jcp/copyright.jsp
001’0
0010
k1 (ω01’)
kn (ω01)
k3 (ω01)
k2 (ω01’)00
R2
0001’
0010
k1 (ω01’)
ke (ω01)
k3 (ω01)
k2 (ω01’)00
R1
Rephasing1 2 3ek k k k= − + + Nonrephasing 1 2 3nk k k k= − +
τ
Tw
t3
001’0
0010
k1 (ω01’)
kn (ω01)
k3 (ω01)
k2 (ω01’)00
R2
001’0
0010
k1 (ω01’)
kn (ω01)
k3 (ω01)
k2 (ω01’)00
001’0
0010
k1 (ω01’)
kn (ω01)
k3 (ω01)
k2 (ω01’)00
R2
0001’
0010
k1 (ω01’)
ke (ω01)
k3 (ω01)
k2 (ω01’)00
0001’
0010
k1 (ω01’)
ke (ω01)
k3 (ω01)
k2 (ω01’)00
R1
Rephasing1 2 3ek k k k= − + +Rephasing1 2 3ek k k k= − + + Nonrephasing 1 2 3nk k k k= − +Nonrephasing 1 2 3nk k k k= − +
τ
Tw
t3
τ
Tw
t3
001’0
1’1’1+1’ 1’
k1 (ω01’)
kn (ω1’-1+1’)
k3 (ω1’-1+1’)
k2 (ω01’)
1’1’
R4
001’0
1’1’1+1’ 1’
k1 (ω01’)
kn (ω1’-1+1’)
k3 (ω1’-1+1’)
k2 (ω01’)
1’1’
R4
Rephasing1 2 3ek k k k= − + +Rephasing1 2 3ek k k k= − + + Nonrephasing 1 2 3nk k k k= − +Nonrephasing 1 2 3nk k k k= − +
0001’
1’1’1+1’ 1’
k1 (ω01’)
ke (ω1’-1+1’)
k3 (ω1’-1+1’)
k2 (ω01’)
1’1’
R3
τ
Tw
t3
0001’
1’1’1+1’ 1’
k1 (ω01’)
ke (ω1’-1+1’)
k3 (ω1’-1+1’)
k2 (ω01’)
1’1’
R3
τ
Tw
t3
τ
Tw
t3
Figure S1. Feynman diagrams showing the origins of Peaks in fig. 1(B) and 1(C). R1 and R2 are for the Red peaks, and R3 and R4 are for the blue peaks. During the population period Tw, the excitation of one mode, e.g. CN, produces a hole on the ground state in R1 and R2, and populations on the 1st excited state. The decay of the populations will fill the hole. Therefore, the peak pairs will decay with the vibrational lifetime of the population during the population period under the ideal situation.
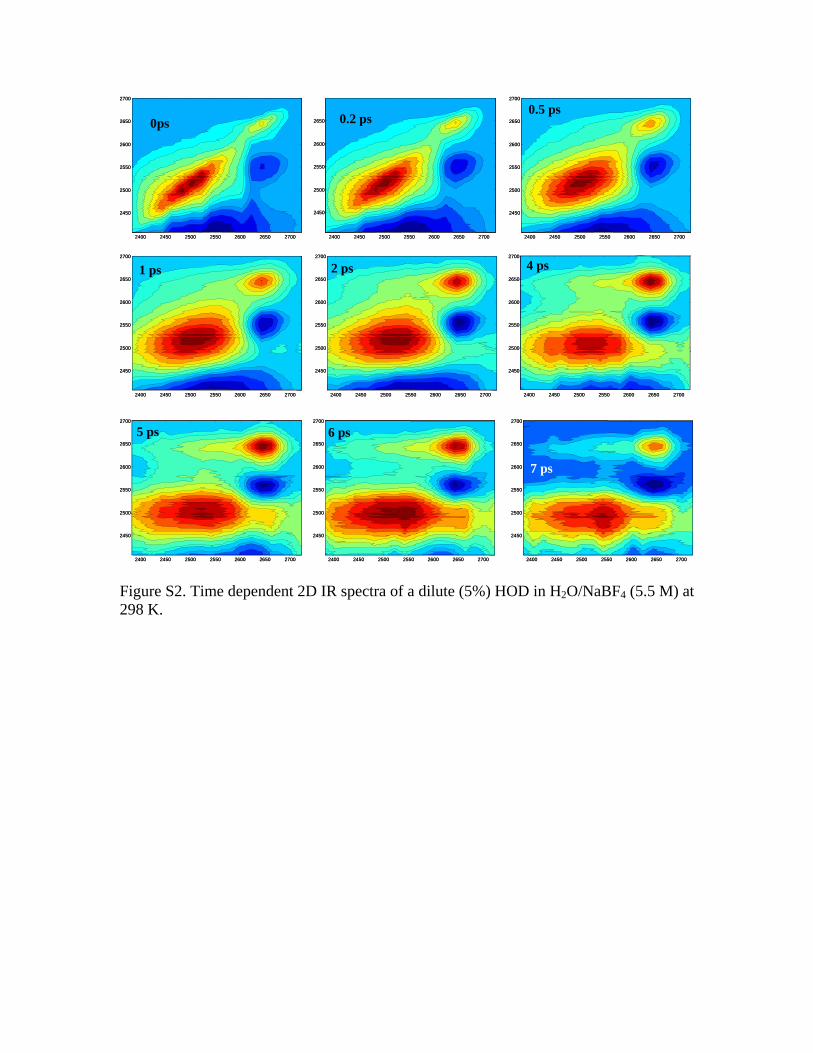
0ps
2400 2450 2500 2550 2600 2650 2700
2450
2500
2550
2600
2650
2700
0ps
2400 2450 2500 2550 2600 2650 2700
2450
2500
2550
2600
2650
2700
0.2 ps
2400 2450 2500 2550 2600 2650 2700
2450
2500
2550
2600
2650 0.2 ps
2400 2450 2500 2550 2600 2650 2700
2450
2500
2550
2600
2650
0.5 ps
2400 2450 2500 2550 2600 2650 2700
2450
2500
2550
2600
2650
2700
0.5 ps
2400 2450 2500 2550 2600 2650 2700
2450
2500
2550
2600
2650
2700
1 ps
2400 2450 2500 2550 2600 2650 2700
2450
2500
2550
2600
2650
2700
1 ps
2400 2450 2500 2550 2600 2650 2700
2450
2500
2550
2600
2650
2700
2 ps
2400 2450 2500 2550 2600 2650 2700
2450
2500
2550
2600
2650
2700
2 ps
2400 2450 2500 2550 2600 2650 2700
2450
2500
2550
2600
2650
2700
4 ps
2400 2450 2500 2550 2600 2650 2700
2450
2500
2550
2600
2650
2700
4 ps
2400 2450 2500 2550 2600 2650 2700
2450
2500
2550
2600
2650
2700
5 ps
2400 2450 2500 2550 2600 2650 2700
2450
2500
2550
2600
2650
2700
5 ps
2400 2450 2500 2550 2600 2650 2700
2450
2500
2550
2600
2650
2700
6 ps
2400 2450 2500 2550 2600 2650 2700
2450
2500
2550
2600
2650
2700
6 ps
2400 2450 2500 2550 2600 2650 2700
2450
2500
2550
2600
2650
2700
7 ps
2400 2450 2500 2550 2600 2650 2700
2450
2500
2550
2600
2650
2700
7 ps
2400 2450 2500 2550 2600 2650 2700
2450
2500
2550
2600
2650
2700
Figure S2. Time dependent 2D IR spectra of a dilute (5%) HOD in H2O/NaBF4 (5.5 M) at 298 K.
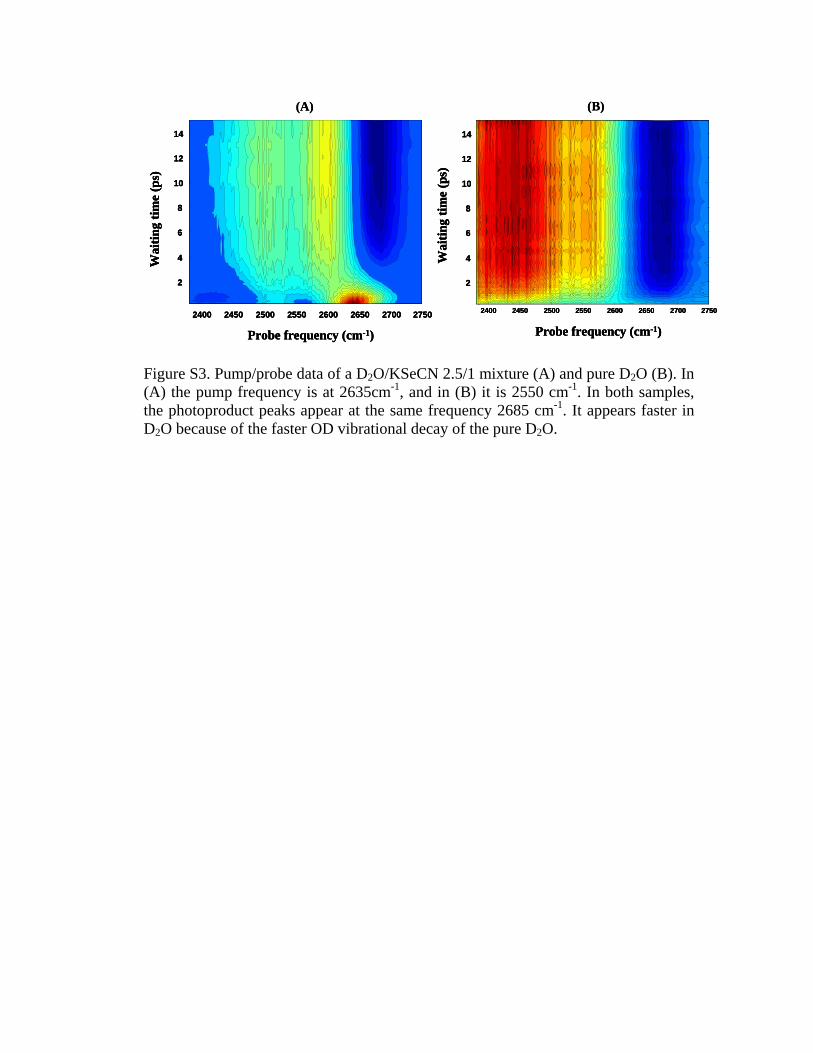
2400 2450 2500 2550 2600 2650 2700 2750
2
4
6
8
10
12
14
Wai
ting
time
(ps)
Probe frequency (cm-1)
2400 2450 2500 2550 2600 2650 2700 2750
2
4
6
8
10
12
14
Wai
ting
time
(ps)
Probe frequency (cm-1)
(A) (B)
2400 2450 2500 2550 2600 2650 2700 2750
2
4
6
8
10
12
14
Wai
ting
time
(ps)
Probe frequency (cm-1)
2400 2450 2500 2550 2600 2650 2700 2750
2
4
6
8
10
12
14
Wai
ting
time
(ps)
Probe frequency (cm-1)
2400 2450 2500 2550 2600 2650 2700 2750
2
4
6
8
10
12
14
Wai
ting
time
(ps)
Probe frequency (cm-1)
2400 2450 2500 2550 2600 2650 2700 2750
2
4
6
8
10
12
14
Wai
ting
time
(ps)
Probe frequency (cm-1)
(A) (B)
Figure S3. Pump/probe data of a D2O/KSeCN 2.5/1 mixture (A) and pure D2O (B). In (A) the pump frequency is at 2635cm-1, and in (B) it is 2550 cm-1. In both samples, the photoproduct peaks appear at the same frequency 2685 cm-1. It appears faster in D2O because of the faster OD vibrational decay of the pure D2O.

0 10 20 30 40 50 60-0.05
0.00
0.05
0.10
0.15
0.20
0.25
0.30
0.35
0-1 transition
Ani
sotro
py
Time Delay (ps)0 10 20 30 40 50 60
-0.05
0.00
0.05
0.10
0.15
0.20
0.25
0.30
1-2 transition
Ani
sotro
py
Time Delay (ps)
0 200 400 600 800 1000-0.35
-0.30
-0.25
-0.20
-0.15
-0.10
-0.05
0.00
0.05
pump 2075 cm-1
probe 2042 cm-1
37ps
PP
sig
nal
Waiting time (ps)
(a) (b) (c)
Figure S4. Vibrational (a) and rotational decays (b) from the 0-1 transition and (c) the 1-2 transition of the CN stretch of a 0.2 % KSeCN D2O solution. The vibrational lifetime is 37 ps. The rotational time is 3.8 0.3 ps± (b) and 4.1 0.2 ps± (c).

1’0’
0001000’0’
k1 (ω01)
ke (ω0’1’)
k3 (ω0’1’)k2 (ω01)
0’0’1’0’
0001000’0’
k1 (ω01)
ke (ω0’1’)
k3 (ω0’1’)k2 (ω01)
0’0’1’0’
0010000’0’
k2 (ω01)
kn (ω0’1’)
k3 (ω0’1’)
k1 (ω01)
0’0’1’0’
0010000’0’
k2 (ω01)
kn (ω0’1’)
k3 (ω0’1’)
k1 (ω01)
0’0’
Rephasing1 2 3ek k k k= − + +Rephasing1 2 3ek k k k= − + + Nonrephasing 1 2 3nk k k k= − +Nonrephasing 1 2 3nk k k k= − +
Figure S5. Feynmann diagrams for mode-specific vibrational energy transfers induced ground state bleachings. In such a scenario, during the population period, the energy transfer from one mode to the other, e.g. from the 1st excited of OD to that of CN, inevitably induces the ground state bleaching of CN since some of CN has accepted energy from OD and leave the ground state to its 1st excited state.

k1 (ω01)000111
ke (ω1’2’)
k3 (ω1’2’)
k2 (ω01)τ
Tw
t3
001011
k1 (ω01)
kn (ω1’2’)
k3 (ω1’2’)
k2 (ω01)
1’1’2’1’
1’1’
1’1’
1’1’2’1’
Rephasing1 2 3ek k k k= − + + Nonrephasing 1 2 3nk k k k= − +
k1 (ω01)000111
ke (ω1’2’)
k3 (ω1’2’)
k2 (ω01)τ
Tw
t3
τ
Tw
t3
001011
k1 (ω01)
kn (ω1’2’)
k3 (ω1’2’)
k2 (ω01)
1’1’2’1’
1’1’
1’1’
1’1’2’1’
Rephasing1 2 3ek k k k= − + +Rephasing1 2 3ek k k k= − + + Nonrephasing 1 2 3nk k k k= − +Nonrephasing 1 2 3nk k k k= − +
Figure S6. Feynman diagrams showing the origins of mode-specific energy transfer from OD to CN blue cross peak (2635 cm-1, 2042 cm-1). The first interaction frequency (the x-coordinate in 2D IR spectra) 01ω is the OD 0-1 transition frequency 2635 cm-1, and the emission frequency (the y-coordinate in 2D IR spectra) 1'2'ω is the CN 1-2 transition frequency 2042 cm-1. During the population period, the excitation of OD stretch (11) transfers to CN (1’1’). The new created CN 1st excited state population (1’1’) produces excited state absorption (1’2’) and emits signal (180 degree out of phase with the probe beam) at the 1’-2’ transition (CN 1-2) frequency. From the analysis, the growth of the cross peak is determined by the energy exchange rate, and the decay of the peak is determined by the CN vibrational relaxation.
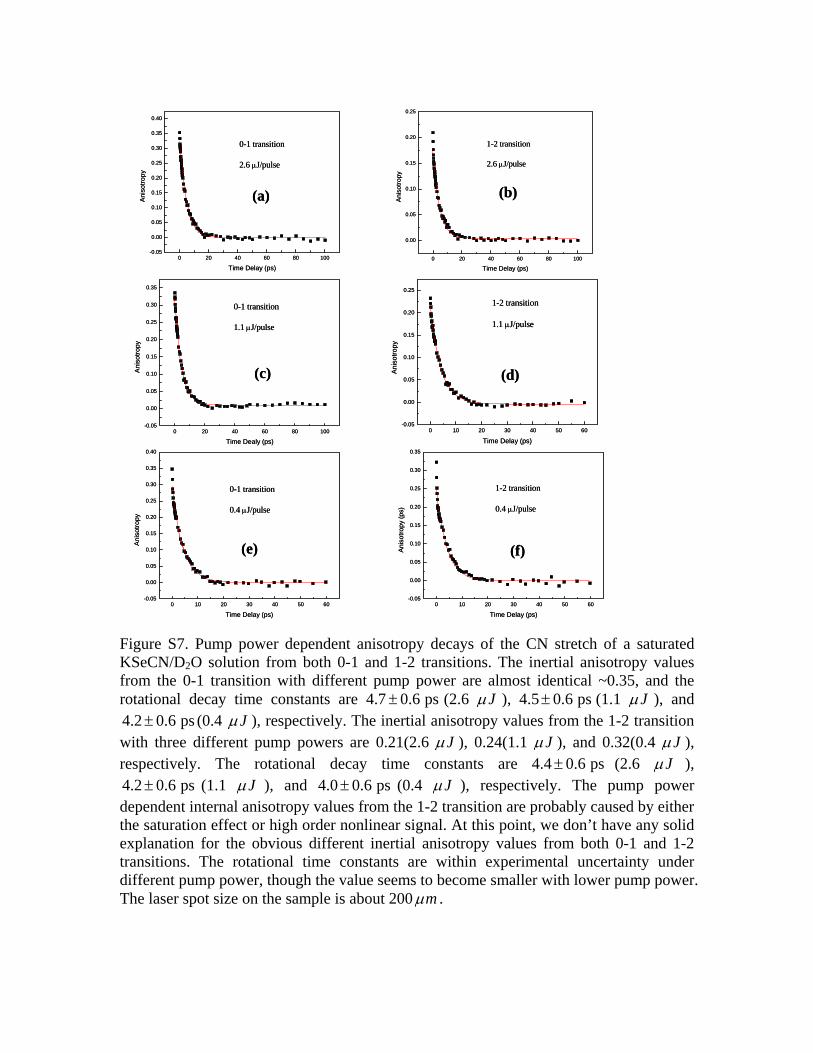
0 20 40 60 80 100-0.05
0.00
0.05
0.10
0.15
0.20
0.25
0.30
0.35
0.40
0-1 transition
2.6 µJ/pulse
Anis
otro
py
Time Delay (ps)0 20 40 60 80 100
0.00
0.05
0.10
0.15
0.20
0.25
1-2 transition
2.6 µJ/pulse
Anis
otro
py
Time Delay (ps)
0 20 40 60 80 100-0.05
0.00
0.05
0.10
0.15
0.20
0.25
0.30
0.35
0-1 transition
1.1 µJ/pulse
Ani
sotro
py
Time Dealy (ps)
0 10 20 30 40 50 60-0.05
0.00
0.05
0.10
0.15
0.20
0.25
1-2 transition
1.1 µJ/pulse
Ani
sotro
py
Time Delay (ps)
0 10 20 30 40 50 60-0.05
0.00
0.05
0.10
0.15
0.20
0.25
0.30
0.35
0.40
0-1 transition
0.4 µJ/pulse
Anis
otro
py
Time Delay (ps)0 10 20 30 40 50 60
-0.05
0.00
0.05
0.10
0.15
0.20
0.25
0.30
0.35
1-2 transition
0.4 µJ/pulse
Anis
otro
py (p
s)
Time Delay (ps)
(a) (b)
(c) (d)
(f)(e)
0 20 40 60 80 100-0.05
0.00
0.05
0.10
0.15
0.20
0.25
0.30
0.35
0.40
0-1 transition
2.6 µJ/pulse
Anis
otro
py
Time Delay (ps)0 20 40 60 80 100
0.00
0.05
0.10
0.15
0.20
0.25
1-2 transition
2.6 µJ/pulse
Anis
otro
py
Time Delay (ps)
0 20 40 60 80 100-0.05
0.00
0.05
0.10
0.15
0.20
0.25
0.30
0.35
0-1 transition
1.1 µJ/pulse
Ani
sotro
py
Time Dealy (ps)
0 10 20 30 40 50 60-0.05
0.00
0.05
0.10
0.15
0.20
0.25
1-2 transition
1.1 µJ/pulse
Ani
sotro
py
Time Delay (ps)
0 10 20 30 40 50 60-0.05
0.00
0.05
0.10
0.15
0.20
0.25
0.30
0.35
0.40
0-1 transition
0.4 µJ/pulse
Anis
otro
py
Time Delay (ps)0 10 20 30 40 50 60
-0.05
0.00
0.05
0.10
0.15
0.20
0.25
0.30
0.35
1-2 transition
0.4 µJ/pulse
Anis
otro
py (p
s)
Time Delay (ps)
(a) (b)
(c) (d)
(f)(e)
Figure S7. Pump power dependent anisotropy decays of the CN stretch of a saturated KSeCN/D2O solution from both 0-1 and 1-2 transitions. The inertial anisotropy values from the 0-1 transition with different pump power are almost identical ~0.35, and the rotational decay time constants are 4.7 0.6 ps± (2.6 Jµ ), 4.5 0.6 ps± (1.1 Jµ ), and 4.2 0.6 ps± (0.4 Jµ ), respectively. The inertial anisotropy values from the 1-2 transition with three different pump powers are 0.21(2.6 Jµ ), 0.24(1.1 Jµ ), and 0.32(0.4 Jµ ), respectively. The rotational decay time constants are 4.4 0.6 ps± (2.6 Jµ ), 4.2 0.6 ps± (1.1 Jµ ), and 4.0 0.6 ps± (0.4 Jµ ), respectively. The pump power dependent internal anisotropy values from the 1-2 transition are probably caused by either the saturation effect or high order nonlinear signal. At this point, we don’t have any solid explanation for the obvious different inertial anisotropy values from both 0-1 and 1-2 transitions. The rotational time constants are within experimental uncertainty under different pump power, though the value seems to become smaller with lower pump power. The laser spot size on the sample is about 200 mµ .
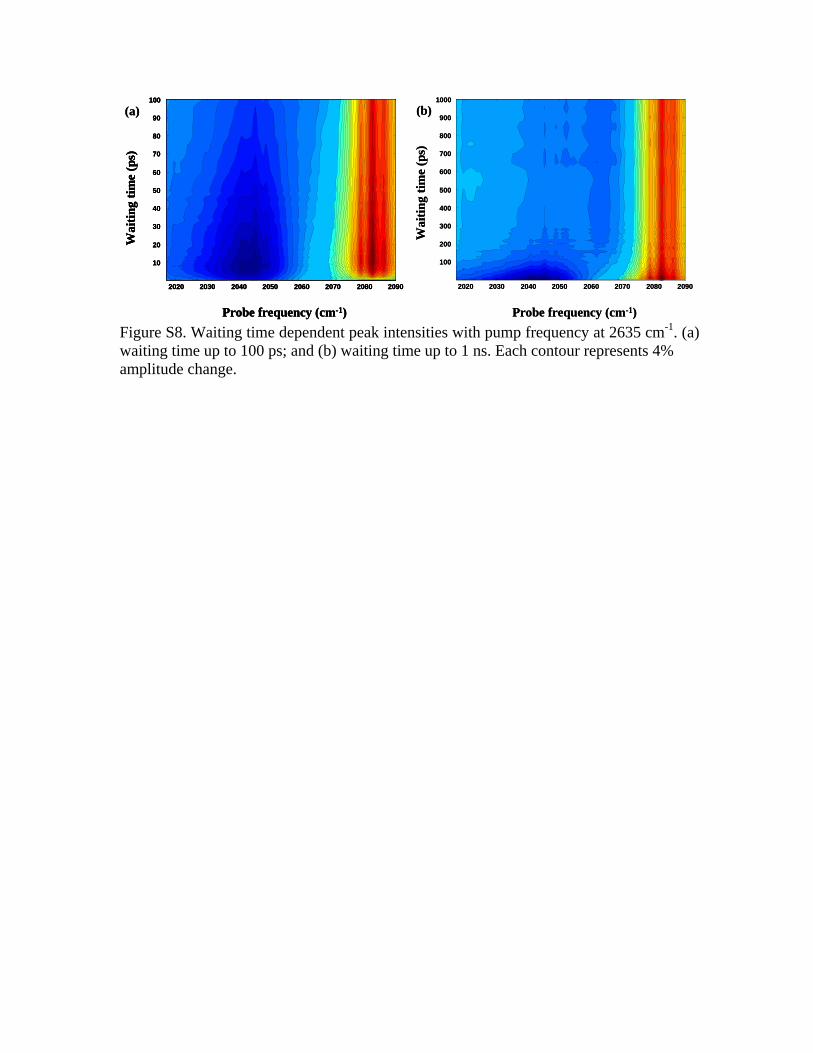
2020 2030 2040 2050 2060 2070 2080 2090
10
20
30
40
50
60
70
80
90
100
Wai
ting
time
(ps)
Probe frequency (cm-1)
2020 2030 2040 2050 2060 2070 2080 2090
100
200
300
400
500
600
700
800
900
1000
Wai
ting
time
(ps)
Probe frequency (cm-1)
(a) (b)
2020 2030 2040 2050 2060 2070 2080 2090
10
20
30
40
50
60
70
80
90
100
Wai
ting
time
(ps)
Probe frequency (cm-1)
2020 2030 2040 2050 2060 2070 2080 2090
10
20
30
40
50
60
70
80
90
100
Wai
ting
time
(ps)
Probe frequency (cm-1)
2020 2030 2040 2050 2060 2070 2080 2090
100
200
300
400
500
600
700
800
900
1000
Wai
ting
time
(ps)
Probe frequency (cm-1)
(a) (b)
Figure S8. Waiting time dependent peak intensities with pump frequency at 2635 cm-1. (a) waiting time up to 100 ps; and (b) waiting time up to 1 ns. Each contour represents 4% amplitude change.
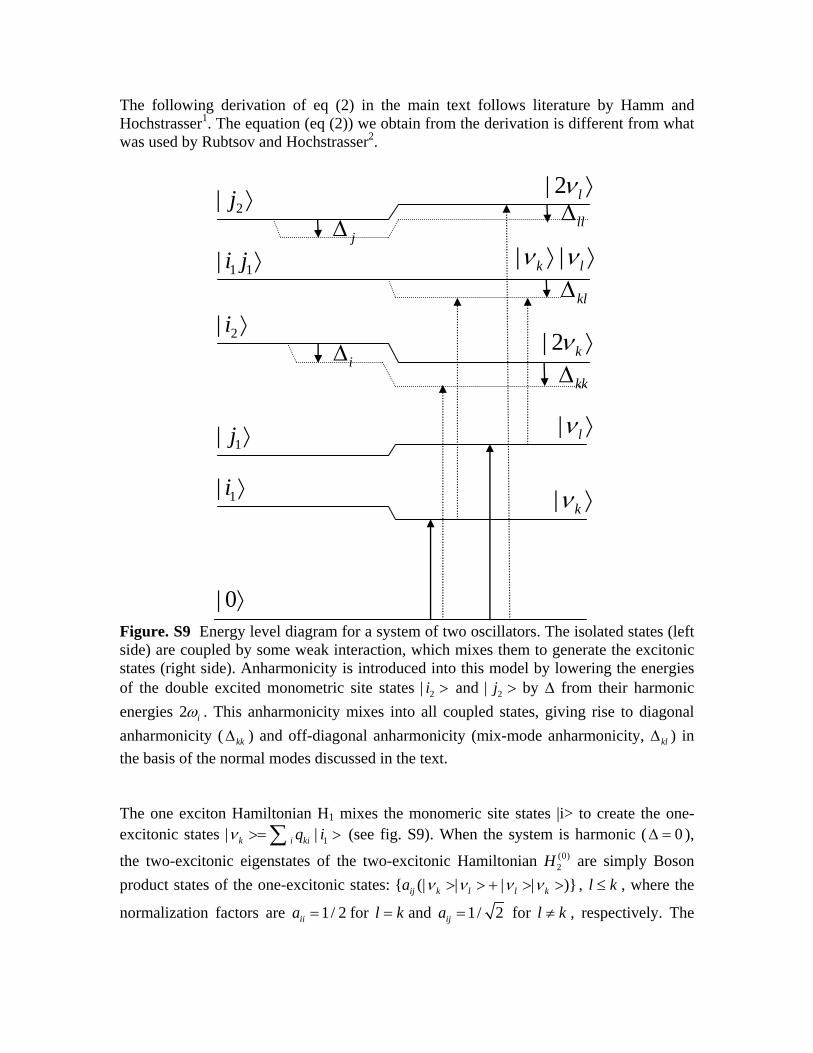
The following derivation of eq (2) in the main text follows literature by Hamm and Hochstrasser1. The equation (eq (2)) we obtain from the derivation is different from what was used by Rubtsov and Hochstrasser2.
2| j ⟩
1 1| i j ⟩
2| i ⟩
1| j ⟩
1| i ⟩
| 0⟩
| kν ⟩
| lν ⟩
| 2 lν ⟩∆ll
∆kl
∆kk
| |k lν ν⟩ ⟩∆ j
∆i| 2 kν ⟩
Figure. S9 Energy level diagram for a system of two oscillators. The isolated states (left side) are coupled by some weak interaction, which mixes them to generate the excitonic states (right side). Anharmonicity is introduced into this model by lowering the energies of the double excited monometric site states 2| i > and 2| j > by ∆ from their harmonic energies 2ωi . This anharmonicity mixes into all coupled states, giving rise to diagonal anharmonicity (∆kk ) and off-diagonal anharmonicity (mix-mode anharmonicity, ∆kl ) in the basis of the normal modes discussed in the text. The one exciton Hamiltonian H1 mixes the monomeric site states |i> to create the one-excitonic states 1| |k i kiq iν >= >∑ (see fig. S9). When the system is harmonic ( 0∆ = ),
the two-excitonic eigenstates of the two-excitonic Hamiltonian (0)2H are simply Boson
product states of the one-excitonic states: { (| | | | )}ij k l l ka ν ν ν ν> > + > > , l k≤ , where the
normalization factors are 1/ 2iia = for l k= and 1/ 2ija = for l k≠ , respectively. The
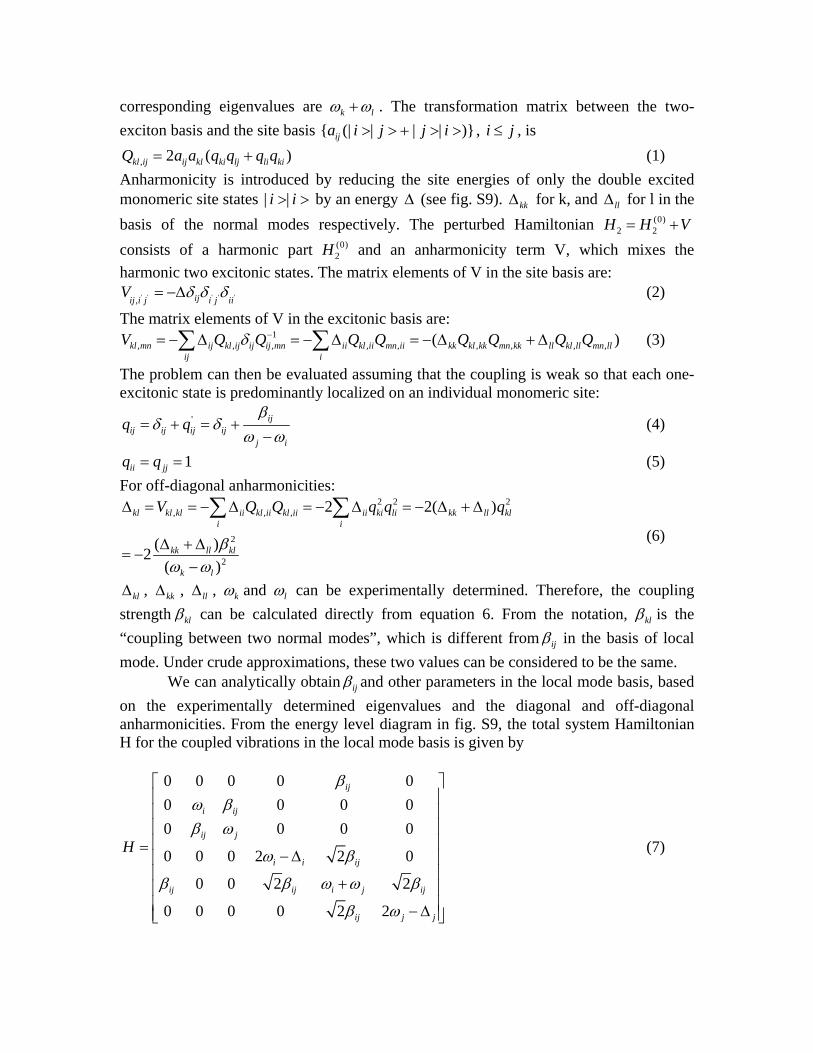
corresponding eigenvalues are ω ω+k l . The transformation matrix between the two-exciton basis and the site basis { (| | | | )}ija i j j i> > + > > , i j≤ , is
, 2 ( )kl ij ij kl ki lj li kiQ a a q q q q= + (1) Anharmonicity is introduced by reducing the site energies of only the double excited monomeric site states | |i i> > by an energy ∆ (see fig. S9). ∆kk for k, and ∆ll for l in the basis of the normal modes respectively. The perturbed Hamiltonian (0)
2 2H H V= + consists of a harmonic part (0)
2H and an anharmonicity term V, which mixes the harmonic two excitonic states. The matrix elements of V in the site basis are:
' ' ' ' ', ijij i j i j iiV δ δ δ= −∆ (2)
The matrix elements of V in the excitonic basis are: 1
, , , , , , , , ,( )kl mn ij kl ij ij ij mn ii kl ii mn ii kk kl kk mn kk ll kl ll mn llij i
V Q Q Q Q Q Q Q Qδ −= − ∆ = − ∆ = − ∆ + ∆∑ ∑ (3)
The problem can then be evaluated assuming that the coupling is weak so that each one-excitonic state is predominantly localized on an individual monomeric site:
' βδ δ
ω ω= + = +
−ij
ij ij ij ijj i
q q (4)
1ii jjq q= = (5) For off-diagonal anharmonicities:
2 2 2, , ,
2
2
2 2( )
( )2( )
βω ω
∆ = = − ∆ = − ∆ = − ∆ + ∆
∆ + ∆= −
−
∑ ∑kl kl kl ii kl ii kl ii ii ki li kk ll kli i
kk ll kl
k l
V Q Q q q q
(6)
∆kl , ∆kk , ∆ll , ωk and ωl can be experimentally determined. Therefore, the coupling strength βkl can be calculated directly from equation 6. From the notation, βkl is the “coupling between two normal modes”, which is different fromβij in the basis of local mode. Under crude approximations, these two values can be considered to be the same.
We can analytically obtainβij and other parameters in the local mode basis, based on the experimentally determined eigenvalues and the diagonal and off-diagonal anharmonicities. From the energy level diagram in fig. S9, the total system Hamiltonian H for the coupled vibrations in the local mode basis is given by
0 0 0 0 00 0 0 00 0 0 0
0 0 0 2 2 0
0 0 2 2
0 0 0 0 2 2
βω ββ ω
ω β
β β ω ω β
β ω
⎡ ⎤⎢ ⎥⎢ ⎥⎢ ⎥⎢ ⎥= − ∆⎢ ⎥⎢ ⎥+⎢ ⎥⎢ ⎥− ∆⎢ ⎥⎣ ⎦
ij
i ij
ij j
i i ij
ij ij i j ij
ij j j
H (7)
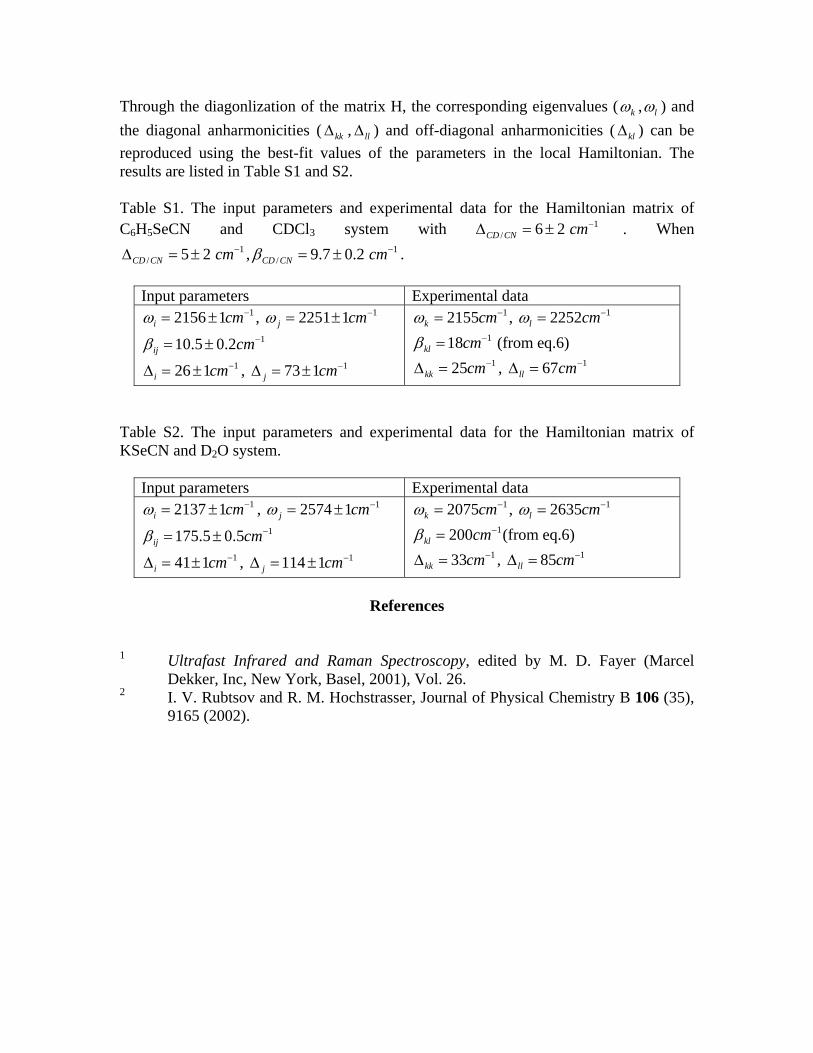
Through the diagonlization of the matrix H, the corresponding eigenvalues (ωk ,ωl ) and the diagonal anharmonicities (∆kk ,∆ll ) and off-diagonal anharmonicities (∆kl ) can be reproduced using the best-fit values of the parameters in the local Hamiltonian. The results are listed in Table S1 and S2. Table S1. The input parameters and experimental data for the Hamiltonian matrix of C6H5SeCN and CDCl3 system with 1
/ 6 2 CD CN cm−∆ = ± . When 1
/ 5 2 CD CN cm−∆ = ± , 1/ 9.7 0.2 CD CN cmβ −= ± .
Input parameters Experimental data
12156 1ω −= ±i cm , 12251 1ω −= ±j cm 110.5 0.2β −= ±ij cm
126 1 −∆ = ±i cm , 173 1 −∆ = ±j cm
12155ω −=k cm , 12252ω −=l cm 118 (from eq.6)kl cmβ −= 125 −∆ =kk cm , 167 −∆ =ll cm
Table S2. The input parameters and experimental data for the Hamiltonian matrix of KSeCN and D2O system.
Input parameters Experimental data 12137 1ω −= ±i cm , 12574 1ω −= ±j cm
1175.5 0.5β −= ±ij cm 141 1 −∆ = ±i cm , 1114 1 −∆ = ±j cm
12075ω −=k cm , 12635ω −=l cm 1200 (from eq.6)kl cmβ −=
133 −∆ =kk cm , 185 −∆ =ll cm
References
1 Ultrafast Infrared and Raman Spectroscopy, edited by M. D. Fayer (Marcel
Dekker, Inc, New York, Basel, 2001), Vol. 26. 2 I. V. Rubtsov and R. M. Hochstrasser, Journal of Physical Chemistry B 106 (35),
9165 (2002).


![Enantioselective, intermolecular [2+2] photocycloaddition ... · Enantioselective, intermolecular [2+2] photocycloaddition reactions of 3-acetoxyquinolone: Total synthesis of (−−−−)-pinolinone](https://img.pdfslide.tips/doc/110x75/5f0c40f67e708231d4347d2f/enantioselective-intermolecular-22-photocycloaddition-enantioselective.jpg)