Embed Size (px)
Citation preview

Aqua-LAC - Vol. 9 - Nº. 1 - Mar. 2017 1
ADVANCED hyDRAULIC AND WATER qUALITy MODELING TO ASSESS FLOOD AND POLLUTION IMPACTS: A CASE STUDy OF ThE CARACOL INDUSTRIAL PARk IN hAITI
MODÉLISATION AVANCÉE DE LA qUALITÉ hyDRAULIqUE ET DE L'EAU POUR ÉVALUER LES EFFETS DES INONDATIONS ET DE LA POLLUTION: UNE ÉTUDE DE CAS
DE L'ESCARGOT DU PARC INDUSTRIEL EN hAïTI
MODELACION HIDRODINAMICA Y DE CALIDAD DEL AGUA PARA EVALUAR EL IMPACTO DE INUNDACIONES Y DE CONTAMINACION. UN CASO DE ESTUDIO DEL
PARQUE INDUSTRIAL CARACOL EN HAITI
Garcia, Reinaldo1 and Miralles-Wilhelm, Fernando2
AbstractIn this paper, we describe the application of advanced hydraulic and water quality models to assess flood risks at the de-velopment site of Parc Industriel Caracol (PIC) in northern Haiti, and evaluate water quality scenarios of the Trou-du-Nord River downstream of the PIC to support the development of the Trou du Nord Watershed Management Plan. To achieve the study goals, we implemented the RiverFlow2D hydraulic model to perform the numerical simulations required in the PIC project. To evaluate potential flooding scenarios at the PIC, we developed design storms based on rainfall scenarios that take into account a wide variety of events that can affect the area of interest. Two types of flooding scenarios were considered: Sunny Day and Rainfall. In both cases, runs were made for 1, 2, 5, 10, 25, 50, 100 and 200 year events and results included maximum flooding depth, maximum velocities, and other parameters to assess flood impacts. The model also reports inundation times that indicate how many hours each area remains flooded to a given depth equal. Water qual-ity model simulations were performed to evaluate the impact of the effluent discharge from the PIC wastewater treatment plant. Four simulation scenarios correspond to a range of effluent and river pollutant concentrations and different water dis-charges from the Trou du Nord River. Simulations confirm that the most unfavorable case is when the Trou du Nord River is dry. Even for relatively low river flows, pollutant concentrations decrease significantly due to the dilution effect of the water from the Trou du Nord River. The hydraulic and water quality models developed in this work can be used further to assess the flood risk to communities located downstream of the PIC, as well as to evaluate impacts of variations in wastewater discharges on the water quality reaching these communities.Keywords: Hydrodynamic modeling, water quality, floods.
RésuméDans cet article, nous décrivons l’application de modèles hydrauliques avancés et de qualité de l’eau pour évaluer les risques d’inondation du Parc Industriel Caracol (PIC) dans le nord de Haïti, et d’évaluer des scénarios de qualité de l’eau de la rivière Trou-du-Nord rivière en aval du PIC pour soutenir le développement du plan de gestion du bassin versant Trou du Nord. Pour atteindre les objectifs de l’étude, nous avons mis en œuvre le modèle hydraulique RiverFlow2D pour effectuer les simulations numériques nécessaires au projet PIC. Pour évaluer les scénarios d’inondation potentiels au PIC, nous avons développé des tempêtes extrêmes basées sur des scénarios de précipitations qui prennent en compte une grande variété d’événements qui peuvent avoir une incidence sur la zone d’intérêt. Deux types de scénarios d’inondation ont été envisagés: « Jour ensoleillé» et « Jour pluvieux». Dans les deux cas, les essais ont été faits pour Tr=1, 2, 5, 10, 25, 50, 100 et 200 années et les résultats inclus profondeur maximale d’inondation, les vitesses maximales, et d’autres para-mètres pour évaluer les impacts des inondations. Le modèle génère également les temps d’inondation. Les simulations du modèle de qualité de l’eau ont été réalisées pour évaluer l’impact de l’effluent de l’usine de traitement des eaux usées de PIC. Quatre scénarios de simulation correspondent à une gamme de concentrations de polluants des effluents et de la rivière et les différents rejets d’eau de la rivière Trou du Nord. Les simulations confirment que le cas le plus défavorable est lorsque la rivière est sèche. Même pour des débits relativement faibles de la rivière, les concentrations de polluants dimi-nuent considérablement en raison de l’effet de dilution de l’eau de la rivière du Nord Trou. Les modèles développés dans ce travail peuvent être utilisés en outre pour évaluer les risques d’inondation pour les communautés situées en aval de la PIC, ainsi que pour évaluer les impacts des variations des rejets d’eaux usées sur la qualité de l’eau que pour atteindre ces communautés.Mots-clés: Modélisation hydrodynamique, la qualité de l’eau, les inondations.
1 Applied Research Center. Florida International University. [email protected] University of Maryland. [email protected]
Recibido: 29/08/2016Aceptado: 19/05/2017
Aqua-LAC - Vol. 9 - Nº 1 - Mar. 2017. pp. 1 - 14

Aqua-LAC - Vol. 9 - Nº. 1 - Mar. 20172
ResumenEn este trabajo se describe la aplicación de modelos avanzados de hidráulica y de calidad de agua para evaluar los ries-gos de inundación en el Parque Industrial Caracol (PIC) en el norte de Haití y valorar escenarios de calidad del agua del Rio Trou-du-Trou aguas abajo de la PIC. Los resultados de las simulaciones apoyarán el desarrollo del plan de Gestión de Cuenca del Rio Trou du Nord. Para lograr los objetivos del estudio, se implementó el modelo hidráulico RiverFlow2D a fin de realizar las simulaciones numéricas requeridas en el proyecto. Para evaluar los posibles escenarios de inundación en el PIC, se desarrollaron tormentas de diseño basadas en escenarios de precipitaciones que contemplan una amplia variedad de eventos que pudiesen afectar a la zona de interés. Se consideraron dos tipos de escenarios de inundación: “Día soleado” y “Dia con precipitaciones”. En ambos casos, se hicieron corridas de Tr= 1, 2, 5, 10, 25, 50, 100 y 200 años y los resultados incluyeron profundidad máxima inundaciones, velocidades máximas, y otros parámetros para evaluar los impactos de inundación. El modelo también genera los tiempos de inundación. Se realizaron simulaciones del modelo de calidad del agua para evaluar el impacto del vertido del efluente de la planta de tratamiento de aguas residuales del PIC. Los cuatro escenarios de simulación cubren un rango de concentraciones de contaminantes de efluentes y fluviales y diferentes descargas de agua del río Trou du Nord. Las simulaciones confirman que el caso más desfavorable es cuando el río está seco. Incluso para los flujos relativamente bajos, las concentraciones de contaminantes disminuyen significati-vamente debido al efecto de dilución del agua proveniente del río Trou fu Nord. Los modelos desarrollados en este trabajo se pueden utilizar adicionalmente para evaluar el riesgo de inundaciones para las comunidades ubicadas aguas debajo del PIC, así como para evaluar el impacto de las variaciones de descargas de aguas residuales en la calidad del agua que llega a esas comunidades.Palabras Clave: Modelación hidrodinámica, calidad de agua, inundaciones.
1. INTRODUCTION
The vulnerability of Caribbean islands to natural and human-induced disasters and their inability to cope with the problem necessitates an understanding of the hydrological processes and responses of the watersheds to various stressors. This challenge is further complicated at a time when development pressures rise due to population growth and socioeconomic needs, while there is increased uncertainty of rainfall in a changing climate. This is particularly true for Haiti, which has the lowest GDP of the region and ranks among the first in the region in terms of environmental degradation (IADB, 2017). Therefore, sustainable planning and management are essential for sustainability of fresh water resources in the watersheds.In this paper, we describe the application of advanced hydraulic and water quality models to assess flood risks at the development site of Parc Industriel Caracol (PIC) in northern Haiti, and evaluate water quality scenarios of the Trou-du-Nord River downstream of the PIC to support de development of the Trou du Nord Watershed Management Plan.Previous modeling efforts in the Trou du Nord watershed have been restricted by limitations of the models used. For example, Environ, (2011) use a steady-state modeling approach to estimate runoff flow rates at the PIC; this approach fails to capture the temporal and spatial dynamics of flooding (and water quality) that occur due to rainfall variability and fine scale terrain features. Physically-based models such as the one implemented in this project can better capture the hydraulic response of an area like the PIC because they parametrize the hydrologic system’s inputs, the physical laws which govern its behavior, boundary, and initial conditions and the key relationships between storms and terrain.
This study addresses the following key questions and requirements.• The models should be capable of addressing
flooding in the PIC area under different situations including, existing conditions, future development conditions, effect of rainfall and discharge from the Trou du Nord River.
• The model should be capable of addressing future changes in the PIC development.
• Determine the evolution of the water quality in the Trou du Nord River downstream from the PIC
• Assessing flooding risk for the PIC. This involves determining flood depth, velocities and inundation times for a number of events representative of the storm occurrence frequency in the area.
• Perform discrete water quality modeling. This requires simulating effluent discharge from the PIC Water Treatment Plant into the Trou du Nord River.
• The models (both for flood estimation and for water quality) should be capable of being calibrated and validated as new data is collected.
2. METhODOLOGy
To achieve the study goals, we implemented the RiverFlow2D hydraulic model to perform the numerical simulations required in the PIC project. RiverFlow2D is a suite of two-dimensional river and estuary flexible mesh models (Garcia et al. 2006, 2009; Murillo et al. 2010) that can support flood risks and water quality assessments including hydraulic structures (www.hydronia.com). RiverFlow2D’s stable and fast numerical engine allows treating high speed
Garcia, Reinaldo and Miralles-Wilhelm, Fernando

Aqua-LAC - Vol. 9 - Nº. 1 - Mar. 2017 3
flows and fast frontal waves over initially dry terrain (Mahmoudi et al. 2015). Setting up RiverFlow2D simulations with the integrated GIS user interface is fast and straightforward. The high performance GPU version is able to run up to 100 times faster than a non-parallelized single-processor model.To solve the shallow water, sediment and pollutant transport equations, the RiverFlow2D model uses an unstructured flexible mesh formed by triangles of different sizes that can be adapted around the most complex geometries (Murillo et al. 2005, 2008, 2010). The mesh can be generated and refined over the areas of more interest to the project such as main river channel, buildings, etc.RiverFlow2D can handle discharges of any number of different pollutants simultaneously accounting for advection by the river velocities, dispersion, and reaction rates if applicable (Murillo et al. 2010). This greatly simplifies the analysis of multiple pollutant discharge scenarios providing high accuracy taking advantage of the high resolution triangular element mesh.
2.1 INPUT DATA
Rainfall Scenarios and Design Storms
To evaluate potential flooding scenarios at the PIC, we developed design storms based on rainfall scenarios that take into account a wide variety of events that can affect the area of interest. We used the maximum
daily rainfall storm amounts that were generated in an earlier stage of the study, and assumed typical 24-hour storm distribution applicable to southern Florida (and herein used for this region) using a SCS Type IIIG (See Figure 1) as an approximation for the rainfall intensity that can occur in Northern Haiti.The total 24-hour rainfall accumulations for each return period used to generate the design storms for the PIC flood simulations are shown in Table 1.
Table 1. Total 24-hour rainfall for Return Periods Considered
Return Period (years)
Total 24-hour Rainfall (mm)
1 60.00
2 153.32
5 222.93
10 273.45
25 342.18
50 396.72
100 454.4
200 515.53
With these assumptions, we generated design storms consisting on hyetographs for return period events of 1, 2, 5, 10, 25, 50, 100 and 200 years.
4 Aqua-LAC Vol. NN – No N2 – Jul. 2016 pp. XX-XX
Figure 1 Twenty-four hour rainfall distribution SCS-Type IIIG.
The total 24-hour rainfall accumulations for each return period used to generate the design storms for the PIC flood simulations are shown in Table 1.
Figure 1. Twenty-four hour rainfall distribution SCS-Type IIIG
Advanced hydraulic and water quality modeling to assess flood and pollution impacts: a case study of the Caracol Industrial Park in Haiti

Aqua-LAC - Vol. 9 - Nº. 1 - Mar. 20174
Inflow Hydrographs from the Trou-du-Nord Wa-tershedFor the purpose of the flood simulations presented in this paper, we used the outflow hydrographs generated by the SWAT model applied to the Trou du Nord watershed that is reported in a companion paper of this same journal [Reference to companion paper]. The hyetograph for each return period described in the previous section were input in SWAT and resulted in hydrographs upstream of the PIC for each event. These hydrographs shown in Figure 2 were in turn introduced into the RiverFlow2D model as inflow conditions to perform the flooding simulations. The peak discharges for each hydrograph are presented in Table 2.
Table 2. Peak discharges for each return period considered
Tryears
Peak dischargem3/s
1 13.00
2 47.80
5 69.30
10 82.60
25 104.54
50 122.76
100 140.05
200 160.00
Aqua-LAC Vol. NN – No N2 – Jul. 2016 pp. XX-XX 5
Table 1 Total 24-hour rainfall for Return Periods Considered.
Return Period (years)
Total 24-hour Rainfall (mm)
1 60.00
2 153.32
5 222.93
10 273.45
25 342.18
50 396.72
100 454.4
200 515.53 With these assumptions, we generated design storms consisting on hyetographs for return period events of 1, 2, 5, 10, 25, 50, 100 and 200 years. Inflow Hydrographs from the Trou-du-Nord Watershed For the purpose of the flood simulations presented in this paper, we used the outflow hydrographs generated by the SWAT model applied to the Trou du Nord watershed that is reported in a companion paper of this same journal [Reference to companion paper]. The hyetograph for each return period described in the previous section were input in SWAT and resulted in hydrographs upstream of the PIC for each event. These hydrographs shown in Figure 2 were in turn introduced into the RiverFlow2D model as inflow conditions to perform the flooding simulations. The peak discharges for each hydrograph are presented in Table 2.
Figure 2 Inflow hydrographs. Tr is used to denote return period (in years) as in Table 1.
Figure 2. Inflow hydrographs. Tr is used to denote return period (in years) as in Table 1
Digital Elevation Model
A digital elevation model with a resolution of 2 meters was used to represent the terrain topography. The DEM corresponds to UTM_Zone 18 Northern Hemisphere DATUM WGS84 SPHEROID WGS84 PROJECTION Transverse_Mercator. The data was obtained as part of this investigation, and was processed to determine elevations on the centroids of each triangular cell, through sampling and Inverse-Distance-Weighting interpolation. The cross sections of the Trou du Nord river were extracted from this DEM.
Modeling Area
Figure 3 shows the extent of the modeling area that has 16.3 km2. Several of the existing industrial buildings of the PIC can be clearly observed on the figure. The INFLOW annotation at the lower end of the area is where the inflow hydrographs from the Trou-du-Nord watershed previously described, were imposed. Downstream at the coastal line, we set open free outflow boundaries to let the water from the river enter into the Caracol Bay.
Garcia, Reinaldo and Miralles-Wilhelm, Fernando

Aqua-LAC - Vol. 9 - Nº. 1 - Mar. 2017 5
6 Aqua-LAC Vol. NN – No N2 – Jul. 2016 pp. XX-XX
Table 2 Peak discharges for each return period considered.
Tr years Peak discharge
m3/s 1 13.00 2 47.80 5 69.30 10 82.60 25 104.54 50 122.76 100 140.05 200 160.00
Digital Elevation Model A digital elevation model with a resolution of 2 meters was used to represent the terrain topography. The DEM corresponds to UTM_Zone 18 Northern Hemisphere DATUM WGS84 SPHEROID WGS84 PROJECTION Transverse_Mercator. The data was obtained as part of this investigation, and was processed to determine elevations on the centroids of each triangular cell, through sampling and Inverse-Distance-Weighting interpolation. The cross sections of the Trou du Nord river were extracted from this DEM. Modeling Area Figure 3 shows the extent of the modeling area that has 16.3 km2. Several of the existing industrial buildings of the PIC can be clearly observed on the figure. The INFLOW annotation at the lower end of the area is where the inflow hydrographs from the Trou-du-Nord watershed previously described, were imposed. Downstream at the coastal line, we set open free outflow boundaries to let the water from the river enter into the Caracol Bay.
Figure 3. Extent of the Modeling Area
Figure 4 shows the triangular-cell mesh used by the model to calculate velocities and depths at every cell. The mesh was refined to have a higher resolution along the main river and also on the PIC area, resulting on 133,848 cells. Triangle sizes ranged from 1.5 m to 16.5 m approximately.
Aqua-LAC Vol. NN – No N2 – Jul. 2016 pp. XX-XX 7
Figure 4 shows the triangular-cell mesh used by the model to calculate velocities and depths at every cell. The mesh was refined to have a higher resolution along the main river and also on the PIC area, resulting on 133,848 cells. Triangle sizes ranged from 1.5 m to 16.5 m approximately.
Figure 5 depicts a detailed view around the PIC area. Note that the mesh has been generated around the main PIC buildings in order to represent the effect that these structures can have on the flooding.
Figure 5 Detail of RiverFlow2D spatial mesh on the PIC area. The model calculates the flow
velocity and depth at each triangle and throughout the simulation period of 24 hours.
Figure 4. Triangular-element mesh used by the RiverFlow2D model. The average size of the
triangular grid in the finest resolution (near the river and the PIC infrastructure) is 1.5 meters
Figure 5 depicts a detailed view around the PIC area. Note that the mesh has been generated around the main PIC buildings in order to represent the effect that these structures can have on the flooding.
Aqua-LAC Vol. NN – No N2 – Jul. 2016 pp. XX-XX 7
Figure 4 shows the triangular-cell mesh used by the model to calculate velocities and depths at every cell. The mesh was refined to have a higher resolution along the main river and also on the PIC area, resulting on 133,848 cells. Triangle sizes ranged from 1.5 m to 16.5 m approximately.
Figure 4 Triangular-element mesh used by the RiverFlow2D model. The average size of the
triangular grid in the finest resolution (near the river and the PIC infrastructure) is 1.5 meters.
Figure 5 depicts a detailed view around the PIC area. Note that the mesh has been generated around the main PIC buildings in order to represent the effect that these structures can have on the flooding.
Figure 5. Detail of RiverFlow2D spatial mesh on the PIC area. The model calculates the flow velocity and depth at each triangle and throughout the simulation period of 24 hours
Advanced hydraulic and water quality modeling to assess flood and pollution impacts: a case study of the Caracol Industrial Park in Haiti

Aqua-LAC - Vol. 9 - Nº. 1 - Mar. 20176
3. FLOODING SIMULATIONS
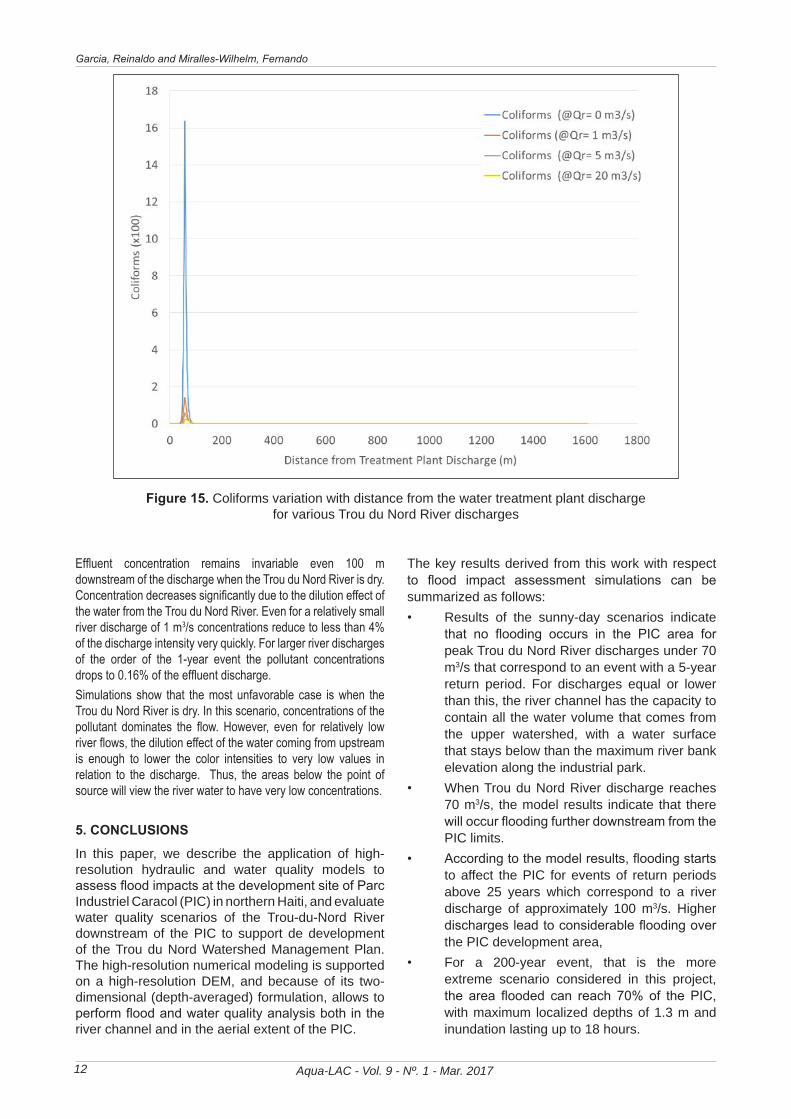
For the application of the RiverFlow2D model to simulate flooding at the PIC, two types of scenarios were considered: Sunny Day and Rainfall explained below. In both cases, runs were made for 1, 2, 5, 10, 25, 50, 100 and 200 year events and results included maximum flooding depth, maximum velocities, and other parameters to assess flood impacts. The model also reports inundation times that indicate how many hours each area remains flooded with a depth equal to or greater than 10 cm. Only results for the 100 year event are presented here.
3.1. Sunny-day Scenarios
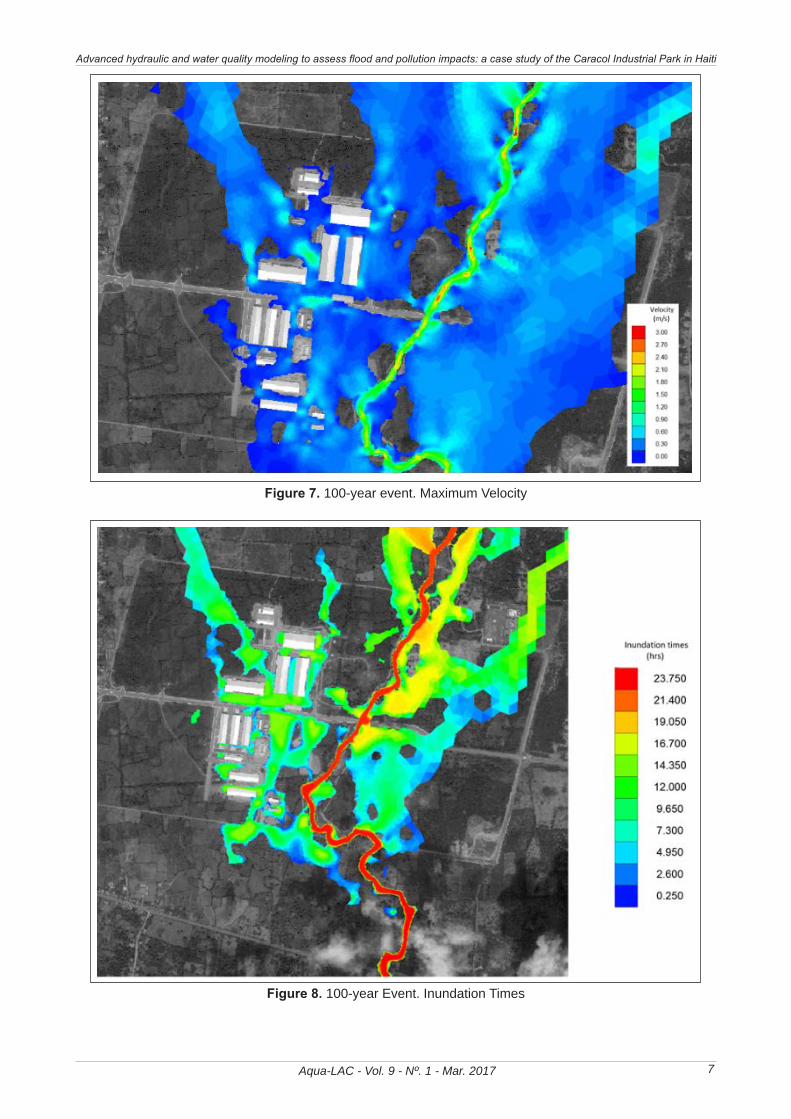
In the Sunny-day scenarios, it is assumed that there is no rainfall and water is only coming from the Trou-du-Nord River flow. This means that only the inflow hydrographs presented previously were imposed at the southern entrance of the Trou-du-Nord River. The following figures show plots of maximum inundation depth, maximum velocities, and inundation times for the 100-year event. Results of the sunny-day scenario indicate that no flooding occurs in the PIC area for the 1 and 5-year events. This suggests that for peak Trou du Nord River discharges below 70 m3/s, the river channel is able to convey the runoff coming from the upper watershed and keep an acceptable freeboard along
the Industrial Park. However, for this discharge, results show that there is some flooding downstream from the wastewater treatment plant.According to the model results, flooding starts to affect the PIC for events of return periods above 25 years. For the particular case of Tr = 25 years, flooding starts to occur just upstream of the bridge and maximum water depths reach 30 cm in a few locations. However, inundation times do not exceed 30 minutes. These results suggest that the threshold discharge to cause PIC flooding from the Trou du Nord River starts when the river discharge is about 100 m3/s. As shown in the results for the 50, 100 and 200-year events, higher discharges lead to considerable flooding over the PIC development. For instance, the model results for the 50-year event corresponding to a peak discharge of 122 m3/s, show that the total percentage of the PIC area affected by flood depths greater than 10 cm is about 15% with some localized spots with depths of up to 1.2 m. Inundation times for this event range from 10 to 12 hours approximately.Maximum flooding area reach about 40% of the PIC development for the 100-year event that corresponds to 140 m3/s peak discharge (Figure 6 to Figure 8), while the inundation can last up to 16 hours in some locations. The 200-year event with a 160 m3/s peak Trou du Nord River discharge is the more extreme scenario considered in this study, the area flooded can reach 70% of the PIC with maximum localized depths pf 1.3m and inundation lasting up to 18 hours.
8 Aqua-LAC Vol. NN – No N2 – Jul. 2016 pp. XX-XX
3 FLOODING SIMULATIONS For the application of the RiverFlow2D model to simulate flooding at the PIC, two types of scenarios were considered: Sunny Day and Rainfall explained below. In both cases, runs were made for 1, 2, 5, 10, 25, 50, 100 and 200 year events and results included maximum flooding depth, maximum velocities, and other parameters to assess flood impacts. The model also reports inundation times that indicate how many hours each area remains flooded with a depth equal to or greater than 10 cm. Only results for the 100 year event are presented here. 3.1 Sunny-day Scenarios In the Sunny-day scenarios, it is assumed that there is no rainfall and water is only coming from the Trou-du-Nord River flow. This means that only the inflow hydrographs presented previously were imposed at the southern entrance of the Trou-du-Nord River. The following figures show plots of maximum inundation depth, maximum velocities, and inundation times for the 100-year event.
Figure 6. 100-yer event. Maximum Depths. Figure 6. 100-yer event. Maximum Depths
Garcia, Reinaldo and Miralles-Wilhelm, Fernando
Aqua-LAC - Vol. 9 - Nº. 1 - Mar. 2017 7
Aqua-LAC Vol. NN – No N2 – Jul. 2016 pp. XX-XX 9
.
Figure 8. 100-year Event. Inundation Times.
Figure 7. 100-year event. Maximum Velocity
Aqua-LAC Vol. NN – No N2 – Jul. 2016 pp. XX-XX 9
Figure 8. 100-year Event. Inundation Times.
Figure 8. 100-year Event. Inundation Times
Advanced hydraulic and water quality modeling to assess flood and pollution impacts: a case study of the Caracol Industrial Park in Haiti

Aqua-LAC - Vol. 9 - Nº. 1 - Mar. 20178
3.2. Rainy-day Scenarios
In the Rainy-day scenarios, it is assumed that in addition to the water that flows from the Trou-du-Nord watershed, the rainfall design storm is occurring all over the area of the PIC. Therefore, the inflow hydrograph, and the uniform rainfall hyetograph were considered in each run. These cases simulate the situation occurring during extreme tropical weather events, such as hurricanes or tropical storms when the river can bring high discharges and it can be simultaneously raining over the area.The rainy-day scenarios provide a completely different flooding picture when compared with the sunny-day cases. Due to the effect of the simultaneous occurrence of rainfall and flow from the Trou du Nord River, according to the model, flooding starts to occur for the 1-year events. For this particular event, the total 24-hour rainfall is 60 mm, and the flooding area with depths above 10 cm covers about 15% or the existing PIC development and localized water depths can reach 1 m. Inundation times can be as long as 22 hours.Model simulations for the 2-year event, with a 24-hour rainfall of 153 mm, show that 20% of the PIC area can be flooded at a given time with localized depths around 1.4 m. Inundation times can reach 23 hours.Percentage of flooded area reaches 30% for the 5 year event that has a 24-hour rainfall of 223 mm. In this case, the maximum depths are around 2 m and the inundation times can be as large as 24 hours.The flooding area with depths above 10 cm covers about 35% of the existing PIC development for the 10 year event with 273 mm of accumulated rainfall in 24 hours.Simulations for the 25 year event indicate that the flooded area can reach 45% of the PIC, with depths exceeding 2.4 m for 24 hours in some.The model results for the 50-year event corresponding to a peak discharge of 122 m3/s show that the total percentage of the PIC area affected by flood depths greater than 10cm is about 65% with some localized spots with depths of up to 2.7 m. Inundation times for this event range from 10 to 24hours approximately.For the 100 year event with a 140 m3/s peak Trou du Nord River discharge the area flooded can reach 70% of the PIC with maximum localized depths of 1.3m and inundation lasting up to 24 hours.Maximum flooding area can reach about 85% of the PIC development for the 200-year event that corresponds to 160 m3/s peak discharge and 515 mm of accumulated rainfall in 24, while the inundation can last up to 24 hours in some locations.
4. WATER QUALITY SIMULATION RESULTS
4.1. Simulations to Determine Pollutant Dispersion Downstream of the Treatment Plant Discharge
This section presents results of the RiverFlow2D model simulations performed to evaluate the impact of the effluent discharge from the PIC wastewater treatment plant. Four simulation scenarios are presented here, corresponding to the effluent and river pollutant concentrations indicated in Table 3, and different water discharges from the Trou du Nord River shown in Table 4; the effluent discharge was assumed to be equal to 40 lps. It is important to note that the water discharge flow rates through the river considered in the water quality simulations are on the low end of the return periods analyzed for flooding (see Table 2). This implies that water quality impacts need to be analyzed at much higher frequencies of occurrence (lower return periods) than flood impacts, as high flow rates associated with higher return periods would dilute water quality impacts and render them negligible as these results show.
Table 3. Pollutant concentration data used in PIC treatment plant effluent dispersion simulations
Parameter Outflow From Plant
Inflow From River Units
OD 3 2.50 mg/l
BOD 30 3.40 mg/l
COD 125 3.40 mg/l
SST 50 14.50 NTU
N total 24.5 0.50 mg/l
P total 4.92 0.10 mg/l
Oil and fats 10 1.00 mg/l
Coliforms 2800 5,400.00 NMP/100 ml
Table 4. Trou du Nord River Discharges Used in the Simulations
Scenario Trou du Nord River discharge m3/s
1 02 13 54 20
Figure 9 shows the model mesh along the river and indicates the inflow from the Trou du Nord River, with the greener tones indicating higher mesh density, and the wastewater treatment plant discharge location.
Garcia, Reinaldo and Miralles-Wilhelm, Fernando

Aqua-LAC - Vol. 9 - Nº. 1 - Mar. 2017 9
12 Aqua-LAC Vol. NN – No N2 – Jul. 2016 pp. XX-XX
Figure 10 to Figure 15 present the pollutant concentration maps for each scenario and concentration profiles along the river from the treatment plant location. These plots allow determining how the concentration of each pollutant varies with distance as a function of the river discharge.
Figure 10. Total Nitrogen concentration in the Trou du Nord River when river discharge is 0 m3/s.
Figure 9. RiverFlow2D model on the Trou du Nord river along the PIC. The green shading indicates the highest spatial resolution numerical grid in order to capture flooding impacts at that resolution (1.5 meters)
Figure 10 to Figure 15 present the pollutant concentration maps for each scenario and concentration profiles along the river from the
treatment plant location. These plots allow determining how the concentration of each pollutant varies with distance as a function of the river discharge.
12 Aqua-LAC Vol. NN – No N2 – Jul. 2016 pp. XX-XX
Figure 10 to Figure 15 present the pollutant concentration maps for each scenario and concentration profiles along the river from the treatment plant location. These plots allow determining how the concentration of each pollutant varies with distance as a function of the river discharge.
Figure 10. Total Nitrogen concentration in the Trou du Nord River when river discharge is 0 m3/s
Advanced hydraulic and water quality modeling to assess flood and pollution impacts: a case study of the Caracol Industrial Park in Haiti

Aqua-LAC - Vol. 9 - Nº. 1 - Mar. 201710
Aqua-LAC Vol. NN – No N2 – Jul. 2016 pp. XX-XX 13
Figure 11. Total Nitrogen concentration in the Trou du Nord River when river discharge is 5 m3/s.
Figure 12. Total Nitrogen concentration in the Trou du Nord River when river discharge is 20 m3/s.
Figure 11. Total Nitrogen concentration in the Trou du Nord River when river discharge is 5 m3/s
Aqua-LAC Vol. NN – No N2 – Jul. 2016 pp. XX-XX 13
Figure 11. Total Nitrogen concentration in the Trou du Nord River when river discharge is 5 m3/s.
Figure 12. Total Nitrogen concentration in the Trou du Nord River when river discharge is 20 m3/s. Figure 12. Total Nitrogen concentration in the Trou du Nord River when river discharge is 20 m3/s
Garcia, Reinaldo and Miralles-Wilhelm, Fernando

Aqua-LAC - Vol. 9 - Nº. 1 - Mar. 2017 11
14 Aqua-LAC Vol. NN – No N2 – Jul. 2016 pp. XX-XX
Figure 13. Total Nitrogen concentration variation with distance from the water treatment plant
discharge for various Trou du Nord River Discharges.
Figure 14. Total Phosphorous concentration variation with distance from the water treatment plant
discharge for various Trou du Nord River Discharges.
Figure 13. Total Nitrogen concentration variation with distance from the water treatment plant discharge for various Trou du Nord River Discharges
14 Aqua-LAC Vol. NN – No N2 – Jul. 2016 pp. XX-XX
Figure 13. Total Nitrogen concentration variation with distance from the water treatment plant
discharge for various Trou du Nord River Discharges.
Figure 14. Total Phosphorous concentration variation with distance from the water treatment plant
discharge for various Trou du Nord River Discharges.
Figure 14. Total Phosphorous concentration variation with distance from the water treatment plant discharge for various Trou du Nord River Discharges
Advanced hydraulic and water quality modeling to assess flood and pollution impacts: a case study of the Caracol Industrial Park in Haiti
Aqua-LAC - Vol. 9 - Nº. 1 - Mar. 201712
Aqua-LAC Vol. NN – No N2 – Jul. 2016 pp. XX-XX 15
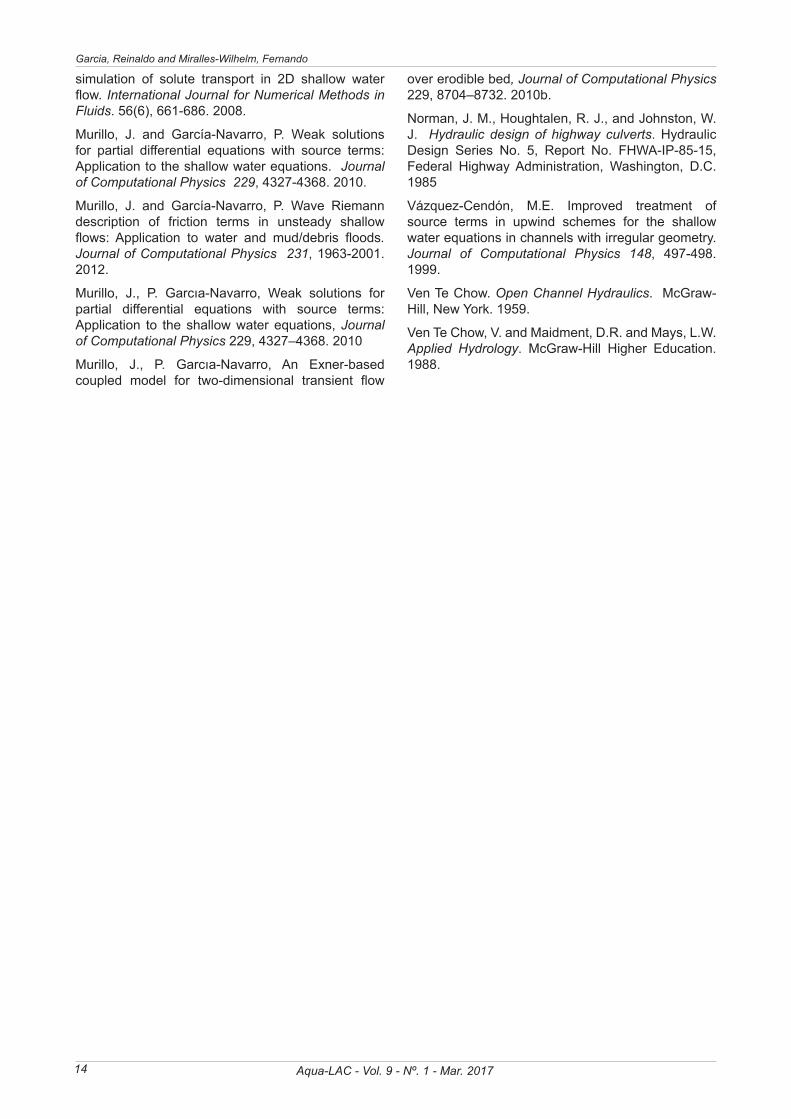
Figure 15. Coliforms variation with distance from the water treatment plant discharge for various
Trou du Nord River discharges.
Effluent concentration remains invariable even 100 m downstream of the discharge when the Trou du Nord River is dry. Concentration decreases significantly due to the dilution effect of the water from the Trou du Nord River. Even for a relatively small river discharge of 1 m3/s concentrations reduce to less than 4% of the discharge intensity very quickly. For larger river discharges of the order of the 1-year event the pollutant concentrations drops to 0.16% of the effluent discharge. Simulations show that the most unfavorable case is when the Trou du Nord River is dry. In this scenario, concentrations of the pollutant dominates the flow. However, even for relatively low river flows, the dilution effect of the water coming from upstream is enough to lower the color intensities to very low values in relation to the discharge. Thus, the areas below the point of source will view the river water to have very low concentrations. 5 CONCLUSIONS In this paper, we describe the application of high-resolution hydraulic and water quality models to assess flood impacts at the development site of Parc Industriel Caracol (PIC) in northern Haiti, and evaluate water quality scenarios of the Trou-du-Nord River downstream of the PIC to support de development of the Trou du Nord Watershed Management Plan. The high-resolution numerical modeling is supported on a high-resolution DEM, and because of its two-dimensional (depth-averaged) formulation, allows to perform flood and water quality analysis both in the river channel and in the aerial extent of the PIC. The key results derived from this work with respect to flood impact assessment simulations can be summarized as follows:
• Results of the sunny-day scenarios indicate that no flooding occurs in the PIC area for peak Trou du Nord River discharges under 70 m3/s that correspond to an event with a 5-year return period. For discharges equal or lower than this, the river channel has the capacity to contain all the water
Figure 15. Coliforms variation with distance from the water treatment plant discharge for various Trou du Nord River discharges
Effluent concentration remains invariable even 100 m downstream of the discharge when the Trou du Nord River is dry. Concentration decreases significantly due to the dilution effect of the water from the Trou du Nord River. Even for a relatively small river discharge of 1 m3/s concentrations reduce to less than 4% of the discharge intensity very quickly. For larger river discharges of the order of the 1-year event the pollutant concentrations drops to 0.16% of the effluent discharge. Simulations show that the most unfavorable case is when the Trou du Nord River is dry. In this scenario, concentrations of the pollutant dominates the flow. However, even for relatively low river flows, the dilution effect of the water coming from upstream is enough to lower the color intensities to very low values in relation to the discharge. Thus, the areas below the point of source will view the river water to have very low concentrations.
5. CONCLUSIONS
In this paper, we describe the application of high-resolution hydraulic and water quality models to assess flood impacts at the development site of Parc Industriel Caracol (PIC) in northern Haiti, and evaluate water quality scenarios of the Trou-du-Nord River downstream of the PIC to support de development of the Trou du Nord Watershed Management Plan. The high-resolution numerical modeling is supported on a high-resolution DEM, and because of its two-dimensional (depth-averaged) formulation, allows to perform flood and water quality analysis both in the river channel and in the aerial extent of the PIC.
The key results derived from this work with respect to flood impact assessment simulations can be summarized as follows:• Results of the sunny-day scenarios indicate
that no flooding occurs in the PIC area for peak Trou du Nord River discharges under 70 m3/s that correspond to an event with a 5-year return period. For discharges equal or lower than this, the river channel has the capacity to contain all the water volume that comes from the upper watershed, with a water surface that stays below than the maximum river bank elevation along the industrial park.
• When Trou du Nord River discharge reaches 70 m3/s, the model results indicate that there will occur flooding further downstream from the PIC limits.
• According to the model results, flooding starts to affect the PIC for events of return periods above 25 years which correspond to a river discharge of approximately 100 m3/s. Higher discharges lead to considerable flooding over the PIC development area,
• For a 200-year event, that is the more extreme scenario considered in this project, the area flooded can reach 70% of the PIC, with maximum localized depths of 1.3 m and inundation lasting up to 18 hours.
Garcia, Reinaldo and Miralles-Wilhelm, Fernando

Aqua-LAC - Vol. 9 - Nº. 1 - Mar. 2017 13
• When rain is considered to occur in thePICarea simultaneouslywith the river discharge,thescenariossimulatedprovideacompletelydifferent flooding picture than those of thesunny-day cases. Due to the effect of thesimultaneous occurrence of rainfall and flowfromtheTrouduNordRiver,thefloodingwouldstarttooccurfor1-yearevents.
• Percentageof floodedarea reaches30% forthe5yeareventthathasa24-hourrainfallof223mm.Inthiscase,themaximumdepthsarearound2mandtheinundationtimescanbeasprolongedas24hours.
• Themaximumfloodingareacanreachabout85% of the PIC development for the 200-yeareventthatcorrespondsto160m3/speakdischargeand515mmofaccumulatedrainfallin24hours,whiletheinundationcanlastupto16hoursinsomelocations.
The key results with respect to the water qualitysimulationsalongtheTrouduNordriverare:• Effluentconcentrationsremaininvariableeven
100mdownstreamofthedischargewhentheTrouduNordRiverisdry.
• Effluent concentrations decrease significantlydue to thedilutioneffectof thewatercomingfrom the Trou du Nord River. Even for arelatively small river dischargeof 1m3/s thecolorintensityreducestolessthan4%ofthedischargeintensityveryquickly.
• Forlargerriverdischargesoftheorderofthe1-yearevent,concentrationsdropto0.16%oftheeffluentdischarge.
• Simulations show that the most unfavorablecase iswhen theTrou duNordRiver is dry.In this scenario, the pollutant concentrationdominatestheflow.However,evenforrelativelylowriverflows,thedilutioneffectofthewatercoming from upstream is enough to lowerconcentrationstoverylowvaluesinrelationtothedischarge.Thus,theareasbelowthepointofsourcewillviewtheriverwatertohaveverylowpollutantconcentrations.
Recommendations
• Install at leastoneprecipitationgauge insidethePICareaandoneontheupperpartofthewatershed.
• MeasureTrouduNordRiverdischargesandwater elevation particularly for events thatgenerateflowratesabove100m3/s.
• ApplytheRiverFlow2DmodeltoevaluatetheimpactthatthePICcouldhaveinthefloodriskdownstreamcommunities.
• Continue to calibrate themodelingwith datafor flooding and water quality as it becomes
availablethroughmonitoringeffortsatthePIC,theTrouduNordriverandsurroundingareas.
acKnoWLedGement & discLaimeR
Florida International University acknowledges thefinancialsupportforthisworkprovidedbytheInter-American Development Bank. The results, views,andopinionsoftheauthor(s)presentedhereindonotnecessarilystateorreflectthoseoftheIADB,FIUorUNESCO.
6. ReFeRences
BrufauP.,García-NavarroP. andVázquez-CendónM.E. Zero mass error using unsteady wetting-dryingconditions inshallowflowsoverdry irregulartopography, Int. Journal for Numerical Methods in Fluids, 45,1047-1082.2004.
ENVIRON International Corporation. Preliminary Hydrological Assessment for the Development of an Industrial Park in Haiti. Project #: 01-27631Aprepared for the Inter-AmericanDevelopmentBankWashington,D.C.August2011.
Garcia,R.,Espinoza,R.,Valera,E.,andGonzalez,M.Anexplicittwo-dimensionalfiniteelementmodelto simulate short- and long-term bed evolution inalluvial rivers. Journal of Hydraulic Research (44),No.6,755–766.2006.
Garcia, R., Gonzalez, N. & O’Brien, J. Dam-breakflood routing. Chapter 4 in: Dam-Break Problems,SolutionsandCaseStudies.Eds.DeWrachien,D.&Mambretti,S.ISBN:978-1-84564-142-9.WITPress,Southampton-Boston,2009.
Julien, P. Erosion and Sedimentation, CambridgeUniversityPress,1995.
Mahmoudi, M. Garcia, R, Eric Cline, Pricem R.,Scinto, L., Wdowinski, S., and Miralles-Wilhelm,F. Fine Spatial Resolution Simulation of Two-DimensionalModelingofFlowPulsesDischargeintoWetlands:CaseStudyofLoxahatcheeImpoundmentLandscape Assessment (LILA), the Everglades.ASCEJournal of Hydrologic Engineering.2015.
Murillo, J., Burguete, J., Brufau, P., and Garcia-Navarro, P. Coupling between shallow water andsolute flow equations: analysis and managementof source terms in 2d. International Journal forNumericalMethodsinFluids.49(3),267-299.2005.
Murillo, J., Burguete, J., Brufau, P. and García-Navarro,P.Theinfluenceofsourcetermsonstability,accuracy and conservation in two-dimensionalshallowflowsimulationusingtriangularfinitevolumes. International Journal of Numerical Methods in Fluids 54,543-590.2007.
Murillo, J., Garcia-Navarro, P., and Burguete, J.,Analysis of a second-order upwindmethod for the
Advanced hydraulic and water quality modeling to assess flood and pollution impacts: a case study of the Caracol Industrial Park in Haiti
Aqua-LAC - Vol. 9 - Nº. 1 - Mar. 201714
simulation of solute transport in 2D shallow waterflow. International Journal for Numerical Methods in Fluids.56(6),661-686.2008.
Murillo, J. and García-Navarro, P. Weak solutionsfor partial differential equations with source terms:Applicationtotheshallowwaterequations. Journal of Computational Physics 229,4327-4368.2010.
Murillo, J. and García-Navarro, P. Wave Riemanndescription of friction terms in unsteady shallowflows: Application to water and mud/debris floods. Journal of Computational Physics 231,1963-2001.2012.
Murillo, J., P. Garcıa-Navarro, Weak solutions forpartial differential equations with source terms:Application to theshallowwaterequations,Journal of Computational Physics229,4327–4368.2010
Murillo, J., P. Garcıa-Navarro, An Exner-basedcoupled model for two-dimensional transient flow
overerodiblebed, Journal of Computational Physics229,8704–8732.2010b.
Norman,J.M.,Houghtalen,R.J.,andJohnston,W.J. Hydraulic design of highway culverts.HydraulicDesign Series No. 5, Report No. FHWA-IP-85-15,Federal HighwayAdministration, Washington, D.C.1985
Vázquez-Cendón, M.E. Improved treatment ofsource terms in upwind schemes for the shallowwaterequationsinchannelswithirregulargeometry.Journal of Computational Physics 148, 497-498.1999.
VenTeChow.Open Channel Hydraulics.McGraw-Hill,NewYork.1959.
VenTeChow,V.andMaidment,D.R.andMays,L.W.Applied Hydrology. McGraw-Hill Higher Education.1988.
Garcia, Reinaldo and Miralles-Wilhelm, Fernando