Embed Size (px)
Citation preview

Morgan Stanley Convertible ConferenceSeptember 24, 2003
2
Forward Looking Information
Certain statements contained in this presentation are forward-looking statements within the meaning of Section 27A of the Securities Act of 1933, as amended, and Section 21E of the Securities Exchange Act of 1934, as amended, and are subject to the “safe harbor” created by those sections. Forward-looking statements include expressions of “belief,” “anticipation,” or “expectations” of management, statements as to industry trends or future results of operations of the Company, and other statements that are not historical fact. Forward-looking statements are based on certain assumptions by management and are subject to risks and uncertainties that could cause actual results to differ materially from those in the forward-looking statements. These risks and uncertainties include, but are not limited to: competitive pressures; factors that affect liquidity, delinquency rates, credit loss rates and charge-off rates; general economic conditions; consumer loan portfolio growth; changes in the cost and/or availability of funding due to changes in the deposit, credit or securitization markets, changes in the way in which the Company is perceived in such markets, and/or conditions relating to existing or future financing commitments; the effects of government policy and regulation, whether of general applicability or specific to the Company, including restrictions and/or limitations on the Company’s minimum capital requirements, deposit taking abilities, reserve methodologies, dividend policies and payments, growth, and/or underwriting criteria; year-end audit adjustments; changes in accounting rules, policies, practices and/or procedures; the success of product development efforts; legal and regulatory proceedings, including the impact of ongoing litigation; interest rates; acquisitions; one-time charges; extraordinary items; the ability to attract and retain key personnel and the impact of existing, modified or new strategic initiatives. These and other risks and uncertainties are described in detail in the Company’s Annual Report on Form 10-K and Annual Report to Stockholders for the fiscal year ended December 31, 2002 under the headings “Cautionary Statement Regard Forward-Looking Information”and “Risk Factors.” You are cautioned not to place undue reliance on any forward-looking statement, which speaks only as of the date thereof. The Company undertakes no obligation to update any forward-looking statements.
3
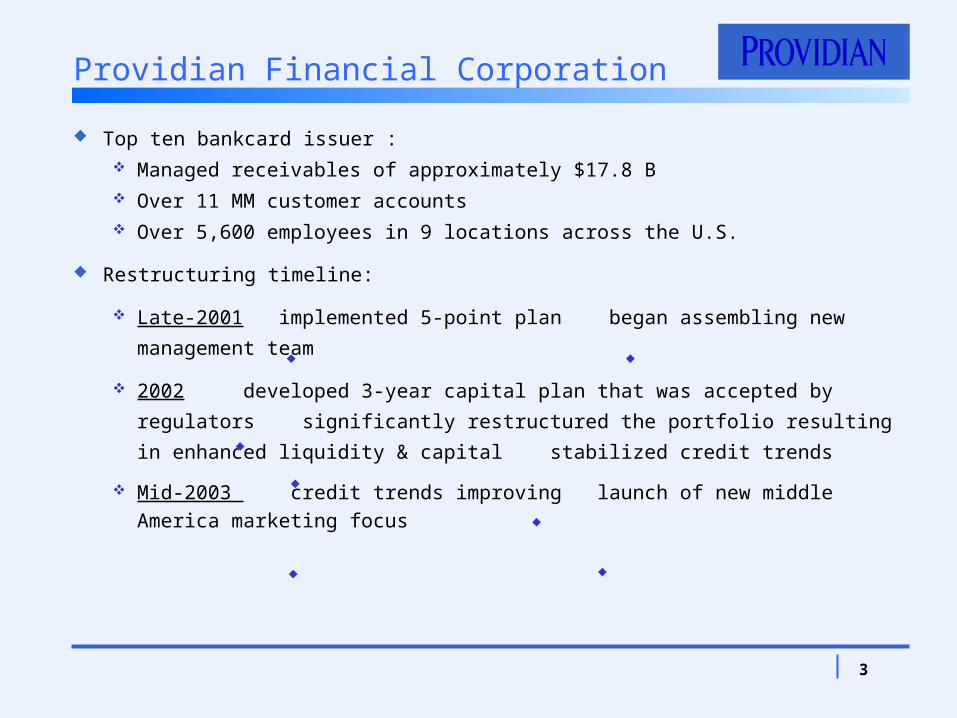
Top ten bankcard issuer : Managed receivables of approximately $17.8 B Over 11 MM customer accounts Over 5,600 employees in 9 locations across the U.S.
Restructuring timeline:
Late-2001 implemented 5-point plan began assembling new
management team
2002 developed 3-year capital plan that was accepted by regulators
significantly restructured the portfolio resulting in enhanced liquidity &
capital stabilized credit trends
Mid-2003 credit trends improving launch of new middle America marketing focus
Providian Financial Corporation
4
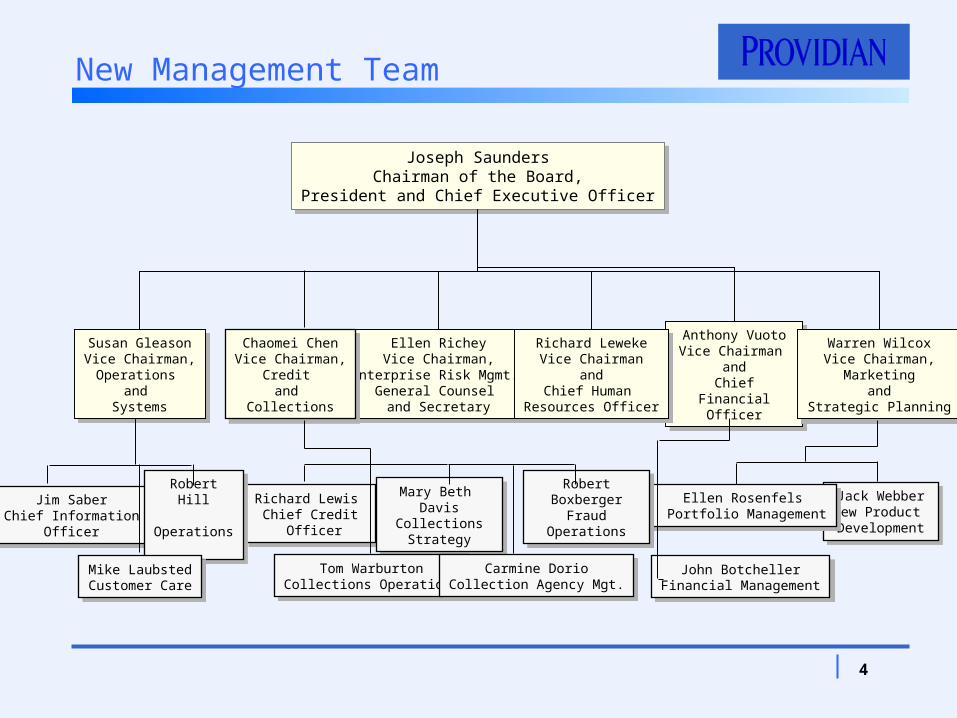
New Management Team
Joseph SaundersChairman of the Board,
President and Chief Executive Officer
Joseph SaundersChairman of the Board,
President and Chief Executive Officer
Susan GleasonVice Chairman,
Operations and
Systems
Susan GleasonVice Chairman,
Operations and
Systems
Ellen RicheyVice Chairman,
Enterprise Risk Mgmt.,General Counsel
and Secretary
Ellen RicheyVice Chairman,
Enterprise Risk Mgmt.,General Counsel
and Secretary
Anthony VuotoVice Chairman
andChief Financial
Officer
Anthony VuotoVice Chairman
andChief Financial
Officer
Warren WilcoxVice Chairman,
Marketingand
Strategic Planning
Warren WilcoxVice Chairman,
Marketingand
Strategic Planning
Richard LewekeVice Chairman
andChief Human
Resources Officer
Richard LewekeVice Chairman
andChief Human
Resources Officer
Chaomei ChenVice Chairman,
Credit and
Collections
Chaomei ChenVice Chairman,
Credit and
Collections
Jim Saber Chief Information
Officer
Jim Saber Chief Information
Officer
Richard Lewis Chief Credit
Officer
Richard Lewis Chief Credit
Officer
Jack WebberNew Product Development
Jack WebberNew Product Development
Ellen Rosenfels Portfolio Management
Ellen Rosenfels Portfolio Management
Robert Hill Operations
Robert Hill Operations
Mary Beth DavisCollections
Strategy
Mary Beth DavisCollections
Strategy
Tom WarburtonCollections Operations
Tom WarburtonCollections Operations
Robert BoxbergerFraud Operations
Robert BoxbergerFraud Operations
Carmine DorioCollection Agency Mgt.
Carmine DorioCollection Agency Mgt.
Mike LaubstedCustomer Care
Mike LaubstedCustomer Care
John BotchellerFinancial Management
John BotchellerFinancial Management
5
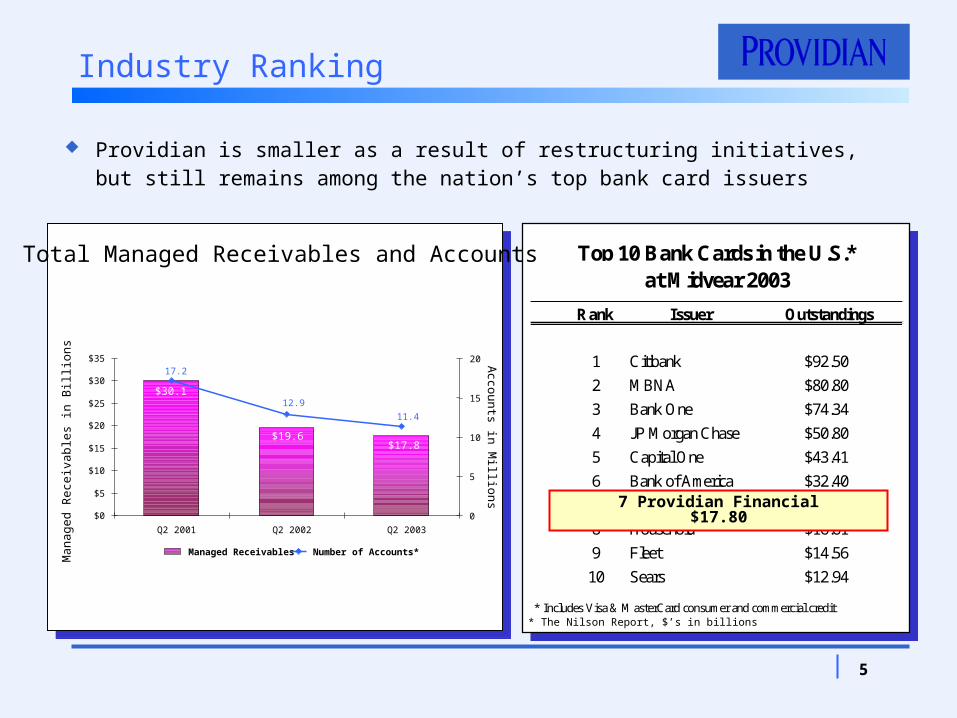
Rank Issuer Outstandings
1 Citibank $92.50
2 MBNA $80.80
3 Bank One $74.34
4 JP Morgan Chase $50.80
5 Capital One $43.41
6 Bank of America $32.40
7 Providian Financial $17.80
8 Household $16.61
9 Fleet $14.56
10 Sears $12.94
* Includes Visa & MasterCard consumer and commercial credit
Top 10 Bank Cards in the U.S.*at Midyear 2003
* The Nilson Report, $’s in billions
Industry Ranking
Providian is smaller as a result of restructuring initiatives, but still remains among the nation’s top bank card issuers
$30.1
$19.6$17.8
11.4
12.9
17.2
$0
$5
$10
$15
$20
$25
$30
$35
Q2 2001 Q2 2002 Q2 2003
0
5
10
15
20
Managed Receivables Number of Accounts*
Man
ag
ed
Rece
ivab
les
in B
illio
ns
Total Managed Receivables and Accounts
Acco
un
ts in M
illion
s
7 Providian Financial $17.80
6
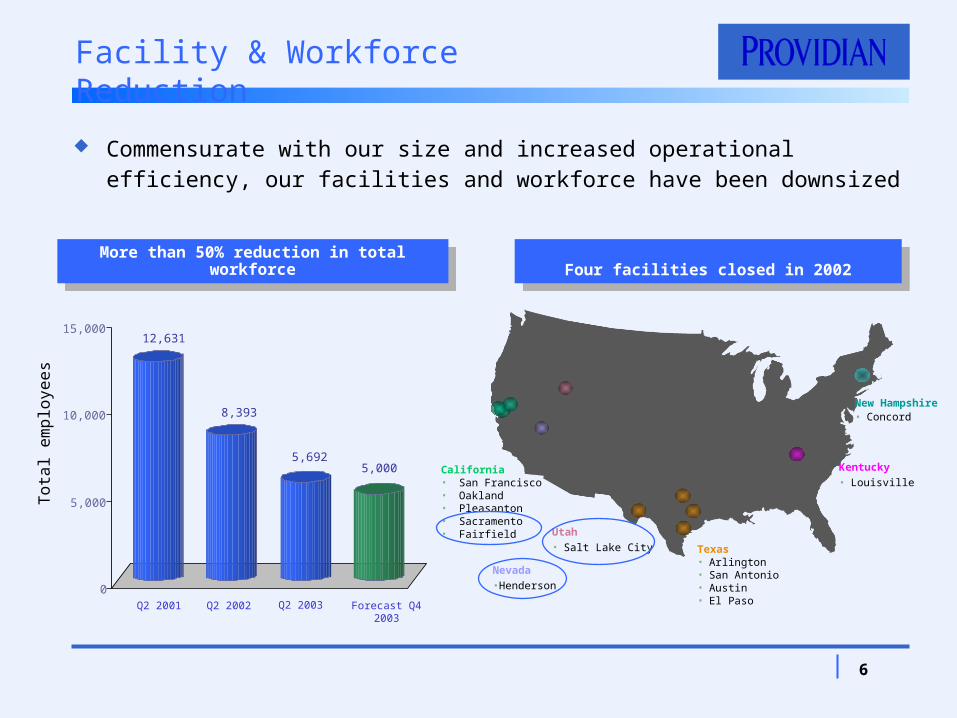
12,631
8,393
5,6925,000
0
5,000
10,000
15,000
To
tal e
mp
loye
es
Q2 2001 Q2 2002 Q2 2003 Forecast Q4 2003
More than 50% reduction in total workforce
More than 50% reduction in total workforce
Facility & Workforce Reduction
Commensurate with our size and increased operational efficiency, our facilities and workforce have been downsized
California• San Francisco• Oakland• Pleasanton• Sacramento• Fairfield
Kentucky• Louisville
New Hampshire• Concord
Four facilities closed in 2002Four facilities closed in 2002
Texas• Arlington • San Antonio • Austin • El Paso
Utah• Salt Lake City
Nevada•Henderson
7
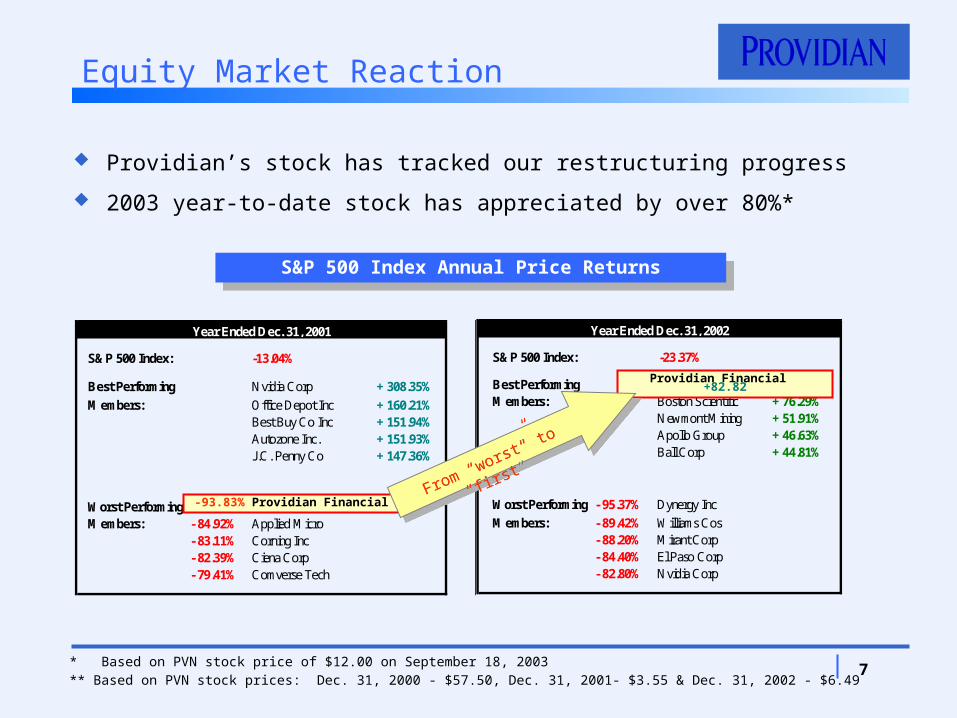
S&P 500 Index: -13.04%
Best Performing Nvidia Corp + 308.35%
Members: Office Depot Inc + 160.21%Best Buy Co Inc + 151.94%Autozone Inc. + 151.93%J.C. Penny Co + 147.36%
Worst Performing - 93.83% Providian FinancialMembers: - 84.92% Applied Micro
- 83.11% Corning Inc- 82.39% Ciena Corp- 79.41% Comverse Tech
Year Ended Dec. 31, 2001
S&P 500 Index: -23.37%
Best Performing Providian Financial + 82.82%Members: Boston Scientific + 76.29%
Newmont Mining + 51.91%Apollo Group + 46.63%Ball Corp + 44.81%
Worst Performing - 95.37% Dynergy Inc
Members: - 89.42% Williams Cos- 88.20% Mirant Corp- 84.40% El Paso Corp- 82.80% Nvidia Corp
Year Ended Dec. 31, 2002
Equity Market Reaction
Providian’s stock has tracked our restructuring progress
2003 year-to-date stock has appreciated by over 80%*
* Based on PVN stock price of $12.00 on September 18, 2003** Based on PVN stock prices: Dec. 31, 2000 - $57.50, Dec. 31, 2001- $3.55 & Dec. 31, 2002 - $6.49
S&P 500 Index Annual Price ReturnsS&P 500 Index Annual Price Returns
-93.83% Providian Financial
Providian Financial +82.82
From “worst” to “first
”
From “worst” to “first
”
8
Restructuring Remains on Track
Providian is a stronger entity and remains solidly on track with its restructuring:
Finance Strengthened capital, funding and liquidity positions
Marketing Executing new middle market strategy & developing new distribution
channels
Credit Reduced net credit losses and improving delinquency rates
Operations Retooled for greater operational and cost efficiency
9
We continue to maintain a solid financial foundation: Liquidity $6.6 billion Capital $2.3 billion Reserves $702 million
Providian National Bank’s total risk-based capital ratios remain in excess of 10% “well-capitalalized” levels
Call Report Basis 15.08% Subprime Guidance Basis (1) 13.76%
Primary funding sources remain deposits, securitization and unsecured debt
Finance
Combined represent 47% of on-balance sheet loans
(1) Subprime guidance basis excluding the effect of adopting the regulatory guidance on the accrued interest receivable asset.
10
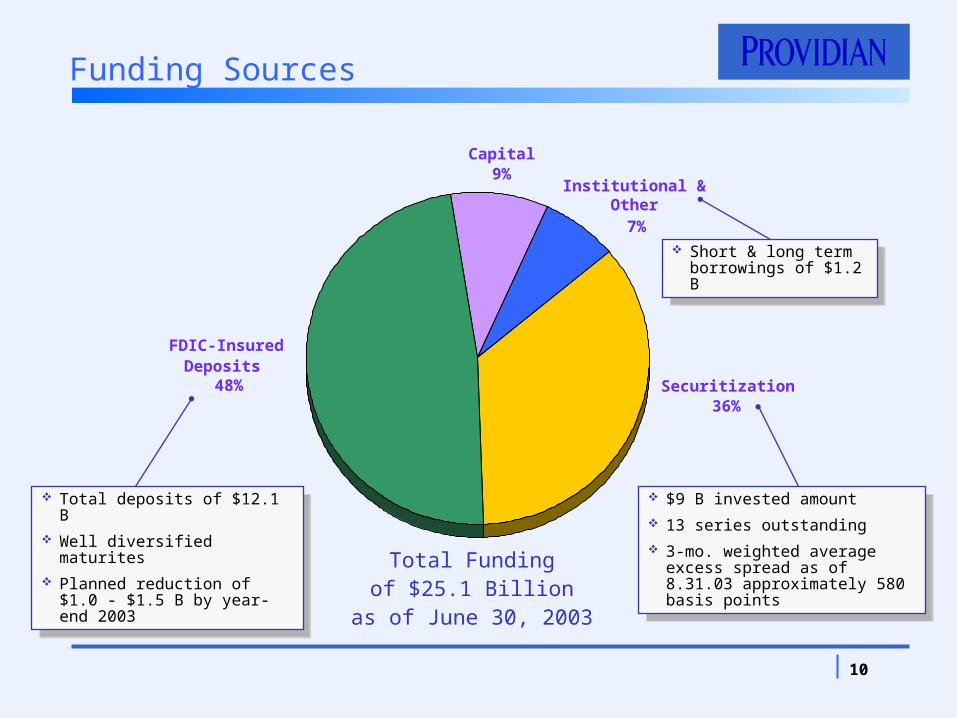
Total Fundingof $25.1 Billion
as of June 30, 2003
Funding Sources
Institutional & Other
7%
Securitization36%
Capital9%
FDIC-Insured Deposits
48%
Total deposits of $12.1 B Well diversified maturites Planned reduction of $1.0 -
$1.5 B by year-end 2003
Total deposits of $12.1 B Well diversified maturites Planned reduction of $1.0 -
$1.5 B by year-end 2003
$9 B invested amount 13 series outstanding 3-mo. weighted average
excess spread as of 8.31.03 approximately 580 basis points
$9 B invested amount 13 series outstanding 3-mo. weighted average
excess spread as of 8.31.03 approximately 580 basis points
Short & long term borrowings of $1.2 B
Short & long term borrowings of $1.2 B
11
Convertible Note Issuance in May
Providian Financial Corp. completed a $287 million, 5-year convertible senior note issue on May 27, 2003
Summary of key terms: Oversubscribed, upsized from $150 million Coupon: 4% fixed rate Conversion premium: 60% Conversion price: approximately $13.01 per share
Proceeds to be used for general corporate purposes, repurchase of outstanding debt or other purposes consistent with our banking subsidiaries’ Capital Plans
12
Marketing Priorities
Pro-actively manage our existing portfolio to optimize performance
Maintain yields and reduce interest rate risk while improving credit quality of the portfolio
Pursue a new account acquisition strategy to recruit high quality, profitable prospects
Migrate acquisitions emphasis to Middle Market to capture greater profit potential and market opportunity
Develop new programs and channels to generate profitable growth consistent with our Middle America emphasis
Reposition the company by providing compelling new value propositions and customer experience
Leverage partner relationships
13
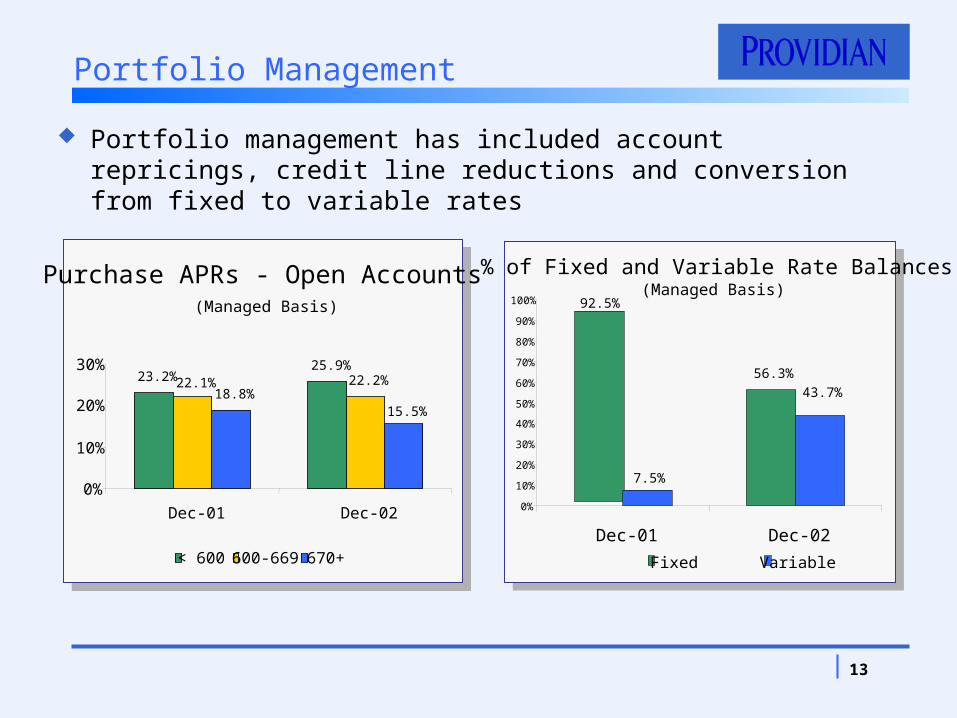
Portfolio Management
Portfolio management has included account repricings, credit line reductions and conversion from fixed to variable rates
% of Fixed and Variable Rate Balances
92.5%
56.3%
7.5%
43.7%
0%
10%
20%
30%
40%
50%
60%
70%
80%
90%
100%
Dec-01 Dec-02
Fixed Variable
Purchase APRs - Open Accounts
23.2%25.9%
22.2%18.8%
22.1%
15.5%
0%
10%
20%
30%
Dec-01 Dec-02
< 600 600-669 670+
(Managed Basis)(Managed Basis)
14
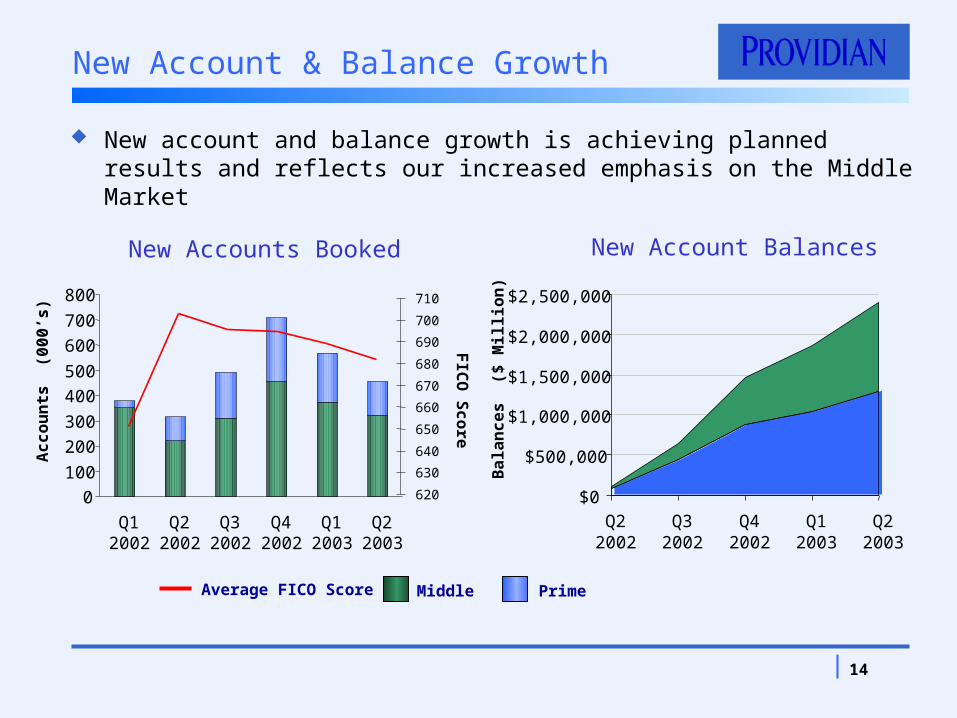
New Account & Balance Growth
New account and balance growth is achieving planned results and reflects our increased emphasis on the Middle Market
New Account Balances
$0
$500,000
$1,000,000
$1,500,000
$2,000,000
$2,500,000
Q22002
Q32002
Q42002
Q12003
Q22003
Ac
co
un
ts
(00
0’s
)
FIC
O S
co
re
New Accounts Booked
0100
200300
400500
600700
800
Q12002
Q22002
Q32002
Q42002
Q12003
Q22003
620
630
640
650
660
670
680
690
700
710
Ba
lan
ce
s
($ M
illi
on
)
PrimeMiddleAverage FICO Score
15
We have an opportunity to excel by focusing our company on serving “Middle Americans”
The “Middle America” market is attractive:
It’s large and targetable
It’s profitable
It’s receptive, less competitive and largely underserved
We have distinctive competencies and differentiated products and services which can be honed to enhance our competitive advantage
These competencies can be leveraged to differentiate Providian products and services, both under our own brand, and through relevant partner relationships
The “New” Providian
16
0
5
10
15
20
25
600 to 619
620 to 639
640 to 659
660 to 679
680 to 699
700 to 719
720 to 739
740 to 759
760 to 779
780 to 799
> 800
Ind
ivid
ual
s (M
M)
The “New” Providian
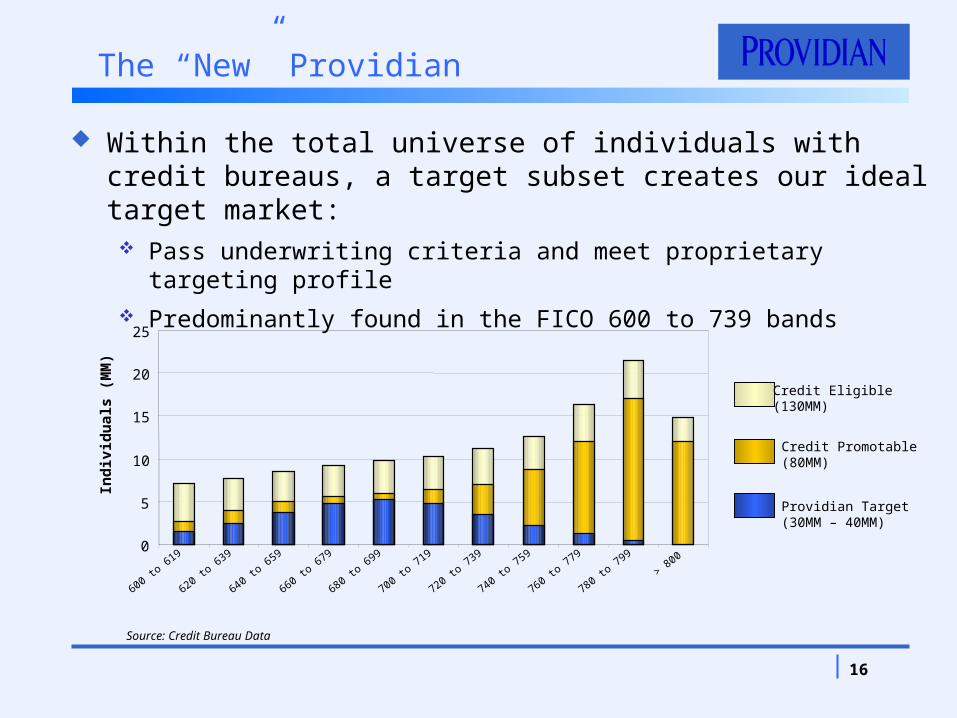
Within the total universe of individuals with credit bureaus, a target subset creates our ideal target market: Pass underwriting criteria and meet proprietary targeting profile Predominantly found in the FICO 600 to 739 bands
Source: Credit Bureau Data
Credit Eligible (130MM)
Credit Promotable(80MM)
Providian Target(30MM – 40MM)
17
$14
$21
$35
$45
$32
$24
$19
$0
$10
$20
$30
$40
$50
600-619 620-639 640-659 660-679 680-699 700-719 720-739
The “New” Providian
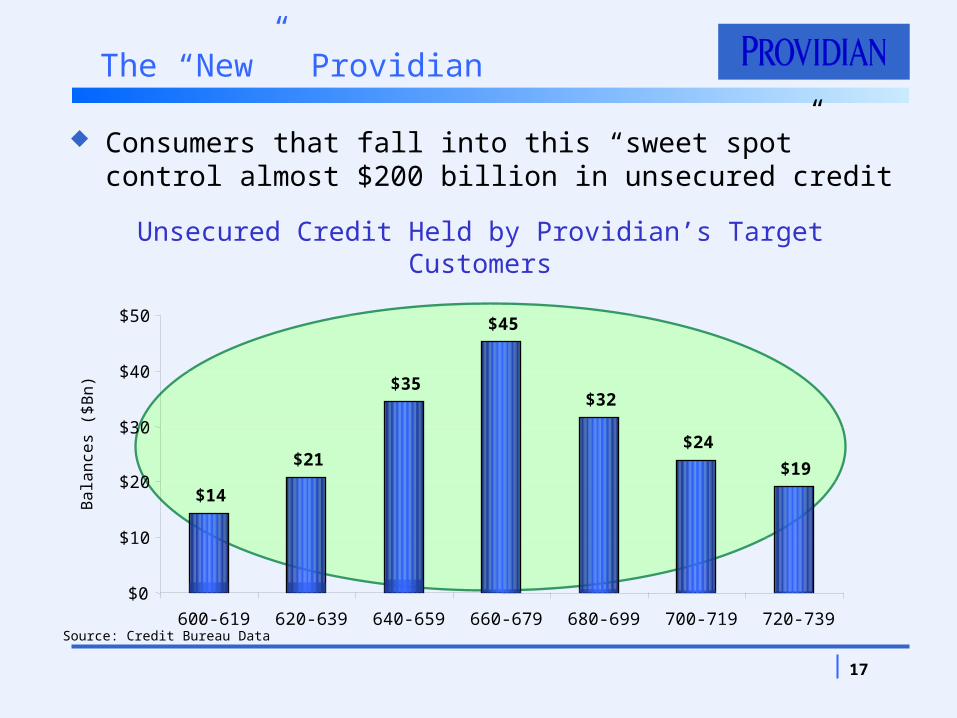
Unsecured Credit Held by Providian’s Target Customers
Consumers that fall into this “sweet spot” control almost $200 billion in unsecured credit
Source: Credit Bureau Data
Bal a
nce
s ($
Bn)
18
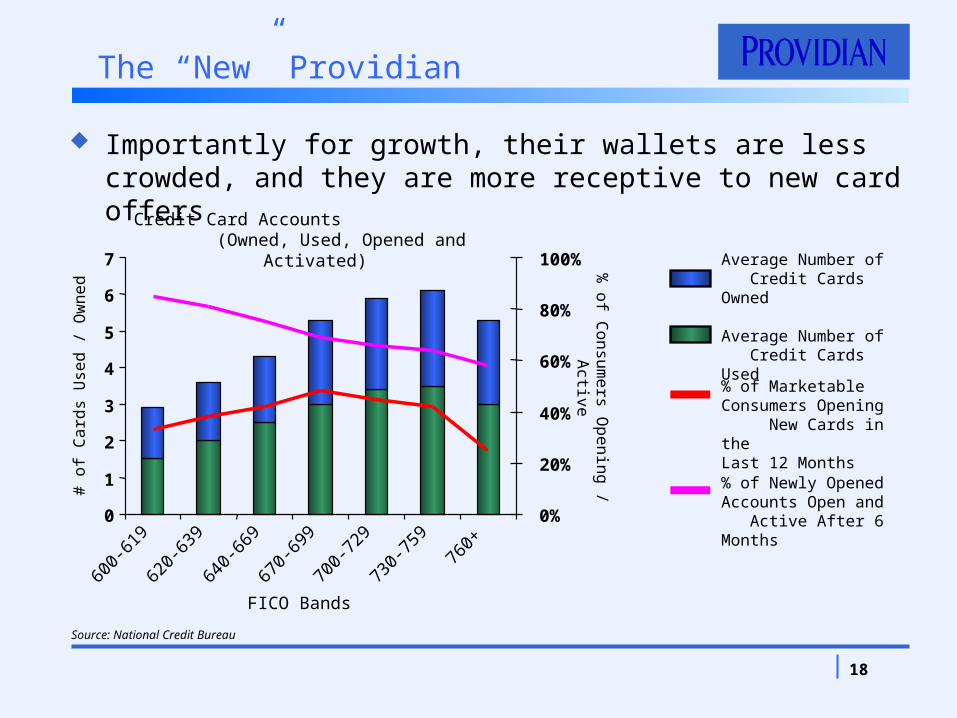
The “New” Providian
Importantly for growth, their wallets are less crowded, and they are more receptive to new card offers
0
1
2
3
4
5
6
7
600-
619
620-
639
640-
669
670-
699
700-
729
730-
759
760+
0%
20%
40%
60%
80%
100%Average Number of Credit Cards Owned
Average Number of Credit Cards Used
Source: National Credit Bureau
# o
f C
ard
s U
sed /
Ow
ned
% o
f Consu
mers O
penin
g / A
ctive
FICO Bands
Credit Card Accounts (Owned, Used, Opened and Activated)
% of Newly Opened Accounts Open and Active After 6 Months
% of Marketable Consumers Opening New Cards in the Last 12 Months
19
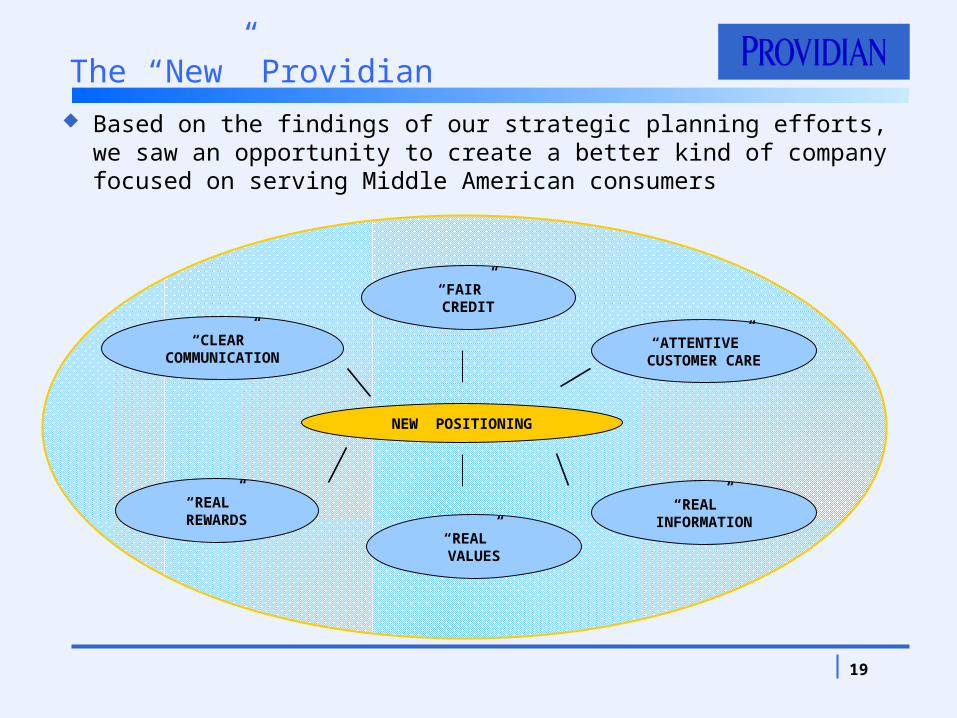
“REAL” VALUES
NEW POSITIONING
“REAL” INFORMATION
“ATTENTIVE” CUSTOMER
CARE
“REAL” REWARDS
“FAIR” CREDIT
“CLEAR”COMMUNICATION
Based on the findings of our strategic planning efforts, we saw an opportunity to create a better kind of company focused on serving Middle American consumers
The “New” Providian

20
Strategic Marketing Partnerships
Strategic marketing partnerships are expected to be a core component of our future marketing efforts
We are in latter stages of discussions with several entities on co-branded relationships:
Consistent with strategy Expected to begin producing accounts before year-
end
PayPal co-branded program is producing solid results
Working with partner to expand distribution
21
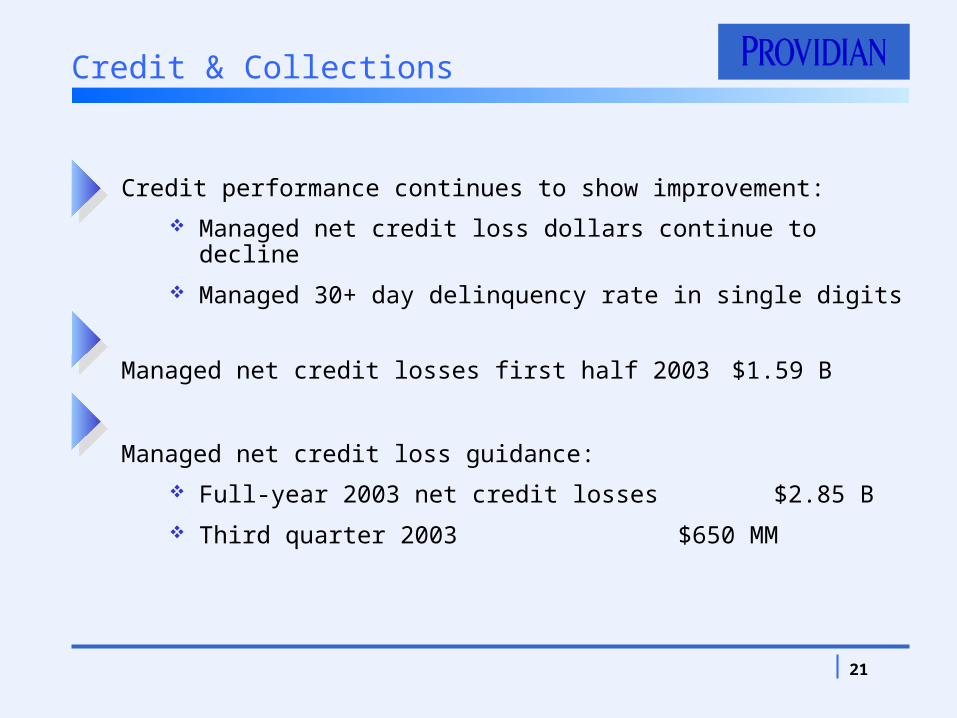
Credit & Collections
Credit performance continues to show improvement:
Managed net credit loss dollars continue to decline
Managed 30+ day delinquency rate in single digits
Managed net credit losses first half 2003 $1.59 B
Managed net credit loss guidance:
Full-year 2003 net credit losses $2.85 B
Third quarter 2003 $650 MM
22
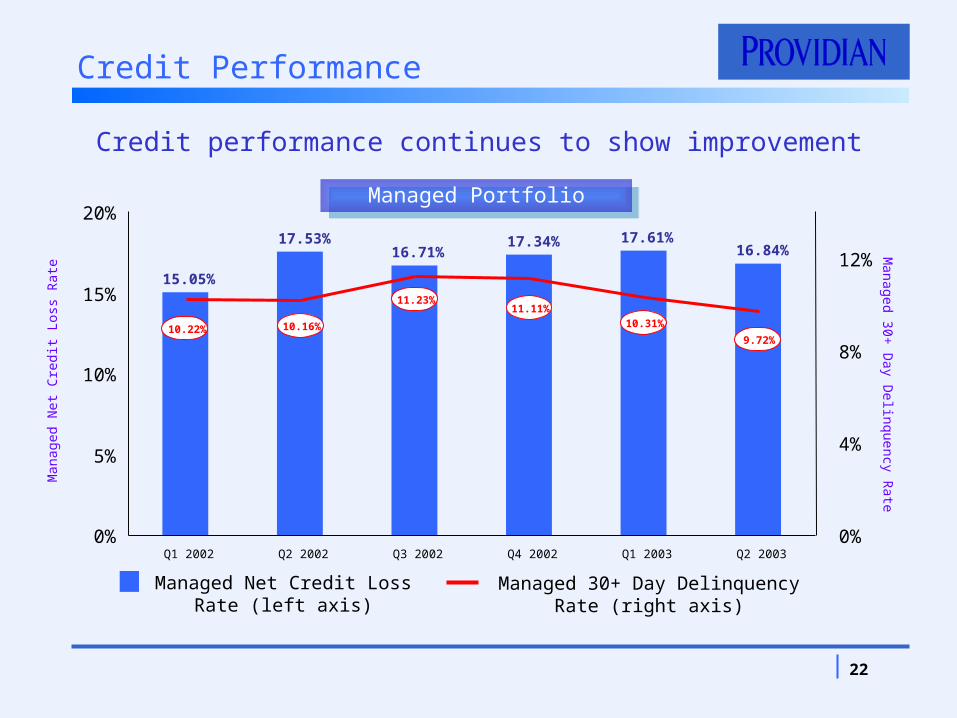
Credit Performance
Managed 30+ Day Delinquency Rate (right axis)
Managed Net Credit Loss Rate (left axis)
Managed 30+
Day D
elinquency Rate
Man
aged
Net
Cre
dit L
oss
Rat
e 15.05%
17.53%16.71%
17.34% 17.61%16.84%
0%
5%
10%
15%
20%
Q1 2002 Q2 2002 Q3 2002 Q4 2002 Q1 2003 Q2 20030%
4%
8%
12%
10.22% 10.16%
11.23%11.11%
10.31%
9.72%
Credit performance continues to show improvement
Managed PortfolioManaged Portfolio
23
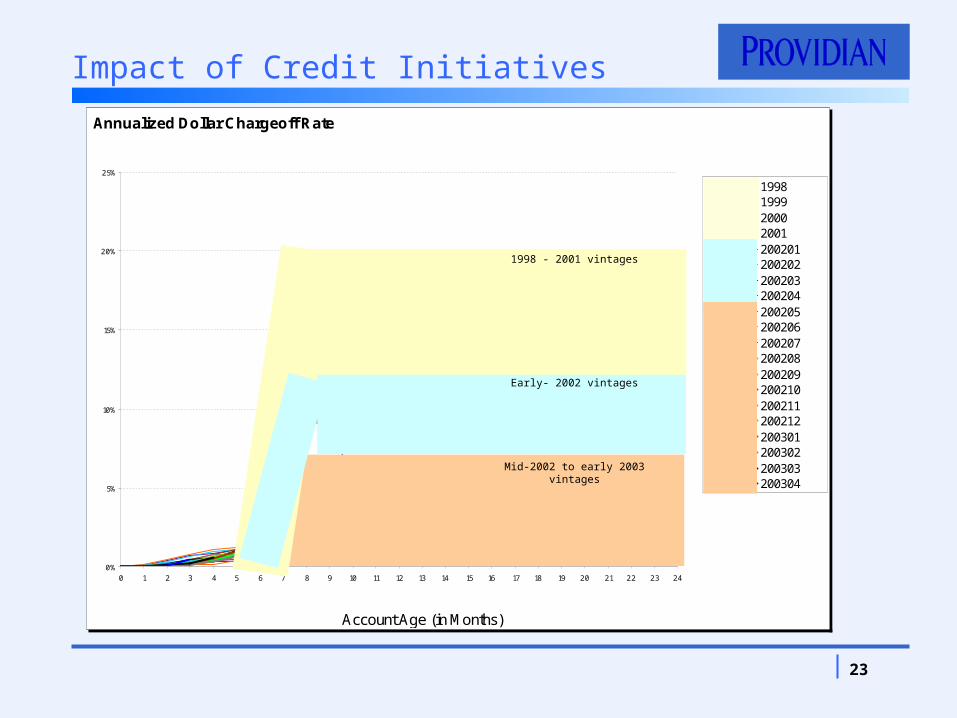
Annualized Dollar Chargeoff Rate
0%
5%
10%
15%
20%
25%
0 1 2 3 4 5 6 7 8 9 10 11 12 13 14 15 16 17 18 19 20 21 22 23 24
Account Age (in Months)
1998199920002001200201200202200203200204200205200206200207200208200209200210200211200212200301200302200303200304
Impact of Credit Initiatives
1998 - 2001 vintages
Early- 2002 vintages
Mid-2002 to early 2003 vintages
24
Operations & Enterprise Technology
Focus on quality performance and creating customer centric culture and processes
Develop flexible, robust platforms to support new opportunities Conversion to TS2 completed in August
Build a culture of continual improvement and cost reduction
Eliminate redundancies and outsource non-core activities to realize savings
Outsourced development activities to Accenture in August
25
Summary
Providian is a stronger entity and remains solidly on track with its restructuring:
Finance Strengthened capital, funding and liquidity positions
Marketing Executing new middle market strategy & developing new distribution
channels
Credit Reduced net credit losses and improving delinquency rates
Operations Retooled for greater operational and cost efficiency


Financial Addendum
28
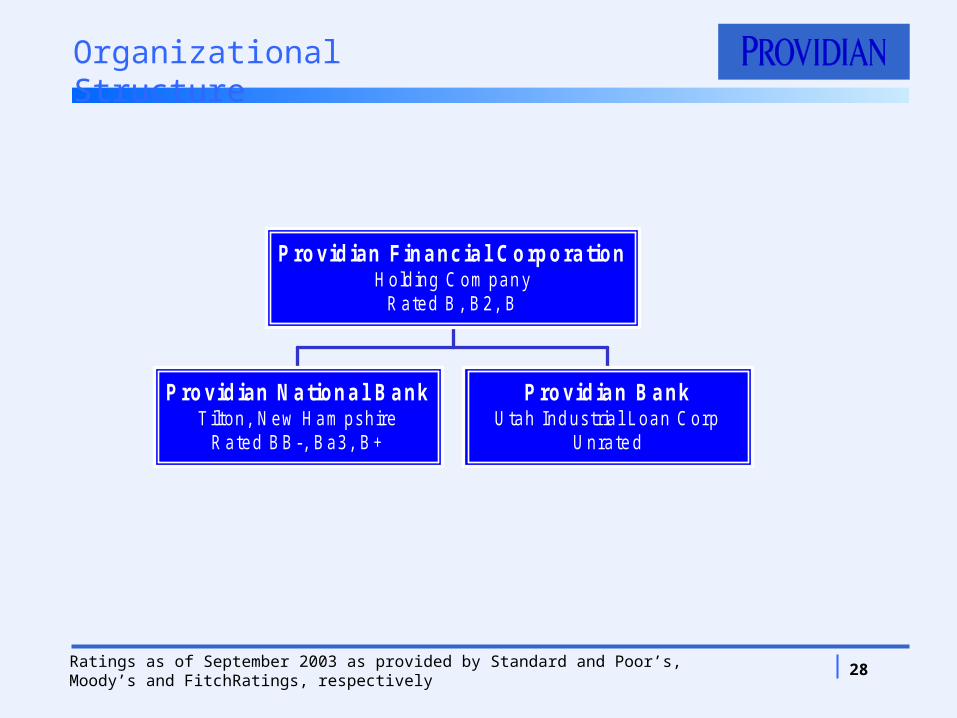
Organizational Structure
Providian National BankT ilton, New Ham pshire
Rated BB-, Ba3, B+
Providian BankUtah Ind ustrial L oan Corp
Unrate d
Providian Financial CorporationHolding C om pan y
Rated B , B2, B
Ratings as of September 2003 as provided by Standard and Poor’s, Moody’s and FitchRatings, respectively
29
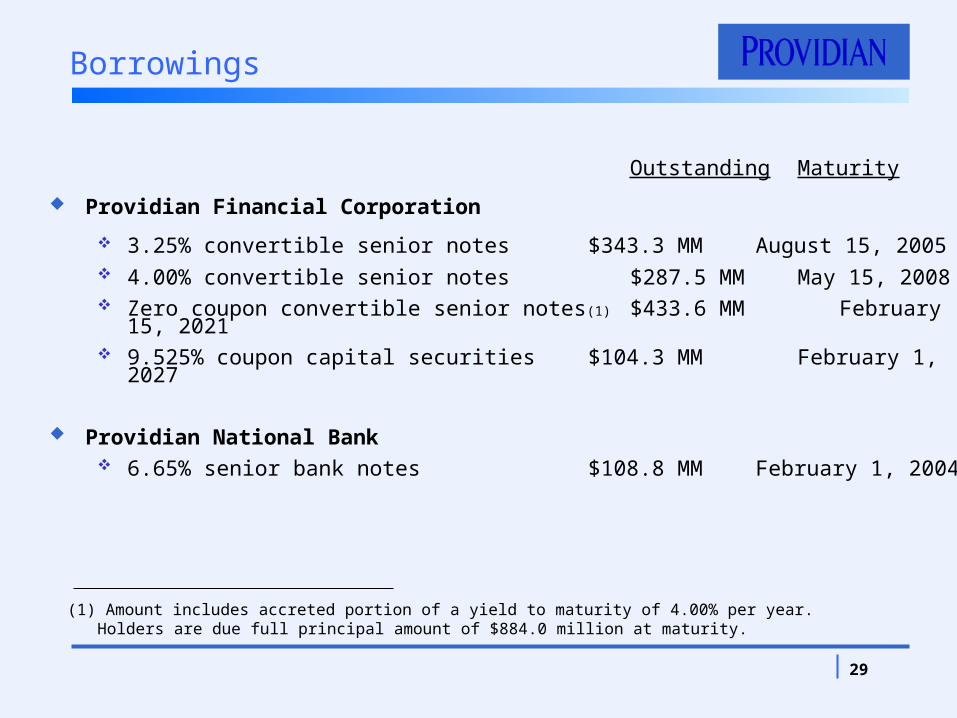
Borrowings
Outstanding Maturity
Providian Financial Corporation
3.25% convertible senior notes $343.3 MM August 15, 2005 4.00% convertible senior notes $287.5 MM May 15, 2008 Zero coupon convertible senior notes(1) $433.6 MM February 15, 2021 9.525% coupon capital securities $104.3 MM February 1, 2027
Providian National Bank 6.65% senior bank notes $108.8 MM February 1, 2004
(1) Amount includes accreted portion of a yield to maturity of 4.00% per year. Holders are due full principal amount of $884.0 million at maturity.
30
Non-GAAP Managed Financial Information
Loans that have been securitized and sold to third party investors are not considered to be our assets under GAAP and therefore are not shown on our balance sheet. However, the interests we retain in the securitized loan pools create financial exposure to the current and expected cash flows of the securitized loans. Although the loans sold are not on our balance sheet, their performance can affect some or all of our retained interests as well as our results of operations and our financial position. In addition, we continue to service these loans.
Because of this continued exposure and involvement, we use managed financial information to evaluate our historical performance, assess our current condition, and plan our future operations. We believe that managed financial information supplements our GAAP information and is helpful to the reader’s understanding of our consolidated financial condition and results of operations. “Reported” financial information refers to GAAP financial information. “Managed” financial information is derived by adjusting the reported financial information to add back securitized loan balances and the related finance charge and fee income, credit losses, and net interest costs.
The Company discloses certain projected financial measures relating to expected performance on a managed basis, such as net credit losses, net interest income margin and non-interest income margin. The Company develops such projections on a managed basis using managed financial information and does not in the normal course derive comparable GAAP projections. Developing such comparable GAAP projections would be unreasonably burdensome and in the opinion of management such comparable GAAP projections would not provide to the users of the financial information a significant benefit in understanding the Company’s expected future performance.
31
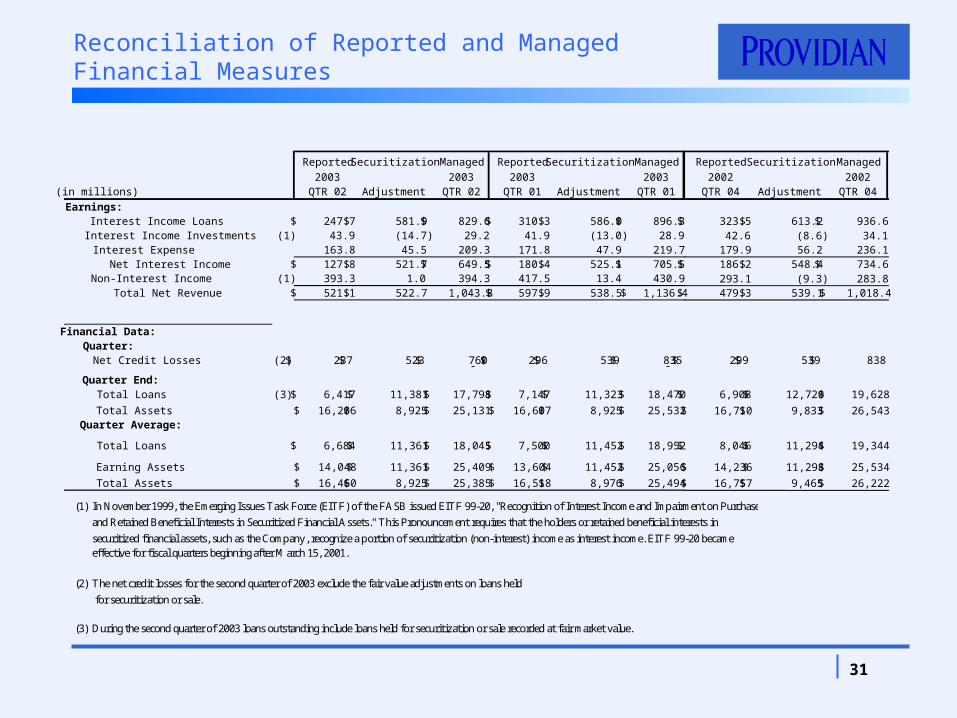
Reported Securitization Managed Reported Securitization Managed
2003 2003 2003 2003(in millions) QTR 02 Adjustment QTR 02 QTR 01 Adjustment QTR 01
Earnings:Interest Income Loans 247.7$ 581.9$ 829.6$ 310.3$ 586.0$ 896.3$ Interest Income Investments (1) 43.9 (14.7) 29.2 41.9 (13.0) 28.9 Interest Expense 163.8 45.5 209.3 171.8 47.9 219.7 Net Interest Income 127.8$ 521.7$ 649.5$ 180.4$ 525.1$ 705.5$ Non-Interest Income (1) 393.3 1.0 394.3 417.5 13.4 430.9 Total Net Revenue 521.1$ 522.7$ 1,043.8 597.9$ 538.5$ 1,136.4$
Financial Data:Quarter:
Net Credit Losses (2) 237$ 523$ 760$ 296$ 539$ 835$ - - Quarter End:
Total Loans (3) 6,417$ 11,381$ 17,798$ 7,147$ 11,323$ 18,470$
Total Assets 16,206$ 8,925$ 25,131$ 16,607$ 8,925$ 25,532$ Quarter Average:
Total Loans 6,684$ 11,361$ 18,045$ 7,500$ 11,452$ 18,952$
Earning Assets 14,048$ 11,361$ 25,409$ 13,604$ 11,452$ 25,056$
Total Assets 16,460$ 8,925$ 25,385$ 16,518$ 8,976$ 25,494$
Reported Securitization Managed
2002 2002QTR 04 Adjustment QTR 04
323.5$ 613.2$ 936.6$ 42.6 (8.6) 34.1
179.9 56.2 236.1 186.2$ 548.4$ 734.6$ 293.1 (9.3) 283.8 479.3$ 539.1$ 1,018.4$
299$ 539$ 838$
6,908$ 12,720$ 19,628$
16,710$ 9,833$ 26,543$
8,046$ 11,294$ 19,344$
14,236$ 11,298$ 25,534$
16,757$ 9,465$ 26,222$
Reconciliation of Reported and Managed Financial Measures
(1) In November 1999, the Emerging Issues Task Force (EITF) of the FASB issued EITF 99-20, "Recognition of Interest Income and Impairment on Purchased
and Retained Beneficial Interests in Securitized Financial Assets." This Pronouncement requires that the holders or retained beneficial interests in
securitized financial assets, such as the Company, recognize a portion of securitization (non-interest) income as interest income. EITF 99-20 becameeffective for fiscal quarters beginning after March 15, 2001.
(2) The net credit losses for the second quarter of 2003 exclude the fair value adjustments on loans held
for securitization or sale.
(3) During the second quarter of 2003 loans outstanding include loans held for securitization or sale recorded at fair market value.
32
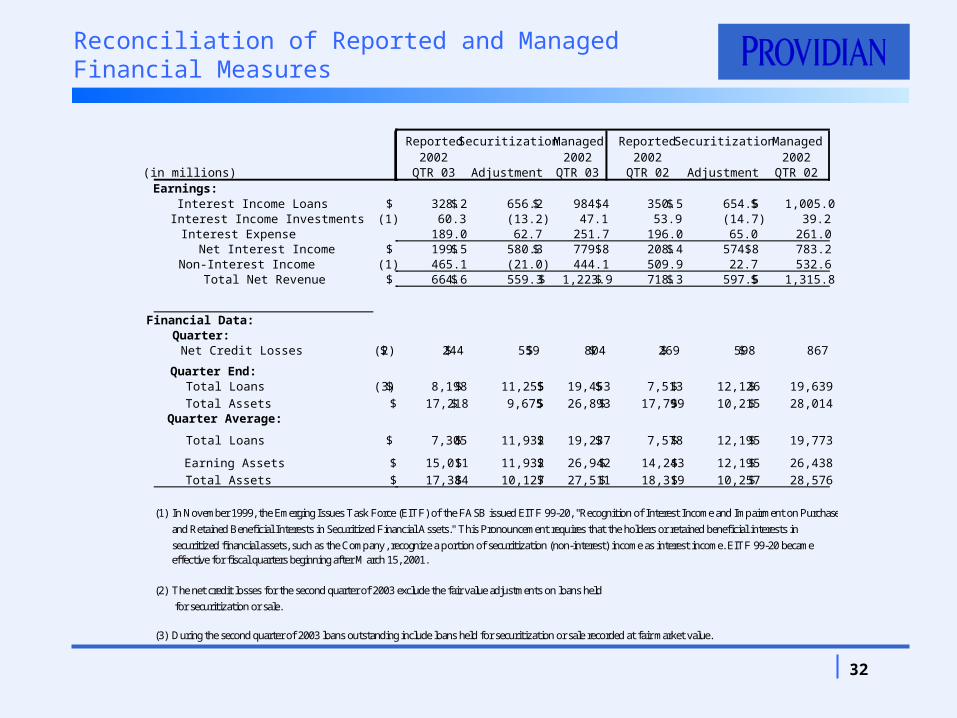
Reported Securitization Managed Reported Securitization Managed2002 2002 2002 2002
QTR 03 Adjustment QTR 03 QTR 02 Adjustment QTR 02
328.2$ 656.2$ 984.4$ 350.5$ 654.5$ 1,005.0$ 60.3 (13.2) 47.1 53.9 (14.7) 39.2
189.0 62.7 251.7 196.0 65.0 261.0 199.5$ 580.3$ 779.8$ 208.4$ 574.8$ 783.2$ 465.1 (21.0) 444.1 509.9 22.7 532.6 664.6$ 559.3$ 1,223.9$ 718.3$ 597.5$ 1,315.8$
244$ 559$ 804$ 269$ 598$ 867$
8,198$ 11,255$ 19,453$ 7,513$ 12,126$ 19,639$
17,218$ 9,675$ 26,893$ 17,799$ 10,215$ 28,014$
7,305$ 11,932$ 19,237$ 7,578$ 12,195$ 19,773$
15,011$ 11,932$ 26,942$ 14,243$ 12,195$ 26,438$
17,384$ 10,127$ 27,511$ 18,319$ 10,257$ 28,576$
(in millions)Earnings:
Interest Income LoansInterest Income Investments (1)Interest Expense Net Interest IncomeNon-Interest Income (1) Total Net Revenue
Financial Data:Quarter:
Net Credit Losses (2)
Quarter End:Total Loans (3)
Total AssetsQuarter Average:
Total Loans
Earning Assets
Total Assets
(1) In November 1999, the Emerging Issues Task Force (EITF) of the FASB issued EITF 99-20, "Recognition of Interest Income and Impairment on Purchased
and Retained Beneficial Interests in Securitized Financial Assets." This Pronouncement requires that the holders or retained beneficial interests in
securitized financial assets, such as the Company, recognize a portion of securitization (non-interest) income as interest income. EITF 99-20 becameeffective for fiscal quarters beginning after March 15, 2001.
(2) The net credit losses for the second quarter of 2003 exclude the fair value adjustments on loans held
for securitization or sale.
(3) During the second quarter of 2003 loans outstanding include loans held for securitization or sale recorded at fair market value.
Reconciliation of Reported and Managed Financial Measures
33
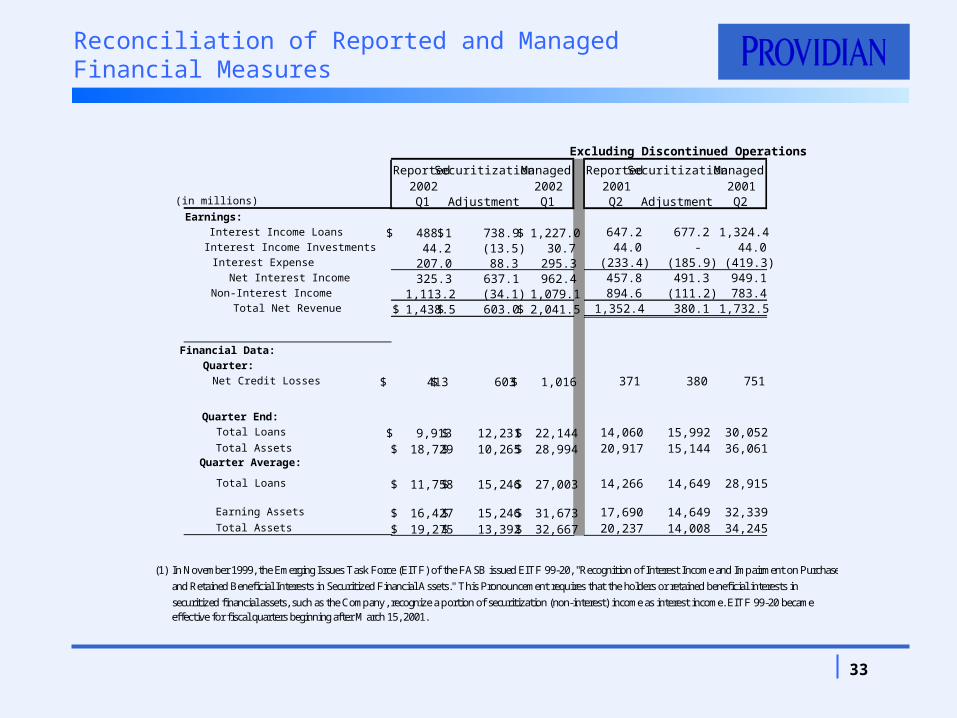
Reconciliation of Reported and Managed Financial Measures
(1) In November 1999, the Emerging Issues Task Force (EITF) of the FASB issued EITF 99-20, "Recognition of Interest Income and Impairment on Purchased
and Retained Beneficial Interests in Securitized Financial Assets." This Pronouncement requires that the holders or retained beneficial interests in
securitized financial assets, such as the Company, recognize a portion of securitization (non-interest) income as interest income. EITF 99-20 becameeffective for fiscal quarters beginning after March 15, 2001.
Excluding Discontinued Operations
Reported Securitization Managed Reported Securitization Managed2002 2002 2001 2001Q1 Adjustment Q1 Q2 Adjustment Q2
488.1$ 738.9$ 1,227.0$ 647.2 677.2 1,324.4 44.2 (13.5) 30.7 44.0 - 44.0
207.0 88.3 295.3 (233.4) (185.9) (419.3) 325.3 637.1 962.4 457.8 491.3 949.1
1,113.2 (34.1) 1,079.1 894.6 (111.2) 783.4 1,438.5$ 603.0$ 2,041.5$ 1,352.4 380.1 1,732.5
413$ 603$ 1,016$ 371 380 751
9,913$ 12,231$ 22,144$ 14,060 15,992 30,052
18,729$ 10,265$ 28,994$ 20,917 15,144 36,061
11,758$ 15,246$ 27,003$ 14,266 14,649 28,915
16,427$ 15,246$ 31,673$ 17,690 14,649 32,339
19,275$ 13,392$ 32,667$ 20,237 14,008 34,245
(in millions)
Earnings:
Interest Income Loans
Interest Income Investments
Interest Expense
Net Interest Income
Non-Interest Income
Total Net Revenue
Financial Data:
Quarter:
Net Credit Losses
Quarter End:
Total Loans
Total AssetsQuarter Average:
Total Loans
Earning Assets
Total Assets
34
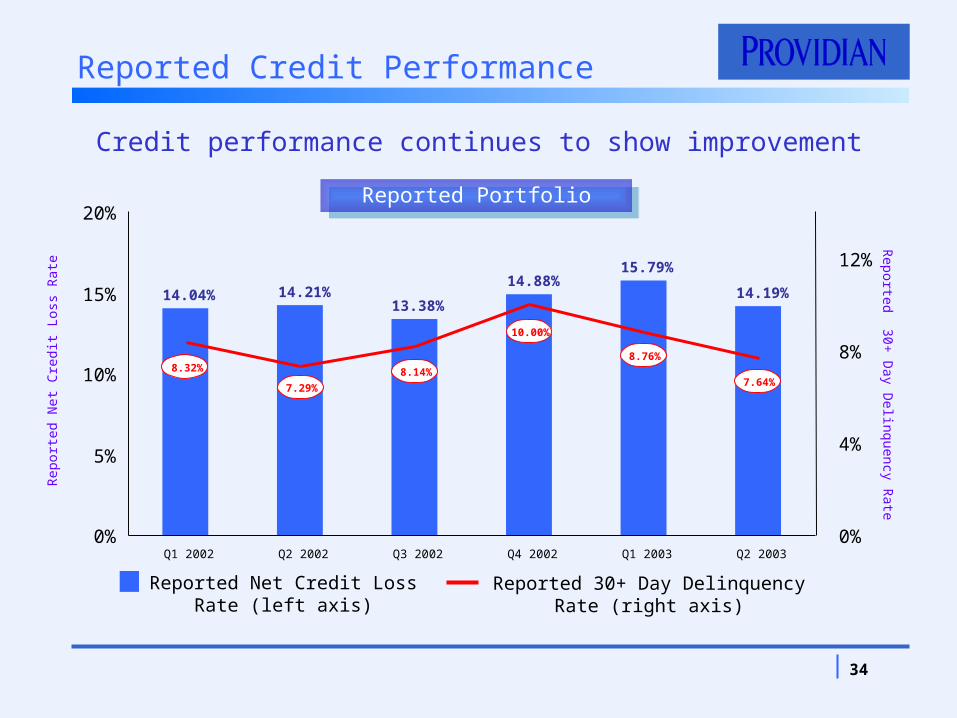
Reported Credit Performance
Reported 30+ Day Delinquency Rate (right axis)
Reported Net Credit Loss Rate (left axis)
Reported 30+
Day D
elinquency Rate
Rep
orte
d N
et C
redi
t Los
s R
ate
14.04% 14.21%13.38%
14.88%15.79%
14.19%
0%
5%
10%
15%
20%
Q1 2002 Q2 2002 Q3 2002 Q4 2002 Q1 2003 Q2 20030%
4%
8%
12%
8.32%
7.29%
8.14%
10.00%
8.76%
7.64%
Credit performance continues to show improvement
Reported PortfolioReported Portfolio