Embed Size (px)
Citation preview
1
Mouse and human microglial phenotypes in Alzheimer’s disease are controlled by 1 amyloid plaque phagocytosis through Hif1α 2 3 Alexandra Grubman1-3,15,*, Xin Yi Choo1-4,15, Gabriel Chew5,15, John F. Ouyang5, Guizhi 4 Sun1-3, Nathan P. Croft6-7, Fernando J. Rossello1-3, Rebecca Simmons8-9, Sam Buckberry8-9, 5 Dulce Vargas Landin8-9, Jahnvi Pflueger8-9, Teresa H. Vandekolk10, Zehra Abay1-3, Xiaodong 6 Liu1-3, John M. Haynes10, Catriona McLean11, Sarah Williams1-3, Siew Yeen Chai13, Trevor 7 Wilson14, Ryan Lister8-9, Colin W. Pouton10, Anthony W. Purcell6-7, Owen J. L. Rackham5, 8 Enrico Petretto5,*, Jose M. Polo1-3,*. 9 10 1Department of Anatomy and Developmental Biology, Monash University, Wellington Road, Clayton, 11
Victoria, Australia. 2Development and Stem Cells Program, Monash Biomedicine Discovery Institute, 12
Wellington Road, Clayton, Victoria, Australia. 3Australian Regenerative Medicine Institute, Monash 13 University, Wellington Road, Clayton, Victoria, Australia. 4Department of Pathology, The University of 14 Melbourne, Victoria, Australia. 5Program in Cardiovascular and Metabolic Disorders, Duke-National 15
University of Singapore Medical School, 8 College Road, 169857 Singapore, Singapore. 6Department of 16
Biochemistry and Molecular Biology, Monash University, Clayton, Victoria, Australia. 7Infection and 17 Immunity Program, Biomedicine Discovery Institute, Monash University. 8ARC Center of Excellence in 18 Plant Energy Biology, The University of Western Australia, Perth, Western Australia, Australia.9The 19 Harry Perkins Institute of Medical Research, Perth, Western Australia, Australia. 10Monash Institute of 20 Pharmaceutical Sciences, Monash University (Parkville campus), Melbourne. 11Victorian Brain Bank, 21 Parkville, Australia. 12Monash Bioinformatics Platform, Monash University, Wellington Road, Clayton, 22
Victoria, Australia. 13Department of Physiology, Monash University, Wellington Road, Clayton, Victoria, 23
Australia. 14MHTP Medical Genomics Facility. 15These authors contributed equally to this work. 24
*Correspondence should be addressed to A.G. ([email protected]), E.P. 25 ([email protected]) and J.M.P. ([email protected]) 26
Keywords: Alzheimer’s disease, microglia, Hif1a, single nuclei RNA-seq, synapse, amyloid 27 plaque, XO4 28
29
.CC-BY-NC-ND 4.0 International licensenot certified by peer review) is the author/funder. It is made available under aThe copyright holder for this preprint (which wasthis version posted May 17, 2019. . https://doi.org/10.1101/639054doi: bioRxiv preprint
2
30
ABSTRACT 31 The important role of microglia, the brain’s resident immune cells, in Alzheimer’s disease 32 (AD) is now well recognized, however their molecular and functional diversity and 33 underlying mechanisms still remain controversial. To transcriptionally and functionally 34 characterize the diversity of microglia in AD and aging, we isolated the amyloid plaque-35 containing (XO4+) and non-containing (XO4-) microglia from an AD mouse model. 36 Transcriptomics analysis unveiled independent transcriptional trajectories in ageing and AD. 37 XO4+ microglial transcriptomes linked plaque phagocytosis to altered expression of bona 38 fide late onset AD genetic risk factors. We further revealed that the XO4+ transcriptional 39 program is present in a subset of human microglia from AD patients and is a direct and 40 reversible consequence of Aβ plaque phagocytosis. Conversely, XO4- microglia in AD 41 displayed an accelerated ageing signature and contained more intracellular post synaptic 42 material than plaque-containing microglia, despite reduced active synaptosome phagocytosis. 43 Mechanistically, we predicted HIF1α as a core regulator of the XO4-/XO4+ axis, and further 44 validated the mechanism in vitro using human stem cell-derived microglia like cells and 45 primary human microglia. Together these findings unveiled the molecular mechanism 46 underpinning the functional diversity of microglia in AD, providing opportunities to develop 47 treatments targeted at subset specific manipulation of the microglial niche.48
.CC-BY-NC-ND 4.0 International licensenot certified by peer review) is the author/funder. It is made available under aThe copyright holder for this preprint (which wasthis version posted May 17, 2019. . https://doi.org/10.1101/639054doi: bioRxiv preprint
3
49
Microglia are specialist immune sentinel cells in the brain that respond to stranger or 50 danger signals, remove cellular and extracellular debris, and regulate synaptic plasticity, 51 maturation and removal1–3. Thus, microglial function is vital to physiological processes in the 52 brain. AD is a progressive neurodegenerative condition, with no effective treatment options. 53 Synapse loss, which occurs in cortical and hippocampal regions, most strongly correlates 54 with cognitive dysfunction in AD4, and is accompanied by extracellular amyloid beta (Aβ) 55 plaques and intraneuronal neurofibrillary tau tangles5. The possible role of microglia in AD 56 has been highlighted by several unbiased data-driven functional genomics studies6–11. Indeed, 57 all the identified genetic risk factors for the more common late onset AD (LOAD; >95% 58 cases) have been recently reported to be microglia specific, or highly expressed in 59 microglia12. Additionally, recent reports in mouse models, have found that microglia obtained 60 from areas rich in plaques, have a different signature to microglia from plaque-free areas, 61 however the origin of these microglia and their signature still remains unknown. 62 Furthermore, knockouts of essential microglial receptor genes on an AD genetic background 63 have yielded both protective and exacerbated phenotypes, often at different disease stages 64 (i.e., 13–17 and 18,19). Coupled with the increasingly recognized spatio-temporal diversity of 65 microglia20–22, these reports highlight the dynamic nature and complexity of microglial 66 responses, which might be explained by the presence of multiple microglial subpopulations 67 that may differentially affect disease course. To address this question, we used an aggressive 68 plaque-depositing AD mouse to investigate whether differences in amyloid plaque 69 phagocytosis are directly molecularly and functionally associated with specific microglia 70 phenotypes in AD. 71
72
RESULTS 73
Methoxy-XO4 purifies molecularly distinct plaque-associated microglia populations 74
To understand the spatio-temporal and functional differences between plaque-75 phagocytic and non-phagocytic microglia in AD, we took advantage of in vivo Aβ plaque 76 labeling using a fluorescent Congo-red derivative, methoxy-XO423 (Fig. 1a-b, Extended data 77 Fig. 1a-b). We found that 13.5% and 15.8% of cerebral microglia were amyloid-78 phagocytosing (XO4+) in 4, and 6m old 5xFAD mice, respectively, with no significant 79 differences observed between male and female mice (Fig. 1c-d). Conversely, we did not 80 detect any XO4+ microglia in 1m old 5xFAD mice, or WT mice of any age, and only 4.35% 81
.CC-BY-NC-ND 4.0 International licensenot certified by peer review) is the author/funder. It is made available under aThe copyright holder for this preprint (which wasthis version posted May 17, 2019. . https://doi.org/10.1101/639054doi: bioRxiv preprint
4
of cerebellar microglia in 5xFAD mice were XO4+, in accordance with the relative resistance 82 of this region to pathology in mouse AD models and AD patients24. 83
Next, we adapted CelSeq2 to transcriptionally profile a small number of XO4+ and 84 XO4- microglia during disease progression in 5xFAD mice25. XO4- and XO4+ microglia 85 clustered separately, showing a progression from WT to XO4+ microglia via XO4- microglia 86 in the first principal component (PC), whereas the second PC separated cerebellar microglia 87 from their cerebral counterparts (Fig. 1e, Extended data Fig. 2a). We found that the factor 88 explaining the greatest variance in gene expression was plaque phagocytosis (i.e., 89 XO4+/XO4-, Extended data Fig. 2b). To investigate whether there was an interaction of 90 plaque phagocytosis with age, we created “gene cytometry plots”, which show the 91 distribution of differentially expressed (DE) genes by their significance score (i.e., false 92 discovery rate (FDR)-weighted log fold change) for both age and XO4+/XO4- factors from 93 the DE analysis. These “gene cytometry plots” allowed us to identify gene sets that are 94 significantly associated with either age, plaque internalization or both (Fig. 1f, g). Most DE 95 genes (black points and contour plot) were associated with the XO4+ signature (Fig. 1f; Q1 96 and Q2) and detection of this signature was amplified by ageing, as 39% of XO4-associated 97 genes were also associated with age progression in microglia at 4m (Fig. 1f; Q2), whereas 98 this proportion had risen to 56% by 6m (Fig. 1g; Q2). 99
Overall, we identified 2,475 genes associated only with the plaque-phagocytic XO4+ 100 state, which were enriched for the gene ontology (GO) terms ribosome, oxidative 101 phosphorylation and phagolysosome pathways (Fig. 1hi, Supplementary table 1). These 102 functional annotations suggest that the XO4+ gene signature reflects the microglia cell 103 response to amyloid phagocytosis, requiring increased protein synthesis to enable efficient 104 digestion of aggregated material, which is in keeping with the increased size of XO4+ 105 compared to XO4- microglia (Extended data Fig. 2c). 106
Among the most upregulated genes in XO4+ microglia were the two most highly 107 penetrant late-onset AD risk factor genes, the receptor Trem2 and its ligand Apoe26, as well as 108 their interacting partners, Tyrobp10 and Lpl, Ldlr, Lrpap1 (reviewed in 27), respectively, 109 suggesting a link between phagocytosis and cholesterol transport pathways to the XO4+ 110 phenotype in AD. Additionally, a significantly high proportion (63%, p=6.1x10-11 by 111 hypergeometric test) of previously reported microglial sensome genes28 were differentially 112 expressed in XO4+ microglia (Extended data Fig. 3a), including c-lectins (Clec4a2, Clec4a3, 113 Clec7a) and CD markers (i.e., Cd33, Cd68, Cd74, Cd180). The XO4+ gene signature partially 114 overlaps with recently reported microglia signatures obtained from APP/PS1 or 5xFAD 115
.CC-BY-NC-ND 4.0 International licensenot certified by peer review) is the author/funder. It is made available under aThe copyright holder for this preprint (which wasthis version posted May 17, 2019. . https://doi.org/10.1101/639054doi: bioRxiv preprint
5
model mice29–31 (Extended data Fig. 3b, c). Twenty-one core genes associated with 116 XO4+/XO4- phenotype were identified by all four studies29–31 as altered in neurodegenerative 117 disease-associated microglia: Apoe, Igf1, Clec7a, Itgax, Axl, Cst7, Spp1, Cxcr4, Gas7, 118 Serpine2, Gpnmb, Csf1, Fabp3, Apbb2 and Cd200r4 (upregulated in XO4+ microglia) and 119 Tmem119, P2ry13, Cx3cr1, Crybb1, P2ry12 and Ccr5 (downregulated in XO4+ microglia; 120 Fig. 1hii). Notably, our analysis identified an additional 2,196 XO4+ signature genes that were 121 not reported in any previous study (Extended data Fig. 3b). These newly identified genes 122 were highly enriched for genes involved in oxidative phosphorylation, regulation of cell 123 cycle, particularly M-phase (Extended data Fig. 3d) and immune response functions. 124 Importantly, phagocytic associated genes were also highly enriched suggesting a potential 125 role in augmented plaque clearance. Furthermore, XO4+ cells showed upregulation of Mki67, 126 consistent with the observed expansion of the XO4+ subset during disease progression in 127 5xFAD mice. Alternatively, it is possible that non-plaque associated microglia proliferate and 128 migrate towards plaques, as reported in APP/PS1 mice32. 129
This partial overlap and extended XO4+ network might be due to several factors: we 130 profiled the specific microglia (CD11b+CD45loCX3CR1+) population in AD that have 131 phagocytosed plaques (XO4+), rather than more heterogeneous approaches (CD11c+ or 132 Clec7a+) which did not include a marker for plaque per se, suggesting that the XO4+ 133 microglia are an important, yet unappreciated, source of the different reported AD-associated 134 signatures. Secondly, we were able to obtain a more homogenous dataset than either bulk 135 APP/PS1 or CD11c+ microglia (which contain both plaque associated and distal microglia29), 136 and we sequenced to a greater depth than the first study that defined the DAM microglia29. 137
To determine whether the observed transcriptional signature corresponded to changes 138 in the proteome of XO4+ microglia, we performed targeted LC-SWATH-MS analysis (Fig. 139 1i). Out of 174 proteins corresponding to DEGs detected, downregulation of 19 genes in 140 XO4+ microglia was mirrored at the protein level, including for DOCK10, CRYBB1, 141 PLXNA1 and FGD2. We also detected elevated concentrations of peptides corresponding to 142 99 genes upregulated in XO4+ microglia, including APOE, PSAT1, RPS4X, ANXA5, 143 GAPDH, LGALSBP, CD180, C1QB and LRPAP1. Nonetheless, we also observed several 144 instances where transcripts induced in XO4+ microglia were repressed post-transcriptionally 145 (SERPINE2, ACACA, UQCRH, and MYO5A). We next sought to directly validate the 146 presence of Aβ within XO4+ cells. In 5xFAD, but not WT, microglia, we detected a single 147 peptide within the amyloid precursor protein sequence (LVFFAEDVGSNK), compared to 148 multiple tryptic peptides arising from APP fragments that were detected within purified 149
.CC-BY-NC-ND 4.0 International licensenot certified by peer review) is the author/funder. It is made available under aThe copyright holder for this preprint (which wasthis version posted May 17, 2019. . https://doi.org/10.1101/639054doi: bioRxiv preprint
6
synaptosome fractions (Supplementary table 2). That LVFFAEDVGSNK is the only tryptic 150 peptide present within the Aβ sequence suggests that this peptide arose from microglial 151 phagocytosis Aβ and not from microglial expression of App or phagocytosis of APP. The 152 180-fold upregulation of the Aβ peptide in XO4+ microglia compared to the limit of detection 153 further confirmed that these microglia contain high levels of internalized Aβ (Fig. 1j). 154 Surprisingly, XO4- microglia also contained Aβ, albeit at ~10 fold lower levels than XO4+ 155 microglia. This is consistent with low levels of non-fibrillar (i.e., oligomeric) Aβ 156 phagocytosis by XO4- microglia, although our observation could also be explained by low 157 numbers of contaminating XO4+ cells containing partially digested Aβ peptide fragments and 158 thus not detected by Methoxy-XO4 staining. Together these data show that the molecular 159 state of XO4+ microglia is distinct from homeostatic and XO4- microglia at the RNA and 160 protein levels and is directly associated with high levels of internalized fibrillar Aβ. 161
Two distinct molecular processes drive microglial alterations in AD 162
Recent reports highlight subtle transcriptional differences between individual 163 microglial cells, even those residing within the same anatomical regions33,34. Thus, to 164 examine the heterogeneity inside the XO4+ cell population, we first employed viSNE35 on 165 FACS data sets, a dimensionality reduction and visualization approach that preserves multi-166 variate relationships within single-cell data. We labelled myeloid cells with a subset of 6 167 microglial sensome markers28 including the genetic LOAD risk factors CD3336 and TREM28 168 that regulate microglial Aβ phagocytosis16,37. XO4+ labeled microglia clustered together, and 169 revealed uniformly high expression of CD33, TREM2 and the Csf1 receptor, CD115 (Fig. 2a, 170 Extended data Fig. 4a; p<0.0001 compared to XO4- microglia for each marker by 2-tailed 171 paired t-test), consistent with the reported increase of CD33-expressing microglia in human 172 AD37 and TREM2 upregulation in microglial processes directly interacting with plaques in 173 three AD mouse models16. It is noteworthy that while all microglia homogeneously expressed 174 CD11b, CX3CR1 and low levels of CD45, the expression pattern of the archetypal microglia-175 specific proteins, CD115, CD33 and TREM2 were highly variable in individual WT and 176 5xFAD XO4- microglia. Thus, we further investigated microglial heterogeneity by single cell 177 sequencing using the 10X Genomics Chromium system. As aging is the most important risk 178 factor for LOAD38, and microglia are known to express an altered ageing gene signature20,39, 179 we examined whether microglial subpopulations in 5xFAD mice adopted an aging phenotype 180 by including FACS-sorted microglia from WT adult (6m) and WT old mice (24m) as well as 181 both XO4- and XO4+ populations from a 6m old 5xFAD mouse (Fig. 2b). Similar to our bulk 182 analyses of XO4+/- microglia, the first PC was dominated by the shift to a phagocytic 183
.CC-BY-NC-ND 4.0 International licensenot certified by peer review) is the author/funder. It is made available under aThe copyright holder for this preprint (which wasthis version posted May 17, 2019. . https://doi.org/10.1101/639054doi: bioRxiv preprint
7
phenotype, whereas the third PC separated 6m from aged WT cells, while 5xFAD XO4- cells 184 were also shifted in the direction of aged WT microglia (Fig. 2b). Single-Cell Consensus 185 Clustering (SC3)40 separated microglia into four clusters, whereby all 5xFAD XO4+ cells 186 were entirely contained within cluster 2, and cluster 3 was almost entirely composed of WT 187 6m microglia (Fig. 2c). Interestingly, 6m XO4- microglia and aged WT microglia clustered 188 together (i.e., have similar transcriptional profiles), suggesting that the XO4- population, from 189 AD mice, may represent an accelerated aging phenotype. The ageing signature was enriched 190 in α-defensin genes (Fig. 2di-ii), antimicrobial peptides which mobilize immune cells and 191 enhance phagocytosis in the periphery (reviewed in 41), although their role in the brain has 192 not previously been described. In agreement with our bulk RNA-seq data (Fig. 1e-h), we 193 observed loss of homeostatic genes (i.e., Crybb1, Fig. 2diii) and upregulation of XO4+ 194 signature genes (i.e., Igf1, Ccl3, Fig. 2div-v) in the XO4+ microglial population. 195
To further elucidate the molecular microglial trajectories in 5xFAD mice, we ordered 196 cells in aging pseudotime, which we defined by their expression of the 42 ageing-specific 197 DEGs (FDR<0.05, top 20 genes reported in Extended data Fig. 5a, list in Supplementary 198 table 3) between adult and aged WT microglia (Fig. 2e). This analysis indicated that the XO4- 199 and XO4+ groups were both shifted in the ageing trajectory, although there was a high degree 200 of heterogeneity of the pseudoage of individual cells within 5xFAD microglial populations, 201 suggesting a gradual acquisition of the ageing signature. Conversely, when cells were ordered 202 by their phagocytic pseudotime, taking into account the 474 phagocytosis-specific DEGs 203 (FDR<0.05, top 20 genes reported in Extended data Fig. 5b, list in Supplementary table 3) 204 between phagocytosing and non-phagocytosing AD microglia, we observed a profile that 205 resembled a switch from a non-phagocytic to a phagocytic signature with few cells exhibiting 206 an intermediate or transitional phagocytic pseudotime (Fig. 2f). These data suggest that 207 although the XO4+ and XO4- molecular signatures are distinct, the cellular age of individual 208 microglia lies on a continuum within each 5xFAD population and is controlled by an 209 independent component of ageing, which is largely unrelated to phagocytosis (Fig. 2g). The 210 top 50 most variable genes in the dataset included microglial identity genes (i.e. Crybb1, 211 Alox5ap, Maf), α-defensin genes (Defa20, Defa21, Defa24, Gm15284), chemokines (Ccl3, 212 Ccl4, Ccl6) and lysosomal genes (Lyz2, Cst7, Ctsa), and clustered samples according to both 213 age and phagocytic phenotype (Fig. 2h). In addition to the newly described set of genes (356 214 XO4+ specific genes not identified in DAM microglia), our single cell RNA-seq data in XO4+ 215 cells also recapitulate core Stage I and Stage II changes described for DAM microglia29. 216 However, the XO4- and aged microglia molecular signatures do not overlap with either Stage 217 I or II DAM (Extended data Fig. 6a, b), although they do differ from homeostatic microglia 218
.CC-BY-NC-ND 4.0 International licensenot certified by peer review) is the author/funder. It is made available under aThe copyright holder for this preprint (which wasthis version posted May 17, 2019. . https://doi.org/10.1101/639054doi: bioRxiv preprint
8
(Fig. 2b-g). These data collectively suggest that the XO4- microglia are on an independent 219 trajectory and are not necessary cellular intermediates poised to become XO4+ cells. 220
The XO4+ molecular signature is reversible and can be induced by phagocytosis of 221 amyloid plaques 222
We next asked whether the XO4+ transcriptional program is a consequence of AD brain 223 microenvironment per se or if the phagocytosis of plaques is the signal required for this 224 molecular switch. In other words, we wished to address whether the XO4+ signature predates 225 plaque phagocytosis and enables enhanced phagocytic capacity of a proportion of cells in 226 5xFAD mice or is a result of plaque phagocytosis. Thus, to determine whether and how any 227 microglia could activate an XO4+ signature, we cultured CFSE-labelled WT microglia with 228 organotypic hippocampal slice cultures (OHSCs) from 6m 5xFAD mice (Fig. 3a). To ensure 229 that the XO4+ microglial signature was not dependent on the presence of the Methoxy-XO4 230 dye, we instead labelled OHSCs with NIAD442, an alternative fluorescent Aβ-binding dye. 231 To establish that a healthy and plaque-associated microglial signature can be detected using 232 this system, we also cultured WT microglia in WT OHSCs and 5xFAD microglia in 5xFAD 233 OHSCs, respectively. We FACS sorted groups of 10 endogenous (CSFE-) and exogenous 234 (CFSE+) microglial cells that were plaque positive (NIAD4+) or not (NIAD4-) for molecular 235 profiling. qPCR analysis of a panel of 42 homeostatic and XO4+ signature genes identified 236 two main clusters of microglia cells by SC3 (Fig. 3b, Supplementary table 4). Cluster 1 237 contained all but 1 sample of NIAD4+ microglia, including both endogenous 5xFAD cells 238 that had phagocytosed plaques, and exogenous (CFSE+) cells from either WT or 5xFAD 239 animals that had acquired the XO4+ signature upon phagocytosis of plaques in 5xFAD 240 OHSCs (Fig. 3d, e). These microglia downregulated numerous homeostatic microglia 241 signature genes (Cx3cr1, Maf, P2ry12, and Cebpa; Fig. 3ci-ii, Extended data Fig. 7a), and 242 activated expression of XO4+ profile genes (Cst7, Igf1, Apoe, Spp1, Lgals3, Trem2, Lyz2, and 243 Cstd; Fig. 3ciii-iv, Extended data Fig. 7b). Therefore, these data not only demonstrate that the 244 XO4+ signature is gained following phagocytosis of plaques but also demonstrates that both 245 WT and 5xFAD microglia are capable of acquiring the XO4+ signature Furthermore, most 246 WT cells cultured with 5xFAD OHSCs that had not phagocytosed plaques retained their 247 homeostatic signature (Fig. 3e, p=0.0326 comparing population proportions), suggesting that 248 microglial plaque phagocytosis, and not mere exposure to an AD-like brain 249 microenvironment is the trigger for conversion to the XO4+ state. Conversely, cluster 2 was 250 characterized by high expression of homeostatic microglial genes and low expression of 251 XO4+ microglia signature markers and included all microglial cells isolated from WT 252
.CC-BY-NC-ND 4.0 International licensenot certified by peer review) is the author/funder. It is made available under aThe copyright holder for this preprint (which wasthis version posted May 17, 2019. . https://doi.org/10.1101/639054doi: bioRxiv preprint
9
OHSCs. This suggests that a physiological environment is not capable of sustaining an XO4+ 253 signature. Whether this occurs through reversal of the XO4+ signature upon lysosomal 254 degradation of internalized plaque or via increased susceptibility to cell death of XO4+ cells 255 in a homeostatic environment will be important to address in future studies. Our data are 256 more consistent with the reversal of XO4+ signature in a physiological environment, as over 257 half of exogenous CFSE+ 5xFAD cells isolated from 5xFAD OHSCs molecularly resembled 258 XO4+ microglia (Fig. 3f) suggesting that survival is not impacted, whereas all 5xFAD CFSE+ 259 cells recovered from WT OHSCs clustered with homeostatic microglia (Fig. 3g, p=0.0155). 260 Interestingly, phagocytosis of synaptosome-labelled beads by microglia in OHSCs did not 261 induce Apoe or Trem2 expression, consistent with the XO4+ signature resulting specifically 262 from phagocytosis of plaques rather than the phagocytic process per se (Extended data Fig. 263 7c). Collectively, our data show that the XO4+ program is activated by plaque phagocytosis 264 and is reversible by exposure to a healthy brain microenvironment. 265
XO4+ microglia actively internalize more synaptosomes ex vivo 266
Aβ oligomers have been reported to induce microglia to aberrantly engulf synapses 267 via deregulated complement deposition43, although it is currently unknown whether all 268 microglia equally participate in this process. Thus, we hypothesized that akin to their 269 transcriptional differences as a consequence of phagocytosis of plaques, XO4+ and XO4- 270 microglia in AD may also differentially engulf synaptic proteins. To study this, we first 271 visualized and quantified internalization of the post-synaptic marker, PSD9544 by individual 272 microglia in the dentate gyrus of WT and 5xFAD mice (Fig. 4a, Extended data Fig. 8a). 273 There was a significant increase in steady-state internal PSD95 by XO4- microglia compared 274 to XO4+ microglia in 6m old 5xFAD mice (Fig. 4b). Given the previously reported 275 susceptibility of excitatory cholinergic neurons and network dysfunction in inhibitory 276 neurons in AD45, and to examine whether steady state levels of pre-synaptic components 277 internalized within microglia differed between XO4+ and XO4- microglia, we examined 278 GAD65 and found that there were also less GAD65+ synapses within XO4+ microglia (Fig. 279 4c,d). Given recent data demonstrating that synapse pruning is a complement-dependent 280 process43,46, we examined colocalization of C3 deposition with microglia in 5xFAD mice and 281 observed decreased complement C3 co-localization with XO4+ microglia compared to XO4- 282 cells (Fig. 4e, f). Indeed, both at the transcriptional and protein level, we detected higher 283 levels of complement components in XO4- microglia than in XO4+ microglia (Extended data 284 Fig. 8e). 285
.CC-BY-NC-ND 4.0 International licensenot certified by peer review) is the author/funder. It is made available under aThe copyright holder for this preprint (which wasthis version posted May 17, 2019. . https://doi.org/10.1101/639054doi: bioRxiv preprint
10
Confocal measurements are static by nature and thus do not distinguish between 286 differences in flux through the phagolysosomal pathway, and observed differences could thus 287 result from altered internalization rate, rate of degradation and efflux. Furthermore, the 288 relative difference in synaptic densities near a plaque (lower in plaque core than >30 μm from 289 the plaque halo (Extended data Fig. 8b), consistent with previous studies47), makes the 290 interpretation of this static measurement difficult. Therefore, in order to directly examine 291 active internalization of synaptic material by microglia, we performed functional 292 phagocytosis assays with pHrodo-red labelled synaptosomes on freshly isolated ex vivo 293 microglia from 5xFAD mice (Fig. 4g, h). We detected a higher rate of internalization by 294 XO4+ microglia by FACS. pHrodo-green labelled E. coli particles were also more efficiently 295 phagocytosed by XO4+ microglia compared to their XO4- counterparts (Fig. 4g, h), 296 suggesting that XO4+ microglia are primed for increased phagocytic capacity, in accordance 297 with their increased expression of lysosomal machinery (Fig. 1h). In summary, these data 298 suggest that, in addition to their distinct molecular profiles, as a result of amyloid plaque 299 phagocytosis the microglial subsets in the hippocampus of 5xFAD mice exhibit different 300 rates of synapse internalization. 301
302
Human AD microglia recapitulate the XO4+ microglia signature 303 Imaging data show that plaque-adjacent microglia in human post mortem AD brains 304 upregulate LPL29 and downregulate P2RY1231, consistent with an XO4+ signature 305 surrounding plaques. However, no study has yet profiled microglial subsets in brain tissue 306 from AD patients. Thus, we used fluorescence activated nuclear sorting (FANS)48 and 307 DroNc-Seq49, to obtain the first single cell transcriptomes of human brain AD patients (n=6) 308 and neurologically normal controls (n=6) (see companion resource paper; Grubman et al. 309 2019). Focusing on the microglia cell sub-population, Uniform Manifold Approximation and 310 Projection (UMAP) analysis, a visualization tool for single cell data, clearly separated AD 311 from healthy cells (Fig. 5a). We further used these data to test whether the XO4+ gene 312 signature identified in 5xFAD mice is conserved in human AD. We took the top 10% of 313 DEGs (n=167) between 5xFAD XO4+ and XO4- microglia to represent the XO4+ signature. 314 After getting the human orthologues of the mouse DEGs, we recapitulated the XO4+ 315 pseudotime signature in AD patients (Fig. 5b, d, Supplementary table 5). In keeping with the 316 mouse data (Fig. 2f), 63.4% of the human AD microglia sub-population exhibited a 317 significant switch from a non-phagocytic to a phagocytic signature (defined as >50th 318 percentile of the phagocytosis pseudotime; p=6.82x10⁻⁶, hypergeometric test), whereas only 319
.CC-BY-NC-ND 4.0 International licensenot certified by peer review) is the author/funder. It is made available under aThe copyright holder for this preprint (which wasthis version posted May 17, 2019. . https://doi.org/10.1101/639054doi: bioRxiv preprint
11
41.9% of healthy cells exhibited the phagocytic signature (p=1, hypergeometric test). 320 Similarly, human cells ordered by the mouse aging pseudotime gene signature showed a 321 significant association with AD (Fig. 5c, e, p=0.00484, hypergeometric test) but not control 322 microglia (p=0.997, hypergeometric test). Interestingly, the association between AD 323 microglia and the ageing signature was primarily driven by genes overlapping with the XO4+ 324 signature, as the association was no longer significant when only genes specific to the ageing 325 signature were analyzed (Extended data Fig. 9a, n=128 genes, p=0.476). The GWAS hit 326 gene FRMD4A and the homeostatic microglia gene, CX3CR1, were downregulated 327 specifically in the subset of human AD microglia with high XO4+ scores, whereas LINGO1 328 and CRYAB were specifically upregulated in this subset (Fig. 5g). Furthermore, there is a 329 significant preservation of mouse XO4+ signature in human AD patients (Fig. 5h; p=6.41x10-330 4). Interestingly, the TREM2-adaptor TYROBP, and APOE were upregulated in microglia 331 with high XO4+ scores, irrespective of the origin of microglia from control or AD patients, 332 suggesting that there are AD-specific and common components of this signature (Fig. 5g). 333 Altogether, our results confirm the existence of multiple subsets of microglia in human AD, 334 including a subset that maps to the XO4+ mouse signature identified here, and an increased 335 ageing signature primarily driven by the overlap with the XO4+ signature. 336
We next stained human sections with 6E10 to label plaques, PSD95 and Iba1 and 337 calculated semi-quantitatively the amount of post-synaptic material in plaque-adjacent and 338 distal microglia (Extended data Fig. 9b-d). Analogous to our findings in 5xFAD mice, we 339 observed that plaque-associated microglia in human AD patients contained modestly, but 340 significantly (p=0.02), less PSD95 staining than in microglia present in the same brain region 341 but not associated with plaques (Extended data Fig. 9d). To functionally assess the effect of 342 the XO4+ identity on synapse phagocytosis in human cells, and due to the impossibility of 343 isolating bona fide methoxy-XO4 stained human microglia, we first needed to understand the 344 gene regulatory network(s) underlying the XO4+ signature, to mimic it in vitro. To this end, 345 we used the Single Cell Regulatory Network Inference and Clustering (SCENIC)50 method; 346 briefly, this approach identifies regulons (i.e., group of genes that are controlled by a 347 common regulatory gene) by grouping the predicted target genes of a given transcription 348 factor (TF) module that show motif enrichment for the same TF (see Methods for details). In 349 addition, SCENIC infers the “activity” of the regulon in each cell by the AUCell algorithm, 350 providing a way to associate the regulon activity to a specific cell population (e.g., XO4+). 351 SCENIC analysis identified the Hif1a and Elf3 regulons with the highest regulon activity in 352 XO4+ cells (Fig. 5i, Supplementary table 6), and we found HIF1A regulon activity to be 353 upregulated in the human microglial nuclei that displayed a high XO4+ score (Fig. 5j). These 354
.CC-BY-NC-ND 4.0 International licensenot certified by peer review) is the author/funder. It is made available under aThe copyright holder for this preprint (which wasthis version posted May 17, 2019. . https://doi.org/10.1101/639054doi: bioRxiv preprint
12
two regulons had minimal overlap of downstream regulated genes, however, functional 355 enrichment analysis identified that both Hif1a and Elf3 specific networks captured many of 356 the same functional processes, including ribosome, oxidative phosphorylation, Alzheimer’s 357 disease and metabolic pathways (Extended data Fig. 10a-b). We thus examined whether 358 HIF1A and/or ELF3 overexpression could contribute to priming human microglia towards an 359 overactive synaptosome-phagocytic phenotype. We transfected primary human microglia 360 with a dox-inducible GFP-tagged construct to genetically turn on these regulomes, and found 361 that HIF1A overexpression indeed functionally increased synaptosome phagocytosis, 362 consistent with a role for HIF1A in regulating XO4+ functions (Fig. 5k). Together, our data 363 show that the XO4+ signature is recapitulated in a subset of human AD microglia and can be 364 controlled via HIF1A to increase synaptosome phagocytosis. 365
366
HIF1A regulon controls the XO4+ molecular signature through MYD88 and mTOR 367
To examine potential upstream small molecule targets and downstream readouts of the XO4+ 368 network and HIF1A regulome, we employed Ingenuity Pathway Analysis (IPA)51. IPA 369 identified several upstream regulators of the Hif1a regulon (Fig. 6a, Supplementary table 7), 370 including BMP9 (also known as GDF2), a ligand of the transforming growth factor-β (TGF-371 β) superfamily, the Toll like receptor (TLR) adaptor MyD88 and mTOR, which were 372 previously involved in restricting amyloidosis52, microglial response to pathogens53 and pro-373 inflammatory microglia54 (Fig. 6b). As our data suggest that the XO4+ molecular and 374 functional properties extend to human AD (Fig. 5), we chose to validate these regulons in 375 human ESC-derived microglia-like cells (iMGLs), using a recently published protocol55. 376 Stimulation of iMGLs with the MyD88-signalling dependent TLR1/2 agonist, Pam3csk, 377 alone, or in combination with BMP9, but not with the MyD88-independent TLR3 agonist, 378 Poly:IC, resulted in upregulation of HIF1A mRNA (Fig. 6c). We also noted induction of 379 downstream IPA-predicted targets SPP1 and GAPDH, as well as secretion of chemokines 380 MIP1α and MIPβ, encoded by the XO4+ signature genes, CCL3 and CCL4, respectively (Fig. 381 6c, d; Extended data Fig. 10c). However, an XO4+ signature gene that was not part of the 382 Hif1a regulon, TREM2, was repressed by Pam3csk (Extended data Fig. 10c). Despite this, we 383 found by FACS that TREM2 protein on the iMGL surface was slightly upregulated by 384 Pam3Csk and BMP9, indicating that stimulation of part of the network may drive 385 downstream changes to induce the XO4+ signature (Extended data Fig. 10d). As predicted by 386 IPA, treatment of cells with the mTOR inhibitor, rapamycin, blocked MyD88- and BMP9-387 dependent induction of Hif1a regulon XO4+ signature mRNA expression (Fig. 6e; Extended 388
.CC-BY-NC-ND 4.0 International licensenot certified by peer review) is the author/funder. It is made available under aThe copyright holder for this preprint (which wasthis version posted May 17, 2019. . https://doi.org/10.1101/639054doi: bioRxiv preprint
13
data Fig. 10e). Moreover, rapamycin treatment reduced TREM2 expression at both the RNA 389 and protein levels and induced the homeostatic marker CX3CR1 (Extended data Fig. 10c-d). 390 Indeed, the network of genes induced by Pam3csk and repressed by rapamycin significantly 391 overlapped with the XO4+ signature (64 genes, p=3.17x10⁻²⁰ by hypergeometric test), and 392 was enriched for gene ontologies including lysosome, HIF1A, and lipid metabolism (Fig. 6f, 393 Extended data Fig. 10e). Moreover, rapamycin was able to reduce synaptosome phagocytosis 394 in iMGLs treated with in vitro-formed Aβ fibrils (Fig. 6g). Together these data show not only 395 the predicted regulatory role of the Hif1α regulon on the XO4+ signature (Fig. 5i-j), but that 396 components of this regulon can be modulated by upstream small molecules to control 397 microglia cell fate along the homeostatic to XO4+ signature axis. 398
399
DISCUSSION 400
Two recent seminal publications29,31 identified a novel microglial phenotype near Aβ 401 plaques that was dependent on Trem2 and Apoe in two mouse models of AD, the transgenic 402 APP/PS1 and 5xFAD strains that overexpress mutant human APP and PSEN1 specifically in 403 neurons. In our study, we chose the aggressive 5xFAD model of AD for several reasons: 404 firstly, it allowed us to decouple the ageing component of AD from amyloid phagocytosis 405 because pathology in these mice occurs prior to ageing. Secondly, synapse loss in this model 406 facilitated investigation of subset-specific microglial synapse pruning functions. Here, we 407 substantially expanded on previous work by firstly defining the specific signature in a subset 408 of AD microglia as a result of plaque phagocytosis in vivo and defined the mechanisms 409 responsible for induction and maintenance of this phenotype. More critically, we found the 410 same signature in a subset of human AD microglia and started to address the controversy 411 regarding the beneficial56 or detrimental31 functional role of these cells. A key challenge to 412 tackling this question had resulted from the lack of a robust method to isolate these cells 413 directly. Keren-Shaul et. al. addressed this problem through single cell transcriptomics, 414 which, although allowing them to distinguish the cells, did not permit additional functional 415 characterizations due to the destructive nature of the technique. Kraseman et. al. chose 416 instead to purify these cells through either sorting for CLEC7A, a marker that was also 417 present on a subset of WT microglia, or by purifying microglia that phagocytosed apoptotic 418 neurons injected stereotaxically into mice. Here, we chose to take up this challenge using a 419 direct approach with methoxy-XO4 staining23, combined with both single cell, bulk 420 transcriptome and proteomic analyses followed by functional characterization of synapse 421 internalization. 422
.CC-BY-NC-ND 4.0 International licensenot certified by peer review) is the author/funder. It is made available under aThe copyright holder for this preprint (which wasthis version posted May 17, 2019. . https://doi.org/10.1101/639054doi: bioRxiv preprint
14
Our findings show that two distinct but interrelated processes drive microglial 423 changes in AD: accelerated aging, as well as a direct response to plaque phagocytosis. Keren-424 Shaul reported that 3% of aged WT microglia exhibited a DAM signature that was 425 undetected in younger animals. As the DAM population is not defined by the functional 426 uptake of amyloid plaque and hence may collectively be comprised of both X04+ and X04- 427 microglia, the effects of ageing and amyloid phagocytosis on microglial transcriptional 428 changes could not be assessed independently in that study. In comparison, our data shows 429 that the age-associated signature acquired by XO4- microglia is independent of uptake of 430 amyloid plaque, thus allowing us to disentangle the ageing from amyloid phagocytic 431 processes. The transcriptional signature of aged human microglia has been reported by two 432 groups previously. Post mortem microglia from cognitively normal patients displayed similar 433 gene expression profiles to mouse microglia, but human and mouse signatures diverged 434 significantly with ageing57. The second human dataset (HuMi_Aged) was enriched for 435 susceptibility genes for LOAD39, which is consistent with our mouse data, despite the 436 aggressive nature of our EOAD model. Several recent studies suggested changes to microglia 437 gene expression in human AD, however were not able to interrogate the specific cell subsets 438 responsible for this signature as they were performed in tissue rather than single cell or single 439 nuclei as per our study. For example, AD-specific gene upregulation of TREM2, TYROBP, 440 CLEC7A, CD68, CD34, SPP1 and various MHC Class II genes were described10,58 and ThioS 441 (plaque associated)-positive microglia in 4/5 human AD patients tested also stained positive 442 for LPL29. In addition, Yin et al. recently reported increased APOE, AXL, TREM2 and HLA-443 DRA mRNA expression in laser microdissected dense-core plaque-adjacent regions in the 444 medial frontal gyrus compared to plaque distal regions from the same sections in EOAD 445 patients, although the same phenomenon was not observed in LOAD patients59. Thus, our 446 study sheds light into an elusive cellular population unveiling the bona fide microglial 447 heterogeneity and their transcriptional make up in AD patients. It is worthwhile noting, that 448 the mouse XO4+ signature is present in 5xFAD mice under conditions of plaque deposition 449 with little tau pathology60, whereas human AD pathology invariably includes tau, or may 450 present with additional pathological phenotypes which likely produce altered signatures and 451 responses in microglia. Interestingly, we observe that the microglial cells from human AD 452 patients that cluster with control microglia are mostly composed of cells from female patient 453 brains. While the current study lacks the power to conclude that female microglia may be 454 impaired at mounting XO4+ responses, these findings warrant a more in depth (and larger) 455 study focused on contribution of gender to transcriptional variability of microglia, 456 particularly in the context of gender differences in AD incidence61. 457
.CC-BY-NC-ND 4.0 International licensenot certified by peer review) is the author/funder. It is made available under aThe copyright holder for this preprint (which wasthis version posted May 17, 2019. . https://doi.org/10.1101/639054doi: bioRxiv preprint
15
The results presented in this study extend the repertoire of microglia types beyond the 458 DAM classification. Our data are consistent with XO4- microglia cells being a case of 459 functional deregulation, set on a trajectory of accelerated ageing and not a transcriptional 460 intermediate en route to become X04+, and therefore different from what was reported for 461 Stage I and II DAM. XO4- contain more steady-state internal synaptic material than XO4+ 462 microglia (Fig. 4a-d) despite their reduced capacity for active phagocytosis (Fig. 4g-h), do 463 not upregulate TREM2 (Fig. 1f-g) and do not migrate towards plaques, despite some capacity 464 to internalize amyloid (Fig. 1j). This hypothesis fits well with current theories regarding the 465 synaptotoxic role of oligomers, and suggests that XO4- microglia internalize oligomeric Aβ, 466 which is found enriched throughout 5xFAD brain except regions containing and directly 467 surrounding fibrillar Aβ plaques62. Whether the toxic role of XO4- microglia and the ageing 468 signature they acquire is a direct result of oligomer phagocytosis remains to be investigated. 469 On the other hand, plaque phagocytosis resulting in a XO4+ signature primes microglia for 470 efficient phagocytosis of multiple substrates including synaptosomes. Rapid pruning of 471 damaged synapses near dystrophic neurites localized around plaques, appears to be, at least 472 initially, protective and may go awry later in disease progression as described before63. Our 473 results are consistent with recent studies, showing improved behavior in AD mouse models 474 that was associated with enhanced microglial amyloid plaque phagocytosis in response to 475 scanning ultrasound64, and IL-33 treatment65. Indeed, IL-33 intracellular signaling occurs 476 exclusively via MyD88, which is consistent with our prediction that MyD88-dependent 477 mechanisms regulate the transition from XO4- to XO4+. 478
We showed that all microglia possess an innate capacity to activate the XO4+ 479 signature, and our data show that phagocytosis of amyloid plaque per se is necessary and 480 sufficient for the generation of this disease associated transcriptomic signature. Interestingly 481 unlike the partially overlapping MGnD signature reported by Krasemann et al 2017, the 482 XO4+ microglial signature does not appear to be caused by phagocytosis of neurons. If the 483 XO4+ signature was induced by phagocytosis of dying neurons, a proportion of microglia 484 isolated from WT OHCSs would convert to an XO4+ signature, as OHSC culture from adult 485 animals inevitably results in some neuron death. However, the XO4+ signature is only 486 observed in WT microglia that have been cultured with an AD OHSC and phagocytosed 487 NIAD4-labelled fibrillar amyloid, and not in microglia that have phagocytosed synaptosome-488 conjugated pHrodo particles. 489
The rapid switch in the transcriptomic profile of microglia is supported by our 490 pseudotime analyses and demonstrates the remarkable plasticity of microglia. Although the 491
.CC-BY-NC-ND 4.0 International licensenot certified by peer review) is the author/funder. It is made available under aThe copyright holder for this preprint (which wasthis version posted May 17, 2019. . https://doi.org/10.1101/639054doi: bioRxiv preprint
16
receptors involved in recognition of synapses are distinct from those responsible for amyloid 492 recognition3,43,66, consistent with our data, there is evidence that Aβ and synapse engulfment 493 may be inhibited together by C3 knockout in APP/PS1 mice67, or enhanced together by 494 conditional microglia specific knockout of TDP-4344. We uncovered that the Hif1a regulon in 495 part underlies the molecular mechanism for a transition to the XO4+ phenotype and regulates 496 synaptosome phagocytosis, and importantly, a portion of this network can be manipulated in 497 vitro as predicted by our IPA, through combined stimulation with BMP9 and MyD88-498 dependent signaling pathways, and can be partially reversed by mTOR blockade via 499 rapamycin. On this note, our demonstration of this pathway in iMGLs opens new avenues to 500 examine how and to what extent the patient's genetic background may influence the 501 manipulation of the XO4+/- axis via HIF1A in patient-derived iMGLs. A Hif1a epigenetic and 502 transcriptomic signature was recently identified in microglia following immune training by 503 peripheral LPS administration in APP/PS1 mice68. There was little gene overlap between the 504 Hif1a module in 68 and the Hif1a regulon identified here, reinforcing the importance of 505 microglial fine tuning of context-dependent responses to specific stimuli. Targeting MyD88 506 alone has yielded contradictory effects in AD models69,70, which could possibly result from 507 differential effects on XO4+ and XO4- populations. Thus, modulation of MyD88-dependent 508 pro-inflammatory responses by combination with the protective effects of BMP9 on cognitive 509 function52,71 may cover a larger part of the gene regulatory network to induce conversion of 510 XO4- cells into XO4+. As yet, while we provide a first description of the gene regulatory 511 network, the upstream regulators controlling TREM2 and APOE in this network remain to be 512 determined. 513
We hypothesize a model whereby microglia during ageing are set on a transcriptional 514 trajectory which is accelerated in AD microenvironment, however upon plaque phagocytosis 515 those microglia re-route into a different trajectory through a Hif1α regulon, resulting in 516 efficient phagocytosis of synaptic components around plaques. We show how the microglial 517 gene networks we uncovered can be harnessed by computational prediction of microglial 518 subset-targeting drugs, or via network pharmacology and repositioning approaches. In view 519 of the apparent beneficial roles of XO4+ microglia, potential therapeutic strategies could 520 involve the targeted conversion of XO4- to XO4+ microglia by using small molecules to 521 activate the right transcriptional networks. 522
523 METHODS 524 Animals 525
.CC-BY-NC-ND 4.0 International licensenot certified by peer review) is the author/funder. It is made available under aThe copyright holder for this preprint (which wasthis version posted May 17, 2019. . https://doi.org/10.1101/639054doi: bioRxiv preprint
17
Heterozygous 5xFAD transgenic mice (B6SJL hybrid background) over-expressing FAD 526 mutant forms of human APP (Swedish mutation K670/ 671NL, London mutation V717I, and 527 Florida mutation I716V) and PSEN1 (M146L and L286V), regulated by the neuron-specific 528 mouse Thy1 promoter60 were housed at Monash Animal Research Platform (MARP) under 529 specific pathogen-free conditions in a day-night controlled light cycle, provided with food 530 and water ad libitum. Animals were used for experiments at different ages through adulthood, 531 as indicated, without undergoing any procedures prior to their stated use. All use and 532 handling of animals for experimentation was approved by Monash Animal Ethics Committee 533 (MARP/2016/112) and conformed to national and institutional guidelines. 534
535
Human patient demographics 536
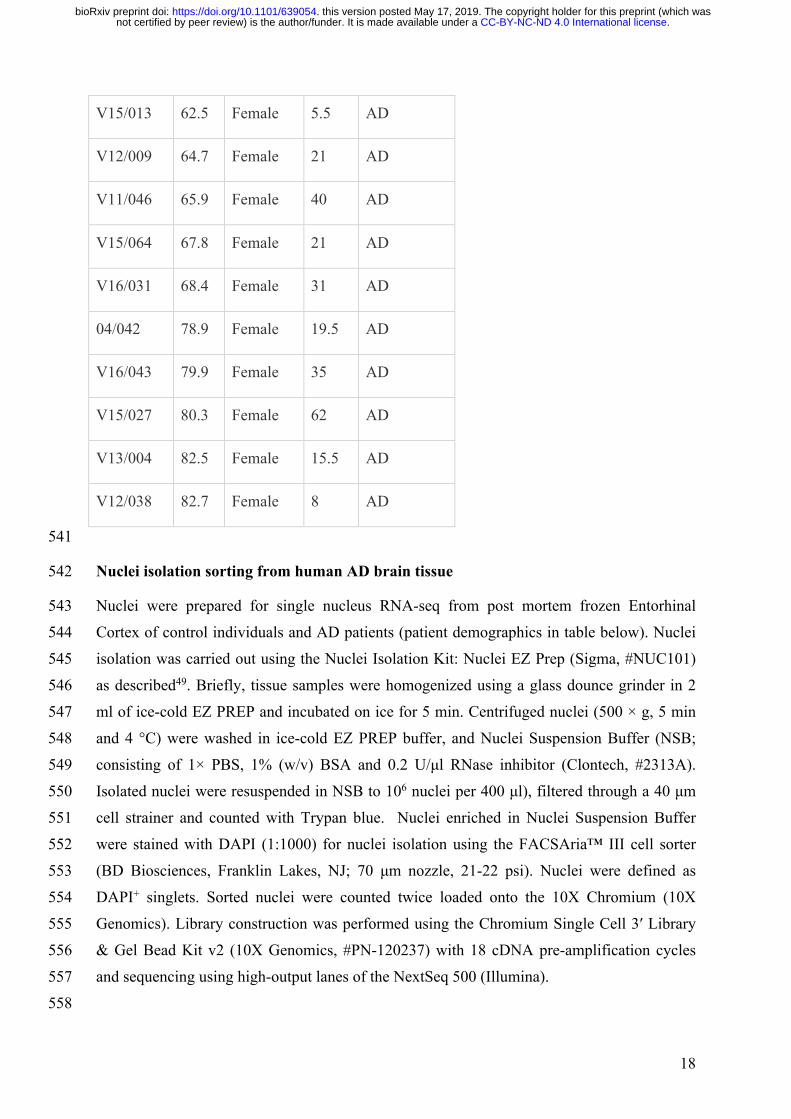
Paraffin embedded human frontal cortex sections of post-mortem Alzheimer’s disease and 537 non-disease aged matched individuals (10 μm) were obtained from the Victorian Brain Bank 538 (Ethics Approval: MUHREC 2016-0554; patient demographics in table below). 539
540
Case # Age Gender PMI Diagnosis
03/965 59 Female 30 Control
05/854 63.4 Female 30.5 Control
V13/020 65.8 Female 43 Control
08/026 67.3 Female 24 Control
04/157 68.3 Female 71.5 Control
07/239 78.8 Female 19 Control
V14/008 79 Female 32 Control
06/993 80.7 Female 59 Control
V12/019 81.2 Female 25 Control
07/143 82.7 Female 28.5 Control
.CC-BY-NC-ND 4.0 International licensenot certified by peer review) is the author/funder. It is made available under aThe copyright holder for this preprint (which wasthis version posted May 17, 2019. . https://doi.org/10.1101/639054doi: bioRxiv preprint
18
V15/013 62.5 Female 5.5 AD
V12/009 64.7 Female 21 AD
V11/046 65.9 Female 40 AD
V15/064 67.8 Female 21 AD
V16/031 68.4 Female 31 AD
04/042 78.9 Female 19.5 AD
V16/043 79.9 Female 35 AD
V15/027 80.3 Female 62 AD
V13/004 82.5 Female 15.5 AD
V12/038 82.7 Female 8 AD
541
Nuclei isolation sorting from human AD brain tissue 542
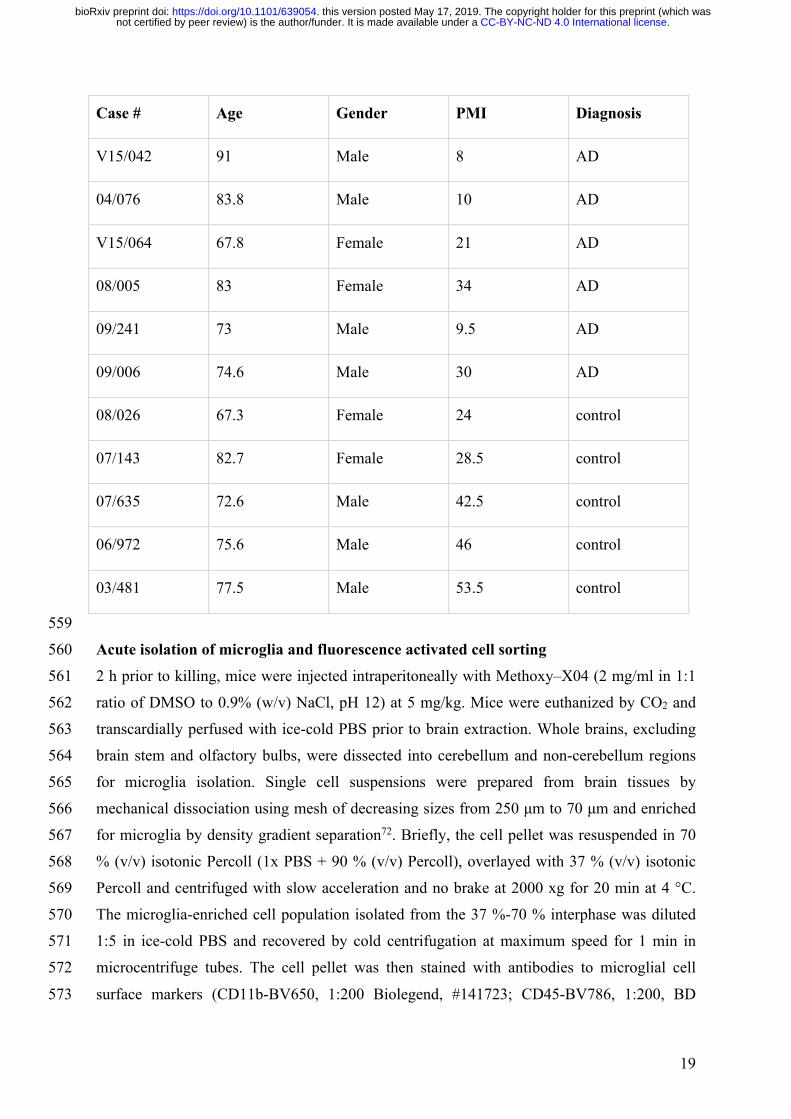
Nuclei were prepared for single nucleus RNA-seq from post mortem frozen Entorhinal 543 Cortex of control individuals and AD patients (patient demographics in table below). Nuclei 544 isolation was carried out using the Nuclei Isolation Kit: Nuclei EZ Prep (Sigma, #NUC101) 545 as described49. Briefly, tissue samples were homogenized using a glass dounce grinder in 2 546 ml of ice-cold EZ PREP and incubated on ice for 5 min. Centrifuged nuclei (500 × g, 5 min 547 and 4 °C) were washed in ice-cold EZ PREP buffer, and Nuclei Suspension Buffer (NSB; 548 consisting of 1× PBS, 1% (w/v) BSA and 0.2 U/μl RNase inhibitor (Clontech, #2313A). 549 Isolated nuclei were resuspended in NSB to 106 nuclei per 400 μl), filtered through a 40 μm 550 cell strainer and counted with Trypan blue. Nuclei enriched in Nuclei Suspension Buffer 551 were stained with DAPI (1:1000) for nuclei isolation using the FACSAria™ III cell sorter 552 (BD Biosciences, Franklin Lakes, NJ; 70 μm nozzle, 21-22 psi). Nuclei were defined as 553 DAPI+ singlets. Sorted nuclei were counted twice loaded onto the 10X Chromium (10X 554 Genomics). Library construction was performed using the Chromium Single Cell 3′ Library 555 & Gel Bead Kit v2 (10X Genomics, #PN-120237) with 18 cDNA pre-amplification cycles 556 and sequencing using high-output lanes of the NextSeq 500 (Illumina). 557 558
.CC-BY-NC-ND 4.0 International licensenot certified by peer review) is the author/funder. It is made available under aThe copyright holder for this preprint (which wasthis version posted May 17, 2019. . https://doi.org/10.1101/639054doi: bioRxiv preprint
19
Case # Age Gender PMI Diagnosis
V15/042 91 Male 8 AD
04/076 83.8 Male 10 AD
V15/064 67.8 Female 21 AD
08/005 83 Female 34 AD
09/241 73 Male 9.5 AD
09/006 74.6 Male 30 AD
08/026 67.3 Female 24 control
07/143 82.7 Female 28.5 control
07/635 72.6 Male 42.5 control
06/972 75.6 Male 46 control
03/481 77.5 Male 53.5 control
559 Acute isolation of microglia and fluorescence activated cell sorting 560 2 h prior to killing, mice were injected intraperitoneally with Methoxy–X04 (2 mg/ml in 1:1 561 ratio of DMSO to 0.9% (w/v) NaCl, pH 12) at 5 mg/kg. Mice were euthanized by CO2 and 562 transcardially perfused with ice-cold PBS prior to brain extraction. Whole brains, excluding 563 brain stem and olfactory bulbs, were dissected into cerebellum and non-cerebellum regions 564 for microglia isolation. Single cell suspensions were prepared from brain tissues by 565 mechanical dissociation using mesh of decreasing sizes from 250 μm to 70 μm and enriched 566 for microglia by density gradient separation72. Briefly, the cell pellet was resuspended in 70 567 % (v/v) isotonic Percoll (1x PBS + 90 % (v/v) Percoll), overlayed with 37 % (v/v) isotonic 568 Percoll and centrifuged with slow acceleration and no brake at 2000 xg for 20 min at 4 °C. 569 The microglia-enriched cell population isolated from the 37 %-70 % interphase was diluted 570 1:5 in ice-cold PBS and recovered by cold centrifugation at maximum speed for 1 min in 571 microcentrifuge tubes. The cell pellet was then stained with antibodies to microglial cell 572 surface markers (CD11b-BV650, 1:200 Biolegend, #141723; CD45-BV786, 1:200, BD 573
.CC-BY-NC-ND 4.0 International licensenot certified by peer review) is the author/funder. It is made available under aThe copyright holder for this preprint (which wasthis version posted May 17, 2019. . https://doi.org/10.1101/639054doi: bioRxiv preprint
20
Biosciences #564225; CX3CR1-FITC, 1:100, Biolegend, #149019; CD11a, 1:20, BD 574 Biosciences, #558191, TREM2-APC, 1:10, R&D Systems, #FAB17291N; CD33-PE, 1:20, 575 eBioscience, #12-0331-82; CD115-BV711, 1:40, Biolegend, #135515) for isolation using the 576 FACSAria™ III cell sorter. Microglia were defined as live/propidium iodide (PI)- (Sigma-577 Aldrich, St. Louis, MO, #P4864), CD11b+, CD45lo, CX3CR1+ single cells and were negative 578 for CD11a (Extended data Fig. 1). The XO4+ population gate was set using Methoxy-XO4-579 injected wild-type animals. X04+ and X04- microglial populations were sorted separately for 580 further analysis by bulk RNA-seq, nano LC-SWATH-MS (20,000 cells per sample) and 581 single cell RNA-seq. 582
583
viSNE Analysis 584
The Cytobank platform (Fluidigm, South San Francisco, California) was utilized to generate 585 viSNE plots35 from Flow Cytometry Standard files. Analyses were performed on 586 live/propidium iodide (PI)- single cell population. A total of 40,000 events were sampled to 587 generate viSNE maps. Seven fluorescent channels (CD11b, CX3CR1, CD45, CD115, CD33, 588 TREM2 and Methoxy-X04) were engaged for dimensionality reduction. The run was 589 performed 5 times to ensure the stability of the presented outcome. 590
591
RNA-seq Library construction and sequencing 592
RNA extraction from 1-10 x104 FACS-sorted microglia or iPS-derived microglia-like cells 593 was performed on the QIAcube (Qiagen) using the RNeasy Micro Kit (Qiagen, #74004) and 594 RNA quality was assessed using the Bioanalyser (Agilent RNA 6000 Pico kit; #5067-1513). 595 The libraries were prepared using 0.5-2 ng of non-cerebellum microglia RNA samples with 596 RIN value ≥ 7 and cerebellar microglia with RIN value ≥ 6. An 8 bp sample index 597 (Supplementary table 8) and a 10 bp unique molecular identifier (UMI) were added during 598 initial poly(A) priming and pooled samples were amplified using a template switching 599 oligonucleotide. The Illumina P5 (5' AAT GAT ACG GCG ACC ACC GA 3') and P7 (5' 600 CAA GCA GAA GAC GGC ATA CGA GAT 3') sequences were added by PCR and Nextera 601 transposase, respectively. The library was designed so that the forward read (R1) utilizes a 602 custom primer (5' GCC TGT CCG CGG AAG CAG TGG TAT CAA CGC AGA GTA C 3') 603 to sequence directly into the index and then the 10 bp UMI. The reverse read (R2) uses the 604 standard R2 primer to sequence the cDNA in the sense direction for transcript identification. 605 Sequencing was performed on the NextSeq550 (Illumina), using the V2 High output kit 606
.CC-BY-NC-ND 4.0 International licensenot certified by peer review) is the author/funder. It is made available under aThe copyright holder for this preprint (which wasthis version posted May 17, 2019. . https://doi.org/10.1101/639054doi: bioRxiv preprint
21
(Illumina, #TG-160-2005) in accordance with the Illumina Protocol 15046563 v02, 607 generating 2 reads per cluster composed of a 19 bp R1 and a 72 bp R2. 608
609
Demultiplexing and Mapping 610
Sequencing reads were sample demultiplexed with Je demultiplex from the JE suite73 using 611 sequence barcodes in Supplementary table 8. Short sequence unique molecular identifiers 612 (UMIs) from read pair 1 of the demultiplexed sample sequencing reads were discarded from 613 both sequencing read pairs with Prinseq (minimum length 9)74. Remaining UMIs were 614 clipped with Je clip and added to the sequencing read header to allow UMI deduplication post 615 read mapping. Demultiplexed UMI tagged sequencing reads were filter-trimmed with 616 Trimmomatic75 and aligned to the mouse genome (GENCODE's GRCm38 primary assembly 617 annotation version vM15) using STAR76 (only sequencing reads from pair 2 were used for 618 transcript quantification). Read deduplication based on UMIs was performed with Je 619 markdupes and transcript read counts calculated with featureCounts77. 620
621
Bulk RNA-seq analysis 622
The log2-transformed normalized gene expression from bulk RNA-seq was obtained using 623 the Variance Stabilizing Transformation (VST) from the “DESeq2” package in R78. PCA 624 (Fig. 1e) and hierarchical clustering (Extended data Fig. 2a) were then performed on the VST 625 counts. To investigate if the sequencing batch had an effect on the gene expression, we 626 performed a covariate analysis. For each covariate of interest (XO4, batch, region, age, 627 genotype and gender), a likelihood ratio test (LRT) was performed using the “DESeq2” 628 package, comparing the full model comprising all covariates and the reduced model which 629 omits the covariate of interest. Thus, genes that are statistically significant under the LRT are 630 genes whose variation in expression levels could be explained by the covariate of interest. 631 The covariate analysis (Extended data Fig. 2b) revealed a large number of genes associated 632 with batch (1020 genes, FDR < 0.01) and these genes significantly overlap with the region-633 related genes (p=3.0x10-46 by hypergeometric test) and XO4-related genes (p=2.2x10-214 by 634 hypergeometric test, Extended data Fig. 2c, d). Thus, the batch covariate was included in 635 subsequent analysis to account for batch effects. We also found that only 8 genes contribute 636 to gender-related variation (FDR < 0.01). Thus, all subsequent analysis was performed 637 excluding the gender covariate and both male and female microglial transcriptomes were 638 analyzed together. The covariate analysis was then performed again without the gender 639
.CC-BY-NC-ND 4.0 International licensenot certified by peer review) is the author/funder. It is made available under aThe copyright holder for this preprint (which wasthis version posted May 17, 2019. . https://doi.org/10.1101/639054doi: bioRxiv preprint
22
covariate to identify genes that are specific to the XO4 covariate (Fig. 1hi). GO and KEGG 640 term overrepresentation analysis were performed using the “gProfileR” package in R79. To 641 generate the “gene cytometry” plots (Fig. 1f, g), a generalized linear model was constructed 642 with the covariates XO4, batch, region, age and genotype. Separate pairwise differential 643 expression analyses were then performed between XO4+ vs. XO4-, 4m vs. 1m and 6m vs. 1m 644 microglia samples respectively. For each differential expression analysis and each gene, a 645 gene score was then calculated as the product of the log2 fold change and negative log-646 transformed FDR, , combining the effect size and statistical significance of the 647
differential expression80. The gene scores for XO4 and age differential expression were then 648 plotted to give the “gene cytometry” plots. 649
650
Single cell sequencing 651
5,000 microglia from each population (including XO4+ and XO4- microglia) were sorted into 652 DMEM/F12 media (supplemented with 5% (v/v) FBS, 50 U/ml Penicillin and 50 µg/ml 653 Streptomycin), centrifuged at 12,000 xg for 2 min at 4°C and resuspended in 35μl of PBS 654 containing 0.04% (w/v) BSA (0.22 µm filtered). The samples were next diluted with 655 nuclease-free water in accordance to 10X single cell protocol guidelines to achieve a target 656 cell recovery of approximately 800 cells/sample. Single cell capture, RNA-seq library 657 construction and sequencing were carried out at Micromon, Monash University using the 658 10X Genomics Chromium system (10X Genomics). Library construction was performed by 659 poly-A selection from total RNA using 10X Chromium controller with Chromium Single 660 Cell 3’ Reagent Kit V2 (10X Genomics, #PN-120237). Sequencing was performed on one 661 High-Output lane of an Illumina NextSeq 550 (Illumina, California, USA) in paired-read 150 662 bp format. Chromium barcodes were used for demultiplexing and FASTQ files were 663 generated using the Cellranger mkfastq pipeline. Alignment, filtering and UMI counting were 664 performed using cellranger count. To improve detection of microglia, due to their low RNA 665 content, cellranger reanalyse was used with the --force-cells option set at the inflection point 666 when number of barcodes is plotted against the number of UMIs. Cells were manually 667 filtered such that barcodes containing at least 10 counts corresponding to Cx3cr1, P2ry12 or 668 Fcrls genes were classified as microglia, resulting in a total of 991 cells from the 4 FACS-669 sorted microglial populations. 670
671
Single Cell Analysis 672
.CC-BY-NC-ND 4.0 International licensenot certified by peer review) is the author/funder. It is made available under aThe copyright holder for this preprint (which wasthis version posted May 17, 2019. . https://doi.org/10.1101/639054doi: bioRxiv preprint
23
The original mapped matrix dimensions were 10,484 genes by 991 cells. For quality control, 673 various filtering steps were implemented. Genes without any counts in any of the cells were 674 discarded. Cells were filtered by total counts and total features (genes) such that cells or 675 genes below and equal to the 5th percentile were discarded. Next, cells with more than 10 % 676 of their gene expression assigned to mitochondrial genes were discarded as these cells are 677 likely to be undergoing apoptosis. Five sex-associated differentially expressed genes (Xist, 678 Ddx3y, Eif2s3y, Hsp90ab1, P4ha1) identified in the bulk-RNA analysis that overlap with 679 differentially expressed genes detected between 24m WT (female) and 6m WT (male) in our 680 single-cell data were also filtered out. Cells not in G1 phase were also removed using scores 681 calculated from cyclone81. Lastly, genes containing less than 1 count in at least 2 cells were 682 removed from analysis, resulting in a dataset consisting of 6,685 genes by 893 cells. 683 SCATER(version 1.6.1)82, SCRAN(version 1.6.6)83, and SINGLE CELL EXPERIMENT 684 (1.0.0) were used for plotting PCAs and quality control plots82. Normalization was done by 685 calculating Log2 Counts Per Million (CPM). Violin plots of DAM1 and DAM2 genes were 686 obtained using Seurat’s VlnPlot function in R84. 687
688
Feature Selection 689
For optimization, each feature selection method (M3DROP(version 3.5.0)85, Highly Variable 690 Genes, Correlation-based, PCA-based, Depth Adjusted Negative Binomial (DANB)) was 691 implemented before running SC3 (Single cell consensus clustering)(version 1.7.6)40. Rand 692 index was calculated using MCLUST 86 to quantify accuracy of the feature selection method. 693 DANB was found to have the highest rand index of approximately 90%. The number of 694 feature genes was ascertained by calculating rand indexes after running SC3. We found that 695 rand index does not increase significantly beyond the 25th percentile of genes used. 696 Therefore, we used the top 1,671 (25th percentile) of the genes as our set of feature genes, 697 which were optimal for discriminating subpopulations of cell in our dataset. 698
699
Clustering 700
Clustering was performed using the single-cell consensus clustering (SC3) method40, which 701 is based on unsupervised clustering of scRNA-seq data. The optimal number of clusters (k) 702 was investigated using the Sc3_estimate_k function of SC3, and subsequently we set k = 4, 703 achieving a rand index of approximately 91.5%. The Kruskal Wallis Test within SC3 704 (get_de_genes) was also used to detect differentially expressed genes across all 4 a priori 705
.CC-BY-NC-ND 4.0 International licensenot certified by peer review) is the author/funder. It is made available under aThe copyright holder for this preprint (which wasthis version posted May 17, 2019. . https://doi.org/10.1101/639054doi: bioRxiv preprint
24
labels and clusters (Plotly Technologies Inc. Collaborative data science. Montréal, QC, 2015. 706 https://plot.ly). 707
708
Differential expression and gene regulatory network analyses 709
Differential expression analysis. We utilized EdgeR87 via the EdgeRQLF function for 710 pairwise differential expression analysis across two cell populations (i.e., between 2 a priori 711 labels or 2 SC3 derived clusters), and size factors were calculated using 712 computeSumFactors() from SCRAN. Multiple testing correction was implemented using the 713 Benjamini & Hochberg (BH) correction and significant differentially expressed genes were 714 called at the BH-adjusted p-value < 5% threshold. 715
Regulon identification. Gene regulatory network analysis was performed using single-cell 716 regulatory network inference and clustering (SCENIC) method(version 0.1.7)50. SCENIC 717 integrates a random forest classifier (GENIE3)(version 1.0.0) to identify potential 718 transcription factor targets based on their co-expression with RcisTarget(version 0.99.0) for 719 cis-regulatory motif enrichment analysis in the promoter of target genes (± 500 bp of the 720 transcription start site (TSS)) and identify the regulon, which consists of a TF and its co-721 expressed target genes. The mus musculus 9 (mm9) motif database provided by the SCENIC 722 authors were used. Finally, for each regulon SCENIC uses the AUCell (version 0.99.5) 723 algorithm to score the regulon activity in each cell. The input for SCENIC was the 6,685 724 (genes) by 893 (cells) matrix obtained after filtering, as detailed above and gene expression is 725 reported in Log2 CPM units. Unlike in the original SCENIC pipeline, we did not implement 726 the 2-step filtering as suggested because the input matrix was already filtered using our own 727 criteria. Otherwise, all parameters used for running were specified in the original SCENIC 728 pipeline. The regulon activity matrix was binarized (giving 1/0 activity score for each cell) 729 and the heatmap of the hierarchical clustering of the binarized matrix was plotted upon 730 removing transcription factors with fewer than 100 genes (as these identified regulons are 731 sporadically expressed in the binary heat map, and not clearly separated compared to larger 732 regulons). Fig. 5i shows the top 2 regulons for XO4+ microglia and non-XO4+ microglia. In 733 addition, we focused only on regulons that are active in more than 10 % of the cells. The 734 identified regulons were visualized using igraph and qgraph R packages88. 735
Regulon annotation. The genes defining the regulon were input in STRING database(version 736 10.5)89 (www.string-db.org) and KEGG enrichment was carried out using the STRING web 737 interface (background = all protein coding genes) (4th June 2018). In order to obtain the 738
.CC-BY-NC-ND 4.0 International licensenot certified by peer review) is the author/funder. It is made available under aThe copyright holder for this preprint (which wasthis version posted May 17, 2019. . https://doi.org/10.1101/639054doi: bioRxiv preprint
25
relevant string protein-protein interactions (PPI), we downloaded the mouse string database 739 and filtered for edges with combined score > 500 and experimental score > 0, giving us high 740 confidence edges supported by experimental data. Text-mining setting was disabled for all 741 analysis in order to minimize spurious gene associations. 742
743
Pseudotime analysis 744
We used Diffusion Map in the destiny R package (version 2.6.1) for the pseudotime 745 analysis90. Specifically, for the phagocytosing pseudotime, we used the list of 536 746 differentially expressed genes between 6m 5xFAD XO4- and 6m 5xFAD XO4+ cells (FDR < 747 0.05). For ageing, we used 104 differentially expressed genes between 6m WT and 24m WT 748 cells (FDR < 0.05). In order to plot the pseudotime, phagocytosis-specific and ageing-specific 749 genes were defined as the non-overlapping genes between phagocytosis and ageing. This 750 resulted in 474 phagocytosis genes and 42 ageing genes for diffusion map calculation. For 751 defining pseudotime order, cells were ranked based on the first component of the diffusion 752 map. For Extended Figure 5, we plotted the top 20 ageing-specific and top 20 phagocytosis-753 specific genes (based on absolute LogFC) ordered by their respective pseudotime. 754
755
Projection Analysis 756
In order to determine the relation between our bulk and single-cell RNA-seq data, we 757 projected our single cell data onto the bulk using Reference Component Analysis (RCA)91. 758 Input units were in log2 (CPM) value, and no additional normalization or transformation was 759 performed. Briefly, the expression profile of each single cell was projected onto each sample 760 in the bulk RNA-seq data by calculating the Pearson correlation coefficient between the log2 761 (CPM) vector from scRNA–seq and bulk RNA-seq. For each cell, the Pearson correlation 762 coefficients were z-score transformed and grouped by hierarchical clustering of the bulk 763 RNA-seq data. The results of the projection analysis are reported in Extended data Fig 4b. 764
765
Ingenuity Pathway Analysis (IPA) 766
To find upstream regulators of the regulons identified by SCENIC, we implemented 767 Ingenuity Pathway Analysis (IPA)51 (27th June 2018). For the Hif1a regulon (n=1,122 genes), 768 we further pruned the regulon size as follows: first, we overlapped the genes in the regulon 769 with the 1,671 feature genes resulting in common set of 371 genes; second, we derived the 770
.CC-BY-NC-ND 4.0 International licensenot certified by peer review) is the author/funder. It is made available under aThe copyright holder for this preprint (which wasthis version posted May 17, 2019. . https://doi.org/10.1101/639054doi: bioRxiv preprint
26
differentially expressed genes from the set using the Kruskal Wallis Test across all 4 a priori 771 clusters (adjusted p-value = 0.05), which resulted in 203 genes. We used the set of 203 genes 772 as input for IPA (five genes: Gltscr2, Wbp5, Amica1, Myeov2, and 0610011F06Rik were not 773 present in the IPA database) and their respective fold changes (FCs); here, we used the log2 774 FCs derived from the 5xFAD XO4+ vs 5xFAD XO4- comparison. Next, we used IPA to 775 predict the upstream regulators of the Hif1a regulon. As a first step, we extracted the 776 regulators from the top five regulator effects networks robustly inferred by IPA (consistency 777 score > 10) from the Hif1a regulon gene set. In doing this, we required the Hif1a gene to be 778 included in the set, a direct downstream target of the regulated network. All upstream 779 regulators must also have an absolute activation z-score higher than 2. We also required the 780 regulated network to have a significant overlap with the Hif1a regulon gene set (p<0.05). The 781 top ten upstream activators are reported in (Fig. 6a) and are ranked by their potential 782 activation (z-score); the complete list of predicted activators presented in Supplementary 783 Table 7. The cartoon diagram of the hypothesis generated by IPA was drawn using 784 BioRender (https://app.biorender.com). 785
786
Single nuclei sequencing analysis 787
Mapping single nuclei reads to the genome. Using the Grch38 (1.2.0) reference from 10x 788 Genomics (see https://support.10xgenomics.com/single-cell-gene-789 expression/software/pipelines/latest/advanced/references for a detailed step-by-step 790 description of the pipeline), we made a pre-mrna reference according to the steps detailed by 791 10x Genomics (https://support.10xgenomics.com/single-cell-gene-792 expression/software/pipelines/latest/advanced/references). Cellranger count was used to 793 obtain raw counts. In all, our single nuclei data consists of 8 10x runs consisting of 4 AD runs 794 and 4 control runs. Each run has 2 patients (see patient information above). 2 runs were 795 discarded because of high neuronal enrichment (see Supplementary Table 9) possibly 796 indicating neuronal contamination or technical artifacts. 797
798
Quality Control for expression matrix: The raw expression matrix was composed of 33 694 799 genes and 14 876 cells. Genes without any counts in any cells were filtered out. A gene was 800 defined as detected if 2 or more transcripts were present in at least 10 cells. 100 PMI-801 associated genes, as defined by Zhu et al in the cerebral cortex, were removed92. For cell 802 filtering, cells outside the 5th and 95th percentile with respect to number of genes detected 803
.CC-BY-NC-ND 4.0 International licensenot certified by peer review) is the author/funder. It is made available under aThe copyright holder for this preprint (which wasthis version posted May 17, 2019. . https://doi.org/10.1101/639054doi: bioRxiv preprint
27
and number of unique molecular identifier (nUMI) were discarded. In addition, cells with 804 more than 10% of their genes being mitochondrial genes were filtered out. In addition, the 805 matrix was normalized with scale factor of 10000 as recommended by the Seurat pipeline 806 before FindVariableGenes was used to define variable genes with the parameters 807 x.low.cutoff = 0.0125, x.high.cutoff = 3, and y.cutoff = 0.5. ScaleData was used to center the 808 gene expression. Overall, the resulting filtered matrix consists of 10 850 genes and 13 214 809 cells. 810
811
Cell Type Identification: BRETIGEA93 is a R package which utilizes set of brain cell-type 812 markers curated from independent human and mouse single cell RNA datasets for cell type 813 proportion estimation in bulk RNA datasets. It can also be employed in single cell RNA 814 datasets for the identification of cell types. For the reference datasets, BRETIGEA uses well-815 annotated and well-referenced datasets from 34 and 94. The 6 main cell type lineages identified 816 by BRETIGEA are neurons, astrocytes, oligodendrocytes, microglia, oligodendrocyte 817 progenitor cells (OPCs), and endothelial cells. We obtained markers from BRETIGEA for all 818 6 cell types and calculated a module score for each cell type using Seurat’s AddModuleScore 819 function. This function calculates the average expression levels of each cell type subtracted 820 by the aggregated expression of a control gene set of 100 randomly selected genes. Cell type 821 identification was done in 2 steps. 822
Firstly, each cell was assigned a cell type based on the highest cell type score across all 6 cell 823 types. Furthermore, we defined a cell as a hybrid cell if the difference between the first and 824 second highest cell type scores are within 20% of the highest cell type score: 825
)/x1 < 0.2 826
where x1 = highest cell type score 827 x2 = 2nd highest cell type score 828
Secondly, for each cell type, we assumed normality of the gene score distribution and applied 829 z-score transformation. Subsequently, in order to consider poorly identified cells i.e. cells 830 with low cell type scores, for each cell type, cells with low cell type score (5th percentile and 831 below) were relabeled as “unidentified” cells. 832
This robust statistical step identified 449 microglia. 833
Single human nuclei analysis: Seurat was used for normalization, scaling, and finding 834 variable genes in the same sequence described in “Quality control for expression matrix”. 835
.CC-BY-NC-ND 4.0 International licensenot certified by peer review) is the author/funder. It is made available under aThe copyright holder for this preprint (which wasthis version posted May 17, 2019. . https://doi.org/10.1101/639054doi: bioRxiv preprint
28
Uniform manifold approximation and projection (UMAP) was recently recommended as a 836 single cell data visualization tool 95. UMAP was calculated using RunUMAP command on 837 the first 15 principle components. Differential expression between AD and control groups 838 was then performed using the empirical Bayes quasi-likelihood F-tests (QLF) in the edgeR 839 package (v3.20.8). Genes are deemed significantly differentially expressed if they have an 840 FDR < 0.05. Out of the 40 human orthologs derived from taking the overlap between genes 841 upregulated in AD microglia vs control microglia (341 genes, FDR < 0.05) and the XO4+ 842 signature in mice (536 genes, FDR < 0.05), 30 of them (75.0%) have concordance of 843 directionality. In contrast, out of the 1051 human orthologs derived from taking the overlap 844 between genes upregulated in AD microglia vs control microglia (10537 genes, FDR <1.0) 845 and the XO4+ feature genes in mice (1671 genes, FDR < 1), only 517 (49.2%) have 846 concordance of directionality. Hypergeometric test, phyper(), was subsequently used to test 847 for significance of concordance in directionality between the XO4+ signature in mice and the 848 genes upregulated in AD human microglia. The formula used is phyper(30-1,517,1051-849 517,40, lower.tail = F). pheatmap was used to plot normalized gene expression of the 40 850 overlapping differentially expressed genes. 851
852
For pseudotime analysis, we defined phagocytosis and ageing genes as the top 10% of the 853 differentially expressed genes for phagocytosis (XO4- vs XO4+) and ageing (6m vs 24m), as 854 previously, resulting in 167 ageing genes and 167 phagocytosis genes. For phagocytosis-855 specific and ageing-specific pseudotime, the overlap of 39 genes between the two signatures 856 was removed. respectively. Seurat’s RunDiffusion was used for diffusion map calculation. 857 bioMart96 (23rd January 2019) was used to convert mouse gene symbols to human 858 orthologues. Overall, 128 ageing-specific and 128 phagocytosis-specific genes were used for 859 pseudotime analysis. Pseudotime order was defined as the ranking of the first diffusion 860 component. Similarly, phyper was used to calculate the respective p-values of the proportion 861 of AD/Control cells lying beyond 50th percentile of the pseudotime. For example, the phyper 862 formula for AD cells in the phagocytosis-specific trajectory is phyper(109-1,225,449-863 225,172, lower.tail = F). 864
865
Comparison with gene expression perturbed by small molecules We consider the DEGs 866 upregulated by TLR1-agonist administration but downregulated by rapamycin. We compared 867 the log fold changes of LGALS3, LY86, CTSB, HIF1A, LDLR, CD63, CTSL, CTSA and GAS7 868 in this dataset with those in XO4- vs 6M WT and XO4+ 6M WT DE analysis. In addition, for 869
.CC-BY-NC-ND 4.0 International licensenot certified by peer review) is the author/funder. It is made available under aThe copyright holder for this preprint (which wasthis version posted May 17, 2019. . https://doi.org/10.1101/639054doi: bioRxiv preprint
29
supplementary figure 10e, we compared 866 DEGS upregulated by TLR1-agonist Pam3csk 870 and downregulated by rapamycin with 1092 DEGS from the bulk RNA DE analysis between 871 XO4+ and XO4- genes (fdr <0.05, logFC>1). We subsequently plotted the overlap (64 genes) 872 between these 2 sets of analysis to represent genes which are differentially expressed in both 873 XO4+ microglia (vs XO4- microglia) and upregulated by Pam3csk administration but 874 downregulated by rapamycin. To calculate the p-value, we use a hypergeometric test where 875 the population is taken to be the 4319 DEGS from the bulk RNA DE analysis between XO4+ 876 and XO4- genes (logFC>1). This set of genes has 92 genes overlapping with the 866 DEGS 877 upregulated by Pam3csk and downregulated by rapamycin. The sample taken for the 878 hypergeometric test is the 1092 DEGs which has 64 genes overlapping with the 866 DEGS 879 upregulated by Pam3csk and downregulated by rapamycin. Overall, phyper formula used is 880 phyper(64,92,4319-92,1092,lower.tail = F). bioMart was used to convert all mice genes to 881 their human orthologues. 882
883
In-solution tryptic digestion of proteins 884
Synaptosomes were prepared using the Procedure for Synaptic Protein Extraction from 885 Neuronal Tissue" and Syn-PER Synaptic Protein Extraction Reagent (Thermo Fisher, 886 #87793, containing a half tablet of cOmplete™ Protease Inhibitor Cocktail (Roche, #CO-RO) 887 per 12.5 ml Syn-PER reagent) from 250 mg of frozen mouse brain tissue. Cell pellets were 888 lysed (60 µL per 2x10⁴ microglial cells per sample; 150 µL per ~4 x10⁵ microglial cells for 889 library preparation; 500 µL for bulk synaptosomes) in 1% (w/v) sodium deoxycholate (SDC, 890 Merck) in 100 mM Tris pH 8.1, then boiled at 95 °C for 5 min. After centrifugation, sample 891 supernatant was subjected to alkylation by addition of 40 mM chloracetamide (CAA, Merck) 892 and incubation for 20 min at room temperature in the dark. Samples were digested by 893 addition of porcine trypsin (enzyme to protein ratio of 1:100; for 2 x10⁴ microglial samples, 894 300 ng was used; Merck) and incubated overnight at 37 °C with shaking. The following day, 895 the reaction was stopped and SDC precipitated through addition of formic acid to a final 896 concentration of 1 % (v/v). Peptides were extracted through adding an equal volume of 100 897 % (v/v) water-saturated ethyl acetate, vortexing and centrifugation at maximum speed in a 898 benchtop microfuge and transferring the aqueous phase to a new tube, with this entire step 899 repeated once. Samples were then vacuum concentrated (Labconco Centrivap) and peptides 900 purified by C18 ZipTips® (Merck) prior to analysis by LC-MS/MS or LC-SWATH-MS. Note 901 that all samples were supplemented with 200 fmoles of each iRT peptide97 (Biognosys, #Ki-902 3002-1). For bulk synaptosome samples, peptides were further fractionated prior to LC-MS 903
.CC-BY-NC-ND 4.0 International licensenot certified by peer review) is the author/funder. It is made available under aThe copyright holder for this preprint (which wasthis version posted May 17, 2019. . https://doi.org/10.1101/639054doi: bioRxiv preprint
30
by reversed-phase HPLC using an Ettan ÄKTA micro HPLC system (GE Healthcare), as 904 described elsewhere98. 905
906
LC-MS/MS and spectral library generation 907
Spectral libraries were generated from mass spectrometry of tryptic peptides derived from a 908 combination of microglia cells and synaptosomes. Purified peptides were analysed on a 909 TripleTOF® 6600 mass spectrometer (SCIEX) equipped with an on-line Eksigent Ekspert 910 nanoLC 415 (SCIEX). Following autosampler injection, samples were subjected to trap-911 elution through loading onto a trap column (Eksigent nanoLC trap, #5016752; ChromXP 912 C18, 3 µm 120 Å, 350 µm x 0.5 mm [SCIEX]) at 2 µl/min for 10 min in loading buffer (2 % 913 (v/v) acetonitrile in water supplemented with 0.1 % formic acid) followed by separation at 914 300 nl/min across an analytical column (Eksigent nano LC column, #805-0012; ChromXP 915 C18, 3 µm 120 Å, 75 µm x 15 cm [SCIEX]) equilibrated in 98 % buffer A (0.1 % (v/v) 916 formic acid in water) and 2 % (v/v) buffer B (80 % (v/v) acetonitrile in water supplemented 917 with 0.1 % (v/v) formic acid) followed by increasing concentrations of buffer B. Specific 918 gradient conditions were: increase from 2-10 % (v/v) buffer B from 0 to 2 mins, then 10-40 919 % (v/v) buffer B from 2 to 152 mins, then 40-50 % (v/v) buffer B from 152 to 154 mins, then 920 50-99 % (v/v) buffer B from 154 to 157 mins, then hold at 99 % (v/v) buffer B from 157 to 921 167 mins, then 99-2 % (v/v) buffer B from 167 to 168 mins, followed by re-equilibration at 2 922 % (v/v) buffer B until the end of the run. The mass spectrometer was operated in information 923 dependent acquisition mode using the following settings: MS1 accumulation time of 200 924 msec, scan range of 300-1800 m/z; for MS2, a switch criteria was used of the top 20 925 precursors exceeding 40 counts with charge state from 2 to 5, rolling collision energy and 926 with ions excluded for 30 sec after two occurrences; MS2 accumulation time was set to 150 927 msec and with a scan range of 80-2000 m/z. Acquired spectra were searched using 928 ProteinPilot™ v5 (SCIEX) against the complete reference mouse proteome (Uniprot, 201707 929 build) and the resultant search was imported into Skyline v3.7.1131799. 930
931
LC-SWATH-MS 932
For data-independent acquisition, purified peptides were analysed on a TripleTOF® 6600 933 mass spectrometer (SCIEX) using the same LC setup and conditions as above, with the 934 exception that the mass spectrometer was operated in SWATH-MS100 mode, using the 935 following conditions: initial MS1 scan across 400-1250 m/z with accumulation time of 150 936
.CC-BY-NC-ND 4.0 International licensenot certified by peer review) is the author/funder. It is made available under aThe copyright holder for this preprint (which wasthis version posted May 17, 2019. . https://doi.org/10.1101/639054doi: bioRxiv preprint
31
msec, followed by 100 variable SWATH windows (calculated using the Variable Window 937 Calculator Excel tool, downloaded from http://sciex.com/support/software-downloads) 938 spanning a range of 400-1241 m/z with a 1 Da overlap and each with an accumulation time of 939 25 msec. Rolling collision energy was used, with a collision energy spread of 5. 940
941
SWATH-MS data analysis 942
SWATH-MS data was analysed using Skyline v3.7.11317 against the generated microglial 943 and synaptosome spectral library, applying predicted retention times from the included iRT 944 peptides detected within each sample in order to aid peak picking. Peak scoring was then re-945 trained within Skyline following the addition of shuffled decoy peptides. Data were initially 946 refined through accepting peptides with an absolute ppm <10 and, for each peptide, there 947 needed to be at least one sample of the set with a peptide dotp of >0.8; peptides not meeting 948 these criteria were excluded. Subsequently, all remaining peptides were subjected to manual 949 interrogation followed by exporting integrated peak areas into Microsoft Excel 2016 for 950 further processing. The list of peptides used for signal normalization is listed in 951 Supplementary table 2. Peptides corresponding to 304 of the XO4+ covariate genes were 952 above the limit of detection. Samples and proteins were clustered using one minus Spearman 953 correlation, and data expressed as a heat map of log2-transformed normalized fold changes 954 compared to WT microglia using GENE-E software v3.0.215 (Broad Institute). 955
956
Organotypic hippocampal slice cultures 957 Organotypic brain slice cultures (OSHCs) were adapted from published protocols101. On day 958 0, brains from 6-month-old 5xFAD and WT animals were coronally sectioned through the 959 hippocampus on a vibratome (Leica; settings: speed=0.4 mm/s and amplitude=1.00 mm) in 960 ice-cold cutting medium (MEM 1X, Life Technologies) containing 10 mM Tris, 50 U/ml 961 Penicillin and 50 µg/ml Streptomycin) to obtain 400 μm thick brain slices. Brain slices were 962 cultured in vitro with culture medium (25% (v/v) MEM 2x, 25% (v/v) HBSS 1x (Life 963 Technologies), 25% (v/v) Horse serum (Life Technologies) with 10 mM Tris, 25 U/ml 964 Penicillin and 25 µg/ml Streptomycin and 0.455% (v/v) 7.5% NaHCO3 aqueous solution) on 965 Millicell Cell Culture Insert (Merck) at air-medium interface. The media was completely 966 replaced every second day. After 3 days of resting, Aβ plaques on brain slices were stained 967 using an alternative fluorescent amyloid plaque labelling dye, NIAD-4 (10 μM, BioVision, 968 #2710) for 3 h, prior to the addition of ex vivo microglia enriched fraction isolated from 6-969
.CC-BY-NC-ND 4.0 International licensenot certified by peer review) is the author/funder. It is made available under aThe copyright holder for this preprint (which wasthis version posted May 17, 2019. . https://doi.org/10.1101/639054doi: bioRxiv preprint
32
month-old 5xFAD and WT animals. Microglia-rich fractions enriched by Percoll gradient 970 (described in Section 4.2.2) were stained with CFSE (final concentration 5 μM; Life 971 Technologies) for 20 min at 37 °C, and 2x10⁴ cells were added per hippocampus onto NIAD-972 4-stained hippocampal slice cultures for 5 days. As a control, synaptosome-labelled pHrodo-973 red particles were added to OHSCs for 5 days. Endogenous and replenished microglia were 974 purified from OSHCs by mechanical dissociation using 70 μm mesh and enriched for 975 microglia by density gradient centrifugation in 30 % (v/v) isotonic Percoll at 1000 xg for 15 976 min. Cell pellets were incubated with Fc block (1:200; BD Biosciences, #553141) for 15 min 977 on ice prior to staining with CD11b-PE (1:50) and CD45-BV786 (1:200) for 15 min. Cells 978 were washed once in PBS and resuspended in 400 μl Zombie IR dye (1:1000; Thermo Fisher 979 Scientific) for live cell discrimination. Endogenous (CFSE-) and exogenous (CFSE+) 980 microglia (single, live, CD11b+, CD45lo) that were either positive or negative for NIAD4 981 were sorted into 96 well plates (10 cells/well) containing 10 μl of Lysis Buffer from the 982 Single Cell to Ct kit (Thermo Fisher Scientific), using the FACSAria™ III cell sorter. As a 983 control, pHrodo-red-containing microglia were also sorted from the slices. cDNA synthesis 984 and pre-amplification (18 cycles) were performed in accordance to manufacturer’s 985 instructions and pre-amplified cDNA was diluted 5-fold prior to qPCR. The primers and 986 probes used are listed in Supplementary table 10. 987 988
Differentiation to iMGLs 989
iHPC Differentiation Base Medium: IMDM (50%; Thermo Fisher Scientific), F12 (50%), 990 ITSG-X, 2% v/v, Thermo Fisher Scientific), L-ascorbic acid 2-Phosphate magnesium (64 991 μg/ml; Sigma), monothioglycerol (400 μM; Sigma), PVA (10 μg/ml; Sigma), Glutamax (1X; 992 Thermo Fisher Scientific), chemically-defined lipid concentrate (1X; Thermo Fisher 993 Scientific), non-essential amino acids (NEAA; 1X; Thermo Fisher Scientific), 994 Penicillin/Streptomycin (P/S; 1% V/V; Thermo Fisher Scientific). Use 0.22 μm filter. 995
iMGL Differentiation Medium: phenol-free DMEM/F12 (1:1), ITS-G, 2%v/v, B27 (2% v/v), 996 N2 (0.5%, v/v), monothioglycerol (200 μM), Glutamax (1X), NEAA (1X), and additional 997 insulin (5 μg/ml; Sigma), filtered through a 0.22 μm filter; supplemented with M-CSF (25 998 ng/ml; Milteniy biotec), IL-34 (100 ng/ml; Milteniy biotec), and TGFβ-1 (50 ng/ml; Milteniy 999 biotec) and cholesterol(1.5 μg/ml; Avanti Polar Lipids, 102). 1000
1001
The protocol for iMGL derivation was adapted from 55 with modifications from the StemDiff 1002
.CC-BY-NC-ND 4.0 International licensenot certified by peer review) is the author/funder. It is made available under aThe copyright holder for this preprint (which wasthis version posted May 17, 2019. . https://doi.org/10.1101/639054doi: bioRxiv preprint
33
Hematopoietic Kit (Stem Cell Technologies, #05310). H9 CX3CR1-TdTomato cells were 1003 cultured on vitronectin (Thermo Fisher Scientific, #A14700)-coated T25 flask (Sarstedt, 1004 #83.3910.002) in E8 medium (Thermo Fisher Scientific, #A1517001). 2 days prior to 1005 differentiation, cells were detached in 0.5 mM EDTA and 40-80 colonies /well were seeded 1006 into a 12 well plate in E8 medium. On day 0, E8 medium was exchanged for 1 mL of 1007 supplemented iHPC Differentiation Base Medium per well. iHPC Differentiation Base 1008 Medium supplemented with FGF2 (50 ng/ml), BMP4 (50 ng/ml), Activin-A (12.5 ng/ml), 1009 ROCKi (1 μM) and LiCl (2 mM), and incubated in a hypoxic incubator. On day 2, medium 1010 was changed to 1 ml of iHPC Differentiation Base Medium supplemented with FGF2 (50 1011 ng/ml) and VEGF (50 ng/ml) and incubated in a hypoxic incubator. On day 4, media was 1012 changed to 1 ml iHPC Differentiation Base media containing FGF2 (50 ng/ml), VEGF (50 1013 ng/ml), TPO (50 ng/ml), SCF (10 ng/ml), IL-6 (50 ng/ml), and IL-3 (10 ng/ml) and incubated 1014 under normoxia. Half the medium was replaced on days 5 and 7. On day 10, the supernatant 1015 containing the HPCs was collected, centrifuged (300 x g for 5 min at room temperature), then 1016 0.5ml cell-containing media was replaced and supplemented with 0.5ml fresh media. On day 1017 12, the supernatant containing HPCs was collected and plated onto matrigel (1:100; hESC-1018 qualified Matrix, LDEV-Free, Falcon, #354277)-coated 12 well plates at 4x10⁴ cells/well in 1019 iMGL complete differentiation medium. Every two days, each well was supplemented with 1020 0.5 ml per well of complete differentiation medium, and at day 22 a 50% media change was 1021 performed. From day 35, iMGLs were cultured in complete iMGL media supplemented with 1022 CD200 (100 ng/ml; Novoprotein) and CX3CL1 (100 ng/ml; Peprotech) for an additional 1023 three days. iMGL experiments were performed at d22-23 of differentiation. iMGLs were 1024 stimulated with human BMP9 (20ng/ml; Biolegend), Pam3csk (100 ng/ml; Invivogen), 1025 Poly:IC (1000 ng/ml; Invivogen) and/or rapamycin (5 nM; Sigma) for 24h prior to RNA 1026 isolation or collection of culture supernatant. 1027
1028
Immunofluorescence staining 1029
Right brain hemispheres from Methoxy-X04 injected PBS-perfused mice were fixed in 4% 1030 PFA overnight, followed by immersion in 30% (w/v) sucrose solution for 48 h and frozen 1031 with liquid N2. Samples were stored at -80°C prior to sectioning. Frozen hemispheres were 1032 cryostat-sectioned into 60 or 20 μm thick sections onto slides for histological staining. 1033 Sections were blocked for 1.5 h in PBST (containing 2% (w/v) BSA and 0.5% (v/v) Triton-1034 X) followed by 1 h incubation with 0.5% (v/v) Mouse on Mouse (M.O.M.™) Blocking 1035 Reagent (Vector Laboratories, #MKB-2213-1). Sections were then stained with primary 1036
.CC-BY-NC-ND 4.0 International licensenot certified by peer review) is the author/funder. It is made available under aThe copyright holder for this preprint (which wasthis version posted May 17, 2019. . https://doi.org/10.1101/639054doi: bioRxiv preprint
34
antibodies, including the rabbit anti-Iba-1 (1:500, #019-19741, Wako, Virginia, USA), mouse 1037 anti-PSD95 (1:160, #MAB1596, Merck Millipore), mouse anti-6E10 (1:500, #803001, 1038 Biolegend), mouse anti-GAD65 (1:1000, #ab26113, Abcam) or rat anti-C3 (1:50, #ab11862, 1039 Abcam) overnight at RT followed by Alexa Fluor 488 goat anti-rabbit IgG (H+L) (1:250, 1040 #A11008, Life Technologies), Alexa Fluor 635 goat anti-mouse IgG (H+L) (1:250, #A31575, 1041 Life Technologies) or Alexa Fluor 568 donkey anti-mouse IgG (H+L) (1:500, #A10037, Life 1042 Technologies), respectively, for 2 h at RT. Sections were then mounted with Mowiol 1043 mounting medium. Paraffin embedded human brain sections were de-waxed for antigen 1044 retrieval with 90% formic acid (5 min) followed by citrate boiling (45min, 98oC DAKO 1045 Citrate Buffer, DAKO PT Link). Sections were then blocked using 0.1% (w/v) Sudan Black 1046 B in 70% ethanol (5 min) followed by PBST (containing 2% (w/v) BSA and 0.5% (v/v) 1047 Triton-X; 1 h). Sections were stained with primary antibodies, including the rabbit anti-Iba-1 1048 (1:500, #019-19741, Wako), goat anti-PSD95 (1:50, # ab12093, Abcam) or mouse anti-6E10 1049 (1:500, #803001, Biolegend) overnight at RT followed by Alexa Fluor 488 goat anti-rabbit 1050 IgG (H+L) (1:250, #A11008, Life Technologies), Alexa Fluor 647 donkey anti-goat IgG 1051 (H+L) (1:250, #A21447, Life Technologies) or Alexa Fluor 568 donkey anti-mouse IgG 1052 (H+L) (1:500, #A10037, Life Technologies), respectively, for 2 h at RT. Sections were then 1053 mounted with Mowiol mounting medium. 1054
1055
Confocal imaging and image analysis 1056
Mouse sections were imaged on a Leica SP8 confocal microscope using a 63x oil 1.4 NA 1057 objective and 2x zoom with 1024x1024 resolution, resulting in a pixel size of 90 nm. 30-40 1058 μm z-stacks were acquired with a 0.3 μm z-step size, using sequential scans with 3x 1059 averaging at 488nm and 647nm wavelengths and 1x averaging at 405nm wavelength. For 1060 human brain sections, microglia were analysed from four 4.5-5 μm z-stacks per patient, 1061 obtained at 63x, 1x zoom, 2048x2048. For quantitation of PSD95 or GAD65 engulfed by 1062 microglia or C3 co-localization with microglia, 3D rendering of confocal images was 1063 performed using surfaces, spots and cell functions and batch analysis in Imaris (v8.3.1). 1064 XO4+ microglia were defined as IMARIS-rendered surfaces in the Iba1 channel with mean 1065 fluorescence intensity above threshold in the Methoxy-XO4 channel. Experimenters were 1066 blinded to the genotype during image acquisition and processing. 1067
1068
qRT-PCR 1069
.CC-BY-NC-ND 4.0 International licensenot certified by peer review) is the author/funder. It is made available under aThe copyright holder for this preprint (which wasthis version posted May 17, 2019. . https://doi.org/10.1101/639054doi: bioRxiv preprint
35
qPCR was performed using the Biomark Fluidigm 96.96 protocol. Briefly, assays 1070 (Supplementary table 10) and samples were combined in a 96.96 Dynamic array IFC 1071 according to Fluidigm® 96.96 Real-Time PCR Workflow Quick Reference PN 6800088. 5 μl 1072 of each assay at a final concentration of 10x was added to each assay inlet port and 5 μl of 1073 diluted sample was added to each sample inlet port according to the ChipPipetting Map. The 1074 data was analysed with Fluidigm Real-Time PCR analysis software (V4.1.2). The limit of 1075 detection was set to 30. Samples with a Ct value for Actb (Mm00607939_s1) outside the 15-1076 25 range were excluded from further analyses. log2 transformed ΔCt values for the 42 1077 detected genes were used for clustering by SC3 and relationships between samples were 1078 visualized by SPRING (https://kleintools.hms.harvard.edu/tools/springViewer), which uses a 1079 k-nearest-neighbor graph rendered using a force directed layout103. Plots were generated 1080 using the ggplot2 function in R. For validation of HIF1A regulon in human ES-derived 1081 iMGLs, 400 ng RNA was reverse transcribed using SuperScript™ II Reverse Transcriptase 1082 (Thermo Fisher Scientific, #18064014). qPCR was performed using TaqMan assays (SPP1, 1083 Hs00959010_m1; HIF1A, Hs00153153_m1; GAPDH, Hs02758991_g1; APOE, 1084 Hs00171168_m1; TREM2, Hs00219132_m1; CX3CR1, Hs01922583_s1; housekeeping gene 1085 SNRPD3, Hs00188207_m1) in a Roche LightCycler® 480 (Roche). 1086
1087
Cytometric Bead Array (CBA) 1088
CBA was carried out using the BD (New Jersey, USA) CBA human flexi kit using a protocol 1089 modified from the manufacturer’s protocol. 5 μl of each standard (highest concentration at 1090 5000 pg/ml in assay diluent) and sample were incubated with 5 μl of capture bead mix 1091 (containing 0.1 μl of each cytokine Capture Bead diluted in Capture Bead Diluent) for 1 h in 1092 a 96 well V-bottom assay plate. This was followed by the addition and incubation with 1093 detection reagent mix (containing 0.1 μl of each cytokine PE Reagent diluted in Detection 1094 Reagent Diluent for 1 h in the dark. Each well was then washed once with 200 μl of Wash 1095 Buffer, and beads were resuspended in 80 μl of Wash Buffer for analysis by FACS using the 1096 LSRFortessa X-20 (BD Biosciences). At least 200 single bead events from each cytokine 1097 population were collected. Results obtained were analysed using the FCAP Array Software 1098 Version 3.0 (BD). 1099
1100
Human primary microglia culture and transfection 1101
.CC-BY-NC-ND 4.0 International licensenot certified by peer review) is the author/funder. It is made available under aThe copyright holder for this preprint (which wasthis version posted May 17, 2019. . https://doi.org/10.1101/639054doi: bioRxiv preprint
36
Primary human microglia isolated from cortex (Celprogen, #37089-01) were cultured on 1102 matrigel-coated 12 well plates at 5x10⁵ cells per well in iMGL differentiation media at 37 °C 1103 in 5 % CO2. Cells (up to passage 5) were transfected for 48 h with dox-inducible GFP-tagged 1104 Gateway-generated Piggybac expression constructs with inserted cDNA encoding human 1105 HIF1A and/or ELF3 open reading frames using Glial Mag transfection kit (Oz Biosciences, 1106 #GL00500) according to manufacturer’s instructions. Primary microglia were co-transfected 1107 with plasmids encoding Hybase transposase and rtta at a ratio of 1:2:2 (Hybase: rtta: ORF). 1108
1109
Preparation and treatment with fibrils 1110
Aβ1-42 (Bachem, #4014447.5000) monomers were prepared by HFIP solubilization and 1111
aliquots were stored at -20 °C over desiccant prior to use. For preparation of aggregated 1112
fibrils, Aβ1-42 was freshly resuspended 5 mM in DMSO at RT and diluted to 100μM final 1113
Aβ with 10 mM HCl and 150 mM NaCl at RT made in 18MΩ sterile water. Following 15 1114
sec vortex, Aβ was incubated at 37 °C for 24 hrs. 200 nM Aβ was added to primary 1115
microglia or iMGLs for 48, 96 or 144 h. 1116
1117
Phagocytosis of pHrodo E. coli and synaptosomes 1118
Synaptosomes were isolated from WT mouse brain tissue or human brain (obtained from 1119 Victorian Brain Bank), according to the Syn-PER Synaptic Protein Extraction Reagent 1120 (Thermo Fisher Scientific, #87793) protocol. The protein concentration was measured by 1121 nanodrop, and mouse synaptosomes were labelled with pHrodo™ Red succinimidyl ester 1122 (Thermo Fisher Scientific, #P36600) as described by 104. Human synaptosomes were labeled 1123 with blue fluorescent 2.0 µm FluoSpheres™ Carboxylate-Modified Microspheres (Life 1124 technologies, F8824) according to manufacturer instructions. Mouse pHrodo-conjugated 1125 synaptosomes were resuspended at 3.5 μg/μl in 5% DMSO in PBS and stored at -80 °C until 1126 use and human pHrodo-conjugated synaptosomes were resuspended at 5.5 mg/ml in 1 % 1127 (w/v) BSA and stored at 4 °C until use. To examine the phagocytic properties of the XO4+ 1128 and XO4- microglia populations, the microglia-enriched cell suspension were isolated from 1129 Methoxy-XO4-injected mice as described above were seeded in 96 well plates. Following 30 1130 min of resting at 37 °C and 5 % CO2, microglia were incubated with pHrodo-conjugated 1131 synaptosomes (4.25 μg per well) or pHrodo™ Green E. coli BioParticles™ Conjugate 1132 (Thermo Fisher Scientific, #P35361, 66.7 ng per well). iMGLs or primary human microglia 1133
.CC-BY-NC-ND 4.0 International licensenot certified by peer review) is the author/funder. It is made available under aThe copyright holder for this preprint (which wasthis version posted May 17, 2019. . https://doi.org/10.1101/639054doi: bioRxiv preprint
37
were incubated with conjugated-synaptosomes (3.44 mg/ml). Cells were collected after 45 1134 min incubation at 37 °C and 5 % CO2 and stained with antibodies to microglia cell surface 1135 markers (CD11b-PE-Cy7, 1:200, Biolegend, #101216; CD45-APC-Cy7, 1:200, Tonbo 1136 Biosciences, #25-0459-T100). XO4+ and XO4- microglia uptake of pHrodo-conjugated 1137 synaptosomes or pHrodo™ Green E. coli BioParticles™ Conjugate was analysed using the 1138 FACSAria™ III cell sorter. 1139
1140
Statistics 1141 Differences between 2 groups were compared by two-tailed t-test, and more than 2 groups, 1142 by one-way ANOVA and Tukey’s or Sidak post hoc tests, as appropriate. To analyze 1143 significance of gene enrichment of sensome genes in the XO4+ signature, we used 1144 hypergeometric test. The hypothesis that plaque distal human microglia internalize more 1145 PSD95 than plaque-associated microglia was tested by paired one-tailed one-sample t-test. 1146
1147
Data availability statement. Bulk RNA-seq and Single cell-seq and single nuclei-seq data 1148 from this study are available from: 1149 http://www.systems-genetics.net/assets/files/Grubman_et_al_2018_bulkRNA.zip 1150 1151 Proteomics raw data are included in Supplementary table 2. Raw sequencing reads have been 1152 submitted to the NCBI’s Sequence Read Archive (SRA, https://www.ncbi.nlm.nih.gov/sra). 1153 1154 COMPETING FINANCIAL INTERESTS 1155 The authors declare no competing financial interests. 1156 1157 ACKNOWLEDGMENTS 1158 The authors acknowledge Flowcore, Monash Micro Imaging, Monash Health Translation 1159 Precinct Medical Genomics Facility, Micromon, Monash Histology Platform and Australian 1160 Research Laboratories/Monash Animal Research Platform, Monash University, for the 1161 provision of instrumentation, training and technical support. We thank Dr. Steve Chai and 1162 Genevieve Buckley for their expertise with Imaris, Angela Vais for her advice regarding 1163 tissue sections, Dr. Steven Firth for provision of confocal imaging expertise. We thank Dr. 1164 Gurpreet Kaur (10X Genomics) for her insight regarding single cell sequencing analysis. We 1165 thank Kirill Tsyganov for a pipeline for mapping bulk RNA-seq data. The Australian 1166 Regenerative Medicine Institute is supported by grants from the State Government of 1167
.CC-BY-NC-ND 4.0 International licensenot certified by peer review) is the author/funder. It is made available under aThe copyright holder for this preprint (which wasthis version posted May 17, 2019. . https://doi.org/10.1101/639054doi: bioRxiv preprint
38
Victoria and the Australian Government. A.G was funded by a NHMRC-ARC Dementia 1168 Fellowship and Dementia Australia Research Foundation Grant. J.M.P. was funded by a 1169 Sylvia-Charles Viertel Fellowship. J.M.P., C.P., J.H. and A.G. received a Monash University 1170 JMP Grant. Part of this work was funded by a Monash Network of Excellence grant. G.S. 1171 was funded by the Yulgilbar Foundation. 1172 1173 AUTHOR CONTRIBUTIONS 1174 AG and JMP conceived the study and designed experiments and together with EP designed 1175 the bioinformatics analysis. XYC, AG and GS performed microglia isolation, FACS, viSNE, 1176 immunostaining, OHSC and human microglia-like cell and primary microglia experiments 1177 with support from and ZA. CM performed pathological assessment of human control and AD 1178 cases. GC and EP performed single cell RNA-seq, pseudotime. IPA and regulon analyses. 1179 JFO and OJLR performed the bulk RNA-seq analyses. NC and AP performed proteomics 1180 experiments, SYC provided reagents and technical assistance. JP, RS, SB, DVL and RL 1181 worked up the protocol for single nuclei sequencing from human brain. FR mapped RNA-seq 1182 data and SW extracted single cell data. AG, XYC, GC, EP and JMP wrote the manuscript. 1183 All authors approved of and contributed to the final version of the manuscript. 1184 1185 1186 REFERENCES 1187
1. Li, Q. & Barres, B. A. Microglia and macrophages in brain homeostasis and disease. 1188 Nat. Rev. Immunol. 18, 225–242 (2018). 1189 2. Grubman, A., Kanninen, K. M. & Malm, T. Multitasking Microglia and Alzheimer’s 1190 Disease: Diversity, Tools and Therapeutic Targets. J. Mol. Neurosci. 60, 390–404 1191 (2016). 1192 3. Paolicelli, R. C. et al. Synaptic pruning by microglia is necessary for normal brain 1193 development. Science 333, 1456–1458 (2011). 1194 4. Scheff, S. W., Price, D. A., Schmitt, F. A. & Mufson, E. J. Hippocampal synaptic loss 1195 in early Alzheimer’s disease and mild cognitive impairment. Neurobiol. Aging 27, 1196 1372–1384 (2006). 1197 5. Villemagne, V. L. et al. Amyloid β deposition, neurodegeneration, and cognitive 1198 decline in sporadic Alzheimer’s disease: a prospective cohort study. Lancet Neurol. 12, 1199 357–367 (2013). 1200 6. Hollingworth, P. et al. Common variants at ABCA7, MS4A6A/MS4A4E, EPHA1, 1201 CD33 and CD2AP are associated with Alzheimer’s disease. Nat. Genet. 43, 429–435 1202 (2011). 1203 7. Gjoneska, E. et al. Conserved epigenomic signals in mice and humans reveal immune 1204 basis of Alzheimer’s disease. Nature 518, 365–369 (2015). 1205 8. Guerreiro, R. et al. TREM2 variants in Alzheimer’s disease. N. Engl. J. Med. 368, 1206 117–127 (2013). 1207 9. Naj, A. C. et al. Common variants at MS4A4/MS4A6E, CD2AP, CD33 and EPHA1 1208 are associated with late-onset Alzheimer’s disease. Nat. Genet. 43, 436–441 (2011). 1209
.CC-BY-NC-ND 4.0 International licensenot certified by peer review) is the author/funder. It is made available under aThe copyright holder for this preprint (which wasthis version posted May 17, 2019. . https://doi.org/10.1101/639054doi: bioRxiv preprint
39
10. Zhang, B. et al. Integrated systems approach identifies genetic nodes and 1210 networks in late-onset Alzheimer’s disease. Cell 153, 707–720 (2013). 1211 11. Lake, B. B. et al. Integrative single-cell analysis of transcriptional and 1212 epigenetic states in the human adult brain. Nat. Biotechnol. 36, 70–80 (2018). 1213 12. Gosselin, D. et al. An environment-dependent transcriptional network 1214 specifies human microglia identity. Science (2017). doi:10.1126/science.aal3222 1215 13. Jay, T. R. et al. Disease Progression-Dependent Effects of TREM2 Deficiency 1216 in a Mouse Model of Alzheimer’s Disease. J. Neurosci. 37, 637–647 (2017). 1217 14. Wang, Y. et al. TREM2 lipid sensing sustains the microglial response in an 1218 Alzheimer’s disease model. Cell 160, 1061–1071 (2015). 1219 15. Jay, T. R. et al. TREM2 deficiency eliminates TREM2+ inflammatory 1220 macrophages and ameliorates pathology in Alzheimer’s disease mouse models. J. Exp. 1221 Med. 212, 287–295 (2015). 1222 16. Yuan, P. et al. TREM2 Haplodeficiency in Mice and Humans Impairs the 1223 Microglia Barrier Function Leading to Decreased Amyloid Compaction and Severe 1224 Axonal Dystrophy. Neuron 92, 252–264 (2016). 1225 17. Wang, Y. et al. TREM2-mediated early microglial response limits diffusion 1226 and toxicity of amyloid plaques. J. Exp. Med. 213, 667–675 (2016). 1227 18. Cho, S.-H. et al. CX3CR1 protein signaling modulates microglial activation 1228 and protects against plaque-independent cognitive deficits in a mouse model of 1229 Alzheimer disease. J. Biol. Chem. 286, 32713–32722 (2011). 1230 19. Fuhrmann, M. et al. Microglial Cx3cr1 knockout prevents neuron loss in a 1231 mouse model of Alzheimer’s disease. Nat. Neurosci. 13, 411–413 (2010). 1232 20. Grabert, K. et al. Microglial brain region-dependent diversity and selective 1233 regional sensitivities to aging. Nat. Neurosci. 19, 504–516 (2016). 1234 21. Ayata, P. et al. Epigenetic regulation of brain region-specific microglia 1235 clearance activity. Nat. Neurosci. 21, 1049–1060 (2018). 1236 22. De Biase, L. M. et al. Local Cues Establish and Maintain Region-Specific 1237 Phenotypes of Basal Ganglia Microglia. Neuron 95, 341–356.e6 (2017). 1238 23. Heneka, M. T. et al. NLRP3 is activated in Alzheimer’s disease and 1239 contributes to pathology in APP/PS1 mice. Nature 493, 674–678 (2013). 1240 24. Ikonomovic, M. D. et al. Post-mortem correlates of in vivo PiB-PET amyloid 1241 imaging in a typical case of Alzheimer’s disease. Brain 131, 1630–1645 (2008). 1242 25. Hashimshony, T. et al. CEL-Seq2: sensitive highly-multiplexed single-cell 1243 RNA-Seq. Genome Biol. 17, 77 (2016). 1244 26. Yeh, F. L., Wang, Y., Tom, I., Gonzalez, L. C. & Sheng, M. TREM2 Binds to 1245 Apolipoproteins, Including APOE and CLU/APOJ, and Thereby Facilitates Uptake of 1246 Amyloid-Beta by Microglia. Neuron 91, 328–340 (2016). 1247 27. Phillips, M. C. Apolipoprotein E isoforms and lipoprotein metabolism. 1248 IUBMB Life 66, 616–623 (2014). 1249 28. Hickman, S. E. et al. The microglial sensome revealed by direct RNA 1250 sequencing. Nat. Neurosci. 16, 1896–1905 (2013). 1251 29. Keren-Shaul, H. et al. A Unique Microglia Type Associated with Restricting 1252 Development of Alzheimer’s Disease. Cell 169, 1276–1290.e17 (2017). 1253 30. Kamphuis, W., Kooijman, L., Schetters, S., Orre, M. & Hol, E. M. 1254 Transcriptional profiling of CD11c-positive microglia accumulating around amyloid 1255 plaques in a mouse model for Alzheimer’s disease. Biochim. Biophys. Acta 1862, 1847–1256 1860 (2016). 1257 31. Krasemann, S. et al. The TREM2-APOE Pathway Drives the Transcriptional 1258 Phenotype of Dysfunctional Microglia in Neurodegenerative Diseases. Immunity 47, 1259 566–581.e9 (2017). 1260 32. Füger, P. et al. Microglia turnover with aging and in an Alzheimer’s model via 1261
.CC-BY-NC-ND 4.0 International licensenot certified by peer review) is the author/funder. It is made available under aThe copyright holder for this preprint (which wasthis version posted May 17, 2019. . https://doi.org/10.1101/639054doi: bioRxiv preprint
40
long-term in vivo single-cell imaging. Nat. Neurosci. 20, 1371–1376 (2017). 1262 33. Mathys, H. et al. Temporal Tracking of Microglia Activation in 1263 Neurodegeneration at Single-Cell Resolution. Cell Rep. 21, 366–380 (2017). 1264 34. Zeisel, A. et al. Brain structure. Cell types in the mouse cortex and 1265 hippocampus revealed by single-cell RNA-seq. Science 347, 1138–1142 (2015). 1266 35. Amir, E.-A. D. et al. viSNE enables visualization of high dimensional single-1267 cell data and reveals phenotypic heterogeneity of leukemia. Nat. Biotechnol. 31, 545–1268 552 (2013). 1269 36. Bertram, L. et al. Genome-wide association analysis reveals putative 1270 Alzheimer’s disease susceptibility loci in addition to APOE. Am. J. Hum. Genet. 83, 1271 623–632 (2008). 1272 37. Griciuc, A. et al. Alzheimer’s disease risk gene CD33 inhibits microglial 1273 uptake of amyloid beta. Neuron 78, 631–643 (2013). 1274 38. 2018 Alzheimer’s disease facts and figures. Alzheimers. Dement. 14, 367–429 1275 (2018). 1276 39. Olah, M. et al. A transcriptomic atlas of aged human microglia. Nat. Commun. 1277 9, 539 (2018). 1278 40. Kiselev, V. Y. et al. SC3: consensus clustering of single-cell RNA-seq data. 1279 Nat. Methods 14, 483–486 (2017). 1280 41. Selsted, M. E. & Ouellette, A. J. Mammalian defensins in the antimicrobial 1281 immune response. Nat. Immunol. 6, 551–557 (2005). 1282 42. Cheng, K. T. [[5’-(4-Hydroxyphenyl)[2,2’-bithiophen]-5-yl]methylene]-1283 propanedinitrile NIAD-4. in Molecular Imaging and Contrast Agent Database (MICAD) 1284 (National Center for Biotechnology Information (US), 2006). 1285 43. Hong, S. et al. Complement and microglia mediate early synapse loss in 1286 Alzheimer mouse models. Science 352, 712–716 (2016). 1287 44. Paolicelli, R. C. et al. TDP-43 Depletion in Microglia Promotes Amyloid 1288 Clearance but Also Induces Synapse Loss. Neuron 95, 297–308.e6 (2017). 1289 45. Verret, L. et al. Inhibitory interneuron deficit links altered network activity 1290 and cognitive dysfunction in Alzheimer model. Cell 149, 708–721 (2012). 1291 46. Dejanovic, B. et al. Changes in the Synaptic Proteome in Tauopathy and 1292 Rescue of Tau-Induced Synapse Loss by C1q Antibodies. Neuron 100, 1322–1336.e7 1293 (2018). 1294 47. Koffie, R. M. et al. Oligomeric amyloid β associates with postsynaptic 1295 densities and correlates with excitatory synapse loss near senile plaques. Proc. Natl. 1296 Acad. Sci. U. S. A. 106, 4012–4017 (2009). 1297 48. Lister, R. et al. Global epigenomic reconfiguration during mammalian brain 1298 development. Science 341, 1237905 (2013). 1299 49. Habib, N. et al. Massively parallel single-nucleus RNA-seq with DroNc-seq. 1300 Nat. Methods 14, 955–958 (2017). 1301 50. Aibar, S. et al. SCENIC: single-cell regulatory network inference and 1302 clustering. Nat. Methods 14, 1083–1086 (2017). 1303 51. Krämer, A., Green, J., Pollard, J., Jr & Tugendreich, S. Causal analysis 1304 approaches in Ingenuity Pathway Analysis. Bioinformatics 30, 523–530 (2014). 1305 52. Burke, R. M. et al. BMP9 ameliorates amyloidosis and the cholinergic defect 1306 in a mouse model of Alzheimer’s disease. Proc. Natl. Acad. Sci. U. S. A. 110, 19567–1307 19572 (2013). 1308 53. Esen, N. & Kielian, T. Central role for MyD88 in the responses of microglia 1309 to pathogen-associated molecular patterns. J. Immunol. 176, 6802–6811 (2006). 1310 54. Xie, L. et al. mTOR signaling inhibition modulates macrophage/microglia-1311 mediated neuroinflammation and secondary injury via regulatory T cells after focal 1312 ischemia. J. Immunol. 192, 6009–6019 (2014). 1313
.CC-BY-NC-ND 4.0 International licensenot certified by peer review) is the author/funder. It is made available under aThe copyright holder for this preprint (which wasthis version posted May 17, 2019. . https://doi.org/10.1101/639054doi: bioRxiv preprint
41
55. Abud, E. M. et al. iPSC-Derived Human Microglia-like Cells to Study 1314 Neurological Diseases. Neuron 94, 278–293.e9 (2017). 1315 56. Deczkowska, A. et al. Disease-Associated Microglia: A Universal Immune 1316 Sensor of Neurodegeneration. Cell 173, 1073–1081 (2018). 1317 57. Galatro, T. F. et al. Transcriptomic analysis of purified human cortical 1318 microglia reveals age-associated changes. Nat. Neurosci. (2017). doi:10.1038/nn.4597 1319 58. Olmos-Alonso, A. et al. Pharmacological targeting of CSF1R inhibits 1320 microglial proliferation and prevents the progression of Alzheimer’s-like pathology. 1321 Brain 139, 891–907 (2016). 1322 59. Yin, Z. et al. Immune hyperreactivity of Aβ plaque-associated microglia in 1323 Alzheimer’s disease. Neurobiol. Aging 55, 115–122 (2017). 1324 60. Oakley, H. et al. Intraneuronal beta-amyloid aggregates, neurodegeneration, 1325 and neuron loss in transgenic mice with five familial Alzheimer’s disease mutations: 1326 potential factors in amyloid plaque formation. J. Neurosci. 26, 10129–10140 (2006). 1327 61. Vos, T., Abajobir, A. A., Abate, K. H., Abbafati, C. & Abbas, K. M. … 1328 prevalence, and years lived with disability for 328 diseases and injuries for 195 1329 countries, 1990–2016: a systematic analysis for the Global Burden of Disease …. Lancet 1330 (2017). 1331 62. Condello, C., Yuan, P., Schain, A. & Grutzendler, J. Microglia constitute a 1332 barrier that prevents neurotoxic protofibrillar Aβ42 hotspots around plaques. Nat. 1333 Commun. 6, 6176 (2015). 1334 63. Hellwig, S. et al. Forebrain microglia from wild-type but not adult 5xFAD 1335 mice prevent amyloid-β plaque formation in organotypic hippocampal slice cultures. 1336 Sci. Rep. 5, 14624 (2015). 1337 64. Leinenga, G. & Götz, J. Scanning ultrasound removes amyloid-β and restores 1338 memory in an Alzheimer’s disease mouse model. Sci. Transl. Med. 7, 278ra33 (2015). 1339 65. Fu, A. K. Y. et al. IL-33 ameliorates Alzheimer’s disease-like pathology and 1340 cognitive decline. Proc. Natl. Acad. Sci. U. S. A. 113, E2705–13 (2016). 1341 66. Jarosz-Griffiths, H. H., Noble, E., Rushworth, J. V. & Hooper, N. M. 1342 Amyloid-β Receptors: The Good, the Bad, and the Prion Protein. J. Biol. Chem. 291, 1343 3174–3183 (2016). 1344 67. Shi, Q. et al. Complement C3 deficiency protects against neurodegeneration in 1345 aged plaque-rich APP/PS1 mice. Sci. Transl. Med. 9, (2017). 1346 68. Wendeln, A.-C. et al. Innate immune memory in the brain shapes neurological 1347 disease hallmarks. Nature 556, 332–338 (2018). 1348 69. Lim, J.-E. et al. MyD88 deficiency ameliorates β-amyloidosis in an animal 1349 model of Alzheimer’s disease. Am. J. Pathol. 179, 1095–1103 (2011). 1350 70. Michaud, J.-P., Richard, K. L. & Rivest, S. MyD88-adaptor protein acts as a 1351 preventive mechanism for memory deficits in a mouse model of Alzheimer’s disease. 1352 Mol. Neurodegener. 6, 5 (2011). 1353 71. Wang, Z. et al. Intranasal BMP9 Ameliorates Alzheimer Disease-Like 1354 Pathology and Cognitive Deficits in APP/PS1 Transgenic Mice. Front. Mol. Neurosci. 1355 10, 32 (2017). 1356 72. Cardona, A. E., Huang, D., Sasse, M. E. & Ransohoff, R. M. Isolation of 1357 murine microglial cells for RNA analysis or flow cytometry. Nat. Protoc. 1, 1947–1951 1358 (2006). 1359 73. Girardot, C., Scholtalbers, J., Sauer, S., Su, S.-Y. & Furlong, E. E. M. Je, a 1360 versatile suite to handle multiplexed NGS libraries with unique molecular identifiers. 1361 BMC Bioinformatics 17, 419 (2016). 1362 74. Schmieder, R. & Edwards, R. Quality control and preprocessing of 1363 metagenomic datasets. Bioinformatics 27, 863–864 (2011). 1364 75. Bolger, A. M., Lohse, M. & Usadel, B. Trimmomatic: a flexible trimmer for 1365
.CC-BY-NC-ND 4.0 International licensenot certified by peer review) is the author/funder. It is made available under aThe copyright holder for this preprint (which wasthis version posted May 17, 2019. . https://doi.org/10.1101/639054doi: bioRxiv preprint
42
Illumina sequence data. Bioinformatics 30, 2114–2120 (2014). 1366 76. Dobin, A. et al. STAR: ultrafast universal RNA-seq aligner. Bioinformatics 1367 29, 15–21 (2013). 1368 77. Liao, Y., Smyth, G. K. & Shi, W. featureCounts: an efficient general purpose 1369 program for assigning sequence reads to genomic features. Bioinformatics 30, 923–930 1370 (2014). 1371 78. Love, M. I., Huber, W. & Anders, S. Moderated estimation of fold change and 1372 dispersion for RNA-seq data with DESeq2. Genome Biol. 15, 550 (2014). 1373 79. Reimand, J. et al. g:Profiler-a web server for functional interpretation of gene 1374 lists (2016 update). Nucleic Acids Res. 44, W83–9 (2016). 1375 80. Rackham, O. J. L. et al. A predictive computational framework for direct 1376 reprogramming between human cell types. Nat. Genet. 48, 331–335 (2016). 1377 81. Scialdone, A. et al. Computational assignment of cell-cycle stage from single-1378 cell transcriptome data. Methods 85, 54–61 (2015). 1379 82. McCarthy, D. J., Campbell, K. R., Lun, A. T. L. & Wills, Q. F. Scater: pre-1380 processing, quality control, normalization and visualization of single-cell RNA-seq data 1381 in R. Bioinformatics 33, 1179–1186 (2017). 1382 83. Lun, A. T. L., McCarthy, D. J. & Marioni, J. C. A step-by-step workflow for 1383 low-level analysis of single-cell RNA-seq data with Bioconductor. F1000Res. 5, 2122 1384 (2016). 1385 84. Satija, R., Farrell, J. A., Gennert, D., Schier, A. F. & Regev, A. Spatial 1386 reconstruction of single-cell gene expression data. Nat. Biotechnol. 33, 495–502 (2015). 1387 85. Andrews, T. S. & Hemberg, M. Modelling dropouts allows for unbiased 1388 identification of marker genes in scRNASeq experiments. biorxiv (2016). 1389 86. Scrucca, L., Fop, M., Murphy, T. B. & Raftery, A. E. mclust 5: Clustering, 1390 Classification and Density Estimation Using Gaussian Finite Mixture Models. R J. 8, 1391 289–317 (2016). 1392 87. Robinson, M. D., McCarthy, D. J. & Smyth, G. K. edgeR: a Bioconductor 1393 package for differential expression analysis of digital gene expression data. 1394 Bioinformatics 26, 139–140 (2010). 1395 88. Epskamp, S. et al. qgraph: Network visualizations of relationships in 1396 psychometric data. J. Stat. Softw. 48, 1–18 (2012). 1397 89. Jensen, L. J. et al. STRING 8--a global view on proteins and their functional 1398 interactions in 630 organisms. Nucleic Acids Res. 37, D412–6 (2009). 1399 90. Campbell, K. R. & Yau, C. A descriptive marker gene approach to single-cell 1400 pseudotime inference. Bioinformatics 35, 28–35 (2019). 1401 91. Li, H. et al. Reference component analysis of single-cell transcriptomes 1402 elucidates cellular heterogeneity in human colorectal tumors. Nat. Genet. 49, 708–718 1403 (2017). 1404 92. Zhu, Y., Wang, L., Yin, Y. & Yang, E. Systematic analysis of gene expression 1405 patterns associated with postmortem interval in human tissues. Sci. Rep. 7, 5435 (2017). 1406 93. McKenzie, A. T. et al. Brain Cell Type Specific Gene Expression and Co-1407 expression Network Architectures. Sci. Rep. 8, 8868 (2018). 1408 94. Darmanis, S. et al. A survey of human brain transcriptome diversity at the 1409 single cell level. Proc. Natl. Acad. Sci. U. S. A. 112, 7285–7290 (2015). 1410 95. Becht, E. et al. Dimensionality reduction for visualizing single-cell data using 1411 UMAP. Nat. Biotechnol. (2018). doi:10.1038/nbt.4314 1412 96. Smedley, D. et al. The BioMart community portal: an innovative alternative to 1413 large, centralize 1414 d data repositories. Nucleic Acids Res. 43, W589–98 (2015). 1415 97. Escher, C. et al. Using iRT, a normalized retention time for more targeted 1416 measurement of peptides. Proteomics 12, 1111–1121 (2012). 1417
.CC-BY-NC-ND 4.0 International licensenot certified by peer review) is the author/funder. It is made available under aThe copyright holder for this preprint (which wasthis version posted May 17, 2019. . https://doi.org/10.1101/639054doi: bioRxiv preprint
43
98. Illing, P. T. et al. Immune self-reactivity triggered by drug-modified HLA-1418 peptide repertoire. Nature 486, 554–558 (2012). 1419 99. MacLean, B. et al. Skyline: an open source document editor for creating and 1420 analyzing targeted proteomics experiments. Bioinformatics 26, 966–968 (2010). 1421 100. Gillet, L. C. et al. Targeted data extraction of the MS/MS spectra generated by 1422 data-independent acquisition: a new concept for consistent and accurate proteome 1423 analysis. Mol. Cell. Proteomics 11, O111.016717 (2012). 1424 101. Gogolla, N., Galimberti, I., DePaola, V. & Caroni, P. Preparation of 1425 organotypic hippocampal slice cultures for long-term live imaging. Nat. Protoc. 1, 1426 1165–1171 (2006). 1427 102. Bohlen, C. J. et al. Diverse Requirements for Microglial Survival, 1428 Specification, and Function Revealed by Defined-Medium Cultures. Neuron 94, 759–1429 773.e8 (2017). 1430 103. Weinreb, C., Wolock, S. & Klein, A. M. SPRING: a kinetic interface for 1431 visualizing high dimensional single-cell expression data. Bioinformatics 34, 1246–1248 1432 (2018). 1433 104. Lehrman, E. K. et al. CD47 Protects Synapses from Excess Microglia-1434 Mediated Pruning during Development. Neuron 100, 120–134.e6 (2018). 1435
1436
.CC-BY-NC-ND 4.0 International licensenot certified by peer review) is the author/funder. It is made available under aThe copyright holder for this preprint (which wasthis version posted May 17, 2019. . https://doi.org/10.1101/639054doi: bioRxiv preprint
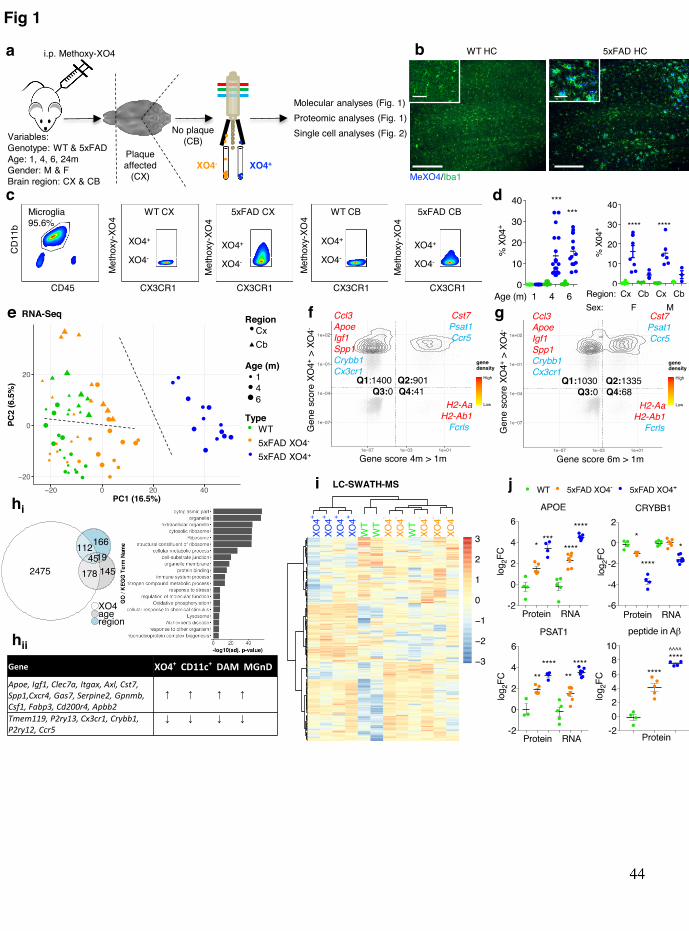
●
●
●
●
●
●
●
●
●
●
●
●
●
●
●
●
●
●
●
●
●
●
●
●
●●
●
●
●●
●
●
●
●
●
●
●
●
●
●
●
●
●
●
●
●
●
●
●
●
●
●
●
●●
●
●
●
●
●
●
●
●
●
●
●
●
●
●
●
●
●
●
●
●
●
●
●
●
●
●
●
●
●
●
●
●
●
●
●
●
●
●
●
●
●●
●
●●
●
●
●
●●
●
●
●
●
●
●
●
●●
●
●
●
●
●
●
● ●
●
●
●
●
●
●
●
●
●
●
●
●
●
●
●
●
●
●
●
●
●
●
●
●
●
●
●
●
●
●
●
●
●
●
●
●
●
●
●
●
●
●
●
●
●
●
●
●
●
●
●
●
●
●
●
●
●
●
●
●
●
●
●
●
●
●
●
●
●
●
●
●
●
●
●
●
●
●
●
●
●
●
●
●
●
●
●
●
●
●
●
●
●
●
●
●
●
●
●
●
●
●
●
●
●
●
●
●
●
●
●
●
●
●
●
●
●
●
●
●
●
●
●
●
●
●
●
●
●
●
●
●
●
●
●
●
●
●
●
●
●
●
●
●
●
●
●
●
●
●
●
●
●
●
●
●
●
●
●
●
●
●
●
●
●
●
●
●
●
●
●
●
●
●
●
●
●
●
●
●
●
●
●
●
●
●
●
●
●
●
●
●
●
●
●
●
●
●
●
●
●
●
●
●
●
●
●
●
● ●
●
●
●
●
●
●
●
●
●
●
●
●
●
●
●
●
●
●
●
●
●
●
●
●
●
●
●
●
●
●
●
●
●
●
●
●
●
●
●
●
●
●
●
●
●
●
●
●
●
●
●
●
●
●
●
●
●
●
●
●
●
●
●●
●
●
●
●
●
●
●
●
●
●
●
●
●
●
●
●
●
●
●
●
●
●
●
●
●
●
●
●
●
●
●
●
●
●
●
●
●
●
●
●
●
●
●
●
●
●
●
●
●
●
●
●
●
●
●
●
●
●
●●
●
●
●
●
●
●
●
●
●
●
●
● ●
●
●
●
●
●
●
●
●
●
●
●
●
●
●
●
●
●
●
●
●
●
●
●
●
●
●
●
●
●
●
●
●
●
●
●
●
●
●
●
●
●
●
●
●
●
●
●
●
●
●
●
●
●
●
●
●
●
●
●
●
●
●
●
●
●
●
●
●
●
●
●
●
●
●
●
●
●
●
●
●
●
●
●
●
●
●
●
●
●
●
●
●
●
●
●
●
●
●
●
●
●
●
●
●
●
●
●
●
●
●
●
●
●
●
●
●
●
●
●
● ●
●
●
●
●
●
●
●
●
●
●
●
●
●
●
●
●
●
●
●
●
●
●
●
●
●
●
●●
●
●
●
●
●
●
●
●
●
●
●
●
●
●
●
●
●
●
●
●
●
●
●
●
●
●
●
●
●
●
●
●
●
●
●
●
●
●
●
●
●
●
●
●
●
●
●
●
●
●
●
●
●
●
●
● ●
●
●
●●
●
●
●
●
●
●
●
●
●
●
●
●
●
●
●
●
●
●
●
●
●
●
●
●
●
●
●
●
●
●
●
●
●
●
●
●
●
●●
●
●
●
●
●
●
●
●
●
●
●
●
●
●
●
●
●
●
●
●
●
●
●
●
●
●
●
●
●
●
●
●
●
●
●
●
●
●
●
●
●
●
●
●
●
●
●
●
●
●
●
●
●
●
●
●
●
●
●
●
●
●
●
●
●
●
●
●
●
●
●
●
●
●
●
●
●
●
●
●
●
●
●
●
●
●
●
●
●
●
●
●
●
●
●
●
●
●
●
●
●
●
●
●
●
●
●
●
●
●
●
●
●
●
●
●
●
●
●
●
●
●
●
●
●
●
●
●
●
●
●
●
●
●
●
●
●
●
●
●
●
●
●
●
●
●
●
●
●
●
●
●
●
●
●
●
●
●
●
●
●
●
●
●
●
●
●
●
●
●
●
●
●
●
●
●
●
●
●
●
●
●
●
●
●
●
●
●
●
●
●
●
●
●
●
●
●
●
●
●
●
●
●
●
●
●
●
●
●
●
●
●
●
●
●
●
●
●
●
●
●
●
●
●
●●
●
●
●
●
●
●
●
●
●
●
●
●
●
●
●
●
●
●
●
●
●
●
●
●
●
●
●
●
●
●
●
●
●
●
●
●
●
●
●
●
● ●
●
●
●
● ●
●
●
●
●
●
●
●
●
●
●
●
●
●
●
●●
●
●
●
●
●
●
●
●
●
●
●●
●
●
●
●
●
●
●
●
●
●
●
●
●
●
●
●
●
●
●
●
●
●
●
●
●
●
●
●
●
●
●
●
●
●
●
●
●
●
●
●
●
●
●
●
●
●
●
●
●
●
●
●
●
●
●
●
●
●●
●
●
●
●
●
●
●
●
●
●
●
●
●
●
●
●
●
●
●
●
●
●
●
●
●
●
●
●
●●
●
●
●
●
●
●
●
●
●
●
●
●
●
●
●
●
●
●
●
●
●
●
●
●
●
●
●●
●
●
●
●
●
●
●
●
●
●
●
●
●
●
●
●
●
●
●
●
●
●
●
●
●
●
●
●
●
●
●
●
●
●
●
●
●
●
●
●
●
●
●
● ●
●
●
●
●
●
●
●
●
●
●
●
●
●
●
●
●
●
●
●
●
●
●
●
●
●
●
●
●
●
●
●
●
●
●
●
●
●
●
●
●
●
●
●
●
●
●
●
●
●
●
●
●
●
●
●
●
●
●
●
●
●
●
●
●
●
●
●
●
●
●
●
●
●
●
●
●
●
●
●
●
●
●
●
●
●
●
●
●
●
●
●
●
●
●
●
●
●
●
●
●
●
●●
●
●
●
●
●
●
●
●
●
●
●
●
●
●
●
●
●
●
●
●
●
●
●
●
●
●
●
●
●
●
●
●
●
●
●
●
●
●
●
●
●
●
●
●
●
●
●
●
●
●
●
●
●
●
●
●
●
●
●
●
●
●
●
●
●
●
●
●
●
●
●
●
●
●
●
●
●
●
●
●
●●
●
●
●
●
●
●
●
●
●
●
●
●
●
●
●
●
●
●
●
●
●
●
●
●
●
●
●
●
●
●
●
●
●
●
●
●
●
●
●
●
●
●
●
●
●
●
●
●
●
●
●
●
●
●
●
●
●
●
●
●
●
●
●
●
●
●
●
●
●
●
●
●
●
●
●
●
●
●
●
●
●
●
●
●
●
●
●
●
●
●
●
●
●
●
●
●
●
●
●
●
●
●
●
●
●
●
●
●
●
●
●
●
●
●
●
●
●
●
●
●
●●
●
●
●
●
●
●
●
●
●
●
●
●
●
●
●
●
●
●
●
●
●
●
●
●
●
●
●
●
●
●
●
●
●
●
●
●
●
●
●
●
●
●
●
●
●
●
●
●
●
●
●
●
●
●
●
●
●
●
●
●●
●
●
●
●
●
●
●
●
●
●
●
●
●
●
●
●
●
●
●
●
●
●
●
●
●
●●
●
●
●
●
●
●
●
●
●
●
●
●
●
●
●
●
●
●
●
●
●
●
●
●
●
●
●
●
●
●
●
●
●
●
●
●
●
●
●
●
●
●
●
●
●
●
●
●
●
●
●
●
●
●
●
●
●
●
●
●
●
●
●
●
●
●
●
●
●
●
●
●
●
●
●
●
●
●
●
●
●
●
●
●
●
●
●
●
●
●
●●
●
●
●
●
●
●
●
●
●
●
●
●
●
●
●
●
●
●
●
●
●
●
●
●
●
●
●
●
●
●
●
●
●
●
●
●
●
●
●
●
●
●●
●
●
●
●
●
●
●
●
●
●
●
●
●
●
●
●
●
●
●
●
●
●
●
●
●
●
●
●
●
●
●
●
●
●
●
●
●
●
●
●
●
●
●
●
●
●
●
●
●
●
●
●
●
●
●
●●
●
●
●
●
●
●
●
●
●
●
●
●
●
●
●
●
●●
●
●
●
●
●
●
●
●
●
●
●
●
●
●
●
●
●
●
●
●
●
●
●
●
●
●
●
●
●
●
●
●
●
●
●
●
●
●
●
●
●
●
●
●
●
●
●
●
●
●
●
●
●
●
●
●
●
●
●
●
●
●
●
●
●
●
●
●
●
●
●
●
●
●
●
●
●
●
●
●
●
●
●
●
●
●
●
●
●
●
●
●
●
●
●
●
●
●
●
●
●
●
●
●
●
●
●
●
●
●
●
●
●
●
●
●
●
●
●
●
●
●
●
●
●
●
●
●
●
●
●
●
●
●
●
●
●
●
●
●
●
●
●
●
●
●
●
●
●
●
●
●
●
●
●
●
●
●
●
●
●
●
●
●
●●
●
●
●
●
●
●
●
●
●
●
●
●
●
●
●
●
●
●
●
●
●
●
●
●
●
●
●
●
●
●
●●
●
●
●
●
●
●
● ●
●
●
●
●
●
●
●
●
●
●
●
●
●
●
●
●
●
●
●
●
●
●
●
●
●
●
●
●
●
●
●
●
●
●
●
●
●●
●
●
●
●
●
●
●
●
●
●●
●
●
●
●
●
●
●
●
●
●
●
●
●
●
●
●
●
●
●
●
●
●
●
●
●
●
●
●
●
●
●
●
●
●
●
●
●
●
●
●
●
●
●
●
●
●
●
●
●
●
●
●
●
●
●
●
●
●
●
●
●
●●
●
●
●
●
●
●
●
●
●
●
●
●
●
●
●
●
●
●
●
●
●
●
●
●
●
●
●
●
●
●
●
●
●
●
●
●
●
●
●
●
●
●
●
●
●
●
●
●
●
●
●
●
●
●
●
●
●
●
●
●
●
●
●
●●
●
●
●
●
●
●
●
●
●
●
●
●
●
●
●
●
●
●
●
●
●
●
●
●
●
●
●
●
●
●
●
●
●
●
●
●
●
●
●
●
●
●
●
●
●
●
●
●
●
●
●
●
●
●
●
●
●
●
●
●
●
●
●
●
●
●
●
●
●
●
●
●
●
●
●
●
●
●
●
●
●
●
●
●
●
●
●
●
●
●
●
●
●
●
●
●
●
●
●
●
●
●
●
●
●
●
●
●
●
●
●
●
●
●
●
●
●
●
●
●
●
●
●
●
●
●
●
●
●
●
●
●
●
●
●
●
●
●
●
●
●
●
●
●
●
●
●
●
●
●
●
●
●
●
●
●
●
●
●
●
●
●
●
●
●
●
●
●
●
●
●
●
●
●
●
●
●
●
●
●
●
●
●
●
●
●
●
●
●
●
●
●
●
●
●
●
●
●
●
●
●
●
●
●
●
●
●
●
●
●
●
●
●
●
●
●
●
●
●
●
●
●
●
●
●
●
●
●
●
●
● ●
●
●
●
●
●
●
●
●
●
●
●
●
●
●
●
●
●
●
●
●
●
●
●
●
●
●
●
●
●
●
●
●
●
●
●
●
●
●
●
●
●
●
●
●
●
●
●
●
●
●
●
●
●
●
●
●
●●
●
●
●
●
●
●
●
●
●
●
●
●
●
●
●
●
●
●
●
●
●
●
●
●
●
●
●
●
●
●
●
●
●
●
●
●
●
●
●
●
●
●
●
●
●
●●
●
●
●
●
●
●
●
●
●
●
●
●
●
●
●
●
●
●
●
●
●
●
●
●
●
●
●
●
●
●
●
●
●
●
●
●
●
●
●
●
●
●●
●
●
●
●
●
●
●
●
●
●
●
●
●
●
●
●
●
●
●
●
●
●
●
●
●
●
●
●
●
●
●
●
●
●
●
●
●
●
●
●
●
●
●
●
●
●
●
●
●
●
●
●
●
●
●
●
●
●
●
●
●
●
●
●
●
●
●
●
●
●
●
●
●
●
●
●
●
● ●
●
●
●
●
●
●
●
●
●
●
●
●
●
●
●
●
●
●
●
●
●
●
●
●
●
●
●
●
●
●
●
●
●
●●
●
●
●
●
●
●
●
●
●
●
●
●
●
●
●
●
●
●
●
●
●
●
●
●
●
●
●
●
●
●
●
●
●
●
●
●
●
●
●●
●
●
●
●
●
●
●
●
●
●
●
●
●
●
●
●
●
●
●
●
●
●
●
●
●
●
●
●
●
●
●
●
●
●
●
●
●
●
●
●
●
●
●
●
●
●●
●
●
●
●
●●
●
●
●
●
●
●
●
●
●
●
●
●
●
●
●
●
●
●
●
●
●
●
●
●
●
●
●
●
●
●
●
●
●
●
●●
●
●
●
●
●
●
●
●
●
●
●
●
●
●
●
●
●
●
●
●
●
●
●
●
●
●●
●
●
●
●
●
●
●
●
●
●
●
●
●
●
●
●
●
●
●
●
●
●
●
●
●
●
●
●
●
●
●
●●
●
●
●
●
●
●●
●
●
●
●
●
●●
●
●
●
●
●
●
●
●
●
●
●
●
●
●
●
●
●
●
●
●
●
●
●
●
●
●
●
●
●
●
●
●
●
●
●
●
●
●
●
●
●
●
●
●
●
●
●
●
●
●
●
●
●
●
●
●
●
●
●
●
●
●
●
●
●
●
●
●
●
●
●
●
●
●
●
●
●
●
●
●
●
●
●
●
●
●
●
●
●
●
●
●
●
●
●
●
●
●
●
●
●
●
●
●
●
●
●
●
●
●
●
●
●
●
●
●
●
●
●
●
●
●
●
●
●
●
●
●
●
●
●
●
●
●
●
●
●
●
●
●
●
●
●
●
●
●
●
●
●
●
●
●
●
●
●
●
●
●
●
●
●
●
●
●
●
●
●
●
●
●
●
●
●
●
●
●
●
●
●
●
●
●
●
●
●
●
●
●
●
●
●
●
●
●
●
●
●
●
●
●
●
●
●
●
●
●
●
●
●
●
●
●
●
●
●
●
●
●
●
●
●
●
●
●
●
●
●
●
●
●
●
●
●
●
●
●●
●
●
●
●
●
●●
●
●
●
●
●
●
●
●
●
●
●
●
●
●
●
●
●
●
●
●
●
●
●
●
●
●
●
●
●
●
●
●
●
●
●
●
●
●
●
●
●
●
●
●
●
●
●
●
●
●
●
●
●●
●
●
●
●
●
●
●
●
●
●
●
●
●
●
●
●
●
●
●
●
●
●
●
●
●
●
●
●
●
●
●
●
●
●
●
●
●
●
●
●
●
●
●
●
●
●
●
●
●
●
●
●
●
●
●
●
●
●
●
●
●
●
●
●
●
●
●
●
●●
●
●
●
●
●
●
●
●
●
●
●●
●
●
●
●
●
●
●
●
●
●
●
●
●
●
●●
●
●
●
●
●
●
●
●
●
●
●
●
●
●
●
●
●
●
●
●
●
●
●
●
●
●
●
●
●
●
●
●
●
●
●
●
●
●
●
●
●
●
●
●
●
●
●
●
●
●
●
●
●
●
●
●
●
●
●
●
●
●
●
●
●
●
●
●
●
●
●
●
●
●
●●
●
●
●
●
●
●
●
●
●
●
●
●
●
●
●
●
●
●
●
●
●
●
●
●
●
●
●
●
●
●
●
●
●
●
●
●
●
●
●
●
●●
●
●
●
●
●
●
●
●
●
●
●
●
●
●
●
●
●
●
●
●
●
●
●
●
●
●
●
●
●
●
●
●
●
●
●
●
●
●
●
●●
●
●
●
●
●
●
●
●
●
●
●
●
●
●
●
●
●
●
●
●
●
●
●
●
●
●
●
●
●
●
●
●
●
●
●
●
●
●
●
●
●
●
●
●
●
●●
●
●
●
●
●
●
●
●
●
●
●
●
●
●
●
●
●
●
●
●
●
●
●
●
●
●
●
●
●
●●
●
●
●
●
●
●
●
●
●
●
●
●
●
●
●
●
●
●
●
●
●
●
●
●
●
●
●
●
●
●
●
●
●
●
●
●
●
●
●●
●
●
●
●
●
●
●●
●
●
●
●
●
●
●
●
●
●
●
●
●
●
●
●
●
●
●
●
●
●
●
●
●
●
●
●
●
●
●●
●
●
●
●
●
●
●
●
●
●
●
●
●
●
●
●
●
●
●
●
●
●
●
●
●
●
●
●
●
●
●
●
●
●
●
●
●
●
●
●
●
●
●
●
●
●
●
●
●
●
●
●
●
●
●
●●
●
●
●
●
●
●
●
●
●
●
●
●
●
●●
●
●
●
●
●
●
●
●
●
●
●
●
●
●
●
●
●
●
●
●
●
●
●
●
●
●
●
●
●
●
●
●
●
●
●
●
●
●
●
●
●
●
●
●
●
●
●
●
●
●
●
●
●
●
●●
●
●
●
●
●
●
●
●
●
●
●
●
●
●
●
●●
●
●
●
●
●
●
●
●
●
●
●
●
●
●
●
●
●
●
●
●
●
●
●
●
●
●
●
●
●
●
●
●
●
●
●
●
●
●
●
●
●
●
●
●
●
●
●
●
●
●
●
●
●
●
●
●
●
●
●
●
●
●
●
●
●
●
●
●
●
●
●
●
●
● ●
●
●
●
●
●
●
●
●
●
●
●
●
●
●
●
●
●
●
●
●
●
●
●
●
●
●
●
●
●
●
●
●
●
●
●
●
●
●
●
●
●
●
●
●
●
●
●
●
●
●
●
●
●
●
●
●
●
●
●
●
●
●
● ●
●
●
●
●
●
●
●
●
●
●●
●
●
●
● ●
●
●
●
●
●
●
●
●
●
●●
●
●
●
●
●
●
●
●
●
●
●
●
●
●
●
●
●
●
●
●
●
●
●
●
●
●●
●
●
● ●
●
●
●
●
●
●
●
●
●
●
●
●
●
●
●
●
●
●
●
●
●
●
●
●
●
●
●
●
●
●
●
●
●
●
●
●
●
●
●
●
●
●
●
●
●
●
●
●
●
●
●
●
●
●
●
●
●
●
●
●
●
●
●
●
●
●
●●
●
●
●
●
●
●
●
●
●
●
●
●
●
●
●
●
●
●
●
●
●
●
●
●
●
●
●
●
●●
●
●
●
●
●
●
●
●
●
●
●
●
●
●
●
●
●
●
●
●
●
●
●
●
●
●
●
●
●
●
●
●
●
●
●
●
●
●
●
●
●
●
●
●
●
●
●
●
●
●
●
●
●
●
●
●
●
●
●
●
●
●
●
●
●
●
●
●
●
●
●
●
●
●
●
●
●
●
●
●
●●
●
●
●
●
●
●●
●
●
●
●
●
●
●
●
●
●
●
●
●
●
●
●
●
●
●
●
●
●
●
●
●
●
●
●
●
●
●
●
●
●
●
●
●
●
●
●
●
●
●
●
●
●
●
●
●
●●
●
●
●
●
●
●
●
●
●
●
●
●
●
●
●
●
●
●
●
●
●
●
●
●
●
●
●
●
●
●
●
●
●
●
●
●
●
●
●
●
●
●
●
●
●
●
●
●
●
●
●
●
●
●
●
●
●
●
●
●
●
●
●
●
●
●
●
●
●
●
●
●
●
●
●
●
●
●
●
●
●
●
●
●
●
●
●
●
●
●
●
●
●
●
●
●●
●
●
●
●
●
●
●
●
●
●
●
●
●
●
●
●
●
●
●
●
●
●
●
●
●
●
●
●
●
●
●
●
●
●
●
●
●
●
●
●
●
●
●
●
●
●
●
●
●
●
●
●
●
●
●
●
●
●
●
●
●
●
●
●
●
●
●
●
●
●
●
●
●
●
●
●
●
●
●
●
●
●●
●
●
●
●
●
●
●
●
●
●
●
●
●
●
●
●
●
●
●
●
●
●
●
●
●
●
●
●
●
●
●
●
●
●
●
●
●
●
●
●
●
●
●
●
●
●
●
●
●
●
●
●
●
●●
●
●
●
●
●
●
●
●
●
●
●
●
●
●●
●
●
●
●
● ●
●
●
●
●
●
●
●
●
●
●
●
●
●
●
●
●
●
●
●
●
●
●
●
●
●
●
●
●
●
●
●
●
●
●
●
●
●
●
●
●
●
●
●
●
●
●
●
●
●
●
●
●
●
●
●
●
●
●
●
●
●
●
●
●
●
●
●
●
●
●●●
● ●
●
●
●
●
●
●
●
●
●
●
●
●
●
●
●
●
●
●
●
●
●
●
●
●
●
●
●
●
●
●
●
●
●
●●
●
●
●
●
●
●
●
●
●
●
●
●
●
●
●
●
●
●
●
●
●
●
●
●●
●
●
●
●
●
●
●
●
●
●
●
●
●
●●
●
●
●
●
●
●
●
●
●
●
●
●
●
●
●
●
●
●
●
●
●
●
●
●●
●
●
●
●
●
●
●●
●
●
●
●
●
●
●
●
●
●
●
●
●
●
●
●
●
●
●
●
●
●
●
●
●
●
●
●●
●
●
●
●
●
●
●
●
●
●
●
●
●
●
●
●
●
●
●
●
●
●
●
●
●
●
●
●
●
●
●
●
●
●
●
●
● ●
●
●
●
●
●
●
●
●
●
●
●●
●
●
●
●
●
●
●
●
●
●
●
●
●
●
●
●
●
●
●
●
●
●
●
●
●
●
●●
●
●
●
●
●
●
●
●
●
●
●
●
●
●
●
●
●
●
●
●
●
●
●
●
●
●
●
●
●
●
●
●
●
●
●
●
●
●
●
●
●
●
●
●
●
●
●
●
●
●
●
●
●
●
●
●
●
●
●
●
●
●
●
●
●
●
●
●
●
●
●
●
●
●
●
●
●
●
●
●
●●
●
●
●
●
●
●
●
●
●
●
●
●
●
●
●
●
●
●
●
●
●
●
●●
●
●
●
●
●
●
●
●
●
●
●
●
●
●
●
●
●
●
●
●
●
●
●
●
●
●
●
●
●●
●
●
●
●
●
●
●
●
●
●
●
●
●
●
●
●
●
●
●
●
●
●
●
●
●
●
●
●
●
●●
●
●
●
●
●
●
●
●
●
●
●
●
●
●
●
●
●
●
●
●
●
●
●
●
●
●
●
●
●
●
●
●
●
●
●
●
●
●
●
●
●
●
●
●
●
●
●
●
●
●
●
●
●
●
●
●
●
●
●
●
●
●
●
●
●
●
●
●
●
●
●
●
●
●
●
●
●
●
●
●
●
●
●
●
●
●
●
●
●
●
●
●
●
●
●
●
●
●
●
●
●
●
●
● ●
●
●
●
●●
●
●
●
●
●
●
●
●
●
●
●
●
●
●
●
●
●
●●
●
●
●
●
●
●
●
●
●
●
●
●
●
●
●
●
●
●
●
●
●
●
●
●
●
●
●
●
●
●●
●
●
●
●
●
●
●
●
●
●
●
●
●
●
●
●
●
●
●
●
●
●
●
●
●
●
●
●
●
●
●
●
●
●
●
●
●
●
●
●
●
●
●
●
●
●
●
●
●
●
●
● ●
●
●
●
●
●●
●
●
●
●
●
●
●
●
●
●
●
●
●
●
●
●
●
●
●
●
●
●
●
●
●
●
●
●
●
●
●
●
●
●
●
●
●
●
●
●
●
●
●
●
●
●
●
●
●
●
●
●
●
●
●
●
●
●
●
●
●
●
●
●
●
●
●
●
●
●
●
●
●
●
●
●
●
●
●
●
●
●
●
●
●
●
●
●
●
●
●
●
●
●
●
●
● ●
●
●
●
●
●●
●
●
●
●
●
●
●
●
●
●
●
●
●
●
●
●
●
●
●
●
●
●
●
●
●
●
●
●
●
●
●
●●
●
●
●
●
●
●
● ●
●
●
●
●
●
●
●
●
●
●
●
●●
●
●
●
●
●
●
●
●
●
●
●
●
●
●
●
●
●
●
●
●
●
●
●
●
●
●
●
●
●
●
●
●
●
●
●
●
●
●
●
●
●
●
●
●
●
●
●
●
●
●
●
●
●
●
●
●
●
●
●
●
●
●
●
●
●
● ●
●
●
●
●
●
●
●
●
●
●
●
●
●
●
●
●
●
●
●
●
●
●
●
●
●
●
●
●
●
●
●
●
●
●
●
●
●
●
●
●
●
●
●
●
●●
●
●
●
●
●
●
●
●
●
●
●
●
●
●
●
●
●
●
●
●
●
●
●
●
●
●
●
●
●
●
●
●
●●
●
●
●
●
●
●
●
●
●
●
●
●
●
●
●
●
●
●
●
●
●
●
●
●
●
●
●
●
●●
●
●
●
●
●
●
●
●
●
●
●
●
●
●
●
●
●
●
●
●
●
●
●
●
●
● ●
●
●
●
●
●
●
●
●
●
●
●
●
●
●
●
●
● ●
●
●
●
●
●
●
●
●
●
●
●
●
●
●
●
●
●
●
●
●
●
●
●
●
●
●
●
●
●
●●
●
●
●
●
●
●
●
●
●
●
●
●
●
●
●
●
●
●
●
●
●
●
●
●
●
●
●
●
●
●
●
●
●
●
●
●
●
●●
●
●
●
●
●
●
●
●
●
●
●
●
●
●
●
●
●
●
●
●
●
●
●
●
●
●
●
●
●
●
●
●
●
●
●
●
●
●
●
●
●
●
●
●
●
●
●
●
●
●●
●
●
●
●
●
●
●
●
●
●
●
●
●
●
●
●
●
●
●
●
●
●
●
●
●
●
●
●
●
● ●
●
●
●
●
●●
●
●
●
●
●
●
●
●
●
●
●
●
●
●
●
●
●
●
●
●
●
●
●
●
●
●
●●
●
●●
●
●
●
●
●
●
●
●
●
●
●
●
●
●
●
●
●
●
●
●
●
●
●
●
●
●
●
●
●
●
●
●
●
●
●
●
●
●
●
●
●
●
●
●
●
●
●
●
●
●
●
●
●
●
●
●
●
●
●
●
●
●
●
●
●
●
●
●
●
●
●
●
●
●
●
●●
●
●
●
●
●
●
●●
●
●
●
●
●
●
●
●
●
●
●
●
●
●
●
●
●
●
●●
●
●
●
●
●
●
●
●
●
●
●●
● ●
●
●
●
●
●
●
●
●
●
●
●
●
●
●
●
●
●
●
●
●
●
●
●
●●
●●
●
●
●
●
●
●
●
●
●
●
●
●
●
●●
●
●
●
●
●
●
●
●
●
●
●
●
●
●
●
●
●
●
●
●
●●
●
● ●
●
●
●
●
●
●
●
●
●
●
●
●
●
●
●
●
●
●
●
●
●
●
●
●
●
●
●
●
●
●
●
●
●
●
●
●●
●
●
●
●
●
●
●
●
●
●
●
●
●
●
●
●
●
●
●
●
●
●
●
●
●
●
●
●
●
●
●
●
●
●
●●
●
●
●
●
●
●
●
●
●
●
●
●
●
●
●
●
●
●
●
●
●
●
●
●
●
●
●
●●
●
●
●
●
●
●
●
●
●
●
●
●
●
●
●
●
●
●
● ●
●
●
●
●
●
●
●
●
●
●
●
●
●
●
●
●
●
●
●
●
●
●●
●
●
●
●
●
●
●
●
●
●
●
●
●
●●
●
●
●
●
●
●
●
●
●
●
●
●●
●
●
●
●
●
●
●
●
●
●
●
●
●
●
●
●
●
●
●
●
●
●
●
●
●
●
●
●
●
●
●
●
●
●
●
●
●
● ●
●
● ●
●
●
●
●
●
●
●
●
●
●
●
●
●
●
●
●
●
●
●
●
●
●
●
●
●
●
●
●
●
●●
●
●
●
●
●
●
●
●
●
●
●
●
●
●
●
●
●
●
●
●●
●
●
●
●
●
●
●
●
●
●
●
●
●
●
●
●
●
●
●
●
●
●
●
●
●
●
●
●
●
●
●
●
●
●●
●
●
●
●●
●
●
●
●
●
●
●
●
●
●
●
●
●
●
●
●
●
●
●
●
●
●
●
●
●
●
●
●
●
●
●
●
●
●
●
●
●
●
●
●
●
●
●
●
●
●
●● ●
●
●
●
●
●
●
●
●●
●
●
●
●
●
●
●
●
●
●
●
●
●
●
●
●
●
●
●
●
●
●
●
●
●
●
●
●
●
●
● ●
●
●
●
●
●
●
●
●
●
●
●
●
●
●
●
●
●
●
●
●
●
●
●●
●
●
●
● ●
●
●
●
●
●
●
●
●
●
●
●
●
●
●
●
●
●
●
●
●
●
●
●
●
●
●
●
●
●
●
●
●
●
●
●
●
● ●
●
●
●●
●
●
●
●
●
●●
●
●
●
●
●
●
●
●
●
●
●
●
●
●
●
●
●
●
●
●
●
●
●
●
●
●
●
●
●
●
●
●
●
●
●
●
●
●
●
●
●
●
●
●
●
●
●●
●
●
●
●
●
●
●
●
●
●
●
●
●●
●
●
●
●
●
●
●
●
●●
●
●
●
●
●
●
●
●
●●
●
●
●
●
●
●
●
●
●
●
●
●
●
●
●
●
●
●
●
●
●
●
●
●
●
●
●
●
●
●
●
●
●
●
●
●
●
●
●
●
●
●
●
●
●
●
●
●
●
●
●
●
●
●
●
●
●
●
●
●
●
●
●
●
●
●
●
●
●
●
●
●
●
●●
●
●
●
●
●
●
●
●
●
●
●
●
●
●
●
● ●
●
●
●
●
●
●
●
●
●
●
●
●
●
●
●
●
●
●
● ●
●
●
●
●
●
●
●
●
●
●
●
●
●
●
●
●
●
●
●
●
●
●
●
●
●
● ●
●
●
●
●
●
●
●
●
●
●
●
●●
●
●
●
●
●
●
●
●
●
●
●
●
●
●
●
●
●
●
●
●
●
●
●
●
●
●
●●
●
●
●
●
●
●
●
●
●
●
●
●
●
●
●
●
●
●
●
●
●
●
●
●
●
●
●
●
●
●
●
●
●
●
●
●
●
●
●
●
●
●
●
●
●
●
●
●
●
●
●
●
●
●
●
●
●
●
●
●
●
●
●
●
●
●
●
●
●
●
●
●
●
●
●
●
●
●
●
●
●
●
●
●
●
●
●
●
●
●
●
●
●
●
●
●
●
●
●●
●
●
●
●
●
●
●
●
●
●
●
●
●
●
●
●
●
● ●
●
●
●
●
●
●
●
●
●
●
●
●
●
●
●
●
●
●
●
●●
●
●
●
●
●
●
●
●
●
●
●
●
●
●
●
●
●
●
●
●
●
●
●
●
●
●
●●
●
●
●
●
●
●
●
●
●
●
●
●●
● ●
●
●
●
●
●
●
●
●
●
●
●
●
●
●
●
●
●
●
●
●
●
●
●
●
●
●
●
●
●
●
●
●
●
●
●
●
●
●
●
●
●
●
●●
●
●
●
●
●
●
●
●
●
●
●
●
●
●
●
●
●
●
●
●
●
●
●
●
●
●
●
●
●
●
●
●
●
●
●
●
●
●
●
●
●
●
●
●
●
●
●●
●
●
●
●
● ●
●
●
●
●
●
●
●
●
●
●
●
●
●
●
●
●
●
●
●
●
●
●
●
●
●
●
●
●
●
●
●
●
●
●
●
●
●
●
●
●
●
●
●
●
●
●
●
●
●
●
●
●
●
●
●
●
●
●
●
●
●
●
●
●
●
●
●
●
●
●
●
●
●
●
●
●
●
●
●
●
●
●
●
●
●
●
●
●
●
●
●
●
●
●
●
●
●
●
●
●
●
●
●
●
●
●
●
●
●
●
●
●
●
●
●
●
●
●
●
●
●
●
●
●
●
●
●
●
●
●
●
●
●
●
●
●
●
●
●
●
●
●
●
●
●
●
●
●
●
●
●
●
●
●
●
●
●
●
●
●
●
●
●
●
●
●
●
●
●
●
●
●
●
●
●
●
●
●
●
●
●
●
●
●
●
●
●
●
●
●
●
●
●
●
●
●
●
●
●
●●
●
●
●
●
●
●
●
●
●
●
●
●
●
●
●
●
●
●
●
●
●
●
●
●
●
●
●
●
●
●
●
●●
●
●
●
●
●
●
●
●
●
●
●
●
●
●
●●
●
●
●
●
●
●
●
●
●
●
●
●
●
●
●
●
●
●
●●
●
●
●
●
●
●●
●●
●●
●
●
●
●
●
●
●
●
●
●
●
●
●
●
●
●
●
●
●
●
●
●
●
●●
●
●●
●
●
●
●
●
●
●
●
●
●
●
●
●
●
●
●
●
●
●
●
●
●
●
●●
●
●●
●
●
●
●
●
●
●
●
●
●
●
●
●
●
●
●
●
●
●
●
●
●
●
●
● ●
●
●
●
●
●
●
●
●
●
●
●
●
●
●
●
●
●
●
●
●
●
●
●
●
●
●
●
●
●
●
●
●
●
●
●
●
●
●
●
●
●
●
●
●
●
●
●
●
●
●
●
●
●
●●
●
●
●
●
●
●
●●
●
●
●
●
●
●
●
●
●
●
●
●
●
●
●●
●
●
●
●
●
●
●
●
●
●
●
●
●
●
●
●
●
●
●
●
●
●
●
●
●
●
●
●
●
●
●
●
●
●
●
●
●
●
●
●
●
●
●
●
●
●
●
●
●
●●
●
●
●
●
●
●
●
●
●
●●
●
●
●
●
●
●
●
●
●
●
●
●
●
●
●●
●
●
●
●
●
●
●
●
●
●
●●
●●
●
●
●
●
●
●
●
●
●
●
●
●
●
●
●
●
●
●
●
●
●
●
●
●
●
●
●
●
●
●
●
●
●
●
●
●
●
●
●
● ●
●
●
●
●
●
●
●
●
●
●
●
●
●
●
●
●
●
●
●
●
●
●
●
●
●
●
●
●
●
●
●
●
●
●
●
●
●
●
●
●
●
●
●
●
●
●
●
●
●●
●
●●
●
●
●
●
●
●
●
●
●
●
●
●
●
●
●
●
●
●●
●
●
●
●●
●
●
●
●
●
●
●
●
●
●
●
●
●
●
●
●
●
●
●
●
●
●
●
●
●
●
●
●
●
●
●
●
●
●
●
●
●
●
●
●
●
●●
●
●
●
●
●
●
●
●
●
●
●
●
●
●
●
●
●
●
●
●
●
●
●
●
●
●
●
●
●
●
●
●
●
●
●
●
●
●
●
●
●●
●
●
●
●
●
●
●
●
●
●
●
●
●
●
●
●●
●
●
●
●
●
●
●
●
●
●
●
●
●
●
●
●
●
●
●
●
●
●
●
●
●
●
●
●
●
●
●
●
●
●
●
●
●
●
●
●
●
●
●
●
●
●
●
●
●
●
●
●
●
●
●
●
●
●
●
●
●
●
● ●
●
●
●
●
●
●
●
●
●
●●
●
●
●
●
●
●
● ●
●
●●
●
●
●
●
●
●
●
●
●
●
●
●
●
●
●
●
●
●
●
●
●
●
●
●
●
●
●
●
●
●
●
●
●
●
●
●
●
●
●
●
●
●
●
●
●
●
●
●
●
●
●
●
●
●
●
●
●
●
●
●
●
●
●
●
●
●
●
●
●
●
●
●
●
●
●
●
●
●
●
●●
●●
●
●
●
●
●
●
●
●
●
●
●
●
●
●
●
●
●
●
●
●
●
●
●
●
●
●
●
●
●
●
●
●
●
●
●
●
●
●
● ●
●
●
●
●
●
●
●
●
●
●
●●
●
●
●●
●
●
●
●
●
●
●
●
●
●
●
●
●
●
●
●
●
●
●
●
●
●
●
●
●
●
●
●
●
●
●
●
●
●
●
●
●
●
●
● ●
●
●
●
●
●
●
●
●
●
●
●
●
●
●
●
●
●
●
●
●
●
●
●
●
●
●
●
●
●
●
●
●
●
●
●
●
●
●
●
●
●
●
●
●
●
●
●
●
●
●
●
●
●
●
●
●
●
●
●
●
●
●
●
●
●
●
●
●
●
●
●
●
●
●
●
●
●
●
●
●
●
●
●
●
●
●
●
●
●
●
●
●
●
●
●
●
●
●
●
●
●
●
●
●
●
●
●
●
●
●
●
●
●
●
●
●
●
●
●
●
●
●
●
●
●
●
●
●
●
●
●
●
●●
●
●
●
●
●
●
●
●●
●
●
●
●
●
● ●
●
●
●
●
●
●
●
●
●
●
●
●
●
●
●
●
●
●
●
●
●
●
●
●
●
●
●
●
●
●
●
●
●
●
●
●
●
●
●
●
●
●
●
●
●
●
●
●
●
●
●
●
●
●
●
●
●
●
●
●
●
●
●
●
●
●
●
●
●
●
●
●
●
●
●
●
●
●
●
●
●
●
●
●
●
●
●
●
●
●
●●
●
●
● ●
●
●
●
●
●
●
●
●
●
●
●
●
●
●
●
●
●
●
●
●
●
●
●
●
●
●●
●
●
●
●
●
●
●
●
●
●
●
●
●
●
●
●
●
●
●
●
●
●
●
●
●
●
●
●
●
●
●
●
●●
●
●
●
●
●
●
●
●
●
●
●
●
●
●
●
●
●
●
●
●
●
●
●
●
●
●
●
●
●
●
●
●
●
●
●
●●
●
●
●
●
●
●
●
●
●
●
●
●
●
●
●
●
●
●
●
●
●
●
●
●
●
●
●
●
●
●
●
●
●
●
●
●
●
●
●
●
●
●
●
●
●
●
●
●
●
●
●
●
●
●
●
●
●
●
●
●
●
●
●
●
●
●
●
●
●
●
●
●
●
●
●
●
●
●
●
●
●
●
●
●
●
●
●
●
●
●
●●
●
●
●
●
●
●
●
●
●
●
●
●
●
●
●
●
●
●
●
●
●
●
●
●
●
●
●
●
●
●
●
●●
●
●
●
●
●
●
●
●
●
●
●
●
●
●
●
●
●
●
●
●
●
●
●
●
●
●
●
●
●
●
●
●
●
●
●
●
●
●
●
●
●
●
●
●
●
●
●
●
●
●
●
●
●
●
●
●
●
●
●
●
●
●
●
●
●
●
●
●
●
●
●
●●
●
●
●
●
●
●
●
●
●
●
●
● ●
●
●
●
●
●
●
●
●
●
●
●
●
●
●
●
●
●
●
●
●
●
●
●
●
● ●
●
●
●
●
●
●
●
●●
●
●
●
●
●
●
●
●●
●
●
●
●
●
●
●
●
●
●
●
●●
●
●
●
●
●
●
●
●
●
●
●
●
●
●
●
●
●
●
●
●
●●
●
●
●
●
●
●
●
●●
●
●
●
●
●
●
●
●
●
●
●
●
●
●
●
●
●
●
●
●
●
●
●
●
●
●
●
●
●
●
●
●
●
●
●
●
●
●
●
●
●
●
●
●
●
●
●
●
●
●
●
●
●
●
●
●
●
●
●
●
●
●
●
●●
●
●
●
●
●
●
●
●
●
●
●
●
●
●
●
●
●
●●
●
●
●
●
●
●
●
●
●
●
●
●
●
●
●
●●
●
●
●
●
●
●
●
●
●
●
●
●
●
●
●
●
●
●
●
●
●
●
●
●
●
●
●
●
●
●
●
●
●
●
●
●
●
●
●
●
●
●●
●
●
●
●
●
●
●
●
●
●
●
●
●
●
●
●
●
●
●
●
●
●
●
●
●
●
●
●
●
●
●
●
●
●
●
●
●
●
●
●
●
●
●
●
●
●
●
●
●
●
●
●
●
●
●
●
●
●
●
●●
●
●
●
●
●
●
●
●
●
●
●
●
●
●
●
●
●
●
●
●
●●
●
●
●
●
●
●
●
●
●
●
●
●
●
●
●
●
●
●
●
●
●
●
●
●
●
●
●
●
●
●
●
●
●
●
●
●
●
●
●
●
●
●
●
●
●
●
●
●
●
●
●
●
●●
●
●
●
●
●
●
●
●
●
●
●
●
●
●
●
●
●
●
●
●
●
●
●
●
●
●
●
●
●
●
●
●
●
●
●
●
●
●
●
●
●
●
●
●
●
●
●
●
●
●
●
●
●
●
●
●
●●
●
●
●
●
●
●
●
●
●
●
●
●
●
●
●
●
●
●
●
●
●
●
●
●
●
●
●
●
●
●
●
●
●
●
●
●
●
●
●
●
●
●
●
●
●
●
●
● ●
●
●
●
●
●
●
●
●
●
●
●
●
●
●
●
●
●
●
●
●
●
●
●
●
●
●
●
●
●
●
●
●
●
●
●
●
●
●
●
●
●
●
●
●
●
●
●
●
●
●
●
●
●
●
●
●●
●
●
●
●
●
●
●
●
●●●
●
●●
●
●
●● ●
●
● ●
●
●
●
●
●
●
●
●
●
●
●
●
●
●
●
●
●
●
●
●
●
●
●
●
●
●
●
●
●
●
●
●●
●
●
●
● ●
●
●
●
●
●
●
●
●
●
●
●
●
●
●
●
●
●
●
●
●
●
●
●
●
●
●
●
●
●
●
●
●
●
●
●
●
●
●
●
●
●
●
●
●
●
●
●
●
●
●
●
●
●
●
●●
●
● ●
●
●
●
●
●
●
●
●
●
●●
●
●
●
●
●
●
●
●
●
●
●
●
●
●
●
●
●
●
●
●
●
●
●
●
●
●
●
●
●
●
●
●
●
●
●
●
●
●
●
●
●
●
●
●
●
●
●
●
●
●
●
●
●
●
●
●
●
●
●
●
●
●
●
●
●
●
●
●
●
●
●●
●
●
●
●
●
●
●
●
●
●
●
●
●
●
●
●
●
●
●
●
●
●
●
●
● ●
●
●
●
●
●
●
●
●
●
●
●
●
●
●
●
●
●
●
●
●
●
●
●
●●
●
●
●
●
●●
●
●
●
●
●
●
●
●
●
●
●
●
●
●
●
●
●
●
●
●
●
●
●
●
●
●
●
●
●
●
●
●
●
●
●
●
●●
●
●
●
●
●
● ●
●
●
●
●
●
●
●●
●
●
●
●
●
●
●
●
●
●
●
●
●
●
●
●
●
●
●
●
●
●
●
●
●●
●
●
●
●
●
●
●
●
●
●
●
●
●
●
●
●
●
●
●
●
●
●
●
●
●
●
●
●
●
●
●
●
●
●
●
●
●
●
●
●
●
●
●●
●
●
●
●
●
●
●
●
●
●
●
●
●
●
●
●
●
●
●
●
●
●
●
●
●
●
●
●
●
●
●
●
●
●
●
●
●
●
●
●
●
●
●
●
●
●
●
●
●
●
●
●
●
●
●
●
●
●
●
●
●
●
●
●
●
●
●
●
●
●
●●
●
●
●
●
●
●
●
●●
●
●
●
●●
●
●
●
●
●
●
●
●●
●
●
●
●
●
●
●
●
●
●
●
●
●
●
●
●
●
●●
●
● ●
●●
●
●●
●
●
●
●
●
●
●
●
●
●
●
●
●
●
●
●
●
●
●
●
●
●
●
●
●
●
●
● ●
●
●
●
●
●
●
●
●
●
●
●
●
●●
●●
●
●
●
●
●
●
●
●
●
●
●
●
●
●
●
●
●
●
●
●
●
●
●
●
●
●
●
●
●
●
●
●
●
●
●
●
●
●
●●
●
●
●
●
●
●
●
●
●
●
●
●
●
●
●
●
●
●
●
●
●
●
●
●
●
●
●
●
●
●
●
●
●
●
●
●
●
●
●
●
●
●
●
●
●
●
●
●
●
● ●
●
●
●
●
●
●
●
●●
●
●
●
●
●
●
●
●
●
●
●
●
●
●
●
●
●
●
●
●
●
●
●
●
●
●
●
●
●
●
●
●
●
●
●
●
●
●
●
●●
●
●
●
●
●
●●
● ●
●
●
●
●
●
●
●
●
●
●●
●
●
● ●
●
●
●
●
●
●●
●
●
●
●
●
●
●
●
●
●
●
●
●
●
●
●
●
●
●
●
●
●
●
●
●
●
●
●
●
●
●
●
●
●
●
●
●
●
●
●
●
●
●
●
●
●
●●
●
●
●
●
●
●
●
●●
●
●
●
●
●
●
●
● ●
●
●
●
●
●
●
●
●
●
●
●
●
●
●
●
●
●
●
● ●
●
●
●
●
●
●
●
●
●
●
●
●
●
●
●
●
●
●
●
●
●
●
●
●
●
●●●
●
●
●
●
●
●
●
●
●
●
●
●
●
●
●
●
●
●
●
●
●
●
●
●
●
●
●
●
●
●
●
●
●
●
●
●
●
●
●
●
●
●
●
●
●
●
●
●
●
●
●
●
●
●
●
●
●
●
●
●
●
●
●
●
●
●
●
●
●
●
●
●
●●●
●
●
●
●
●
●
●●
●
●
●
●
●
●
●
●
●
●
●
●
●
●
●
●
●
●
●
●
●
●
●
●
●
●
●
●
●
●
●
●
●
●
●
●
●
●
●
●
●
●
●
●
●
●
●
●
●
●
●
●
●
●
●
●
●
●
●
●
●
●
●
●●
●
●
●
●
●
●
●
●
●
●
●
● ●
●
●
●
●
●
●
●
●
●
●
●
●
●
●
●
●
●
●
●
●
●
●
●
●
●
●
●
●
●
●
●
●
●
●
●
●
●
●
●
●
●
●
●
●
●
●
●
●
●
●
●
●
●
●
●
●
●
●
● ●
●
●
●
●
●
●
●
●
●
●
●
●
●
●
●
●
●
●
●
●
●
●
●
●
●
●
●
●
●
●
●
●
●
●
●
●
●
●
●
●
●
●
●
●
●
●
●
●
●
●
●
●
●
●
●
●
●
●
●
●
●
●
●
●
●
●
●
●
●
●
●
●
●
●
●
●
●
●
●
●
●
●
●
●
●
●
●
●
●
●
●
●
●
●
●
●●
●
●
●
●
●
●
●
●
●
●●
●
●
●
●
●
●
●
●
●
●
●
●
●
●
●
●
●
●
●
●
●
●
●●
●
●
●
●
●
●
●
●
●
● ●
●
●
●
●
●
●
●
●
●
●
●
●
●
●
●
●
●
●
●
●
●
●
●
●
●
●
●
●
●
●
●
●
●
●
●
●
●
●
●
●
●
●
●
●
●
●
●
●
●
●
●
●
●
●
●
●
●
●
●
●
●
●
●
●
●●
●
●
●
●
●
●
●
●
●
●
●
●
●
●
●
●
●
●
●
●
●
●
●
●
●
●●
●
●
●
●
●
●
●
●
●
●
●
●
●
●
●
●
●
●
●
●
●
●●
●
●
●
●
●
●
●
●
●
●
●
●
●
●
●
●
●
●
●
●
●
●
●
●
●
●
●
●
●
●
●
●
●
●
●
●
●
●
●
●
●
●
●
●
●
●
●
●
●
●
●
●
●
●
●
●
●
●
●
●
●
●
●
●
●
●
●
●
●
●
●
●
●
●
●●
●
●
●
●
●
●
●
●
●
● ●
●
●
●
●
●
●
●
●
●
● ●
●
●
●
●
●
●
●
●
●●
●
●
●
●
●
●
●
●
●
●
●
●
●
●
●
●
●
●●
●
●
●
●●
●
●
●
●
●
●
●
●
●
●
●
●
●
●
●
●
●
●
●
●
●
●
●
●
●
●
●
●
●
●
●
●
●
●
●
●
●
●
●
●
●
●
●
●
●
●
●
●
●
●
●●
●
●
●
●
●
●
●
●
●
●
●
●
●●
●●
●
●
●
●
●
●●
●
●
●
●
●
●
●
●
● ●
●
●
●
●
●
●
●
●
●
●
●
●
●
●
●
●
●
●
●
●
●
●
●
●
●
●
●
●
●
●
●
●
●
●
●
● ●
●
●
●
●
●
●
●
●
●
●
●
●
●
●
●
●
●
●
●
●
●
●
●●
●
●
●
●
●
●
●
●
●
●
●
●
● ●
●
●
●
●
●
●
●
●
●
●
●
●
●
●
●
●
●
●
●
●
●
●
●
●
●
●
●
●
●
●
●
●
●
●
●
●
●
●
●
●
●●
●
●●
●
●
●
●
●
●
●
●
●
●
●
●
●
●
●
●
●
●
●
●
●●
●
●
●
●
●
●
●
●
●
●
●
●
●
●
●
●
●
●
●
●
●
●
●
●
●
●
●
●
●
●
●
●
●
●
●
●
●
●
●
●
●
●
●
●
●
●
●
●
●
●
●
●
●
●
●
●
●
●
●
●●
●
●
●
●
●
●
●
●
●
●
●
●
●
●
●
●
●
●
●
●
●
● ●
●●
●
●
●
●
●
●
●
●
●
●
●
●
●
●
●
●
●
●
●
●
●
●
●
●
●
●
●
●
●
●
●
●
●
●
●
●
●
●
●
●
●
●●
●
●
●
●
●
●
●
●
●
●
●
●
●
●
●
●
●
●
●
●
●
●
●
●
●
●
●
●
●
●
●
●
●
●
●
●●
●
●
●
●
●
●
●
●
●
●
●
●
●
●
●
●
●
●
●
●
●
●
●
●
●
●
●
●
●●
●
●
●
●
●●
●
●
●
●
●
●
●
●
●
●
●
●
●
●
●
●
●
●
●
●
●
● ●
●
●
●
●
●
●
●
●
●
●
●
●
●
●
●
●
●
●
●
●
●
●
●●
●
● ●
●●
●
●
●
●
●
●
●
●
●
●
●
●
●
●
●
●
●
●
●
●●
●
●
●
●
●
●
●
●●
●
●
●
●
●
●
●
●
●
●
●
●
●
●
●
●
●
●
●
●
●
●
●
●●
●
●
●
●
●
●
●
●
●
●
●
●
●
●
●
●
●
●
●
●
●
●
●
●
●
●
●
●
●
●
●
●
●
●
●●
●
●
●
●
●
●
●
●
●
●
●
●
●
●
●
●
●
●
●
●
●
●
●
●
●
●
●
●
●
●
●
●
●
●
●
●
●
●
●
●
●
●
●
●
●
●
●
●
●
●
●
●●
●
●
●
●
●
●
●
●
●
●
●
●●
●
●●
●
●
●
●
●
●
●
●
●
●
●
●
●
●
●
●
●
●
●
●
●
●
●
●
●
●
●
●
●
●
●
●
●
●
●
●
●
●
●
●
●
●
●
●
●
●●
●
●
●
●
●●
●
●
●
●
●
●
●
●
●
●
●
●
●
●
●
●
●
●
●
●
●
●
●
●
●
●
●
●
●
●
●
●
●
●
●
●
●
●
●
●
●
●
●
●
●
●
●
●
●
●
●
●
●
●
●
●
●
●
●
●
●
●
●
●
●
●
●●
●
●
●
●
●
●
●
●
●
●
●
●
●
●
●
●
●
●
●
●
●
●
●
●
●
●
●
●
●
●
●
●
●
●
●
●
●
●
●
●
●
●
●
●
●
●
●
●
●
●
●
●
●
●
●
●
●
●
●
●
●
●
●
●
●
●
●
●
●
●
●
●
● ●●
●
●
●●
●
●
●
●
●● ●
●
●
●
●
●
●
●
●
●
●
●●
●
●
●
●
●
●
●
●
●
●
●
●
●
●
●
●
●
●
●
●
●
●
●
●
●
●
●
●
●
●
●
●
●
●
●
●
●
●
●
●
●
●
●
●
●
●
●
●
●
●
●
●●
●
●
●
●
●
●
●
●
●
●
●
●
●
●
●
●
●
●
●
●
●
●
●
●
●
●
●
●
●
●
●
●
●
●
●
●
●
●
●
●
●
●
●
●
●
●
●
●
●
●
●
●
●
●
●
●
●
●
●
●
●
●
●
●
●
●
●
●
●
●
●
●
●
●
●
●
●
●
●
●
●
●
●
●
●
●
●
●●
●●
●
●
●
●
●
●
●
●
●
●
●
●
●
●
●
●
●
●
●
●
●
●
●
●
●
●
●
●
●
●
●
●
●●
●
●
●
●
●
●
●
●
●
●●
●
●
●
●
●
●
●
●
●
●
●
●
●
●
●
●
●
●
●
●
●
●
●
●
●
●●
●
●
●
●
●
●
●
●
●
●
●
●
●
●
●
●
●
●
●
●
●
●
●
●
●
●
●●
●
●
●
●
●
●
●
●
●
●●
●
●
●
●
●
●
●
●
●
●
●
●
●
●
●
●
●
●
●
●
●
●
●
●
●
●
●
●
●●
●
●
●
●
●
●
●
●
●
●
●
●
●
●
●
●
●
●
●
●
●
●
●
●
●
●
●
●
●
●
●
●
●
●
●
●
●
●
●
●
● ●
●
●
●
●
●●
●
●
●
●
●
●
●
●
●
●
●
●
●
●●
●
●
●
●
●
●
●
●
●
●
●
●
●
●
●
●
●
●
●
●
●
●
●
●
●
●
●
●
●
●
●
●
●
●
●
●
●
●
●
●
●
●●
●
●
●
●
●
●
●
●
●
●
●
●
●
●
●
●
●
●
●
●
●
●
●●
●
●
●
●
●
●
●
●
●
●
●
●
●
●
●
●
●
●
●
●
●
●
●●
●
●
●
●
●
●
●
●
●
●
●
●
●
●
●
●
●
●
●
●
●
●
●
●
●
●
●
●
●
●
●
●
●
●
●
●
●
●
●
●
●
●
●
●
●
●
●
●
●
●
●
●
●
●
●
●
●
●
●
●
●
●
●
●
●
●●
●
●
●
●
●
●
●
●
●
●
●
●
●
●
●
● ●
●
●
●
●
●
●
●●
●
●
●
●
●
●
●
●
●
●
●
●
●
●
●
●
●
●
●
●
●
●
●
●
●
●
●
●
●
●
●
●
●
●
●
●
●
●
●
●●
●
●
●
●
●
●
●
●
● ●
●
●
●
●
●
●
●
●
●
●
●
●
●
●
●
●
●
●
●
●
●
●
●
●
●
●
●
●
●
●
●
●
●
●
●
●
●
●
●
●
●
●
●
●
●
●
●
●
●
●
●
●
●
●
●
●
●
●
●
●
●
●
●
●
●
●
●
●
●
●
●
●
●
●
●
●●
●
●
●
●
●
●
●
●
●
●
●
●
●
●
●
●
●
●
●
●
●
●
●
●
●
●
●
●
●
●
●
●
●
●
●
●
●
●
●
●
●
●
●
●
●
●
●
●
●
●
●
●
●
●
●●
●
●
●
●
●
●
●
●
●
●
●
●
●
●
●
●
●
●
●●
●
●
●
●
●
●
●
●
●
●
●
●
●
●
●
●
●●
●
●
●
●
●
●
●
●
●
●
●
●
●
●
●
●
●
●●
●
●
●
●
●
●
●
●
●
●
●
●
●●
●
●
●
●
●
●
●
●
●
●
●
●
●
●
●
●
●
●
●
●
●
●
●
●
●
●
●
●
●
●
●
●
●
●
●
●
●
●
●
●
●
●
●
●●
●
●
●
●
●●
●
●
●
●
●
●
●
●●
●
●
●
●●
●
●
●
●
●
●
●
●
●
●
●
●
●
●
●
●
●
●
●
●
●
●
●
●
●
●
●
●
●
●
●
●
●
●
●
●
●
●
●
●
●
●
●
●
●
●
●
●
●
●
●
●
●
●
●
●
●
●
●
●
●
●
●
●
●
●
●
●
●
●
●
●
●
●
●
●
●
●
●
●
●
● ●
●
●
●
●
●
●
●
●
●
●
●
●
●
●
●
●
●
●
●
●
●
●
●
●
●
●
●
●
●
●
●
●
●
●
●
●
●
●●
●
●
●
●
●
●
●
●
●
●
●
●
●
●
●
●
●
●
●
●
●
●
●
●
●
●
●
●
●
●
●
●
●
●
●
●
●
●
●
●
●
●
●
●
●
●
●
●
●
●
●
●
●
●
●
●
●
●
●
●
●
●
●
●
●
●
●
●
●
●
●
●
●
● ●
●●
●
●
●
●
●
●
●
●
●
●
●
●
●
●
●
●
●
●
●
●
●
●
●
●
●
●
●
●
●
●
●
●
●
●
●
●
●
●
●
●
●
●●
●
●
●
●
●
●
●
●
●
●
●
●
●
●
●
●●
●
●
●
●
●
●
●
●
●
●
●
●
●
●
●
●
●
●
●
●
●
●
●
●
●
●
●
●
●
●
●
●●
●
●
●
●
●
●
●
●
●
●
●
●
●
●
●
●
●
●
●
●
●
●
●
●●
●
●
●
●
●
●
●
●
●
●
●
●
●
●
●
●
●
●
●
●●
●
●
●
●
●
●
●
●
●
●
●
●
●
●
●
●
●
●
●
●
●
●
●
●
●
●
●
●
●
●
●
●
●
●
●
●
●
●
●
●
●
●
●
●
●
●
●
●
●
●
●
●
●
●
●
●
●
●
●
●
●
●
●
●
●
●
●
●
●
●
●
●
●
●
●
●
●
●
●
●
●
●
●
●● ●
●
●
●
●
●
●
●
●
●
●
●
●
●
●
●
●
●
●
●
●
●
●
●
●
●
●
●
●
●
●
●
●
●
●
●●
●
●
●
●
●
●
●
●●
●
●
●
●
●
●
●
●
●
●
●
●
●
●
●
●
●
●
●
●
●
●
●
●
●
●
●
●
●
●
●
●
●
●
●
●
●
●
●
●
●
●
●
●
●●
●
●
●
●
●
●
●
●
●
●
●
●
●
●
●
●
●
●
●
●
●
●
●
●
●
●
●
●
●
●
●
●
●
●
●
●
●
●
●
●●
●
●●
●
●
●
●
●
●
●
●
●
●
●
●
●
●
●
●
●
●
●
●
●
●
● ●
●
●
●
●
●
●
●
●
●
●
●
●
●
●
●
●
●
●
●
●
●
●
●
●
●
●
●
●
●
●
●
●
●
●
●
●
●
●
●
●
●
●
●
●
●
●
●
●
●
●
●
●
●
●●
●
●
●
●
●
●
●●
●
●
●
●
●
●
●
●
●
●
●
●
●
●
●
●
●
●
●
●
●
●
●
●●
●
●
●
●
●
●
●
● ●
●
●
●
●
●
●
●
●
●
●
●
●
●
●●
●
●
●
●
●
●
●
●
●
●
●
●
●
●
●
●
●
●
●
●
●
●
●
●
●
●
●
●
●
●
●
●
●
●●
●
●
●
●
●
●
●
●
●
●
●
●
●
●
●
●
●
●
●
●
●
●
●
●
●
●
●
●
●
●
●
●
●
●
●
●
●
●
●
●
●
●
●
●
●
●
●
●
●
●
●
●
●
●
●
●
●
●
●
●
●
●
●
●
●
●
●
●
●
●
●
●
●
●
●
●
●
●
●
●
●
●
●
●
●
●
●
●
●
●
●●
●
●
●
●
●
●
●
●
●
●
●
●
●
●●
●
●
●
●
●
●
●
●
●
●
●
●
●
●
●
●
●
●●
●
●●
●
●
●
●
●
●
●
●
●
●
●
●
●
●
●
●
●
●
●
●
●
●
●
●
●
●
●
●
●
●
●
●
●
●
●
●
●
●
●
●
●
●
●
●
●
●
●
●
●
●
●
●
●
●
●
●●
●
●●
●
●
●
●
●
●
●
●
●
●
●
●
●
●●
●
●
●
●
●
●
●
●
●●
●
●
●
●
●
●
●
●
●
●
●
●
●
●
●
●
●
●
●
●
●●
●
●
●
●
●
●
●
●
●
●
●
●
●
●
●
●
●
●
●
●
●
●
●
●
●
●
●
●
●
●
●
●
●
●
●
●
●
●
●
●
●
●
●
●
●
●
●
●
●
●
●
●
●
●
●
●
●
●
●
●
●
●
●●
●
●
● ●
●
●
●
●
●
●
●
●
●
●
●
●
●
●
●
●●
●
●
●
●
●
●
●
●
●
●●
●
●
●
●●
●
●
●
●
●
●
●
●
●
●
●
●
●
●
●
●
●
●
●
●
●
●
●
●
●
●
●
●
●
●
●
●
●
●
●
●
●
●
●
●
●
●
●
●
●
●
●
●
●
●
●
●
●
●
●
●
●
●
●
●
●
●
●
●
●
●
● ●
●
●
●●
●
●
●
●
●
●
●
●
●●
●
●
●
●
●
●
●
●
●
●
●
●
●
●
●
●
●
●
●
●
●
●
●
●
●
●
●
●
●
●
●
●
●
● ●
●
●
●
●
●
●
●
●
●
●
●
●
●
●
●
●
●
●
●
●
●
●
●●
●
●
●
●
●
●
●
●
●
●
●
●
●
●
●
●
●
●
●
●
●
●●
●
●
●
●
●
●
●
●
●
●
●
●
●
●
●
●
●
●
●
●
●
●
●●
●
●
●
●
●
●
●
●
●
●
●
●
●
●●
●
●
●
●
●
●
●
●
●
●
●
●
●
●
●
●
●
●●
●
●
●
●
●
●●
●
●
●
●
●
●
●●
●
●
●
●
●
●
●
●
●
●
●
●
●
●
●
●
●
●
●
●
●
●
●
●
●
●
●
●
●
●
●
●
●
●
●
●
●
●
●
●
●
●
●
●
●
●
●
●
●
●
●
●
●
●●
●
●
●
●
●
●
●
●
●
●●
●
●
●
●
●
●
●
●
●
●
●
●
●
●
●
●
●
●
●
●
●●
●
●
●
●
●
●
●
●
●
●
●
●
●
●
●
●
●●
●
●
●
●
●
●
●
●
●●
●
●
●
●
●
●
●
●
●
●
●
●
●
●
●
●
●
●
●
●
●
●
●
●
●
●
●
●
●
●
●
●
●
●
●
●
●
●
●
●
●
●
●
●
●
●
●
●
●
●
●
●
●●
●
●
●
●
●
●
●
●
●
●
●
●
●
●
●
●
●
●
●●
●
●●
●
●
●
●
●
●
●
●
●
●
●
●
●
●
●
●
●
●
●
●
●
●
●
●
●
●
●
●
●
●
●
●
●
●
●
●
●
●
●
●
●
●
●
●
●
●
●
●
●
●
●
●
●
●
●●
●
●
●
●
●
●
●
●
●
●
●
●
●
●
●
●
●
●
●●
●
●
●
●
●
●
●
●
●
●
●
●
●
●
●
●
●
●
●
●
●
●
●
●
●
●
●
●
●
●
●
●
●
●
●
●
●
●
●
●
●
●
●
●
●
●
●
●
●
●
●
●
●
●
●
●
●
●
●
●
●
●
●
●
●
●
●
●
● ●
●
●
●
●
●
●
●
●
●
●
●
●
●
●
●
●
●
●
●
●
●
●
●
●
●
●
●
●
●
●
●
●
●
●
●
●
●
●
●
●
●
●
● ●
●
●
●
●
●
●
●
●
●
●
●
●
●
●
●
●
● ●
●
●
●
●
●
●
●
●
●
●
●
●
●
●
●
●
●
●
●
●
●
●
●
●
●
●
●
●
●
●
●
●
●
●
●
●
●
●
●
●
●
●
●
●
●●
●
●
●
●
●
●
●
●
●
●●
●
●
●
●
●
●
●
●
●
●
●
●
●
●
●
●
●
●
●
●
●
●
●
●
●
●
●
●
●
●
●
●
●
●
●
●
●
●
●
●
●
●
●
●
●
●
●
●
●
●
●
●
●
●
●
●
●
●
●
●
●
●
●
●
●●
●
●
●
●
●
●
●
●
●
●
●●
●
●
●
●
●
●
●
●
●
●
●
●
●
●
●
●
●
●
●
●
●
●
●●
●
●
●
●
●
●
●
●
●
●
● ●
●
●
●
●
●
●
●
●
●
●
●
●
●
●
●
●
●
●
●●
●
●
●
●
●
●
●●
●
●
●
●
●
●
●
●
●
●
●
●
●
●
●
●
●●
●
●
●
●
●
●
●
●
●
●
●
●
●
●
●
●
●
●
●
●
●
●
●
●
●
●
●
●
●
●
●
●
●
●
●
●
●
●
●●
●
●
●
●
●
●
●
●
●
●
●
●
●
●
●
●
●
●
●
●
●
● ●
●
●
●
●
●
●
●
●
●
●
●
●●
●
●
●
●
●
●
●
●
●
●
●
●
●
●
●
●
●
●
●
●
●
●
●
●
●
●
●
●
●
●
●●
●
●
●
●
●
●
●
●
●
●
●
●
●
●
●
●
●
●
●
●
●
●
●
●
●
●
●
●
●●
●
●
●
●
●
●
●
●
●
●
●
●
●
●
●
●
●
●
●
●
●
●
●
●
●
●
●
●
●
●
●
●
●
●
●
●
●
●
●
●
●
●
●
●
●
●
●
●
●
●
●
●
●
●
●
●
●
●
●
●
●
●
●
●
●
●
●
●
● ●
●
●
●
●
●
●
●●
●
●
●
●
●
●
●
●
●
●
●
●
●
●
●
●
●
●
●
●
●
●
●
●●
●
●
●
●
●
●
●
●
●
●
●
●
●
●
●
●
●
●
● ●
●
●
●
●
●
●
●
●
●
●
●
●
●
●
●
●
●
●
●
●
●
●●
●
●
●
●
●
●
●
●
●
●
●
●
●
●
●
●
●
●
●
●
●
●
●
●
●
●
●●
●
●
●
●
●
●
●
●
●
●
●
●
●
●
●
●
●
●
●
●
●
●
●
●
●
●
●
●
●
●
●
●
●
●
●●
●
●
●
●
●
●
●
●
●
●
●
●
●
●
●
●
●
●
●
●
●
●
●
●
●
●
●
●
●
●
●
●
●
●
●
●
●
●
●
●
●
●
●
●
●
●
●
●
●
●
●
●
●
●
●
●
●
●
●
●
●
●
●
●
●
●
●
●
●
●
●
●
●
●
●
●
●
●
●
●
●
●
●
●
●
●
●
●
●
●
●
●●
●
●
●●
●
●
●
●
●
●
●
●
●
●
●
●
●
●
●
●
●
●●
●
●
●
●
●
●
●
●
●
●
●
●
●
●
●
●
●
●
●
●
●
●
●
●
●
●
●
●
●
●
●
●
●
●
●
●
●
●
●
●
●
●
●
●
●
●
●
●
●
●
●
●
●
●
●
●
●
●
●
●
●
●
●
●
●
●
●
●
●
●
●
●
●
●
●
●
●
●
●
●
●
●
●
●
●
●
●
●
●
●
●
●
●●
●
●
●
●●
●
●
●
●
●
●
●
●
●
●
●
●
●
●
●
●
●
●
●
●
●
●
●
●
●
●●
●
●
●
●
●
●
●
●
●
●
●
●
●
●
●
●
●
●
●
●
●
●
● ●
●
●
●
●
●
●
●
●
●
●
●
●
●
●
●
●
●
●
●
●
●
●
●
●
●
●
●
●
●
●
●
●
●
●
●
●
●
●
●
●
●
●
●
●
●
●
●
●
●
●
●
●
●
●
●
●
●
●
●
●
●
●
●
●
●
●
●
●
●
●
●
●
●
●
●
●
●
●
●
●
●
●
●
●
●
●
●
●
●
●
●
●
●
●
●
●
●
●
●
●
● ●
●
●
●
●
● ●
●
●
●
●
●
●
●
●
●
●
●
●
●
●
●
●
●
●
●
●
●
●
●
●
●
●
●
●
●
●
●●
●
●
●
●
●
●
●
●
●
●
●
●
●
●
●
●
●
●
●
●
●
●
●
●
●
●
●
●
●
●
●
●
●
●
●
●●
●
●
●
●
●
●
●
●
●
●
●
●
●
●
●
●
●
●
●
●
●
●
●
●
●
●
●
●
●
●
●
●
●
●●
●
●
●
●
●
●
●
●
●
●
●
●
●
●
●
●●
●
●
●
●
●
●
●
●
●
●
●
●
●
●
● ●
●
●
●
●
●
●
●
●
●
●
●●
●
●
●
● ●
●
●
●
●
●
●
●
●
●
●
●
●
●
●
●
●
●
●
●●
●
●
●
●
●
●
●
●
●
●
●
●
●
●
●
●
●●
● ●
●
●
●
●
●
●
●
●
●
●
●
●
●
●
●
●
●
●
●
●
●
●
●
●
●
●
●
●
●
●
●
●
●
●
●
●
●
●
●
●
●
●
●
●
●
●
●
●
●
●
●
●
●
●
●
●
●
●
●●
●
●
●
●
●
●
●
●
●
●
●
●
●
●
●
●
●
●
●
●
●
●
●
●
●
●
●
●
●
●
●
●
●
●
●
●
●
●
●
●
●
●
●
●
●
●
●
●
●
●
●
●
●
●
●
●
●
●
●
●
●
●
●
●
●
●
●
●
●
●
●
●
●
●
●●
●
●
●
●
●
●
●
●
●
●
●
●
●
●
●
●
●
●●
●
●
●
●
●
●
●
●
●
●
●
●
●
●
●
●●
●
●
●
●
●
●
●
●
●
●
●
●
●
●
●
●
●
●●
●
●
●
●
●
●
●
●
●
●
●
●
●
●
●
●
●
●
●
●
●
●
●
●●
●
●
●
●●
●
●
●
●
●
●
●
●
●
●
●
●
●
●
●
●
●
●
●
●
●
●
●
●
●
●
●
●
●
●
●
●
●
●
●
●
●
●
●
●
●
●
●
●
●
●
●
●
●
●
●
●
●
●
●
●
●
●
●
●
●
●
●
●
●
●
●
●
●
●
●
●
●
●
●
●
●
●
●
●
●
●
●
●
●
●
●●
●
●
●
●
●
●
●
●●
●
●
●
●
●
●
●
●
●
●
●
●
●
●
●
●
●
●
●
●
●
●
●
●
●
●
●
●
●
●
●
●
●
●
●
●
●
●
●
●
●
●
● ●
●
●
●
●
●
●
●
●
●
●
●
●
●
●
●
●
●
●
●
●
●
●
●
●
●
●
●●
●
●
●
●
●
●
●
●
●
●
●
●
●
●
●
●
●
●
●
●
●
●
●
●
●
●
●
●
●
●
●
●
●
●
●
●
●
●
●
●
●
●
●
●
●
●
●
●
●
●
●
●
●
●
●
●
●
●
●
●
●
●
●
●
●
●
●
●
●
●
●
●
●
●
●
●●
●
●
●
●
●
●
●
●
●
●
●
●
●●
●
●
●
●
●
●
●
●
●
●
●
●
●
●
●
●
●
●
●
●
●●
●
●
●
●
●
●
●
●
●
●
●
●
●
●
●
●
●
●
●
●
●
●●
●
●
●
●
●
●
●
●
●
●
●
●
●
●
●
●
●
●
●
● ●
●
●●
●
●
●
●
●
●
●
●
●
●
●
●
●●
●
●
●
●
●
●
●
●
●
●
●
●
●
●
●
●
●
●
●
●
●
●
●
●
●
●
●
●
●
●
●
●
●
●
●
●
●
●
●
●
●
●
●
●
●
●
●
●
●
●
●
●
●
●●
●
●
●
●
●
●
●
●
●
●
●
●
●
●
●
●
●
●
●
●
●
●
●
●
●
●
●
●
●
●
●
●
●
●
●
●
●
●
●
●
●
●
●
●
●
●
●
●
●
●
●
●
●
●
●
●
●
●
●
●
●
●
●
●
●
●
●
●
●
●
●
●
●
●
●
●
●
●
●
●
●
●
●
●
●●
●
●
●●
●
●
●
●
●
●
●
●
●
●
●
●
●
●
●
●
●
●
●
●
●
●
●
●
●
●
●
●
●
●
●
●
●
●
●
●
●
●
●
●
●
●
●
●
●
●
●
●
●
●
●
●
●
●
●
●
●
●
●
●
●
●
●
●
●
●
●
●
●
●
●
●
●
●
●
●
●
●
●
●
●
●
●
●
●
●
●
●
●
●
●
●
●
●
●
●
●
●
●
●
●
●
●
●
●
●
●
●
●
●
●
●
●
●
●
●
●
●
●
●
●
●
●
●
●
●
●
●
●
●
●
●
●
●
●
●
●
●
●●
●
●
●
●
●
●
●
●
●
●
●
●
●
●
●
●
●
●
●
●
●
●
●
●
●
●
●
●
●
●
●
●
●
●
●
●
●
●
●
●
●
●
●
●
●
●
●
●●
●
●
●
●
●
●
●
●
●
●
●
●
●
●
●
●
●
●
●
●
●
●
●
●
●
●
●
●
●
●
●
●
●
●
●
●
●
●
●
●
●
●
●
●
●
●
●
●
●
●
●●
●
●
●
●
●
●
●
●
● ●
●
●
●
●
●
●
●
●
●
●
●
●
●
●
●
●
●
●
●
●
●
●
●
●
● ●
●
●
●
●
●
●
●
●
●
●
●
●
●
●
●
●
●
●
●
●
●
●
●
●
●
●
●
●
●
●
●
●
●
●
●
●
●
●●●
●
●
●
●
●
●
●
●
●
●
●
●
●
●
●
●
●
●
●
●
●
●
●
●
●
●
●
●
●
●
●
●●
●
●
●
●
●
●
●
●
●
●●
●
●
●
●
●
●
●
●
●
●
●
●
●
●●
●
●
●
●
●
●
●
●
●
●
●
●
●
●
●
●
●
●
●
●
●
●
●
●
●
●
●
●
●
●
●
●
●
●
●
●
●
●
●
●
●
●
●●
●
●
●
●
●
●
●
●
●
●
●
●
●
●
●
●
●
●
●
●
●
●
●
●
●
●
●
●
●
●
●
●
●
●
●
●
●
●
●
●
●
●
●
●
●
●
●
●
●
●
●
●
●
●
●
●
●
●
●
●
●
●
●
●
●
●
●
●
●
●
●
●
●
●
●
●●
●
●
●
●
●
●
●
●
●
●
●
●
●
●
●
●
●
●
●
●
●
●
●
●
●
●
●
●
●
●
●
●
●
●
●
●
●
●
●
●●
●
●
●
●
●
●
●
●
●
●●
●
●
●
●
●
●
●
●
●
●
●
●
●●
●
●
●
●
●
●
●
●
●
●
●
●
●
●
●
●
●
●
●
●
●
●
●
●
●
●
●
●
●
●
●
●
●
●
●
●
●
●
●
●
●
●
●
●
●
●
●
●
●
●
●
●
●
●
●
●
●
●
●
●
●
●
● ●
●
●
●
●
●
●
●
●
●
●
●
●
●
●
●
●
●
●
●
●
●
●
●
●
●
●
●
●
●
●
●
●
●
●
●
●
●
●
●
●
●
●
●
●
●
●
●
●
●
●
●
●
●
●
●
●
●
●
●
●
●
●
●
●
●
●
●
●
●
●
●
●
●
●
●
●
●
●
●
●
●
●
●
●
●
●
●
●
●
●
●
●
●
●
●
●
●
●
●
●
●
●
●
●
●
●
●
●
●
●
●
●
●●
●
●
●
●
●
●
●
●
●
●
●
●
●
●
●
●
●
●
●
●
●
●
●
●●
●
●
●
●
●
●
●
●
●
●
●
●
●
●
●
●
●
●
●
●
●
●
●
●
●
●
●
●
●
●
●
●
●
●
●
●
●
●
●
●
●
●
●
●
●
●
●
●
●
●
●
●
●
●
●
●
●
●
●
●
●
●
●● ●●
●
●
●
●
●
●
●
●
●
●
●
●
●●
●
●
●
●
●
●
●
●
●
●
●
●
●
●
●
●●
●
●
●
●●
●
●
●
●
●
●
●
●
●
●
●
●
●
●
●●
●
●
●
●
●
●
●
●
●
●
●
●
●
●
●
●
●
●
●
●
●
●
●
●
●
●
●
●
●
●
●
●
●
●
●
●
●
●
●
●
●
●
●
●
●
●
●●
●
●
●
●
●
●
●
●
●
●
●
●
●
●
●
●
●
●
●
●
●
●
●
●
●
●
●
●
●
●
●
●
●
●
●
●
●
●
●
●
●
●
●
●
●
●
●
●
●
●
●
●
●
●
●
●
●
●
●
●
●
●
●
●
●
●
●
●
●
●
●
●
●
●
●
●
●
●
●
●
●
●
●●
●
●
●
●
●
●
●
●
●
●
●●
●
●
●
●
●
●
●●
●
●
●
●
●
●
●●
●
●
●
●
●
●
●
●
●
●
●
●
●
●
●
●
●
●
●
●
●
●
●
●
●
●
●
●
●
●
●
●
●
●
●
●
●
●
●
●
●
●
●
●
●
●
●
●
●
●
●
●
●
●
●
● ●
●
●
●
●
●
●
●
●
●●
●
●
●
●
●
●
●
●
●
●
●
●
●
●
●
●
●
●
●
●
●
●
●
●
●
●
●
●
●
●
●
●
●
●
●
●
●
●
●
●
●
●
●
●
●
●
●
●
●
●
●
●
●
●
●
●
●
●
●
●
●
●
●
●
●
●
●
●
●
●
●
●
●
●
●
●
●
●
●
●
●
●
●
●
●
●
●
●
●
●
●
●
●
●
●
●
●
●
●
●
●
●
●
●
●
●
●
●
●
●
●
●
●
●
●
●
●
●
●
●
●
●
●
●
●
●
●
●
●
●
●
●
●
●
●
●
●
●
●
●
●
●
●
●
●
●
●
●
●
●
●
●
●
●
●
●
●
●
●
●
●
●
●
●
●
●
●
●
●
●
●
●
●
●
●
●
●
●
●
●
●
●
●
●●
●
●
●
●
●
●
●
●
●
●●
●
●
●
●
●
●
●
●
●
●
●
●
●
●
●
●
●
●
●
●
●
●
●
●
●
●
●
●
●
●
● ●
●
●
●
●
●
●
●
●
●
●
●●
●
●
●
●
●
●
●
●
●
●
●
●
●
●
●
●
●
●
●
●
●
●
●
●
●
●
●
●
●
●
●
●
●
●
●
●
●
●
●
●
●
●
●
●
●
●
●
●
●
●
●
●
●
●
●
●
●
●
●
●
●
●
●
●
●
●
●
●
●
●
●
●
●
●
●
●
●
●
●
●
●
●
●
●
●
●
●
●
●
●
●
●
●
●●
●
●
●
●
●
●
●
●
●
●
●
●
●
●
●
●
●
●
●
●
●
●●
●●
●
●
●
●
●
●
● ●
●
●
●
●
●
●
●
●
●
●
●
●
●
●
●
●
●
●
●
●
●
●
●
●
●
●
●
●
●
●
●
●
●
●
●
●
●
●
●
●
●
●
●
●
●
●
●
●
●
●
●
●
●
●
●
●
●
●
●
●
●
●
●
●
●
●
●
●
●
●
●
●
●
●
●
●
●
●
●
●
●
●
●
●
●
●
●
●
●
●
●
●
●
●
●
●
●
●
●
●
●
●
●
●
●
●
●
●
●
●
●
●
●
●
●
●
●
●
●
●
●
●
●
●
●
●
●
●
●
●
●
●
●
●
●
●
●
●
●
●
●
●
●
●
●
●
●
●
●
●
●
●
●
●
●
●
●
●
●
●
●
●
●
●
●
●
●●
●
●
●
●
●
●
●
●
● ●
●
●
●
●●
●
●
●
●
●
●
●
●
●
●
●
●
●
●
●
●
●
●
●
●
●
●
●
●
●
●
●
●
●
●
●
●
●
●
●●
●
●
●
●
●
●
●
●
●
●
●
●
●
●
●
●
●
●
●
●
●
●●
●
●
●
●
●
●
●
●
●
●
●
●
●
●
●
●
●
●
●●
●
●
●
●
●
●
●
●
●
●
●
●
●
●
●
●
●
●
●
●
●
●
●
●
●
●
●
●
●
●
●
●
●
●
●
●
●
●
●
●
●
●
●
●
●
●
●
●
●
●
●
●
●
●
●
●
●
●
●
●
●
●
●
●
●
●
●
●
●
●
●
●
●
●
●
●
●
●●
●
●
●
●
●
●
●
●
●
●
●
●
●
●
●
●
●
●
●
●
●
●
●
●
●
●
●
●
●
●
●
●
●
●
●
●
●
●●
●
●
●
●
●
●
●
●
●
●
●
●
●
●
●
●
●●
●
●
●
●
●
●
●
●
●
●
●
●
●
●
●
●
●
●
●● ●
●
●
●
●
●
●
● ●
●
●
●
●
●●
●
●
●
●
●
●
●
●●
●
●
●
●
●
●
●
●
●
●
●●
●
●
●
●●
●
●
●
●
●
●
●
●
●
●
●
●
●
●
●
●
●
●
●
●
●
●
●
●
●
●
●●
●●
●
●
●
●
●
●
●
●
●
● ●
●
●
●
●●
●
●
●
●
●
●
●
●
●
●
●
●
●
●
●
●
●
●
●
●
●
●
●
●
●
●
●
●
●
● ●
●
●
●
●
●
●
●
●
●
●
●
●
●
●
●
●
●
●
●
●
●
●
●
●
●
●
●
●
●
●
●
●
●
●
●
●
●
●
●
●
●
●
●
●
●
●
●
●
●
●
●
●
●
●
●
●
●
●
●
●
●
●
●
●
●
●
●
●
●
●
●
●
●
●
●
●
●
●
●
●
●
●
●
●
●
●
●
●
●●
●
●
●
●
●
●
●
●
●
●
●
●
●
●
●
●
●
●
●
●
●
●
●
●
●
●
●
●
●
●●
●
●
●
●
●
●
●
●
●
●
●
●
●
●
●
●
●
●
●
●
●
●
●
●
●
●
●
●
●
●
●
●●
●
●
●
●
●
●
●
●
●
●
●
●
●
●
●
●
●
●
●
●
●
●
●
●
●
●
●
●
●
●
●
●
●
●
●
●
●
●
●
●
●
●
●
●
●
●
●●
●
●
●
●
●
●
●
●
●
●
●
●
●
●
●
●
●
●
●
●
●
●
●●
●
●
●
●
●
●
●
●
●
●
●
●
●
●
●
●
●
●
●
●
●
●
●
●
● ●
●
●
●
●
●
●
●
●
●
●
●
●
●
●
●
●
●
●
●
●
●
●
●
●
●
●
●
●
●
●
●
●
●
●
● ●
●
●
●
●
●●
●
●
●
●
●
●
●
●
●
●
●
●
●
●
●
●
●
●
●
●
●
●
●
●
●
●
●
●
●
●
●
●
●
●
●
●
●
●
●
●
●
●
●
●
●
●
●
●
●
●
●
●●
●
●
●
●
● ●
●
●
●
●
●
●
●
●
●
●
●
●
●
●
●
●
●
●
●
●
●
●
●
●
●
●
●
●
●
●
●
●
●
●
●
●
●
●
●
●
●
●
●
●
●
●
●
●
●
●
●
●
●
●●
●
●
●
●●●
●●
●
●
●
●
●
●
●
●
●
●
●
●
●
●
●
●
●
●
●
●
●
●
●
●
●
●
●
●
●
●
●
●
●
●
●
●
●
●
●
●
●
●
●
●
●
●
●
●
●
●
●
●
●
●
●
●
●
●
●
●
●
●
●
●
●
●
●
●
●
●
●
●
●
●
●
●
●
●
●
●
●
●
●
●
●
●
●
●
●
●
●
●
●
●
●
●
●
●
●
●
●
●
●
●
●
●
●
●
●
●
●
●
●
●
●
●
●
●
●
●
●
●
●
●
●
●
●
●
●
●
●
●
●
●
●
●
●
●
●
●
●
●
●
●
●
●
●
●
●
●
●
●
●
●
●
●
●
●
●
●
●
●
●
●●
●
●
●
●
●
●
●
●
●
●
●
●
●
●
●
●
●
●
●
●
●
●
●
●
●
●
●
●
●
●
●
●
●
●
●
●
●
●
●
●
●
●
●
●
●
●
●
●
●
●
●
●
●
●
●●
●
●
●
●
● ●●
●
●
●●
●
●
●
●
●
●
●
●
●
●
●
●
●
●
●
●
●
●
●
●
●
●
●
●●
●
●
●
●
●
●● ●
●
●
●
●
●
●
●
●
●
●
●
●
●
●
●
●
●
●
●
●
●
●
●
●
●
●
●
●
●
●
●
●
●
●
●
●
●
●
●
●
●
●
●
●
●
●
●
●
● ●
●
●
●
●
●
●
●
●●
●
●
●
●
●
●
●
●
●
●
●
●
●
●
●
●
●
●
●
●
●
●
●
●
●
●
●
●
●
●●
●
●
●
●
●
●
●
●
●
●
●
●
●
●
●
●
●
●
●
●
●
●
●
●
●●
●
●●
●
●
●●
●
●
●
●
●
●
●
●●
●
●
●
●
●
●
●
●
●
●
●
●
●
●
●
●
●
●
●
●
●
●
●
●
●
●
●
●
●
●
●
●●
●
●
●
●
●
●
●
●
●
●
●
●
●
●
●
●
●
●
●
●
●
●
●
●
●
●
●
●
●
●
●
●
●
●
●
●
●
●
●
●
●●
●
●
●
●
●
●
●
●
●
●
●
●
●
●
●
●
●
●
●
●
●
●
●
●
●
●
●
●
●
●
●
●
●
●
●
●
●
●
●
●
●
●
●
●
●
●
●
●
●
●
●
●
●
●
●
●
●
●
●
●
●
●
●
●
●
●
●
●
●
●
●
●
●
●
●
●
●●
●
●
●
●
●
●
●
●
●
●
●
●
●
●
●
●
●
●
●
●
●
●
●●
●
●
●
●
●
●
●
●
●
●
●
●
●
●
●
●
●
●
●
●
●●
●
●
●
●
●
●
●
●
●
●
●
● ●
●
●
●
●
●
●
●
●
●
●
●
●
●
●
●
●
●
●
●
●
●
●
●
●
●
●
●
●
●
●
●
●
●
●
●
●
●
●
●
●●
●
●
●
●
●
●●
●
●
●
●
●
●
●
●
●
●
●
●
●
●
●
●
●
●
●
●
●
●
●
●
●
●
●
●
●
●
●
●
●
●
●
●
●
●
●
●
●
●
●
●
●
●
●
●
●
●
●
●
●
●
●
●
●
●
●
●
●
●
●
●●
●
●
●
●
●
●
●
●
●
●
●
●
●
●
●
●
●
●
●
●
●
●
●
●
●
●
●
●
●
● ●
●
●
●
●
●
●
●
●
●●
●
●
●
●
●
●●
●
●
●
●
●
●
●●
●
●
●
●
●
●
●
●
●
●
●
●
●
●
●
●
●
●
●
●
●
●
●●
●
●
●
●
●
●●
●
●
●
●
●
●
●
●
●
●
●
●
●
●
●
●
●
●
●
●
●
●
●
●
●
●
●
●●
●
●
● ●
●
●
●
●
●
●
●
●
●
●
●
●
●
●●
●
●
●
●●
●
●
●●
●
●
●
●
●
●
●
●
●●
●
●
●
●
●
●
●
●
●
●
●
●
●
●
●
●
●
●
●
●
●
●
●
●
●
●
●
●
●
●
●
●
●
●
●
●
●
●
●
●
●
●
●
●
●
●
●
●
●
●
●
●
●●
●●
●
●
●
●
●
●
●
●
●
●
●
●
●
●
●
●
●
●
●
●
●
●
●
●
●
●
●
●
●
●
●
●
●
●
●
●
●
●
●
●
●
●
●
●
●
●
●
●
●
●
●
●
●
●
●
●
●
●
●●
●
●
●
●
●
●
●
●
●
●
●
●
●
●
●
●●
●
●
●
●
●
●
●
●
●
●
●
●
●
●
●
●
●
●
●
●
●
●
●
●
●
●
●
●
●
●
●
●
●
●
●
●
●
●
●
●
●
●
●
●
●
●
●
●
●
●
●
●
●
●
●●
●●
●
●
●
●
●
●
●
●
●
●
●
●
●
●
●
●
●
●
●
●
●
●
●
●
●
●
●
●
●
●
●
●
●
●
●
●
●
●
●
●
●
●
●
● ●
●
●
●
●
●
●
●
●
●
●
●
●
●
●
●
●
●
●
●
●
●
●
●
●
●
●
●
●
●
●
●
●
●
●
●
●
●
●
●
●
●
●●
●
●
●
●
●
●
●
●
●
●
●●
●
●
●
●
●
●
●
●
●
●
●
●
●
●
●
●
●
●
●
●
●
●
●
●
●
●
●●
●
●
●
●
●
●
●
●
●●
●
●
●
●
●
●
●
●
●
●
●
●
●
●
●
●
●
●
●
●
●
●
●
●
●
●
●
●
●
●
●
●
●
●
●
●
●
●
●
●
●
●
●
●
●
●
●
●
●
●
●
●
●
●
●
●
●
●
●
●
●
●
●
●
●
●
●
●
●
●
●
●
●
●
●
●
●
●
●
●
●
●
●
●
●
●
●
●
●
●
●
●
●
●
●
●
●
●
●
●
●
●
●
●
●
●
●
●
●
●
●
●
●
●
●
●
●
●
●
●
●
●
●●
●
●
●
●
●
●
●
●●
●
●
●
●
●
●
●
●
●
●
●
●
●
●
●
●
●
●
●
●
●
●
●
●
●
●
●
●
●
●
●
●
●
●
●
●●
●
●
●
●
●
●
●
●
●
●
●
●
●
●
●
●
●
●
●
●
●
●
●
●
●
●
●
●
●
●
●
●
●
●
●
●
●
●
●●
●
●
●
●
●
●
●
●
●
●
●
●
●
●
●
●
●
●
●
●
●
●
●
●
●
●
●
●●
●
●●
●
●
●
●
●
●
●
●
●
●
●
●
●
●
●
●
●
●
●
●
●●
●
●
●
●
●
●
●
●
●
●
●
●
●
●
●
●●
●
●
●
●●
●
●
●●
●
●
●
●
●●
●
●
●
●
●
●
●
●
●
●
●
●
●
●
●
●
●
●
●
●
●
●
●
●
●
●
●
●
●
●
●
●
●
●
●
●
●●
●
●
●
●
●
●
●
●
●
●
●
●
●
●
●
●
●
●
●
●
●
●
●
●
●●
●
●
●
● ●
●
●
●
●
●
●
●
●
●
●
●
●
●
●
●
●
●●
●
●
●
●●
●
●
●
●
●
●●
●
●
●
●
●
●
●
●
●
●
●
●
●
●
●
●
●
●●
●
●
●
●
●
●
●
●
●
●
●
●
●
●
●
●
●
●
●
●
●
●
●
●
●
●
●
●
●
●
●
●
●
●●
●
●
●
●
●
●
●
●
●
●
●
●
●
●
●
●
●●
●
●
●●
●
●
●
●
●
●
●
●
●●
●
●
●
●
●
●
●
●
●
●
●
●
●
●
●
●
●
●
●
●
●
●
●
●
●
●
●
●
●
●
●
●
●
●
● ●
●
●
●
●
●
● ●
●
●
●
●
●
●
●
●
●
●
●
●
●
●
●
●
●
●
●
●
●
●
●
●
●
●
●
●
●
●
●
●
●
●
●
●
●
●
●
●
●
●
●
●
●
●
●
●
●
●
●
●
●
●
●
●
●
●
●
●
●
●●
●
●
●
●
●
●
●
●
●
●
● ●
●●
●
●
●
●
●
●
●
●
●
●
●
●
●
●
●
●●
●
●
●
●
●
●
●
●
●
●
●
●
●
● ●
●
●
●
●
●
●
●
●
●
●
●
●
●
●
●
●
●
●
●
●
●
●
●
●
●
●
●
●
●
●
●
●
●
●
●
●
●
●
●
●
●
●
●
●
●
●
●
●
●
●
●
●
●
●
●
●
●
●
●
●
●
●
●
●
●
●
●
●
●
●
●
●
●
●
●
●
●
●
●
●
●
●
●
●
●
●
●
●
●
●
●
●
●
●
●
●
●
●
●
●
●
●
●
●
●
●
●
●
●
●
●
●
●
●
●
●
●
●
●●
●
●
●
●
●
●
●●
●
●
●
●
●
●
●
●
●
●
●
●
●
●
●
●
●●
●
●
●
●
●
●
●
●
●
●
●
●
●
●
●
●
●
●
●
●
●
●
●
●
●
●
●
●
●
●
●
●
●
●
●
●●
●
●
●
●
●
●
●
●
●
●
●
●
●
●
●
●
●
●
●
●
●
●
●
●
●
●
●
●
●
●
●
●
●
●
●
●
●
●
●
●
●
●
●
●
●
●
●
●
●
●
●
●●
●
●
●
●
●
●
●
●
●
●
●
●
●●
●
●
● ●
●
●
●
●
●
●
●
●
●●●
●
●
●
●
●
●
●
●
●
●
●
●
●
●
●
●
●
●
●
●
●
●●
●
●
●
●
●
●
●
●
●
●
●
●
●
●
●
●
●
●
●
●
●
●
●
●
●
●
●
●
●
●
●
●
●
●
●
●
●
●
●
●
●
●
●
●
●
●
●
●
●
●
●
●
●
●
●
●
●
●
●
●
●
●
●
●
●
●
●
●
●
●
●
●
●
●
●
●
●
●
●
●
●
●
●
●
●
●
●
●
●
●
●
●
●
●
●
●
●
●
●
●
●
●
●
●
●
●
●
●
●
●
●
●
●
●
●
●
●
●●
●
●
●
●
●
●
●
●
●
●
●
●
●
●
●
●
●
●
●
●
●
●
●
●
●
●
●
●
●
●
●
●
●
●
●
●●
●
●
●
●
●
●
●
●
●
●
●
●
●
● ●
●
●
●
●
●
●●
●
●
●
●
●
●
●
●
●
●
●
●
●
●
●
●
●
●
●
●
●
●
●
●
●
●
●
●
●
●
●
●
●
●
●
●
●
●
●
●
●
●
●
●
●
●
●
●
●●
●
●
●
●
●
●
●
●
●
●
●
●
●
●
●
●
●
●
●
●
●
●
●
●
●
●●
●
●
●
●
●
●
●
●
●
●
●
●
●
●
●
●
●
●
●
●
●
●●
●
●
●
●
●
●
●
●
●
●
●
●
●
●
●
●
●
●
●
●
●
●
●
●
●
●
●
●
●
●
●
●
●
●
●
●
●
●
● ●
●
●
●
●
●
●
●
●●
●
●●
●
●
●
●
●
●
●
●
●
●
●
●
●●
●
●
●
●
●
●
●
●
●
●
●
●
●
●
●
●
●
●
●
●
●
●
●
●
●
●
●
●
●
●
●
●
●
●
●
●
●
●
●●
●
●
●
●
●●
●
●
●
●
●
●
●
●
●
●
●
●
●
●●
●
●
●
●
●
●
●
●
●
●
●
●
●
●
●
●
●
●
●
●
●
●
●
●
●
●
●
●
●
●
●
●
●
●
●
●
●
●
●
●
●
●
●
●
●
●
●
●●
●
●
●
●
●
●
●●
●
●
●
●
●
●
●
●
●
●
●
●
● ●
●
●
●
●
●
●●
●
●
●
●
●
●
●
●
●
●
●
●
●
●
●●
●
●
●
●
●
●
●
●
●
●
●
●
●
●
●
●●
●
●
●
●
●
●
●
●
●
●
●
●
●
●
●
●
●
●
●
●
●
●
●
● ●
●
●
●●
●
●
●
●
●
●
●
●
●
●
●
●
●
●
●
●
●
●
●
●
●
●
●
●
●
●
●
●
●
●
●
●
●
●
●
●
●
●
●
●
●
●
●●
●●
●
●
●
●
●
●
●
●
●
●
●
●
●
●
●●
●
●
●
●
●
●
●
●
●
●
●
●
●
●
●
●
●
●
●
●
●
●●
●
●
●
●
●
●
●
●
●
●
●
●
●
●
●
●
●
●
●
●
●
●
●
●
●
●
●
●●
●
●
●
●
●
●
●
●
●
●
●
●
●
●
●
●
●
●
●
●
●
●
●
●
●
●
●
●
●
●
●
●
●
●
●
●
●
●
●
●
●
●
●
●
●
●
●
●
●
●
●
●
●
●●
●
●
●
●
●
●
●
●
●
●
●
●
●
●
●
●
●
●
●
●
●
●
●
●
●●
●
●
●
●
●
●
●
●
●
●
● ●
●
●
●
●
●
●
●
●
●
●
●
●
●
●
●
●
●
●
●
●
●
●
●
●
●
●
●
●
●
●
●
●
●
●
●
●
●
●
●
●
●
●
●
●
●
●
●
●
●
●
●
●
●
●
●
●
●
●
●
●
●
●
●
●
●
●
●
●
●
●
●
●
●
●
●
●
●
●
●
●
●
●
●
●
●
●
●
●
●
●
●
●
●
●
●
●
●
●
●
●
●●
●
●
●
●
●
●
●
●
●
●
●
●
●
●
●
●
●
●
●
●
●
●
●
●
●
●
●
●
●
●
●
●
●
●
●
●
●
●
●
●
●
●
●
●
●
●
●
●
●
●
●
●
●
●
●
●
●
●
●
●
●
●
●
●
●
●
●
●
●
●
●
●
●
●
●
●
●
●
●
●
●
●
●
●
●
●
●
●
●
●
●
●
●
●
●
●
●
●
●●
●
●
●
●
●
●
●
●
●
●
●
●
●
●
●
●
●
●
●
●
●
●
●
●
●
●
●
●
●
●
●
●
●
●
●
●
●
●
●
●
●
●
●
●
●
●
●
●
●
●
●
●
●
●
●
●
●
●
●
●
●
●
●
●
●
●
●
●
●
●
●
●
●
●
●
●
●
●
●
●
●
●
●
●
●
●
●
●
●
●
●
●
●
●
●
●
●
●
●
●
●
●
●
●
●
●
●
●
●
●
●
●
●
●
●
●
●
●
●
●
●
●
●
●
●
●
●
● ●
●
●
●
●
●
●●
●
●
●
●
●
●
●
●
●
●
●
●
●
●
●
●
●
●
●
●
●
●
●
●
●
●
●
●
●
●
●
●
●
●
●
●
●
●
●
●
●
●
●
●
●
●
●
●
●
●
●
●
●
●
●
●
●
●
●
●
●
●
●
●
●
● ●
●
●
●
●
●
●
●
●
●
●
●
●
●
●●
●
●
●
●
●
●
●
●
●
●
●●
●
●
●●
●
●
●
●
●
●
●
●
●
●
●
●●
●
●
●
●
●
●
●
●
●
●
●
●
●
●
●
●
●
●
●
●
●
●
●
●
●
●
●●
●
●
●
●
●
●
●
●
●
●●
●
●
●
●
●
●
●
●
●
●
●
●
●
●
●
●
●
●
●
●
●
●
●
●
●
●
●
●
●
●
●
●
●
●
●
●
●
●
●
●
●
●
●
●
●
●
●
●
●
●
●
●
●
●
●
●
●
●
●
●
●●
●
●
●
●
●
●
●
●
●
●
●
●
●
●
●
●
●
●
●
●
●
●
●
●
●
●
●
●
●
●
●
●●
●
●
●
●
●
●
●
●
●
●
●
●
●
●
●
●
●
●
●
●
●
●
●
●
●
●
●
●
●
●
●
●
●
●
●
●
●
●
●
● ●
●
●
●
●
●
●
●
●
●
●
●
●
●●
●
●
●
●
●
●
●●
●
●
●
●
●
●
●
●
●
●
●
●
●
●
●
●
●
●
●
●
●
●●
●
●
●
●
●
●
●
●
●
●
●
●
●
●
●
●
●
●
●
●
●
●
●
●
●
●
●
●
●
●
●
●
●
●
●●
●
●
●
●
●
●
●
●
●
●
●
●
●
●
●
●
●
●
● ●●
●
● ●
●
●
●
●
●
●●●
●
●
●
●
●
●
●
●
●●
●
●
●
●
●
●
●
●
●
●
●
●
●
●
●
●
●
●
●
●
●
●
●
●
●
●
●
●
●
●
●
●
●
●
●
●
●
●
●
●
●
●
●
●
●
●●
●
●
●
●
●
●
●
●
●
●● ●
●
●
●
●●
●
●
●
●
●
●
●
●
●
●
●
●
●
●
●
●
●
●
●
●
●
●
●
●
●
●
●
●
●
●
●●
●
● ●
●
●
●
●
●
●●
●
●
●
●
●
●
●
●
●
●
●
●
●
●
●
●
●
●
●
●
●
●
●
●
●
●
●
●
●
●
●
●
●
●
●
●
●
●
●
●
●
●
●
●
●
●
●
●
●
●
●
●
●
●
●
●
●
●
●
●
●
●
●
●●
●
●
●
●
●
●
●
●
●
●
●
●
●
●
●
●
●
●
●
●
●
●
●
●
●
●
●
●
●
●
●
●
●
●
●
●
●
●
●
●
●
●
● ●●
●
●
●
●
●
●
●
●
●
●
●
●
●
●
●
●
●
●
●
●
●
●
●
●
●
●
●
●
●
●
●
●
●
●
●
●
●
●
●
●
●
●
●
●
●
●
●
●
●
●
●
●●
●
●
●
●
●
●
●
●
●
●
●
●
●
●
●
●
●
●
●
●
●
●
●
●
●
●
●
●
●
●
●
●
●
●
●
●
●
●
● ●
●
●
●
●
●
●
●
●
●
●
●
●
●●
●
●
●
●
●
●
●
●
●
●
●
●
●
●
●
●
●
●
●
●
●
●
●
●
●
●
●
●
●
●
●
●
●
●
●
●
●
● ●●
●
●
●
●
●
●
●
●
●
●
●
●
●
●●
●
●
●
●
●
●
●
●
●
●
●
●
●
●
●
●
●●
●
●
●
●
●
●
●
●
●
●
●
●
●
●
●
●
●
●
●
●
●
●
●
●
●●
●
●
●
●
●
●
● ●
●
●
●
●
●
●
●
●
●
●●
●
●
●
●
●
●●
●
●
●●
●
●
●
●
●●
●
●
●
●
●
●
●
●
●
●
●
●
●
●
●
●●
●
●
●
●
●
●
●
●
●
●
●
●
●
●
●
●
●
●
●
●
●
●
●
●
●
●
●
●
●
●
●
●
●
●
●
●
●
●●
●
●
●
●
●
●
●
●
●
●
●
●
●
●
●
●
●
●
●
●
●
●
●
●
●
●
●
●
●
●
●
●
●
●
●
●
●
●
●
●
●
●
●
●
●
●
●
●
●
●
●
●
●
●●●
●
●
●
●
●
●
●
●
●
●
●
●
●
●
●
●
●
●
●
●
●
●
●
●
●
●
●
●
●
●
●
●
●
●
●
●
●●
●
●
●
●
●
●
●
●
●
●
●
●
●
●
●
●
●
●
●
●
●
●
●
●
●
●
●
●
●
●
●
●
●
●
●
●
●
●
●
●
●
● ●
●
●
●
●
●
●
●
●
●
●
●●
●
●
●
●
●
●
●
●
●
●
●
●
●
●
●
●
●
●
●
●
●
●
●
●
●
●
●
●
●
●
●●●
●
●
●
●
●
●
●
●
●
●
●
●
●
●
●
●
●
●
●
●
●
●
●
●
●
●
●
●
●
●
●
●
●
●
●
●
●
●
●
●
●
●
●
●
●
●
●
●
●
●
●
●
●
●
●
●
●
●
●
●
●
●
●
●
●
●
●
●
●
●
●
●
●
●
●
●
●
●
●
●
●
●
●
●
●
●
●
●
●
●
●
●
●
●
●
●
●
●
●
●
●
●
●
●
●
●
●
●
●
●
●
●
●
●
●
●
●
●
●
●
●
●
●
●
●
●
●
●
●
●
●
●
●
●
●
●
●
●
●
●
●
●
●
●
●
●
●
●
●
●
●
●
●
●
●
●
●
●
●
●
●
●
●
●
●
●●
●
●
●
●
●
●
●
●
●
●
●
●
●
●
●
●●
●
●
●
●
●
●
●
●
●
●
●
●
●
●
●
●
●
●
●
●
●
●
●
●
●
●
●
●
●
●
●
●
●
●
●
●
●●
●
●
●
●
●
●
●
●
●
●
●
●
●
●
●
●
●
●
●
●
●
●
●
●
●
●
●
●
●
●
●
●●
●
●
●
●
●●
●
●
●
●
●
● ●
●
●
●
●
●
●
●
●
●
●
●
●
●
●
●
●
●
● ●
●
●
● ●
●
●
●
●
●
●
●
●
●
●
●
●
●
●
● ●
●●
●
●
●
●
●
●
●
●
●
●
●
●
●
●
●
●
●
●
●
●
●
●
●
●
●
●
●
●
●
●
●
●
●
●
●
●
●
●
●
●
●
●
●
●
●
●
●
●
●
●
●
●
●
●
●
●
●
●
●
●
●
●
●
●
●
●
●●
●
●
●
●
●
●
●
●
●
●
●
● ●
●
●
●
●
●
●
●●●
●
●
●
●
●
●
●
●
●
●
●
●
●●
●
●
●
●
●
●
●
●
●
●
●
●
●
●
●
●●
●
●
●
●
●●
●
●
●
●
●
●
●
●
●
●
●
●
●
●
●
●
●
●
●
●
●
●
●
●
●
●
● ●
●
●
●
●
●
●●
●
●
●
●
●
●
●
●
●
●
●
●
●
●
●
●
●
● ●●
●
●
●
●
●
●
●
●
●
●
●
●
●
●
●
●
●
●
●
●
●
●
●
●
●
●
●
●
●
●
●
●
●
●
●
●
●
●
●
●
●●
●
●
●
●
●
●
●
●
●
●
●
●
●
●
●
●
●
●
●
●
●
●
●
●
●
●
●
●
●
●
●
●
●
●
●
●
●
●
●
●
●
●
●
●
●
●
●
●
●
●
●
●
●
●
●
●
●
●
●
●
●
●
●
●
●
●
●
●
●
●
●
●
●
●
●
●
●
●
●
●
●
●
●
●
●
●
●
●
●
●
●
●
●
●
●
●
●
●●
●
●
●
●
●
●
●
●
●
●
●
●
●
●
●
●
●
●
●
●
●
●
●
●
●
●
●
●
●
● ●
●
●
●
●
●
●
●
●
●
●
●
●
●
●
●
●
●
●
●
●
●
●
●
●
●
●
●
●
●
●
●
●
●
●
●
●
●
●
●
●
●
●
●
●
●
●
●
●
●
●
●
●
●
●
●
●
●
●
●●
●
●
●
●
●
●
●
●
●
●
●
●
●
●
●
●
●
●
●
●
●
●
●
●
●
●
●●
●
●
●
●
●
●
●
●
●
●
●
●
●
●
●
●
●
●
●
●
●
●
●
●
●
●
●
●
●
●
● ●
●
●
●
●
●
●
●
●
●
●
●
●
●
●
●
●
●
●
●
●
●
●
●
●
●●
●
●
●
●
●
●
●
●
●
●
●
●
●●
●
●
●
●
●
●
●
●
●
●
●
●
●
●
●
●
●
●
●
●
●
●
●
●
●
●
●
●
●
●
●
●
●
●●
●
●
●
●
●
●
●
●
●
●
●
●
●
●
●
●
●
●
●
●
●
●
●
●
●
●
●
●
●
●
●
●
●
●
●
●
●
●
●
●
●
●
●
●
●
●
●
●
●
●
●
●
●
●
●
●
●
●
●
●
●
●
●
●
●
●
●
●
●
●
●
●
●
●
●
●
●
●●
●
●
●
●
●
●
●
●
●
●
●
●●
●
●
●
●
●
●
●
●
●
●
●●
●
●
●
●
●
●
●
●
●
●
●
●
●
●
●●
●
●
●
●
●
●
●
●
●
●
●
●
●●
●
●
●
●
●
●
●
●
●
●
●
●
●
●
●
●
●
●
●
●
●
●
●
●
●
●
●
●
●
●
●
●
●
●
●
●
●
●
●
●
●
●
●
●
●
●
●
●
●
●
●
●
●
●
●
●
●
●
●
●
●
●
●
●
●
●
●
●
●
●
●
●
●
●
●
●
●
●
●
●
●
●
●
●
●
●
●
●
●
●
●
●
●
●
●
●
●●
●
●
●
●
●
●
●
●
●
●
●●
●●
●
●
●
●
●
●
●
●
●
●
●
●
●
●
●
●
●
●
●
●
●
●
●
●
●
●
●
●
●
● ●
●
●
●
●
●
●
●
●
●
●
●
●
●●
●
●
●
●
●
●
●
●
●
●
●
●●
●
●
●
●
●
●
●
●
●
●
●
●
●
●
●
●
●
●
●
●
●
●
●
●
●
●
●
●
●
●
●
●
●
●
●
●
●
●
●
●
●
●
●
●
●
●
●
●
●
●
●
●
●
●●
●
●
●
●
●
●
●
●
●
●
●●
●
●
●
●
●
●
●
●
●
●
●
●
●
●
●
●
●
●
●
●
●
●
●
●
●
●
●
●
●
●
●
●
●
●
●
●
●
●
●
●
●
●
●
●
●
●
●
●
●
●
●
●
●
●
●
●
●
●
●
●
●
●
●
●
●
●
●
●
●
●
●
●
●
●
●
●
●
●
●
●
●
●
●
●
●
●
●
●
●
●
●
●
●
●
●
●
●
●
●
●
●
●
●
●
●
●
●
●
●
●
●
●●
●
●
●
●
●
●
●
●●
●
●
●
●
●
●
●
●
●
●
●
●
●
●
●
●
●
●
●
●
●
●
●
● ●
●
●
●
●
●
●
●
●
●
●●
●
●
● ●
●
●
●
●
●
●
●
●
●
●
●
●
●
●
●
●
●
●
●
●
●
●
●
●
●
●
●
●
●
●
●
●
●
●
●
●
●
●
●
●
●
●
●
●
●
●
●
●
●
●
●
●
●
●●
●
●
●
●
●
●
●
●
●
●
●
●
●
●
●
●
●
●●
●
●
●●
●
●
●
●
●
●
●
●
●
●
●●
●
●●
●
●
●
●
●
●
●
●
●
●
●
●
●
●
●
●
●
●
●
●
●
●
●
●
●
●
●
●
●
●
●●
●
●
●
●
●
●
●
●
●
●
●
●
●
●
●
●
●
●
●
●
●
●
●
●
●
●
●
●
●
●
●●
●
●
●
●
●
●
●
●
●
●
●
●
●
●
●
●
●
●
●
●
●
●
●
●
●
●
●
●
●
●
● ●
●
●
●
●
●
●
●
●
●
●
●
●
●
●
●
●
●
●
●
●
●
●
●
●
●
●
●
●
●
●
●
●
●
●
●
●
●
●
●
●
●
●
●
●
●●
●
●
●
●
●
●
●
●
●
●
●
●
●
●
●
●●
●
●
●
●
●
●
●
●
●
●
●
●
●
●
●
●
●
●
●
●
●
●
●
●
●
●
●
●
●
●
●
●
●
●
●
●
●
●
●
●
●
●
●
●
●
●
●
●
●
●
●
●
●
●
●
●
●
● ●
●
●
●
●
●●
●●
●
●
●
●
●
●
●
●
●
●
●
●
●
●
●
●
●
●
●
●
●
●
●
●
●
●
●
●
●
●
●
●
●
●
●
●
●
●
●
●●
●
●
●
●
●
●
●
●
●
●
●
●
●
●
●
●
●
●
●
●
●
●
●
●
●
●
●
●
●
●
●
●
●●
●
●
●
●
●
●
●
●
●
●
●
●
●
●
●
●
●
●
●
●
●
●
●
●
●
●
●
●
●
●
●
●
●
●●
●
●
●
●
●
●
●
●
●●
●
●
●
●
●
●
●
●
●
●
●
●
●
●
●
●
●
●
●
●
●
●
●
●
●
●
●
●●
●
●
●
●
●
●
●
●
●
●
●
●
●
●
●
●
●
●
●
●
●
●
●
●
●
●●
● ●
●
●
●●
●
●
●
●
●
●
●
●
●
●
●
●●
●
●
●
●
●
●
●
●
●
●
●
●
●
●
●
●
●
●
●
●
●
●
●
●
●
●
●
●
●
●
●
●
●
●
●
●
●
●
●
●
●
●
●
●
●
●
●
●
●
●
●
●
●
●
●
●
●
●
●
●
●
●
●
●
●
●
●
●
●
●
●
●
●
●
●
●
●
●
●
●
●
●
●
●
●
●
●
●
●
●
●
●
●
●
●
●
●
●
●
●
●●
●
●
●
●
●
●
●
●
●
●
●
●
●
●
●
●
●
●
●
●
●
●
●
●
●●
●
●
●
●
●●
●
●
●
●
●
●
●
●
●
●
●
●
●
●●
●
●
●
●
●
●
●
●
●
●
●
●
●
●
●
●
●
●
●
●
●
●
●
●
●
●
●●
●
●
●
●
●
●
●
●
●
●
●
●
●
●
●
●
●
●
●
●
●
●
●
●
●
●
●
●●
●
●
●
●
●
●
●
●
●
●
●
●
●
●
●
●
●
●
●
●
●
●
●
●
●
●
●
●
●
●
●
●
●
●
●
●
●
●
●
●
●
●
●
●
●
●
●
●
●●
●
●
●
●
●●
●
●
●
●
●
●
●
●
●
●
●
●
●
●
●
●
●
●
●
●
●
●
●
●
●
●
●
●
●
●
●
●
●
●
●
●
●
●
●
●
●
●
●
●
●
●
●
●
●
●
●
●
●
●
●
●●
●
●
●
●
●
●
●
●
●
●
●
●
●
●
●
●
●
●
●
●
●
●
●
●
●
●
●
●
●
●
●
●
●
●
●
●
●
●●
●
●
●
●
●
●
●
●
●
●
●
●
●
●
●
●●
●
●
●
●
●
●
●
●
●
●
●
●
●
●
●
●
●
●
●
●
●
●
●
●
●
●
●
●
●
●
●
●
●
●
●
●
●
●
●
●
●
●
●
●
●
●
●
●
●
●
●
●
●
●
●
●
●
●
●
●
●
●
●
●
●
●
●
●
●
●
●
●
●
●
●
●
●
●
●
●●
●
●
●
●
●
●
●
●
●●
●
●
●
●
●
●
●
●
●
●●
●
●
●
●
●
●
●
●
●
●
●
●
●
●
●
●
●
●
●
●
●
●
●
●
●
●
●
●
●
●
●
●
●
●
●
●
●
●
●
●
●
●
●
●
●●
●
●
●
●
●
●
●
●
●
●
●
●
●
●
●
●
●
●
●
●●
●
●
●
●
● ●
●
●
●
●
●
●
●
●
●
●
●
●
●
●
●
●
●
●
●
●
●
●
●
●
●
●
●
●
●
●
●
●
●
●
●
●
●
●
●
●
●
●
●
●
●
●
●
●
●
●
●
●
●
●●
●
●
●
●
●
●
●●
●
●
●●
●
●
●
●
●
●
●
●
●
●
●
●
●
●●
●
●
●
●
●
●
●
●
●
●
●
●
●
●
●
●
●
●
●
●
●
●
●
●
●
●
●
●
●
●
●
●
●
●●
●●
●
●
●
●
●
●
●
●
●
●
●
●
●
●
●
●
●
●
●
●
●
●
●
●
●
●
●
●
●
●
●
●
●
●
●
●
●
●
●
●
●
●
●
●
●
●
●
●
●
●
●
●
●
●
●
●
●
●
●●●
●
●
●
●
●
●
●
●
●
●
●
●
●
●
●
●
●
●
●
●
●
●
●
●
●
●
●
●
●
●
●
●
●
●
●
●
●
●
●
●
●
●
●
●
●
●
●
●
●
●
●
●
●
●
●
●
●
●
●
●
●
●
●
●
●
●
●
●
●
●
●
●
●
●
●
●
●
●
●●
●
●
●
●
●
●
●
●
●
●
●
●
●
●
●
●
●
●
●
●
●
●
●
●
●
●
●
●
●
●
●
●
●
●
●
●
●
●
●
●
●
●
●
●
●
●
●
●
●
●
●
●
●
●
●
●
●
●
●
●
●
●
●
●
●
●
●
●
●
●
●
●
●
●
●
●
●
●
●●
●
●
●
●●
●
●
●
●
●
●●
●
●
●
●
●
●
●
●
●
●
●●
●
●
●
●
●
●
●
●
●
●
●
●
●
●
●
●
●
●
●
●
●
●
●
●
●
●
●
●
●
●
●
●
●
●
●
●
●
●
●
●
●
●
●
●
●
●
●
●
●
●
●
●
●
●
●
●
●
●
●
●
●
●
●
●
●
●
●
●
●
●
●
●
●
●
●
●
●
●●
●
●
●
●
●
●
●
●●
●
●
●
●
●
●
●
●
●
●
●
●
●
●
●
●
●
●
●
●
●
●
●
●
●
●
●
●
●
●
●
●
●
●
●
●● ●
●●
●
●
●
●
●
●
●
●
●
●
●
●
●
●
●
●
●
● ●
●
●
●
●
●
●
●
●
●
●
●
●
●
●
●
●
●
●
●
●
●
●
●
●
●
●
●
●
●
●
●
●
●
●
●
●
●
●
●
●
●
●
●
●
●
●
●
●
●
●
●
●
●
●
●
●
●
●
●
●
●
●
●
●
●
●
●
●
● ●
● ●
●
●
●
●
●●
●
●
●
●
●
●
●
●
●
●
●
● ●
●
●
●
●
●
●
●
●
●
●
●
●
●
●
●
●
●
●
●
●
●
●
●
●
●
●
●
●
●
●
●
●
●
●
●
●
●
●
●
● ●
●
●
●
●
●
●
●
●●
●
●
●
●
●
●
●
●
●
●
●
●
●●
●
●
●
●
●
●
●
●
●
●
●
●
●
●
●
●
●
●
●
●
●
●
●
●
●●
●
●
●
●
●
●
●
●
●
●
●
●
●
●
●
●
●
●
●
●
●
●
●
●
●
●
●
●
●
●
●
●
●
●
●
●
●
●
●
●
●
●
●
●
●
●
●
●
●
●
●
●
●
●
●
●
●
●
●●
●
●
●
●
●
●●
●
●
●
●
●
●
●
●
●
●
●
●
●
●
●
●
●
●
●
●
●
●
●
●
●
●
●
●
●
●
●
●
●
●
●
●
●
●
●
●
●
●
●
●
●
●
●
●
●
●
●
●
●
●
●
●
●
●
●
●●
●
●
●
●
●
●
●
●
●
●
●
●
●●
●
●
●
●
●
●
●
●
●
●
●
●
●
●
●
●
●
●
●
●
●
●
●
●
●
●
●
●
●
●
●
●
●
●
●
●
●
●
●
●
●
●
●
●
●
●
●
●
●
●
●
●
●
●
●
●
●
●●
●
●
●
●
●
●
●●
●
●
●
●
●
●
●
●
●
●
●
●
●
● ●
●
●
●
●
●
●
●
●
●
●
●
●●
●
●
●
●
●
●
●
●
●
●
●
●
●
●
●
●
●
●
●
●
●
●
●
●
●
●
●●
●
●
●
●
●
●
●
●
●
●
●
●
●● ●
●
●
●
●
●
●
●
●
●
●
●
●
●●
●
●
●
●
●
●
●
●
●
●
●
●
●
●
●
●
●
●
●
●
●
●
●
●
●
●
●
●
●
●
●
●
●
●
●
●
●
●
●
●
●
●
●
●
●
●
●
●
●
●
●
●
●
●
●
●
●
●
●
●
●
●
●
●
●
●
●●
●
●
●
●
●
●
●
●
●
●
●
●
●
●
●
●
●
●
●
●
●
●●
●
●
●
●
●
●
●
●
●
●
●
●
●
●
●
●
●
●
●
●
●
●
●
●
●
●
●
●
●
●
●
●
●
●
●
●●
●
●
●
●
●
●
●
●
●
●
●
●
●
●
●
●
●
● ●
●
●
●
●
●
●
●
●
●
●
●
●
●
●
●
●
●
●
●
●
●
●
●
●
●
●
●
●
●
●
●
●
●
●
●
●
●
●
●
●
●
●
●
●
●
●
●
●
●
●
●
●
●
●
●
●
●
●
●
●
●
●
●
●
●
●
●
●
●
●
●
●
●●
●
●
●
●
●
●
●
●
●
●
●
●
●
●
●
●
●
●
●
●
●
●
●
●
●
●
●
●
●
●
●
●
●
●
●
●
●
●●
●
●
●
●
●
●
●
●
●
●
●
●
●
●
●
●
●
●
●
●
●
●
●
●
●
●
●
●
●
●
●
●
●
●
●
●
●●
●
●
●
●
●
●
●
● ●
●●
●
●
●
●
●
●
●
●
●
●
●
●
●
●
●
●
●
●
●
●
●
●
●
●
●
●
●
●
●
●
●
●
●
●
●
●
●
●
●
●
●
●
●
●
●
●
●
●
●
●
●
●
●
●
●
●
●
●
●
●
●
●
●
●
●
●
●
●
●
●
●
●
●
●
●
●
●
●
●
●
●
●●
●
●
●
●
●
●
●
●
●
●
●
●
●
●
●
●
●
●
●
●
●
●●
●
●
●
●●
●
●
●
●
●
●
●
●
●
●
●
●
●
●
●
●
●●
●
●
●
●
●
●
●
●
●
●
●
●
●
●
●
●
●
●
●
●
●
●
●
●
●
●
●
●
●
●
●
●
●
●
●
●
●●
●
●
●
●
●
●
●
●
●
●
●
●
●
●
●
●
●
●
●
●
●
●
●
●
●
●
●
●
●
●
●
●
●
●
●
●
●
●
●
●
●
●
●
●
●
●
●
●
●
●
●
●
●
●●
●
●
●
●
●
●
●
●
●
●
●
●
●
●
●
●
●
●
●
●
●
●
●
●
●
●
●
●
●
●
●
●
●
●
●●
●●
●
●
●
●
●
●
●
●
●
●
●
●
●
●
●
●
●
●
●
●
●
●
●
●
●
●
●
●
●
●
●
●
●●
●
●
●
●
●
●
●
●
●
●
●
●
●
●
●
●
●
●
●
●
●
●
●
●
●
●
●
●
●
●
●
●
●
●
●
●
●●
●
●
●
●
●
●
●
●
●
●
●
●
●
●
●
●
●
●
●
●
●
●
●
●
●
●
●
●
●
●
●
●
●
●
●
●
●
●
●
●
●
●
●
●
●
●
●
●
●●
●
●
●
●
●●
●
●
●
●
●
●
●
●
●
●
●
●
●
●
●
●
●
●
●
●
●
●
●
●
●
●
●
●
●
●
●
●
●
●
●
●
●
●
●
●
●
●
●●
●
●
●
●
●
●
●
●
●
●
●
●
●
●
●
●
●
●
●
●
●
●
●
●
●
●
●
●
●
●
●
●
●
●
●
●●
●
●
●
●
●
●
●
●
●
●
●
●
●
●
●
●
●
●
●
●
●
●
●
●
●
●
●
●
●
●
●
●
●
●
●
●
●
●
●
●
●
●
●●
●
●
●
●
●
●
●
●
●
●
●
●
●
●
●
●
●
●
●
●
●
●
●
●
●
●
●
●
●
●
●
●
●
●
●
●
●
●
●
●
●
●
●
●
●
●
●
●
●●
●●
●
●
●
●
●
●
●
●
●
●
●
●
●
●
●
●
●●
●
●
●●
●
●
●
●
●
●
●
●
●
●
●
●
●
●
●
●
●●
●
●
●
●
●
●
●
●
● ●
●
●
●
●
●
●
●
●
●
●
●
●
●
●
●
●
●
●
●
●
●
●
●
●
●
●
●
●
●
●
●
●
●
●
●
●
●
●
●
●
●
●
●
●
●
●
●
●
●
●
●
●
●
●
●
●
●
●
●
●
●
●
●
●
●
●●●
●
●
●
●
●
●
●
●
●
●
●
●
●●
●
●
●
●
●
●
●
●
●
●
●
●
●
●
●
●
●
●
●
●
●
●
●
●
●
●
●●
●
●
●
●
●
●
●
●
●
●
●
●
●
●
●
●
●
●
●
●
●
●
●
●
●
●
●
●
●
●
●
●
●
●
●
●
●
●
●
●
●
●
●
●
●
●
●
●
●
●
●
●
●
●
●
●
●
●
●
●
●
●
●
●
●
●
●
●
●
●
●
●
●●
●
●
●
●
●
●
●
●
●
●
●
●
●
●
●
●
●
●
●
●●
●
●
●
●
●
●
●
●
●
●
●
●
●
●
●
●
●
●
●
●
●
●
●
●
●
●
● ●
●
●
●
●
●
●
●
●
●
●
●●
●
●
●
●
●
●
●
●●
●
●
●
●
●●
●
●
●
●
●
●
●
●
●
●
●
●
●
●
●
●
●
●
●
●
●
●
●
●
●
●
●
●
●
●
●
●
●
●
●●
●
●
●
●
●
●
●
●
●
●
●
●
●
●
●
●
●
●
●
●
●
●
●
●
●
●
●
●
●
●
●
●
●
●
●
●
●
●
●
●
●
●
●
●
●
●
●
●
●
●
●
●
●
●
●
●
●
●
●
●
●
●
●
●
●
●
●
●
●
●
●●
●
●
●
●
●
●
●
●
●
●
●
●
●
●
●
●
●
●
●
●
●
●
●
●
●
●
●
●●
●
●
●
●
●
●
●
●
●
●
●
●
●
●
●
●
●●
●
●
●
●
●
●
●
●
●
●
●
●
●
●
●
●
●●
●
●
●
●
●
●
●
●
●
●●●
●
●
●
●
●
●
●
●
●
●
●
●
●
●
●
●
●
●
●
●
●
●
●
●
●
●
●
●
●
●
●
●
●
●
●
●
●
●
●
●
●
●
●
●
●
●
●
●
●
●
●
●
●
●
●
●
●
●
●
●
●
●
●
●
●
●
●
●
●
●●
●
●
●
●
●
●
●
●
●
●
●
●
●
●
●
●
●
●
●
●●
●
●
●
●
●
●
●
●
●
●
●
●
●
●
●
●
●
●
●
●
●
●
●
●
●
●
●
●
●
●
●
●
●●
●
●
●
●
●
●
●
●●
●
●
●
●
●
●
●
●
●
●
●
●
●
●
●
●
●
●
●
●
●
●
●
●
●
●
●
●
●
●
●
●
●
●
●
●
●
●
●
●
●
●●
●
●
●
●
●
●
●
●
●
●
●
●
●
●
●
●
●
●
●
●
●
●
●
●
●
●
●
●
●
●
●
●
●
●
●
●
●
●
●
●●
●
●
●
●
●
●
●
●
●
●
●
●
●
●
●
●
●
●
●
●
●
●
●
●
●
●
●
●
●●
●
●
●
●
●
●
●
●●
●
●
●
●
●
●
●
●
●
●
●
●
●
●
●
●
●
●
●
●
●
●
●
●
●
●
●
●
●
●
●
●
●
●
● ●
●
●
●
●
●
●
●
●
●
●
●
●
●
●
●
●
●
●
●
●●
●
●
●
●
●
●
●
●
●
●
●
●
●
●
●
●
●
●
●
●
●
●
●
●
●
●
●
●
●
●
●
●
●
●
●
●
●
●
●
●
●
●
●
●
●
●
●●
●
●
●
●
●
●
●
●
●
●
●
●
●
●
●
●
●
●
●
●
●
●
●
●
●
●
●
●
●
●
●
●
●
●
●
●
●
●
●
●
●
●
●
●
●
●
●
●
●
●
●
●
●
●
●
●
●
●
●
●
●
●
●
●
●
●
●
●
●
●
●
●
●
●
●
●
● ●
●
●
●
●
●
●
●
●
●
●
●
●
●
●
●
●
●
●
●
●
●
●
●
●
●
●
●
●
●
●
●
●
●
●
●
●
●
●
●
●
●
●
●
●
●●
●
●
●
● ●
●
●
● ●
●
●
●
●
●
●
●
●
●
●
●
●
●
●
●
●
●
●
●
●
●
●
●
●
●
●
●
●
●
●
●
●
●
●
●
●
●
●
●
●
●
●
●
●
●
●
●
●
●
●
●
●
●●
●
●
●
●
●
●
●
●
●
●
●
●
●
●
●
●
●
●
●
●●
●
●
●
●
●
●
●
●
●
●
●●
●
●
●
●
●
●
●
●
●
●
●
●
●
●
●
●
●
●
●
●
●
●
●
● ●●
●
●
●
●
●
●
●
●
●
●
● ●
●●
●
●
●
●
●
●
●
●
●
●
●
●
●
●
●
●
●
●
●
●
●
●
●
●
●
●
●
●
●
●
●
●
●
●
●
●
●
●
●
●
●
●
●
●
●
●
●
●
●
●
●
●
●
●
●
●
● ●
●●
●
●
●
●
●
●
●
●
●
●
●
●
●
●
●
●
●
●
●
●
●
●
●
●
●
●
●
●
●
●
●
●
●
●
●
●
●
●
●
●
●
●
●
●
●
●
●
●
●
●
●
●
●
●
●
●
●
●
●
●
●
●
●
●
●
●
●
●
●
●
●
●
●
●
●
●
●
●
●
●
●
●
●
●
●
●
●
●
●
●
●
●
●
●
●
●
●
●
●
●
●
●
●
●
●
●
●
●
●
●
●
●
●
●
●
●
●
●
●
●
●
●
●
●
●
●
●
●
●
●
●
●●
●
●
●
●
●
●
●
●
●
●
●
●
●
●
●
●
●
●
●
●
●
●
●●
●
●
●
●
●
●
●
●
●
●
●
●
●
●
●
●
●
●
●
●
●
●
●
●
●
●
●
●
●
●●
●
●
●
●
●
●
●
●
●
●
●
●
●
●
●
●
●
●
●
●
●
●
●
●
●
●
●
●
●
●
●
●
●
●
●
●
●
●
●
●
●
●
●
●
●
●
●
●
●
●
●
●
●
●
●
●
●
●
●
●
●
●●
●
●
●
●
●
●
●
●
●
●
●
●
●
●
●
●
●
●
●●
●
●
●
●
●
●●
●
●
●
●
●
●
●
●
●
●
●
●
●
●
●
●
●
●
●
●
●●
●
●
●
●
●
●
●
●
●
●
●●
●
●
●
●
●●
●
●
●
●
●
●
●
●
●
●
●
●
●
●
●
●
●
●
●
● ●
●
●
●
●
●
●
●
●
●
●
●
●
●
●
●
●
●
●
●
●
●
●
●
●
●
●
●
●
●
●
●
●
●
●
●
●
●
●
●
●
●
●
●
●
●
●●
●
●
●
●
●
●
●
●
●
●
●
●
●
●
●
●
●
●
●
●
●
●
●
●
●
●
●
●
●
●
●
●
●
●
●
●
●
●
●
●
●
●●
●
●
●
●
●
●
●
●
●
●
●
●
●
●
●●
●
●
●
●
●
●
●
●
●
●
●
●
●
●
●
●
●
●
●
●●
●
●
●
●
●
●
●
●
●
●
●
●
●●
●
●
●
●
●
●
●
●●
●
●
●
●
●
●
●
●
●
●
●
●
●
●
●
●
●
●
●
●
●
●
●
●
●
●
●
●
●
●
●
●●
●
●
●
●
●
●
●
●
●
●
●
●
●
●
●
●
●
●
●
●
●
●
●
●
●
●
●
●
●
●
●
●
●
●
●
●
●
●
●
●
●
●
●
●
●
●
●
●
●
●
●
●
●
●
●
●
●
●
●
●
●
●
●
●
●
●
●
●
●
●
●
●
●
●
●
●
●
●●
●
●
●
●
●
●
●
●
●
●
●
●
●
●
●
●
●
●
●
●
●
●
●
●
●
●
●
●
●
●
●
●
●
●
●
●
●
●
●
●
●●
●
●
●
● ●
●
●
●
●
●
●
●
●
●
●
●
●
●
●
●
●
●
●
●
●
●
●
●
●
●
●
●
●
●
●
●
●
●
●
●
●
●
●
●
●
●
●
●
●
●
●
●
●
●
●
●
●
●
●
●
●
●
●
●
●
●
●
●●
●
●
●
●●
●
●
●
●●
●●
●
●
●
●
●
●
●
●
●
●
●
●
●
●
●
●
●
●
●
●
●
●
●
●
●
●
●
●
●
●
●
●
●
●
●
●
●
●
●
●
●
●
●
●
●●
●
●
●
●
●
●
●
●
●
●
●
●
●
●
●
●
●
●
●
●
●
●
●
●
●
●
●
●
●
●
●
●
●
●
●
●
●
●
●
●
●
●
●
●
●
●
●
●
●
●
●
●
●
●
●
●
●
●
●
●
●
●
●
●
●
●
●
●
●
●●
●
●
●
●
●
●
●
●
●
●
●●
●
●
●
●●
●
●
●
●
●
●
●
●
●
●
●
●●
●
●
●
●
●
●
●
●
●
●
●
●
●
●
●
●
●
●
●
●
●
●
●
●
●
●
●
●
●
●
●
●
●
●
●
●
●
●
●
●
●
●
●
●
●
●
●
●
●
●
●
●
●
●
●
● ●
●●
●
●
●
●
●
●
●
●
●
●
●
●
●
●
●
●
●
●
●
●
●
● ●
●
●●
●
●
●
●
●
●
●
●
●
●
●
●
●
●
●
●
●
●
●
●
●
●
●
●
●
●
●
●
●
●● ●
●
●
●●
●
●
●
●
●
●
●
●
●
●
●
●
●
●
●
●
●
●
●
●
●
●
●
●
●
●
●
●
●●
●
●
●
●
●
●
●
●
●
●
●
●
●
●
●
●
●
●
●
●
●
●
●
●
●
●
●
●
●
●
●
●
●
●
●
●
●
●
●
●
●
●
●
●
● ●
●
●
●
●
●
●
●
●
●
●
●
●
●
●
●
●
●
●
●
●
●
●
●
●
●
●
●
●
●●
●
●
●
●
●
●
●
●
●
●
●
●
●
●
●
●
●
●
●
●
●
●
●
●
●
●
●
●
●
●
●
●
●
●
●
●
●
●
●
●
●
●
●
●
●
●
●
●
●
●
●
●
●
●
●
●
●
●
●
●
●
●
●
●
●
●
●
●
●
●
●
●
●
●
●
●
●
●
●
●
●
●
●
●
●
●
●
●
●
●
●
●
●
●
●
●
●
●
●
●
●
● ●
●
●
●
●
●
●
●
●
●
●
●
●
●
●
●
●
●
●
●
●
●
●
●
●
●
●
●
●
●
●
●●●
●
●
●
●
●
●
●
●
●
●
●
●
●
●
●
●
●
●
●
●
●
●
●
●
●
●
●
●
●
●
●
●
●
●
●
●
●
●
●
●
●
●
●
●
●
●
●
●
●
●
●●
●
●
●
●
●
●
●
●
●●
●
●
●
●
●
●
●
●
●
●
●
●
●
●
●
●
●
●
●●
●
●
●
●
●
●
●
●
●
●
●
●
●
●
●
●
●
●
●
●
●
●
●
●
●
●
●
●
●
●
●
●
●
●
●
●
●
●
●
●
●
●
●
●
●
●
●
●
●
●
●
●
●
●
●
●
●
●
●
●
●
●
●
●
●
●
●
●
●
●
●
●
●
●
●
●
●
●
●
●
●
●
●
●
●
●
●
●
●
●
●
●
●
●
●
●
●
●
●
●
●
●
●
●
●
●●
●●
●
●
●
●
●
●
●
●
●
● ●●
●
●
●
●
●
●
●
●
●
●
●
●
●
●
●
●
●
●
●
●
●
●
●
●
●
●
●
●
●
●
●
●
●
●●
●
●
●
●
●
●
●
●
●
●
●
●
●
●
●
●
●
●
●
●
●
●
●
●
●
●
●
●
●
●
●
●
●
●
●
●
●
●
●
●
●
●
●
●●
●
●
●
●
●
●
●
●
●
●
●
●●
●
●
●
●
●
●
●
●
●
●
●●
●
●●
●●
●
●
●
●
●
●
●
●
●
●
●
●
●
●
●
● ●
●
●
●
●●
●
●
●
●
●
●
●
●
●●
●
●
●
● ●
●
●
●
●
●
●
●
●
●
●
●
●
●
●
●
●
●
●
●
●
●
●
●
●
●
●
●
●
●
●
●
●
●
●
●
●
●
●●
●
●
●
●
● ●
●
●
●
●
●
●
●
●
●
●
●
●
●
●
●
●
●
●●
●
●●
●
●
●
●
●
●
●
●
●
●
●
●
●
●
●
●●
●
●
●
●
●
●
●
●
●
●
●
●
●
●
●
●●
●
●
●
●
●
●
●
●
●
●
●
●
●
●
●
●
●
●
●
●
●
●
●
●
●
●
●
●
●
●
●●
●
●
●
●
●
●
●
●●
●
●
●
●
●
●
●
●
●
●
●
●
●
●
●
●
●
●
●
●●
●
●
●
●
●
●
●
●
● ●
●
●
●
●
●
●
●
●
●
●
●
●
●
●
●
●
●
●
●
●
●
●
●
●●
●
●
●●
●
●
●
●
●
●
●
●
●
●
●
●
●
●
●
●
●
●
●
●
●
●
●
●
●
●
●
●
●
●
●
●
●
●
●●
●
●
●●
●
●
●
●
●
●
●
●
●
●
●
●
●
●
●
●
●
●
●
●
●
●
●
●
●
●
●
●
●
●
●
●
●
●
●
●
●
●
●
●
●
●
●
●
●
●
●
●
●
●
●
●
●
●
●
●
●
●
●
●
●
●
●
●
●
●
●
●
●
●
●
●
●●
●
●
●
●
●
●
●
●
●
●
●
●
●
●
●
●
●
●
●
●
●
●
●
●
●
●
●
● ●
●
●
●
●
●
●
●
●
●●
●
●
●
●
●
●
●
●
●
●
●
●
●
●
●
●
●
●
●
●
●
●
●
●
●
●
●●
●
●
●
● ●
●
●
●
●
●
●
●
●
●
●
●
●
●
●
●
●
●
●
●
●
●
●
●
●●
●
●
●
●
●
●
●
●
●
●
●
●
●
●
●
●
●
●
●
●
●
●
●
●
●
●
●
●
●
●
●
●
●
●
●
●
●
●
●
●
●●
●
●
●
●
●
●
●
●
●
●
●
●
●
●
●
●
●
●
●
●
●
●
●
●
●
●
●
●
●
●
●
●
●
●
●
●
●
●
●
●
●
●
●
●
●
●
●
●
●
●
●●
●
●
●
●
●
●
●
●
●
●
●
●
●
●
●
●
●
●
●
●
●
●
●
●
●
●
●
●
●
●
●
●
●
●●
●
●
●
●
●
●
●
●
●
●
●
●
●
●
●
●
●
●
●
●
●
●
●
●
●
●
●
●
●
●
●
●
●
●
●
●
●
●
●
●
●
●
●
●
●
●
●
●
●
●
●
●
●
●
●
●
●
●
●
●
●
●
●
●
●
●
●
●
●
●
●
●
●
●
● ●
●
●
●
●
●
●
●
●
●
●
●
●
●
●
●
●
●
●
●
●
●
●
●
●
●
●
●
●
●
●
●
●
●
●
●
●
●
●
●
●
●
●
●
●
●
●
●
●
●
●
●
●
●
●
●
●
●
●
●
●
●
●
●
●
●
●
●
●
●
●
●
●
●
●
●
●
●
●
●
●
●
●
●
●
●
●
●
●
●
●
●
●
●
●
●
●●
●
●
●
●
●
●
●
●
●
●
●
●
●
●
●●
●
●
●
●
●
●
●
●
●
●
●
●
●●
●
●
●
●
●
●
●
●
●
●
●
●
●
●
●
●
●
●
●
●
●
●
●
●
●
●
●
●
●
●
●
●
●
●
●
●
●
●
●
●
●
●
●
●
●
●
●
●
●
●
●
●
●
●
●
●
●
●
●
●
●
●
●
●
●
●●
●
●
●
●
●
●
●
●
●
●●
●
●
●●
●
●
●
●
●
●
●
●
●
●
●
●
●
●
●
●
●
●
●
●
●
●
●
●●
●
●
●
●
●
●
●
●
●
●
●
●
●
●
●
●
●
●
●
●
●
●
●
●
●
●
●
●
●
●
●
●
●
●
●
●
●●
●
●
●
●
●●
●
●
●
●
●
●
●
●●
●
●
●
●
●
●
●
●
●
●
●
●
●
●
●
●
●
●
●
●
●
●
●
●
●
●
●
●
●
●
●
●
●
●
●
●
●
●
●
●
● ●
●
●
●
●
●
●
●
●
●
●
●
●
●
●
●
●
●
●
●
●
●
●
●
●
●
●
●
●●
●
●
●
●
●
●
●
●
●
●
●
●
●
●
●
●
●
●
●
●
●
●
●
●
●
●
●
●
●
●
●
●
●
●
●
●
●
●
●
●
●
●
●
●
●
●
●
●
●
●
●
●
●
●
●
●
●
●
●
●
●
●
●
●
●
●
●
●
●
●
●
●
●
●
●
●
●
●
●
●
●
●
●
●
●
●
●
●
●
●
●
●
●
●
●
● ●
●
●
●
●
●
●
●
●
●●
●
●
●
●
●
●
●
●
●
●
●
●
●
●
●
●
●●
●
●
●
●
●
●
●
●
●
● ●
●
●
●
●
●
●
●
●
●
●
●
●
●
●●
●
●
●
●
●
●
●
●
●
●
●
●
●
●
●
●
●
●
●
●
●
●
●
●
●
●
●
●
●
●
●
●
●
●
●
●
●
●
●
●
●
●
●
●
●
●
●
●
●
●
●
●
●
●
●
●
●
●
●
●
●
●
●
●
●
●
●
●
● ●
●
●
●
●
●
●
●
●
●
●
●
●
●
●
●
● ●
●
●
●
●
●
●
●
●●
●
●
●
●
●
●
●
●
●
● ●
●
●●
●
●
●
●
●
●●
●
●
●
●
●
●
●
●
●
●
●
●
●
●
●
●
●
●
●
●
●
●
●
●
●
●
●
●
● ●
●
●
●
●
●
●
●
●
●
●
●
●
●
●
●
●
●
● ●
●
●
●
●
●
●
●
●
●
●
●
●
●
●●
●
●
●
●
●
●
●
●
●●
●
●
●
●
●
●
●●
●
●
●
●
●●
●
●
●
●
●
●
●
●
●
●
●●
●
●
●
●
●
●
●
●
●
●
●
●
●
●
●
●
●
●
●
●
●
●
●
●
●
●
●
●
●●
●
●
●
●
●
●
●
●
●
●
●
●
●
●
●
●
●
●
●
●
●
●
●
●
●
●●
●
●
●
●
●
●
●
●●
●●
●
●●
●
●●
●
●
● ●
●
●
●
●
●
●
●
●
●
●●
●
●
●
●
●
●●
●
● ●
●
●
●
●
●
●
●
●
●
●
●
●
●
●
●
●
●
●
●
●
●
●
●
●
●
●
●
●
●
●●
●
●
●
●
●
●
●
●
●
●
●
●
●
●
●
●
●●
●
●
●
●
●
●
●
●
●
●●
●●
●
●
●
●
●
●●
●
●
●
●
●
●
●
●
●
●
●
●
●
●
●
●
●
●
●
●
●
●
●
●
●
●
●
●
●
●
●
●
●
●
●
●
●
●
●
●
●
●
●●
●
●
● ●
●
●●
●
●
● ●
●
●
●
●
●
●
●
●
●
●
●
●
●
●
●
●
●
●
●
●
●
●
●
●
●
●
●
●
●
●
●
●
●
●
●
●
●
●
●
●
●
●
●
●
●
●
●
●
●
● ●●
●
●
●
●
●
●
●
●●●
●
●
●
●
●
●
●●
●
●
●
●
●
●
●
●
●
●
●
●
●
●
● ●
●
●
●
●
●
●
●
●
●●
●
●
●
●
●
●
●
●
●
●
●
●
●
●
●
●
●
●
●
●
●
●
●
●
●
●
●
●
●
●
●
●
●
●●
●
●
●●
●
●
●
●
●
●
●
●
●
●
●
●
●
●
●●
●
●
●
●
● ●
●
●
●
●
●
●
●
●
●
●
●
●
●
●
●
●
●
●
●
●
●
●
●
●
●
●
●
●
●
●
●●
●
●
●
●
●
●
●
●
●
●
●
●
●
●
●
●
●
●
●
●
●
●
●
●
●
●●
●
●
●
●●
●
●●
●
●
●●
●
●
●●
●
●
●
●
●
●
●
●
●
●
●
●
●
●
●
●
●
●
●
●
●
●
●
● ●
●
●
●
●
●
●
●
●
●
●
●
●
●
●
●
●
●
●
●●
●
●
●
●
●
●
●
●
●
●
●
●
●
●
●
●●
●
●
●
●
●
●
●
●
●
●
●
●
●
●
●
●
●
●
●
●
●
●
●
●
●
●
●
●
●
●
●
●
● ●
●
●
●
●
●●
●
●
●
●
●
●
●
●
●
●
●
●
●
● ●
●
●
●
●
●
●
●
●
●
●
●
●
●
●
●
●
●
●
●
●
●
●
●
●
●
●
● ●
●
●
●
●
●
●
●
●
●
●
●
●
●
●
●
●
●
● ●
●
●●
●
●●
●
●
●
●
●
●
●
●
●
●
●
●
●
●
●
●●
●
●
●
●
●
●
●
● ●
●●
●
●
●
●
●●
●
●
●
●
●
●
●●
●
●
●
●
●
●●
●
●
●
●
●
●
●
● ●
● ●
●
●
●
●●
●
●
●
●
●
●●
●●
●
●
●
●
●
●
●
●
●
●
●
●
●
●
●
●
●
●
●
●
●
●
●
●
●
●
●
●
●
●
●
●
●
●
●
●
●
●
●
●
●
●
●
●
●
●
●
●
●
●
●
●
●
●
●
●
●
●
●
●
●
●
●
●
●
●
●
●
●
●
●●
●
●
●
●
●
●
●
●
●
●
●
●
●
●
●
●●
●
●
●
●
●
●
●
●
●
●●
●
●
●
●
●
●
●
●
●●●
●
●
●
●
●
●
●
●
●
●●
●
●
●
●
●
●
●
●
●
●
●
●
●
●
●
●
●
●●
●
●
●
●
●
●
●
●
●
●
●
●
●
●
●
●
●
●
●
●
●●
●
●
●
●●
●
●
●
●
●
●
●
●
●
●
●●
●
●●
●●
●
●●
●
●
●
●
●
●
●
●
●
●
●
●
●●
●
●
●
●
●
● ●
●
●
●
●
●
●
●
●
●
●
●
●
●
●
●
●
●
● ●
●
●
●
●
●
●
●●
●
●
●
●
●●
●
●
●
●
●
●
●
● ●
●
●●
●
●
●
●
●
●
●
●
●
●
●
●
●
●
●
●
●
●
●
●●
●
●
●
●
●
●
●
●
●
●
●
●
●
●
●
●
●
●
●
●
●
●
●
●
●
●
●
●
●
●
●
●
●
●
●
●
●
●
●
●
●
●
●
●●
●
●
●
●
●
●
●
●
●
●
●
●
●
● ● ●
●
●
●
●
●
●
●
●
●
●
●
●
●
●
●
●
●
●
●
●
●
●
●
●
●
●
●
●
●
●
●
●
●●
●
●
●
●
●
●
● ●
●
●
●
●●●
●
●
●
●
●
●
●
●
●
●
●●
●
●
●
●
●
●
●
●
●
●
●
●●
●
●
●
●
●
●
●
●
●
●●
●●
●
●
●
●
●
●
●
●
●
●
●
● ●
●
●
●
●
●
●
●
●
●
●
●
●
●
●
●
●
●●
●
●
●
●
●
●
●
●
●
●
●
●
●
●
●
●
●
●
●
●
●
●
●
●
●
●
●
●
●
●
●
●
●
●
●
●
●
●
●
●
●
●
●
●
●
●
●
●
●
●
●
●
●
●
●
●
●
●
●
●
●
●
●
●
●
●
●
●
●
●
●
●
●
●
●
●
●
●
●
●
●
●
●
●
●
●
●
●
●
●
●
●
●
●
●
●
●
●
●
●
●
●
●
●
●
●
●
●
●
●
●
●
●
●
●●
●
●
●
●
●
●
●
●
●
●
●
●
●●
●
●
●
●
●
●
●
●
●●
●
●
●
●
●
●
●
●●
●
●
●
●
●
●
●
●
●
●
●
●
●
●
●
●
●
●
●
●
●
●
●
●
●
●
●
●
●
●
●●●
●●
●
●
●
●
●
●
●
●
●
●
●
●
●
●
●●
●
●
●
●
●
●
●
●
●
●
●
●
●
●
●
●
●
●
●
●
●
●
●●
●
●
●
●
●
●
●
●
●
●
●
●
●
●
●
●
●
●
●
●
●
●
●
●
●
●
●
●
●
●
●
●
●
●
●
●
●
●●
●
●
●
●
●
●
●
●
●
●
●
●
●
●
●
●
●
●●
●
●
●
●
●
●
●
●
●
●
●
●
●
●
●
●
●
●
●
●
●
●
●
●
●
●
●
●
●
●
●
●
●
●
●
●
●
●
●
●
●
●
●
●
●
●
●●
●
●
●
●
●
●
●
●
●●
●
●
●
●
●
●●
●
●
●
●
●
●
●●
●
●●
●
●
●
●●
●
●
●●
●
●
●
●
●
●
●●
●
●
●
●●
●●
●
●
●●
●
●●
●
●
●
●
●
●
●
●
●
●
●
●
●
●
●
●
●
●
●
●
●
●
●
●
●
●
●
●
●
●
●
●
●
●
●
●
●
●
●
●
●
●
●
●
●
●
●●
●
●
●
●
●
●
●
●
●
●
●
●●
●
●
●
●
●
●
●
●
●
●
●
●
●
●
●
●●
●●
●●
●
●●
●●
●
●
●
●
●
●
●
●
●
●
●
●
●
●
●
●
●
●
●
●
●
●
●
●
●
●
●
●
●●
●
●
●
●
●
●
●
●
●
●
●
●
●
●
●
●
●
●
●
●
●
●
●
●
●
●
●
●
●
●
●
●
●
●
●
●
●
●
●
●
●
●
●
●
●
●
●
●
●
●
●
●
●●
●
●
●
●
●
●
●
●
●
●
●
●●
●
●
●
●
●
●
●
●
●
●
●
●
●
●
●
●
●
●
●●
●
●
●
●
●
●
●
●
●
●
●
●
●
●
●
●
●
●
●
●
●
●
●
●
●
●
●
●
●
●
●
●
●●
●
● ●
●
●
●
●
●
●
●
●
●
●
●
●
●
●
1e−07
1e−04
1e−01
1e+02
1e−07 1e−03 1e+01Gene Score of 4M vs 1M
Gen
e Sc
ore
of X
O4+
vs
XO4−
Low
High
genedensity
++/−+/+−/−−: 901 / 1400 / 41 / 0
●
●
●
●
●
●
●
●
●
●
●●
●
●
●
●
●
●
●
●●
●
●
●
●
●
●
●
●
●
●
●
●
●
●
●
●
●
●●
●
●
●
●
●
●
●
●
●
●
●
●
●
●
●
●
●
●
●
●●
●
●
●
●
●
●
●
●
●
●
●
●
●
●
●
●
●
●
●
●
●
●
●
●●
●
●
●
●
●
●
●
●
●
●
●
●
●
●
●
●
●
●
●
●
●
●
●
●
●
●
●
●
●
●
●
●
●
●
●
●
●
●
●
●
●
●
●
●
●
●
●
●
●
●
●
●
●
●
●
●
●
●
●●
●
●
●
●
●
●
●
●
●
●
●
●
●
●
●
●
●
●
●●
●
●
●
●
●
●
●
●
●
●
●
●
●
●
●
●
●
●
●
●
●
●
●
●
●
●
●
●
●
●
●
●
●
●
●
●
●
●
●
●
●
●
●
●
●
●
●
●
●
●
●
●
●
●
●●
●
●
●
●
●
●
●
●
●
●
●
●
●
●
●●
●
●
●
●
●
●
●
●
●
●●
●●
●
●
●
●
●
●
●
●
●
●
●
●
●
●
●
●
●
●
●
●
●
●
●
●
●
●
●
●
●
●
● ●
●
●
●
●
●
●
●
●
●
●
●
●
●
●
●
●
●
●
●
●
●
●
●
●
●
●
●
●
●
●
●
●
●
●
●
●
●
●
●
●
●
●
●
●
●
●
●
●
●
●
●
●
●
●
●
●
●
●
●
●
●
●
●
●
●
●
●
●
●
●
●
●
●
●
●
●
●
●
●
●
●
●●
●
●
●
●
●
●
●
●
●
●
●
●
●
●
●
●
●
● ●
●
●
●
●
●
●
●
●
●
●
●
●
●
●
●
●
●
●
●
●
●
●
●
●
●
●
●
●
●
●
●
●
●
●
●
●
●
●
●
●
●
●
●
●
●
●
●
●
●
●
●
●
●
●
●
●
●
●
●
●
●
●
●
●
●
●
●
●
●
●
●
●
●
●
●●
●
●
●
●
●
●
●
●
●
●
●
●
●
●
●
●
●
●
●
●
●
●
●
●
●
●
●
●
●
●
●
●
●
●
●
●
●
●
●
●
●
●
●
●
●
●
●
●
●
●
●
●
●
●
●
●
●
●
●
●
●
●
●
●
●
●
●
●
●
●
●
●
●
●
●
●
●
●
●
●
●
●
●
●
●
●
●
●
●
●
●
●
●
●
●●
●
●
●
●
●
●
●
●
●
●
●●
●
●
●
●
●
●
●
●
●
●
●
●
●
●
●
●
●
●
●
●
●
●
●
●
●
●
●
●
●
●
●
●
●
●
●
●
●
●
●
●
●
●
●
●
●
●
●
●
●
●
●
●
●
●
●
●
●
●
●
●
●
●
●
●
●
●
●
●
●
●
●
●
●
●
●
●
●
●
●
●
●
●
●
●
●
●
●
●
●
●
●
●
●
●
●
●
●
●
●
● ●
●
●
●
●
●
●
●
●●
●
●
●
●
●
●
●
●
●
●
●
●
●
●
●
●
●
●
●
●
●
●
●
●
●
●
●
●
●
●
●
●
●
●
●
●
●
●
●
●
●●
●
●
●
●
●
●
●
●
●
●
●
●
●
●
●
●
●
●
●
●
●
●
●
●
●
●
●
●
●
●
●
●
●
●
●
●
●
●
●
●
●
●
●
●
●
●
●
●
●
●
●
●
●
●
●
●
●
●
●
●
●
●
●
●
●
●
●
●
●
●
●
●
●
●
●
●
●
●●
●
●
●
●
●
●
●
●
●
●
●
●
●
●
●
●
●
●
●
●
●
●
●
●
●
●
●
●
●
●
●
●
●
●
●
●
●
●
●
●
●
●
●
●
●
●
●
●
●
●
●
●
●
●
●
●
●
●
●
●
●
●
●
●
●
●
●
●
●
●
●
●
●
●
●
●
●
●
●
●●
●
●
●
●
●
●
●
●
●
●
●
●
●
●
●
●
●
●
●
●
●
●
●
●
●
●
●
●
●
●
●
●
●
●
●
●
●
●
●
●
●
●
●
●
●
●
●
●
●
●
●
●
●
●
●
●
●
●
●
●
●
●
●
●
●
●
●
●
●
●
●
●
●
●
●
●
●
●
●
●
●
●
●
●
●
●
●
●
●
●
●
●
●
●
●
●
●
●
●
●
●
●
●
●
●
●
●
●
●
●
●
●
●
●
●
●
●
●
● ●
●
●
●
●
●
●
●
●
●
●
●
●
●
●
●
●
●
●
●
● ●
●
●
●
●
●
●
●
●
●
●
●
●
●
●
●
●
●
●
●
●
●
●
●
●
●
●
●
●
●
●
●
●
●
●
●
●
●
●
●
●
●●
●
●
●
●
●
●
●
●
●
●
●
●
●
●
●
●
●
●
●
●●
●
●●
●
●
●
●
●
●
●
●
●
●
●
●
●
●
●
●
●
●
●
●
●
●
●
●
●
●
●
●
●
●
●
●
●
●
●
●
●
●
●
●
●
●
●
●
●
●
●
●
●
●
●
●
●
●
●
●
●
●
●
●
●
●
●
●
●
●
●
●
●
●
●
●
●
●
●
●
●
●
●
●
●
●
●
●
●
●
●
●●
●
●
●
●
●
●
●●
●
●
●
●
●
●
●
●●
●
●
●
●
●
●
●
●●
●
●
●
●
●
●●
●
●
●
●
●
●
●
●●
●
●
●
●
●
●
●
●
●
●
●
●
●
●
●
●
●
●
●
●
●
●
●
●
●
●
●
●
●
●
●
●
●
●
●
●
●
●
●
●
●
●
●
●
●
●
●
●
●
●
●
●
●
●
●
●
●
●
●
●
●
●
●
●
●
●
●
●
●●
●
●
●
●
●
●
●
●
●
●
●
●
●
●
●
●
●
●
●
●
●
●
●
●
● ●
●
●
●
●
●
●
●
●
●
●
●
●
●
●
●
●
●
●
●
●
●
●
●
●
●
●
●
●
●
●
●
●
●
●
●
●
●
●
●
●
●
●
●
●
●
●
●
●
●
●
●
●
●
●
●
●
●
●
●
●
●
●
●
●
●
●
●
●
●
●
●
●
●
●
●
●
●
●
●
●
●
●
●
●
●
●
●
●●
●
●
●
●
●
●
●
●
●
●
●
●
●
●
●
●
●
●
●
●
●
●
●
●
●
●●
●
●
●
●
●
●
●●
●
●
●
●
●
●
●
●
●
●
●
●
●
●
●
●
●
●
●
●
●
●
●
●
●
●
●
●
●●
●
●
●
●
●
●
●
●
●
●
●
●
●
●
●
●
●
●
●
●
●
●
●
●
●
●
●
●
●
●
●
●
●
●
●
●
●
●
●
●
●
●
●
●
●
●
●
●●
●
●
●
●
●
●
●
●
●
●
●
●
●
●
●
●
●
●
●
●
●
●
●
●
●
●
●
●
●
●●
●
●
●
●
●
●
●
●
●
●
●
●
●
● ●
●
●
●
●
●
●
●
●
●
●
●
●
●
●
●
●
●
●
●
●
●
●
●
●
●
●
●
●
●
●
●
●
●
●●
●
●
●
●
●
●
●
●
●
●●
●
●
●
●
●
●
●
●
●
●
●
●
●
●
●
●
●
●
●
●
●
●
●
●
●
●
●
●
●
●
●
●
●
●
●
●
●
●
●
●
●
●
●
●
●
●
●
●
●
●
●
●
●
●
●
●
●
●
●
●
●
●
●
●
●
●
●
●
●
●
●
●
●
●
●
●
●
●
●
●
●
●
●
●
●
●
●
●
●
●
●
●
●
●
●
●
●
●
●
●
●
●
●
●
●
●
●
●
●●
●
●
●
●
●
●
●
●
●
●
●●
●
●
●
●
●
●
●
●
●
●
●
●
●
●
●
●
●
●
●
●
●
●
●
●
●
●
●
●
●
●
●
●
●
●
●
●
●
●
●
●
●
●
●
●
●
●
●
●
●
●
●
●
●
●
●
●
●
●
●
●
●
●
●
●
●
●
●
●
●
●
●
●
●
●
●
●
●
●
●
●
●
●
●
●
●
●
●
●
●
●
●
●
●
●
●
●
●
●
●
●
●
●
●
●
●
●
●
●
●
●
●
●
●
●
●
●
●
●
●
●
●
●
●
●
●
●
●
●
●
●
●
●
●
●●●
●
●
●●
●
●
●
●
●●
●
●
●
●
●
●
●
●
●
●
●
●
●
●
●
●
●
●
●
●
●
●
●
●
●
●
●
●
●
●
●
●
●
●
●
●
●
●
●
●
●
●
●
●
●
●
●
●
●
●
●
●
●
●
●
●
●
●●
●
●
●
●●
●
●
●
●●●
●
●
●
●
●
●
●
●
●
●
●
●
●
●
●
●
●
●
●
●
●
●
●
●
●
●
●
●
●
●
●
●
●
●
●
●
●
●
●
●
●
●
●
●
●
●
●
●
●
●
●
●
●
●
●
●
●
●
●●
●
●
●
●
●
●
●
●
●
●
●
●
●
●
●
●
●
●
●
●
●
●
●
●
●
●
●
●
●
●
●
●
●
●
●
●
●
●
●
●
●
●
●
●
●
●
●
●
●
●
● ●
●
●
●
●
●
●
●
●
●
●
●●
●
●
●
●
●
●
●
●
●
●
●
●
●
●●
●
●
●
●
●
●
●
●
●
●
●
●●
●
●
●
●
●
●
●
●
●
●
●
●
●
●
●
●
●
●
●
●
●
●
●
●
●
●
●
●
●
●
●
●
●
●
●
●
●
●
●
●
●
●
●
●
●
●
●
●
●
●
●
●
●
●
●
●
●
●
●
●
●
●
●
●
●
●
●
●
●
●●
●
●
●
●
●
●
●
●
●
●
●
●
●
●
●
●
●
●
● ●
●
●
●
●
●
●
●
●
●
●
●
●
●
●
●
●
●
●
●
●
●
●
●
●
●
●
●
●
●
●
●
●
●
●
●
●
●
●
●
●
●
●
●
●
●
●
●
●
●
●
●
●
●
●
●
●
●
●
●
●
●
●
●
●
●
●
●
●
●
●
●
●
●
●
●
●
●
●
●
●
●
●
●
●
●
●
●
●
●
●
●
●
●
●
●
●
●
●
●
●
●
●
●
●
●
●
●
●
●
●
●
●
●
●
●
●
●
●
●
●
●
●
●
●
●
●
●
●
●
●
●
●
●
●
●
●
●
●
●
●
●
●
●
●
●
●
●
●
●
●
●
●
●
●
●
●●
●
●
●
●
●
●
●
●
●
●
●
●
●
●
●
●
●
●
●
●
●
●
●
●
●
●
●
●
●
●
●
●
●
●
●
●
●
●
●
●
●
●
●
●
●
●
●
●●
●
●
●
●
●
●
●
●
●
●
●
●
●
●
●
● ●
●
●
●
●
●
●
●
●
●
●
●
●
●
●
●
●
●
●
●
●
●●
●
●
●
●
●
●
●
●
●
●
●
●
●
●
●
●
●
●
●
●
●
●
●
●●
●
●
●
●
●
●
●
●
●
●
●
●
●
●
●
●
●
●
●
●
●
●
●
●
●
●
●
●
●
●
●
●
●
●
●
●
●
●
●
●
●
●
●
●
●
●
●
●
●
●
●
●
●
●
●
●
●
●
●
●
●
●
●
●
●
●
●
●●
●
●
●●
●
●
●
●
●
●
●
●
●
●
●
●
●
●
●
●
●
●●
●
●
●
●
●
●
●
●
●
●
●
●
●
●
●
●
●
●
●
●
●
●
●
●
●
●
●
●
●
●
●
●
●
●
●
●
●
●
●
●
●
●
●
●
●
●
●
●
●
●
●
●
●
●
●
●
●
●
●
●
●
●
●
●
●
●
●
●
●
●
●
●
●
●
●
●
●
●
●
●
●
●
●
●
●
●
●
●
●
●
●
●
●
●
●
●
●
●
●
●
●
●
●
●
●
●
●
●
●
●
●
●
●
●
●
●
●
●●●
●
●
●
●
●
●
●
●
●
●
●
●
●
●
●
●
●
●
●
●
●
●
●
●
●
●
●
●
●
●
●
●
●
●
●
●
●
●
●
●
●
●
●
●
●
●
●
●
●
●
●
●
●
●
●
●
●
●
●
●
●
●
●
●
●
●
●
●
●
●
●
●
●
●
●
●
●
●
●
●
●
●
●
●
●
●
●
●
●
●
●
●
●
●
●
●
●
●
●
●
●
●
●
●
●
●
●
●
●
●
●
●
●
●
●
●
●
●
●
●
●
●
●
●
●
●
●
●
●
●
●
●
●
●
●
●
●
●
●
●
●
●
●
●
●
●
●
●
●
●
●
●
●
●
●
●
●
●
●
●
●
●
●
●
●
●
●
●
●
●
●
●
●
●
●
●
●
●
●
●
●
●
●
●
●
●
●
●
●
● ●
●
●
●
●●
●
●
●
●
●
●
●
●
●
●
●
●
●
●
●
●
●
●
●
●
●
●
●
●
●
●
●
●
●
●
●
●
●
●
●
●
●
●
●
●
●●
●
●
●
●
●
●
●
●
●
●
●
●
●
●
●
●
●
●
●
●
●
●
●
●
●
●
●
●
●
●●
●
●
●
●
●
●
●
●
●
●
●
●
●
●
●
●
●
●
●
●
●
●
●
●
●
●
●
●
●
●
●
●
●
●
●
●
●
●
●
●
●
●
●
●
●
●
●
●
●
●
●
●
●
●
●
●
●
●
●
●
●
●
●
●
●
●
●
●
●
●
●
●
●
●
●
●
●
●
●
●
●
●
●
●
●
●
●
●
●
●
●
●
●
●
●
●
●
●
●
●
●
●
●
●
●
●
●
●
●
●
● ●
●
●
●
●
●
●
●
●
●
●
●
●
●
●
●
●
●
●
●
●
●
●
●
●
●
●
●
●
●
●
●
●
●
●
●●
●
●
●
●
●
●
●
●
●
●
●
●
●
●
●
●
●
● ●
●
●
●
●
●
●
●
●
●
●
●
●
●
●
●
●
●
●
●
●
●
●
●
●
●
● ●
●
●
●
●
●
●
●
●
●
●
●
●●
●
●
●
●
●
●
●
●
●
●
●
●
●●
●
●
●
●
●
●
●
● ●
●
●
●
●
●
●
●
●
●
●
●
●
●
●
●
●
●
●
●
●
●
●
●
●●
●
●
●
●
●
●
●
●
●
●
●
●
●
●
●
●
●
●
●
●
●
●
●
●●
●
●
●
●
●
●
●
●
●
●
●
●
●
●
●
●
●
●
●
●
●●
●
●●
●
●
●
●
●
●
●
●
●
●
●
●
●
●
●
●
●
●
●
●
●
●
●
●
●
●
●
●
●
●
●
●
●
●
●●
●
●
●
●
●
●
●
●
●
●
●
●
●
●
●
●
●
●
●
●
●
●
●
●
●
●
●
●
●
●
●
●
●
●
●
●
●
●
●
●
●
●
●
●
●
●
●
●
●
●
●
●
●
●
●
●
●
●
●
●
●
●
●
●
●
●
●
●
●
●
●
●
●●
●
●
●
●
●
●
●
●
●
●
●
●
●
●
●
●
●
●
●
●
●●
●
●
●
●
●
●
●
●
●
●
●
●
●
●
●
●
●
●
●
●
●
●
●
●
●
●
●
●
●
●
●
●
●
●
●
●
●
●
●
●
●
●
●
●
●
●
●
●
●
●
●
●
●
●
●
●
●
●
●●
●
●
●
●
●
●
●
●
●
●
●
●
●
●
●
●
●
●
●
●●
●
●
●
●
●
●
●
●
●
●
●
●
●
●
●
●
●
●
●
●
●
●
●
●
●
●
●
●
●
●
●
●
●
●
●
●
●
●
●
●
●
●
●
●
●
●
●
●
●
●
●
●
●
●
●
●
●
●
●
●
●
●
●
●
●
●
●
●
●
●
●
●
●
●
●
●
●
●
●
●
●
●
●
●
●
●
●
●
●
●
●
●
●
●
●
●
●
●
●
●
●
●
●
●
●
●
●
●
●
●
●
●
●
●
●
●
●
●
●
●
●
●
●
●
●
●
●
●
●
●
●
●
●
●●
●
●
●
●
●
●
●
●
●
●
●
●
●
●
●
●
●
●
●
●
●
●
●
●
●
●
●
●
●
●
●
●
●
●
●
●
●
●
●
●
●
●●
●
●
●
●
●
●
●
●
●
●
●
●
●
●
●
●
●
●
●
●
●
●
●
●
●
●
●
●
●
●
●
●
●
●
●
●
●
●
●
●
●
●
●
●
●
●
●
●
●
●
●
●
●
●
●
●
●
●
●
●
●
●
●
●
●
●
●
●
●
●
●
●
●
●
●
●
●
●
●
●
●
●
●
●
●
●
●
●
●
●
●
●
●
●
●
●
●
●
●●
●
●
●
●
●
●
●
●
●
●
●
●
●
●
●
●
●
●
●
●
●
●
●
●
●
●
●
●
●
●
●
●
●
●
●
●
●
●
●
●
●
●
●
●
●
●
●
●
●
●
●
●
●
●
●
●
●
●
●
●
●
●
●
●
●
●
●
●
●
●
●
●
●
●
●
●
●
●
●
●
●
●
●
●
●
●
●
●
●
●
●
●
●
●
●
●
●
●
●
●●
●
●
●
●
●
●
●
●
●
●
●
●
●
●
●
●
●
●
●
●
●
●
●
●
●
●
●
●
●
●
●
●
●
●
●
●
●
●
●
●
●
●
●
●
●
●●
●
●
●
●
●
●
●
●
●
●
●
●
●
●
●
●
●
●
●
●
●
●
●
●●
●
●
●
●
●
●
●
●
●
●
●
●
●
●
●
●
●
●
●
●●
●
●
●
●
●
●
●
●
●
●
●
●
●
●
●
●
●
●
●
●
●
●
●
●
●
●
●
●
●
●
●
●
●
●
●
●
●
●
●
●
●
●
●
●
●
●
●
●
●
●
●
●
●
●
●
●
●
●
●
●
●
●
●
●
●
●
●
●
●
●
●
●
●
●
●
●
●
●
●
●
●
●
●
●
●
●
●
●
●
●
●
●
●
●
●
●
●
●
●
●
●
●
●
●
●
●
●
●
●
●
●
●
●
●
●
●
●
●
●
●
●
●
●
●
●
●
●
●
●
●
●
●
●
●
●
●
●
●
●
●
●
●
●
●
●
●
●
●
●
●
●
●
●
●
●
●
●
●
●
●
●
●
●
●
●
●
●
●
●
●
●
●
●
●
●
●
●
●
●
●
●
●
●
●
●
●
●
●
●
●
●
●
●
●
●
●
●
●
●
●
●
●
●
●●
●
●
●
●
●
●
●
●
●
●
●
●●
●
●
●
●
●
●
●
●
●
●
●
●
●
●
●
●
●
●
●
●
●
●
●
●
●
●
●
●
●
●
●
●
●
●
●
●
●
●
●
●
●
●
●
●
●
●
●
●
●
●
● ●
●
●
●
●
●
●
●
●
●
●
●
●
●
●
●
●
●
●
●
●
●
●
●
●
●
●
●
●
●
●
●
●
●
●
●
●
●
●
●
●
●
●
●
●
●
●
●
●
●
●
●
●
●
●
●
●
●
●
●
●
●
●
●
●
●
●
●
●
●
●
●
●
●
●
●
●
●
●
●
●
●
●
●
●
●
●
●
●
●
●
●
●
●
●
●
●
●
●
●
●
●
●
●
●
●
●
●
●
●
●●
●
●
●
●●
●
●
●
●
●●
●
●
●
●
●
●
●
●
●
●
●
●
●
●
●
●
●
●
●
●
●
●
●
●
●
●
●
●
●
●
●
●
●
●
●
●
●
●
●
●
●
●●
●
●
●
●
●
●
●
●
●
●
●
●
●
●
●
●
●
●
●
●
●
●
●
●
●
●
●
●
●
●
●
●●
●
●
●
●
●
●
●
●
●
●
●
●
●
●
●
●
●
●
●
●
●
●
●
●
●
●
●
●
●
●
●
●
●
●
●
●
●
●
●
●
●
●
●
●
●
●
●
●
●
●
●
●
●
●
●
●
●
●
●
●●
●
●
●
●
●
●
●
●
●
●
●
●
●
●
●
●
●
●
●
●
●
●
●
●
●
●
●
●
●
●
●
●
●●
●
●
●
●●
●
●
●
●
●
●
●
●
●
●
●
●
●
●
●
●
●
●
●
●
●
●
●
●
●
●
●
●
●
●
●
●
●
● ●
●
●
●
●
●
●
●
●●
●
●
●
●
●
●
●
●
●
●
●
●
●
●
●
●
●
●
●
●
●
●
●
●
●
●
●
●
●
●
●
●
●
●
●
●
●
●
●
●
●
●
●
●
●
●
●
●
●
●
●
●
●
●
●
●
●
●
●
●
●
●
●
●
●
●
●
●
●
●
●
●
●
●
●
●
●
●
●
●
●
●
●
●
●
●
●
●
●
●
●
●●
●
●
●
●
●
●
●
●
●
●
●
●
●
●
●
●
●
● ●
●
●
●
●
●
●
●
●
●
●
●
●
●
●
●
●
●
●
●
●
●
●
●
●
●
●
●
●
●
●
●
●
●
●
●
●
●
●
●
●
●
●
●
●
●
●
●
●
●
●
●
●
●
●
●
●
●
●
●
●
●
●
●
●
●
●
●
●
●
●
●
●
●
●
●
●
●
●
●
●
●
●
●
●
●
●
●
●
●
●
●
●
●
●
●
●
●
●
●
●
●
●
●
●
●
●
●
●
●
●
●
●
●
●
●
●
●
●
●
●
●
●
●
●
●
●
●
●
●
●
●
●
●
●
●
●
●
●
●
●
●
●
●
●●
●
●
●
●
●
●
●
●
●●
●
●
●
●
●
●
●
●
●
●
●
●●
●
●
●
●
●
●
●
●
●
●
●
●
●
●
●
●
●
●
●
●
●
●
●
●
●
●
●
●
●
●●
●
●
●
●
●
●
●
●
●
●
●
●
●
●
●
●
●
●
●
●
●
●
●
●
●
●
●
●
●
●
●
●
●
●
●
●
●
●
●
●
●
●
●
●
●
●
●
●
●
●
●
●
●
●
●
●
●
●
●
●
●
●
●
●
●
●
●
●
●
●
●
●
●
●
● ●
●
●
●
●
●
●
●
●
●
●
●
●
●
●
●
●
●
●
●
●
●
●
●
●
●
●●
●
●●
●
●
●
●
●
●●
●
●
●
●
●
●
●
●
●
●
●
●
●
●
●
●
●
●
●
●
●
●
●
●
●
●
●
●
●
●
●
●
●
●
●
●
●
●
●●
●
●●
●
●
●
●
●
●
●
●
●
●
●
●
●
●
●
●
●
●
●
●
●
●
●
●
●
●
●
●
●
●
●
●
●
●
●
●
●
●
●
●
●
●
●
●●
●
●
●
●
●
●
●
●
●
●
●
●
●
●
●
●
●
●
●
●
●
●
●
●
●
●
●
●
●
●
●
●
●
●●
●
●
●
●
●
●
●●
●
●
●
●
●
●
●
●
●
●
●
●
●
●
●
●
●
●
●
●
●
●
●
●
●
●
●
●
●
●
●
●
●
●
●
●
●
●
●
●
●
●
●
●
●●
●
●
●
●
●
●
●
●
●
●
●
●
●
●
●
●
●
●
●
●
●
●
●
●
●
●●
●
●
●
●
●
●
●
●●
●
●
●
●
●
●
●
●
●
●
●
●
●
●
●
●
●
●
●
●
●
●
●
●
●
●
●
●
●
●
●
●
●
●
●
●
●
●
●
●
●
●
●
●
●
●
●
●
●
●
●
●
●
●
●
●
●
●
●
●
●
●
●
●
●
●
●
●
●
●
●
●
●
●
●
●
●
●
●
●
●
●
●
●
●
●
●
●
●●
●
●
●
●
●
●
●
●
●
●
●
●
●
●
●
●
●
●
●
●
●
●
●
●
●
●
●
●
●
●
●
●
●
●
●
●
●
●
●
●
●
●
●
●
●
●
●
●
●
●
●
●
●
●
●
●
●
●
●
●
●
●
●
●
●
●
●
●
●
●
●
●
●
●
●
●
●
●
●
●
●
●
●
●
●
●
●
●
●
●
●
●
●
●
●
●
●
●
●
●
●
●
●
●
●
●
●
●
●
●
●
●
●
●
●
●
●
●
●
●
●
●
●
●
●●
●
●
●
●
●
●
●
●
●
●
●
●
●
●
●
●
●
●
●
●
●
●
●
●
●
●
●
●
●
●
●
●
●
●
●
●
●
●
●
●
●
●
●
●
●
●
●
●
●
●
●
●
●
●
●
●
●
●
●
●
●
●
●
●
●
●
●
●
●
●
●
●
●
●
●
●
●
●
●
●
●
●
●
●
●
●
●
●
●
●
●
●
●
●
●
●
●
●
●
●
●
●
●
●
●
●
●
●
●
●
●
●
●
●
●
●
●
●
●
●
●
●
●
●
●
●
●
●
●
●
●
●
●
●
●
●
●
●
●
●
●
●
● ●
●
●
●
●
●
●●
●
●
●
●
●
●
●
●
●
●
●
●
●
●
●
●
●
●
●
●
●
●
●
●
●
●
●
●
●
●
●
●
●
●
●
●
●
●
●
●
●
●
●
●
●
●
●
●●
●
●
●
●
●
●
●
●
●
●
●●
●
●
●
●
●
●
●
●
●
●
●●
●
●
●
●
●
●
●
●
●
●
●
●
●
●
●
●
●
●
●
●
●
●
●
●
●
●
●
●
●
●
●
●
●
●
●
●
●
●
●
●
●
●
●
●
●
●
●
●
●
●
●
●
●
●
●
●
●
●
●
●
●
●
●
●
●
●
●
●
●
●
●
●
●
●
●
●
●
●
●
●
●
●
●
●
●
●
●
●
●
●
●
●
●
●
●
●
●●
●
●
●
●
●
●
●
●
●
●
●
●
●
●
●
●
●
●
●
●
●
●
●
●
●
●
●
● ●
●
●
●
●
●
●
●
●
●
●
●
●
●
●
●
●
●
●
●
●
●
●
●
●
●
●
●
●
●
●
●
●
●
●
●
●
●
●
●
●
●
●
●
●
●
●
●
●
●
●
●
●
●
●
●
●
●
●
●
●
●
●
●
●
●
●
●
●
●
●
●
●
●
●
●
●
●
●
●
●
●
●●
●
●
●
●
●
●
●
●
●
●
●
●●
●
●●
●
●
●
●
●
●
●
●
●
●
●
●
●
●
●
●
●
●
●
●
●
●
●
●
●
●
●
●
●
●
●
●
●
●
●●
●
●
●
●
●
●
●
●
●
●
●
●
●●
●
●
●
●
●
●
●
●
●
●
●
●
●
●●
●
●
●
●
●
●
●
●
●
●
●
●
●
●
●
●
●
●
●
●
●
●
●
●
●
●
●
●
●
●
●
●
●
●
●
●
●
●
●
●
●
●
●
●
●
●
●
●
●
●
●
●
●
●
●
●
●
●
●
●
●
●
●●
●
●
●
●
●
●
●
●
●
● ●
●
●●
●
●
●
●
●
●
●
●
●
●
●
● ●
●
●
●
●
●●
●
●
●
●
●
●
●
●
●
●
●
●
●
●
●
●
●
●
●
●
●
●
●
●
●
●
●
●
●
●
●
●
●
●
●
●
●
●
●
●
●
●
●
●
●
●
●
●
●
●
●
●
●
●
●
●
●
●
●
●
●
●
●
●
●
●
●
●
●
●
●
●
●
●
●
●
●
●
●
●●
●
●
●
●
●
●
●
●
●
●
●
●
●
●
●
●
●
●
●●
●
●
●
●
●
●
●
●
●
●
●
●
●
●
●
●
●
●
●
● ●
●
●
●
●
●
●
●
●
●
●
●
●
●
●
●
●
●
●
●
●
●
●
●
●
●
●
●
●
●
●
●
●
●
●
●
●
●
●
●
●
●
●
●●
●
●
●
●
●
●
●
●
●
●
●
●
●
●
●
●
●
●
●
●
●
●
●
●
●
●
●
●
●
●
●
●
●
●
●
●
●
●
●
●
●
●
●
●
●
●
●
●
●
●
●
●
●
●
●
●
●
●
●
●
●
●
●
●
●
●
●
●
●
●
●
●
●
●
●
●
●
●
●
●
●
●
●
●
●
●●
●
●
●
●
●
● ●
●
●
●
●
●
●
●
●
●
●
●
●
●
●
●
●
●
●
●
●
●
●
●
●
●
●●
●
●
●
●
●
●
●
●
●
●
●
●
●
●
●
●
●
●
●
●
●
●
●
●
●
●
●
●
●
●
●
●
●
●
●
●
●
●
●
●
●
●
●
●
●
●
●
●
●
●
●
●
●
●
●
●
●
●
●
●
●
●
●
●
●
●
●
●
●
●
●
●
●
●
●
●
●●
●
●
●●
●
●
●
●
●
●
●
●
●
●
●
●
●
●
●
●
●●
●
●
●
●
●
●
●
●
●
●
●
●
●
●
●
●
●
●
●
●
●
●
●
●
●
●
●
●
●
●
●
●
● ●
●
●
●
●
●
●
●
●
●
●
●
●
●
●
●
●
●
●
●
●
●
●
●
●
●
●
●●
●
●
●
●
●
●
●
●
●
●
●
●
●
●
●
●
●
●
●
●●
●
●
●
●
●
●
●
●
●
●
●
●
●
●
●
●
●
●
●
●
●
●
●
●
●
●
●
●
●
●
●
●
●
●
●
●
●
●
●●
●
●
●
●
●
●
●
●
●
●
●
●
●
●
●
●
●●
●
●
●
●
●
●
●
●
●
●
●
●
●
●
●
●●
●
●
●
●
●
●
●
●
●
●
●
●
●
●
●
●
●
●
●
●
●
●
●
●
●
●
●
●
●
●
●
●
●
●
●
●
●
●
●
●
●
●
●
●
●
●
●
●
●
●
●
●
●
●
●
●
●
●
●
●
●
●
●
●
●
●
●
●
●
●
●
●
●
●
●
●
●
●
●
●
●
●
●
●
●
●
●
●
●
●
●
●
●
●
●
●
●
●
●
●
●
●
●
●
●
●
●
●
●
●
●
●
●
●
●
●
●
●
●
●
●
●
●
●
●
●
●
●
●
●
●
●
●
●
●
●
●
●
●
●
●●
●
●
●
●
●
●
●
●
●
●
●
●
●
●
●
●
●
●
●
●
●
●
●
●
●
●
●
●
●
●
●
●
●
●
●
●
●
●
●
●
●
●
●
●
●
●
●
●
●
●
●
●
●
●
●
●
●
●
●
●
●
●
●
●
●
●
●
●
●
●
●
●
●
●
●
●
●
●
●
●
●
●
●
●
●
●
●
●
●
●
●
●
●
●
●
●
●
●
●
●
●
●
●
●
●
●
●
●
●
●
●
●
●
●
●●
●
●
●
●
●
●
●
●
●
●
●
●
●
●
●
●
●
●
●
●
●
●
●
●
●
●●
●
●
●
●
●
●
●
●
●
●
●●
●
●
●
●
●
●
●
●
●
●
●
●
●
●
●
●
●
●
●
●
●
●
●
●
●
●
●
●
●●
●
●
●
●
●
●
●
●
●
●
●
●
●
●
●
●
●
●
●
●
●
●
●
●
●
●
●
●
●
●
●
●
●
●
●
●
●
●
●
●
●
●
●
●
●
●
●
●
●
●
●
●
●
●
●
●
●
●
●
● ●
●
●
●
●
●
●
●
●
●
●
●
●
●
●
●
●
●
●
●
●
●
●
●
●
●
●
●
●
●
●
●
●
●
●
●●
●
●
●
●
●
●
●
●
●
●
●
●
●
●
●
●
●
●
●
●
●
●
●
●
●
●
●
●
●
●
●
●
●
●
●
●
●
●●
●
●
●
●
●
●
●
●
●
●
●●
●
●
●
●
●
●
●
●
●●
●
●
●
●
●
●
●
●
●
●
●
●
●
●
●●
●
●
●
●
●
●
●
●
●
●
●
●
●
●
●
●
●
●
●●
●
●
●
●
●
●
●
●
●
●
●
●
●
●
●
●
●
●
●
●
●
●
●
●
●
●
●
●
●
●
●
●
●
●
●
●
●
●
●
●
●
●
●
●
●
●
●
●
●
●
●
●
●
●●
●
●
●
●
●
●
●
●
●
●
●
●
●
●
●
●
●
●
●
●
●
●
●
●
●
●
●
●
●
●
●
●
●
●
●
●
●
●
●
●
●
●
●
●
●
●
●
●
●
●
●
●
●
●
●
●
●
●
●
●
●
●
●
●
●
●
●
●
●
●
●
●
●
●
●
●
●
●
●
●
● ●●
● ●
●
●
●
●
●
●
●
●
●●
●
●
●
●●
●
●
●
●
●
●
●
●
●
●
●
●
●
●
●
●
●
●
●
●
●
●
●
●
●
●
●
●
●
●
●
●
●
●
●
●
●
●
●
●
●
●
●
●
●
●
●
●
●
●●
●
●
●
●
●
●
●
●
●
●
●
●
●
●
●
●
●
●
●
●
●
●
●
●
●
●
●●
●
●
●
●
●
●
●
●
●
●
●
●
●
●
●
●
●
●
●
●
●
●
●
●
●
●
●
●
●
●
●
●
●
●
●
●
●
●
●
●
●
●
●
●
●
●
●
●
●
●
●
●
●
●
●
●
● ●
●
●
●
●
●
●
●
●
●
●
●
●
●
●
●
●
●
●
●
●
●
●
●
●
●
●
●
●
●
●
●
●●
●
●
●
●
●
●
●
●
●
●
●
●
●
●
●
●
●
●
●
●
●
●
●
●
●
●
●
●
●
●
●
●
●
●
●
●
●
●
●
●
●
●
●
●
●
●
●
●
●
●
●
●
●
●
●
●
●
●
●
●
●
●
●
●
●
●
●
●
●
●
●
●
●
●
●●
●
●
●
●
●
●
●
●
●
●
●
●
●
●
●
●
●
●
●
●
●
●
●
●
●
●
●
●
●
●
●
●
●
●
●
●
●
●
●
●
●
●
●
● ●
●
●
●
●
●
●
●
●
●
●
●
●
●
●
●
●
●
●
●
●
●
●
●
●
●
●
●
●
●
●
●
●
●
●
●
●
●
●
●
●
●
●
●
●
●
●
●
●
●
●
●
●
●
●
●
●
●
●
●
●
●
●
●
●
●
●
●
●
●
●
●
●
●
●
●
●
●
●
●
●
●
●
●
●
●
●
●
●
●
●
●
●
●
●
●
●
●
●
●
●
●
●
●
●
●
●
●
●
●
●
●
●
●
●
●
●
●
●
●
●
●
●
●
●
●
●
●
●
●●
●
●
●
●
●
●
●●
●
●
●
●
●
●
●
●
●
●
●
●
●
●
●
●
●
●
●
●
●
●
●
●
●
●
●
●
●
●
●
●
●
●
●
●●
●
●
●
●
●
●
●
●
●
●
●
●
●
●
●
●
●
●
●
●
●
●
●
●
●
●
●
●
●
●
●
●
●
●
●
●
●
●
●
●●
●
●
●
●●
●
●
●
●
●
●
●
●
●
●
●
●
●
●
●
●
●
●
●
●
●
●
●
●
●
●
●
●
●
●
●
●
●
●
●
●
●
●
●
●
●
●
●
●
●
●
●
●●
●
●
●
●
●
●
●
●
●
●
●
●
●
●
●
●
●
●
●
●
●
●
●
●
●
●
●
●
●
●
●
●
●
● ●
●
●
●
●●
●
●
●
●
●
●
●
●
●
●
●
●
●
●
●
●
●
●
●
●
●
●
●
●
●
●
●
● ●
●
●
●
●
●
●
●
● ●
●
●
●
●
●
●
●
●
●
●
●
●
●●
●
●
●
●
●
●
●
●
●
●
●
●
●
●
●
●
●
●
●
●
●
●
●
●
●
●
●
●
●
●
●
●
●
●
●
●
●
●
●
●
●
●
●
●
●
●
●
●
●
●
●
●
●
●
●
●
●
●
●●
●
●
●
●
●
●
●
●
●
●
●
●
●
●
●
●
●
●
●
●
●
●
●
●
●
●
●
●
●
●
●
●
●
●
●
●
●
●
●
●
●
●●
●
●
●
●
●
●
●
●
●
●
●
●
●
●
●
●
●
●
●
●
●
●
●
●
●
●
●
●
●●
●
●
●
●
●
●
●
●
●
●
●
●
●
●
●
●
●
●
●
●
●
●
●
●
●●
●
●
●
●
●
●
●
●
●
●
●
●
●●
●
●
●
●
●
●
●
●
●
●
●
●
●
●
●
●
●
●
●
●
●
●
●
●
●
● ●
●
●
●
●
●
●
●
●
●
●
●
●
●
●
●
●
●
●
●
●
●
●
●
●
●
●●
●
●
●
●
●
●
●
●
●
●
●
●
●
●
●
●
●
●
●
●
●
●
●
●
●
●
●
●
●
●
●
●●
●
●
●
●
●
●
●
●
●
●
●
●
●
●
●
●
●
●
●
●
●
●
●
●
●
●
●
●
●
●
●
●
●
●
●
●
●
●
●
●
●
●
●
●
●
●
●
●
●●
●
●
●
●
●
●
●
●
●
●
●
●
●
●
●
●
●
●
●
●
●
●
●
●●
●
●
●
●●
●
●
●
●
●
●
●
●
●
●
●
●
●
●
●
●
●
●
●
●
●
●
●
●●
●
●
●
●
●
●
●
●
●●
●
●●
●
●
●
●
●
●
●
●
●
●
●
●
●
●
●
●
●
●
●
●
●
●
●
●
●
●
●
●
●
●
●
●
●
●
●
●
●
●
●
●
●
●
●
●
●
● ●
●
●
●
●
●
●
●
●
●
●
●
●
●
●
●
●
●
●
●●
●
●
●
●
●
●
●
●
●
●
●
●
●
●
●
●
●
●
●
●
●
●
●
●
●
●
●
●
● ●
●
●
●
●
●
●
●
●
●
●
●
●
●
●
●
●
●●
●●
●
●
●
●
●
●
●
●
●
●
●●●
●
●
●
●
●
●
●
●
●
●
●
●
●
●
●
●
●●
●
●●
●
●
●
●
●
●
●
●
●
●
●
●
●
●
●
●
●
●
●
●
●
●
●
●
●
●
●
●
●
●
●
●
●
●
●
●
●●
●
●
●
●
●
●
●
●
●
●
●
●
●
●
●
●
●
●
●
●
●
●
●
●
●
●
●
●●
●
●
●
●●
●
●
●
●
●
●
●
●
●
●
●
●
●
●
●
●
●
●
●
●
●
●
●
●
●
●
●
●
●
●
●
●
●
●
●
●
●
●
●
●
●
●
●
●
● ●
●
●
●
●
●
●
●
●
●
●
●
●
●
●
●
●
●
●
●●
●
●
●
●
●
●
●
●
●
● ●
● ●
●
●
●
●
●
●
●
●
●
●
●
●
●
●
●
●
●
●
●
●
●
●
●
●
●
●
●
●
●
●
●
●
●
●
●
●
●
●
●
●
●
●
● ●
●
● ●
●
●
●
●
●
●
●
●
●
●
●
●
●
●
●
●
●
●
●
●
●
●
●
●
●
●
●
●
●
●
●
●
●
●
●
●
●
●
●
●
●
●
●
●
●
●
●
●
●●
●
●
●
●
●
●
●
●
●
●
●
●
●
●
●
●
●
●
●
●
●
●
●
●
●
●
●●
●
●
●
● ●
●
●
●
●
●
●
●
●
●
●
●
●
●
●
●
●
●
●
●
●
●
●
●
●
●
●
●
●
●
●
●
●
●
●
●
●
●
●
●
●
●
●
●●
●
●
●
●
●
●
●
●
●
●
●
●
●
●
●
●
●
●
●
●
●
●
●
● ●
●
●
●
●
●
●
●
●
●
●
●
●
●
●
●
●
●
●
●●
●
●
●
●
●
●
●
●
●
●
●
●
●
●
●
●
●
●
●
●
●
●
●
●
●
●
●
●
●
●
●
●
●
●
●
●
●
●
●
●
●
●
●
●
●
●
●
●
●●
●
●
●
●
●
●
●
●
●
●
●
●
●
●
●
●
●
●
●
●
●
●
●
●
●
●
●
●
●
●
●
●
●●
●
●
●
●
●
●
●
●
●
●
●
●
● ●
●
●
●
●
●
●●
●
●
●●
●
●
●
●●
●
●
●
●
●
●
●
●
●
●
●
●
●
●
●
●
●
●
●
●
●
●
●
●
●
●
●
●
●
●
●
●
●
●
●
●
●
●
●
●
●
●
●
●
●
●
●
●
●
●
●●
●
●
●
●
●
●
●
●
●
●
●
●
●
●
● ●
●
●
●
●
●
●
●●
●
● ●
●
●
●
●
●
●
●
●
●
●
●
●
●
●
●
●
●
●
●
●
●
●
●
●
●
●
●
●
●
●
●
●
●
●
●
●
●
●
●
●
●
●
●
●
●●
●
●
●
●
●
●
●
●
●
●
●
●
●
●
●
●
●
●
●
●
●
●
●
●
●
●
●
●
●
●
●
●
●
●
●
●
●
●
●
●
●
●
●
●
●
●
●
●
●
●
●
●
●
●
●
●
●
●
●
●
●
●
●
●
●
●
●
●
●
●●
●
●
●
●
●
●
●
●
●
●
●
●
●
●
●
●
●
●
●
●
●
●
●
●
●
●
●
●
●
●
●
●
●
●
●
●
●
●
●
●
●
●
●
●
●
● ●
●
●
●
●
●
●
●
●
●
●
●
●
●
●
●
●
●
●
●●
●
●
●
●
●
●
●
●
●
●
●
●
●
●
●
●
●
●
●
●
●
●
●
●
●
●
●
●
●
●
●
●
●
●
●
●●
● ●
●
●
●
●
●
●
●
●
●
●
●
●
●
●
●
●
●
●
●
●
●
●
●
●
●
●
●
●
●
●
●
●
●
●●
●
●
●
●
●
● ●
●
●
●
●
●
●
●
●
●
●
●
●
●
●
●
●
●
●
●
●
●
●
●
●
●
●
●
●
●
●
●
●
●
●●
●
●
●
●
● ●
●●
●
●
●
●
●
●
●
●
●
●
●
●
●
●
●
●
●
●
●
●
●
●
●
●
●
●
●
●
●
●
●
●
●
●
●
●
●
●
●
●
●
●
●
●
●
●
●
●
●
●
●
●
●
●
●
●
●
●
●
●
●
●
●
●
●
●
●
●
●
●
●
●
●
●
●
●
●
●
●
●
●
●
●
●
●●
●
●
●
●
●
●
●
●
●
●
●
●
●
●
●
●
●
●
●
●
●
●
●
●
●
●
●
●
●
●
●
●
●
●
●
●
●
●
●
●
●
●
●
●
●
●
●
●
●
●
●
●
●
●
●
●
●
●
●
●
●
●
●
●
●
●
●
●
●
●
●●
●
●
●
●
●
●
●
●
●
●
●
●
●●
●
●
●
●
●
●
●
●
●
●
●
●
●
●
●
●
●
●
●
●
●
●
●●
●
●
●
●
●
●
●
●
●
●
●
●
●
●●
●
●
●
●
●
●
●
●
●
●
●
●
●
●
●
●
●
●
●
●
●
●
●●
●
●●
●
●
●
●
●
●
●
●
●
●
●
●
●
●
●
●
●
●
●
●
●
●
●
●●
●
●
●
●
●
●
●
●
●
●
●
●
●
●
●
●
●
●
●
●
●
●
●●
●
●●
●
●
●
●
●
●
●
●
●
●
●
●
●
●
●
●
●
●
●
●
●
●
●
●
● ●
●
●
●
●
●
●
●
●
●
●
●
●
●
●
●
●
●
●
●
●
●
●
●
●
●
●
●
●
●
●
●
●
●
●
●
●
●
●
●
●
●
●
●
●
●
●
●
●●
●
●
●
●
●
●
●
●
●
●
●
●●
●
●
●
●
●
●
●
●
●
●
●
●
●
●
●
●
●
●
●
●
●
●
●
●
●
●
●
●
●
●
●
●
●
●
●
●
●
●
●
●
●
● ●
●
●
●
●
●
●
●
●
●●
●
●
●
●
●
●
●
●
●
●
●
●
●
●●
●
●
●
●
●
●
●
●
●
●
● ●
●
●●
●
●
●
●
●
●
●
●
●
●
●
●
●
●
●
●
●
●
●
●
●
●
●
●
●
●
●
●
●
●
●
●
●
●
●
●
●
● ●
●
●
●
●
●
●
●
●
●
●
●
●
●
●
●
●
●
●
●
●
●
●
●
●
●
●
●
●
●
●
●
●
●
●
●
●
●
●
●
●
●
●
●
●●
●
●
●
●
●
●
●
●
●
●
●
●
●
●
●
●
●●
●
●
●
●
●
●
●
●
●
●
●
●
●
●
●
●
●
●
●
●
●
●
●
●
●
●
●
●●
●
●
●
●
●
●
●
●
●
●
●
●
●
●
●
●
●
●
●
●
●
●
●
●
●
●
●
●
●
●
●
●
●
●
●
●
●
●
●
●
●
●
●
●●
●
●
●
●
●
●
●
●
●
●
●
●
●
●
●●
●
●
●
●
●
●
●
●
●
●
●
●
●
●
●
●
●
●
●
●
●
●
●
●
●
●
●
●
●
●
●
●
●
●
●
●
●
●
●
●
●
●
●
●
●
●
●
●
●
● ●
●
●
●
●
●
●
●●
●
●
●
●
●
●
●●
●
●
●
●
●
●
●
●
●
●
●
●
●
●
●
●
●
●
●
●
●
●
●
●
●
●
●
●
●
●
●
●
●
●
●
●
●
●
●
●
●
●
●
●
●
●
●
●
●
●
●
●
●
●
●
●
●
●
●
●
●
●
●
●●
●●
●
●
●
●
●
●
●
●
●
●
●
●
●
●
●
●
●
●
●
●
●
●
●
●
●
●
●
●
●
●
●
●
●
●
●
● ●
●
●
●
●
●
●
●
● ●●
●
●
●
●
●
●
●
●
●
●
●
●
●
●
●
●
●
●
●
●
●
●
●
●
●
●
●
●
●
●
●
●
●
●
●
●●
●
●
●
●
●
●
●
●
●
●
●
●
●
●
●
●
●
●
●
●
●
●
●
●
●
●
●
●
●
●
●
●
●
●
●
●
●
●
●
●
●
●
●
●
●
●
●
●
●
●
●
●
●
●
●
●
●
●
●
●
●
●
●
●
●
●
●
●
●
●
●
●
●
●
●
●
●
●
●
●
●
●
●
●
●
●
●
●
●
●
●
●
●
●
●
●
●
●
●
●
●
●
●
●
●
●
●
●
●
●
●
●
●
●
●●
●
●
●
●
●
● ●
●
●
●
●
●
●
●
●
●
●
●
●
●
●
●
●
●
●
●
●
●
●
●
●
●
●
●
●
●
●
●
●
●
●
●
●
●
●
●
●
●
●
●
●
●
●
●
●
●
●
●
●
●
●
●
●
●
●
●
●
●
●
●
●
●
●
●
●
●
●
●
●
●
●
●●
●
●
●
●
●
●
●
●
●
●
●
●
●
●
●
●
●
●
●
●
●
●
●
●
●
●
●
●
●
●
●
●
●●
●
●
●
●
●
●
●
●
●
●
●
●
●
●
●
●
●
●
●
●
●
●
●
●
●
●
●
●
●
●
●
●●
●
●●
●
●
●
●
●
●
●
●
●
●
●
●
●
●
●
●
●
●
●
●
●
●
●
●
●
●
●
●
●
●
●●
●
●
●
●
●
●
●
●
●
●
●
●
●
●
●
●
●
●
●
●
●
●
●
●
●
●
●
●
●
●
●
●
●
●
●
●
●
●
●
●
●
●
●
●
●
●
●
●
●
●
●
●
●
●
●
●
●
●
●
●
●
●
●
●
●
●
●
●
●
●
●
●
●
●
●
●●
●
●
●
●
●
●
●
●
●
●
●
●
●
●
●
●
●
●
●
●
●
●
●
●●
●
●
●
●
●
●
●
●
●
●
●
●
●
●●
●
●
●
●
●
●
●
●
●
●
●
●
●
●
●
●
● ●
●
●
●
●
●
●
●
●
●
●
●
●
●
●
●
●
●
●
●
●
●
●
●
●
●
●
●
●
●
● ●
●
●
●
●
●
●
●
●
●
●
●
● ●
●
●
●
●
●
●
●
●
●
●
●
●
●
●
●
●
●
●
●
●
●
●●
●
●
●
●
●
●
●
●
●●
●
●
●
●
●
●
●●
●
●
●
●●
●
●
●
●
●
●
●
●
●
●
●
●
●
●
●
●
●
●
●
●
●
●
●
●
●
●●
●
●
●
●
●
●
●
●●
●
●
●
●
●
●
●
●
●
●
●
●
●
●
●
●
●
●
●
●
●
●
●
●
●
●
●
●
●
●
●
●
●
●
●
●
●
●
●
●
●
●
●
●
●
●
●
●
●
●
●
●
●
●●
●
●
●
●
●
●
●
●
●
●
●
●
●
●
●●
●
●
●
●
●
●
●
●●
●
●
●
●
●
●
●
●
●
●
●
●
●
●
●
●
●
●
●
●
●
●
●
●
●
●
●
●
●
●
●
●
●
●
●
●
●
●
●●
●
●
●
●
●
●
●
●
●
●
●
●
●
●
●
●
●
●
●
●
●
●
●
●
●
●
●
●
●
●
●
●
●
●
●
●
●
●
●
●
●
●
●
●
●
●
●
●
●
●
●
●
●
●
●
●
●
●
●
●
●
●
●●
●
●
●
●
●
●
●
●
●
●
●
●
●
●●
●
●
●
●●
●
●
●
●
●
●
●
●
●
●
●
●
●
●
●
●
●
●
●
●
●
●
●
●
●
●
●
●
●
●
●
●
●
●
●
●
●
●
●
●
●
●
●
●
●
●●
●
●
●
●
●
●
●
●
●
●
●
●
●
●
●
●
●
●
●
●
●
●
●
●
●
●
●
●
●
●
●
●
●
●
●
●
●
●
●
●
●
●
●
●
●
●
●
●
●
●●
●
●
●
●
●
●
●
●
●
●
●
●
●●
●
●
●
●
●
●
●
●
●
●
●
●
●
●
●
●
●
●
●
●
●
●
●
●
●
●
●
●
●
●
●
●
●
●
●
●
●
●
●
●
●
●
●
●
●
●
●
●
●
●
●
●
●
●
●
●
●
●
●
●
●
●
●
●
●
●
●
●
●
● ●
●
●
●
●
●
●
●
●
●
●
●
●●
●
● ●●
●
●
●
●
●
●
●
●
●
●
●
●
●
●
●
●
●
●
●
●
●
●
●
●
●
●
●
●
●
●●
●
●
●
●
●
● ●
●
●
●
●
●
●
●
●
●
●
●
●
●
●
●
●
●
●
●
●
●
●
●
●
●
●
●
●
●
●
●
●
●
●
●
●
●
●
●
●
●
●
●
●
●
●
●
●
●
●
●
●
●
●
●
●
●●
●
●
●
●
●
●
●
●
●
●
●
●
●
●
●
●
●
●
●
●
●
●
●
●
●
●
●
●
●
●
●
●
●
●
●
●
●
●
●
●
●
●
●
●
●
●
●
●
●
●
●
●
●
●
●
●
●
●
●
●
●
●
●
●
●
●
●●
●
●
●
●
●
●
●
●
●
●
●
●
●
●
●
●
●
●
●
●
●
●
●
●
●
●
●
●
●
●
●
●
●
●●
●
●
●
●
●●
●
●
●
●
●
●
●
●
●
●●
●
●
●
●
●
●
●
●
●
●
●
●
●
●
●
●
●
●
●
●
●●
●
●
● ●
●
●
●●
●
●
●
●
●
●
●
●
●
●
●
●
●
●
●
●
●
●
●
●
●
●
●
●
●
●
●
●
●
●
●
●
●
●
●
●
●
●
●
●
●
●
●
●
●
●
●
●
●
●
●
●
●
●
●
●
●
●
●
●
●
●
●
●
●
●
●
●
●
●
●
●
●
●
●
●
●
●
●
●
●
●
●
●
●
●
●
●
●
●
●
●
●
●
●
●
●
●
●
●
●
●
●
●
●
●
●
●
●
●
●
●
●
●
●
●
●
●●●
●
●
●
●●
●●
●
●
●
●
●
●
●
●
●
●
●
●
●
●
●
●
●
● ●
●
●
●
●●
●
●
●
●
●
●
●
●
●
●
●
●
●
●
●
●
●
●
●
●●
●
●
●
●
● ●
●
●
●
●
●
●
●
●
●
●
●
●●
●
●
●
●
●
●
●
●
●
●
●
●
●
●
●●
●
●
●
●
●
●
●
●
●
●
●
●
●
●
●
●●
●
●
●
●
●
●
●
●
●
●
●
●
●
●
●
●
●
●
●
●
●
●
●
●
●
●
●
●
●
●
●
●
●
●
●
●
●
●
●
●
●
●
●
●
●
●
●
●
●
●
●●
●
●
●
●
●
●
●
●
●
●
●
●
●
●
●
●
●
●
●●
●
●
●
●
●
●
●
●
●
●
●
●
●
●
●
●
●
●
●
●
●
●●
●
●
●
●
●●
● ●●
●
●
●
●
●
●
●●
●
●
● ●
●
●
●
●
●●
●
●
●
●
●
●
●
●
●
●
●
●
●
●
●
●
●
●
●
●
●
●
●
●
●
●
●
●
●
●
●
●
●
●
●
●
●
●
●●
●
●
●
●
●
●
●
●
●●
●
●
●
●
●
● ●
●
●
●
●
●
●
●
●
●
●
●
●
●
●
●
●
●●
●
●
●
●
●
●
●
●
●
●
●
●
●
●
●
●
●
●
●
●
●
●
●●●
●
●
●
●
●
●
●
●
●
●
●
●
●
●
●
●
●
●
●
●
●
●
●
●
●
●
●
●
●
●
●
●
●
●
●
●
●
●
●
●
●
●
●
●
●
●
●
●
●
●
●
●
●
●
●
●
●
●
●
●
●
●●●
●
●
●
●
●
●●
●
●
●
●
●
●
●
●
●
●
●
●
●
●
●
●
●
●
●
●
●
●
●
●
●
●
●
●
●
●
●
●
●
●
●
●
●
●
● ●
●
●
●
●
●
●
●
●
●
●
●
●
●
●
●
●
●
●
●
●
●
●
●●
●
●
●
●
●
●
●
●
●
●
●
●
●
●
●
●
●
●
●
●
●
●
●
●
●
●
●
●
●●
●
●
●
●●
●
●
●
●
●
●
●
●
●
●
●
●
●
● ●
●
●
●
●
●
●
●
●
●
●
●
●
●
●
●
●
●●
●
●
●
●
●
●
●
●
●
●
●
●
●
●
●
●
●
●
●
●
●
●
●
●
●
●
●
●
●
●
●
●
●
●
●
●
●
●
●
●
●
●
●
●
●
●
●
●
●
●
●
●
●
●
●
●
●
●
●
●
●
●
●
●
●
●
●
●●
●
●
●
●
●
●●
●
●
●
●
●
●
●
●
●
●
●
●
●
●
●
●
●
●
●
●●
●
●
●
●
●
●
●
●
●
●
● ●
●
●
● ●
●
●
●
●
●
●
●
●
●
●
●
●
●
●
●
●
●
●
●
●
●
●
●
●
●
●
●
●
●
●
●
●
●
●
●
●
●
●
●
●
●
●
●
●
●
●
●
●
●
●
●
●
●
●
●●
●●
●
●
●
●
●
●
●
●
●
●
●
●
●
●
●
●
●
●
●●
●
●
●
●
●
●
●
●
●
●
●
●
●
●
●
●
●
●●
●
●
●
●
●
●
●
●
●
●
●
●
●
●
●
●
●
●
●
●
●
●
●
●
●
●
●
●
●
●
●
●
●
●
●
●
●
●
●
●
●
●
●
●
●
●
●
●
●
●
●
●
●
●
●
●
●
●
●
●
●
●
●
●
●
●
●
●●
●
●
●
●
●
●
●
●
● ●
●
●
●
●
●
●
●
●
●
●●
●
●
●
●
●
●
●
●●
●
●
●
●
●
●
●
●
●
●
●
●
●
●●
●
●
●
●●
●
●
●
●
●
●
●
●
●
●
●
●
●
●
●
●
●
●
●
●
●
●
●
●
●
●
●
●
●
●
●
●
●
●
●
●
●
●
●
●
●
●
●●
●
●
●
●
●
●
●
●
●
●
●●
●●
●
●
●
●
●
●
●
●
●
●
●
●
●
●
●
●
●
●
●
●
●
●
●
●
●
●
●
●
●
●
●
●
●
●
●
●
●
●
●
● ●
●
●
●
●
●
●
●
●
●
●
●
●
●
●
●
●
●
●
●
●
●
●
●●
●
●
●
●
●
●
●
●
●
●
●
●
●
●
●
●
●
●
●
●
●
●
●
●
●
●
●
●
●
●
●
●
●
●
●
●
●
●
●
●
●
●
●
●
●
●
●
●●
●
●
●
●
●
●
●
●
●
●
●
●
●
●
●●
●
●
●
●
●
●
●
●
●
●
●
●
●
●
●
●
●
●
●
●
●
●
●
●
●
●
●
●
●
●
●
●
●●
●
●
●
●
●
●
●
●
●
●
●
●
●
●
●●
●
●
●
●
●
●
●
●
●
●
●
●
●
●
●
●
●
●
●
●
●
●
●
●
●
●
●
●
●
●
●
●
●
●
●
●
●
●
●
●
●
●
●
●
●
●
●
●
●
●
●
●●
●
●
●
●
●
●
●
●
●
●
●
●
●
●
●
●
●
●
●
●
●
●
●
●
●
●
●
●
●
●
●
●
●
●
●
●
●
●
●
●
●
●
●
●
●
●
●
●
●
●
●
●
●
●
●●
●
●
●●
●
●
●
●
●
●
●
●
●
●
●
●
●
●
●
●
●
●
●
●
● ●
●
●
●
●
●
●
●
●
●●
●
●
●
●
●
●
●●
●
●
●
●
●
●
●
●
●
●
●
●
●
●
●
●
●
●
●
●
●
●
●
●
● ●
●
●
●
●
●
●
●
●
●
●
●
●
●
●
●
●
●
●
●
●
●
●
●
●
●
●
●
●
●
●
●
●
●
●
●
●
●
●
●
●
●
●
●
●
●
●
●
●
●
●
●
●●
●
●
●
●
●
●
●
●
●
●
●
●
●
●
●
●
●
●
●
●
●
●
●
●
●
●
●
●
●
●
●
●
●
●
●
●
●
●
●
●
●
●
●
●
●
●
●
●
●
●
●
●
●
●
●
●
●
●
●
●
●
●
●
●
●
●
●
●
●
●
●
●
●
●
●
●
●
●
●
●
●
●
●
●
●
●
●
●
●
●
●
●
●
● ●
●
●
●
●
●
●
●
●●
●
●
●
●
●
●
●
●
●
●
●
●
●
●
●
●
●
●
●
●
●●
●
●
●
●
●
●
●
●
●
●
●
●
●
●
●
●
●
●
●
●
●
●
●
●
●
●
●
●
●
●
●
●
●
●
●●
●
●
●
●
●
●
●
●
●
●
●
●
●
●
●
●
●
●
●
●
●
●
●
●
●
●
●
●
●
●
●
●
●
●
●
●
●
●
●
●
●
●
●
●
●
●●
●
●
●
●
●
●
●
●
●
●●
●
●
●
●
●
●
●
●
●
●
●● ●
●
●
●
●
●
●
●
●
●●
●
●
●●
●
●
●
●
●
●
●
●
●
●
●
●
●
●
●
●
●
●
●
●
●
●
●
●
●
●
●
●
●
●
●
●
●
●
●
●
●
●
●
●●
●
●
●
●
●
●
●
●
●
●
●
●
●
●
●
●
●
●
●
●
●
● ●
●
●
●
●
●
●
●
●
●
●
●
●
●
●
●
●
●
●
●
●
●
●
●
●
●
●
●
●
●
●
●
●
●
●
●
●
●
●
●
●
●
●
●
●
●
●
●
●
●
●
●
●
●
●
●
●
●
●
●
●●
●●
●
●
●
●
●
●
●
●
●
●
●
●
●
●
●
●
●
●
●
●
●
●
●
●
●
●
●
●
●
●
●●
●
●
●
●
●
●
●
●
●
●
●
●
●
●
●
●
●
●
●
●
●
●
●
●
●
●
●
●
●
●
●
●
●
●
●
●
●
●
●
●
●
●
●
●
●
●
●
●
●
●
●
●
●●
●
●
●
●
●
●
●
●
●
●
●●
●
●
●
●
●
●
●
●
●
●
●
●
●
●
●
●
●
●
●
●
●●
●
● ●
●
●
●
●
●
●
●
●
●
●
●
●
●
●
●
●
●
●
●
●
●
●
●
●
●
●
●
●
●
●
●
●
●
●
●
●
●
●
●
●
●
●●
●
●
●
●
●
●
●
●
●
●
●
●
●
●
●
●
●
●
●
●
●
●
●
●
●
●
●
●
●
●
●
●
●
●
●
●
●
●
●
●
●
●
●
●
●
●●
●
●
●
●
●
●
●
●
●
●
●
●
●
●
●
●
●
●
●
●
●
●
●
●●
●
●
●
●
●
●
●
●
●
●
●
●
●
●
●
●
●
●●
●
●
●
●
●
●
●
●
●
●
●
●
●
●
●
●
●
●
●
●
●
●
●
●
●
●
●
●
●
●
●
●
●
●
●
●
●
●
●
●
●
●
●
●
●
●
●
●
●
●
●
●
●
●
●
●
●
●
●
●●
●
●
●
●
●
●
●
●
●
●
●
● ●
●
●
●
●
●
●
●●
●
●
●
●
●
●
●
●
●
●
●
●
●
●
●
●
●
●
●
●
●
●
●
●
●
●
●
●
●
●
●
●
●
●●
●
●
●
●
●
●
●
●●
●
●
●
●
●
●
●
●
●
●
●
●
●
●
●
●
●
●
●
●
●
●
●
●
●
●
●
●
●
●
●
●
●
●
●
●
●
●
●
●
●
●
●
●
●
●
●
●
●
●
●
●
●
●
●
●
●
●
●
●
●
●
● ●
●
●
●
●
●
●
●
●
●
●
●
●
●
●
●
●
●
●
●
●
●
●
●
●
●
●
●
●
●
●
●
●
●
●
●
●
●
●
●
●
●
●
●
●
●●
●
●
●
●●
●
●
●
●
●
●
●
●
●
●
●
●
●
●
●
●
●
●
●
●●
●
●
●
●
●
●
●
●
●
●
●
●
●
●
●●
●
●
●
●
●
●
●
●
●
●
●
●
●
●
●
●
●
●
●
●
●
●
●
●
●
●
●
●
●
●
●
●
●●
●
●
●
●
●
●
●
●
●
●
●
●
●
●
●
●
●
●
●
●
●
●
●
●
●
●
●
●
●
●●
●
●
●
●●
●
●
●
●
●
●
●●
●
●
●
●
●
●
●
●
●
●
●
●
●
●
●
●
●
●
●
●
●
●
●
●
●
●
●
●
●
●
●●
●
●
●
●
●
●
●
●
●
●
●
●
●
●
●
●
●
●
●
●
●
●
●
●
●
●
●
●
●
●
●
●
●
●
●
●
●
●
● ●
●
●
●
●
●
●
●
●
●
●
●
●
●
●
●
●
●
●
●
●
●
●
●
●
●
●
●
●
●
●
●
●
●
●●
●
●
●
●
●
●
●
●
●
●
●
●
●
●
●
●
●
●
●
●
●
●
●
●
●
●
●
●
●
●
●
●
●
●
●
●
●
●
●
●
●
●
●
●
●
●
●
●
●
●
●
●
●
●
●
●
●
●
●●
●●
●
●
●
●
●
●
●
●
●
●
●
●
●
●
●
●
●
●
●
●
●
●
●
●
●
●
●
●
●
●
●
●
●
●
●
●
●
●
●
●●
●
●
●
●
●
●
●
●
●
●
●
●
●
●
●
●
●
●
●
●
●
●●
●
●
●
●
●
●
●
●
●
●
●
●
●
●
●
●
●
●
●
●
●
●
●
●
●
●
●
●
●
●
●
●
●
●●
●
●
●
●
●
●
●
●
●
●
●
●
●
●
●
●
●
●
●
●
●
●
●
●
●
●
●
●
●
●
●
●
●
●
●
●
●
●
●
●
●
●
●
●
●
●
●
●
●
●
●●
●
●●
●
●
●
●
●
●
●
●
●
●
●
●
●
●
●
●
●
●
●
●
●
●
●
●
●
●
●
●
●
●
●
●
●
●
●
●
●
●
●
●
●
●
●
●
●
●
●
●
●
●
●
●
●
●
●
●
●
●
●
●
●
●
●
●
●
●
●
●
●
●
●
●
●
●
●●
●
●
●
●
●
●
●
●
●
●
●
●
●
●
●
●
●
●
●
●
●
●
●
●
●
●
●
●
●
●
●
●
●●
●
●●
●
●
●
●
●
●
●
●
●
●
●
●
●
●
●
●
●
● ●
●
●
●
●
●
●
●
●
●
●
●
●
●
●
●
●
●
●
●
●
●
●
●
●
●
●
●
●
●
●
●
●
●
●
●
●
●
●
●
●
●
●
●
●
●
●●
●
●
●
●
●
●
●
●
●
●
●
●
●
●
●
●
●
●
●
●
●
●
●
●
●
●
●
●
●
●
● ●
●
●
●
●
●
●
●
●
●
●
●
●
●
●
●
●
●
●
●
●
●
●
●
●
●
●
●
●
●
●
●
●
●
●
●
●
●
●
●
●
●
●
●
●
●
●
●
●
●
●
●
●
●
●
●
●
●
●
●
●
●
●
●
●
●
●
●
●
●
●
●
●
●
●
●
●
●
●
●
●
●
●
●
●
●
●
●
●
●
●
●
●
●●
●
●
●
●
●
●
●
●
●
●
●●
●
●
●
●
●
●
●
●
●
●
●
●●
●
●
●
●
●
●
●
●
●
●
●
●
●
●
●
●
●
●
●
●
●
●
●
●
●
●
●
●
●
●
●
●
●
●
●
●
●
●
●
●
●
●
●
●
●
●
●
●
●
●
●
●
●
●
●
●
●
●
●
●
●
●
●
●
●
●
●
●
● ●
●
●
●
●
●
●
●
●
●
●
●
●
●
●
●
●
●
●
●
●
●
●
●
●
●
●
●
●
●
●
●
●
●
●
●
●
●
●
●
●
●
●
● ●
●
●
●●
●
●
●
●
●
●
●
●
●
●
●
●
●
●
●
●
●
●
●
●
●
●
●
●
●
●
●
●
●
●
●
●
●
●
●
●
●
●
●
●
●
●
●
●
●
●
●
●
●
●
●●
●
●●
●
●
●
●
●
●
●
●
●
●
●
●
●
●
●
●
●
●
●
●
●
●
●
●
●
●
●
●
●●
●
●
●
●
●
●
●
●
●
●
●
●
●
●
●
●
●
●
●
●
●
●
●
●
●
●
●
●
●
●
●
●
●
●
●
●
●
●
●
●
●
●
●
●
●●
●
●
●
●
●
●
●
●
●
●
● ●
●
●
●
●
●
●
●●
●
●
●
●
●
●
●
●
●
●
●
●
●
●
●
●
●
●
●
●
●
●
●
●
●
●
●
●
● ●
●
●
●
●
●
●
●
●
●
●
●
●
●
●
●
●
●
●
●
●
●
●
●
●
●
●
●
●
●
●
●
●
●
●
●
●
●
●
●
●
●
●●
●
●
●
●
●
●
●
●
●
●
●
●
●
●
●
●
●
●
●
●
●
●●
●
●
●
●
●
●
●
●
●
●
●
●
●
●
●●
●
●
●
●
●
●
●
●
●
●
●
●
●
●
●
●
●
●
●
●
●
●
●
●●
●
●
●
●
●
●●
●
●
●
●
●
●
●
●
●
●
●
●
●
●
●
●
●
●
●
●
●
●
●
●
●
●
●
●
●
●
●
●
●
●
●
●
●
●
●
●
●
●
●
●
●
●
●
●
● ●
●
●
●
●
●
●
●
●●
●
●
●
●
●
●
●
●
●
●
●
●
●
●
●
●
●
●
●
●●
●
●
●
●
●
●
●
●
●
●
●
●
●
●●
●
●
● ●
●
●●
●
●
●
●
●
●
●
●
●
●
●
●
●
●
●
●
●
●
●
●
●
●
●
●
●
●
●
●
●
●
●
●
●
●
●
●
●
●
●
●●
●
●
●
●
●
●
●
●
●
●
●
●
●
●
●
●
●●
●
●●
●
●
●
●
●
●
●
●
●
●
●
●
●
●
●
●
●
●●
●
●
●
●
●
●
●
●
●
●
●
●
●
●
●
●
●
●
●
●
●
●
●
●
●
●
●●
●
●
●
●
●
●
●
●
●
●
●
●
●
●
●
●
●●
●
●
●
●
●
●
●
●
●
●
●
●
●
●
●
●
●
●
●
●
●
●
●
●
●
●
●
●
●
●
●
●
●
●
●
●
●
●
●
●
●
●
●
●
●
●
●
●
●
●
●
●
●
●
●
●
●
●
●
●
●
●
●
●
●
●
●●
●
●
●
●
●
●
●
●
●
●
●
●
●
●
●
●
●
●
●
●
●
●
●
●
●
●
●
●
●
●
●
●
●
● ●
●
●
●
●
●
●
●
●
●
●
●
●
●
● ●
●
●
●
●
●
●
●
●
●
●
●
●
●
●
●
●
●
●
●
●
●
●
●
●
●
●
●
●
●
●
●
●
●
●
●
●●
●
●
●
●
●
●
●
●
●
●●
●
●
●
●
●
●
●
●
●
●
●
●
●
●
●
●
●
●
●
●
●
●
●
●
●
●
●
●
●
●
●
●
●
●
●
●
●
●
●
●
●
●
●
●
●
●
●
●
●
●
●
●
●
●
●
●
●
●
●
●
●
●
●
●
●
●●
●
●
●
●
●
●
●
●
●
●
●
●
●
●
●
●
●
●
●●
●
●
●
●
●
●
●
●
●
● ●
●
●
●
●
●
●
●
●
●
●
●
●
●
●
●
●
●
●
●●
●
●
●
●●
●●
●
●
●
●
●
●
●
●
●
●
●
●
●
●
●
●
●
●
●
●
●
●
●
●
●
●
●
●
●
●
●
●
●
●
●
●
●
●
●
●
●
●
●
●
●
●
●
●
●
●
●
●
●
●
●
●
●
●
●
●
●
●
●
●
●
●
●
●
●
●
●
●
●
●●
●
●
●
●
●
●
●
●
●
●
●
●
●
●
●
●
●
●
●
●
●
●
●
●
●
●
●
●
●
●
●
●
●
●
●
●
●
●
●
●
●
●
●
●
●
●
●
●
●
●
●
●
●
●
●
●
●
●
●
●
●
●
●●●
●
●
●
●
●
●
●
●
●
●
●
●
●
●
●
●
●
●
●
●
●
●
●
●
●
●
●
●
●
●
●
●
●
●
●●
●
●
●●
●
●
●
●
●
●
●
●
●
●
●
●
●
●
●
●
●
●
●
●●
●
●
●
●
●
●
●
●
●
●
●
●
●
●
●
●
●
●
●
●
●●
●
●
●
●
●
●
●
●
●
●
●
●
●
● ●
●
●
●
●
●
●
●
●
●
●
●
●
●
●
●
●
●
●
●●
●
●
●
●
●
●
●
●
●
●
●
●
●
●
●
●
●
●
●
●
●
●
●
●
●
●●
●
●
●
●
●
●
●
●
●
●
●
●
●●
●
●
●
●
●
●
●
●
●
●
●
●
●
●
●
●
●
●
● ●
●
●
●
●
●
●
●
●
●
●
●
●
●
●●
●
●
●
●
●
●
●
●
●
●
●
●
●
●
●
●
●
●
●
●
●
●
●
●
●
●
●
●
●
●
●
●
●
●
●
● ●
●
●
●
●
●
●
●
●
●
●
●
●
●
●
●
●
●
●
●
●
●
●
●
●
●
●●
●
●
●
●
●
●
●
●
●
●
●
●
●
●
●
●
●
●
●●
●
●
●
●
●
●
●
●
●
●
●
●
●
●
●
●
●
●
●
●
●
●
●
●
●
●
●
●
●
●
●
●
●
●
●
●
●●
●
●
●
●
●
●●
●
●
●
●
●
●
●
●
●
●
●
●
●
●
●
●
●
●
●
●
●
●
●
●
●
●
●
●
●
●
●
●
●●
●
●
●
●●
●
●
●
●
●
●
●
●
●
●
●
●
●
●
●
●
●
●
●
●
●
●●
●
●
●
●
●
●
●
●
●
●
●
●
●
●
●
●
●
●
●
●●
●
●
●
●
●
●
●
●
●
●
●
●
●
●
●
●
●
●
●
●
●
●
●
●
●
●
●
●
●
●
●
●
●
●
●
●
●
●
●
●
●
●
●
●
●
●
●
●
●
●
●
●
●
●
●
●
●
●
●
●
●
●
●
●
●
●
●
●
●
●
●●
●
●
●
●●
●
●
●
●
● ●
●
●
●
●
● ●
●
●
●
●
●
●
●
●
●
●
●
●
●
●
●
●
●
●
●
●
●
●
●
●
●
●
●
●
●
●●
●
●
●
●
●
●
●
●
●
●
●
●
●
●
●
●
●
●
●
●
●
●
●
●
●
●
●
●
●
●
●
●
●
●
●
●
●
●
●
●
●
●
●
●
●
●
●
● ●
●
●
●
●
●
●
●
●
●
●
●
●
●
●
●
●
●
●
●
●
●
●
●
●
●
●
●
●
●
●
●
●
●
●
●
●
●
● ●
●
●
●
●
●
●
●
●
●
●
●
●
●
●
●
● ●
●
●
●
●
●
●
●
●
●
●
●
●
●
●
●
●●
●
●
●
●
●
●
●
●
●
●
●
●●
●●
●
●
●
●
●
●
● ●
●
●
●
●
●
●
●
●
●
●
●
●
●
●
●
●
●
●
●
●
●
●
●
●
●
●
●
●
●
●
●
●
●
●
●
●
●
●
●
●
●
●
●
●●
●●
●
●
●
●
●
●●
●
●
●
●
●
●
●
●
●
●
●
●
●
●
●
●
●
●
●
●
●
●
●
●
●
●
●
●
●
●
●
●
●
●
●
●
●
●
●
●
●●
●
●
●
●
●
●
●
●
●
●
●
●
●
●●
●
●
●
●
●
●
●
●
●
●
●
●
●
●
●
●
●
●
●
●
●
●
●
●
●
●
●
●
●
●●
●
●
●
●
●
●
●
●
●
●
●
●
●
●
●
●
●
●
●
●
●
●
●
●
●
●
●
●
●
●
●
●
●
●
●●
●
●
●
●
●
●
●
●
●
●
●
●
●
●
●
●
●
●
●
●
●
●
●
●
●
●
●
●
●
●
●
●
●
●
●
●
●
●
●
●
●
●
●
●
●
●
●
●●
●
●
●
●
●
●
●
●
●
●
●
●
●
●
●●
●
●
●
●
●
●
●
●
●●
●
●
●
●
●
●
●
●
● ●
●
●
●
●
●
●
●
●
●
●
●
●
●
●
●
●
●
●
●
●
●
●
●
●
●
●
●
●
●
●
●
●
●
●
●
●
●
●
●
●
●
●
●
●
●
●
●
●
●●
●
●
●
●
●
●
●
●
●
●
●
●
●
●
●
●
●
●
●
●
●
●
●
●
●
●
●
●
●
●
●
●
●
●
●
●
●
●
●
●
●
●
●
●
●
●
●
●
●
●
●
●
●
●
●
●
●
●
●
●
●
●
●●
●
●
●
●
●
●
●
●
●
●
●●
●
●
●
●
●
●
●
●
●
●
●
●
●
●
●
●
●
●●
●
●
●
●
●
●
●
●
●
●
●
●
●
●
●
●
●
●●
●
●
●
●
●
●
●
●
●
●
●
●
●
●
●
●
● ●
●
●●
●
●
●
●
●
●
●
●
●
●
●
●
●
●
●
●
●
●
●
●
●
●
●
●
●
●
●
●
●
●
●
●
●
●
●
●
●
●
●
●
●
●
●
●
●
●
●
●
●
●
●
●
●
●
●
●
●
●●
●
●
●
●
●
●
●
●
●
●
●
●
●
●
●
●
●●
●
●
●
●
●
●
●●
●
●
●
●
●
●
●
●
●
●
●
●
●
●
●
●
●
●
●
●
●
●
●
●
●
●
●
●
●
●
●
●
●
●
●
●
●
●
●
●
●
●
●●
●
●
●
●
●
●
●
●
●
●
●
●
●
●
●
●
●
●
●
●
●
●
●
●
●
●
●
●
●
●
●
●
●
●
●
●
●
●
●
●
●
●
●
●
●
●
●
●
●
●
●
●
●
●
●
●
●
●
●
●
●
●
●
●
●
●
●
●
●
●
●
●
●
●
●
●
●
●
●
●
●
●
●
●
●
●
●
●
●
●
●
●
●
●
●
●
●
●
●
●
●
●
●
●
●
●
●
●
●
●
●
●
●
●
●
●
●
●
●
●
●
●
●
●
●
●
●
●
●
●●
●
●
●
●
●
●
●
●
●
●
●
●
●
●
●
●
●
●
●
●
●
●
●
●
●
●
●
●
●
●
●
●
●
●
●
●
●
●
●
●
●
●
●
●
●
●
●
●
●
●
●
●
●
●
●
●
●
●
●
●
●
●
●
●
●
●
●
●
●
●
●
●
●
●
●
●
●
●
●
●
●
●
●
●
●
●
●●
●
●
●
●
●
●
●
●
● ●
●
●
●
●
●
●
●
●
●
●
●
●
●
●
●
●
●
●
●
●
●
●
●●
●
●
●
●
●
●
●
●
●
●
●
●
●
●
●
●
●
●
●
●
●
●
●
●
●
●
●
●
●
●
●
●
●
●
●
●
●●●
●
●
●
●
●
●
●
●
●
●
●
●
●
●
●
●
●
●
●
●
●
●
●
●
●
●
●
●
●
●
● ●
●
●
●
●
●
●
●
●
●
●●
●
●
●
●
●
●
●
●
●
●
●
●
●
●●
●
●
●
●
●
●
●
●
●
●
●
●
●
●
●
●
●
●
●
●
●
●
●
●
●
●
●
●
●
●
●
●
●
●
●
●
●●
●
●
●
●
●
●
●
●
●
●
●
●
●
●
●
●
●
●
●
●
●
●
●●
●
●
●
●
●
●
●
●
●
●
●
●
●
●
●
●
●
●
●
●
●
●
●
●
●
●
●
●
●●
●●
●
●
●●
●
●
●
●
●
●
●
●
●
●
●
●
●
●
●
●
●
●
●
●
●
●
●
●
●
●
●
●
●
●
●
●
●
●
●
●
●
●
●●
●
●
●
●
●
●
●
●
●
●
●
●
●
●
●
●
●
●
●
●
●●
●
●
●
●
●
●
●
●
●
●
●
●
●
●
●
●
●
●
●
●
●
●
●
●
●
●
●
●
●
●
●
●
●
●
●
●
●
●
●
●
●
●●
●
●
●
●
●
●
●
●
●
●
●
●
●
●
●
●
●
●
●
●
●
●
●
●
●
●
●
●
●
●
●
●
●
●
●
●
●
●
●
●
●
●
●
●
●
●
●
●
●
●
●
●
●
●
●
●
●
●
●
●
●
●
●
●
●
●
●
●
●
●
●
●
●
●
●
●
●
●
●
●
●
●
●
●
●
●
●
●
●
●
●
●
●
●
●
●
●
●
●
●
●
●
●
●
●
●
●
●
●
●
●
●
●
●
●
●
●
●
●
●
●
●
●
●
●
●
●●
●
●
●
●
●
●
●
●
●
●
●
●
●
●
●
●
●
●
●
●
●
●
●
●
●
●
●
●
●
●
●
●
●
●
●
●
●
●
●
●
●
●
●
●
●
●
●
●
●
●
●
●
●
● ●●●
●
●
●
●
●
●
●
●
●
●●
●
●
●
●
●
●
●
●
●●
●
●
●
●●
●
●
●
●
●
●
●
●
●
●
●
●
●
●●
●
●
●
●
●
●
●
●
●
●
●
●
●
●
●
●
●
●
●
●
●
●
●
●
●
●
●
●
●
●
●
●
●
●
●
●
●
●
●
●
●
●
●●
●
●
●
●
●
●
●
●
●
●
●
●
●
●
●
●
●
●
●
●
●
●
●●
●
●
●
●
●
●
●
●
●
●
●
●
●
●
●
●
●
●
●
●
●
●
●
●
●
●
●
●
●
●
●
●
●
●
●
●
●
●
●
●
●
●
●
●
●
●
●
●
●
●
●
●●
●
●
●
●
●
●
●
●
●
●
●
●●
●
●
●
●●
●
●
●
●
●
●
●
●
●
●
●
●
●
●
●
●
●
●
●
●
●
●
●
●
●
●
●
●
●
●
●
●
●
●
●
●
●
●
●
●
●
●
●
●
●
●
●
●
●
●
●
●
●
●
●●
●
●
●
●
●
●
●●
●
●
●
●
●
●
●
●
●
●
●
●
●
●
●
●
●
●
●
●
●
●
●
●
●
●
●
●
●
●
●
●
●
●
●
●
●
●
●
●
●
●
●
●
●
●
●
●
●
●●
●
●
●
●
●
●
●
●
●
●
●
●
●
●
●
●
●
●
●
●
●
●
●
●
●
●
●
●
●
●
●
●
●
●
●
●
●
●
●
●
●
●
●
●
●
●
●
●
●
●
●
●
●
●
●
●
●
●
●
●
●
●
●
●
●
●
●
●
●
●
●
●
●
●
●
●
●
●
●
●
●
●
●
●
●
●
●
●
●
●
●
●
●
●
●●
●
●
●
●
●
●
●●
●
●
●
●
●
●
●
●
●
●
●
●
●
●
●
●
●
●
●
●
●
●
●
●
●
●
●●
●
●
●
●
●
●
●
●
●
●
●
●
●
●
●
●
●
●
●
●
●
●
●
●
●
●
●
●
●
●
●
●
●
●
●
●
●
●
●
●
●
●
●
●
●
●
●
●
●
●
●
●
●
●
●
●
●
●
●
●
●
●
●
●
●
●
●
●
●
●
●
●
●
●
●
●
●
●
●
●
●
●
●
●
●
●
●
●
●
●
●
●
●
●●
●
●
●
●●
●
●
●
●
●
●
●
●
●
●
●
●
●
●
●
●
●
●
●
●
●●
●●
●
●
●
●
●
● ●
●
●
●
●
●
●●
●
●
●
●
●
●
●
●
●
●
●
●
●
●
●
●
●
●
●
●
●
●
●
●
●
●
●
●
●
●
●
●
●
●
●
●
●
●
●
●
●
●
●
●
●
●
●
●
●
●
●
●
●
●
●
●
●
●
●
●
●
●
●
●
●
●
●
●
●
●
●
●
●
●
●
●
●
●
●
●
●
●
●
●
●
●
●
●
●
●
●
●
●
●
●
●
●
●
●
●
●
●
●
●
●
●
●
●
●
●
●
●
●
●
●
●
●
●
●
●
●
●
●
●
●
●
●
●
●
●
●
●●
●
●
●
●
●
●
●
●
●
●
●
●
●●
●
●
●
●
●
●
●
●
●
●
●
●
●
●
●
●
●
●
●
●
●
●
●
●
●
●
●
●
●
●
●
●
●●
●
● ●
●
●
●
●
●
●
●
●
●
●
●
●
●●
●
●
●
●
●
●
●
●
●
●
●
●
●●
●
●●
●
●
●
●
●
●
●
●
●
●
●
●
●
●
●
●
●
●
●
●
●
●
●
●
●
●
●
●
●
●
●
●
●
●
●
●
●
●
●
●
●
●
●
●
●
●
●
●
●
●
●
●
●
●
●
●
●
●●
●
●
●
●
●
●
●
●
●
●
●
●
●
●
●
●
●
●
●
●
●
●
●
●
●
●
●
●
●
●
●
●
●
●
●
●
●
●
●
●
●
●
●
●
●
●●
●
●
●
●
●
●
●
●
●
●
●
●
●
●
●
● ●●
●
●
●
● ●
●
●
●
●
●
●
●
●
●
●
●
●
●
●●
●
●
●
●
●
●
●
●
●
●
●
●●
●
●
●
●
●●
●
●
●
●
●
●
●
●
●
●
●
●
●
●
●
●
●
●
●
●
●
●
●
●
●
●●●
●
●
●
●
●
●
●
●
●
●
●
●
●
●
●●
●
●
●
●
●
●
●
●
●
●
●
●
●
●
●
●
●
●
●
●
●
●
●
●
●
●
●●
●
●
●
●
●
●
●
●
●
●
●
●
●
●
●
●
●
●
●
●
●
●
●
●
●
●
●
●
●
●
●
●
●
●
●
●
●
●
●
●
●
●
●
●
●
●
●
●
●
●
●
●
●
●
●
●
●
●
●
●
●
●
●
●
●
●
●
●
●
●
●
●
●
●
●
●●
●
●
●
●
●
●
●
●
●
●
●
●
●
●
●
●
●
●
●
●
●
●
●
●
●●
●
●
●
●
●
●
●
●
●
●
●
●
●
●
●
●
●
●
●
●
●
●
●
●
●
●
●●
●
●
●
●
●
●
●
●
●
●
●
●
●
●
●
●
●
●
●
●
●
●
●
●
●
●
●
●
●
●
●
●
●
●
●
●
●
●
●
●
●
●
●
●
●
●
●
●
●
●
●
●
●
●
●
●
●
●
●
●
●
●
●
●
●
●
●
●
●
●
●
●
●
●
●
●
●
●●
●
●
●
●
●
●
●
●
●
●
●
●
●
●
●
●
●
●
●
●
●
●
●
●
●
●
●
●
●
●
●
●
●
●
●
●
● ●
●
●
●
●
●●
●
●
●
●
●
●
●
●
●
●
●
●
●
●
●
●
●
●
●
●
●
●
●
●
●
●
●
●
●
●
●
●
●
●
●
●
●
●
●
●
●
●
●
●
●
●●
●
●
●
● ●
●
●
●
●
●
●
●
●
●
●
● ●
●
●
●
●
●
●
●
●
●
●
●
●
●
●
●
●
●
●
●
●
●
●
●
●
●
●
●
●
●
●
●
●
●
●●
●
●
●●
●
●
●
●
●
●
●
●
●
●
●
●
●
●
●
●
●
●
●
●
●
●
●
●
●
●
●
●
●
●
●
●
●
●
●
●
●
●
●
●
●
●
●
●
●
●
●
●
●
●
●
●
●
●
●
●
●
●
●
●
●
●●
●
●
●
●
●
●
●
●
●
●
●
●
●
●
●
●
●
●
●
●
●
●
●
●
●
●
●
●
●
●
●
●
●
●
●
●
●
●
●
●
●
●
●
●
●
●
●
●
●
●
●
●
●
●
●
●
●
●
●
●
●
●
●
●
●
●
●
●
●
●
●
●
●
●
●
●
●
●
●
●
●
●
●
●
●
●
●
●
●
●
●
●
●
●
●
●
●
●
●
●
●
●
●
●
●
●
●
●
●
●
●
●
●
●
●
●
●
●
●
●●
●
●
●
●
● ●●
●
●
●●
●
●
●
●
●
●
●
●
●
●
●
●
●
●
●
●
●
●
●
●
●
●●
●
●
●
●
●
●● ●
●
●
●
●
●
●
●
●
●
●
●
●
●
●
●
●
●
●
●
●
●
●
●
●
●
●
●
●
●
●
●
●
●
●
●
●
●
●
●
●
●
● ●
●
●
●
●
●
●
●●
●
●
●
●
●
●
●
●
●
●
●
●
●
●
●
●
●
●
●
●
●
●
●
●
●
●
●
●
●
●
●
●
●
●
●
●
● ●
●
●
●
●
●
●
●
●
●
●●
●●
●
●●
●
●
●
●
●
●
●
●
●
●
●
●
●●
●
●
●
●
●
●
●
●
●
●
●
●
●
●
●
●
●
●
●
●
●●
●
●
●
●
●
●
●
●
●
●
●
●
●
●
●
●
●
●
●
●
●
●
●
●
●
●
●
●
●
●
●
●
●
●
●
●
●
●
●
●
●
●
●
●
●
●
●
●
●
●
●
●
●
●
●
●
●
●
●
●
●
●
●
●
●
●
●
●
●
●
●
●
●
●
●
●
●
●
●
●
●
●
●
●
●
●
●
●
●
●
●
●
●
●
●
●
●
●
●
●
●
●
●
●
●
●
●
●
●
●
●
●
●
●
●
●
●
●
●
●
●
●
●
●
●
●
●
●
●
●
●
●
●
●
●
●
●
●
●
●
●
●
●
●
●
●
●
●●
●
●
●
●
●
●
●
●
●
●
●
●
●
●
●
●
●
●
●
●
●
●
●
●
●
●
●
●
●
●
●
●
●
●
●
●●
●
●
●
●
●
●
●
●
●
●
●
●
●
●
●
●
●
●
●
●
●
●
●
●
●
●
●
●
●
●
●
●
●
●
●
●
●
●
●
●
●
●
●
●
●
●
●
●
●
●
●
●
●
●
●
●●
●
●
●
●
●
●
●
●
●
●
●
●
●
●
●
●
●
●
●
●
●
●
●
●
●
●
● ●
●
●
●
●
●
●
●
●
●
●●
●
●
●
●
●
●
●
●
●
●
●
●
●
●
●
●
●
●
●
●
●
●
●
●
●
●
●●
●
●
●
●
●
●●
●
●
●
●
●
●
●
●
●
●
●
●
●
●
●
●
●
●
●
●
●
●
●●
●
●
● ●
●
●
●
●
●
●
●
●
●
●
●
●
●
●
●●
●
●
●
●
●●
●
●
●
●
●
●
●
●
●
●
●●
●
●
●
●
● ●
●
●
●
●
●
●
●
●
●
●
●
●
●
●
●
●
●
●
●
●
●
●
●
●
●
●
●
●
●
●
●
●
● ●
●●
●
●
●
●
●
●
●
●
●
●
●
●
●
●
●
●
●
●
●
●
●
●
●
●
●
●
●
●
●
●
●
●
●
●
●
●
●
●
●
●
●
●
●
●●
●
●
●
●
●
●●
●
●
●
●
●
●
●
●
●
●
●
●
●
●●
●
●
●
●
●
●
●
●
●
●
●
●
●
●
●
●
●
●
●
●
●
●
●
●
●
●
●
●●
●
●
●
●
● ●
●
●
●
●
●●
●●
●
●
●
●
●
●
●
●
●
●
●
●
●
●
●
●
●
●
●
●
●
●
●
●
●
●
●
●
●
●
●
●
●
●
●
●●
●
●
●
●
●
●
●
●
●
●
●
●
●
●
●
●
●
●
●
●
●
●
●
●
●
●
●
●
●
●
●
●
●
●●
●
●
●
●
●
●
●
●
●
●
●
●
●
●
●
●
●
●
●
●
●
●
●
●
●
●
●
●
●
●
●●
●
●
●
●
●
●
●
●
●
●
●
●
●
●
●
●
●
●
●
●
●
●
●
●
●
●
●
●
●
●
●
●
●
●
●
●
●
●
●
●
●
●
●
●
●
●
●
●
●
●
●
●
●
●
●
●
●
●
●
●
●
●
●
●
●
●
●
●
●
●
●
●
●
●
●
●
●
●
●●
●
●
●
●
●
●
●
●
●
●
●
●
●
●
●
●
●
●
●
●
●
●
●
●
●●
● ●
●
●
●
●●
●
●
●
●
●
●
●
●
●
●
●
●
●
●
●
●
●
●
●
●
●
●
●
●
●
●
●
●
●
●
●●
●
●
●
●
●
●
●
●
●
●
●
●
●
●
●
●
●
●
●
●
●
●
●
●
●●
●
●
●
●
●●
●
●
●
●
●
●
●
●
● ●
●
●
●
●
●
●
●
●
●
●
●
●
●
●
●
●
●
●
●
●
●
●
●
●
●●
●
● ●
●
●
●
●
●
●
●
●
●
●
●
●
●
●
●
●
●
●
●
●
●
●
●
●●
●
●
●
●
●
●
●
●
●
●
●
●
●
●●
●
●
●
●●
●
●
●●
●
●
●
●
●●
●
●
●
●
●
●
●
●
●
●
●
●
●
●
●
●
●
●
●
●
●
●
●
●
●
●
●
●
●
●
●
●
●●
●
●
●
●
●
●
●
●
●
●
●
●
●
●
●
●
●
●
●
●
●
●●
●
●
●
●
● ●
●
●
●
●
●
●
●
●
●
●
●
●
●
●●
●
●
●
●●
●
●
●
●
●●
●
●
●
●
●
●
●
●
●
●
●
●
●
●
●
●
●
●●
●
●
●
●
●
●
●
●
●
●
●
●
●
●
●
●
●
●
●
●
●
●
●
●
●
●
●
●
●
●●
●
●
●
●
●
●
●
●
●
●
●
●
●
●
●●
●●●
●
●
●
●
●
●
●●
●
●
●
●
●
●
●
●
●
●
●
●
●
●
●
●
●
●
●
●
●
●
●
●
●
●
●
●
●
●
●
●
●
●
●
●
●
●
●●
●
●
●
●
●
●
●
●
●
●
●
●
●
●
●
●
●
●
●
●
●
●
●
●
●
●
●
●
●
●
●
●
●
●
●
●
●
●
●
●
●
●
●
● ●
●
●●
●
●
●
●
●
●
●
●
●
●●
●
●
●
●
●
●
●
●
●
●
●
●
●●
●
●
●
●
●
●
●
●
●
●
●
●
●
●
●
●
●
●
●
●
●
●
●
●
●
●
●
●
●
●
●
●
●
●
●
●
●
●
●
●
●
●
●
●
●
●
●
●
●
●
●
●
●
●
●
●
●
●
●
●
●
●
●
●
●
●
●
●
●
●
●
●
●
●
●
●
●
●
●
●
●
●
●
●
●
●
●
●
●
●
●
●
●
●
●
●
●
●
●
●
●
●
●
●
●
●
●
●
●
●
●●
●
●
●
●
●
●
●●
●
●
●
●
●
●
●
●
●
●
●
●
●
●
●
●●
●
●
●
●
●
●
●
●
●
●
●
●
●
●
●
●
●
●
●
●
●
●
●
●
●
●
●
●
●
●
●
●
●
●
●
●
●
●
●
●
●
●
●
●
●
●
●
●
●
●
●
●
●
●
●
●
●
●
●
●
●
●
●
●
●
●
●
●
●
●
●●
●●
●
●
●
●
●
●
●
●
●
●
●
●●
●
● ●
●
●
●
●
●
●
●
●●
●
●
●
●
●
●
●
●
●
●
●
●
●
●
●
●
●
●
●
●●
●
●
●
●
●
●
●
●
●
●
●
●
●
●
●
●
●
●
●
●
●
●
●
●
●
●
●
●
●
●
●
●
●
●
●
●
●
●
●
●
●
●
●
●
●
●
●
●
●
●
●
●
●
●
●
●
●
●
●
●
●
●
●
●
●
●
●
●
●
●
●
●
●
●
●
●
●
●
●
●
●
●
●
●
●
●
●
●
●
●
●
●
●
●
●
●
●●
●
●
●
●
●
●
●
●
●
●
●
●
●
●
●
●
●
●
●
●
●
●
●
●
●
●
●
●
●
●
●
●
●●
●
●
●
●
●
●
●
●
●
●
●
●
●
● ●●
●
●
●●
●
●
●
●
●
●
●
●
●
●
●
●
●
●
●
●
●
●
●
●
●●
●
●
●
●
●
●
●
●
●
●
●
●
●
●
●
●
●
●
●
●
●
●
●
●
●
●
●
●
●
●
●
●
●
●
●
●
●
●
●
●
●
●
●
●
●
●
●
●
●
●
●
●
●
●
●
●
●
●
●
●
●
●
●
●
●
●
●●
●
●
●
●
●
●
●
●
●
●
●
●
●
●
●
●
●
●
●
●
●
●
●
●
●
●
●
●
●
●
●
●
●
●
● ●
●
●
●
●
●
●
●
●
●
●
●
●
●
●
●
●
●
●
●●
●
●
●
●
●
●
●
●
●
●
●
●
●
●
●
●
●
●
●
●
●
●
●
●
●
●
●
●
●
●
●
●
●
●
●
●
●●
●
●
●
●
●
●
●
●
●
●
●
●
●
●
●
●
●
●
●
●
●
●
●
●
●
●
●
●
●
●
●
●
●
●
●
●
●
●
●
●
●
●
●●
●
●
●
●
●
●
●
●
●
●
●
●
●
●
●
●
●
●
●
●
●
●
●
●●
●
●
●
●
●
●
●
●
●
●
●
●
●
●●
●
●
●
●
●
●●
●
●
●
●
●
●
●
●
●
●
●●
●
●
●
●
●
●
●
●
●
●
●
●
●
●
●
●
●
●
●
●
●
●
●
●
●
●
●
●
●
●
●
●
●
●
● ●
●
●
●
●
●
●
●
●
●
●
●
●
●
●
●
●
●●
●
●
●
●
●
●
●
●
●
●
●
●
●
●
●
●
●
●
●
●
●
●●
●●
●
●
●
●
●
●
●
●
●
●
●
●
●
●
●
●
●
●
●
●
●
●
●
●
●
●
●
●
●
●
●
●
●
●
●
●
●
●
●
●
●
●
●
●
●
●
●
●
●
●
●
●
●
●
●
●
●
●
●
●
●
●●
●
●
●
●
●
●
●
●
●
●
●
●
●
●
●
●
●
●
●
●
●
●
●
●
●
●
●
●
●
●
●
●
●
●
●
●
●
●
●
●
●
●
●
●
●
●
●
●
●
●
●
●
●
●
●
●
●
●
●
●
●
●
●
●
●
●
●
●
●
●
●
●
●
●
●
● ●
●
●
●
●
●
●
●
●
●
●
●
●
●
●
●
●
●
●
●
●
●
●
●
●
●
●
●
●
●
●
●
●
●
●
●
●
●
●
●
●
●
●
●
●
●
●
●
●
●
●
●
●
●
●
●
●
●
●
●
●
●
●
●
●
●
●
●
●
●
●
●
●
●
●
●
●
●
●
●
●
●
●
●
●
●
●
●
●
●
●
●
●
●
●
●
●
●
●
●
●
●
●
●●
●
●
●
●
●
●
●
●
●
●
●
●
●
●
●
●
●
●
●
●
●
●
●
●
●
●
●
●
●
●
●
●
●
●
●
●
●
●
●
●
● ●
●
●
●
●
●
●
●
●
●
●
●
●
●
●
●
●
●
●
●
●
●
●
●
●
●
●
●
●
●
●
●
●
●
●
●●
●
●
●
●
●
●
●
●
●
●
●
●
●
●
●
●
●
●
●
●
●
●
●●
●
●
●
●
●
●
●
●
●
●
●
●
●
●
●
●
●
●
●
●
●
●
●
●
●
●
●
●
●
●
●
●
●
●
●
●
●
●
●
●
●
●
●
●
●
●
●
●
●
●
●
●
●
●
●
●
●
●
●
●
●
●
●
●
●
●
●
●
●
●
●
●
●
●
●
●
●
●●
●
●
●
●
●
●
●
● ●
●
●
●
●
●
●
●
●
●
●
●
●
●
●
●
●
●
●
●
●
●
●
●
●
●
●
●
●
●
●
●
●
●
●
●
●
●
●
●
●
●
●
●
●
●
●
●
●
●
●
●
●
●
●
●
●
●
●
●
●
●
●
●
●
● ●
●
●
●
●
●
●
●
●
●
●
●
●●
●
●
●
●
●
●
●
●
●
●
● ●
●
●●
●
●
●
●
●
●
●
●
●
●
●
●
●
●
●
●
●
●
●
●
●
●
●
●
●
●
●
●
●
●
●
● ●
●
●
●●
●
●
●
●
●
●
●
●
●
●
●
●
●
●
●
●
●
●
●
●
●
●
●
●
●
●
●
●
●
●
●
●
●
●
●
●
●
●
●
●
●
●
●
●
●
●
●
●
●
●
● ●
●
●
●
●
●
●
●
●
●
●
●
●
●
●
●
●
●
●
●
●
●
●
●
●
●
●
●
●
●
●
●
●
●
●
●
●
●
●
●
●
●
●
●
●
● ●
●
●
●
●
●
●
●
●
●
●
●
●
●
●●
●
●
●
●
●
●
●
●
●
●
●
●
●
●
●
●
●
●
●
●
●
●
●
●
●
●
●
●
●
● ●
●
●
●
●
●
●
●
●
●
●
●
●
●
●
●
●
●
●
●
●
●
●
●
●
● ●
●
●
●
●
●
●
●
●
●
●
●
●
●
●
●
●
●
● ●●
●
●●
●
●
●
●
● ●●
●
●
●
●
●
●
●●●
●
●
●
●
●
●
●
●
●
●
●
●
●
●
●
●
●
●
●
●
●
●
●
●
●
●
●
●
●
●
●
●
●
●
●
●
●
●
●
●
●
●
●
●
●
●●●
●
●
●
●●
●
●
●
●
●
●
●
●
●
●
●
●
●
●
●
●
●
●
●
●
●
●
●
●
●
●
●
●
●
●
●●
●
● ●
●
●
●
●
●●
●
●
●
●
●
●
●
●
●
●●
●
●
●
●
●
●
●
●●
●
●
●
●
●
●
●
●
●
●
●
●
●
●
●
●
●
●
●
●
●
●
●
●
●
●
●
●
●
●
●
●
●
●
●
●
●
●
●
●
●
●
●
●
●
●
●
●
●
●
●
●
●
●
●
●
●
●
●
●
●
●
●
●
●
●
●
●●●
●
●
●
●
●
●
●
●
●
●
●
●
●
●
●
●
●
●
●
●
●
●
●
●
●
●
●
●
●
●
●
●
●
●
●
●
●
●
●
●
●
●
●
●
●
●
●
●
●
●
●
●
●
●
●
●
●
●
●
●
●
●
●
●
●
●
●
●
●
●
●
●
●
●
●
●
●
●
●
●
●
●
●
●
●
●
●
●
●
●
●
●
●
●
●
●
●
●
●
●
●
●
●
●
●
●
●
●
●
●
●
●
●
●
●
●
●●
●
●
●
●
●
● ●
●
●
●
●
● ●
●
●
●
●
●
●
●
●
●
●
●
●
●
●
●
●
●●
●
●
●
●
●
●
●
●
●
●
●
●
●
●
●
●
●
●
●
●
●
●
●
●●
●
●
●
● ●
●
●
●
●
●
●
●
●
●
●
●●
●
●
●
●
●
●
●
●●
●
●
●
●
●
●
●
●
●
●
●
●
●
●
●
●
●
●
●
●
●●
●
●
●
●
●
●
●
●
●
●
●
●
●
●
●
●
●
●
●
●
●
●
●
●
●
●
●
●
●
●
●
●●
●●
●
●
●
●
●
●
●
●
●
●
●
●
●
●
●
●
●
●
●
●
●
●
●
●
●
●
●
●
●
●
●
●
●
●
●
●
●
●
●
●
●
●
●
●
●●●
●
●
●
●
●
●
●
●
●
●
●
●
●
●
●
●
●
●
●
●
●
●
●
●
●
●
●
●
●
●
●
●●
●
●
●
●
●
●
●
●
●
●
●
●
●
●
●
●
●
●
●
●
●
●
●
●●
●
●
●
●
●
●
●●
●
●●
●
●
●
●
●
●
●
●
●●
●
●
●
●
●
●
●
●
●
●
●
●
●
●
●
●
●
●
●
●
●
●
●
●●
●
●
●
●
●
●
●
●
●
●●
●
●
●
●
●
●
●
●
●
●
●
●
●
●
●
●
●
●
●
●
●
●
●
●
●
●
●
●
●
●
●
●
●
●
●
●
●
●
●
●
●
●
●
●
●
●
●
●
●
●
●●
●
●
●
●
●
●
●
●
●
●
●
●
●
●
●
●
●
●
●
●
●
●
●
●
●
●
●
●
●
●
●
●
●
●
●
●
●
●
●
●
●
●
●
●
●
●
●
●
●
●
●
●
●
●
●
●
●
●
●
●
●
●
●
●
●
●
●
●
●
●
●●
●
●
●
●
●
●
●
●
●
●
●●
●
●
●
●
●
●
●
●
●
●
●
●
●
●
●
●
●
●
●
●
●
●
●
●
●
●
●
●
●
●●
●
●
●
●
●
●
●
●
●
●
●
●
●
●
●
●
●
●
●
●
●
●
●
●
●
●●
●
●
●
●
●●
●
●
●
●
●
●
●
●
●
●
●
●
●
●
●
●
●
●
●
●
●
●
● ●
●
● ●
●
●
●
●
●
●
●
●
●
●
●
●
● ●
●
●
●
●
●
●
●
●
●
●
●
●
●
●
●
●
●
●
●
●
●
●
●
●
●
●
●
●
●
●
●
●
●
●
●
●
●
●
●
●
●
●
●
●
●
●
●
●
●
●
●
●
●
●
●
●
●
●
●
●
●
● ●
●
●
●
●
●
●
●
●●
●
●
●
●
●
●
●●
●
●
●
●
●
●
●
●
●
●
●
●
●
●
●
●
●●
●
●
●
●
●
●
●
●
●
●
●
●
●
●
●
●
●
●
●
●
●
●
●
●
●
●
●
●
●
●
●
●
●
●
●
●
●
●
●
●
●
●
●
●
●
●
●
●
●
● ●●
●
●
●
●
●
●
●
●
●
●
●
●
●
●
●
●
●
●
●
●
●
●
●
●
●
●
●
●
●
●
●
●
●
●
●
●
●
●●
●
●
●
●
●
●
●
●
●
●
●
●
●
●
●
●
●
●
●
●
●
●
●
●
●
●
●
●
●
●
●
●
●
●
●
●
●
●
●
●
●
●
●
●
●
●
●
●
●
●
●
●
●
●
●
●
●
●
●
●
●
●
●
●
●
●
●
●
●
●
●
●
●
●
●
●
●
●
●
●
●
●
●
●
●
●
●
●
●
●
●
●
●
●
●
●
●
●
●
●
●
●
●
●
●
●
●
●
●
●
●
●
●
●
●
●
●
●
●
●●
●
●
●
●
●
●
●
●
●
●
●
●
●
●
●
●
●
●
●
●
●
●
●
●
●
●
●
●
●
●
●
●
●
●
●
●
●
●
●
●
●
●
●
●
●
●
●
●
●●
●
●
● ●
●
●
●
●
●
●
●
●
●
●
●
●
●
●
●
●
●
●
●
●
●
●
●
●
●
●
●
●
●
●
●
●
●
●
●
●
●
●
●
●
●
●
●
●
●●
●
●
●
●
●
●
●
●
●
●
●
●
●
●
●
●
●
●
●
●
●
●
●
●
●
●
●
●
●
●
●
●
●
●
●●
●
●
●
●
●
●
●
●
●
●
●
●
●
●
●
●
●
●
●
●
●
●
●
●
●
●
●●
●
●
●
●
●
●
●
●
●
●
●
●
●
●
●
●
●
●
●
●
●
●
●
●
●
●
●
●
●
●
●
●
●
●
●
●
●
●
●
●
●
●
●
●
●
●
●
●
●
●
●
●
●
●
●
●
●
●
●
●
●
●
●
●
●
●
●
●
●
●
●
●
●
●
●
●
●
●
●
●
●
●
●●
●
●
●
●
●
●
●
●
●
●
●
●●
●
●
●
●
●
●
●
●
●
●
●
●
●●
●
●
●
●
●
●
●
●
●
●
●
●
●
●
●
●
●
●
●
●
●
●
●
●
●
●
●
●
●
●
●●
●
●
●
●
●
●
●
●
●
●
●
●
●
●
●
●
●
●
●
●
●
●
●
●
●
●
●
●
●
●
●
●
●
●
●
●
●
●●
●
●
●
●
●
●
●
●
●
●
●
●
●
●
●
●
●
●
●
●●
●●
●
●
●
●
●
●
●
●
●
●
●
●
●
●
● ●
●
●
●
●
●
● ●
●
●
●
●
●
●
●
●
●
●
●
●
●●
●
●
●
●
●●
●
●
●
●
●
●
●
●
●
●
●
●
●
●
●
●
●
●
●
●
●
●
●
●
●
●
●
●
●
●
●
●
●
●
●
●
●
●
●
●
●
●
●
●
●
●
●
●●
●
●
●
●
●
●
●
●
●
●
●
●
●
●
●
●
●
●
●
●
●
●
●
●
●
●
●
●
●
●
●
●
●
●
●
●
●
●
●
●
●
●
●
●
●
●
●
●
●
●
●
●
●
●
●
●
●
●
●
●
●
●
●
●
●
●
●
●
●
●
●
●
●
●
●
●
●
●
●
●
●
●
●
●
●●
●
●
●
●
●
●
●
●
●
●
●
●
●
●
●
●
●
●
●
●
●
●
●
●
●
●
●
●
●
●●
●
●
●
●
●
●
●
●●
●
●
●
●
●
●
●
●
●
●
●
●
●
●
●
●
●●
●
●
●
●
●
●
●●
●
●
● ●
●
●
●
●
●
●
●
●
●
●
●
●
●
●
●
●
●
●
●
●
●
●
●
●
●
●
●
●
●
●
●
●
●
●
●
●
●
●
●
●
●
●
●
●
●
●
●●
●●
●●
●
●
●
●
●
●
●
●
●
●
●
●
●
●
●●
●
●
●●
●
●
●
●
●
●
●
●
●●
●
●●
●
●
●
●
●
●
●
●
●
●
●
●
●
●
●
●
●
●
●
●
●
●
●
●
●
●●
●
●
●
●
●
●
●
●
●
●
●
●
●
● ●
●
●
●
●
●
●
●●
●
●
●
●
●
●
●
●
●
●
●
●
●
●
●
●
●
●
●
●
●
●
●
●
●
●
●
● ●
●
●
●
●
●
●
●
●
●
●
●
●
●
●
●
●
●
●
●
●
●
●
●
●
●
●
●
●
●
●
●
●
●
●
●
●
●
●
●
●
●
●●
●
●
●
●
●
●
●
●
●
●
●
● ●
●
●
●
●
●
●
●
●
●
●
●
●
●
●
●
●
●
●
●
●
●
●
●
●
●
●
●
●
●
●
●
●
●
●
●
●
●
● ●
●
●
●
●
●
●
●
●
●
● ●
●
●
●
●
●
●●
● ●
●
●
●
●
●
●
●
●
●
●
●
●
●
●
●
●
●
●
●
●
●
●
●
●
●
●
●
●
●
●
●
●
● ●
● ●●
●
●
●
●
●
●
●
●
●
●
●
●
●
●
●
●
●
●
●
●
●
●
●
●
●
● ●
●
●
●
●
●
●
●
●
●
●
●
●
●
●
●
●
●
●
●
●
●
●
●
●
●
●
●
●
●
●●
●
●
●
●
●
●●
●
●
●
●
●
●
●
●
●
●
●
●
●
●
●
●
●
●
●
●
●
●
●
●
●
●●
●
●
●
●
●
●
●
●
●
●
●
●
●
●
●
●
●
●
●
●
●
●●
●
●
●
●
●●
●
●
●
●
●
●
●
●
●
●
●●
●
●
●
●
●
●
●
●
●
●
●
●
●
●
●
●
●
●
●
●
●
●
●
●
●
●
●
●
●
●
●
●
●
●
●
●
●
●
●●
●
●
●
●
●
●
●
●
●
●
●
●
●
●
●
●
●
●
●
●
●
●
●
●
●
●
●
●
●
●
●
●
●
●
●
●
●
●
●
●
●
●
●
●
●
●
●
●
●●
●
●
●
●
●
●
●
●
●
●
●
●
●
●
●
●
●
●
●
●
●
●
●
●
●
●
●
●
●
●
●
●
●
●
●
●
●
●
●
●
●
●
●
●
●
●
●
●
●
●
●
●
●
●
●
●
●
●
●
●
●
●
●
●
●
●
●
●
●
●
●
●
●
●
●
●
●
●
●
●
●
●
●
●
●
●
●
●
●
●
●
●
●
●●
●
●
●
●
●
●
●
●
●
●
●
●
●
●
●
●
●
●●
●
●
●
●
●
●
●
●
●
●
●
●
●
●
●
●
●
●
●
●
●
●
●●
●
●
●
●
●●
●
●
●
●
●
●
●
●
●
●
●
●
●
●
●
●
●
●
●
●
●
●
●
●
●
●
●
●
●
●
●
●
●
●
●
●
●
●
●
●
●
●
●
●
●
●
●
●
●
●
●
●●
●
●
●
●
●
●
●
●
●
●
●
●
●
●
●
●
●
●
●
●
●
●
●
●
●
●
●
●
●
●
●
●
●●
●
●
●
●
●
●
●
●
●
●
●
●●
●
●
●
●
●
●
●
●
●
●
●
●
●
●
●
●
●
●
●
●
●
●
●
●
●
●
●
●
●
●
●
●
●
●
●
●
●
●
●
●
●
●
●
●
●
●
●
●
●
●
●
●
●
●
●
●
●
●
●
●
●
●
●
●
●
●
●
●
●
●
●
●
●
●
●
●
●
●
●
●
●
●
●
●
●
●
●
●
●●
●
●
●
●
●
●
●
●
●
●
●
●
●
●
●
●
●
●
●
●
●
●
●
●
●
●
●
●
●
●
●
●
●
●
●
●
●
●
●
●●
●
●
●
●
●
●
●
●
●
●
●
●
●
●
●●
●
●
●
●
●●
●
●
●
●
●
●
●
●
●
●
●
●
●
●
●
●
●
●
●
●
●
●
●
●
●
●
●
●
●
●
●
●
●
●
●
●
●
●
●
●
●
●
●
●
●
●
●●
●
●
●
●
●
●
●
●
●●
●
●
●
●
●
●
●
●
●
●
●
●
●
●●
●
●
●
●
●
●
●
●
●
●
●
●
●
●
●
●
●
●
●
●
●
●
●
●
●
●
●
●
●
●
●
●
●
●
●●
●●
●
●
●
●
●
●
●
●
●
●
●
●
●
●
●
●
●
●
●
●
●
●
●
●
●
●
●
●
●
●
●
●
●
●
●
●
●
●
●
●
●
●
●
●
●
●
●
●
●
●●●
●
●
●
●
●
●
●
●
●
●
●
●
●
●
●
●
●
●
●
●
●
●
●
●
●
●
●
●
●
●
●
●
●
●
●
●
●
●
●
●
●
●
●
●
●
●
●
●
●
●
●
●
●
●
●
●
●
●
●
●
●
●●
●
●
●
●
●●
●
●
●
●
●
●
●
●
●
●
●
●
●
●
●
●
●
●
●
●
●
●
●
●
●
●
●
●
●
●
●
●
●
●
●
●
●
●
●
●
●
●
●
●
●
●
●
●
●
●
●
●
●
●
●
●
●
●
●
●
●●
●●
●
●
●
●
●
●
●
●
●●
●
●
●
●
●
●
●
●
●
●
●
●
●
●
●
●
●
●
●
●
●
●
●
●
●
●
●
●
●
●
●
●
●
●
●
●
●
●
●
●
●
●
●
●
●
●
●
●
●
●
●
●
●
●
●
●
●
●
●
●
●
●
●
●
●
●
●
●
●
●
●
●
●
●
●
●
●
●
●
●●
●
●
●
●
●
●
●
●●
●
●
●
●
●
●
●
●
●
●
●
●
●
●
●
●
●
●
●
●
●
●
●
●
●
●
●
●
●
●
●
●
●●●
●
●
●
●
●
●
●
●
●
●
●
●
●
●
●
●
●
●
● ●
●
●
●
●
●
●
●
●
●
●
●
●
●
●
●
●
●
●
●
●
●
●
●
●
●
●
●
●
●
●
●
●
●
●
●
●
●
●
●
●
●
●
●
●
●
●
●
●
●
●
●
●
●
●
●
●
●
●
●
● ●
●
●
●
●●
●
●
●
●
●
●
●
●
●
●
●
●
●
●
●
●
●
●
●
●
●
●
●
●
●
●
●
●
●
●
●
●
●
●
●
●
●
●
●
●●
●
●
●
●
●
● ●
●
●
●
●
●
●
●
●
●
●
●
●
●
●
●●
● ●
●
●
●
●
●
●
●
●
●
●
●
●●
●
●
●
●
●
●
● ●
●
●
●
●
●
●
●
●
●
●
●
●
●
●
●
●
●
●
●
●
●
●
●
●
●
●
●
●
●
●
●
●
●
●
●
●
●
●
●
●
●
●
●
●
●
●
●
●
●
●
●
●
●
●
●
●
●
●
●
●●
●
●
●
●
●
●
●
●
●
●
●
●
●
●
●
●
●
●
●
●
●
●
●
●
●
●
●
●
●
●
●
●
●
●
●
●
●
●
●
●
●
●
●
●
●
●
●
●
●
●
●
●
●
●
●
●
●
●
●
●
●
●
●
●
●
●
●
●
●
●
●
●
●
●
●
●
●
●
●
●
●
●
●
●
●
●
●
●
●
●
●
●
●
●
●
●●
●
●
●
●
●
●
●
●
●
●
●
●
●
●
●
●
●
●
●
●
●
●
●
● ●
●
●
●
●
●
●
●
●
●
●
●
●
●●
●
●
●
●
●
●
●
●
●
●
●
●●
●
●
●
●
●
●
●
●
●
●
●
●
●
●
●
●
●
●
●
●
●
●
●●
●
●
●
●
●
●
●
●
●
●●
●
●
●
●
●
●
●
●
●
●
●
●
●
●
●
●
●
●
●
●
●
●
●
●
●
●
●
●
●
●
●
●
●
●
●
●
●
●
●
●
●
●
●
●
●
●
●
●
●
●
●
●
●
●
●
●
●
●
●
●
●
●
●
●
●
●
●
●
●
●
●
●
●●
●
●
●
●
●
●
●
●
●
●
●
●
●
●
●
●
●
●
●
●
●●
●
●
●
●
●
●
●
●
●
●
●
●
●
●
●
●
●
●
●
●
●
●
●
●
●
●
●
●
●
●
●
●
●
●
●
●
●
●
●
●
●
●
●
●
●●
●
●
●
●
●
●
●
●
●
●
●
●
●
●
●
●
●
●
●
●
●
●
●
●
●
●
●
●
●
●
●
●
●
●
●
●
●
●
●
●
●
●
●
●
●
●
●
●
●
●
●
●
●
●
●
●
●
●●
●
●
●
●
●
●
●
●
●
●
●
●
●
●
●
●
●
●
●
●
●
●
●
●
●
●
●
●
●
●
●
●
●
●
●
●
●
●
●
●
●
●
●
●
●
●
●
●
●
●
●
●
●
●
●
●
●
●
●
●
●
●
●
●
●
●
●
●
●
●
●
●
●
●●
●
●
●
●
●
●
●
●
●
●
●
●
●
●
●
●
●
●
●
●
●
●
●
●
●
●
●
●
●
●
●
●
●
●
●
●
●
●
●
●
●
●
●
●
●
●
●
●
●
●
●
●
●
●
●
●
●
●
●
●
●
●
●
●
●
●
●
●
●
●
●
●
●
●
●●
●
●
●
●
●
●
●
●
●
●
●
●
●
●
●
●
●
●
●
●
●
●
●
●
●
●
●
●
●
●
●
●
●
●
●
●
●
●
●
●●
●
●
●
●
●
●
●
●
●
●
●
●
●
●
●
●
●
●
●
●
●
●
●
●
●
●
●
●
●●
●
●
●
●
●
●
●
●
●
●
●
●
●
●
●
●
●
●
●
●
●
●
●
●
●
●
●●
●
●
●
●
●
●
●
●
●
●
●
●
●
●
●
●
●
●
●
●●
●
●
●●
●
●
●
●
●
●
●
●
●
●
●
●
●
●
●
●
●
●
●
●
●
●
●
●
●
●
●
●
●
●
●
●
●
●
●
●
●
●
●
●
●
●
●
●
●
●
●
●
●
●
●
●
●
●
●
●
●
●
●
●
●
●
●
●
●
●
●
●
●
●
●
●
●
●
●
●
●
●
●
●
●
●
●
●
●
●
●
●
●
●
●
●
●
●
●
●
●
●
●
●
●
●
●
●
●
●
●
●
●
●
●
●
●
●
●
●
●
●
●
●
●
●
●
●●
●
●
●
●
●
●
●
●
●
●
●
●
●
●
●
●
●
●
●
●
●
●
●
●
●
●
●
●
●
●
●
●
●
●
●
●
●
●
●
●
●●
●
●
●
●
●
●
●
●
●
●
●
●
●
●
●
●
●
●
●
●
●
●
●
●
●
●
●
●
●
●
●
●
●
●
●
●
●
●
●
●
●
●
●
●
●
●
●
●
●
●
●
●
●
●
●
●
●
●
●
●
●
●●
●
●
●
●
●
●
●
●
●
●
●
●
●
●
●
●
●
●
●
●
●
●
●
●
●
●
●
●
●
●
●
●
●
●
●
●
●
●
●
●
●
●
●
●
●
●
●
●
●
●
●
●
●
●
●
●
●
●
●
●
●
●
●
●
●
●
●
●
●
●
●
●
●
●
●●
●
●
●
●
●
●
●
●
●
●
●
●
●
●
●
●
●
●
●
●
●
●
●
●
●
●
●
●
●
●
●
●
●
●
●
●
●
●
●
●
●
●
●
●
●
●
●
●
●
●
●
●
●
●
●
●
●
●
●
●
●
●
● ●
●
●
●
●
●
●
●
●
●
●
●
●
●
●
●
●●
●
●
●
●
●
●
●
●
●
●
●
●
●
●
●
●
●
●
●
●
●
●
●
●
●
●
●
●
●
●
●
●
●
●
●
●
●
●
●
●
●
●
●
●
●
●
●
●
●
●
●
●
●
●
●
●
●
●
●
●
●
●
●
●
●
●
●
●
●
●
●
●
●
●
●
●
●
●
●
●
●
●
●
●
● ●
●
●
●
●
●
●
●
●
●
●
●
●
●
●
●
●
●
●
●
●
●
●
●
●
●
●
●
●
●
●
●
●
●
●
●
●
●
●
●
●
●
●
●
●
●
●
●
●
●
●
●
●
●
●
●
●
●
●
●
●
●
●
●
●
●
●
●
●
●
●
●
●
●
●
●
●
●
●
●
●
●
●
●
●
●
●
●
●
●
●
●
●
●
●
●
●
●
●
●
●
●
●
●
●
●
●
●
●
●
●
●
●
●
●
●
●
●
●
●
●
●
●
●
●
●
●
●
●
●
●
●
●
●
●
●
●
●
●
●
●
●
●
●
●
●
●
●
●
●
●
●
●
●
●
●
●
●
●
●
●
●
●
●
●
●
● ●
●
●
●
●
●
●
●
●
●
●
●
●
●
●
●
●
●
●
●
●
●
●
●●
●
●
●
●
●
●
●
●
●
●
●
●
●
●●
●
●
●
●
●
●
●
●
●
●
●
●
●
●
●
●
● ●
●●
●
●
●
●
●
● ●
●
●
●
●
●
●
●
●
●
●
●
●
●
●
●
●
●
●
●
●
●
●
●
●
●
●
●
●
●
●
●
●
●
●
●
●
●
●
●
●
●
●
●
●
●
●
●
●
●
●
●
●
●
●
●
●
●
●
●
●
●
●
●
●
●
●
●
●
●
●
●
●
●
●
●●
●
●
●
●
●
●
●
●
●
●
●
●
●
●
●
●
●
●
●
●
●
●
●
●
●
●●
●
●
●
●
●
●
●
●●
●
●
●
●
●
●
●
●
●
●
●
●
●
●
●
●
●
●
●
●
●
●
●
●
●
●
●
●
●
●
●
●
●
●
●
●●
●
●
●
●
●
●
●
●
●
●
●
●
●
●
●
●
●
●
●
●
●
●
●
●
●
●
●
●
●●
●
●
●
●
●
●
●
●
●
●
●
●
●
●
●
●
●
●
●
●
●
●
●
●
●
●
●
●●
●
●
●
●
●
●
●
●●
●
●
●
●
●
●
●
●
●
●
●
●
●
●
●
●
●
●
●
●
●
●
●
●
●
●
●●
●
●
●
●
●
●
●
●
●
●
●
●
●●
●
●
●
●
●
●
●
●
●
●
●
●
●●
●●
●
●
●
●
●
●
●
●
●
●
●
●
●
●
●
●
●
●
●
●
●
●
●
●
●
●
●
●
●
●
●
●
●
●
●
●
●
●
●
●
●
●
●
●
●
●
●
●
●
●
●
●
●
●
●
●
●
●
●
●
●
●
●
●
●
●
●
●
●
●
●
●
●
●
●
●
● ●
●
●
●
●
●
●
●
●
●
●
●●
●
●
●
●
●
●
●
●
●
●
●
●
●
●
●
●
●
●
●
●
●
●
●
●
●
●
●
●
●
●
●
●
●
●
●
●●
●
●
●
● ●
●
●
●●
●
●
●
●
●
●
●
●
●
●
●
●
●
●
●
●
●
●
●
●
●
●
●
●
●
●●
●
●
●
●
●
●
●
●
●
●
●
●
●
●
●
●
●
●
●
●
●
●
●
●
●
●
●
●
●●
●
●
●
●
●
●
●
●
●
●
●●
●
●
●
●
●
●
●
●
●
●
●
●
●
●
●
●
●
●
●
●●
●
●
●
●
●
●
●
●
●
●
● ●
●
●
●
●
●
●
●
●
●
●
●
●
●
●
●
●
●
●
●
●
●
●
●
●
●●
●
●
●
●
●
●
●
●
●
●
●
●
●
●
●
●
●
●
●
●
●●
●●
●
●
●
●
●
●
●
●
●
●
●
●
●
●
●
●
●
●
●
●
●
●
●
●
●
●
●
●
●
●
●
●
●
●
●
●
●
●
●
●
●
●
●
●
●
●
●
●
●
●
●
●
●
●
●
●
●
●
●
●
●
●
●
●
●
●
●
●
●
●
●
●
●
●
●
●
●
●
●
●
●
●
●
●
●
●
●
●
●
●
●
●
●
●
●
●
●
●
●
●
●
●
●
●
●
●●
●
●
●
●
●
●
●
●
●
●
●
●
●
●
●
●
●
●
●
●
●
●●
●
●
●
●
●
●
●
●
●
●
●
●
●
●
●
●
●
●
●
●
●
●
●
●
●
●
●
●
●
●
●
●
●
●
●
●
●
●
●
●
●
●
●
●
●
●
●
●
●
●
●
●
●
●
●
●
●
●
●
●
●
●
●
●
●
●
●
●
●
●●
●
●
●
●
●
●
●
●
●
●
●
●
●
●●
●
●
●
●
●
●
●
●
●
●
●
●
●
●
●
●
●
●
●
●
●
●
●
●
●
●
●
●●
●
●
●
●
●
●
●
●●
●
●
●
●
●
●
●
●
●
●
●
●
●
●
●
●
●
●●
●
●
●
●
●
●
●
●
●
●
●
●
●
●
●
●
●
●
●
●
●
●
●
●
●
●
●
●
●
●
●
●
●
●
●
●
●
●●
●
●
●
●●
●
●
●
●
●
●
●
●
●
●
●
●
●
●
●
●
●
●
●
●
●
●
●
●
●
●
●
●
●
●
●
●
●
●
● ●
●
●
●
●
●
●
●
●
●
●●
●
●
●
●
●
●
●
●
●
●
●
●
●
●
●
●
●
●
●
●
●
●
●
●
●
●
●
●
●
●
●●
●
●
●
●
●
●
●
●●
●
●
●
●
●
●
●
●
●
●
●
●
●
●
●
●
●
●
●
●
●
●
●
●
●
●
●
●
●
●
●
●
●
●
●
●
●
●
●
●
●
●
●
●
●
●
●
●
●
●
●
●
●
●
●
●
●
●
●
●
●
●
●
●
●
●
●
●
●
●
●
●
●
●
●
●
●
●
●
●
●
●
●
●
●
●
●
●
●
●
●
●
●
●●
●
●
●
●
●
●
●
●
●
●
●
●
●
●
●
●
●
●
●
●
●
●
●
●
●
●
●●
●
●
●
●
●
●
●
●
●
●
●
●
●
●
●
●
●
●
●
●
●
●
●
●
●
●
●
●
●
●
●
●
●
●
●
●
●
●
●
●
●
●
●
●
●
●
●
●
●
●
●
●
●
●
●
●
●
●
●
●
●
●●
●
●
●
●●
●
●
●
●
●
●●
●
●
●
●
●
●
●
●
●
●
●
●
●
●
●
●
●
●
●
●
●
●
●
●
●
●
●
●
●
●
●
●
●
●
●
●
●
●
●
●
●
●
●
●
●
●
●
●
●
●
●
●
●
●
●
●
●
●
●
●
●
●
●
●
●
●
●
●
●
●
●
●
●
●
●
●
●
●
●
●
●
●
●
●
●
●
●
●
●
●
●
●
●
●
●
●
●
●
●
●
●
●
●
●
●
● ●
●
●●
●
●
●
●
●
●
●
●
●
●
●
●
●
●
●
●
●
●
●
●
●
●
●
●
●
●
●
●
●
●
●
●
●
●
●
●
●
●
●
●
●
●
●
●
●
●
●
●
●
●
●
●
●
●
●
●
●
●
●
●
●
●
● ●
●●
●
●
●
●
●
●
●
●
●
●
●
●
●
●
●
●
●
●
●
●
●
●
●
●
●●
●
●
●
●
●
●
●
●
●
●
●
●
●
●
●
●
●
●
●
●
●
●
●
●
●
●● ●
●
●
●●
●
●
●
●
●
●
●
●
●
●
●
●
●
●
●
●
●
●
●
●
●
●
●
●
●
●
●
●
●●
●
●
●
●
●
●
●
●
●
●
●
●
●
●
●
●
●
●
●
●
●
●
●
●
●
●
●
●
●
●
●
●
●
●
●●
●
●
●
●
●
●
●
●
●
●
●
●
●
●
●
●
●
●
●
●
●
●
●
●
●
●
●
●
●
●
●
●
●
●
●
●
●
●
●
●
●
●
●
●
●
●
●●
●
●
●
●
●
●
●
●
●
●
●
●
●
●
●
●
●
●
●
●
●
●
●●
●
●
●
●
●
●
●
●
●
●
●
●
●
●
●
●
●
●
●
●
●
●
●
●●
●
●
●
●
●
●
●
●
●
●
●
●
●
●
●
●
●●
●
●
●
●
●
●
●
●
●
●
●
●
●
●
●
●
●
●
●
●
●
●
●
●
●●●
●
●
●
●
●
●
●
●
●
●
●
●
●
●
●
●
●
●
●
●
●
●
●
●
●
●
●
●
●
●
●
●
●
●
●
●
●
●
●
●●
●
●
●
●
●
●
●
●●
●
●
●
●
●
●
●
●
●
●
●
●
●
●
●
●●
●
●
●
●
●
●
●
●
●
●
●●
●
●
●
●
●
●
●
●
●
●
●
●
●
●
●
●
●
●
●
●
●
●
●
●
●
●
●
●
●
●
●
●
●
●
●
●
●
●
●
●
●
●
●
●
●
●
●
●
●
●
●
●
●
●
●
●
●
●
●
●
●
●
●
●
●
●
●
●
●
●
●
●
●
●
●
●
●
●●
●●
●
●
●
●
●
●
●
●
● ●●
●
● ●
●
●
●
●
●
●
●
●●
●
●
●
●
●
●
●
●
●
●
●
●
●
●
●
●
●
●
●●
●
●
●
●
●
●
●
●
●
●
●
●
●
●
●
●
●
●
●
●
●
●
●
●
●
●
●
●
●
●
●
●
●
●
●
●●
●
●
●
●
●
●
●
●
●
●●
●
●
●
●
●
●
●
●
●●
●
●●
●●
●
●
●
●
●
●
●
●
●
●
●
●
●
●
●
●
●
●●
●
●
●
●
●
●
●
●●
●
●
●
●
●
●
●
●
●
●
●
●
●
●
●
●
●
●
●
●
●
●
●
●
●
●
●
●
●
●
●
●
●
●●
●●
●
●
●
●
●
●
●
●
●●
●
●
●
●
●
●
●
●
●
●
●
●
●●
●
●●
●
●
●
●
●
●
●
●
●
●
●
●
●
●●
●
●
●
●
●
●
●
●
●
●
●
●
●●
●
●
●
●
●
●
●
●
●
●
●
●
●
●
●
●
●
●
●
●
●
●
●
●
●
●
●
●
●
●
●
●
●
●
●●
●
●
●
●
●
●
●
●
●
●
●
●
●
●
●●
●
●
●
●
●
●
●
●
● ●
●
●
●
●
●
●
●
●
●
●
●
●
●
●
●
●
●
●
●
●
●
●
●
●
●
●
●
●
●●
●
●
●
●
●
●
●
●
●
●
●
●
●
●
●
●
●
●
●
●
●
●
●
●
●
●
●
●
●
●
●
●●
●
●●
●
●
●
●
●
●
●
●
●
●
●
●
●
●
●
●
●
●
●
●
●
●
●
●
●
●
●
●
●
●
●
●
●
●
●
●
●
●
●
●
●
●
●
●
●
●
●
●
●
●
●
●
●
●
●
●
●
●
●
●
●
●
●
●
● ●
●
●
●
●
●
●
●
●
●
●
●
●
●
●
●
●
●
●
●
●
●
●
●
●
●
●●
●
●
●
●
●
●
●
●●
●
●
●
●
●
●
●
●
●
●
●
●
●
●
●
●
●
●
●●
●
●
●
● ●
●
●
●
●
●
●
●
●
●
●
●
●
●
●
●
●
●
●
●
●
●
●
●●
●
●
●
●
●
●
●
●
●
●
●
●
●
●
●
●
●
●
●
●
●
●
●
●
●
●
●
●
●
●
●
●
●
●
●
●
●
● ●
●
●
●
●
●
●
●
●
●
●
●
●
●
●
●
●
●
●
●
●
●
●
●
●
●
●
●
●
●
●
●
●
●
●
●
●
●
●
●
●
●
●
●
●
●
●
●●
●
●
●
●
●
●
●
●
●
●
●
●
●
●
●
●
●
●
●
●
●
●
●
●
●
●
●
●
●
●
●●
●
●
●
●
●
●
●
●
●
●
●
●
●
●
●
●
●
●
●
●
●
●
●
●
●
●
●
●
●
●
●
●
●
●
●
●
●
●
●
●
●
●
●
●
●
●
●
●
●
●
●
●
●
●
●
●
●
●
●
●
●
●
●
●
●
●
●
●
●
●
●
●
●
●
●
●
●
●
●
●
●
●
●
●
●
●
●
●
●
●
●
●
●
●
●
●
●
●
●
●
●
●
●
●
●
●
●
●
●
●
●
●
●
●
●
●
●
●
●
●
●
●
●
●
●
●
●
●
●
●
●
●
●
●
●
●
●
●
●
●
●
●
●●
●
●
●
●
●
●
●
●
●
●
●
●
●●
●
●
●
●
●
●
●
●
●
●
●●
●
●
●
●
●
●
●
●
●
●
●
●
●
●
●
●
●
●
●
●
●
●
●
●
●
●
●
●
●
●
●
●
●
●
●
●
●
●
●
●
●
●
●
●
●
●●
●
●
●
●
●
●
●
●
●
●
●
●
●
●
●
●
●
●
●
●
●
●
●
●
●
●
●
●
●
●
●
●
●
●
●
●
●●
●
●
●
●
●
●
●
●
●
●
●
●
●
●
●
●
●
●
●
●
●
●
●
●
●
●
●
●
●
●
●
●
●
●
●
●
●●
●
●
●
●
●
●
●
●
●
●
●
●
●
●
●
●
●
●
●
●
●
●
●
●
●
●
●
●
●
●
●
●
●
●
●
●
●
●
●
●
●
●
●●
●
●
●
●
●
●●
●
●
●
●
●
●
●
●
●
●
●
●
●
●
●
●
●
●
●
●
●
●
●
●
●
●
●
●
●
●
●
●
●
●
●
●
●
●
●
●
●
●
●
● ●
●
●
●
●
●
●
●
●
●
●
●
●
●
●
●
●
●
●
●
●
●
●
●
●
●
●
●
●
●
●●
●
●
●
●
●
●
●
●
● ●
●
●
●
●
●
●●
●
●●
●
●
●
●
●
●
●
●
●
●
●
●
●
●
●
●
●
●
●
●
●
●
●
●
●
●
●
●
●
●
●
●
●
●
●
●
●●
●
●
●
●
●
●
●
●
●●
●
●
●
●
●
●
●
●
● ●
●
●
●
●
●
●
●
●
●
●
●
●
●
●
●
●
●
●
●
●
●
●
●
●
●
●
●
●
●
●
●
●
●
●
●
●
●
●
●
●
●
●
●
●
●
●
●
●
●
●
●
●
●
●
●
●
●
●
●
●
●
●
●
●
●
●
●
●
●
●
●
●
●
●
●
●●
●
●
●
●
●
●
●
●
●
●
●
●
●
●
●
●
●
●
●
●
●
●
●
●
●●
●
●
●
●
●
●
●
● ●
●
●
●
●
●
●
●
●●
●
●
●
●
●
●
●
●
●
●
●
●
●
●
●
●
●
●
●
●
●
●
●
●
●
●
●
●
●
●
●
●
●
●
●
●
●
●●
●
●
●
●●
●
●
●
●
●
●
●
●
●
●
●
●
●
●
●
●
●
●
●
●
●
●
●
●
●
●
●
●
●
●
●
●
●
●
●
●
●
●
●
●
●
●
●
●
●
●
●
●
●
●
●
●
●
●
●
●●
●
●
●
●
●
●
●
●
●
●
●
●
●
●
●●
●
●
●
●
●
●
●
●
●
●
●
●
●
●
●
●●
●
●
●
●
●
●
●
●
●
●
●
●
●
●
●
●●
●
●
●
●
●
●
●
●
●
●
●
●
●
●●
●
●
●
●
●
●
●
●
●
●
● ●
●
●
●
●
●
●
●
●
● ●
●
●
●
●
●
●
●
●
●
●
●
●
●
●
●
●
●
●
●
●
●
●
●
●
●
●
●
●
●
●
●
●
●
●
●
●●
●
●
●
●
● ●
●
●
●
●
●
●
●
●
●
●
●
●
●
●
●
●
●
●
●
●
●
●
●
●●
●
●
●
●
●
●
●
●
●
●
●
●
●
●●
●
●●
●
●
●
●
●
●
●
●
●
●
●
●
●
●
●
●
●
●
●
●
●
●
●
●
●
●
●
●
●
●
●
●
●
●
●
●
●
●
●
●
●
●
●
●
●
●
●
●
●
●
●
●
●
●
●
●
●
●
●
●●
●
●
●
●
●
●
●
●
●
●
●
●
●
●
●
●
●
●
●
●
●
● ●
●
●
●
●
●
●
●
●
●
●
●
●
●
●
●
●
●
●
●
●
●
●
●
●
●
●
●
●
●
●
●
●
●
●
●
●
●
●
●
●
●
●
●
●
●
●
●
●
●
●
●
●
●
●●
●
●
●
●
●
●
●
●
●
●
●
●●
●
●
●●
●
●
●
●
●
●
●
●
●
●
●
●
●
●
●
●
●
●
●
●
●
●
●
●
●
●
●
●
●
●
●
●
●
●
●
●
●
●
●
●
●
●
●
●
●
●
●
●
●
●
●
●
●
●
●
●
●●
●
●
●
●
●
●
●
●
●
●
●
●
●
●
●
●
●
●
●
●
●
●
●
●
●
●
●
●
●
●
●
●
●
●
●
●
●
●
●
●
●
●
●
●
●
●
●
●
●
●
●
●
●
●
●
●
●
●
●
●●
●
●
●
●
●
● ●
●
●
●
●
●
●
●
●
●
●
●
●
●
●
●
●
●
●
●
●
●
●
●
●●
●
●
●
●
●
●
●
●●
●
●
●
●
●
●
●
●
●
●
●
●
●
●
●●
●
●
●
●
●
●
●
●
●
●
●
●
●
●
●
●
●
●
●
●●
●
●
●
●
●
●
●
●
●
●
●
●
●
●
●
●
●
●
●
●
●●
●
●
●
●
●
●
●
●
●
●
●
●
●
●
●
●
●
●
●
●
●
●
●
●
●
●
●
●
●
●
●
●
●
●
●
●
●
●
●
●
●
●
●
●
●
●
●
●
●
●
●
●●
●
●
●
●
●
●
●
●
●
●
●
●
●
●
●
●
●
●
●
●
●
●
●
●
●
●
●
●
●
●
●
●
●
●
●
●
●
●
●
●
●
●
●
●
●
●
●
●
●
●
●
●
●
●
●
●
●
●
●
●
●
●
●
●
●
●
●
●
●
●
●●
●●
●
●
●
●
●
●
●
●
●
●
●
●
●
●
●
●
●
●
●
●
●
●
●
●
●
●
●
●
●
●
●
●
●
●
●
●
●
●
●
●
●
●
●
●
●
●
●
●
●
●
●
●
●
●
●
●
●
●
●
●
●
●
●
●
●
●
●
●
●
●
●
●
●
●
●
●
●●
●
●
●
●
●
●
●
●
●
●
●
●
●
●
●
●
●
●
●
●
●
●
●
●
●
●
●
●
●
●
●
●
●
●
●
●
●
●
●
●
●
●
●
●
●
●
●
●
●
●
●
●
●
●
●
●
●
●
●
●
●
●●
●
●
●
●
●
●
●
●
●
●
●
●
●
●
●
●
●
●
●
●
●
●
●
●
●
●
●
●
●
●
●
●
●
●
●
●
●
●
●
●
●
●
●
●
●
●
●
●
●
●
●
●
●
●●
●
●
●
●
●
●
●
●
●
●
●
●
●
●
●
●
●
●
●
●
●
●
●
●
●
●
●
●
●
●
●
●
●
●
●
●
●
●
● ●
●
●
●
●
●
●
●
●
●
●
●
●
●
●
●
● ●
●
●
●
●
●
●●
●
●
●
●
●
●
●
●
●
●
●
●
●
●
●
●
●
●
●●
●
●
●
●
●
●
●
●
●
●
●
●
●
●
●
●
●
●
●
●
●
●
●
●
●
●
●
●
●
●
●
●
●
●
●
●
●
●
●
●
●
●
●
●
●
●
●
●
●
●
●
●
●
●
●
●
●
●
●
●
●
●
●
●
●
●
●
●
●
●
●
●
●
●
●
●
●
●
●
●
●
●
●
●
●
●
●
●
●
●
●
●
●
●
●
●
●
●
●
●
●
●
●
●
●
●
●
●
●
●
● ●
●●
●
●
●●
●
●
●
●
●
●
●
●
●
●
●
●
●
●
●
●
●
●
●
●
●
●
●
●
●
●
●
●
●
●
●
●
●
●●
●
●
●
●●
●
●
●
●
●
●
●
●
●
●
●
●
●
●
●
●
●
●
●
●
●
●
●●
●
●
●
●
●
●
●
●
●
●
●
●
●
●
●
●
●
●
●
●
●
●● ●
●
●
●
●
●
●
●
●
●
●
●
●●
●
●
●
●
●
●
●
●
●
●
●
●
●
●
●
●
●
●
●●
●
●
●
●
●
●
●
●
●
●
●
●
●
●
●
●
●
●
●
●
●
●
●
●
●
●
●
●●
●
●
●●
●
●
●
●
●
●●
●
●
●
●
●●
●●
●
●●
●
●
●●
●
●
●
●
●
●
●
●
●
●
●
●
●
●
●
●●
●
●
●
●
●
●
●
●
●
●
●
● ●
●
●
●
●
●
●●
●
●
●
● ●
●
●
●
●
●
●
●
●
●
●
●
●
●●
●
●
●
●
●●
●
●
●
●
●
●
●
●
●
●
●
●
●
●
●
●
●
●
●
●
●
●
●
●
●
●
●
●
●
●
●
●
●
●
●
●
●
●
●
●
●
●
●
●
●
●
●
●
●
●
●
●
●
●
●●●
●
●
●
●
●
●●
●
●
●
●●
●
●
●●
●
● ●
●
●
●
●
●
●
●
●
●
●
●
●
●●
●
●
●
●
●
●
●
●
●
●
●
●
●
●●
●
●
●
●
●
●
●●
●
●
●●
●
●
●
●
●
●
●
●
●
●
●
●
●
●
●
●
●
●
●
●
●
●
●
●
●
●
●
●
●
●
●
●
●
●
●
●
●
●●
●
●
●
●
●
●
●
●
●
●
●
●
●
●
●
●
●
●
●
●
●
●
●
●
●
●
●
●
●
● ●
●
●
●
●
●
●
●
●
●
●
●
●
●
●
●
●
●
●
●
●
●
●
●
●
●
●
●
●
●
●
●
●
●
●●
●
●
●
●
●
●
●
●
●
●
●
● ●
●
●
●
●
●
●●
●
●
●
●
● ●
●
●
●
●
●
●
●
●
●
●
●
● ●
●
●
●
●
●
●
●
●
●
●
●
●
●
●
●
●●
● ●
●
●
●
●
●
●
●
●
●
●
●
●●
●
● ●
●
●
●
●
●
●
●
●
●
●
●●
●
●●
●
●
●
●
●
●
●
●
●
● ●●
●
●
●
●
●
●
●
●
●
●
●
●
●
●
●
● ●
●
●
●
●
●●
●
●
●
●
●
●
●
●
●
●
●
●
●
●
●
● ●
●
●
●
●
●
●
●
●
●
●
●
●
●
●
●
●
●
●●
●
●
●
●
●
●
●
●
●
●
●
●
●
●
●
●
● ●
●
●
●
●
●
●
●
●
●
●
●
●
●
●
●
●
●
●
●
●
●
●
●
●
●
●
●
●
●●
●
●
●
●
●
●
●
●
●
●
●●
●
●
●
●
●
●
●
●
●
●
●
●
●
●
●
●
●
●
●
●
●
●
●
●●●
●●
●
●
●
●●
●
●
●
●
●
●
●
●
●
●
●
●
●
●
●
●
●
●
●
●
●
●●
●
●
●
●
● ●
●
●
●
●
●
●●
●
●
●
●
●
●
●
●
●
●
●
●
●
●●
●
●
●
●
●
●
●
●●
●
●
●
●
●
●
●
●
●●
●
●
●
●
●
●
●
●
●
●
●
●
● ●
●
●
●
●
●
●
●●
●
●
●
●
●
●
●
●
●
●●
●
●
●
●
●
●
●●
●
●
●
●
●
●
●
●
●
●
●
●
●
●
●
●●
●
●
●
●
●
●
●
●●
●
●
●
●
●
●
●
●
●●
●
●
●
●
●
●
●
●
●
●●
●
●
●
●
●
●
●
●
●
●
●
●
●
●
●
●
●
●
●
●●
●
●
● ●
●
●
●
●
●
●
●
●
●
●
●
●
●
● ●
●
●
●
●
●
●
●
●
●
●
●
●
●
●
●
●
●
●
●
● ●
●
●
●
●
●
●
●
●
●
●
●
●
●
●
●
●
●
● ●
●
●
●
●
●
●
●
●
●
●
●
●
●●
●
●
●
●
●●
●
●
●
●
●
●
●
●
●
●
●
●
●
●
●
●
●
●
●
●
●
●
●●
●
●
●●
●●
●
●
●
●
●
●
●
●
●
●
●
●
●
●
●
●
●
●
●
●
●
●
●
●
●
●
●
●
●
●
●
●
●
●
●●
●
●
●
●
●
●
●
●
●
●
●
●
●
●
●
●
●
●
●
●
●
●
●
●
●
●
●
●●
●
●
●
●
●
●
●
●
●●
●
●
●
●
●
●●
●
●
●
●
●
●
●
● ●
●
●●
●
●
●
●
●
●
●
●
●
●
●●
●●
●
●
●
●
●
●
●
●
●
●
●
●
●
●
●
●
●
●
●
●
●
●
●
●
●
●
●
●●
●
●
●●
●
●
●
●
●
●
●
●
●
●
●
●
●
●
●
● ●
●
●
●
●
●
●
●
●
●
●
●
●
●
●
●●
●●
●
●
●
●
●
●
●
●
●
●
●
● ●
●
●
●
●
●
●
●
●
●
●
●
●●
●
●
●
●
●
●
●
●
●
●
●
●
●
●
●
●
●
●
●
●
●
●
●
●
●
●
●
●
●
●
●
●
●
●
●
●
●
●
●
●
●
●●
●
●
●
●
●
●
●
●
●
●
●
●
●
●
●
●
●
●
●●
●
●
●
●
●
●
●●
●
●
● ●●
●
●
●
●
●
●
●
●
●
●
●
●
●
●
●●
●
●
●
●●
●
●
●
●
●
●
●
●
●
●
●
●
●
●
●
●
●
●
●
●●
●
●
●
●
●
●
●
●
●
●
●
●
●
●
●
●
●
●
●
●
●
●
●
●
●
●
●
●
●●
●
●
●
●
●
●
●
●
●
●
●
●
●
●
●
●
●
●
●
●
●
●
●
●
●
●
●
● ●
●
●
●
●
●
●
●
●
●
●
●
●
●
●
●
●
●
●
●
●
●
●
●
●
●
●
●
●
●
●
●
●
●
●
●
●
●●
●●
●
●
●
●
●
●●●
●●
●
●
●
●
●
●
●
●
●
●
●
●
●●
●
●
●
●
●
●
●
●
●●
●
●
●
●
●
●
●
●
●●
●
●
●
●
●
●
●
●
●
●
●
●
●
●
●
●
●
●
●
●
●
●
●
●
●
●
●
●
●
●
●
●
●
●
●
●
●
●
●
●
●
●
●
●
●
●●
●
●
●
●
●
●
●
●
●
●
●
●
●
●
●●
●
●
●
●
●
●
●
●
●
●
●
●
●
●
● ●
●
●●
●
●
●
●
●
●
●
●
●
●
●
●
●
●
●
●
●
●
●●
●
●
●
●
●
●●
● ●
●●
●
●
●
●
●●
●
●
●●●
●
●
●
●
●●
●
●
●●
●
●
●
●
● ●
●
●
●
●
●
●
●
●
●
●
●
●
●
●
●
● ●
●
●
●
●
●
●
●
●
●
●
●
●
●
●
● ●
●
●●
●
●
●
●
●
●●
●
●
●
●
●
●
●
●●
● ●
●●
●
●
●
●
●
●
●
●
●
●
●
●
●
●
●
●
●
●
●
●
●
●
●
●
●
●
●
●
●
●
●
●
●
●
●
●
●
●
●
●
●
●
●
●
●
●
●
●
●
●
●
●
●
●
●
●
●
●
●
●
●
●
●
●
●
●
●
●
●
●
●
●
●
●
●
●
●
●
●
●
●
●
●
●
●
●
●
●
●
●
●
●
●
●
● ●●
●
●
●
●
●
●
●
●
●
●
●
●
●
●
●
●
●
●
●
●
●
●
●
●
●
●
●
●
●
●
●
●
●
●
●
●
●
●
●
●
●
●
●
●
●
●
●
●
●
●
●
●
●
●
●
●●
●
●●
●
●
●
●
●
●
●
●
●●
●
1e−07
1e−04
1e−01
1e+02
1e−07 1e−03 1e+01Gene Score of 6M vs 1M
Gen
e Sc
ore
of X
O4+
vs
XO4−
Low
High
genedensity
++/−+/+−/−−: 1335 / 1030 / 68 / 0
Fig 1
Variables: Genotype: WT & 5xFAD Age: 1, 4, 6, 24m Gender: M & F Brain region: CX & CB
i.p. Methoxy-XO4
XO4+
XO4-
CD45
C
D11b
CX3CR1 M
etho
xy-X
O4
Plaque affected
(CX)
No plaque (CB)
a b
c
e
i j
Molecular analyses (Fig. 1) Proteomic analyses (Fig. 1) Single cell analyses (Fig. 2)
WT CX 5xFAD CX Microglia 95.6%
CX3CR1 M
etho
xy-X
O4
XO4+
XO4-
WT HC 5xFAD HC
XO4+
XO4-
CX3CR1 M
etho
xy-X
O4
WT CB 5xFAD CB
CX3CR1 M
etho
xy-X
O4
XO4+
XO4-
XO4+ XO4-
RNA-Seq
LC-SWATH-MS
MeXO4/Iba1
d
f g
Gene score 6m > 1m
G
ene
scor
e XO
4+ >
XO4-
Gene score 6m > 1m Gene score 4m > 1m
G
ene
scor
e XO
4+ >
XO4-
Q1:1400 Q2:901 Q3:0 Q4:41
Q1:1030 Q2:1335 Q3:0 Q4:68
Gene XO4+ CD11c+ DAM MGnD
Apoe, Igf1, Clec7a, Itgax, Axl, Cst7, Spp1,Cxcr4, Gas7, Serpine2, Gpnmb, Csf1, Fabp3, Cd200r4, Apbb2
↑ ↑ ↑ ↑
Tmem119, P2ry13, Cx3cr1, Crybb1, P2ry12, Ccr5
↓ ↓ ↓ ↓
hi
hii
Ccl3 Cst7 Apoe Psat1 Igf1 Ccr5 Spp1 Crybb1 Cx3cr1 H2-Aa H2-Ab1 Fcrls
Ccl3 Cst7 Apoe Psat1 Igf1 Ccr5 Spp1 Crybb1 Cx3cr1 H2-Aa H2-Ab1 Fcrls
XO4+
XO4+
XO4+
XO4+
W
T W
T XO
4-
XO4-
WT
XO4-
XO4-
XO4-
Region Cx Cb Age (m) 1 4 6 Type WT 5xFAD XO4- 5xFAD XO4+
.CC-BY-NC-ND 4.0 International licensenot certified by peer review) is the author/funder. It is made available under aThe copyright holder for this preprint (which wasthis version posted May 17, 2019. . https://doi.org/10.1101/639054doi: bioRxiv preprint
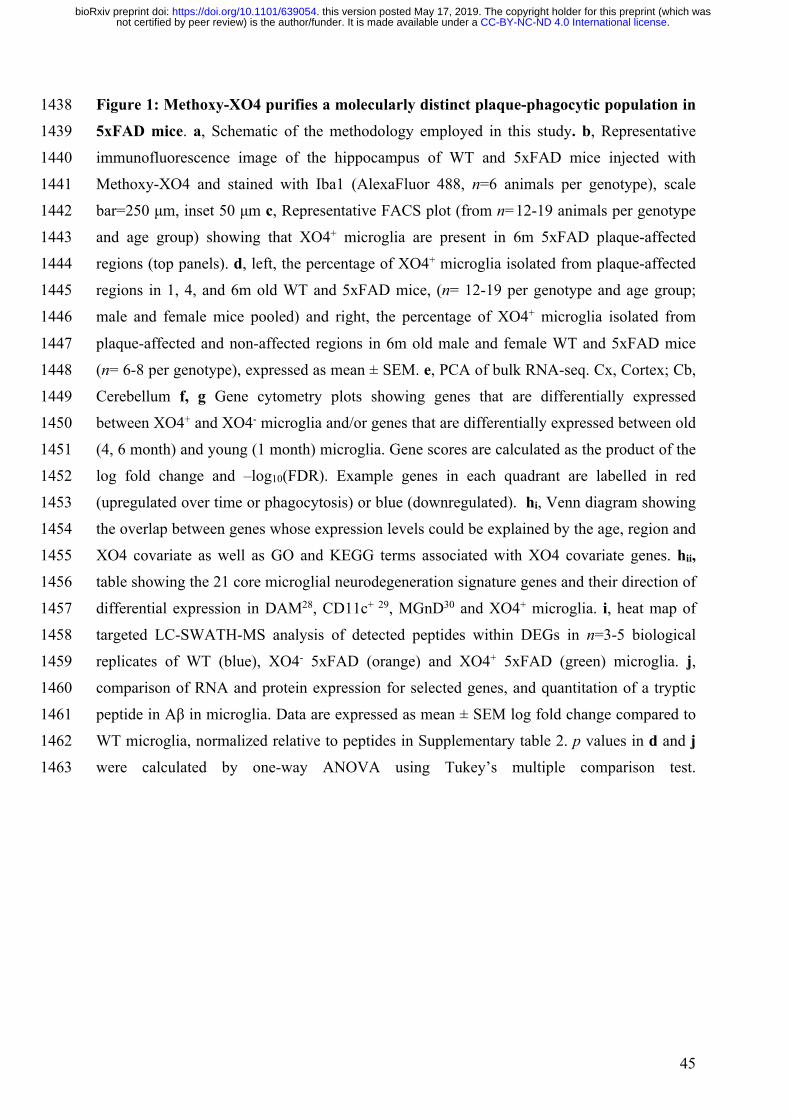
45
Figure 1: Methoxy-XO4 purifies a molecularly distinct plaque-phagocytic population in 1438 5xFAD mice. a, Schematic of the methodology employed in this study. b, Representative 1439 immunofluorescence image of the hippocampus of WT and 5xFAD mice injected with 1440 Methoxy-XO4 and stained with Iba1 (AlexaFluor 488, n=6 animals per genotype), scale 1441 bar=250 μm, inset 50 μm c, Representative FACS plot (from n=12-19 animals per genotype 1442 and age group) showing that XO4+ microglia are present in 6m 5xFAD plaque-affected 1443 regions (top panels). d, left, the percentage of XO4+ microglia isolated from plaque-affected 1444 regions in 1, 4, and 6m old WT and 5xFAD mice, (n= 12-19 per genotype and age group; 1445 male and female mice pooled) and right, the percentage of XO4+ microglia isolated from 1446 plaque-affected and non-affected regions in 6m old male and female WT and 5xFAD mice 1447 (n= 6-8 per genotype), expressed as mean ± SEM. e, PCA of bulk RNA-seq. Cx, Cortex; Cb, 1448 Cerebellum f, g Gene cytometry plots showing genes that are differentially expressed 1449 between XO4+ and XO4- microglia and/or genes that are differentially expressed between old 1450 (4, 6 month) and young (1 month) microglia. Gene scores are calculated as the product of the 1451 log fold change and –log10(FDR). Example genes in each quadrant are labelled in red 1452 (upregulated over time or phagocytosis) or blue (downregulated). hi, Venn diagram showing 1453 the overlap between genes whose expression levels could be explained by the age, region and 1454 XO4 covariate as well as GO and KEGG terms associated with XO4 covariate genes. hii, 1455 table showing the 21 core microglial neurodegeneration signature genes and their direction of 1456 differential expression in DAM28, CD11c+ 29, MGnD30 and XO4+ microglia. i, heat map of 1457 targeted LC-SWATH-MS analysis of detected peptides within DEGs in n=3-5 biological 1458 replicates of WT (blue), XO4- 5xFAD (orange) and XO4+ 5xFAD (green) microglia. j, 1459 comparison of RNA and protein expression for selected genes, and quantitation of a tryptic 1460 peptide in Aβ in microglia. Data are expressed as mean ± SEM log fold change compared to 1461 WT microglia, normalized relative to peptides in Supplementary table 2. p values in d and j 1462 were calculated by one-way ANOVA using Tukey’s multiple comparison test. 1463
.CC-BY-NC-ND 4.0 International licensenot certified by peer review) is the author/funder. It is made available under aThe copyright holder for this preprint (which wasthis version posted May 17, 2019. . https://doi.org/10.1101/639054doi: bioRxiv preprint
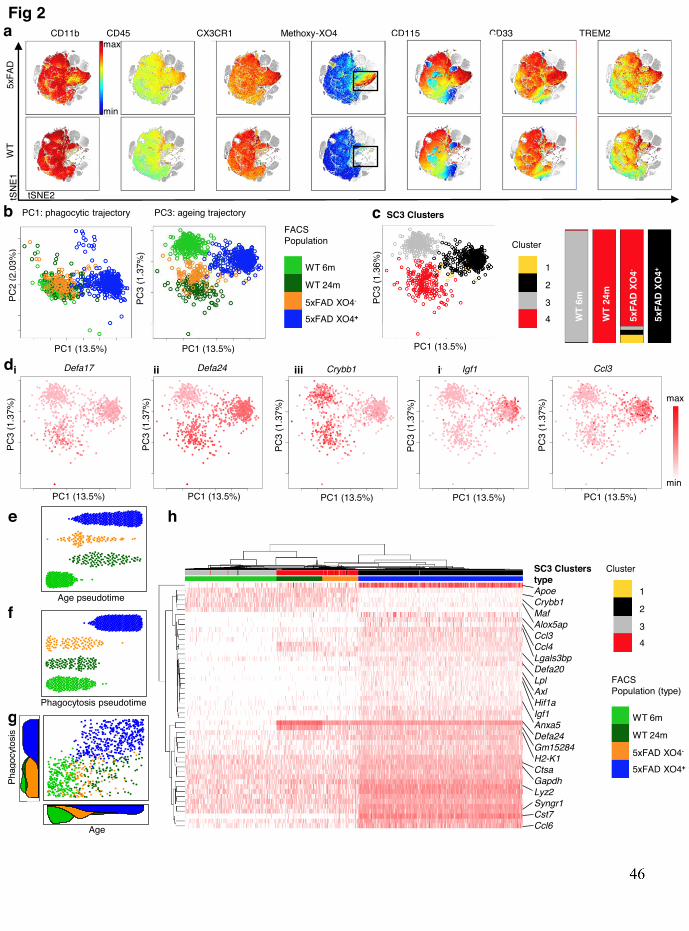
PC1: phagocytic trajectory PC3: ageing trajectory
Fig 2 W
T
5
xFAD
CD11b CD45 CX3CR1 Methoxy-XO4 CD115 CD33 TREM2 a
tSNE2
tSNE
1
b
Defa24 Defa17
Age pseudotime
Phagocytosis pseudotime
c
h
WT 6m
WT 24m
5xFAD XO4-
5xFAD XO4+
1
2
3
4
max
min
FACS Population
SC3 Clusters
PC1 (13.5%)
PC3
(1.3
7%)
PC1 (13.5%)
PC2
(2.0
3%)
PC3
(1.3
6%)
PC1 (13.5%)
PC3
(1.3
7%)
PC1 (13.5%)
PC3
(1.3
7%)
WT
6m
WT
24m
5x
FAD
XO4-
5xFA
D XO
4+
e
SC3 Clusters type Apoe Crybb1 Maf Alox5ap Ccl3 Ccl4 Lgals3bp Defa20 Lpl Axl Hif1a Igf1 Anxa5 Defa24 Gm15284 H2-K1 Ctsa Gapdh Lyz2 Syngr1 Cst7 Ccl6
di ii iii iv v
Cluster
f
g
Phag
ocyt
osis
1
2
3
4
Cluster
WT 6m
WT 24m
5xFAD XO4-
5xFAD XO4+
FACS Population (type)
max min
Igf1 Crybb1
PC1 (13.5%)
PC3
(1.3
7%)
PC1 (13.5%)
PC3
(1.3
7%)
Ccl3
PC1 (13.5%)
PC3
(1.3
7%)
Age
PC1 (13.5%)
●●
●●
●
●●●
●●●●
●
●●
●●
●
●
●●●● ●
●●
● ●
●●●●●● ●●
●
●
● ●
●
●● ●●
●●●
●
●
●
●
●●
●
● ●
●●
●●●●
● ●
●●
●
●● ●
●● ●● ●●
●
●
●
●●
●
●
●
● ●
●●
●
● ●
●
● ●●● ●
●●●
●
● ●●●●
●● ●
●
●● ●
●
●
●●
●●
●
●
● ●●●
●●●
●●●●●
●●
●●●●
●
●●●
●
●●
●
●●
●●●●●
● ●●●
●
●
●●
●
●
●●
●
●●
●●●
● ●●
●
●●●
●●● ●●●
●●
● ●●
●●●
●●●
●
● ●●
●
●
●
●●●
●●●
●
●
●
●
●● ●●
●
●
●●
●
●●
●●
●●●
●
●●● ●● ●●
●●
●●●
●
●●
●●
●
●●
●
●
●
●●
●
●●
●
●●
●●
●●●
●
●●
●● ●
●●●
●
●●●● ●●●
●●
●
●●
●●
●
●
●
●
●
●●
●
●
●
●
●●
●
●
●
●
●
●●
●
●●● ●●●
● ●● ●
●●
●●
●●
● ● ●●
●
●●
●●●
●●
●
●●● ●●
●
●
●
●● ●●
● ●
●●
●
●●
●
● ●
●
●●
●
●
●●●●●●
●
●●
● ●
●●
●
●●●
●●
●●●
●
●●
●
●
●●
●●●
●●
●●
●
●
●●
●
●●●
● ●
●●
●●
●●●
●●
●●● ●
●
●
●
●●
●●
●
●
●
●
●●
●●
●●
●
●
●
● ●
●●
● ●●
●
●●●
●
● ●● ●●●
●●
●●●
● ●● ●●●
● ●● ●●
●
●●
● ●
● ●●●
●
●●●●●
●
●●●
●● ●
●●
●
●
●●●
●●
●●●
●●
●●
●●●●●
●●● ●●●
●●●●
● ●
●
●●
●
●
●
●
●
●●● ●●●●
●●
●●
●
●●●
●●●●●●●
●
●●
● ●●●
●●
●●
●
●●● ●
●
●
●
● ●
●●
● ●●●●● ●
●
●●
●
●
●●
●
●
●●●
●
●● ●●●
●●
●● ●●●
●●
●●
●
●
●
●●●●
●
●
●●
●●
●●
●●
●
●● ●
●●
●●●
●
●●●
●
●●
●●
● ●
●●● ●
●● ●
●
●●
●
●● ●●
● ●
●●●
●●
●
●
● ●
●●
●●
●
●
●
●
●●●
●
●
● ●● ●●
●●●●
●
●●
●●●
●
●
●●●
●●● ●
●
●
●●●
●
●
●● ●● ●
●
●●
●●
●
●
●●
●●● ●●
●
●
● ●
●●
●●
● ●●●
●●●●
●●●●
●●●●
●
●●●
●●
●●
●●●
●
●●
●
●●
●
● ●
●●
● ●●
●
●●
●
●
●●
●
●●
●
●●
●
●
●
●
●
●
●
●
●●
● ●●
●●
●
●●
●● ●
●●
●●●
●●
●
●
●
●
●
●●●●● ●
●
● ●●
● ●●●●
● ● ●●
●
●
●●●●
●●● ●●
●
●●●●
● ●●
●
●
●
●
●● ●
●●
Ccl3
●●
●●
●
●●●
●●●●
●
●●
●●
●
●
●●●● ●
●●
● ●
●●●●●● ●●
●
●
● ●
●
●● ●●
●●●
●
●
●
●
●●
●
● ●
●●
●●●●
● ●
●●
●
●● ●
●● ●● ●●
●
●
●
●●
●
●
●
● ●
●●
●
● ●
●
● ●●● ●
●●●
●
● ●●●●
●● ●
●
●● ●
●
●
●●
●●
●
●
● ●●●
●●●
●●●●●
●●
●●●●
●
●●●
●
●●
●
●●
●●●●●
● ●●●
●
●
●●
●
●
●●
●
●●
●●●
● ●●
●
●●●
●●● ●●●
●●
● ●●
●●●
●●●
●
● ●●
●
●
●
●●●
●●●
●
●
●
●
●● ●●
●
●
●●
●
●●
●●
●●●
●
●●● ●● ●●
●●
●●●
●
●●
●●
●
●●
●
●
●
●●
●
●●
●
●●
●●
●●●
●
●●
●● ●
●●●
●
●●●● ●●●
●●
●
●●
●●
●
●
●
●
●
●●
●
●
●
●
●●
●
●
●
●
●
●●
●
●●● ●●●
● ●● ●
●●
●●
●●
● ● ●●
●
●●
●●●
●●
●
●●● ●●
●
●
●
●● ●●
● ●
●●
●
●●
●
● ●
●
●●
●
●
●●●●●●
●
●●
● ●
●●
●
●●●
●●
●●●
●
●●
●
●
●●
●●●
●●
●●
●
●
●●
●
●●●
● ●
●●
●●
●●●
●●
●●● ●
●
●
●
●●
●●
●
●
●
●
●●
●●
●●
●
●
●
● ●
●●
● ●●
●
●●●
●
● ●● ●●●
●●
●●●
● ●● ●●●
● ●● ●●
●
●●
● ●
● ●●●
●
●●●●●
●
●●●
●● ●
●●
●
●
●●●
●●
●●●
●●
●●
●●●●●
●●● ●●●
●●●●
● ●
●
●●
●
●
●
●
●
●●● ●●●●
●●
●●
●
●●●
●●●●●●●
●
●●
● ●●●
●●
●●
●
●●● ●
●
●
●
● ●
●●
● ●●●●● ●
●
●●
●
●
●●
●
●
●●●
●
●● ●●●
●●
●● ●●●
●●
●●
●
●
●
●●●●
●
●
●●
●●
●●
●●
●
●● ●
●●
●●●
●
●●●
●
●●
●●
● ●
●●● ●
●● ●
●
●●
●
●● ●●
● ●
●●●
●●
●
●
● ●
●●
●●
●
●
●
●
●●●
●
●
● ●● ●●
●●●●
●
●●
●●●
●
●
●●●
●●● ●
●
●
●●●
●
●
●● ●● ●
●
●●
●●
●
●
●●
●●● ●●
●
●
● ●
●●
●●
● ●●●
●●●●
●●●●
●●●●
●
●●●
●●
●●
●●●
●
●●
●
●●
●
● ●
●●
● ●●
●
●●
●
●
●●
●
●●
●
●●
●
●
●
●
●
●
●
●
●●
● ●●
●●
●
●●
●● ●
●●
●●●
●●
●
●
●
●
●
●●●●● ●
●
● ●●
● ●●●●
● ● ●●
●
●
●●●●
●●● ●●
●
●●●●
● ●●
●
●
●
●
●● ●
●●
Crybb1
●●
●●
●
●●●
●●●●
●
●●
●●
●
●
●●●● ●
●●
● ●
●●●●●● ●●
●
●
● ●
●
●● ●●
●●●
●
●
●
●
●●
●
● ●
●●
●●●●
● ●
●●
●
●● ●
●● ●● ●●
●
●
●
●●
●
●
●
● ●
●●
●
● ●
●
● ●●● ●
●●●
●
● ●●●●
●● ●
●
●● ●
●
●
●●
●●
●
●
● ●●●
●●●
●●●●●
●●
●●●●
●
●●●
●
●●
●
●●
●●●●●
● ●●●
●
●
●●
●
●
●●
●
●●
●●●
● ●●
●
●●●
●●● ●●●
●●
● ●●
●●●
●●●
●
● ●●
●
●
●
●●●
●●●
●
●
●
●
●● ●●
●
●
●●
●
●●
●●
●●●
●
●●● ●● ●●
●●
●●●
●
●●
●●
●
●●
●
●
●
●●
●
●●
●
●●
●●
●●●
●
●●
●● ●
●●●
●
●●●● ●●●
●●
●
●●
●●
●
●
●
●
●
●●
●
●
●
●
●●
●
●
●
●
●
●●
●
●●● ●●●
● ●● ●
●●
●●
●●
● ● ●●
●
●●
●●●
●●
●
●●● ●●
●
●
●
●● ●●
● ●
●●
●
●●
●
● ●
●
●●
●
●
●●●●●●
●
●●
● ●
●●
●
●●●
●●
●●●
●
●●
●
●
●●
●●●
●●
●●
●
●
●●
●
●●●
● ●
●●
●●
●●●
●●
●●● ●
●
●
●
●●
●●
●
●
●
●
●●
●●
●●
●
●
●
● ●
●●
● ●●
●
●●●
●
● ●● ●●●
●●
●●●
● ●● ●●●
● ●● ●●
●
●●
● ●
● ●●●
●
●●●●●
●
●●●
●● ●
●●
●
●
●●●
●●
●●●
●●
●●
●●●●●
●●● ●●●
●●●●
● ●
●
●●
●
●
●
●
●
●●● ●●●●
●●
●●
●
●●●
●●●●●●●
●
●●
● ●●●
●●
●●
●
●●● ●
●
●
●
● ●
●●
● ●●●●● ●
●
●●
●
●
●●
●
●
●●●
●
●● ●●●
●●
●● ●●●
●●
●●
●
●
●
●●●●
●
●
●●
●●
●●
●●
●
●● ●
●●
●●●
●
●●●
●
●●
●●
● ●
●●● ●
●● ●
●
●●
●
●● ●●
● ●
●●●
●●
●
●
● ●
●●
●●
●
●
●
●
●●●
●
●
● ●● ●●
●●●●
●
●●
●●●
●
●
●●●
●●● ●
●
●
●●●
●
●
●● ●● ●
●
●●
●●
●
●
●●
●●● ●●
●
●
● ●
●●
●●
● ●●●
●●●●
●●●●
●●●●
●
●●●
●●
●●
●●●
●
●●
●
●●
●
● ●
●●
● ●●
●
●●
●
●
●●
●
●●
●
●●
●
●
●
●
●
●
●
●
●●
● ●●
●●
●
●●
●● ●
●●
●●●
●●
●
●
●
●
●
●●●●● ●
●
● ●●
● ●●●●
● ● ●●
●
●
●●●●
●●● ●●
●
●●●●
● ●●
●
●
●
●
●● ●
●●
Defa17
●●
●●
●
●●●
●●●●
●
●●
●●
●
●
●●●● ●
●●
● ●
●●●●●● ●●
●
●
● ●
●
●● ●●
●●●
●
●
●
●
●●
●
● ●
●●
●●●●
● ●
●●
●
●● ●
●● ●● ●●
●
●
●
●●
●
●
●
● ●
●●
●
● ●
●
● ●●● ●
●●●
●
● ●●●●
●● ●
●
●● ●
●
●
●●
●●
●
●
● ●●●
●●●
●●●●●
●●
●●●●
●
●●●
●
●●
●
●●
●●●●●
● ●●●
●
●
●●
●
●
●●
●
●●
●●●
● ●●
●
●●●
●●● ●●●
●●
● ●●
●●●
●●●
●
● ●●
●
●
●
●●●
●●●
●
●
●
●
●● ●●
●
●
●●
●
●●
●●
●●●
●
●●● ●● ●●
●●
●●●
●
●●
●●
●
●●
●
●
●
●●
●
●●
●
●●
●●
●●●
●
●●
●● ●
●●●
●
●●●● ●●●
●●
●
●●
●●
●
●
●
●
●
●●
●
●
●
●
●●
●
●
●
●
●
●●
●
●●● ●●●
● ●● ●
●●
●●
●●
● ● ●●
●
●●
●●●
●●
●
●●● ●●
●
●
●
●● ●●
● ●
●●
●
●●
●
● ●
●
●●
●
●
●●●●●●
●
●●
● ●
●●
●
●●●
●●
●●●
●
●●
●
●
●●
●●●
●●
●●
●
●
●●
●
●●●
● ●
●●
●●
●●●
●●
●●● ●
●
●
●
●●
●●
●
●
●
●
●●
●●
●●
●
●
●
● ●
●●
● ●●
●
●●●
●
● ●● ●●●
●●
●●●
● ●● ●●●
● ●● ●●
●
●●
● ●
● ●●●
●
●●●●●
●
●●●
●● ●
●●
●
●
●●●
●●
●●●
●●
●●
●●●●●
●●● ●●●
●●●●
● ●
●
●●
●
●
●
●
●
●●● ●●●●
●●
●●
●
●●●
●●●●●●●
●
●●
● ●●●
●●
●●
●
●●● ●
●
●
●
● ●
●●
● ●●●●● ●
●
●●
●
●
●●
●
●
●●●
●
●● ●●●
●●
●● ●●●
●●
●●
●
●
●
●●●●
●
●
●●
●●
●●
●●
●
●● ●
●●
●●●
●
●●●
●
●●
●●
● ●
●●● ●
●● ●
●
●●
●
●● ●●
● ●
●●●
●●
●
●
● ●
●●
●●
●
●
●
●
●●●
●
●
● ●● ●●
●●●●
●
●●
●●●
●
●
●●●
●●● ●
●
●
●●●
●
●
●● ●● ●
●
●●
●●
●
●
●●
●●● ●●
●
●
● ●
●●
●●
● ●●●
●●●●
●●●●
●●●●
●
●●●
●●
●●
●●●
●
●●
●
●●
●
● ●
●●
● ●●
●
●●
●
●
●●
●
●●
●
●●
●
●
●
●
●
●
●
●
●●
● ●●
●●
●
●●
●● ●
●●
●●●
●●
●
●
●
●
●
●●●●● ●
●
● ●●
● ●●●●
● ● ●●
●
●
●●●●
●●● ●●
●
●●●●
● ●●
●
●
●
●
●● ●
●●
Defa24
●●
●●
●
●●●
●●●●
●
●●
●●
●
●
●●●● ●
●●
● ●
●●●●●● ●●
●
●
● ●
●
●● ●●
●●●
●
●
●
●
●●
●
● ●
●●
●●●●
● ●
●●
●
●● ●
●● ●● ●●
●
●
●
●●
●
●
●
● ●
●●
●
● ●
●
● ●●● ●
●●●
●
● ●●●●
●● ●
●
●● ●
●
●
●●
●●
●
●
● ●●●
●●●
●●●●●
●●
●●●●
●
●●●
●
●●
●
●●
●●●●●
● ●●●
●
●
●●
●
●
●●
●
●●
●●●
● ●●
●
●●●
●●● ●●●
●●
● ●●
●●●
●●●
●
● ●●
●
●
●
●●●
●●●
●
●
●
●
●● ●●
●
●
●●
●
●●
●●
●●●
●
●●● ●● ●●
●●
●●●
●
●●
●●
●
●●
●
●
●
●●
●
●●
●
●●
●●
●●●
●
●●
●● ●
●●●
●
●●●● ●●●
●●
●
●●
●●
●
●
●
●
●
●●
●
●
●
●
●●
●
●
●
●
●
●●
●
●●● ●●●
● ●● ●
●●
●●
●●
● ● ●●
●
●●
●●●
●●
●
●●● ●●
●
●
●
●● ●●
● ●
●●
●
●●
●
● ●
●
●●
●
●
●●●●●●
●
●●
● ●
●●
●
●●●
●●
●●●
●
●●
●
●
●●
●●●
●●
●●
●
●
●●
●
●●●
● ●
●●
●●
●●●
●●
●●● ●
●
●
●
●●
●●
●
●
●
●
●●
●●
●●
●
●
●
● ●
●●
● ●●
●
●●●
●
● ●● ●●●
●●
●●●
● ●● ●●●
● ●● ●●
●
●●
● ●
● ●●●
●
●●●●●
●
●●●
●● ●
●●
●
●
●●●
●●
●●●
●●
●●
●●●●●
●●● ●●●
●●●●
● ●
●
●●
●
●
●
●
●
●●● ●●●●
●●
●●
●
●●●
●●●●●●●
●
●●
● ●●●
●●
●●
●
●●● ●
●
●
●
● ●
●●
● ●●●●● ●
●
●●
●
●
●●
●
●
●●●
●
●● ●●●
●●
●● ●●●
●●
●●
●
●
●
●●●●
●
●
●●
●●
●●
●●
●
●● ●
●●
●●●
●
●●●
●
●●
●●
● ●
●●● ●
●● ●
●
●●
●
●● ●●
● ●
●●●
●●
●
●
● ●
●●
●●
●
●
●
●
●●●
●
●
● ●● ●●
●●●●
●
●●
●●●
●
●
●●●
●●● ●
●
●
●●●
●
●
●● ●● ●
●
●●
●●
●
●
●●
●●● ●●
●
●
● ●
●●
●●
● ●●●
●●●●
●●●●
●●●●
●
●●●
●●
●●
●●●
●
●●
●
●●
●
● ●
●●
● ●●
●
●●
●
●
●●
●
●●
●
●●
●
●
●
●
●
●
●
●
●●
● ●●
●●
●
●●
●● ●
●●
●●●
●●
●
●
●
●
●
●●●●● ●
●
● ●●
● ●●●●
● ● ●●
●
●
●●●●
●●● ●●
●
●●●●
● ●●
●
●
●
●
●● ●
●●
Igf1
.CC-BY-NC-ND 4.0 International licensenot certified by peer review) is the author/funder. It is made available under aThe copyright holder for this preprint (which wasthis version posted May 17, 2019. . https://doi.org/10.1101/639054doi: bioRxiv preprint
47
Figure 2: Single cell sequencing identifies an ageing profile in 5xFAD XO4- microglia. a, 1466 Dimensionality reduction representation (viSNE, representative of n=3 mice per genotype) of 1467 myeloid cells isolated from WT (top) and 5xFAD (bottom) 6m male mice. Microglia 1468 (CD11b+CD45loCX3CR1+) are colored for expression of CD11b, CD45, CX3CR1, Methoxy-1469 XO4, CD115, CD33 and TREM2, whereas remaining myeloid cells are grayscale for clarity. 1470 b, PCA of 893 single cells x 1671 feature genes showing the distribution of cells from each 1471 FACS-sorted sample. c, PCA plot of single microglia colored by SC3 clusters and 1472 composition of automated clusters as a percentage of sequenced FACS-sorted cell 1473 populations. d. PCA plots for single microglia colored by expression of selected ageing 1474 microglia genes (i-ii), homeostatic (iii) and XO4+ signature genes (iv-v). e, f Diffusion maps 1475 pseudotime analysis of microglial populations ordered by their expression of e, ageing DEGs 1476 (6m WT v 24m WT, 42 DEGs) or f, phagocytic DEGs (6m 5xFAD XO4- v 6m 5xFAD 1477 XO4+, 474 DEGs) g, scatter plot showing the relationship between ageing and phagocytosing 1478 pseudotime in individual cells, and the density of cells at each point during the ageing 1479 (bottom) and phagocytosing (left) trajectories. h, Hierarchical clustering and heat map 1480 showing expression of the top 50 DEGs across the 4 SC3 clusters.1481
.CC-BY-NC-ND 4.0 International licensenot certified by peer review) is the author/funder. It is made available under aThe copyright holder for this preprint (which wasthis version posted May 17, 2019. . https://doi.org/10.1101/639054doi: bioRxiv preprint
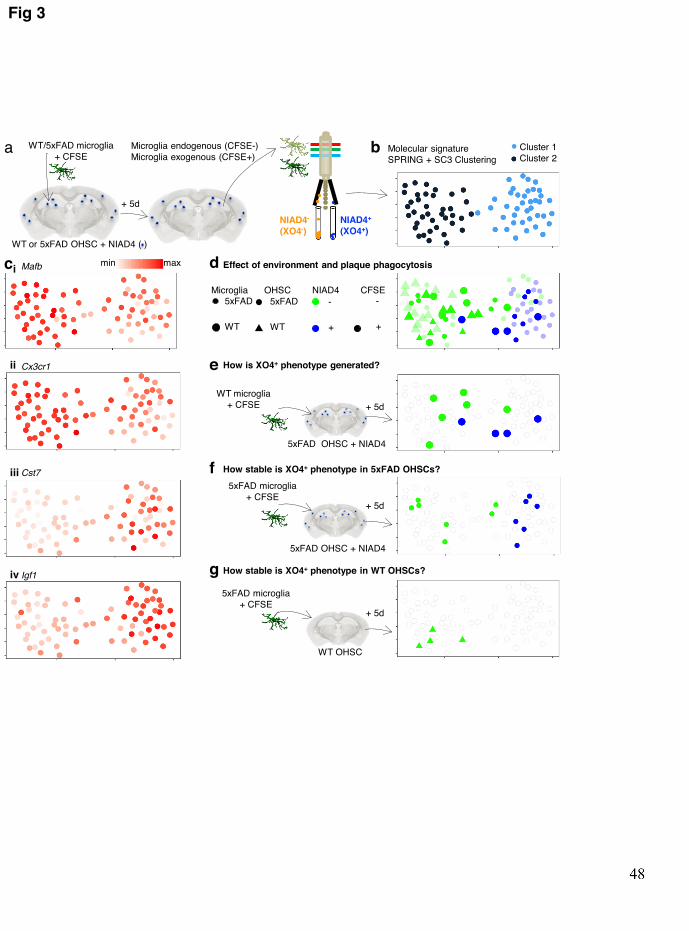
Molecular signature SPRING + SC3 Clustering
WT/5xFAD microglia + CFSE
+ 5d
WT or 5xFAD OHSC + NIAD4 ( )
Microglia endogenous (CFSE-) Microglia exogenous (CFSE+)
f How stable is XO4+ phenotype in 5xFAD OHSCs?
e How is XO4+ phenotype generated?
NIAD4-
(XO4-) NIAD4+
(XO4+)
g How stable is XO4+ phenotype in WT OHSCs?
d Effect of environment and plaque phagocytosis
a
ci
ii
iii iv
Cluster 1 Cluster 2
WT microglia + CFSE + 5d
5xFAD OHSC + NIAD4
5xFAD microglia + CFSE
+ 5d
5xFAD OHSC + NIAD4
5xFAD microglia + CFSE
+ 5d
WT OHSC
Cx3cr1
Igf1
Cst7
Mafb min max
Microglia5xFAD
WT
OHSC5xFAD
WT
NIAD4−
+
CFSE−
+
Microglia5xFAD
WT
OHSC5xFAD
WT
NIAD4−
+
CFSE−
+
Microglia5xFAD
WT
OHSC5xFAD
WT
NIAD4−
+
CFSE−
+
Microglia5xFAD
WT
OHSC5xFAD
WT
NIAD4−
+
CFSE−
+Microglia
5xFAD
WT
OHSC5xFAD
WT
NIAD4−
+
CFSE−
+
Microglia OHSC NIAD4 CFSE 5xFAD
WT
5xFAD
WT
-
+
-
+
b
Fig 3
.CC-BY-NC-ND 4.0 International licensenot certified by peer review) is the author/funder. It is made available under aThe copyright holder for this preprint (which wasthis version posted May 17, 2019. . https://doi.org/10.1101/639054doi: bioRxiv preprint
49
Figure 3: The XO4+ molecular signature is reversible and is acquired through 1484 phagocytosis of amyloid plaques. a, Schematic representing the experimental design to 1485 FACS isolate CFSE-labelled replenished and CFSE- endogenous microglia that differentially 1486 phagocytose endogenous NIAD4-labelled plaques after 5 days co-culture with WT or 5xFAD 1487 OHSCs. b-d, k-nearest-neighbor graph rendered using a force directed layout103, colored by 1488 SC3 cluster (b), and log2 transformed ΔCt values of selected DEGs (c) or cell grouping (d). 1489 e, WT microglia added into 5xFAD slices recapitulate a XO4+ signature upon plaque 1490 phagocytosis (p=0.0326). f, XO4+ phenotype is stable in exogenous CFSE+NIAD4+ 5xFAD 1491 microglia recovered from 5xFAD slices, but g, is lost in CFSE+ 5xFAD microglia recovered 1492 from WT slices (p=0.0155). 1493
1494
.CC-BY-NC-ND 4.0 International licensenot certified by peer review) is the author/funder. It is made available under aThe copyright holder for this preprint (which wasthis version posted May 17, 2019. . https://doi.org/10.1101/639054doi: bioRxiv preprint
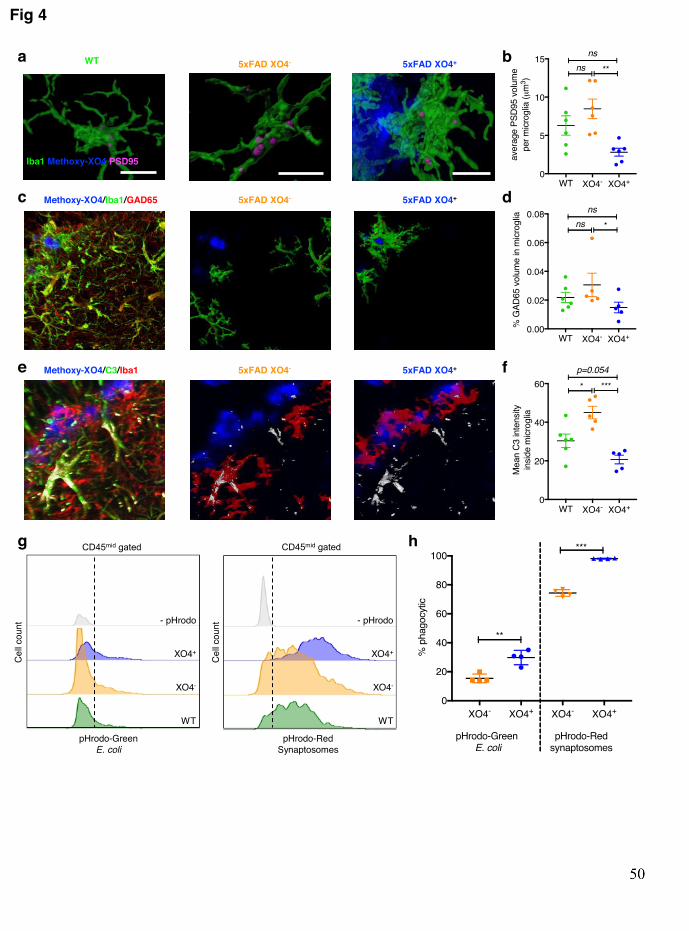
Fig 4
5xFAD XO4- 5xFAD XO4+ a
Iba1/Methoxy-XO4/PSD95
CD45mid gated
pHrodo-Green E. coli
- pHrodo
XO4+
XO4-
WT
Cell c
ount
CD45mid gated
Methoxy-XO4/Iba1/GAD65 5xFAD XO4- 5xFAD XO4+
Methoxy-XO4/C3/Iba1 5xFAD XO4- 5xFAD XO4+
- pHrodo
XO4+
XO4-
WT
pHrodo-Red Synaptosomes
Cell c
ount
b
c d
e f
g h
WT
.CC-BY-NC-ND 4.0 International licensenot certified by peer review) is the author/funder. It is made available under aThe copyright holder for this preprint (which wasthis version posted May 17, 2019. . https://doi.org/10.1101/639054doi: bioRxiv preprint
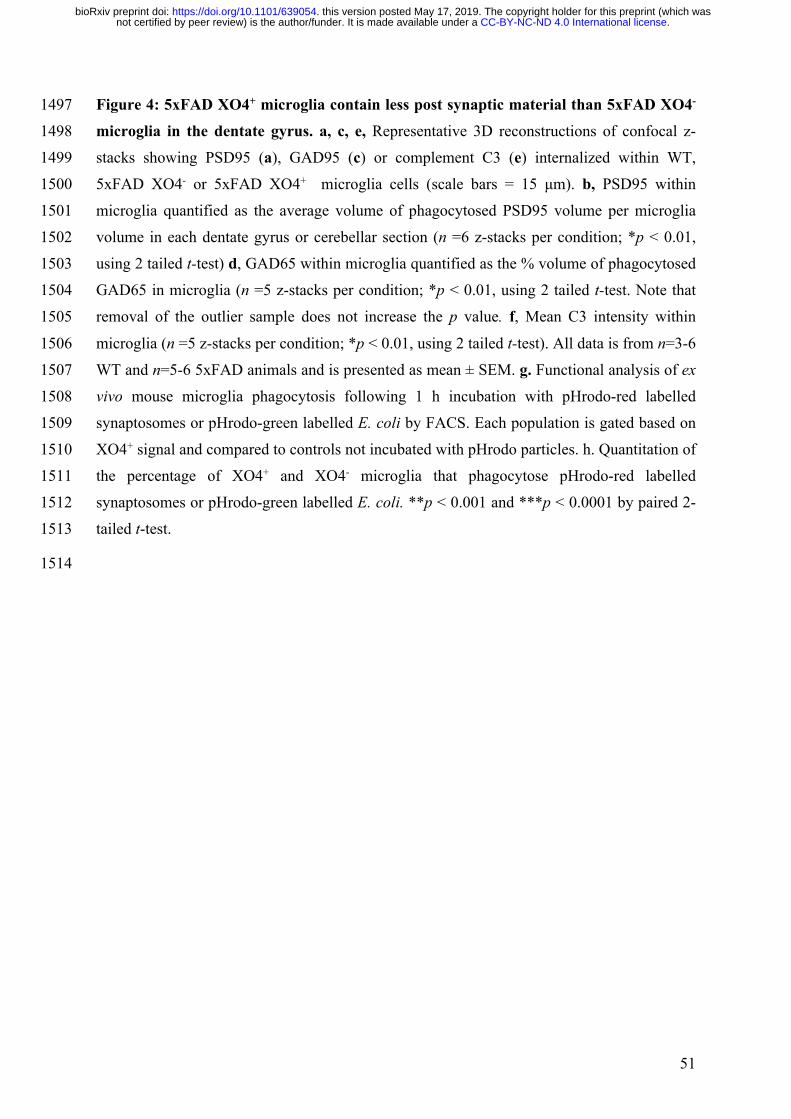
51
Figure 4: 5xFAD XO4+ microglia contain less post synaptic material than 5xFAD XO4- 1497 microglia in the dentate gyrus. a, c, e, Representative 3D reconstructions of confocal z-1498 stacks showing PSD95 (a), GAD95 (c) or complement C3 (e) internalized within WT, 1499 5xFAD XO4- or 5xFAD XO4+ microglia cells (scale bars = 15 μm). b, PSD95 within 1500 microglia quantified as the average volume of phagocytosed PSD95 volume per microglia 1501 volume in each dentate gyrus or cerebellar section (n =6 z-stacks per condition; *p < 0.01, 1502 using 2 tailed t-test) d, GAD65 within microglia quantified as the % volume of phagocytosed 1503 GAD65 in microglia (n =5 z-stacks per condition; *p < 0.01, using 2 tailed t-test. Note that 1504 removal of the outlier sample does not increase the p value. f, Mean C3 intensity within 1505 microglia (n =5 z-stacks per condition; *p < 0.01, using 2 tailed t-test). All data is from n=3-6 1506 WT and n=5-6 5xFAD animals and is presented as mean ± SEM. g. Functional analysis of ex 1507 vivo mouse microglia phagocytosis following 1 h incubation with pHrodo-red labelled 1508 synaptosomes or pHrodo-green labelled E. coli by FACS. Each population is gated based on 1509 XO4+ signal and compared to controls not incubated with pHrodo particles. h. Quantitation of 1510 the percentage of XO4+ and XO4- microglia that phagocytose pHrodo-red labelled 1511 synaptosomes or pHrodo-green labelled E. coli. **p < 0.001 and ***p < 0.0001 by paired 2-1512 tailed t-test. 1513
1514
.CC-BY-NC-ND 4.0 International licensenot certified by peer review) is the author/funder. It is made available under aThe copyright holder for this preprint (which wasthis version posted May 17, 2019. . https://doi.org/10.1101/639054doi: bioRxiv preprint
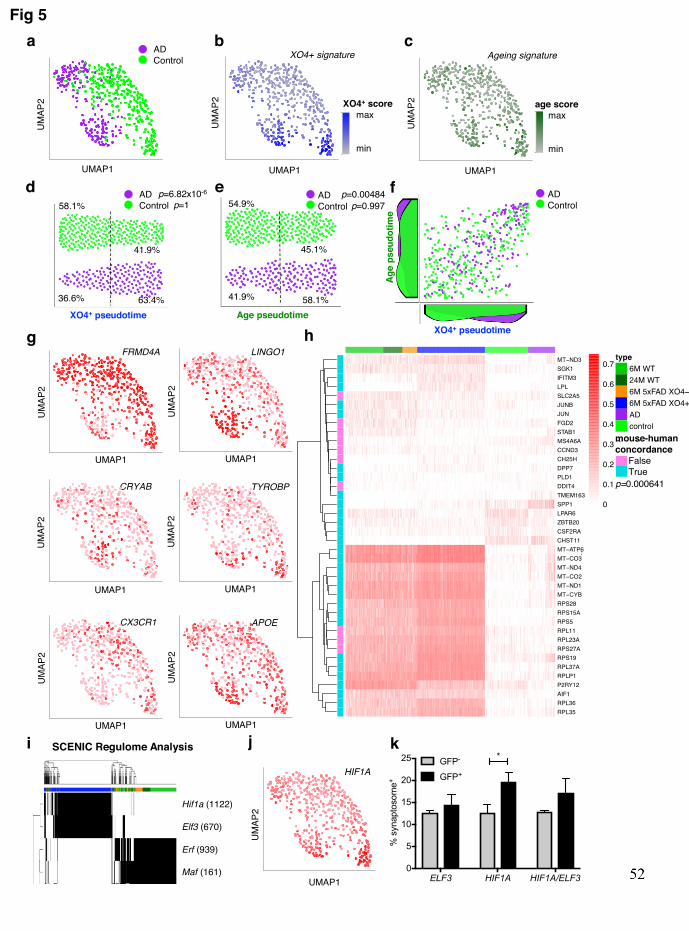
LINGO1 FRMD4A
TYROBP CRYAB
UMAP1
UMAP
2
UMAP1
UMAP
2
UMAP1
UMAP
2
UMAP1
UMAP
2
g h
APOE CX3CR1
UMAP1
UMAP
2
UMAP1
UMAP
2
Hif1a (1122)
Elf3 (670)
Erf (939)
Maf (161)
SCENIC Regulome Analysis i j
ELF3 HIF1A HIF1A/ELF30
5
10
15
20
25
% s
ynap
toso
me+
GFP-
GFP+
*
UMAP
2
b XO4+ signature
XO4+ score max min
UMAP
2
c Ageing signature
age score max min
Fig 5
AD Control
UMAP
2 a
mouse-human concordance False True p=0.000641
XO4+ pseudotime 63.4% 36.6%
41.9%
Age pseudotime 58.1% 41.9%
45.1%
UMAP1 UMAP1 UMAP1
AD Control
Age
pseu
dotim
e
XO4+ pseudotime
e d p=0.00484 54.9%
f p=6.82x10⁻⁶ AD Control p=0.997
AD Control 58.1% p=1
k HIF1A
UMAP1
UMAP
2
.CC-BY-NC-ND 4.0 International licensenot certified by peer review) is the author/funder. It is made available under aThe copyright holder for this preprint (which wasthis version posted May 17, 2019. . https://doi.org/10.1101/639054doi: bioRxiv preprint
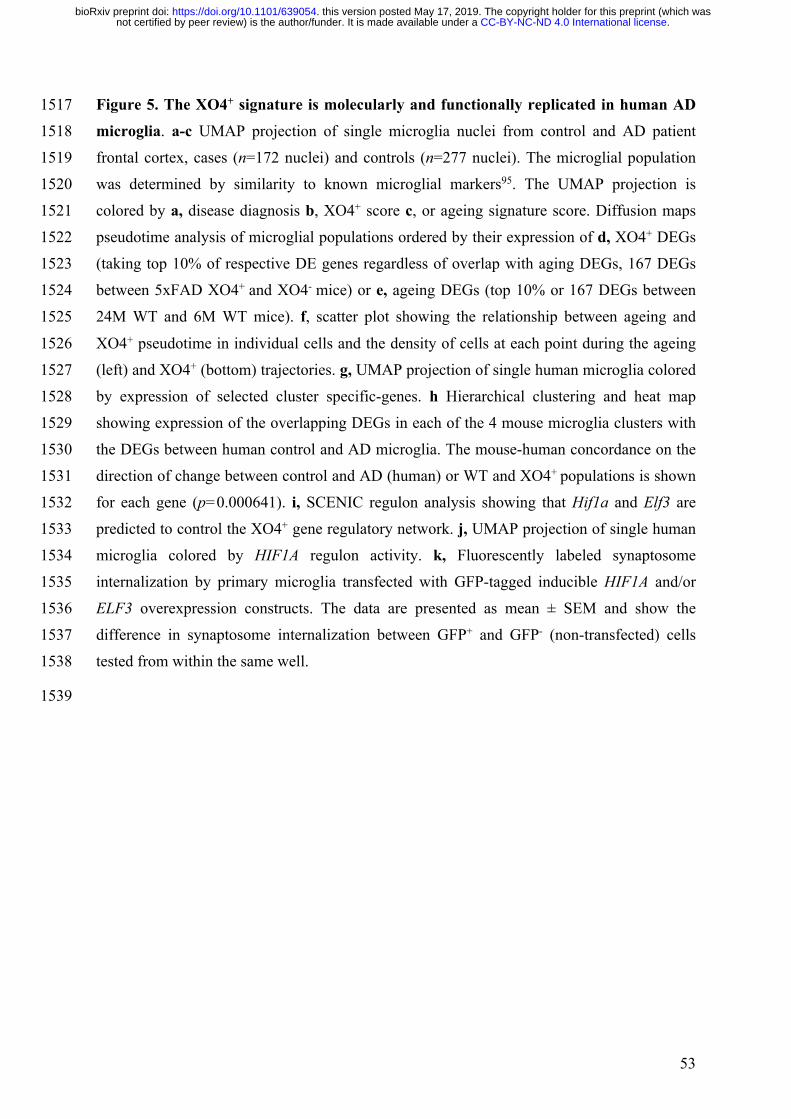
53
Figure 5. The XO4+ signature is molecularly and functionally replicated in human AD 1517 microglia. a-c UMAP projection of single microglia nuclei from control and AD patient 1518 frontal cortex, cases (n=172 nuclei) and controls (n=277 nuclei). The microglial population 1519 was determined by similarity to known microglial markers95. The UMAP projection is 1520 colored by a, disease diagnosis b, XO4+ score c, or ageing signature score. Diffusion maps 1521 pseudotime analysis of microglial populations ordered by their expression of d, XO4+ DEGs 1522 (taking top 10% of respective DE genes regardless of overlap with aging DEGs, 167 DEGs 1523 between 5xFAD XO4+ and XO4- mice) or e, ageing DEGs (top 10% or 167 DEGs between 1524 24M WT and 6M WT mice). f, scatter plot showing the relationship between ageing and 1525 XO4+ pseudotime in individual cells and the density of cells at each point during the ageing 1526 (left) and XO4+ (bottom) trajectories. g, UMAP projection of single human microglia colored 1527 by expression of selected cluster specific-genes. h Hierarchical clustering and heat map 1528 showing expression of the overlapping DEGs in each of the 4 mouse microglia clusters with 1529 the DEGs between human control and AD microglia. The mouse-human concordance on the 1530 direction of change between control and AD (human) or WT and XO4+ populations is shown 1531 for each gene (p=0.000641). i, SCENIC regulon analysis showing that Hif1a and Elf3 are 1532 predicted to control the XO4+ gene regulatory network. j, UMAP projection of single human 1533 microglia colored by HIF1A regulon activity. k, Fluorescently labeled synaptosome 1534 internalization by primary microglia transfected with GFP-tagged inducible HIF1A and/or 1535 ELF3 overexpression constructs. The data are presented as mean ± SEM and show the 1536 difference in synaptosome internalization between GFP+ and GFP- (non-transfected) cells 1537 tested from within the same well. 1538
1539
.CC-BY-NC-ND 4.0 International licensenot certified by peer review) is the author/funder. It is made available under aThe copyright holder for this preprint (which wasthis version posted May 17, 2019. . https://doi.org/10.1101/639054doi: bioRxiv preprint
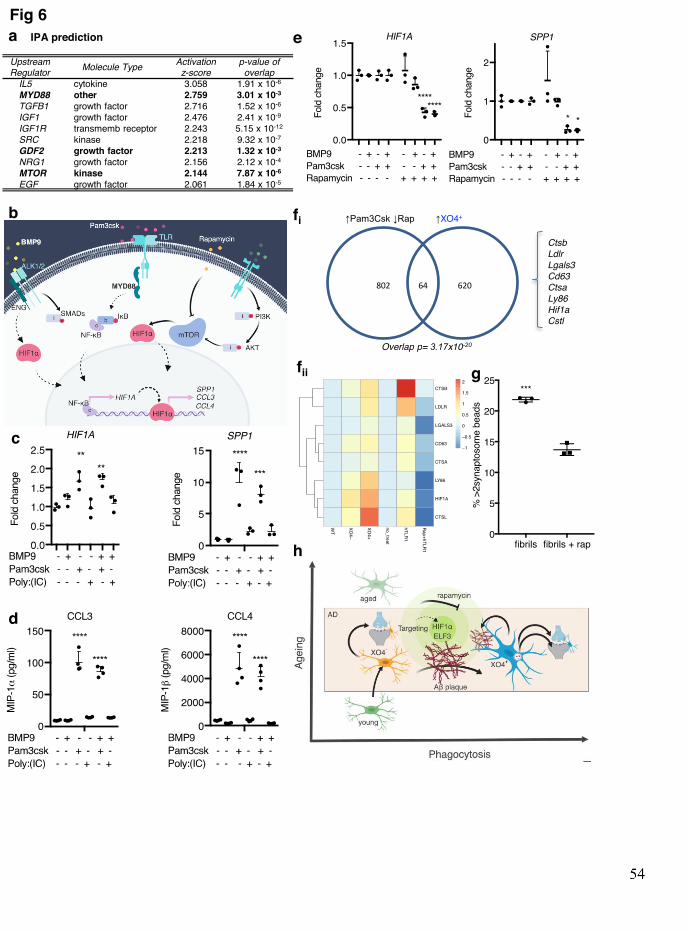
Fig 6 IPA prediction
fi
h
e Upstream Regulator Molecule Type Activation
z-score p-value of
overlap IL5 cytokine 3.058 1.91 x 10⁻⁶ MYD88 other 2.759 3.01 x 10⁻³ TGFB1 growth factor 2.716 1.52 x 10⁻⁶ IGF1 growth factor 2.476 2.41 x 10⁻⁹ IGF1R transmemb receptor 2.243 5.15 x 10⁻¹² SRC kinase 2.218 9.32 x 10⁻⁷ GDF2 growth factor 2.213 1.32 x 10⁻³ NRG1 growth factor 2.156 2.12 x 10⁻⁴ MTOR kinase 2.144 7.87 x 10⁻⁶ EGF growth factor 2.061 1.84 x 10⁻⁵
802 64 620
↑Pam3Csk ↓Rap ↑XO4+
Overlap p= 3.17x10⁻²⁰
Ctsb Ldlr Lgals3 Cd63 Ctsa Ly86 Hif1a Cstl
c
d
coun
t
Synaptosome-beads
Aβ fibrils
Aβ fibrils + rap
45%
58%
g
b
a
Edit – method,– Fig 5def, h Fig 6f, S11 c, e
fii
.CC-BY-NC-ND 4.0 International licensenot certified by peer review) is the author/funder. It is made available under aThe copyright holder for this preprint (which wasthis version posted May 17, 2019. . https://doi.org/10.1101/639054doi: bioRxiv preprint
55
Figure 6. Microglial XO4+ signature can be manipulated through the Hif1a regulon. a, 1542 Top ten activators of the Hif1a regulon predicted by IPA. The activation z-score is a 1543 statistical measure of the match between the expected relationship direction of regulation and 1544 the observed gene expression; positive z-scores are indicative of predicted activation. p-value 1545 of overlap refers to the significance of the overlap between the Hif1a regulon gene set and the 1546 regulated target genes predicted by IPA. b, Cartoon diagram of hypothesis generated by IPA. 1547 c, Stimulation of iMGLs with MyD88-dependent TLR agonist Pam3csk (alone or with 1548 BMP9) induces XO4+ signature genes within the Hif1a regulon as identified by qPCR and d, 1549 cytometric bead array. MyD88-independent TLR stimulation (Poly:IC) does not shift iMGLs 1550 towards an XO4+ signature. Data are fold changes normalized to non-treated cells. e, 1551 MyD88-dependent XO4+ signature gene expression is modulated by rapamycin. Data are fold 1552 changes induced by rapamycin normalized to each respective treatment in the absence of 1553 rapamycin. p values throughout are calculated by one way ANOVA and Sidak post-test. f, 1554 Venn diagram showing the overlap between a XO4+-like state induced in iMGLs using 1555 Pam3csk and reversed by rapamycin (RNA-seq) as predicted by ingenuity pathway analysis 1556 (IPA) with the mouse XO4+ signature, as measured by RNA-seq. Representative gene 1557 expression heatmap of the overlap, showing expression levels in mice (WT, 5xFAD XO4-, 1558 5xFAD XO4+) and human iMGLs (non-treated, Pam3csk and Pam3csk+rapamycin). g, 1559 Fluorescently labeled synaptosome internalization by iMGLs treated with amyloid fibrils, 1560 alone, or in combination with rapamycin for 48 h, as measured by FACS. The data are 1561 presented as mean ± SEM, and analysed by unpaired t-test. h, proposed model of generation 1562 and regulation of microglia diversity in AD. 1563
1564
.CC-BY-NC-ND 4.0 International licensenot certified by peer review) is the author/funder. It is made available under aThe copyright holder for this preprint (which wasthis version posted May 17, 2019. . https://doi.org/10.1101/639054doi: bioRxiv preprint