Embed Size (px)
DESCRIPTION
In this primary research project for our Marketing Research class, we surveyed UWM students about their drinking habits, analyzed possible reasons and causes for binge drinking, and suggested tactics and strategies to help prevent dangerous binge drinking habits in the future.
Citation preview
The Problems and Consequences Associated with Binge Drinking on the UWM Campus
Vandelay Industries
5/9/13
Aaron Bernard, Noah Rooney, Britney Sheehan, Tyler Gossage, Kyle Davis, Mallory Hurley
Table of Contents
Executive Summary……………………………………………………..2
Background of Binge Drinking……..………………………..……….3-7
Problem Statement………………………………………..…………..…8
State of Purpose……………………………………...………………….9
References………………………………………………..…………….10
Research Objective…………...………………………...……………...11
Research Method………………………………………………...…….12
Analysis and Discussion…………………………...……….....……13-22
Conclusion for Research Conclusion………………………………….23
Recommendation for Solutions…………………………….………24-25
Appendix………………………………………………………….. 26-33
1
Executive Summary
Vandelay Industries has conducted a research to study the reason behind the recent
growth in binge drinking on college campus. The main objective of this study is to figure out the
reasons and causes of binge drinking, so that it can be prevented. To do this, Vandelay Industries
used students of the University of Wisconsin-Milwaukee as a sample to help understand the
entire student population at UWM. The students were requested to complete short "Lifestyle"
surveys. These surveys contained questions asking about personal drinking habits, drinking
habits of peers, and reasons for drinking. This would generate the data that Vandelay Industries
needs to provide analysis for the research questions.
Analysis of the survey data disclosed that a vast majority of UW-Milwaukee students
(91%) consume alcohol, with an average of 5.5 drinks per night. The primary reasons that
students drink is 'because their friends are drinking', followed closely by 'because drinking is the
best way to have a good time.' Respondents also reported to, on average, drink "occasionally"
and "often" because of peer pressure. Vandelay Industries recommends that college campuses
promote fun and diverse activities during typical drinking times and try to spread awareness of
the dangers of overconsumption of alcohol. Bringing in celebrities and motivational speakers
during these times has been a successful tactic for colleges in the past. Utilizing social media to
spread word of these events is also recommended, as well as handing out flyers and promotional
gifts. Doing all of this will create a student following and give them the opportunity to have
social experiences that are safe from the dangers of alcohol consumption.
2
Background of Binge Drinking
Binge drinking Binge drinking is the most common pattern of excessive alcohol use in the
United States. The National Institute on Alcohol Abuse and Alcoholism defines binge drinking
as a pattern of drinking that brings a person’s blood alcohol concentration (BAC) to 0.08 percent
or above. This typically happens when men consume 5 or more drinks, and when women
consume 4 or more drinks, in about 2 hours.
While the prevalence of binge drinking in adults across America has not increased, it
certainly hasn’t decreased. The trend for binge drinking in adults has remained the same for the
past 10 years and doesn’t show signs of declining any time soon. The most alarming side of
binge drinking in America is exactly how far reaching this trend extends. More than 38 million
US adults binge drink and out of those 38 million Americans, 80,000 of them will be dead by
this time next year. What is even more surprising is the age bracket that binge drinks the most. It
should be of no surprise to learn that the age group with most bingers is those between 18 – 34
years of age, but shockingly they do not binge drink the most often. That title goes to the age
bracket of 65+.
When breaking down the rate of binge drinking from state to state, we find out that
Wisconsin is at number one with around 25.6% of the population binge drinking on average with
Utah in last with about 10.9% of the population binge drinking. When analyzing the state to state
binge drinking averages by the CDC (Centers for Disease Control and Prevention) a trend
between the states starts to arise. It turns out that binge drinking is more common among states
3
that more affluent, educated, and prone to colder weather. While some states are more likely to
binge drink than others, at the end of the day this is still a major issue that America needs to
tackle. Without immediate action to address this problem the unfortunate consequences of binge
drinking will continue unabated.
Excessive drinking has been linked to many health problems that range from
unintentional injuries to malicious intentional harm. These consequences can not only harm the
body, but also affect relationships among peers. Some unintentional injuries that can occur due to
excessive amounts of alcohol include automobile accidents, falls, and burns. These unintentional
injuries can range from minor scratches to deadly accidents. Alcohol poisoning is another
unintentional consequence of binge drinking and is a major problem among young adults today.
Alcohol poisoning is a medical emergency that results from high alcohol levels in the
bloodstream passing through the nervous system and can create problems such as low blood
pressure, coma, or even death. Alcohol poisoning is prevalent among young adults ranging from
the ages of 18-24, which is the age group for most college graduates.
The more common consequences of excessive drinking occur within the consumer’s
body. Diseases such as high blood pressure, stroke, and other cardiovascular problems can be
linked to excessive amounts of alcohol consumption. Neurological damage along with liver
disease has also been a common consequence of binge drinking. The prevalence of binge
drinking among males is twice as much as it is among the female population, thus leading to
many cases of domestic violence, unintentional pregnancies, and most commonly: sexually
transmitted disease. Nearly 35% of all reports of violence is a result of alcohol abuse and is the
leading factor for child mistreatment and negligence cases.
4
There are many possible causes to binge drinking on college campuses which can vary
from student to student. One main attraction in binge drinking is the thought that it is socially
acceptable on campus. Weekends in college generally begin Thursday evening and run through
Saturday night. By going out on these nights, students say they feel as if they fit in with their
peers and explain that they feel more confident and social when meeting people while drinking.
Alcohol is a key part of many social gatherings outside of the classroom that allows for many
students to open up and meet new people during the night. Being the key part of such events also
creates peer pressure among students to drink. Students are put in a situation with people they
may not know and tend to use alcohol as a backbone for their night.
After a long week of exams and homework, students enjoy loosening up on the weekend.
Many students reward themselves with alcohol once they complete their stressful weeks.
Students use alcohol as their escape allowing the use of binge drinking as their reasoning to act,
do, and behave as they please. Another cause for binge drinking could be a student’s desire for
“new experiences” that is available once they move into a college setting. In a college town,
many students find that getting alcohol around campus may be more accessible. This is definitely
apparent to first-year students that have more accessibility than they had in high school. Students
may also find that liquor stores around college campuses tend to be more lenient and students
may find it as an easy source to obtaining alcohol. Also, since many students live on their own,
the lack of parental guidance and enforcement of “house rules” may encourage students to buy
alcohol that they may be deterred from if they were living with their guardians.
Binge drinking could possibly occur due to genetic inherence. History of alcohol abuse
could factor into why some students feel the need to binge drink. Also, a younger sibling could
have watched or heard stories of their older siblings’ college experience and wanted to follow in
5
their footsteps. There are many different agendas behind binge drinking, whether it is social
interactions or the accessibility they gain from the college life.
To fight the problem of binge drinking on college campuses, there has been many
prevention programs designed and implemented to bring awareness to the student population. In
October 2011, Shaquille O'Neal and The Century Council partnered to bring the students' voice
to life by producing student-created videos. These videos address how serious of an issue
campus binge drinking is. Shaq also has messages in the form of short public service
announcements (PSA's) with the campaign LessThanUThink (LTUT). LTUT is a student-based
anti-binge campaign created by the advertising and public relations students of the University of
Alabama. This campaign's primary focus is to reach out to students via humorous messages that
relay the negative social effects of overconsumption.
The Texas Christian University (TCU) has their own anti-binge campaign called
VITALS. It stands for Vomiting, Incoherent, Temperature, Absence of Color, Low Breathing,
and Seizures. As opposed to using humor or scare tactics to send a message, VITALS focuses on
illustrating that the characteristics in its name are essential to living. The primary goal is
educating TCU students about alcohol poisoning symptoms and what to do in a case involving
alcohol poisoning. They spread the awareness of the dangers of binge-drinking through mobile
phone apps, the website, advertisements, t-shirts, water bottles, and magnets. VITALS also hopes
to increase the recognition of its emblem.
The Other Hangover is a student-driven campaign created on the University of
Minnesota-Twin Cities campus. It targets at-risk drinkers and is designed to fight high-risk
campus drinking. The campaigns objectives are to increase awareness of the negative effects of
6
overconsumption, generate active discussion of the negative effects of overconsumption, and
change the attitudes relating to overconsumption. The Other Hangover is funded by The Century
Council and had a student-led team that designed the positioning, strategy, and execution
elements of the campaign. The main focus of the campaign was to show how one's reputation
can be ruined by drinking too much. The flyers and banners do a great job of sending that
message. Based on UM-Twin Cities surveys, 81% agree that the messages are more relatable
than other 'drink responsibly' ads, 81% agree that the situations portrayed in The Other Hangover
ads are more realistic and believable than other ads, 77% said that they like The Other Hangover
campaign more than others, and 54.8% of students made conversation about the campaign with
their friends. The Other Hangover has also expanded to Augsburg College, Hamline University,
and Macalester College.
7
Problem Statement
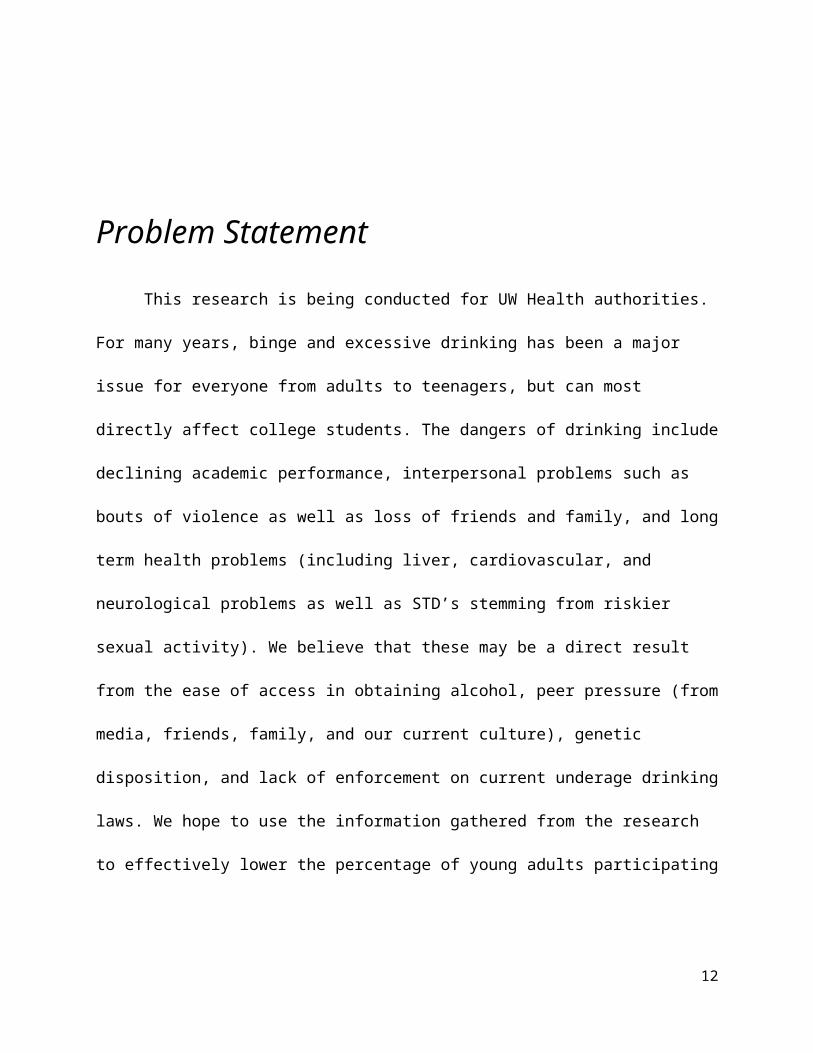
This research is being conducted for UW Health authorities. For many years, binge and
excessive drinking has been a major issue for everyone from adults to teenagers, but can most
directly affect college students. The dangers of drinking include declining academic
performance, interpersonal problems such as bouts of violence as well as loss of friends and
family, and long term health problems (including liver, cardiovascular, and neurological
problems as well as STD’s stemming from riskier sexual activity). We believe that these may be
a direct result from the ease of access in obtaining alcohol, peer pressure (from media, friends,
family, and our current culture), genetic disposition, and lack of enforcement on current
underage drinking laws. We hope to use the information gathered from the research to
effectively lower the percentage of young adults participating in binge and excessive drinking
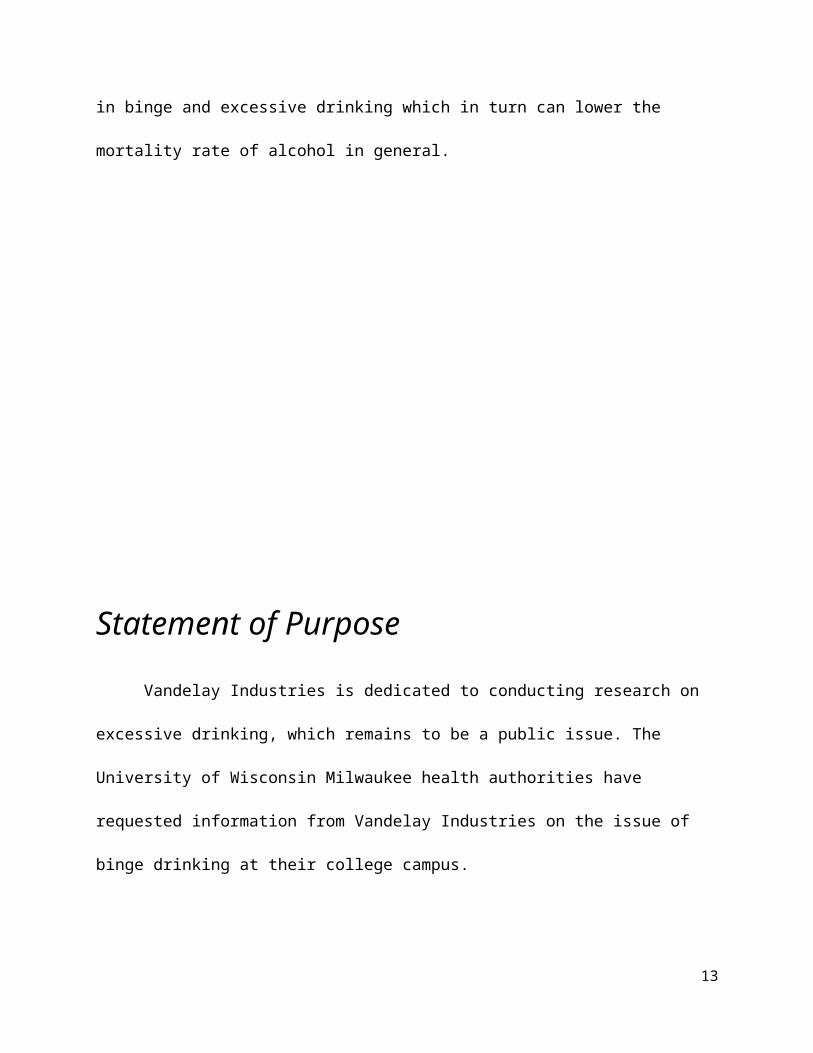
which in turn can lower the mortality rate of alcohol in general.
8
Statement of Purpose
Vandelay Industries is dedicated to conducting research on excessive drinking, which
remains to be a public issue. The University of Wisconsin Milwaukee health authorities have
requested information from Vandelay Industries on the issue of binge drinking at their college
campus.
The University of Wisconsin Milwaukee is at the forefront of contributing to this national
problem. Wisconsin continues to be ranked in the top five states for excessive drinking. The
purpose of the research being conducted is to help prevent excessive drinking among college
campuses, reduce the number of alcohol related injuries or deaths, and to help focus students on
their studies. UWM health authorities hope to reduce the percentage of students who drink
excessively along with helping promote good health across the campus using the information
that is being provided by Vandelay Industries.
9
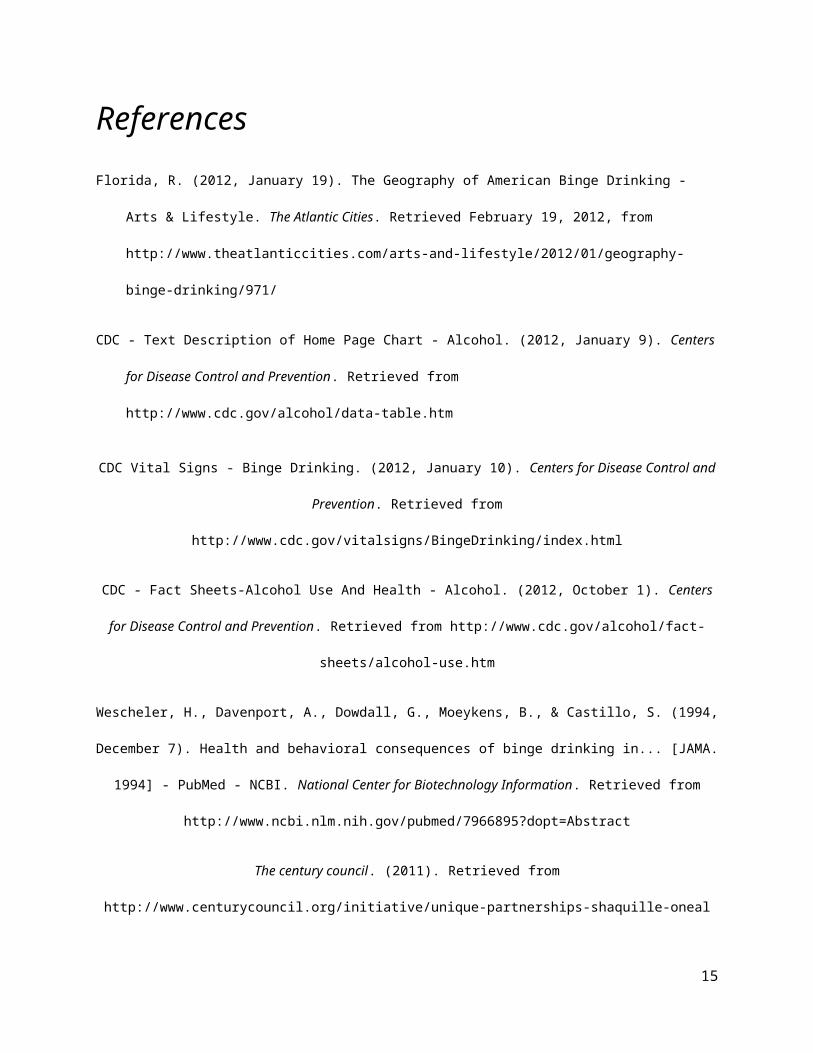
References
Florida, R. (2012, January 19). The Geography of American Binge Drinking - Arts & Lifestyle. The Atlantic Cities.
Retrieved February 19, 2012, from http://www.theatlanticcities.com/arts-and-lifestyle/2012/01/geography-
binge-drinking/971/
CDC - Text Description of Home Page Chart - Alcohol. (2012, January 9). Centers for Disease Control and
Prevention. Retrieved from http://www.cdc.gov/alcohol/data-table.htm
CDC Vital Signs - Binge Drinking. (2012, January 10). Centers for Disease Control and Prevention. Retrieved from
http://www.cdc.gov/vitalsigns/BingeDrinking/index.html
CDC - Fact Sheets-Alcohol Use And Health - Alcohol. (2012, October 1). Centers for Disease Control and
Prevention. Retrieved from http://www.cdc.gov/alcohol/fact-sheets/alcohol-use.htm
Wescheler, H., Davenport, A., Dowdall, G., Moeykens, B., & Castillo, S. (1994, December 7). Health and
behavioral consequences of binge drinking in... [JAMA. 1994] - PubMed - NCBI. National Center for
Biotechnology Information. Retrieved from http://www.ncbi.nlm.nih.gov/pubmed/7966895?dopt=Abstract
The century council. (2011). Retrieved from http://www.centurycouncil.org/initiative/unique-partnerships-shaquille-
oneal
LessThanUThink. (2011). Retrieved from http://ltut.org/
VITALS. (n.d.). Retrieved from http://www.tcuvitals.com/
The other hangover. (2011). Retrieved from http://www.theotherhangover.com/
10
Research Objectives
We hope to answer the following Research Questions (“RQs”):
RQ1. Research Question 1: Determine the drinking profile of your typical
respondent: By “drinking profile,” we mean:
a) How prevalent is drinking of alcoholic beverages?
b) How much is typically ingested?
c) What is the primary reason why students drink?
d) How much is typically spent?
RQ2. Research Question 2: With those students who drink alcohol,
a) How large a group are students with when they go out drinking, on the average?
b) To what extent do students drink because of pressure from friends and acquaintances?
c) To what extent do students drink because of easy availability of cheap alcohol?
RQ3. For Research Question 3, we will determine:
a) How widespread is drinking in the population?
b) To what extent does this sample of students reveal the possibility of alcohol abuse in
the student population?
c) Do males and females drink different amounts?
RQ4. For Research Question 4, we are trying to determine:
a) In the student’s perception, what are the most common consequences of
excessive drinking among his / her peers?
b) Is there evidence of underage drinking?
c) This is a qualitative question: Do you suspect social desirability bias with answers to
any of these questions? Which one(s)? Explain what you understand by this term, and
then answer the question.
11
Research Method
For our method of collecting responses, our group wanted to focus on reaching out to a
wide array of UW-Milwaukee students. Since our group is larger, we decided to couple up and
take on different sections of the campus. We chose places such as the Library and Union;
however, we tried to avoid the dorms due to the fact that the majority of students are only lower
classman, usually Freshmen and Sophomores. In the union we tried to reach out to students that
were seated so that they would be more willing to take the survey. We figured that if someone
was walking around the union they were probably trying to get a class, therefore wouldn’t want to stop
to quickly take the survey. We also chose students that we seated alone because we assumed they
would be sitting with someone around their age or they would not feel pressured match
responses because their friend was present. In order to create variety within our results, we tried
to base our sample selection on students we thought varied from one another. For example, if we
asked a student that had an older appearance, we would then try to find a student that seemed as
if they were younger. For our responses we wanted to get a good sample of all students, therefore
tried to find students of different ages and majors. The majority of the time these tactics we tried
to use worked. We discovered that most all of students we asked were willing to take the survey
because it was one-page (back and front) and only took a few minutes to complete. When
discussing our finding, we found that on average we each asked about 11 people in order to
receive our 8 surveys. To each obtain the 8 surveys each, it took roughly 25 minutes which
includes finding students, having them fill it out, and thanking them. Overall, we found that we
were able to find diversified group of students, who were willing to take the survey with very
few complications.
12
Analysis and Discussion
RQ1. Research Question 1: Determine the drinking profile of your typical respondent: By
“drinking profile,” we mean:
a) How prevalent is drinking of alcoholic beverages?
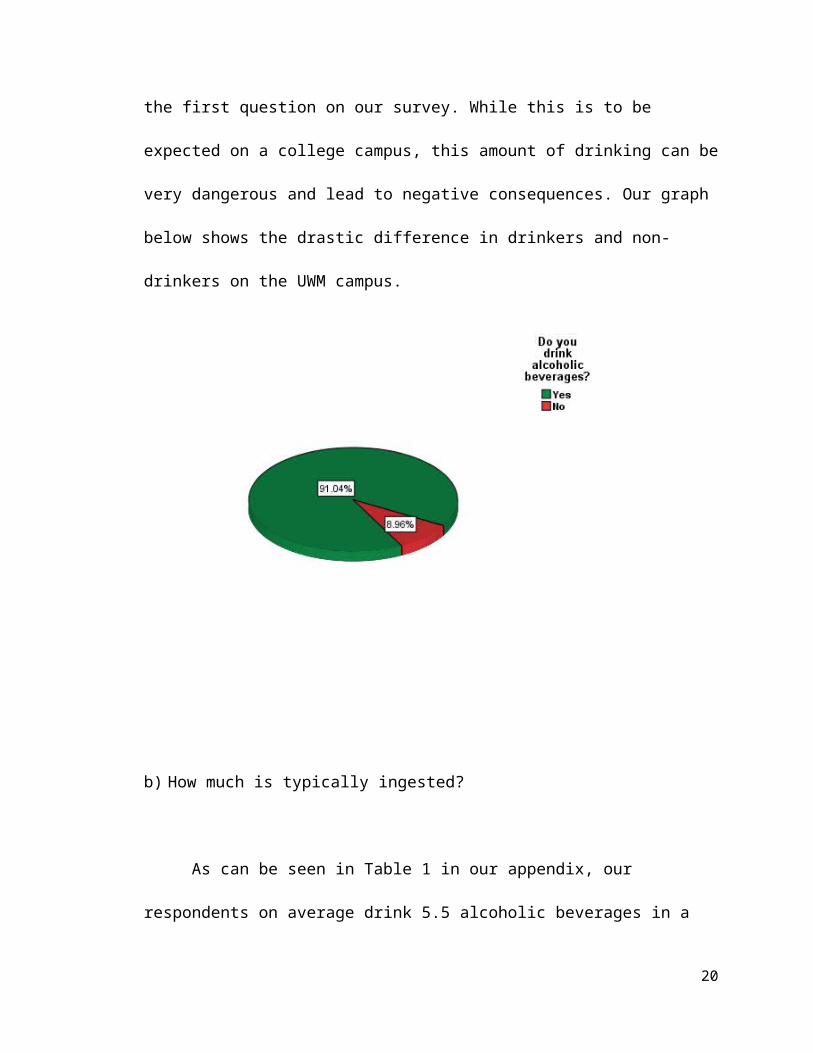
Drinking among the UWM student population is very popular. As can be seen in
Table 4, approximately 91% of students drink. Only 6 of our 67 respondents answered no
to the first question on our survey. While this is to be expected on a college campus, this
amount of drinking can be very dangerous and lead to negative consequences. Our graph
below shows the drastic difference in drinkers and non-drinkers on the UWM campus.
13
b) How much is typically ingested?
As can be seen in Table 1 in our appendix, our respondents on average drink 5.5
alcoholic beverages in a typical night out. The respondents also stated that they go out
drinking 2 nights in a typical week. 5.5 drinks is borderline binge drinking which is
becoming a very real problem on our college campuses. What’s even more troubling is
the fact that our respondents will be borderline binge drinking an average of 2 nights out
of every week. That is 104 days a year of binge drinking. It is safe to say that when
almost 30% of the year is spent binge drinking, it increases the likelihood of unwanted
consequences to become very real complications.
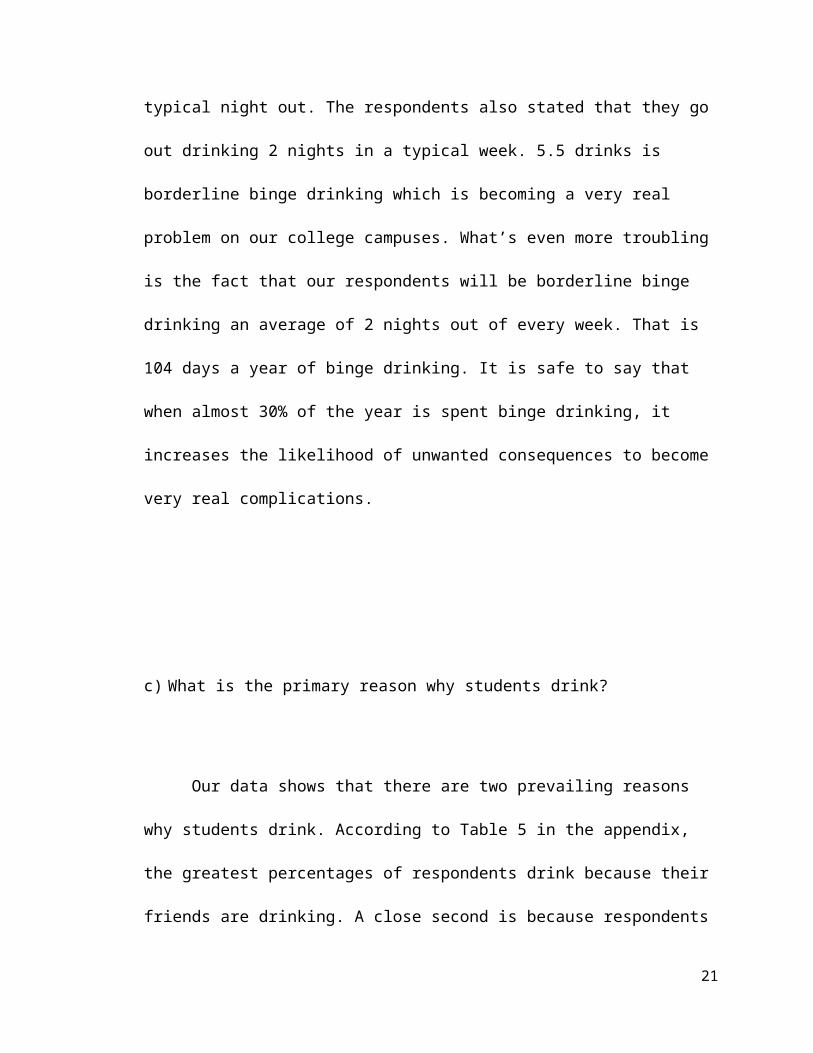
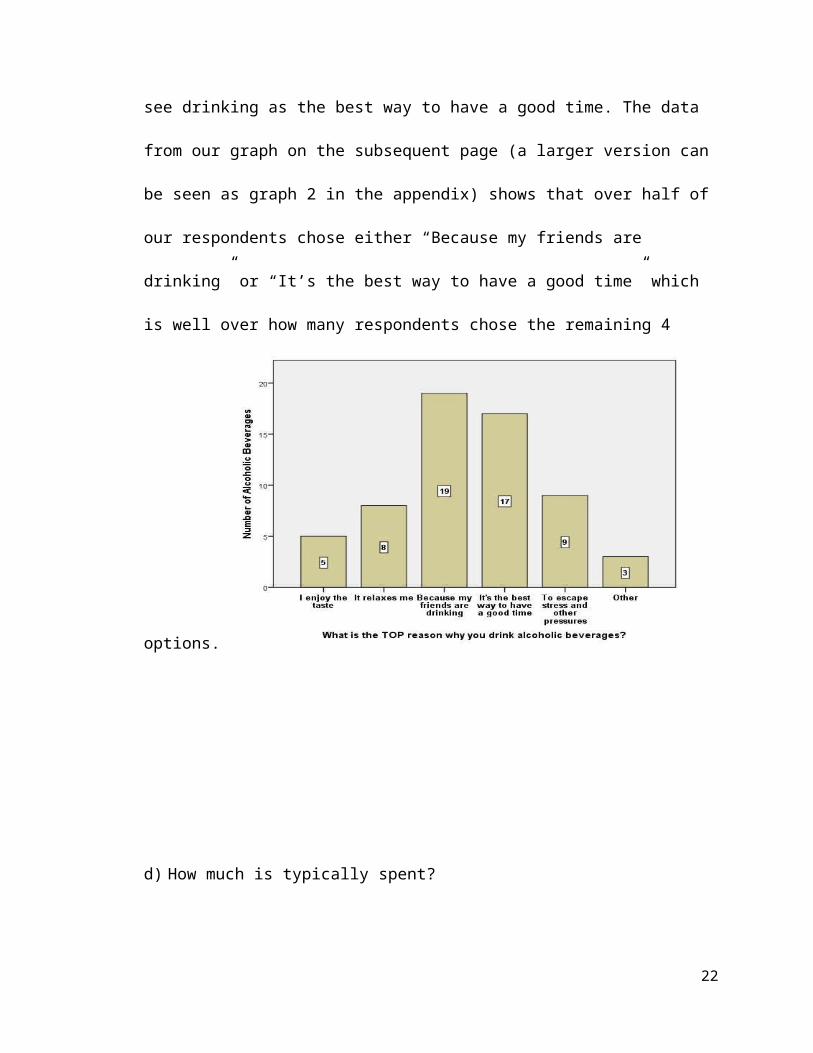
c) What is the primary reason why students drink?
Our data shows that there are two prevailing reasons why students drink.
According to Table 5 in the appendix, the greatest percentages of respondents drink
because their friends are drinking. A close second is because respondents see drinking as
the best way to have a good time. The data from our graph on the subsequent page (a
larger version can be seen as graph 2 in the appendix) shows that over half of our
respondents chose either “Because my friends are drinking” or “It’s the best way to have
14
a good time” which is well over how many respondents chose the remaining 4 options.
d) How much is typically spent?
As can be seen in Table 1 in the appendix, the average spent on a typical night for our
respondents is $19.00 a night. There was an extremely wide array of responses for this
question with responses from as low as $0 to as high as $60. Since the average amount of
nights our respondents go out in a week is 2 nights, our respondents spend an average $1,976
a year on alcohol. That is almost half of a full semester at UWM.
15
RQ2. Research Question 2: With those students who drink alcohol:
e) How large of a group are students with when they go out drinking, on the average?
Our data in Table 5 show that our respondents are out drinking they are on average
with a group of 5 people. This is clearly the safest route as our respondents will always be
close to a friend who can help out if our respondents were in trouble. However, with a larger
amount of people with while drinking means there is a larger amount of peer pressure to deal
with which can be an issue with our respondents as we discover in the next question.
f) To what extent do students drink because of pressure from friends and acquaintances?
According to Table 2, our respondents on average drink between “occasionally”
and “often” because of pressure from friends and acquaintances. The mean value was
2.43 with a standard deviation of 1.072. This is important to consider when figuring out
recommendations as it would not be enough to target the students, but the reinforcing the
ability to say no to peer pressure.
16
g) To what extent do students drink because of easy availability of cheap alcohol?
As can be seen on Table 2 in the appendix, students on average drink “often”
because of easy availability of cheap alcohol. The mean value was 2.7 with a standard
deviation of 1.27. We can conclude that the average UWM student drinks more often due
to easy availability of cheap alcohol rather than peer pressure.
RQ3. For Research Question 3, we will determine:
h) How widespread is drinking in the population?
CI= p+-1.96(Square root of p*q/n)
91+-1.96(Square root of 91*9/67)
91+1.96(3.50) = 97.86
91-1.96(3.50) = 84.14
CI = (84.14, 97.86)
My best estimate (according to our data in Table 4) is that on average 91% of
UWM students drink alcoholic beverages. In addition, I am 95% confident that the true
population falls between these limits – 84.14% and 97.86%. This is shocking when
compared to the average amount of drinkers in the entire United States of America which
is 67%. This is a huge difference in populations.
17
i) To what extent does this sample of students reveal the possibility of alcohol abuse in
the student population?
My best estimate (according to our data in Table 7) is that on an average night
out, UWM students drink about 5.5 alcoholic beverages. In addition I am 95% confident
that the true amount of alcoholic beverages consumed in a night falls between 4.7 and
6.4.
According to our definition of binge drinking (a pattern of drinking that brings a
person’s blood alcohol concentration (BAC) to 0.08 percent or above which typically
happens when men consume 5 or more drinks, and when women consume 4 or more
drinks, in about 2 hours), the average range of alcoholic beverages consumed in a night
for our sample can be considered alcohol abuse. However, variables to consider when
determining if it is truly alcohol abuse include time between drinks, BMI of the
individual and whether or not they ate before drinking.
18
j) Do males and females drink different amounts?
Our null hypothesis is that there is no difference between the amount of alcoholic
beverages a male consumes compared to the amount of alcoholic beverages a female
consumes.
After running an independent samples t-test on Table 8 in our appendix, we find
out that there is no major difference in the alcohol consumption between male and female
students. Although males consume an average of 6 alcoholic beverages a night and
females consume an average of 4.5, the differences are not statistically significant. We
determined this because our p value was .076 which is above .05 and thus not statistically
significant. Therefore we must accept our null hypothesis.
RQ4. For Research Question 4, we are trying to determine:
k) In the student’s perception, what are the most common consequences of excessive
drinking among his / her peers?
According to the table on the subsequent page (Table 10 in the appendix): passing
out, getting in trouble with the police, and drunk driving are the biggest consequences
UWM students believe are involved with excessive drinking. UWM students agree that
passing out is the biggest consequence while drinking. Passing out can be extremely
19
dangerous and a person’s BAC can still increase while the person is passed out. Another
consequence that UWM students agreed was almost as common as passing out was
getting in trouble with the police. This consequence can happen because of many
variables, but ultimately ends with the student regretting their actions.
Consequences to Drinking Mean Standard DeviationHave Passed Out 2.91 0.701Trouble with Police 2.42 0.934Drunk Driving 2.32 0.97Nausea, Sweating, Shakiness, Craving 2.32 0.793Perform Poorly in Class 2.17 0.997Vandalism 2.09 0.904Miss Class 2.06 1.014Have Been in an Accident 1.97 0.883
l) Is there evidence of underage drinking?
According to table 9 in the appendix, there is overwhelming evidence of underage
drinking on the UWM campus according to our sample. When a one-sample t-test
hypothesis test was run we discovered that there was almost no difference between our
hypothesis of our average age being 20 (below the legal drinking age) and our sample
mean of 20.19.
20
Our null hypothesis was that there were NO differences between the average age
of our sample and our hypothesis that the average age would be 20. The significance
value for our hypothesis test was 0.252 which is not close to being statistically significant
and we must accept our null hypothesis.
m) Do you suspect social desirability bias with answers to any of these questions?
Social desirability bias is the idea that a person may respond to interview or
survey questions in a way that he or she believes is socially acceptable rather than
completely accurate. This bias can be extremely detrimental to the overall validity of
information from a survey.
I believe that only a couple questions were subjected to social desirability bias
such as Q3 (How much money do you spend on alcohol on a typical night out?), Q5
(What is the TOP reason why you drink alcoholic beverages?), Q7 (To what extent do
you drink because of pressure from friends and acquaintances?), Q8 (To what extent do
you drink due to easy availability of cheap?), and Q18 (What is your cumulative GPA?).
I believe Q3 is subject to social desirability bias because it is based on financial matters
and most people may feel uncomfortable if they spend a lot of money on alcohol. Q5 may
be subject to social desirability bias because as our group suspected “Because my friends
are drinking” and “It’s the best way to have a good time” would be the most popular
answers because they are the most “stereotypical” reasons for drinking. While the
21
respondent may actually drink to escape stress or relax, these reasons for drinking are
more or less frowned upon as reasons for drinking.
I believe Q7 and Q8 have similar reasons for why social desirability bias may
have been a factor. I believe the main issue is that answering in the affirmative to both
answers make the respondent feel similarly to why they answered “Because my friends
are drinking” or “It’s the best way to have a good time” in Q5: these are not generally
acceptable reasons to drink.
Q18 could have been subjected to social desirability bias because GPA is a
sensitive subject to students especially in the competitive atmosphere of a university.
22
Conclusion of Research Conducted
Vandelay Industries set out to conduct research on the growing population of Binge
Drinking Students on college campuses. Our sample of UWM students was used as a sample for
the population of all students attending the University of Wisconsin - Milwaukee. Students
within this sample were asked to complete a short lifestyles survey in order for Vandelay
Industries to generate data on the subject.
The lifestyles survey proved to be a valuable piece of Vandelay Industries’ research. The
information generated from the survey showed that approximately 91% of students consume
alcoholic beverages, with typical students drinking 5.5 drinks per night. These statistics are quite
alarming due to the fact that the mean age or our respondents was under the legal drinking age in
the United States.
Even more alarming information retrieved from the survey was that most respondents
replied “Agree” when asked: “My friends and acquaintances sometimes pass out after a drinking
spree.” With the known effects of alcohol on the human body, this response was especially
disturbing.
When asked the top reason why students drink alcoholic beverages, majority of
respondents replied that they drank because their friends were drinking. It appears that peer
pressure tends to be a major player in the binge drinking problem on college campuses. Another
top reason was the easy availability of cheap alcohol. It seems the easier and cheaper the alcohol,
the more will be consumed.
23
Recommendations for Solutions
After studying the data we gained from our survey, Vandelay Industries noticed a
troubling trend in what students deemed to be the most frequent consequences of drinking and
the ones they experienced both first-hand and second-hand the most. Most students agreed they
had second-hand experience of friends and acquaintances passing out, getting in trouble with the
cops, or drinking and driving after binge drinking. While it is impossible to stop drinking on
college campuses, it is possible to curb alcohol consumption on campus and spread awareness of
the negative effects of alcohol.
One recommendation to help control this problem of binge drinking is for the colleges to
promote activities that can be held on campus during typical drinking hours and nights. Typically
students tend to go out on average 2 nights a week, these nights being Friday and Saturday.
Colleges across the United States could form committees that specialize in generating ideas for
activities on these nights. The activities could range from physical activities (such as dodge ball
nights, basketball games, or roller skating) to mental games (such as trivia nights or puzzle
games). A broad range of activities would be needed to attract the wide array of students that
attend a typical college.
One tactic that has also worked in the past for colleges has been bringing in a celebrity to
attract students. The committee could look into booking music performances, comedians,
magicians, or motivational speakers to come and speak to the students during typical drinking
times. The college can set up a budget for this committee in order to be able to afford these
sources of entertainment.
24
The committee can utilize social media to help spread the word about the events being
held on campus during these hours. By using Facebook and Twitter posts, they can reach out to
students through the growing social media world. Posting videos and different photos can help
bring in students by showing how entertaining the events can be. The college website may also
be used to promote these activities on the weekends.
The internet isn’t the only way that students can be reached. On campus, the committee
can hand out flyers or promotional gifts to students in order to gain a following. Leaving flyers
on seats in large lecture halls is another effective way for the committee to promote themselves.
In order for these events to be successful, the committee must first create a following.
While ending alcohol consumption on college campuses is near impossible at this point,
it is important to spread awareness of the truly negative effects of the irresponsible use of
alcohol. One way to spread awareness is to advertise statistics and emotional stories through
social media targeted at college students. Through the use of anonymous usernames on social
media websites, students could share their story of how irresponsible drinking affected their life.
These recommendations are just a couple of many tactics that could be used to help
prevent binge drinking on college campuses. We believe that colleges can create a group that
promotes anti-drinking activities on campus. By using different sources of media, they will be
able to create a following and hopefully help provide students with a fun, safe experience
without alcohol or at the very least responsible alcohol consumption.
25
Appendix
Tables:
Table 1 (Frequencies for Ratio-level questions)Statistics
N Mean Std. Deviation
Valid Missing
How many alcoholic beverages
do you consume on an average
night out?
60 7 5.5417 3.35383
How much money do you spend
on alcohol on a typical night out?53 14 18.74 12.274
How many nights in a typical
week do you go out?61 6 1.9016 .99087
On average, how many people
are you with when you go out?59 8 5.12 2.847
What is your cumulative GPA? 62 5 3.0960 .45436
What is your age? 63 4 20.11 1.297
Table 2 (Frequencies for Interval-level questions)Statistics
N Mean Std. Deviation
Valid Missing
To what extent do you drink
because of pressure from friends
and acquaintances?
61 6 2.43 1.072
To what extent do you drink due
to easy availability of cheap
alcohol?
61 6 2.70 1.269
My friends and acquaintances
often miss class due to drinking.65 2 2.06 1.014
My friends and acquaintances
have been in accidents due to
drinking.
65 2 1.97 .883
26
My friends and acquaintances do
poorly on exams or papers due to
drinking.
65 2 2.17 .977
My friends and acquaintances
sometimes get into trouble with
the police due to drinking.
65 2 2.42 .934
My friends and acquaintances
sometimes participate in
vandalism or damage property
due to drinking.
64 3 2.09 .904
My friends and acquaintances
drive while drunk.65 2 2.32 .970
My friends and acquaintances
sometimes pass out after a
drinking spree.
65 2 2.91 .701
My friends and acquaintances
sometimes experience nausea,
sweating, shakiness, or craving
as a direc...
65 2 2.32 .793
* For questions “To what extent do you drink because of pressure from friends and acquaintances” and “To what extent do you drink due to easy availability of cheap alcohol” the following scale was used:
Not at all = 1Occasionally = 2Often = 3Very often = 4Always = 5
*For the remaining questions, the following scale was used:Strongly Disagree = 1Disagree = 2Agree = 3Strongly Agree = 4
27
Table 3 (Frequencies for Nominal-level questions)Statistics
Do you drink
alcoholic
beverages?
What is the TOP
reason why you
drink alcoholic
beverages?
What is your
gender?
NValid 67 61 65
Missing 0 6 2
Mode 1 3 1
Table 4 (Frequency Table)Do you drink alcoholic beverages?
Frequency Percent Valid Percent Cumulative
Percent
Valid
Yes 61 91.0 91.0 91.0
No 6 9.0 9.0 100.0
Total 67 100.0 100.0
Table 5What is the TOP reason why you drink alcoholic beverages?
Frequency Percent Valid Percent Cumulative
Percent
Valid
I enjoy the taste 5 7.5 8.2 8.2
It relaxes me 8 11.9 13.1 21.3
Because my friends are drinking 19 28.4 31.1 52.5
It's the best way to have a good
time17 25.4 27.9 80.3
To escape stress and other
pressures9 13.4 14.8 95.1
Other 3 4.5 4.9 100.0
Total 61 91.0 100.0
Missing Missing 6 9.0
Total 67 100.0
28
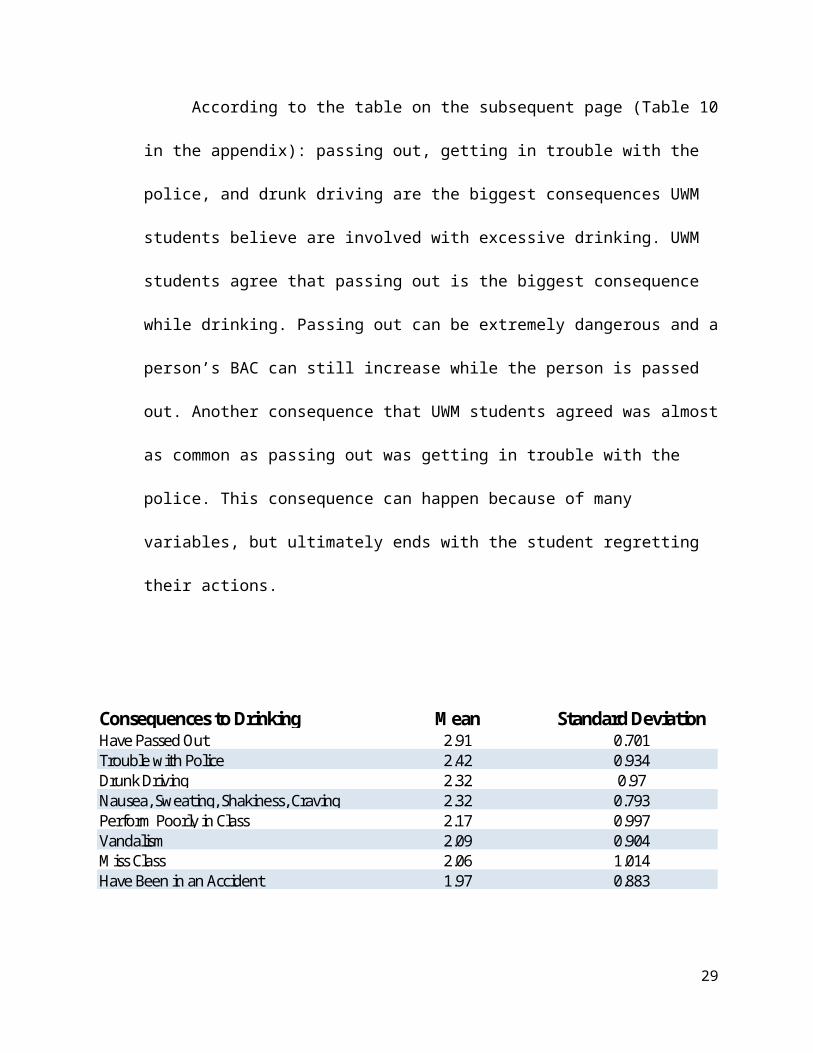
Table 6What is your gender?
Frequency Percent Valid Percent Cumulative
Percent
Valid
Male 38 56.7 58.5 58.5
Female 27 40.3 41.5 100.0
Total 65 97.0 100.0
Missing missing 2 3.0
Total 67 100.0
Table 7
29
Table 8Group Statistics
What is your gender? N Mean Std. Deviation Std. Error Mean
How many alcoholic
beverages do you consume
on an average night out?
Male 36 6.1389 3.89982 .64997
Female 22 4.7045 2.14176 .45662
Independent Samples Test
Levene's Test
for Equality of
Variances
t-test for Equality of Means
F Sig. t df Sig. (2-
tailed)
Mean
Difference
Std. Error
Difference
95% Confidence
Interval of the
Difference
Lower Upper
How many alcoholic
beverages do you
consume on an
average night out?
Equal variances assumed 8.256 .006 1.582 56 .119 1.43435 .90668 -.38195 3.25066
Equal variances not assumed 1.806 55.530 .076 1.43435 .79433 -.15719 3.02589
Table 9
30
Table 10
Consequences to Drinking Mean Standard DeviationHave Passed Out 2.91 0.701Trouble with Police 2.42 0.934Drunk Driving 2.32 0.97Nausea, Sweating, Shakiness, Craving 2.32 0.793Perform Poorly in Class 2.17 0.997Vandalism 2.09 0.904Miss Class 2.06 1.014Have Been in an Accident 1.97 0.883
31
Graphs:
Graph 1
32
Graph 2
33