Embed Size (px)
Citation preview

ACCESS IC LAB
Graduate Institute of Electronics Engineering, NTU
Multi-Modal Emotion Recognition
Framework Based on Human
Physiological Signals
Speaker: 電子所碩一莊育權
Advisor: Prof. Jian-Jiun Ding
Date: 2018/12/06
2018 TFW Oral Presentation
ACCESS IC LAB Graduate Institute of Electronics Engineering, NTU
P2
Outline
Introduction
Emotion Recognition
Database
Entropy Domain Features
Multiple Scaled Entropy
Modified Entropy Features
Simulation Results
EMD Domain Features
Empirical Mode Decomposition
Simulation Results
Processing Scheme
Signal Preprocessing
Feature Extraction
Classification Model
Simulation Results
Conclusion
Reference
ACCESS IC LAB Graduate Institute of Electronics Engineering, NTU
P3
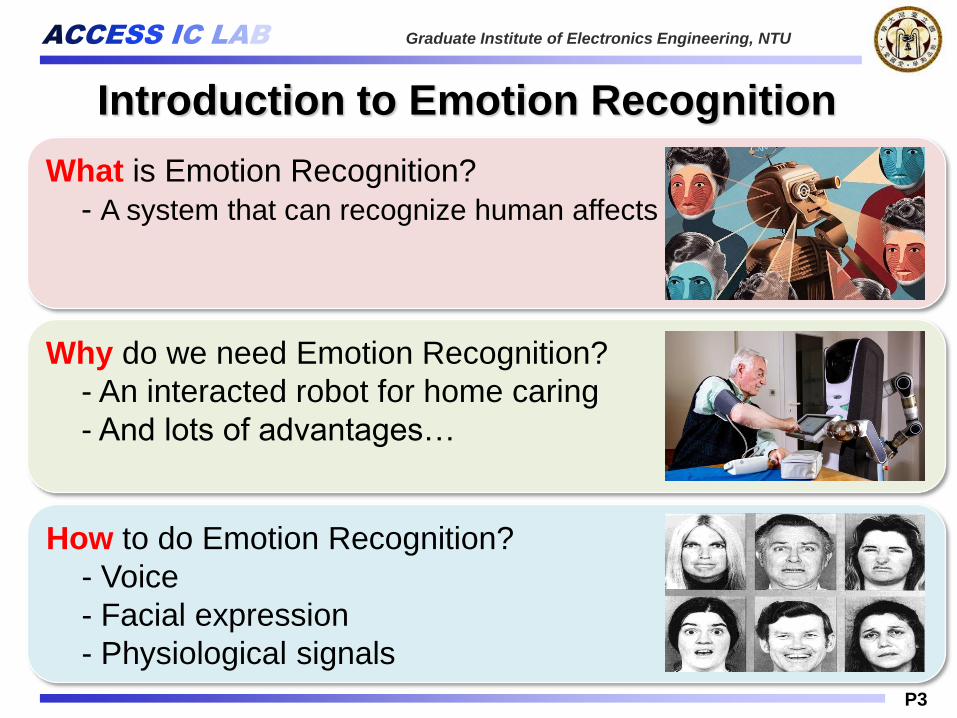
How to do Emotion Recognition?
- Voice
- Facial expression
- Physiological signals
Why do we need Emotion Recognition?
- An interacted robot for home caring
- And lots of advantages…
What is Emotion Recognition?
- A system that can recognize human affects
Introduction to Emotion Recognition
ACCESS IC LAB Graduate Institute of Electronics Engineering, NTU
P4
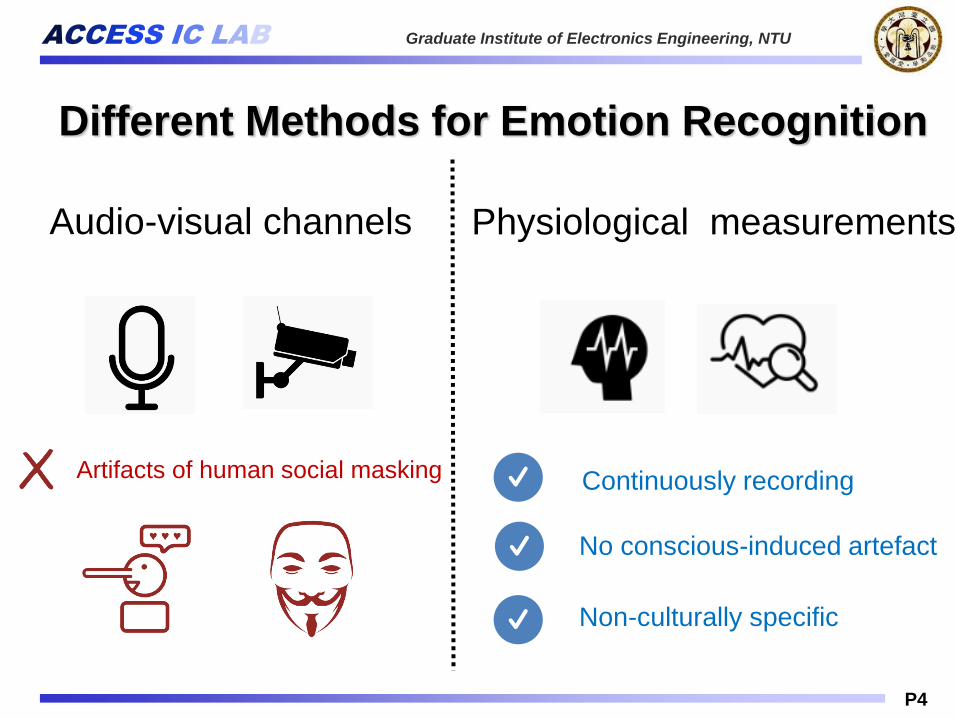
Different Methods for Emotion Recognition
Audio-visual channels Physiological measurements
Artifacts of human social masking
Non-culturally specific
No conscious-induced artefact
Continuously recording
ACCESS IC LAB Graduate Institute of Electronics Engineering, NTU
P5
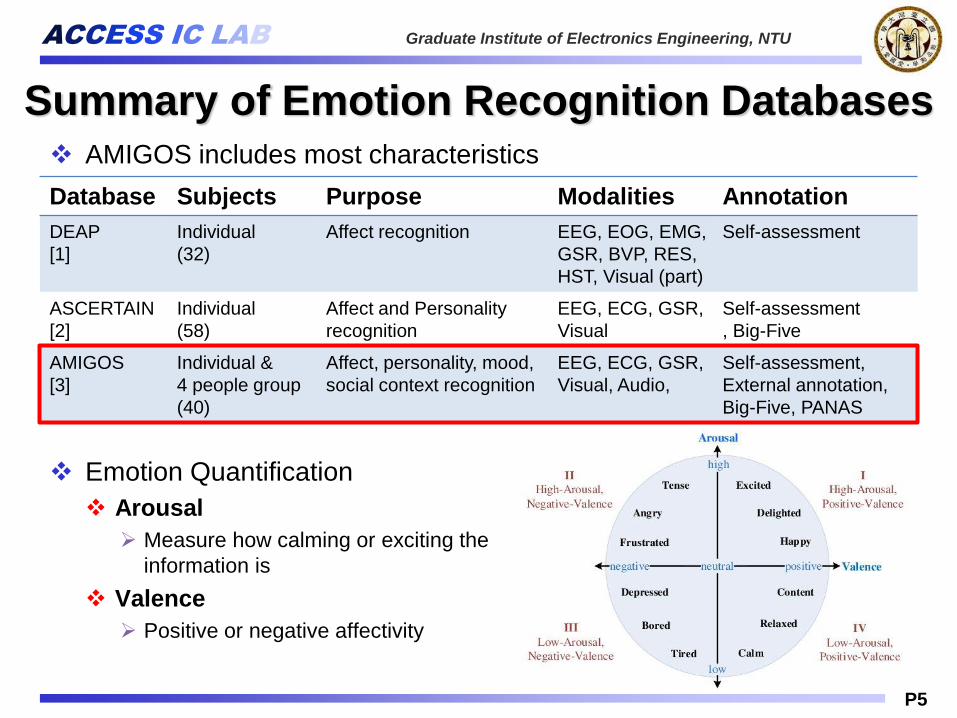
Summary of Emotion Recognition Databases
Database Subjects Purpose Modalities Annotation
DEAP
[1]
Individual
(32)
Affect recognition EEG, EOG, EMG,
GSR, BVP, RES,
HST, Visual (part)
Self-assessment
ASCERTAIN
[2]
Individual
(58)
Affect and Personality
recognition
EEG, ECG, GSR,
Visual
Self-assessment
, Big-Five
AMIGOS
[3]
Individual &
4 people group
(40)
Affect, personality, mood,
social context recognition
EEG, ECG, GSR,
Visual, Audio,
Self-assessment,
External annotation,
Big-Five, PANAS
AMIGOS includes most characteristics
Emotion Quantification
Arousal
Measure how calming or exciting the
information is
Valence
Positive or negative affectivity
ACCESS IC LAB Graduate Institute of Electronics Engineering, NTU
P6
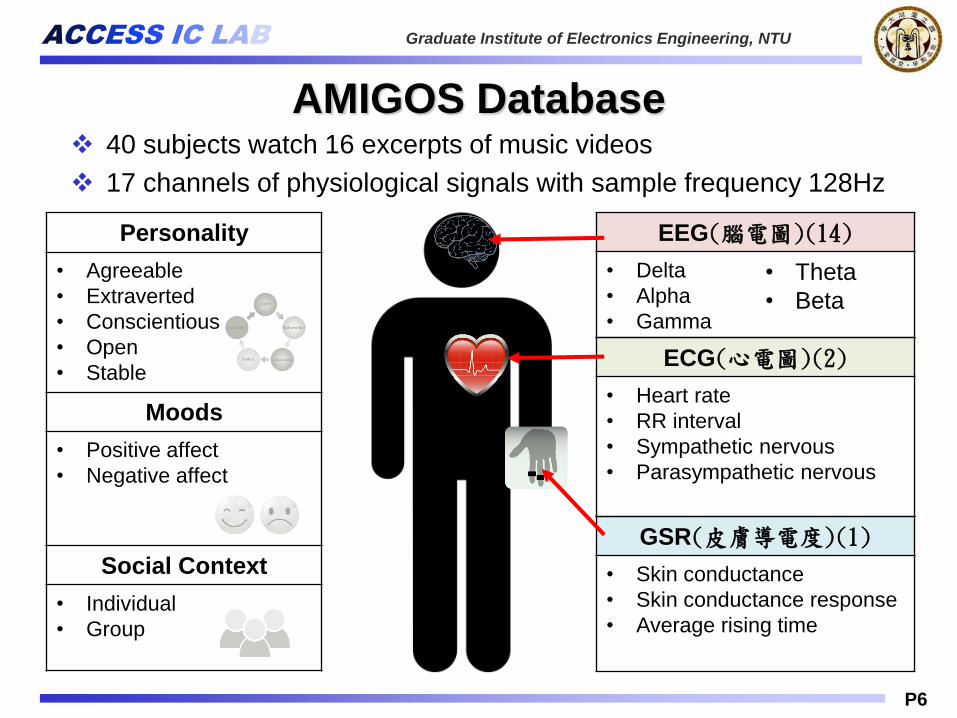
GSR(皮膚導電度)(1)
• Skin conductance
• Skin conductance response
• Average rising time
ECG(心電圖)(2)
• Heart rate
• RR interval
• Sympathetic nervous
• Parasympathetic nervous
EEG(腦電圖)(14)
• Delta
• Alpha
• Gamma
• Theta
• Beta
AMIGOS Database 40 subjects watch 16 excerpts of music videos
17 channels of physiological signals with sample frequency 128Hz
Personality
• Agreeable
• Extraverted
• Conscientious
• Open
• Stable
Moods
• Positive affect
• Negative affect
Social Context
• Individual
• Group
ACCESS IC LAB Graduate Institute of Electronics Engineering, NTU
P7
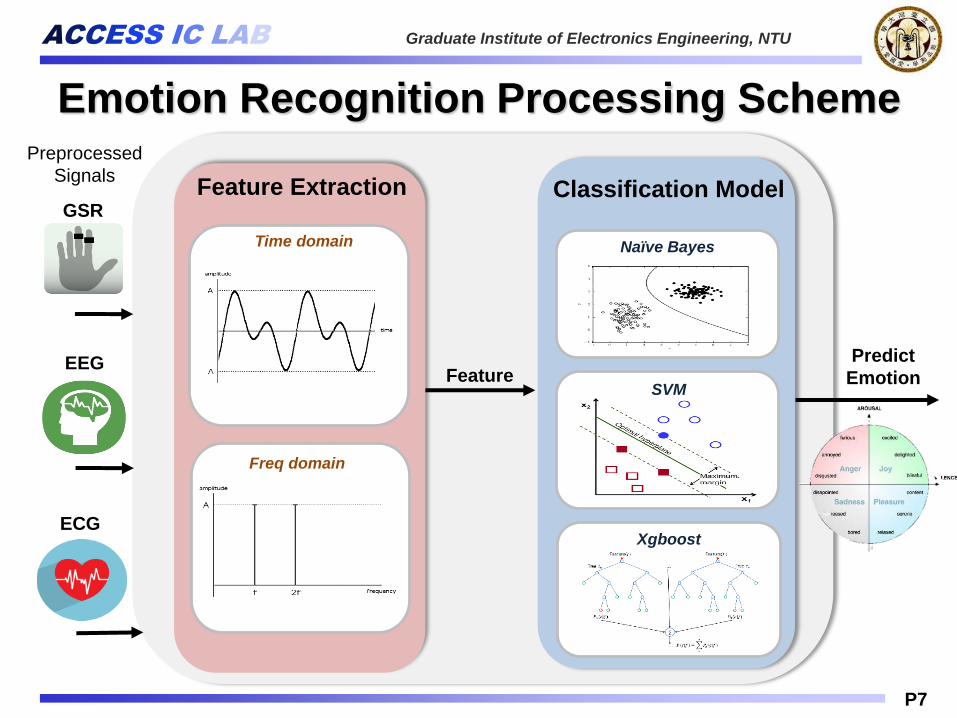
Emotion Recognition Processing Scheme
EEG
GSR
ECG
Feature
Feature Extraction
Time domain
Freq domain
Classification Model
Naïve Bayes
SVM
Xgboost
Predict
Emotion
Preprocessed
Signals
ACCESS IC LAB Graduate Institute of Electronics Engineering, NTU
P8
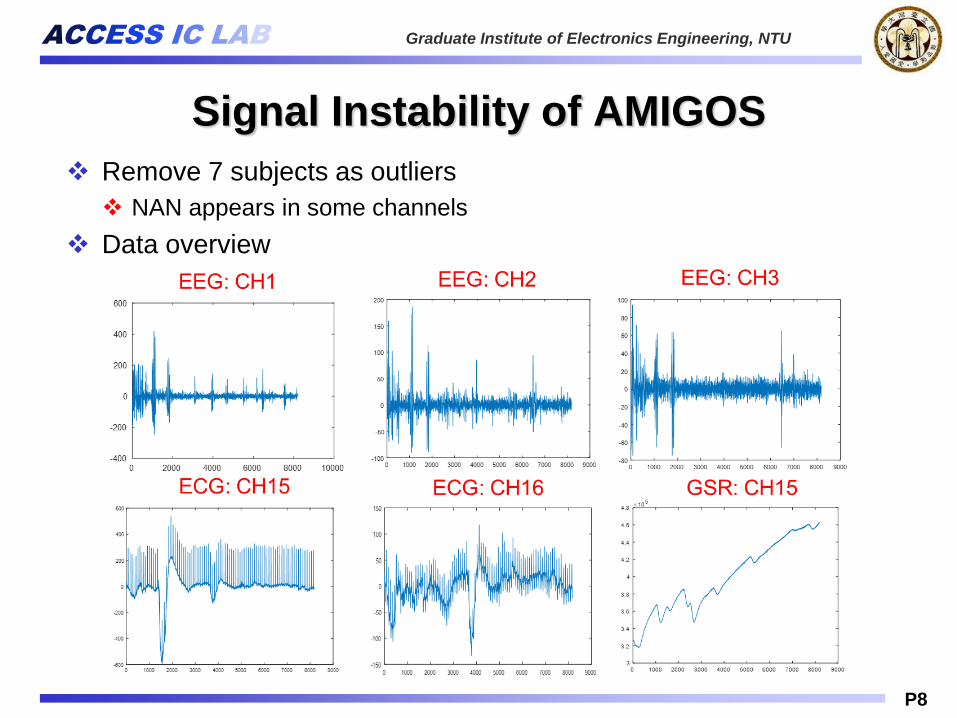
Signal Instability of AMIGOS
Remove 7 subjects as outliers
NAN appears in some channels
Data overview
ACCESS IC LAB Graduate Institute of Electronics Engineering, NTU
P9
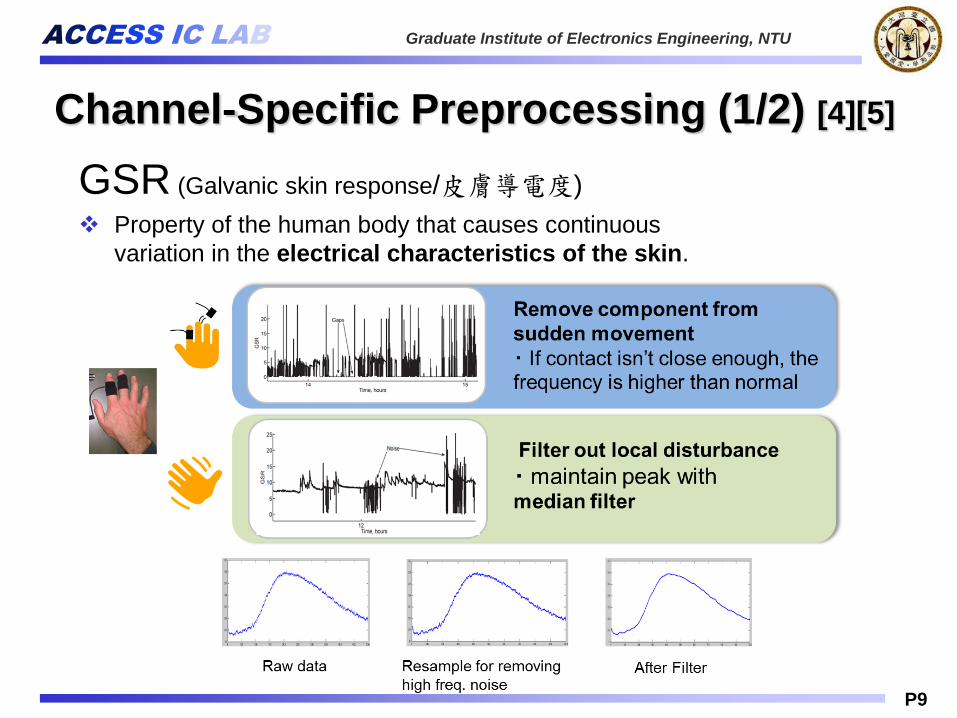
Channel-Specific Preprocessing (1/2) [4][5]
GSR (Galvanic skin response/皮膚導電度)
Property of the human body that causes continuous
variation in the electrical characteristics of the skin.
ACCESS IC LAB Graduate Institute of Electronics Engineering, NTU
P10
Channel-Specific Preprocessing (2/2)
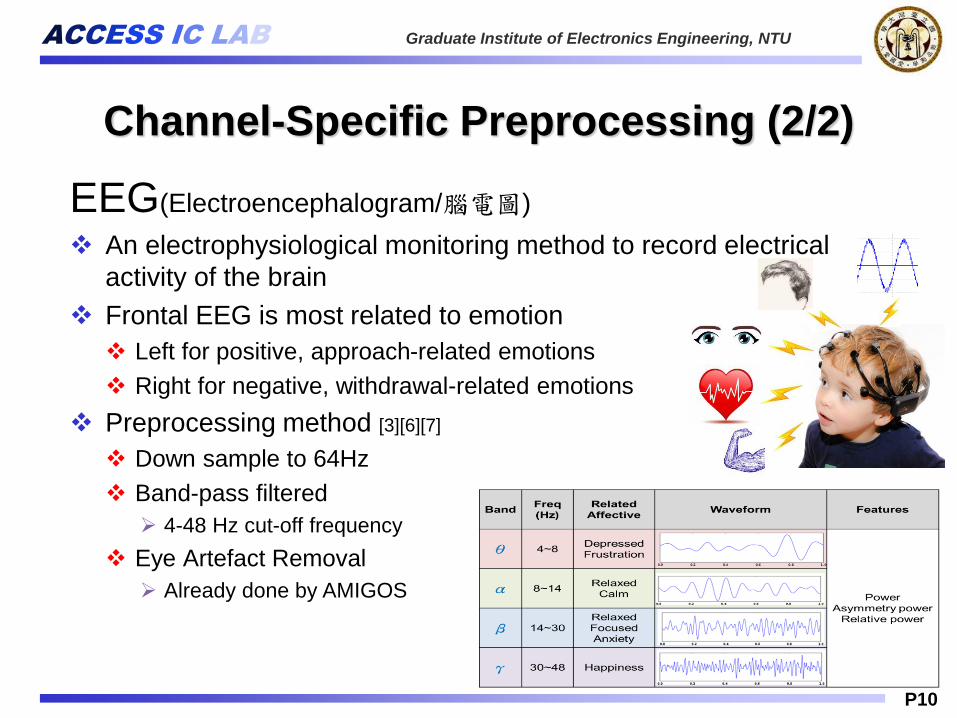
EEG(Electroencephalogram/腦電圖)
An electrophysiological monitoring method to record electrical
activity of the brain
Frontal EEG is most related to emotion
Left for positive, approach-related emotions
Right for negative, withdrawal-related emotions
Preprocessing method [3][6][7]
Down sample to 64Hz
Band-pass filtered
4-48 Hz cut-off frequency
Eye Artefact Removal
Already done by AMIGOS
ACCESS IC LAB Graduate Institute of Electronics Engineering, NTU
P11
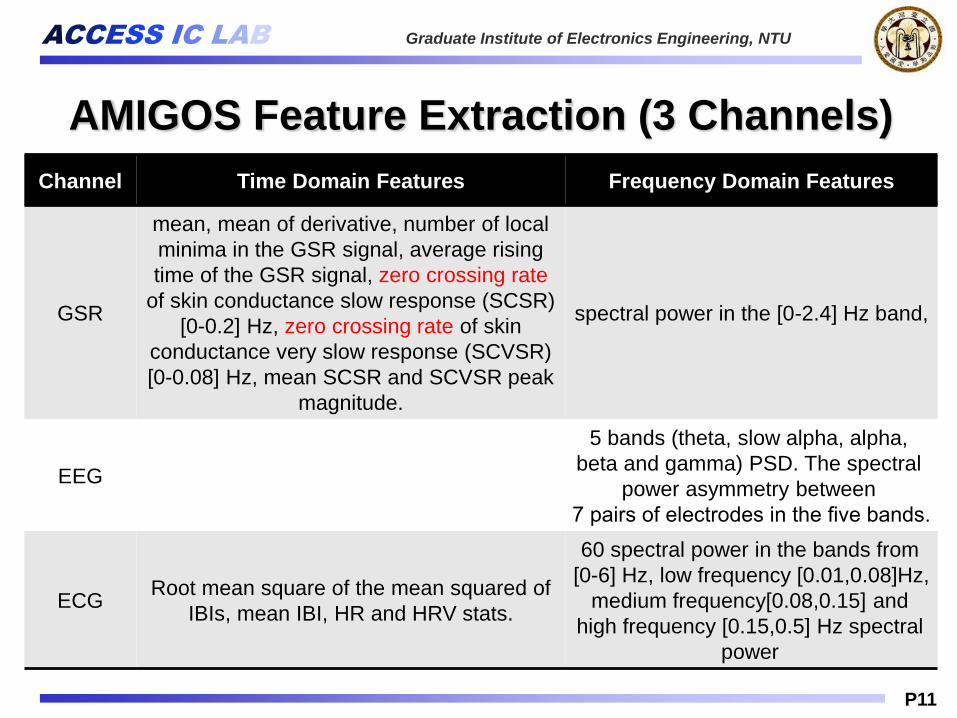
AMIGOS Feature Extraction (3 Channels)
Channel Time Domain Features Frequency Domain Features
GSR
mean, mean of derivative, number of local
minima in the GSR signal, average rising
time of the GSR signal, zero crossing rate
of skin conductance slow response (SCSR)
[0-0.2] Hz, zero crossing rate of skin
conductance very slow response (SCVSR)
[0-0.08] Hz, mean SCSR and SCVSR peak
magnitude.
spectral power in the [0-2.4] Hz band,
EEG
5 bands (theta, slow alpha, alpha,
beta and gamma) PSD. The spectral
power asymmetry between
7 pairs of electrodes in the five bands.
ECGRoot mean square of the mean squared of
IBIs, mean IBI, HR and HRV stats.
60 spectral power in the bands from
[0-6] Hz, low frequency [0.01,0.08]Hz,
medium frequency[0.08,0.15] and
high frequency [0.15,0.5] Hz spectral
power
ACCESS IC LAB Graduate Institute of Electronics Engineering, NTU
P12
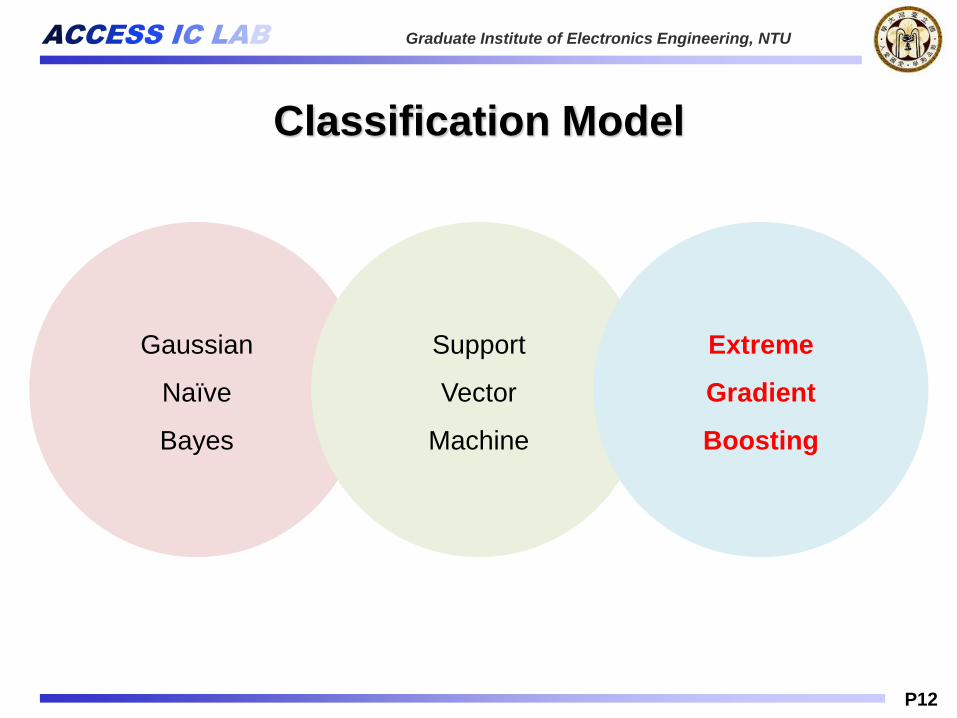
Classification Model
Gaussian
Naïve
Bayes
Support
Vector
Machine
Extreme
Gradient
Boosting
ACCESS IC LAB Graduate Institute of Electronics Engineering, NTU
P13
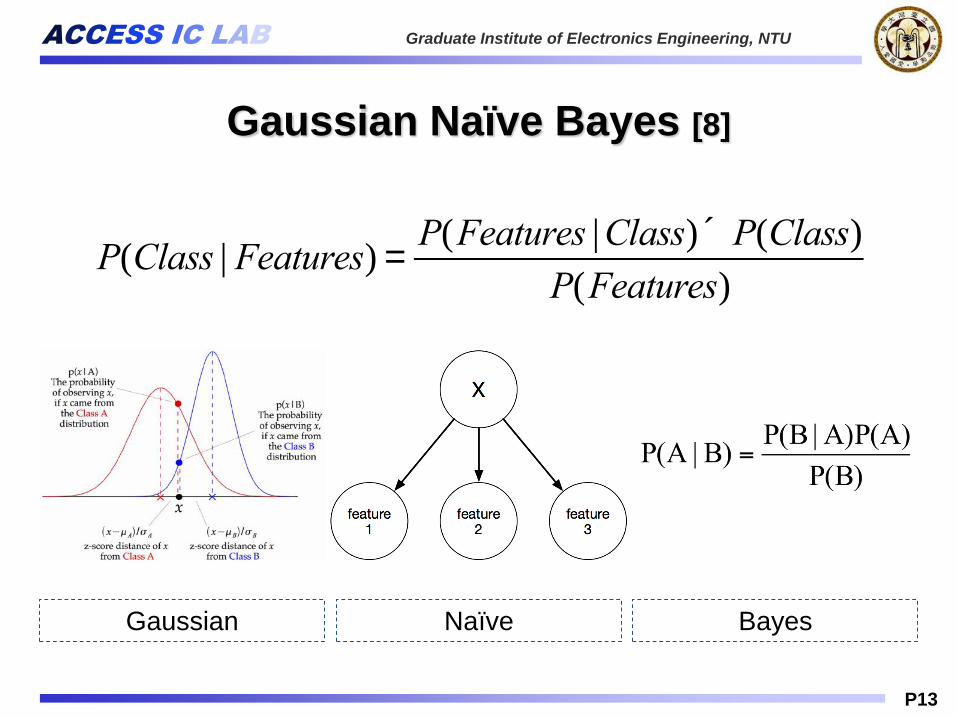
Gaussian Naïve Bayes [8]
P(Class | Features) =P(Features |Class) ´ P(Class)
P(Features)
Gaussian Naïve Bayes
ACCESS IC LAB Graduate Institute of Electronics Engineering, NTU
P14
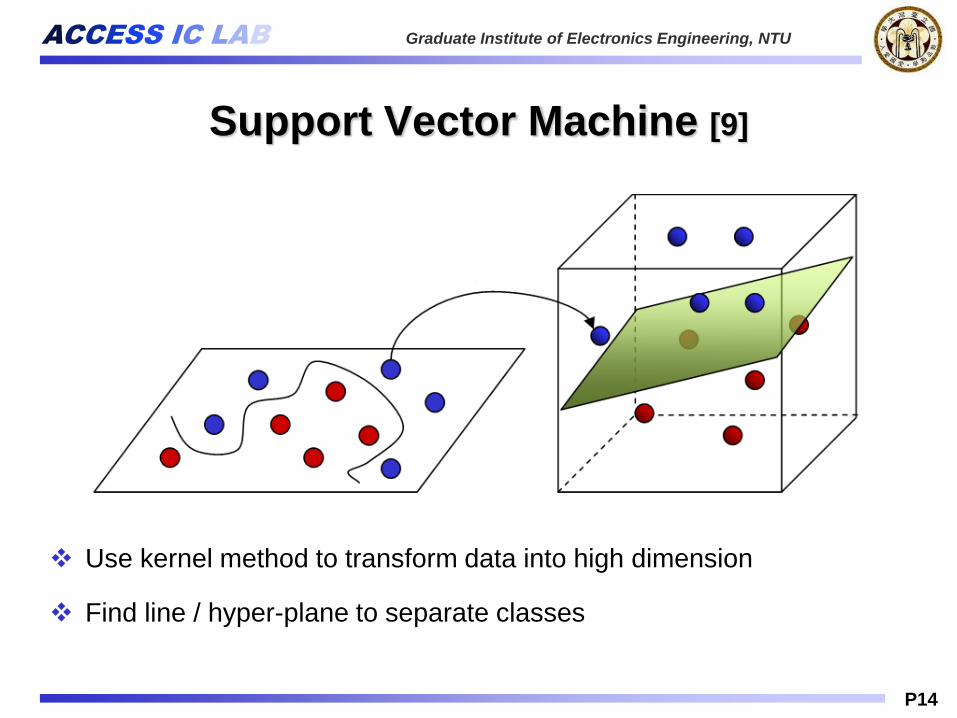
Support Vector Machine [9]
Use kernel method to transform data into high dimension
Find line / hyper-plane to separate classes
ACCESS IC LAB Graduate Institute of Electronics Engineering, NTU
P15
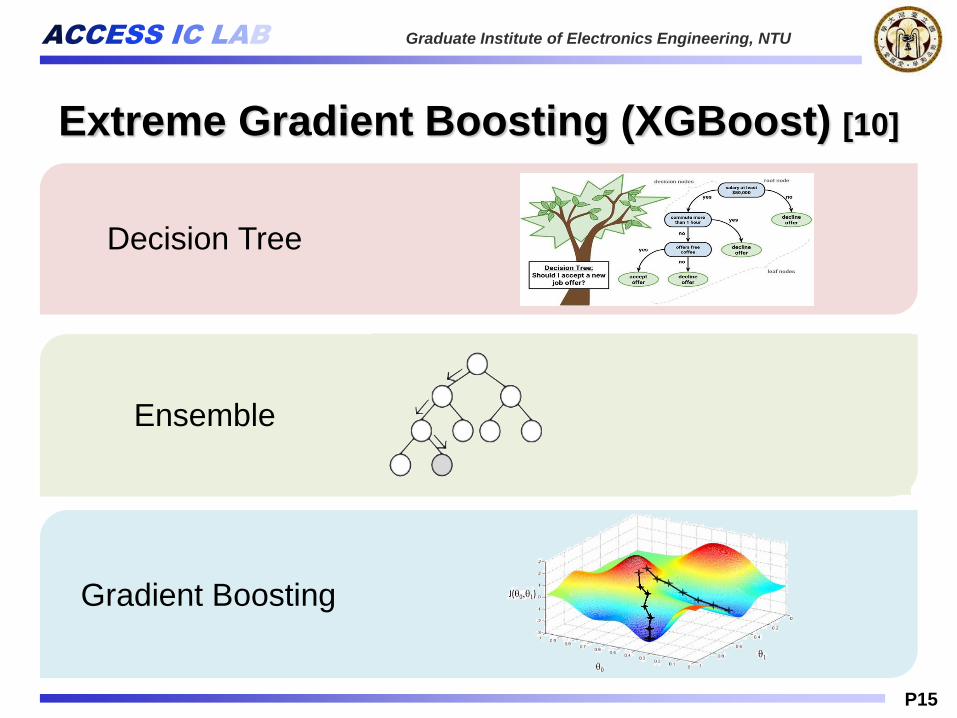
Extreme Gradient Boosting (XGBoost) [10]
Decision Tree
Ensemble
Gradient Boosting
ACCESS IC LAB Graduate Institute of Electronics Engineering, NTU
P16
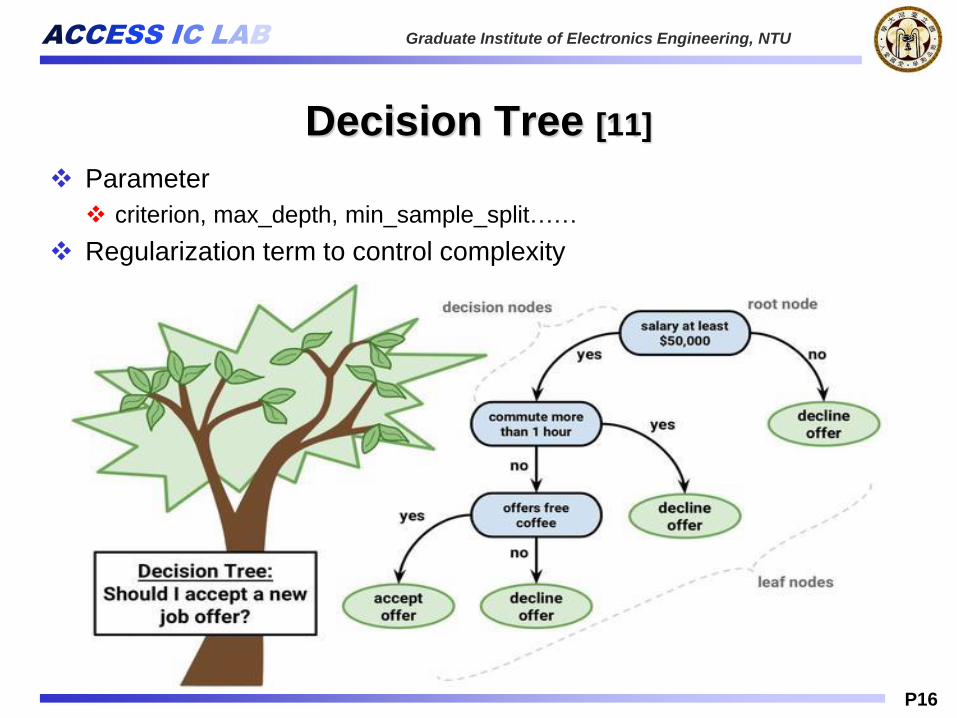
Decision Tree [11]
Parameter
criterion, max_depth, min_sample_split……
Regularization term to control complexity
ACCESS IC LAB Graduate Institute of Electronics Engineering, NTU
P17
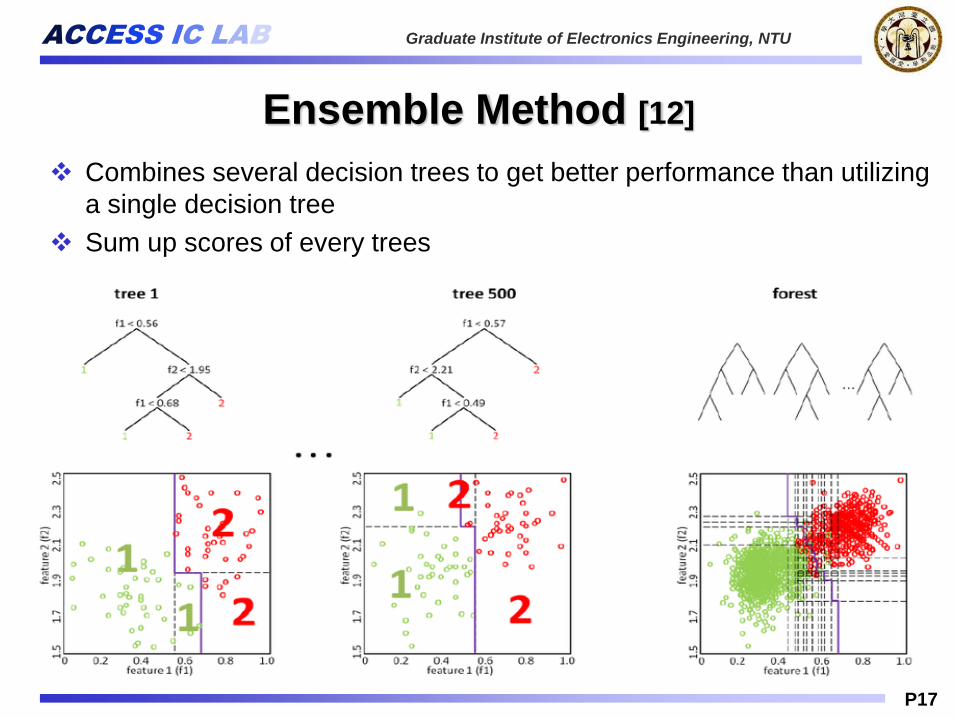
Ensemble Method [12]
Combines several decision trees to get better performance than utilizing
a single decision tree
Sum up scores of every trees
ACCESS IC LAB Graduate Institute of Electronics Engineering, NTU
P18
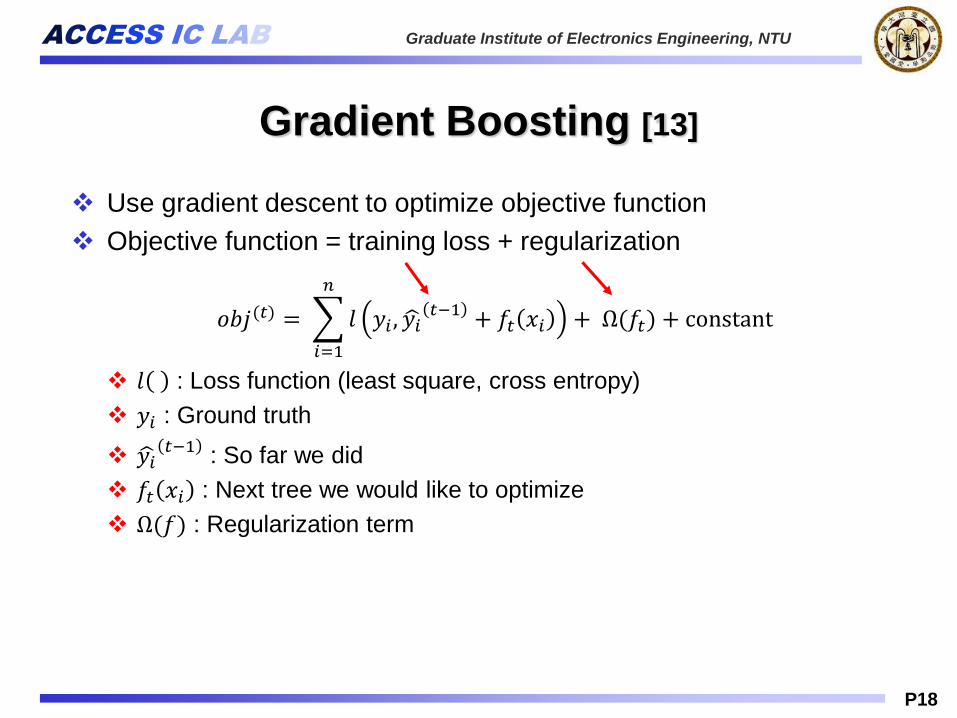
Gradient Boosting [13]
Use gradient descent to optimize objective function
Objective function = training loss + regularization
𝑙 : Loss function (least square, cross entropy)
𝑦𝑖 : Ground truth
𝑦𝑖𝑡−1
: So far we did
𝑓𝑡 𝑥𝑖 : Next tree we would like to optimize
Ω(𝑓) : Regularization term
𝑜𝑏𝑗(𝑡) =
𝑖=1
𝑛
𝑙 𝑦𝑖 , 𝑦𝑖𝑡−1 + 𝑓𝑡 𝑥𝑖 + Ω(𝑓𝑡) + constant
ACCESS IC LAB Graduate Institute of Electronics Engineering, NTU
P19
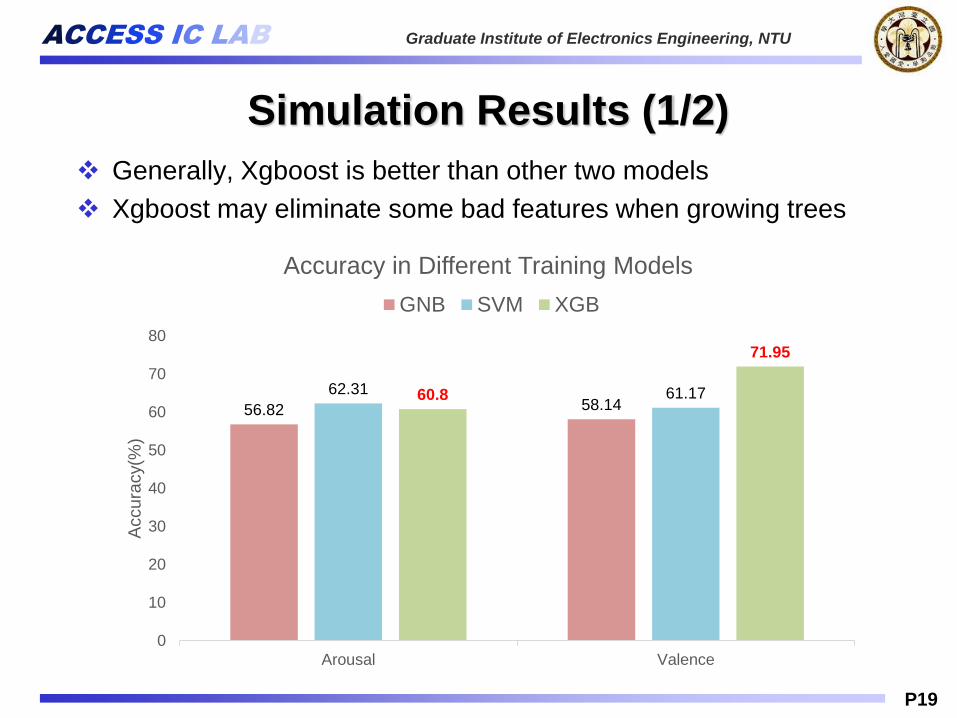
Simulation Results (1/2)
Generally, Xgboost is better than other two models
Xgboost may eliminate some bad features when growing trees
56.82 58.1462.31 61.1760.8
71.95
0
10
20
30
40
50
60
70
80
Arousal Valence
Accura
cy(%
)
Accuracy in Different Training Models
GNB SVM XGB
ACCESS IC LAB Graduate Institute of Electronics Engineering, NTU
P20
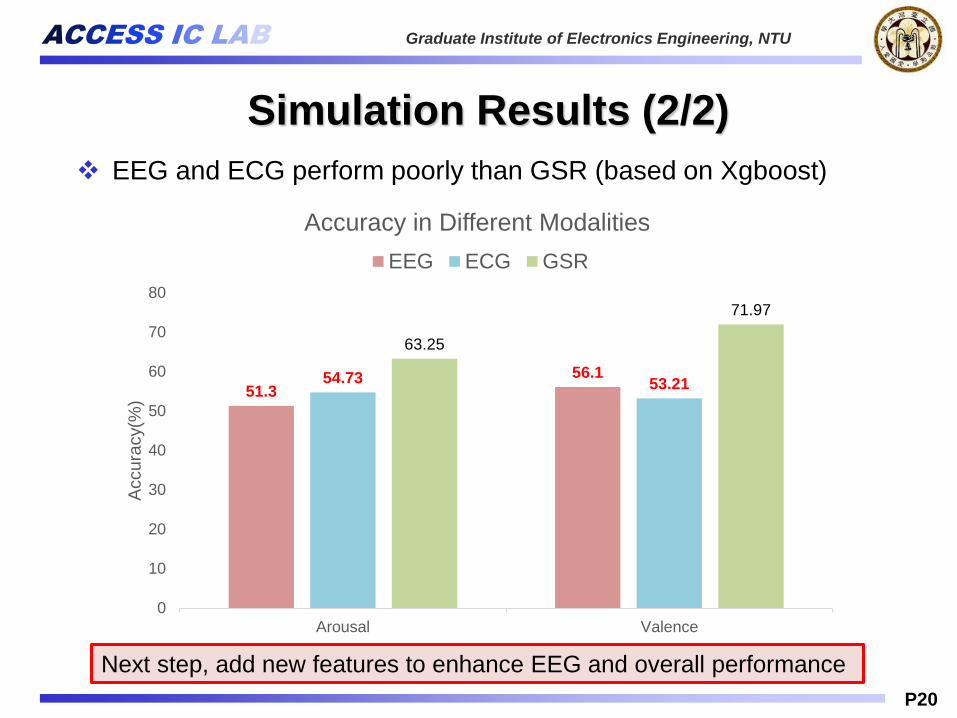
51.3
56.154.73 53.21
63.25
71.97
0
10
20
30
40
50
60
70
80
Arousal Valence
Accura
cy(%
)
Accuracy in Different Modalities
EEG ECG GSR
Simulation Results (2/2)
EEG and ECG perform poorly than GSR (based on Xgboost)
Next step, add new features to enhance EEG and overall performance
ACCESS IC LAB Graduate Institute of Electronics Engineering, NTU
P21
Analyze Physiological Signals
in EMD Domain
ACCESS IC LAB Graduate Institute of Electronics Engineering, NTU
P22
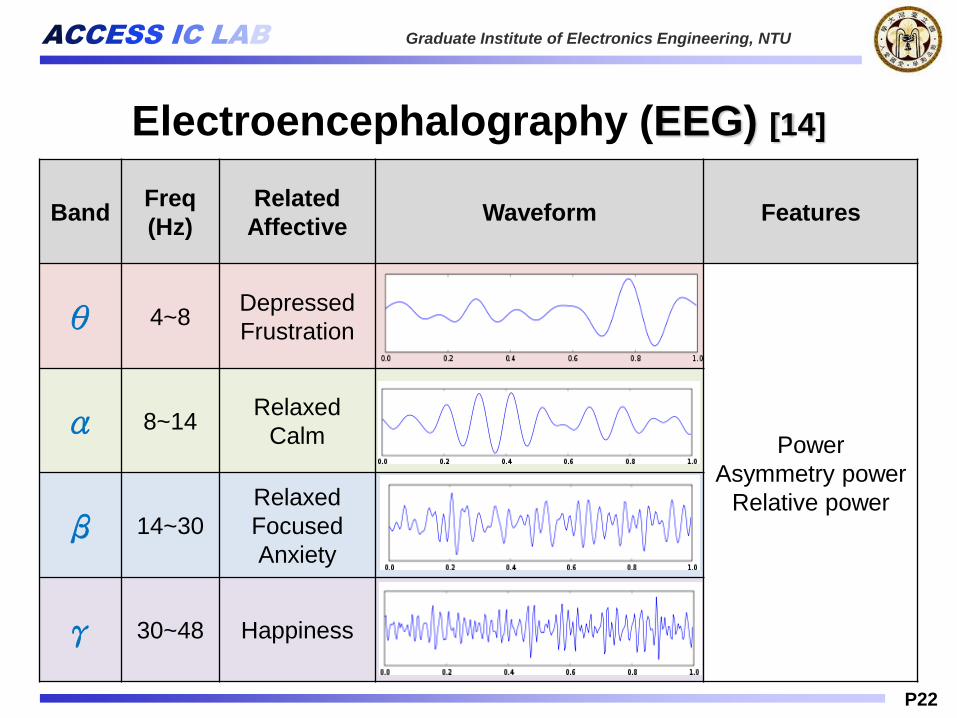
Electroencephalography (EEG) [14]
BandFreq
(Hz)
Related
AffectiveWaveform Features
θ 4~8Depressed
Frustration
Power
Asymmetry power
Relative power
α 8~14Relaxed
Calm
β 14~30
Relaxed
Focused
Anxiety
γ 30~48 Happiness
ACCESS IC LAB Graduate Institute of Electronics Engineering, NTU
P23
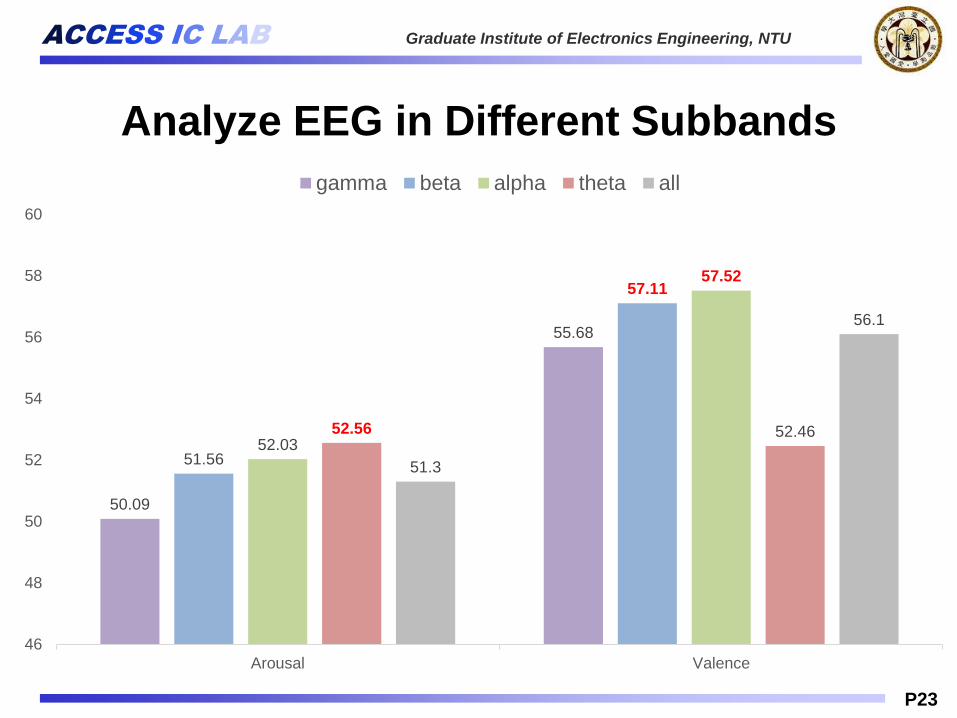
Analyze EEG in Different Subbands
50.09
55.68
51.56
57.11
52.03
57.52
52.56 52.46
51.3
56.1
46
48
50
52
54
56
58
60
Arousal Valence
gamma beta alpha theta all
ACCESS IC LAB Graduate Institute of Electronics Engineering, NTU
P24
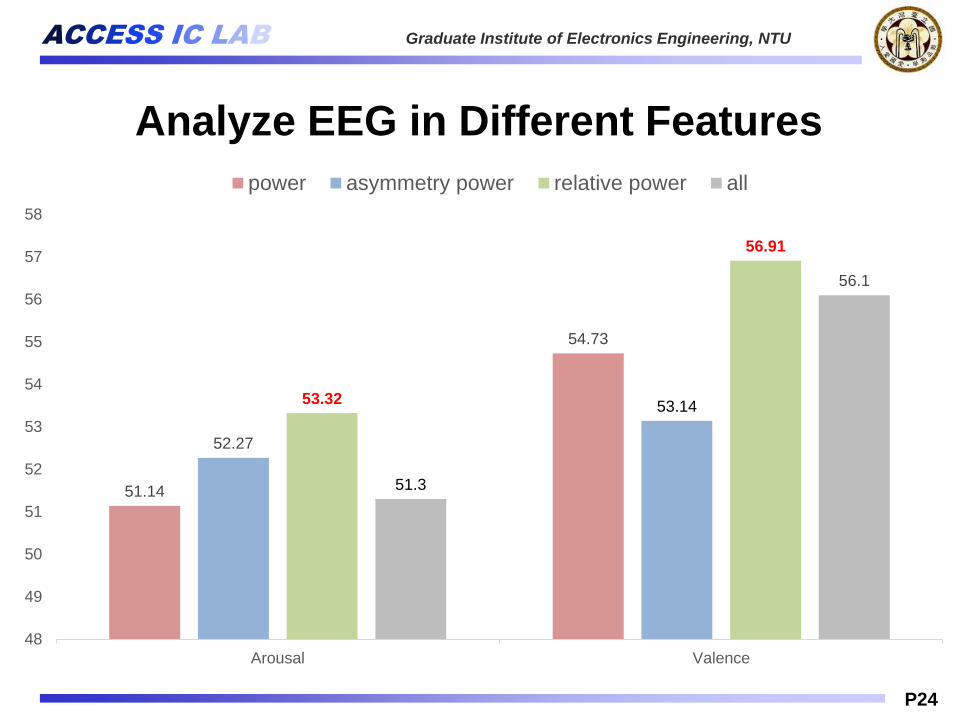
Analyze EEG in Different Features
51.14
54.73
52.27
53.1453.32
56.91
51.3
56.1
48
49
50
51
52
53
54
55
56
57
58
Arousal Valence
power asymmetry power relative power all
ACCESS IC LAB Graduate Institute of Electronics Engineering, NTU
P25
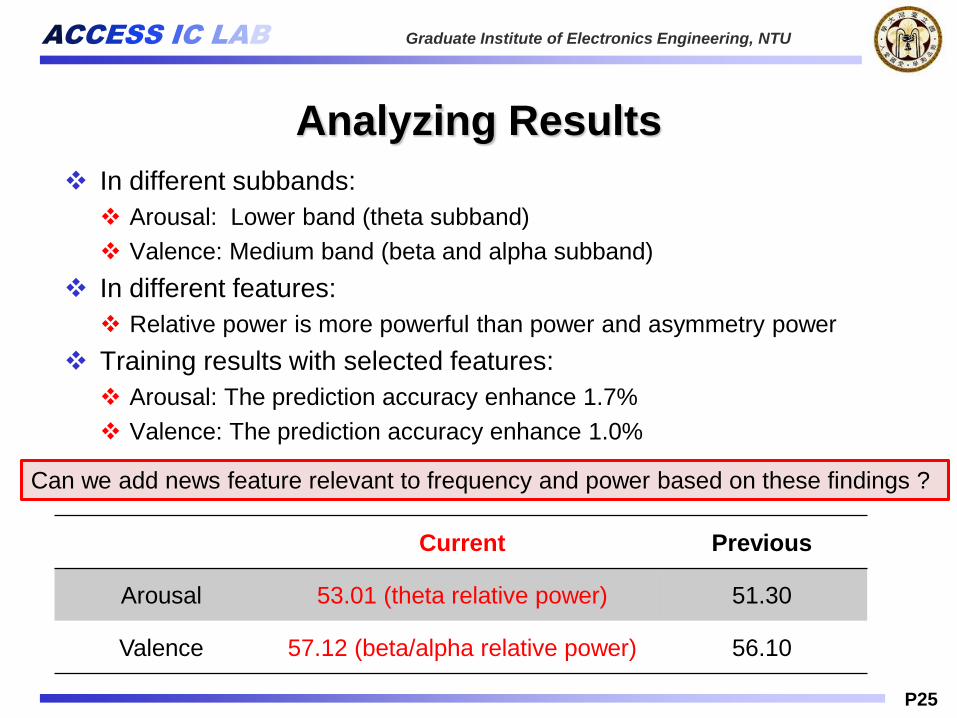
Analyzing Results
Current Previous
Arousal 53.01 (theta relative power) 51.30
Valence 57.12 (beta/alpha relative power) 56.10
In different subbands:
Arousal: Lower band (theta subband)
Valence: Medium band (beta and alpha subband)
In different features:
Relative power is more powerful than power and asymmetry power
Training results with selected features:
Arousal: The prediction accuracy enhance 1.7%
Valence: The prediction accuracy enhance 1.0%
Can we add news feature relevant to frequency and power based on these findings ?
ACCESS IC LAB Graduate Institute of Electronics Engineering, NTU
P26
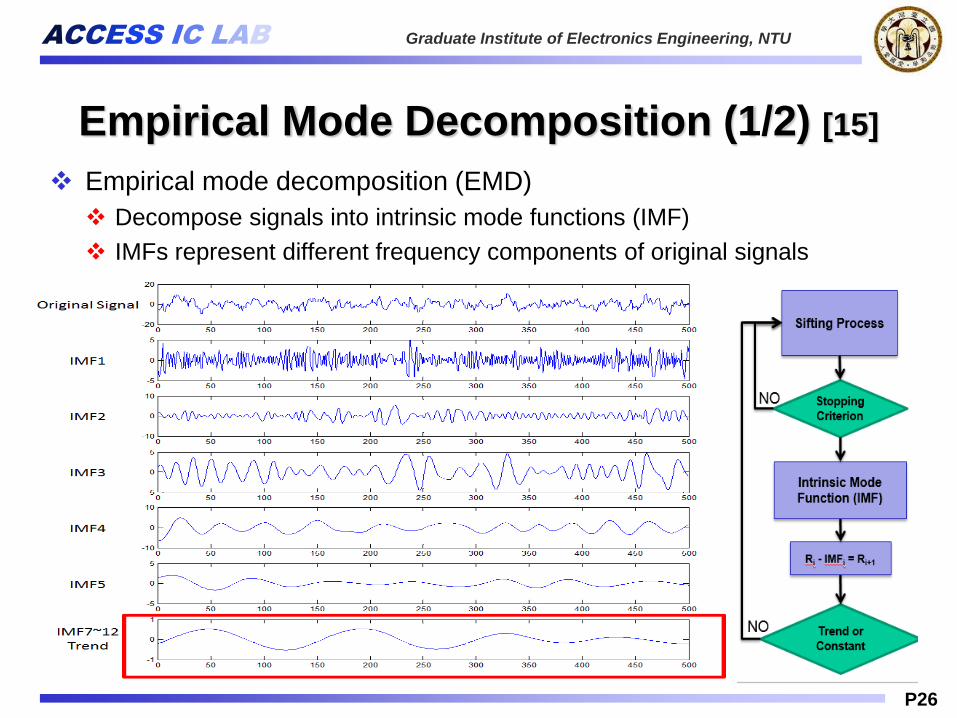
Empirical Mode Decomposition (1/2) [15]
Empirical mode decomposition (EMD)
Decompose signals into intrinsic mode functions (IMF)
IMFs represent different frequency components of original signals
ACCESS IC LAB Graduate Institute of Electronics Engineering, NTU
P27
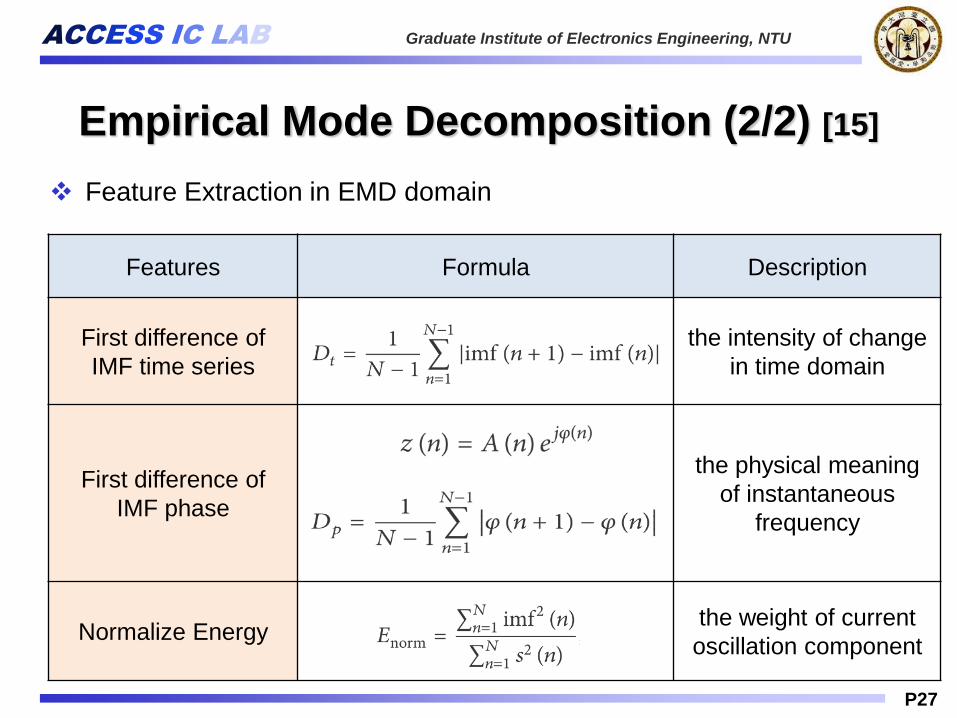
Empirical Mode Decomposition (2/2) [15]
Feature Extraction in EMD domain
Features Formula Description
First difference of
IMF time series
the intensity of change
in time domain
First difference of
IMF phase
the physical meaning
of instantaneous
frequency
Normalize Energythe weight of current
oscillation component
ACCESS IC LAB Graduate Institute of Electronics Engineering, NTU
P28
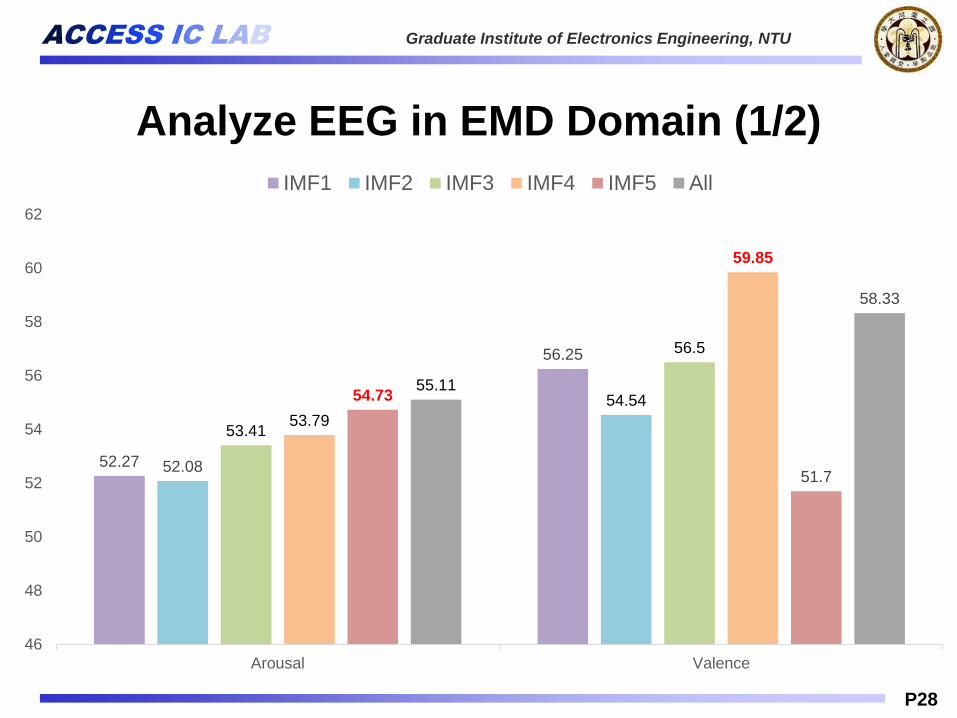
Analyze EEG in EMD Domain (1/2)
52.27
56.25
52.08
54.54
53.41
56.5
53.79
59.85
54.73
51.7
55.11
58.33
46
48
50
52
54
56
58
60
62
Arousal Valence
IMF1 IMF2 IMF3 IMF4 IMF5 All
ACCESS IC LAB Graduate Institute of Electronics Engineering, NTU
P29
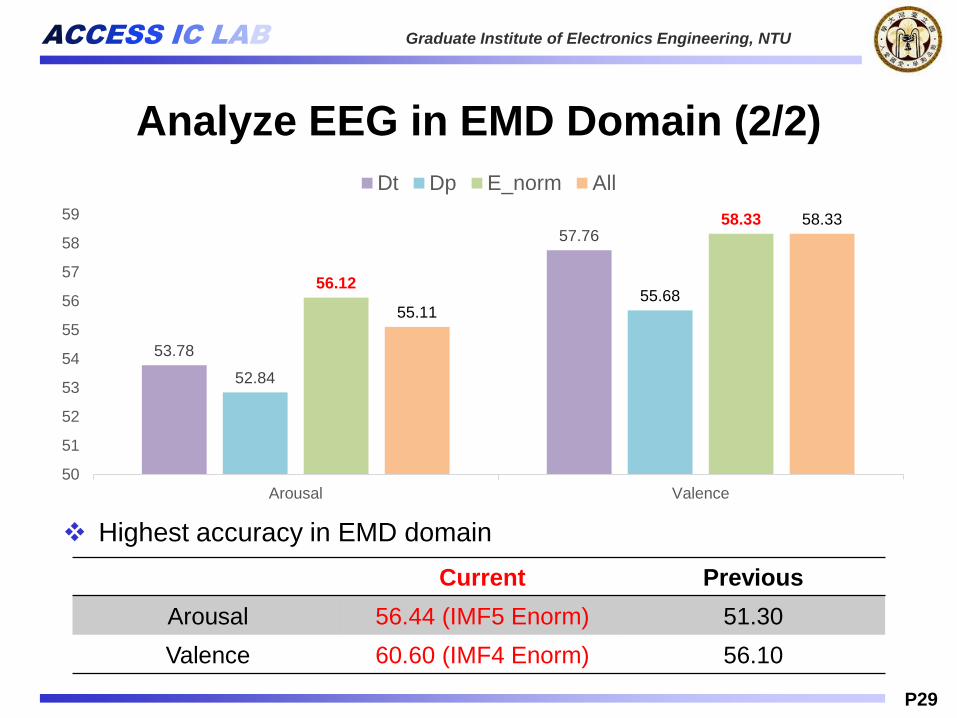
Analyze EEG in EMD Domain (2/2)
53.78
57.76
52.84
55.6856.12
58.33
55.11
58.33
50
51
52
53
54
55
56
57
58
59
Arousal Valence
Dt Dp E_norm All
Current Previous
Arousal 56.44 (IMF5 Enorm) 51.30
Valence 60.60 (IMF4 Enorm) 56.10
Highest accuracy in EMD domain
ACCESS IC LAB Graduate Institute of Electronics Engineering, NTU
P30
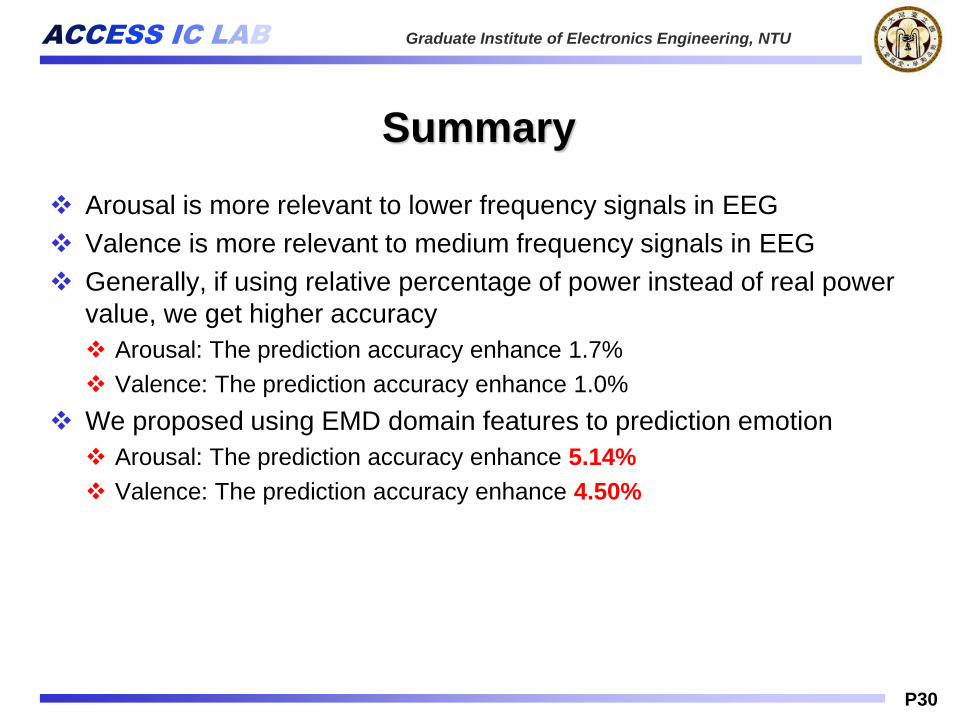
Summary
Arousal is more relevant to lower frequency signals in EEG
Valence is more relevant to medium frequency signals in EEG
Generally, if using relative percentage of power instead of real power
value, we get higher accuracy
Arousal: The prediction accuracy enhance 1.7%
Valence: The prediction accuracy enhance 1.0%
We proposed using EMD domain features to prediction emotion
Arousal: The prediction accuracy enhance 5.14%
Valence: The prediction accuracy enhance 4.50%
ACCESS IC LAB Graduate Institute of Electronics Engineering, NTU
P31
Analyze Physiological Signals
in Entropy Domain
ACCESS IC LAB Graduate Institute of Electronics Engineering, NTU
P32
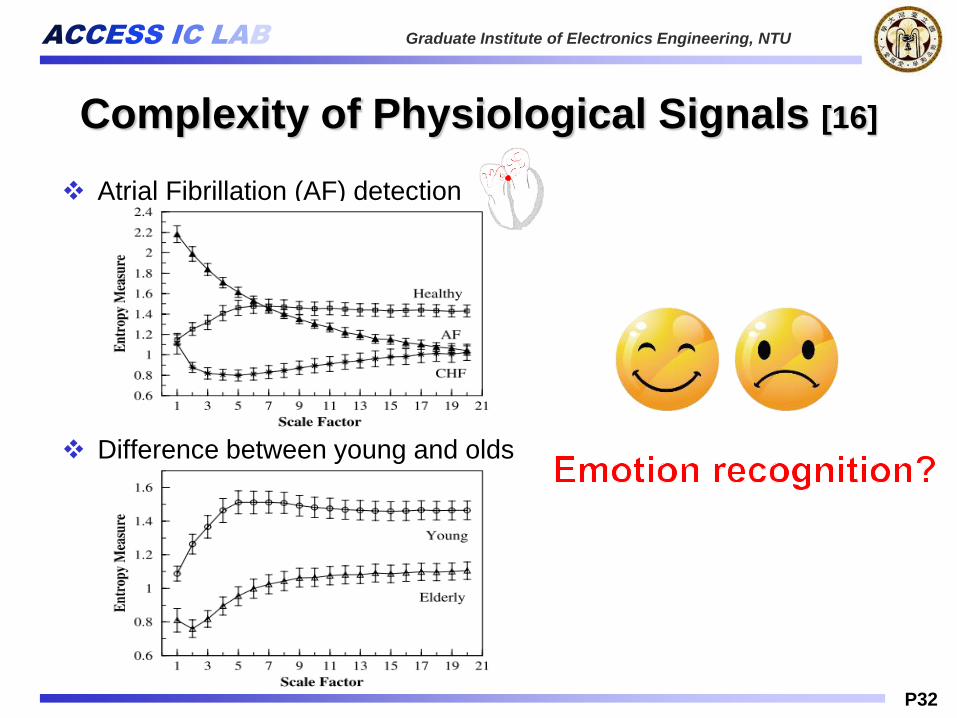
Difference between young and olds
Atrial Fibrillation (AF) detection
Complexity of Physiological Signals [16]
ACCESS IC LAB Graduate Institute of Electronics Engineering, NTU
P33
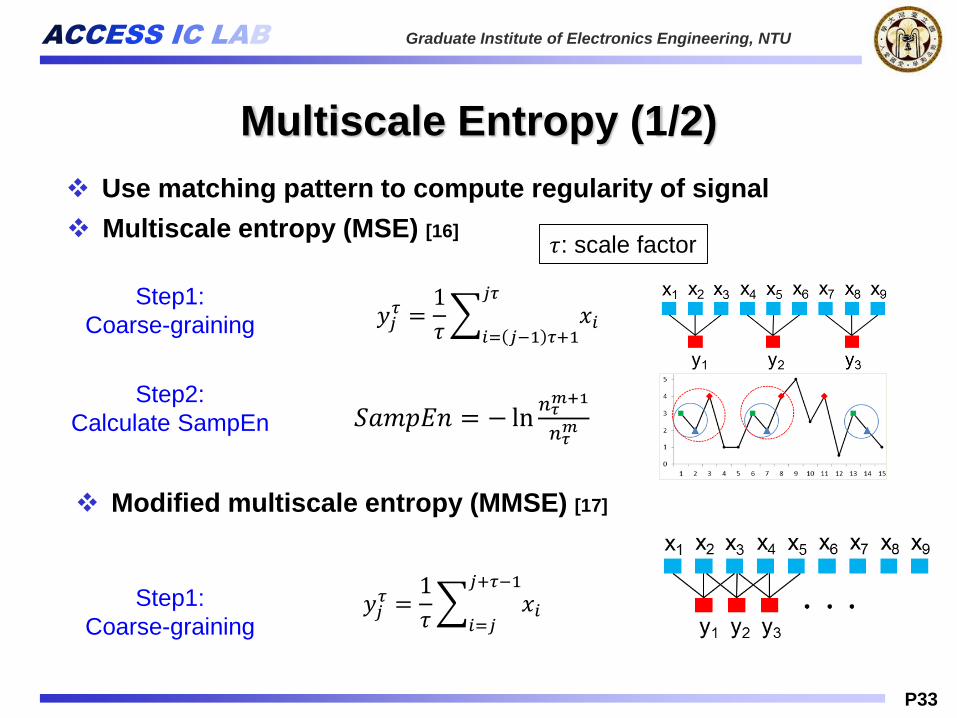
Multiscale Entropy (1/2)
Multiscale entropy (MSE) [16]
𝑦𝑗𝜏 =
1
𝜏
𝑖= 𝑗−1 𝜏+1
𝑗𝜏
𝑥𝑖
𝜏: scale factor
𝑆𝑎𝑚𝑝𝐸𝑛 = − ln𝑛𝜏𝑚+1
𝑛𝜏𝑚
Step1:
Coarse-graining
Step2:
Calculate SampEn
Step1:
Coarse-graining 𝑦𝑗𝜏 =
1
𝜏
𝑖=𝑗
𝑗+𝜏−1
𝑥𝑖
Modified multiscale entropy (MMSE) [17]
Use matching pattern to compute regularity of signal
ACCESS IC LAB Graduate Institute of Electronics Engineering, NTU
P34
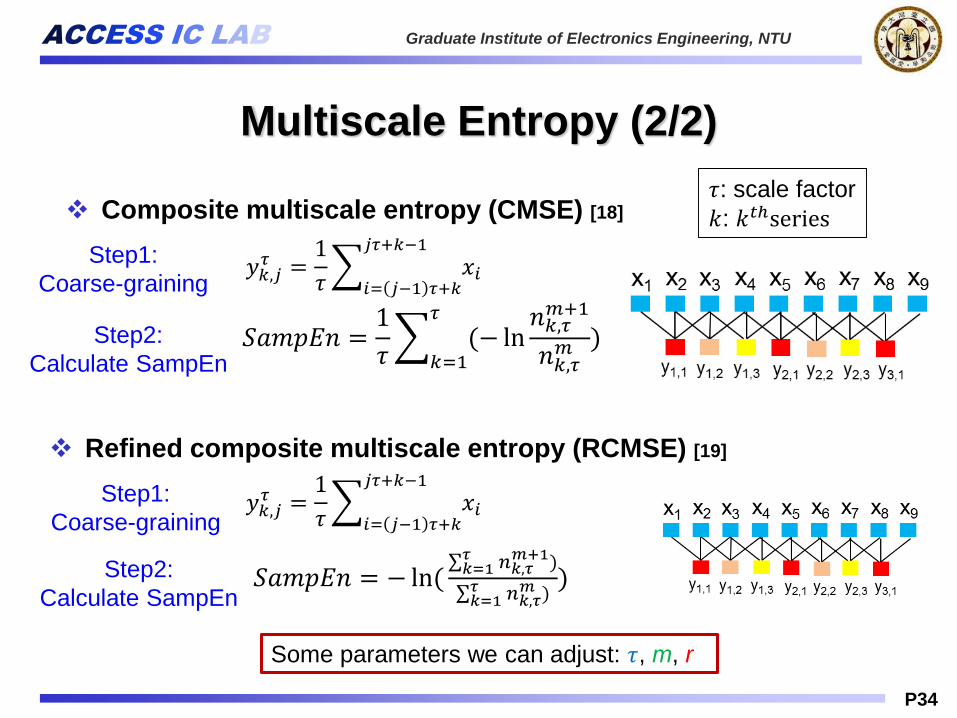
Multiscale Entropy (2/2)
Refined composite multiscale entropy (RCMSE) [19]
Step1:
Coarse-graining 𝑦𝑘,𝑗𝜏 =
1
𝜏
𝑖= 𝑗−1 𝜏+𝑘
𝑗𝜏+𝑘−1
𝑥𝑖
Step2:
Calculate SampEn𝑆𝑎𝑚𝑝𝐸𝑛 =
1
𝜏
𝑘=1
𝜏
(− ln𝑛𝑘,𝜏𝑚+1
𝑛𝑘,𝜏𝑚 )
Composite multiscale entropy (CMSE) [18]
Step1:
Coarse-graining 𝑦𝑘,𝑗𝜏 =
1
𝜏
𝑖= 𝑗−1 𝜏+𝑘
𝑗𝜏+𝑘−1
𝑥𝑖
Step2:
Calculate SampEn𝑆𝑎𝑚𝑝𝐸𝑛 = − ln(
𝑘=1𝜏 𝑛𝑘,𝜏
𝑚+1)
𝑘=1𝜏 𝑛𝑘,𝜏
𝑚 ))
𝜏: scale factor
𝑘: 𝑘𝑡ℎseries
Some parameters we can adjust: 𝜏, m, r

ACCESS IC LAB Graduate Institute of Electronics Engineering, NTU
P35
MSE Useful Features
Index Method Scale m tolerance P-value
1 ECG MSE 2 2 0.1std 0.001
2 ECG RCMSE 2 2 0.2std 0.009
3 ECG MSE 2 1 0.2std 0.014
4 ECG MSE 3 1 0.2std 0.014
5 ECG RCMSE 2 0 0.2std 0.041
6 ECG MSE 2 0 0.1std 0.036
Arousal
Not significant
Valence
ACCESS IC LAB Graduate Institute of Electronics Engineering, NTU
P36
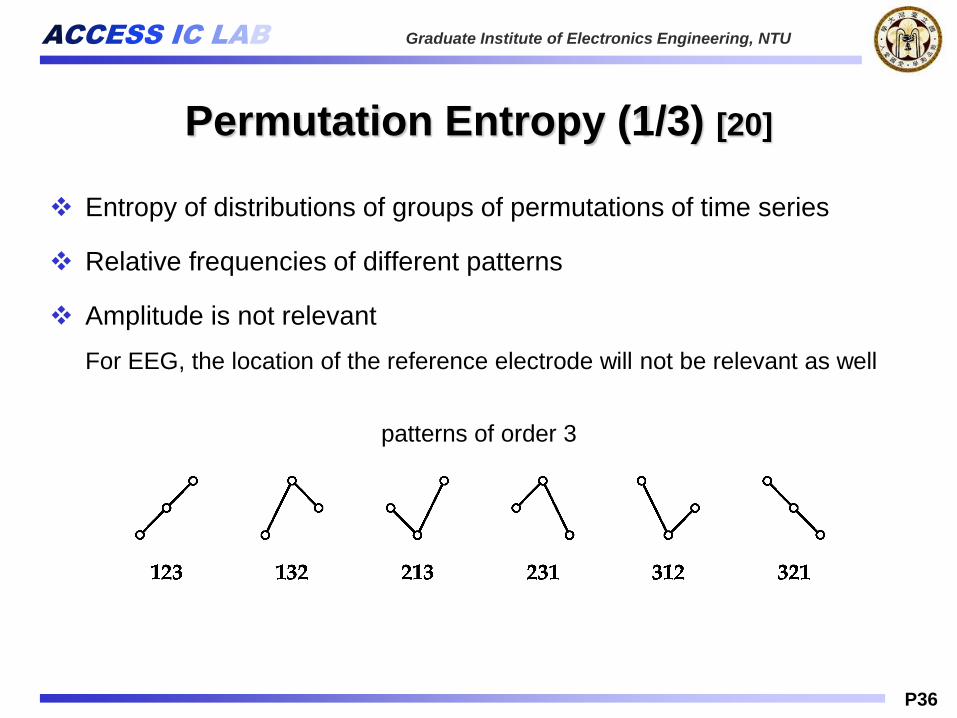
Permutation Entropy (1/3) [20]
Entropy of distributions of groups of permutations of time series
Relative frequencies of different patterns
Amplitude is not relevant
For EEG, the location of the reference electrode will not be relevant as well
patterns of order 3
ACCESS IC LAB Graduate Institute of Electronics Engineering, NTU
P37
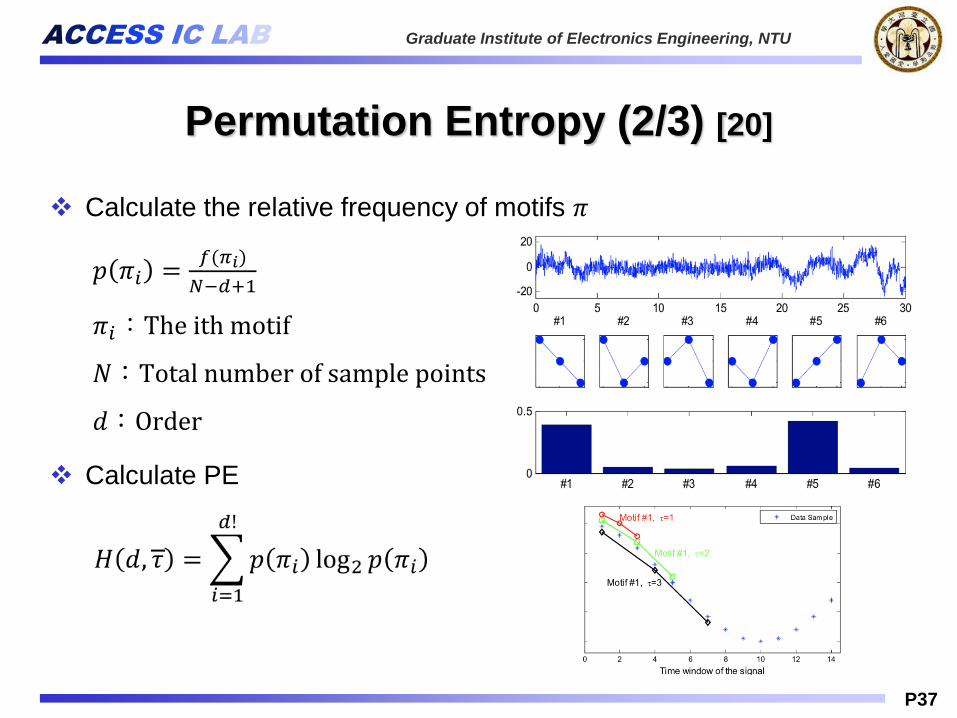
Permutation Entropy (2/3) [20]
Calculate the relative frequency of motifs 𝜋
𝑝 𝜋𝑖 =𝑓(𝜋𝑖)
𝑁−𝑑+1
𝜋𝑖:The ith motif
𝑁:Total number of sample points
𝑑:Order
Calculate PE

ACCESS IC LAB Graduate Institute of Electronics Engineering, NTU
P38
Permutation Entropy (3/3) [20]
Multi-Scale Permutation Entropy (MSPE) [21]
1. Get coarse-grained time series
𝑦𝑗(𝜀)
=1
𝜀 𝑖= 𝑗−1 𝜀+1𝑗𝜀
𝑥𝑖
𝑥𝑖:Original time series
𝜀:Size of Scale
2. Calculate the relative frequency
𝑝 𝜋𝑖 =𝑓(𝜋𝑖)
𝑁−𝑑+1
3. Calculate PE
ACCESS IC LAB Graduate Institute of Electronics Engineering, NTU
P39
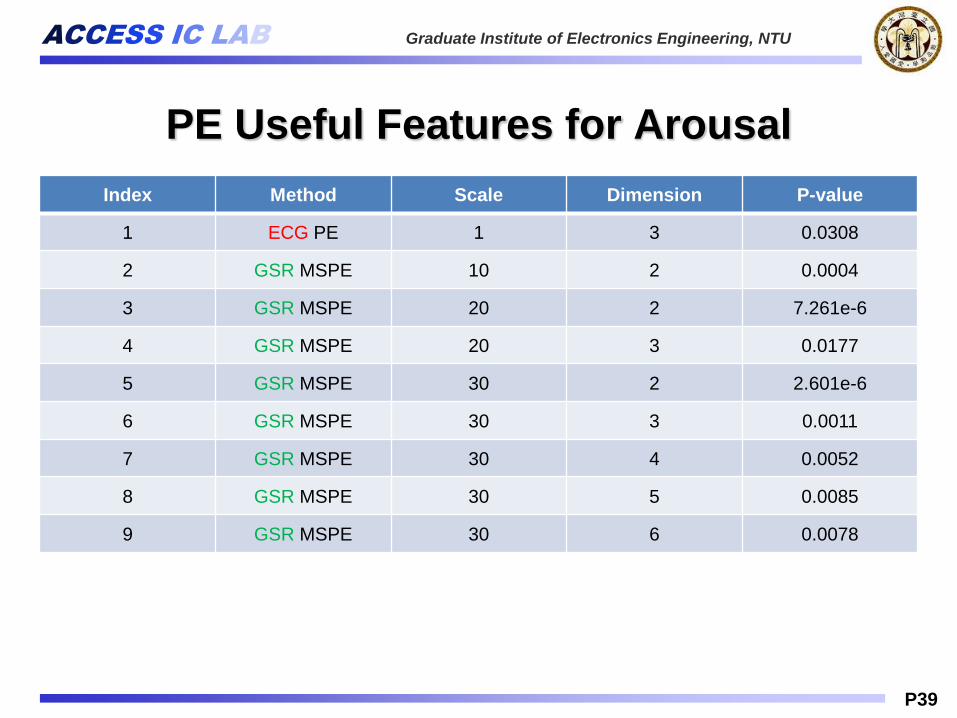
PE Useful Features for Arousal
Index Method Scale Dimension P-value
1 ECG PE 1 3 0.0308
2 GSR MSPE 10 2 0.0004
3 GSR MSPE 20 2 7.261e-6
4 GSR MSPE 20 3 0.0177
5 GSR MSPE 30 2 2.601e-6
6 GSR MSPE 30 3 0.0011
7 GSR MSPE 30 4 0.0052
8 GSR MSPE 30 5 0.0085
9 GSR MSPE 30 6 0.0078
ACCESS IC LAB Graduate Institute of Electronics Engineering, NTU
P40
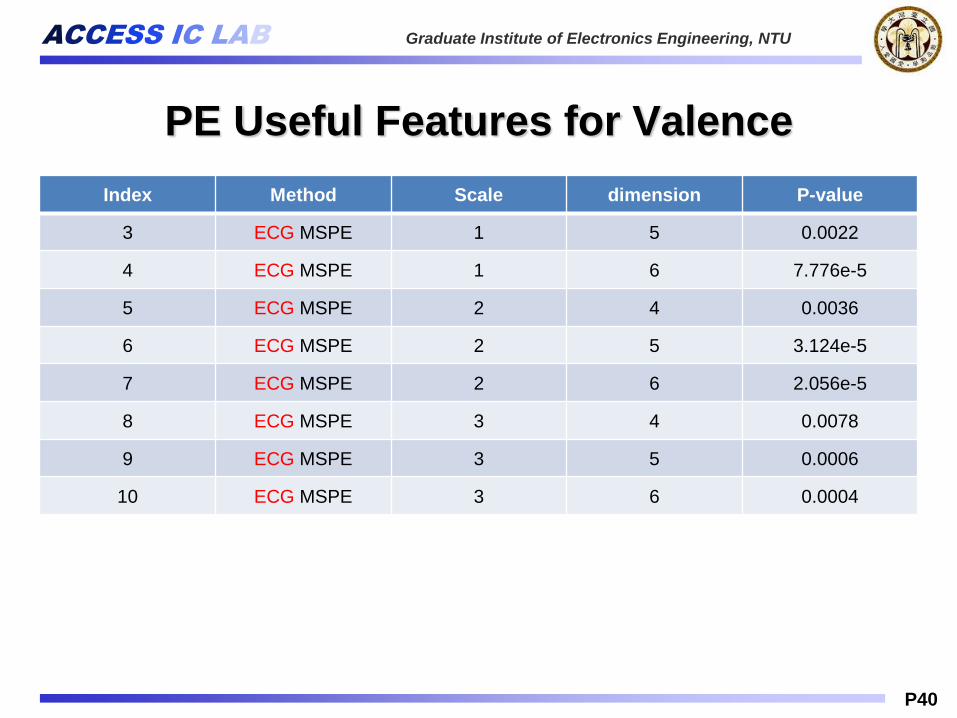
PE Useful Features for Valence
Index Method Scale dimension P-value
3 ECG MSPE 1 5 0.0022
4 ECG MSPE 1 6 7.776e-5
5 ECG MSPE 2 4 0.0036
6 ECG MSPE 2 5 3.124e-5
7 ECG MSPE 2 6 2.056e-5
8 ECG MSPE 3 4 0.0078
9 ECG MSPE 3 5 0.0006
10 ECG MSPE 3 6 0.0004

ACCESS IC LAB Graduate Institute of Electronics Engineering, NTU
P41
Entropy Simulation Results
EEG ECG GSR ALL
OLD
Arousal 51.30 54.73 63.25 60.80
Valence 56.1 53.21 71.97 71.95
NEW
Arousal 56.06 55.49 62.80 61.00
Valence 61.36 62.12 76.90 79.10
ACCESS IC LAB Graduate Institute of Electronics Engineering, NTU
P42
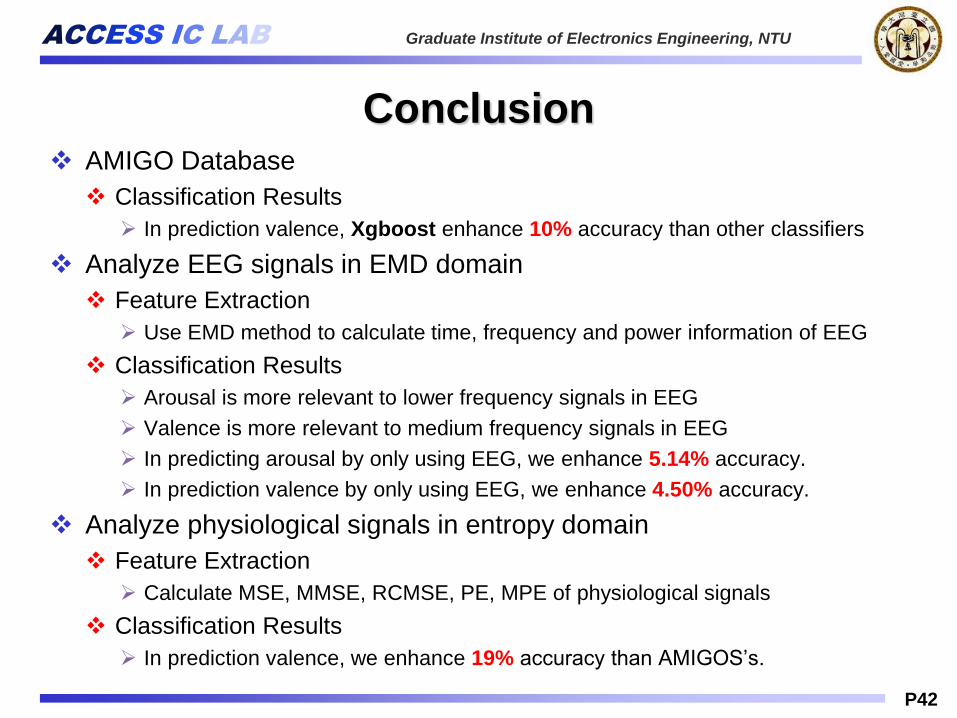
Conclusion AMIGO Database
Classification Results
In prediction valence, Xgboost enhance 10% accuracy than other classifiers
Analyze EEG signals in EMD domain
Feature Extraction
Use EMD method to calculate time, frequency and power information of EEG
Classification Results
Arousal is more relevant to lower frequency signals in EEG
Valence is more relevant to medium frequency signals in EEG
In predicting arousal by only using EEG, we enhance 5.14% accuracy.
In prediction valence by only using EEG, we enhance 4.50% accuracy.
Analyze physiological signals in entropy domain
Feature Extraction
Calculate MSE, MMSE, RCMSE, PE, MPE of physiological signals
Classification Results
In prediction valence, we enhance 19% accuracy than AMIGOS’s.
ACCESS IC LAB Graduate Institute of Electronics Engineering, NTU
P43
Reference (1/3)
[1] S. Koelstra et al., "DEAP: A Database for Emotion Analysis ;Using Physiological Signals,"
in IEEE Transactions on Affective Computing, vol. 3, no. 1, pp. 18-31, Jan.-March 2012.
[2] R. Subramanian; J. Wache; M. Abadi; R. Vieriu; S. Winkler; N. Sebe, "ASCERTAIN: Emotion and
Personality Recognition using Commercial Sensors," in IEEE Transactions on Affective Computing ,
vol.PP, no.99, pp.1-1
[3] Miranda-Correa, Juan Abdon, et al. "AMIGOS: A dataset for Mood, personality and affect
research on Individuals and GrOupS." arXiv preprint arXiv:1702.02510 (2017).
[4] Bakker, Jorn, Mykola Pechenizkiy, and Natalia Sidorova. "What's your current stress level?
Detection of stress patterns from GSR sensor data." Data Mining Workshops (ICDMW), 2011 IEEE
11th International Conference on. IEEE, 2011.
[5] http://neuroelf.net/wiki/doku.php?id=gsr_data_analysis
[6] A.GuruvaReddy , Srilatha Narava. Artifact removal from EEG Signals. International Journal of
Computer Applications 2013; 77(13):16-19
[7] Rakendu Rao and R. Derakhshani, "A Comparison of EEG Preprocessing Methods using Time
Delay Neural Networks," Conference Proceedings. 2nd International IEEE EMBS Conference on
Neural Engineering, 2005.,Arlington, VA, 2005, pp. 262-264.
[8] John, George H., and Pat Langley. "Estimating continuous distributions in Bayesian
classifiers." Proceedings of the Eleventh conference on Uncertainty in artificial intelligence. Morgan
Kaufmann Publishers Inc., 1995.
[9] Hearst, Marti A., et al. "Support vector machines." IEEE Intelligent Systems and their
applications 13.4 (1998): 18-28.
ACCESS IC LAB Graduate Institute of Electronics Engineering, NTU
P44
Reference (2/3)
[10] Chen, Tianqi, Tong He, and Michael Benesty. "Xgboost: extreme gradient boosting." R package
version 0.4-2 (2015): 1-4.
[11] Kohavi, Ron. "Scaling up the accuracy of Naive-Bayes classifiers: a decision-tree hybrid." KDD.
Vol. 96. 1996.
[12] Liaw, Andy, and Matthew Wiener. "Classification and regression by randomForest." R news 2.3
(2002): 18-22.
[13] Friedman, Jerome H. "Greedy function approximation: a gradient boosting machine." Annals of
statistics (2001): 1189-1232.
[14] https://zh.wikipedia.org/wiki/%E8%85%A6%E9%9B%BB%E5%9C%96
[15] Ning Zhuang, Ying Zeng, Li Tong, Chi Zhang, Hanming Zhang, and Bin Yan. Emotion
Recognition from EEG Signals Using Multidimensional Information in EMD Domain.
[16] Costa, Madalena, Ary L. Goldberger, and C-K. Peng. "Multiscale entropy analysis of complex
physiologic time series." Physical review letters 89.6 (2002): 068102.
[17] Wu, S.D.; Wu, C.W.; Lee, K.Y.; Lin, S.G. Modified multiscale entropy for short-term time series
analysis. Phys. A 2013, 392, 5865–5873.
[18] S.D. Wu, C.W. Wu, S.G. Lin, C.C. Wang, K.Y. Lee, Time series analysis using com-posite
multiscale entropy, Entropy 15 (2013) 1069–1084.
[19] S.-D. Wu, C.-W. Wu, S.-G. Lin, K.-Y. Lee, and C.-K. Peng, “Analysis of complex time series
using refined composite multiscale entropy,” Physics Letters A, vol. 378, no. 20, pp. 1369–1374,
2014.
ACCESS IC LAB Graduate Institute of Electronics Engineering, NTU
P45
Reference (3/3)
[20] Bandt, Christoph, and Bernd Pompe. "Permutation entropy: a natural complexity measure for
time series." Physical review letters 88.17 (2002): 174102.
[21] Aziz, Wajid, and Muhammad Arif. "Multiscale permutation entropy of physiological time
series." 9th International Multitopic Conference, IEEE INMIC 2005. IEEE, 2005.