Embed Size (px)
Citation preview
MUNICIPAL FINANCE OF URBAN INFRASTRUCTUREKNOWNS AND UNKNOWNS
James Alm
WOLFENSOHN CENTER FOR DEVELOPMENT
WORKING PAPER 19 | MAY 2010
Global Economyand Developmentat BROOKINGS
The Brookings Global Economy and Development working paper series also includes the following titles:
• Wolfensohn Center for Development Working Papers
• Middle East Youth Initiative Working Papers
• Global Health Initiative Working Papers
Learn more at www.brookings.edu/global
James Alm is Dean of the Andrew Young School of
Policy Studies at Georgia State University in Atlanta,
Georgia.
Acknowledgments:
I am grateful for many helpful comments from and discussion with Patricia Annez, George Peterson, Robert
Buckley, Johannes Linn and other participants at the workshop “Making Cities Making Cities Work for Growth,”
hosted by the Wolfensohn Center for Development at Brookings in Washington, DC on November 13, 2009.
Editor’s Note:
This working paper is based on a study fi rst presented at a workshop for “Making Cities Work for Growth” hosted
by the Wolfensohn Center for Development on November 13, 2009, in Washington, DC.
“Making Cities Work for Growth” is an action-oriented research initiative led by the Wolfensohn Center for
Development at Brookings, and aims to build engagement for national strategies that support urbanization.
The project builds on the fi ndings of The Growth Report (2008) produced by the Commission on Growth and
Development, which identifi ed effective urbanization strategies as a key ingredient for successful long-term
growth. The research, supported by the Rockefeller Foundation, is led by Brookings Nonresident Senior Fellow and
Urban Advisor with the World Bank Patricia Annez.
This paper was commissioned by the Wolfensohn Center for Development. It does not necessarily refl ect the of-
fi cial views of the Brookings Institution, its board or the advisory council members.
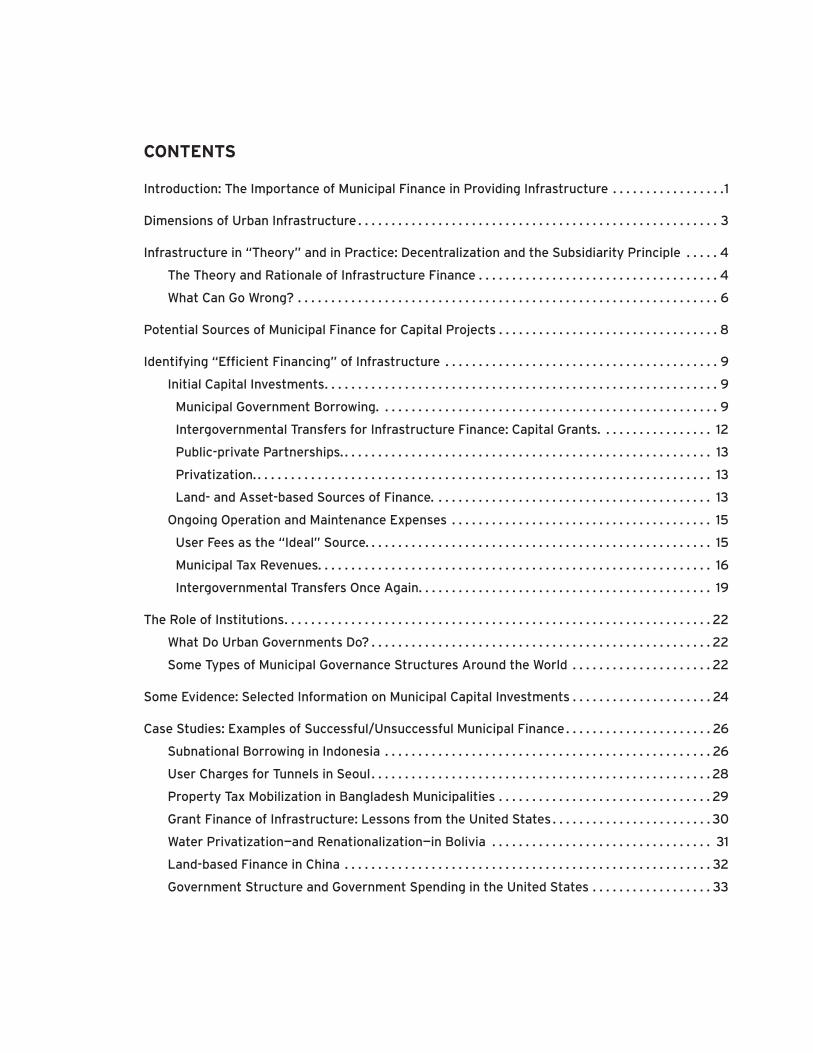
CONTENTS
Introduction: The Importance of Municipal Finance in Providing Infrastructure . . . . . . . . . . . . . . . . .1
Dimensions of Urban Infrastructure . . . . . . . . . . . . . . . . . . . . . . . . . . . . . . . . . . . . . . . . . . . . . . . . . . . . . . 3
Infrastructure in “Theory” and in Practice: Decentralization and the Subsidiarity Principle . . . . . 4
The Theory and Rationale of Infrastructure Finance . . . . . . . . . . . . . . . . . . . . . . . . . . . . . . . . . . . . 4
What Can Go Wrong? . . . . . . . . . . . . . . . . . . . . . . . . . . . . . . . . . . . . . . . . . . . . . . . . . . . . . . . . . . . . . . . 6
Potential Sources of Municipal Finance for Capital Projects . . . . . . . . . . . . . . . . . . . . . . . . . . . . . . . . . 8
Identifying “Effi cient Financing” of Infrastructure . . . . . . . . . . . . . . . . . . . . . . . . . . . . . . . . . . . . . . . . . 9
Initial Capital Investments . . . . . . . . . . . . . . . . . . . . . . . . . . . . . . . . . . . . . . . . . . . . . . . . . . . . . . . . . . . 9
Municipal Government Borrowing. . . . . . . . . . . . . . . . . . . . . . . . . . . . . . . . . . . . . . . . . . . . . . . . . . . 9
Intergovernmental Transfers for Infrastructure Finance: Capital Grants. . . . . . . . . . . . . . . . . 12
Public-private Partnerships. . . . . . . . . . . . . . . . . . . . . . . . . . . . . . . . . . . . . . . . . . . . . . . . . . . . . . . . 13
Privatization. . . . . . . . . . . . . . . . . . . . . . . . . . . . . . . . . . . . . . . . . . . . . . . . . . . . . . . . . . . . . . . . . . . . . 13
Land- and Asset-based Sources of Finance. . . . . . . . . . . . . . . . . . . . . . . . . . . . . . . . . . . . . . . . . . 13
Ongoing Operation and Maintenance Expenses . . . . . . . . . . . . . . . . . . . . . . . . . . . . . . . . . . . . . . . 15
User Fees as the “Ideal” Source. . . . . . . . . . . . . . . . . . . . . . . . . . . . . . . . . . . . . . . . . . . . . . . . . . . . 15
Municipal Tax Revenues. . . . . . . . . . . . . . . . . . . . . . . . . . . . . . . . . . . . . . . . . . . . . . . . . . . . . . . . . . . 16
Intergovernmental Transfers Once Again. . . . . . . . . . . . . . . . . . . . . . . . . . . . . . . . . . . . . . . . . . . . 19
The Role of Institutions . . . . . . . . . . . . . . . . . . . . . . . . . . . . . . . . . . . . . . . . . . . . . . . . . . . . . . . . . . . . . . . . 22
What Do Urban Governments Do? . . . . . . . . . . . . . . . . . . . . . . . . . . . . . . . . . . . . . . . . . . . . . . . . . . . 22
Some Types of Municipal Governance Structures Around the World . . . . . . . . . . . . . . . . . . . . . 22
Some Evidence: Selected Information on Municipal Capital Investments . . . . . . . . . . . . . . . . . . . . . 24
Case Studies: Examples of Successful/Unsuccessful Municipal Finance . . . . . . . . . . . . . . . . . . . . . . 26
Subnational Borrowing in Indonesia . . . . . . . . . . . . . . . . . . . . . . . . . . . . . . . . . . . . . . . . . . . . . . . . . 26
User Charges for Tunnels in Seoul . . . . . . . . . . . . . . . . . . . . . . . . . . . . . . . . . . . . . . . . . . . . . . . . . . . 28
Property Tax Mobilization in Bangladesh Municipalities . . . . . . . . . . . . . . . . . . . . . . . . . . . . . . . . 29
Grant Finance of Infrastructure: Lessons from the United States . . . . . . . . . . . . . . . . . . . . . . . . 30
Water Privatization—and Renationalization—in Bolivia . . . . . . . . . . . . . . . . . . . . . . . . . . . . . . . . . 31
Land-based Finance in China . . . . . . . . . . . . . . . . . . . . . . . . . . . . . . . . . . . . . . . . . . . . . . . . . . . . . . . 32
Government Structure and Government Spending in the United States . . . . . . . . . . . . . . . . . . 33
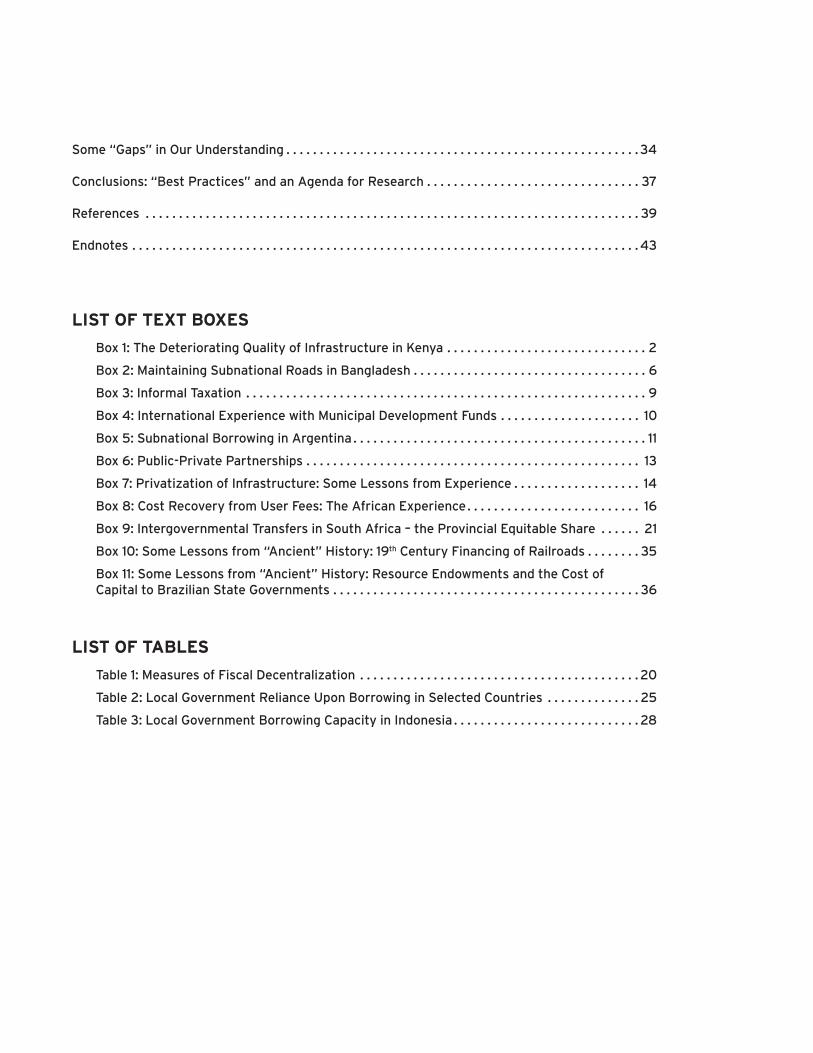
Some “Gaps” in Our Understanding . . . . . . . . . . . . . . . . . . . . . . . . . . . . . . . . . . . . . . . . . . . . . . . . . . . . . 34
Conclusions: “Best Practices” and an Agenda for Research . . . . . . . . . . . . . . . . . . . . . . . . . . . . . . . . 37
References . . . . . . . . . . . . . . . . . . . . . . . . . . . . . . . . . . . . . . . . . . . . . . . . . . . . . . . . . . . . . . . . . . . . . . . . . . 39
Endnotes . . . . . . . . . . . . . . . . . . . . . . . . . . . . . . . . . . . . . . . . . . . . . . . . . . . . . . . . . . . . . . . . . . . . . . . . . . . . 43
LIST OF TEXT BOXES
Box 1: The Deteriorating Quality of Infrastructure in Kenya . . . . . . . . . . . . . . . . . . . . . . . . . . . . . . 2
Box 2: Maintaining Subnational Roads in Bangladesh . . . . . . . . . . . . . . . . . . . . . . . . . . . . . . . . . . . 6
Box 3: Informal Taxation . . . . . . . . . . . . . . . . . . . . . . . . . . . . . . . . . . . . . . . . . . . . . . . . . . . . . . . . . . . . 9
Box 4: International Experience with Municipal Development Funds . . . . . . . . . . . . . . . . . . . . . 10
Box 5: Subnational Borrowing in Argentina . . . . . . . . . . . . . . . . . . . . . . . . . . . . . . . . . . . . . . . . . . . . 11
Box 6: Public-Private Partnerships . . . . . . . . . . . . . . . . . . . . . . . . . . . . . . . . . . . . . . . . . . . . . . . . . . 13
Box 7: Privatization of Infrastructure: Some Lessons from Experience . . . . . . . . . . . . . . . . . . . 14
Box 8: Cost Recovery from User Fees: The African Experience . . . . . . . . . . . . . . . . . . . . . . . . . . 16
Box 9: Intergovernmental Transfers in South Africa – the Provincial Equitable Share . . . . . . 21
Box 10: Some Lessons from “Ancient” History: 19th Century Financing of Railroads . . . . . . . . 35
Box 11: Some Lessons from “Ancient” History: Resource Endowments and the Cost of Capital to Brazilian State Governments . . . . . . . . . . . . . . . . . . . . . . . . . . . . . . . . . . . . . . . . . . . . . . 36
LIST OF TABLES
Table 1: Measures of Fiscal Decentralization . . . . . . . . . . . . . . . . . . . . . . . . . . . . . . . . . . . . . . . . . . 20
Table 2: Local Government Reliance Upon Borrowing in Selected Countries . . . . . . . . . . . . . . 25
Table 3: Local Government Borrowing Capacity in Indonesia . . . . . . . . . . . . . . . . . . . . . . . . . . . . 28
MUNICIPAL FINANCE OF URBAN INFRASTRUCTURE 1
MUNICIPAL FINANCE OF URBAN INFRASTRUCTUREKNOWNS AND UNKNOWNS
James Alm
INTRODUCTION: THE IMPORTANCE OF MUNICIPAL FINANCE IN PROVIDING INFRASTRUCTURE
Various trends, including an increasing emphasis
on fi scal decentralization; political democrati-
zation in many areas; globalization and the fi nancial
liberalization that often accompanies it; growing de-
mands for urban services as urbanization continues in
major cities around the world; all argue compellingly
for fi nding ways to help municipalities fi nance large-
scale infrastructure. Improved urban infrastructure,
for water supply, sanitation, urban transportation and
solid waste management is widely believed essen-
tial in encouraging and facilitating economic growth.
Evidence indicates that those countries most success-
ful in sustaining high growth supported their cities
with transformative investments to improve urban
infrastructure that could accommodate rapid popula-
tion growth in major economic centers. This evidence
suggests that infrastructure has a strong “supply-
side” orientation and in practice, it is the effects of
infrastructure on “supply” that are most often empha-
sized. There is also a strong “demand-side” aspect: in-
dividuals and businesses value the services that fl ow
from the stock of infrastructure facilities and these
demands should be (but are often not) considered in
determining the appropriate level of infrastructure
investment. In addition to the potential supply-and-de-
mand-side impacts on economic growth, the services
of infrastructure also play a signifi cant role in the dis-
tribution of income.
Although data are often limited, the extent of the
infrastructure “gap”—or the amount of additional in-
frastructure spending that is needed to provide basic
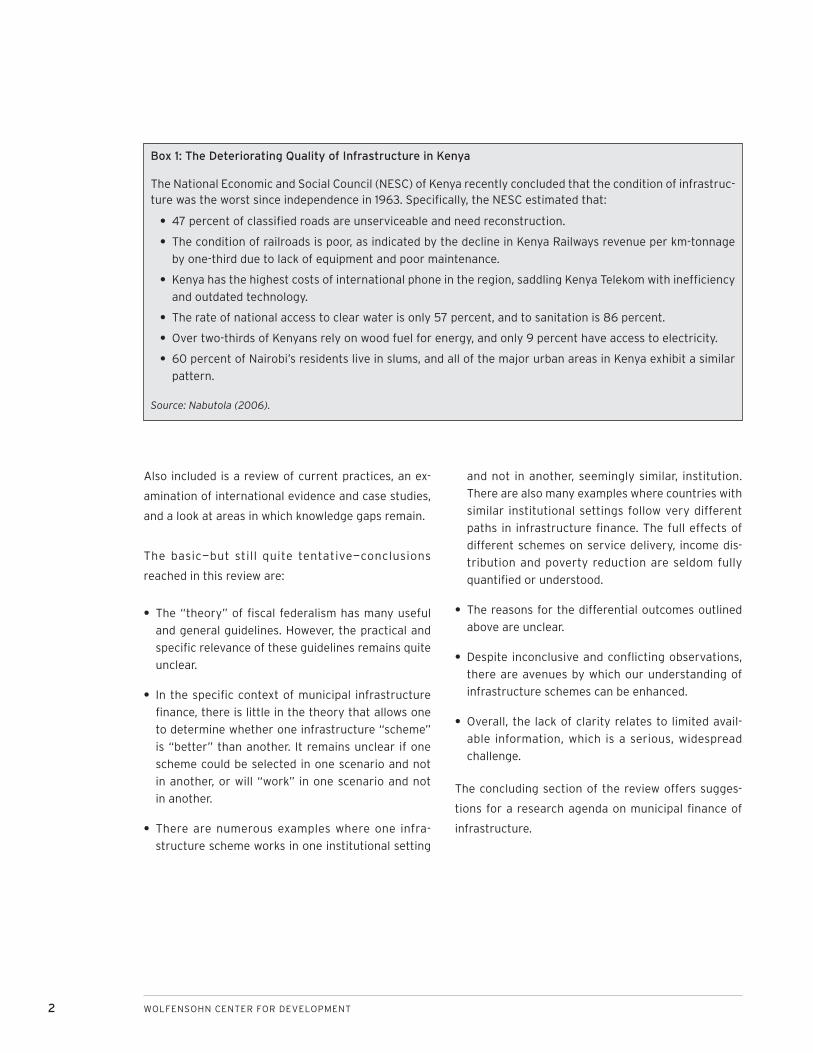
services—is enormous. See Box 1 for a discussion of
the quality of infrastructure in Kenya. The experience
there is not an isolated one.
Urban infrastructure fi nance has multiple dimensions.
This paper focuses on a limited number of these di-
mensions:
Finance for major infrastructure improvements in
major economic centers;
Finance for expansion of basic municipal services in
secondary cities and towns; and
Intergovernmental systems for financing invest-
ments with impacts beyond jurisdictional limits.
•
•
•
2 WOLFENSOHN CENTER FOR DEVELOPMENT
Also included is a review of current practices, an ex-
amination of international evidence and case studies,
and a look at areas in which knowledge gaps remain.
The basic—but still quite tentative—conclusions
reached in this review are:
The “theory” of fi scal federalism has many useful
and general guidelines. However, the practical and
specifi c relevance of these guidelines remains quite
unclear.
In the specifi c context of municipal infrastructure
fi nance, there is little in the theory that allows one
to determine whether one infrastructure “scheme”
is “better” than another. It remains unclear if one
scheme could be selected in one scenario and not
in another, or will “work” in one scenario and not
in another.
There are numerous examples where one infra-
structure scheme works in one institutional setting
•
•
•
and not in another, seemingly similar, institution.
There are also many examples where countries with
similar institutional settings follow very different
paths in infrastructure fi nance. The full effects of
different schemes on service delivery, income dis-
tribution and poverty reduction are seldom fully
quantifi ed or understood.
The reasons for the differential outcomes outlined
above are unclear.
Despite inconclusive and confl icting observations,
there are avenues by which our understanding of
infrastructure schemes can be enhanced.
Overall, the lack of clarity relates to limited avail-
able information, which is a serious, widespread
challenge.
The concluding section of the review offers sugges-
tions for a research agenda on municipal fi nance of
infrastructure.
•
•
•
Box 1: The Deteriorating Quality of Infrastructure in Kenya
The National Economic and Social Council (NESC) of Kenya recently concluded that the condition of infrastruc-ture was the worst since independence in 1963. Specifi cally, the NESC estimated that:
47 percent of classifi ed roads are unserviceable and need reconstruction.
The condition of railroads is poor, as indicated by the decline in Kenya Railways revenue per km-tonnage
by one-third due to lack of equipment and poor maintenance.
Kenya has the highest costs of international phone in the region, saddling Kenya Telekom with ineffi ciency
and outdated technology.
The rate of national access to clear water is only 57 percent, and to sanitation is 86 percent.
Over two-thirds of Kenyans rely on wood fuel for energy, and only 9 percent have access to electricity.
60 percent of Nairobi’s residents live in slums, and all of the major urban areas in Kenya exhibit a similar
pattern.
Source: Nabutola (2006).
•
•
•
•
•
•
MUNICIPAL FINANCE OF URBAN INFRASTRUCTURE 3
DIMENSIONS OF URBAN INFRASTRUCTURE
It is useful at the start to be precise on what exactly
is meant by “infrastructure.” For purposes here,
infrastructure will be taken to mean long-lived capital
facilities used in providing certain types of services
to households and also in providing services that
enhance private sector production. “Infrastructure”
therefore includes services from water systems, solid
waste management, sewer systems, power generating
plants, roads, mass transportation, electricity
generation, and telecommunications.
Note that this definition focuses on the role of in-
frastructure in household consumption (e.g., water
systems) and in business production (e.g., electricity
generation). Infrastructure has an essential role in
both dimensions. Note also that this defi nition em-
phasizes both the fl ow of services from the physical
facility and the stock of capital that actually gener-
ates the service fl ow. As noted by Fox (1994), there
are two major advantages to focusing on the service
fl ow rather than (exclusively) on the capital stock. One
is that policymakers are more likely to think fl exibly
about the best technology for producing the service.
For example, policymakers may conclude that encour-
aging public group transportation, such as jeepneys
in the Philippines and matatu buses in Kenya, is a
better solution to transportation needs than build-
ing roads or constructing mass transit systems. Also,
policymakers are more likely to focus on providing the
specifi c services that people demand instead of look-
ing at engineering designs for infrastructure facilities.
Note fi nally that this defi nition does not distinguish
between public versus private infrastructure. If one
considers separately the various functions of plan-
ning, fi nance, construction, ownership, operation, and
maintenance of infrastructure, then it is not necessary
for the public sector to be the sole actor in all of these
functions; that is, there can clearly be a combined role
for the public, the private, and even the not-for-profi t
sectors in providing “infrastructure” and its associ-
ated services.
4 WOLFENSOHN CENTER FOR DEVELOPMENT
INFRASTRUCTURE IN “THEORY” AND IN PRACTICE: DECENTRALIZATION AND THE SUBSIDIARITY PRINCIPLE
The Theory and Rationale of Infra-structure Finance
In a “perfect” world, the provision of urban infra-
structure—indeed, the provision of most any local
government service—would be a simple process, and
would involve the following basic considerations:
Determine whether the project is justifi ed, by con-
ducting a standard social benefi t-cost analysis;
Given the long-lived nature of the capital facilities,
borrow the funds necessary to fi nance the initial
infrastructure cost; and
Finance the ongoing operations and maintenance
expenditures via user costs or other local sources
of revenues.
Indeed, the outcome of this process would refl ect the
basic, underlying rationale for fi scal decentralization
generally and for municipal provision of capital proj-
ects specifi cally: the so-called Subsidiarity Principle of
Oates (1972, 1993, 1999) and others, also sometimes
referred to as the “Decentralization Theorem.” This
principle states that government services should be
provided by the lowest level of government that can
do so efficiently. When tastes, incomes, and needs
differ across regions, local governments will be in the
best position to determine the expenditure priorities
of its citizens, and assigning responsibilities to the
lowest level of government allows government ser-
vices to be adapted more closely to the specifi c de-
mands of local citizens. The existence of multiple local
jurisdictions also gives individuals the opportunity to
“vote with their feet” by moving to the jurisdiction
•
•
•
that best meets their demands for the appropriate
mix of public services and taxes (Tiebout, 1956), at
least when mobility exists. Relatedly, when local gov-
ernments are assigned expenditure responsibilities,
they should bear the costs of fi nancing those expendi-
tures because only then will they balance the benefi ts
of public goods with the costs. In this regard, McLure
(2006) has more recently suggested a revenue-side
corollary to the Subsidiarity Principle, which extends
subsidiarity from expenditure to tax assignments:
taxes should be assigned to the lowest level of govern-
ment that can collect the tax effi ciently.1
International experience has shown repeatedly that
these general guidelines, while useful in highlighting
the main types of considerations, are often applied
quite differently, if at all, in different countries; that
is, there is no single “best” expenditure (and rev-
enue) assignment. Even so, this experience has also
shown that it is important to have a clear and stable
assignment across governments, in which the respon-
sibilities of each level of government are clear and un-
ambiguous and in which a mechanism exists both to
coordinate provision and to resolve potential confl icts.
It is especially important to follow, where possible, the
Subsidiarity Principle in the assignment of the alloca-
tive function of government. Failure to follow these
general principles typically has lead to underprovision
of government services.2 Details of revenue assign-
ment and transfer design are discussed later.
Of course, the conditions under which decentraliza-
tion actually “works” at the local government level are
quite stringent, and include such conditions as:
There must be a popularly elected local council;
There must be locally appointed chief offi cials;
There must be a locally approved budget;
•
•
•
MUNICIPAL FINANCE OF URBAN INFRASTRUCTURE 5
There must be an absence of central government
mandates on local government decisions on em-
ployment and salaries;
There must be a clear expenditure assignment;
Local governments must be able to exert at least
some control on the level of at least some revenue
sources;
Local governments must have some powers to bor-
row;
The must be a transparent grant system, in which
local governments are able to understand their
grant entitlements;
Local governments must have the capacity to col-
lect taxes;
Local governments must have the capacity to de-
liver services effi ciently;
Local governments must have the capacity to keep
adequate books of account; and
The central government must have the ability to
monitor the behaviors of local governments.
These conditions help ensure that local government is
responsive to the demands of local citizens. However,
these conditions are seldom if ever met, especially in
developing countries (Bahl, 1999).
In the context here, if local governments are to be
given more independence in their expenditure (and
tax) decisions, then such independence should extend
to their responsibility for execution of the planning,
fi nancing, constructing, operating, and maintaining
of all capital projects in the relevant areas that have
been assigned to them; that is, the assignment of
capital expenditure responsibilities should follow the
same criteria as the assignment of recurrent expendi-
ture responsibilities, and for largely the same reasons.
Assigning capital expenditure responsibilities to the
•
•
•
•
•
•
•
•
•
lowest level of government that can handle them ef-
fi ciently will improve the effi ciency of service delivery
by making these governments more accountable to
their citizens, subject of course to the same condi-
tions identifi ed earlier.
Indeed, such independence should extend even to lo-
cal government use of borrowing. In principle, local
government borrowing can provide signifi cant ben-
efi ts, benefi ts that follow directly and immediately
from the application of the Subsidiarity Principle to
capital projects. As noted earlier, this principle re-
quires that the responsibility for government services
should lie with the lowest level of government whose
jurisdiction matches the benefi t area of the service.
There is no reason why this principle should not apply
to the services that fl ow from capital projects, just as
the principle applies to current expenditures. Further,
local government borrowing allows the government
to align more closely current expenditures with cur-
rent receipts, an especially important consideration
in the face of temporary and unexpected fl uctuations
in revenues. Finally, given the lumpy nature of invest-
ment projects, requiring that they be fi nanced out of
current revenues is likely to be ineffi cient and inequi-
table, since both current and future generations will
benefi t from capital projects that last multiple years.
In sum, the Subsidiarity Principle suggests that local
governments should be responsible for the full range
of duties associated with capital projects: planning, fi -
nancing, constructing, operating, and maintaining.
It is certainly the case that local government borrow-
ing has sometimes created, or at least contributed to,
signifi cant problems.3 These diffi culties are discussed
in more detail later.
However, the failure to allow local governments to
borrow can also lead to problems. When local govern-
6 WOLFENSOHN CENTER FOR DEVELOPMENT
ments have no responsibility for the facilities, then
they may fi nd it advantageous to scrimp on mainte-
nance expenditures, believing that the central govern-
ment will replace existing facilities. Put differently, if
municipal governments do not feel “ownership” of
their capital facilities, then there is a “moral hazard”
problem because it is unlikely that they will choose to
invest resources in maintaining them. It is well known
in public budgeting and fi scal management that re-
placement costs are typically a large multiple of funds
required for maintenance and even basic rehabilita-
tion (Willoughby, 2000). See Box 2.
What Can Go Wrong?
However, as noted, this “perfect” and “simple” sce-
nario of infrastructure finance never exists. Even
aside from the failure of the various conditions for de-
centralization to be satisfi ed, what can go wrong?
An obvious problem lies in diffi culties in conducting
benefi t-cost analysis of the proposed infrastructure
project. The presence of multiple objectives (e.g.,
income distribution, correction of externalities, pro-
vision of public goods, equal access to services, incor-
poration of civil society organizations) often clouds
the estimates. It is difficult to estimate the social
benefi ts of services that generate in part, say, positive
externalities or that redistribute income. The demand
for the public services fi nanced by infrastructure may
be diffi cult to estimate because of the lack of true lo-
cal accountability; that is, there may not an accurate
demand-revealing process that operates via the politi-
cal process. There may be uncertainty about demand
for services, both now and in the future, which makes
estimation of the willingness to pay for services dif-
fi cult. There may also be uncertainty about costs of
service provision (e.g., exchange risk), and uncertainty
about the appropriate discount rate to apply in the
analysis.
Of perhaps more consequence, another problem
stems from diffi culties in generating borrowed funds
for initial infrastructure costs via municipal govern-
ment access to capital markets. In most countries, mu-
nicipal government access to credit markets is quite
Box 2: Maintaining Subnational Roads in Bangladesh
As part of a USAID-fi nanced project in the early 1980s to construct roads in mainly rural areas of Bangladesh by the Local Government Engineering Department (LGED) of the Ministry of Interior and Local Government, a team of economists was also asked to examine the revenue-generating abilities of local governments. The intention of this part of the overall “Zila Roads Maintenance Project” was to improve the capacity of local governments to generate the revenues necessary to maintain the roads. Otherwise, poorly maintained roads would quickly be eroded when the monsoons hit. However, the roads were being built with very little input from the local governments who would be given maintenance responsibilities. As a result, the local governments felt little ownership of the roads and so felt little incentive to maintain the roads that were being given them because they had little at stake in the road construction. Despite the identifi cation by the project of various means of increasing local government revenue mobilization, the local governments devoted little effort to road maintenance, and many of the constructed roads quickly deteriorated. Sometime later, virtually the same scenario was repeated on a World Bank project to build municipal infrastructure, and for the same reasons.
Source: Alm and Martinez-Vazquez (1997).
MUNICIPAL FINANCE OF URBAN INFRASTRUCTURE 7
limited. In part this lack of access is due to the non-ex-
istence of local government credit markets. However,
even where these markets exist, there is seldom use-
ful and reliable information on the “creditworthiness”
of local governments, via such common devices in
developed countries of a bond-rating system. There is
frequently a lack of transparency in municipal govern-
ment operations that contributes to this.
A fi nal problem arises due to diffi culties in generating
revenues for ongoing operations and maintenance ex-
penditures. In very few developing countries is there a
consistent pattern of effi cient cost recovery via user
fees. There is typically a higher ongoing cost of opera-
tions and maintenance due to municipal government
ineffi ciency, including corruption and incompetence
of local government offi cials. The record of municipal
governments I collecting tax revenues from “regular”
sources of revenues is also quite mixed. The ability to
generate signifi cant amounts of revenues from “inno-
vative” sources of revenues, including municipal gov-
ernment “assets” (e.g., land) is also limited.
In the face of these types of diffi culties with municipal
government provision of infrastructure, other op-
tions are often suggested, including public-private
partnerships, complete privatization, or privatization
combined with government regulation, as preferred
options for provision of infrastructure services. These
options are discussed later.
The remainder of the paper discusses the various
ways in which municipal governments may act to pro-
vide infrastructure.
8 WOLFENSOHN CENTER FOR DEVELOPMENT
POTENTIAL SOURCES OF MUNICIPAL FINANCE FOR CAPITAL PROJECTS
Municipal governments have many potential
sources of revenues to fi nance the initial con-
struction of capital facilities and also to pay for the
operation and maintenance of infrastructure projects.
These include:
Municipal government borrowing from private capi-
tal markets via bond issuance;
Municipal government borrowing from specialized
fi nancial institutions/intermediaries;
Taxes4;
User fees;
Land- and Asset-based sources:
•
•
•
•
•
Impact fees and development charges (e.g., de-
veloper extractions);
Betterment levies (e.g., land value capture
taxes);
Use of municipal “assets” (e.g., land); and
Tax increment fi nancing
Central government fi nance via intergovernmental
transfers; and
International donors.
These sources can be broadly classified into three
main categories: borrowing, municipal own-source
revenues (e.g., taxes and user fees), and transfers. Of
these, some are better suited for the initial fi nance of
infrastructure and some for the operation and main-
tenance of existing facilities, as discussed in the next
section.
°
°
°
°
•
•
MUNICIPAL FINANCE OF URBAN INFRASTRUCTURE 9
IDENTIFYING “EFFICIENT FINANCING” OF INFRASTRUCTURE
It is useful in the following discussion to distinguish
between the one-time fi nance of initial capital in-
vestments and the on-going fi nance of operation and
maintenance expenditures. Each dimension is dis-
cussed in turn.
One especially novel method that does not fi t easily
into any category is “informal taxation.”
See Box 3 for a discussion of this little-examined
method of fi nance.
Initial Capital InvestmentsMunicipal Government BorrowingMunicipal governments in most all countries are un-
able to fi nance initial capital investments from current
savings, and municipal borrowing is the obvious and
preferred source of fi nancing for these investments.
Borrowing allows local governments to better match
current expenditures with current tax revenues, allow-
ing temporary and unexpected swings in revenues to
be smoothed without undue disruption in service pro-
vision. Borrowing allows local governments to fi nance
public capital projects that are lumpy in nature, and
to shift some of the burden of fi nance to future gen-
erations that will benefi t from durable and long-lived
projects. Most importantly, borrowing allows local
governments to construct facilities that more closely
refl ect the demands of its citizens, thereby moving
government “closer to the people.”
In practice, there are two main types of borrowing
fi nance. One source comes from direct municipal ac-
cess to capital markets via the municipal government
issue of bonds. Bond issue as the main source of long
term capital investments by municipalities is unlikely
to play a signifi cant role given the absence of capital
markets for which local governments have meaning-
ful access. Bond issue is especially unlikely for smaller
local governments.
A second source, and one that addresses to some ex-
tent municipal government access to capital markets,
is borrowing from specialized fi nancial institutions. It
is common in many European countries to create a
fi nancial intermediary (or a fi nancial intermediation
program) that allows all local governments to bor-
row conditional upon designated banking criteria.
One advantage of this approach is that these fi nan-
Box 3: Informal Taxation
“Informal taxation” refers to contributions made by local residents outside the formal tax system to the
construction and maintenance of local public goods, payments that are coordinated by public offi cials but
enforced largely through social customs and norms. In fact, individuals in many communities throughout the
developing contribute substantially local public goods such as roads and water systems, both in money and
labor, with often complex arrangements determining how much each household should pay and what penal-
ties apply for those who free ride. These systems are called by many different names, such as gotong royong
in Indonesia and harambee in Kenya. These informal payments can be quite large; they are often regressive in
their pattern of incidence; and their form differs signifi cantly across countries.
Source: Olken and Singhal (2009).
10 WOLFENSOHN CENTER FOR DEVELOPMENT
cial intermediaries can reduce the cost of borrowing
for smaller local governments by spreading the risks
across many governments, a practice that lowers the
average costs of borrowing. Also, it may be possible
to combine technical development assistance with
lending assistance. A fi nancial intermediary may also
facilitate central government intervention through
its supply of targeted investment funds. However,
there are risks of a fi nancial intermediation program.
The program may be susceptible to political biases,
abuses, and corruption. There has also often been a
tendency for the central government to comingle a
range of objectives with what should be strict lending
criteria of a fi nancial intermediary. See Box 4 for some
international experiences with these types of funds.
In either case, there needs to be appropriate central
government oversight and regulation of municipal
borrowing activities, in order to ensure that stan-
dard loan practices are met. The framework should,
among other things: allow subnational governments
to borrow and issue bonds only for capital invest-
ment purposes; specify the sources of borrowing (e.g.,
domestic financial institutions, special investment
banks, and the like); require that the maturity of the
loan match the project life; specify that subnational
debt remains the responsibility of the subnational
government (and not the central government); allow
subnational governments to offer as guarantee for
repayment the revenues generated from the project
(a common practice in many developed countries); im-
pose some limit on total indebtedness; require central
government prior approval; and specify penalties for
failure to meet debt obligations. It is especially impor-
tant that the central government oversight should not
extend to central government guarantor of municipal
bond issues. Details of various regulatory schemes are
discussed later.
Box 4: International Experience with Municipal Development Funds
In many western European countries, and now in many countries in Asia, Africa, and Latin America, there are
specifi c institutions that have been established to allow subnational government borrowing for investment
purposes. These institutions are sometimes called a municipal development fund (MDF); the management of
a MDF is typically assigned to banks or government regulatory agencies, which are referred to as a municipal
development intermediary (MDI). A municipal development fund is a pool of money operated at a level above
individual subnational governments that is available to the subnational government for investment purposes.
The main objective of these pools of funds to mobilize resources from private lenders, the central government,
and donor agencies, and to make these resources available for investment in urban infrastructure. Another
objective is to provide assistance to subnational governments in the design, appraisal, and execution of invest-
ment programs. There are different approaches around the world in the management of these funds. There
are also different sources of initial funding, including initial subscriptions from the central government, private
lenders (including other fi nancial institutions, insurance companies, and pension funds), and international do-
nors. MDFs typically lend to local governments at preferential rates for long-term investments; in some cases,
there are elements of grants to local governments (e.g., conditional matching grants or conditional block
grants). Eligibility is often unrestricted, although limits on loan amounts are common, especially for larger
subnational governments. Loans require subnational governments to meet various criteria, especially on debt
service ratios. Indeed, assessing debt service capacity remains a diffi cult consideration in the management of
MDFs.
Source: Davey (1988).
MUNICIPAL FINANCE OF URBAN INFRASTRUCTURE 11
However, municipal government borrowing has also
often created problems of various types.5 First, the
granting of preferential borrowing terms to local
governments may create “moral hazard” problems
in which local governments borrow more than is eco-
nomically justifi ed. Second and relatedly, local gov-
ernments—and lenders—may believe that the central
government will assume responsibility for any loans
that the local governments are unable to repay, again
creating a moral hazard problem that encourages
lenders to make excessive loans to local governments
and that also encourages local governments to borrow
excessively. These actions impose largely unplanned
and uncontrollable fi nancial burdens on the central
government that complicate overall macroeconomic
stabilization policies. Indeed, there is much evidence
that decentralization of local government borrowing
has contributed to stabilization problems in countries
like Brazil, China, and Colombia. See Box 5 for a dis-
cussion of the recent Argentina experience.
These types of diffi culties have led analysts to sug-
gest ways in which municipal government borrow-
ing can be more effi ciently organized and regulated.
International experience with municipal government
borrowing provides some specifi c suggestions on con-
trols. See Ter-Minassian (1996) and Ter-Minassian and
Craig (1997) for detailed discussions. The most impor-
Box 5: Subnational Borrowing in Argentina
Argentina is divided into 24 autonomous political jurisdictions consisting of 23 provinces and the City of
Buenos Aires. With approximately 50 percent of total public spending occurring at the sub-national level, it is
the most decentralized country in Latin America. At the same time, the most important taxes are collected at
the national level, which implies a signifi cant degree of vertical imbalance. However, within Argentina’s federal
structure all levels of government are generally permitted to borrow both domestically and abroad, and during
the 1980s and 1990s both levels of government borrowed extensively, refl ecting the weak fi scal management
of the period. Given especially the lack of formal limitations on domestic currency borrowing operations, pro-
vincial governments have frequently pledged future coparticipation receipts as collateral for borrowing from
commercial banks; in addition, they sometimes developed alternative sources of fi nancing. These practices
led eventually to the jurisdictions running unsustainable fi scal policies that often brought the provinces to the
brink of bankruptcy. The exact time when the province entered into a serious fi scal crisis was in some episodes
prompted by the occurrence of exogenous shocks in the economy, as was the case with the Tequila crisis in
1995. In this instance, the intervention of the federal government nationalizing the provincial pension systems
and also in the case of Cordoba was mainly accelerated by the effect of the Tequila shock on those provinces’
fi nances of those provinces. On other occasions, the provinces’ fi scal distress was associated with an acute po-
litical crisis, which in turn motivated fi nancial and political intervention by the federal government. In general,
however, the federal government did not set up extensive and generous rescue operations. They were more a
case-by-case-type solution. Using these mechanisms and negotiations, the federal government tried to obtain
some benefi ts (such as provincial adjustment, reforms) in exchange for the fi nancial help it extended. Even
though the central authorities showed generosity toward some small and poor jurisdictions, federal support
for other provinces, most notably large provinces such as Cordoba, was much less, and in the latter instances
the province itself bore most of the cost of adjustment.
Source: Nicolini, Posadas, Sanguinetti, Sanguinetti, and Tommas (2002).
12 WOLFENSOHN CENTER FOR DEVELOPMENT
tant elements of any regulatory framework include:
transparency via information and accounting systems,
penalties for excessive borrowing, local government
access to own-source revenues, and, especially, local
government accountability via the political process.
Intergovernmental Transfers for Infra-structure Finance: Capital GrantsAnother potential source of initial investment fi nance
(as well as ongoing operation and maintenance fi-
nance) is intergovernmental transfers. Transfers are
typically justifi ed on several grounds:
To correct for vertical imbalances (e.g., between the
national and the subnational governments);
To correct for horizontal imbalances (e.g., between
the subnational governments);
To accommodate political differences and consid-
erations;
To correct for externalities; and
To achieve national objectives pursued at subna-
tional levels.
All of these rationales can, in principle, be used to
justify transfers that fi nance municipal infrastructure.
Specifi cally, capital transfers can be used to assist
in fi nancing “lumpy” capital investments (e.g., verti-
cal and horizontal imbalances), to offset signifi cantly
different infrastructure endowments (at least when
these are not the result of voluntary local decisions
(e.g., imbalances again), to address externalities
across subnational governments, and to pursue na-
tional sectoral objectives at subnational levels.
Capital transfers are typically designed as project-
based grants, which are closely administered and
monitored by central government line ministries.
These transfers are also typically allocated in the
•
•
•
•
•
form of categorical or block grants, often on the ba-
sis of ad hoc decisions and negotiations between the
central and the subnational governments. Sometimes
there is a pre-established formula used to determine
the amount of the transfer, such as the number of
“clients” for a governmental service (e.g., students in
construction of schools, patients in the construction
of hospitals, cars in the construction of roads). There
is also sometimes some type of competition process
with defined application procedures, although this
process may be subject to manipulation.
An important concern in capital transfers is how to
achieve “additionality,” or maintenance of effort on
the part of recipient governments. Transfers are al-
most always given as conditional grants, but funds
are obviously fungible. Another concern is whether
local governments will actually take “ownership” of
the facility once it is constructed and maintain the
infrastructure, given that the bulk of the funds used
in construction usually come from the central govern-
ment. See again Box 2.
Capital transfers—indeed, any intergovernmental
transfer—carry with them significant institutional
burdens and requirements. An overriding issue is
the constraint on design and evaluation imposed by
data availability. The allocation of most transfers is
based on detailed formulae, all of which require de-
tailed information that is often not available. Alm and
Martinez-Vazquez (2009) discuss how transfers can
be designed in a world with imperfect data. Even so,
it is important to improve data collection. Relatedly,
intergovernmental transfers require a strong cen-
tral government ability to monitor the actual use of
grants, as well as to monitor the performance of the
grants; this also requires data upon which these evalu-
ations are based. Many countries have chosen to use a
special, independent “grants commission” to adminis-
MUNICIPAL FINANCE OF URBAN INFRASTRUCTURE 13
ter its transfer, in order to remove as much as possible
the role of politics in grant design and allocation.
Overall, international experience suggests that there
is no single best approach to design capital transfers.
However, non-transparent, highly detailed and discre-
tionary procedures should be avoided, and matching
requirements in capital transfers can generate many
benefi ts.
Further considerations in transfer design are dis-
cussed later.
Public-private PartnershipsPublic-private partnerships, also sometimes referred
to as private participation in infrastructure (PPI), have
been seen as a way to provide infrastructure without
imposing an excessive fi scal burden on municipal gov-
ernments. However, this potential has not frequently
been realized. See Box 6.
PrivatizationIndeed, one method of achieving greater private sec-
tor involvement is to privatize completely the service
to the private sector. This option is often viewed as a
means for lowering costs by encouraging competition.
It is also viewed as a way to minimize the fi nancial bur-
den that service provision would impose on municipal
governments, and as a way of improving service qual-
ity. However, the record of privatization is mixed. See
Box 7.
Land- and Asset-based Sources of Fi-nanceMunicipal governments often have access to various
“assets,” especially urban land, which the govern-
ments believe can be used to help fi nance infrastruc-
ture. As classified by Peterson (2008), land-based
fi nancing may be classifi ed in three main categories:
developer exactions (including impact fees), value
capture, and land asset management. Such methods
have been used with some success in Cairo, Mumbai,
Bangalore, Istanbul, Cape Town, and Bogota.
With developer exactions, developers are required
to fi nance some or all of the infrastructure that new
developments impose on local governments, such as
roads, water and power delivery, and sewage treat-
ment. In the United States, such developer exactions
are often called impact fees, and are a commonly used
method of infrastructure fi nance, especially in Florida,
Colorado, and California. This method is consistent
Box 6: Public-Private Partnerships
The intense fi scal pressures in many developing countries have made the prospect of shifting investment re-
sponsibility to private infrastructure providers an attractive alternative to public sector provision, by offering
the possibility of expanded and improved services without further burdening the government sector with ad-
ditional fi scal demands. However, the general experience of these public-private partnerships has been disap-
pointing, and they have played a far less signifi cant role in fi nancing infrastructure in cities than was hoped for.
In particular, these partnerships have mobilized little private fi nance, for various practical, political, economic
and institutional reasons. Indeed, these partnerships seem unlikely to eliminate, or even to reduce, the various
constraints that these factors impose, in part because there are a number of features that raise the risk profi le
for of urban infrastructure for private investors, factors that are outside the control of many cities, factors that
are unlikely to change.
Source: Annez (2006).
14 WOLFENSOHN CENTER FOR DEVELOPMENT
Box 7: Privatization of Infrastructure: Some Lessons from Experience
Privatization is often viewed as a means for lowering costs by encouraging competition. The presumption is
that public sector producers have poor incentives for effi cient operation because they lack pressure to oper-
ate at the lowest cost. The private sector, on the other hand, is presumed to be subject to competitive forces.
However, the public sector does not always have poor incentives and the private sector does not always face
competitive pressures, so benefi ts do not always result from privatization.
Urban transit is an area in which private production can lower cost. Public bus systems often require large
subsidies because of high operating costs. In the 1990s, the system in Karachi received a $5 million annual
subsidy, the system in Calcutta a $10 million subsidy, and the system in Bangkok a $30 million subsidy. On the
other hand, the private sector Seoul system, which had 90 operating bus companies, received no subsidy.
Private minibus systems have proven very effective in many cities. Some public bus systems, such as the one
in Bombay, also operate without a subsidy. Some urban water supply activities in Chile, solid waste disposal
and collection in Brazil, and intracity transportation in Nairobi are examples of effective private production of
services.
Even if privatization appears benefi cial, the public sector will typically be required to maintain a role in provid-
ing most infrastructure. One reason is that the private sector does not adequately provide for externalities,
such as sewerage, dams, and roads, unless government fi nancing is involved because of inability to charge
user fees suffi cient to fi nance the services. Also, some infrastructure services may be characterized by large
economies of scale in production or distribution. The government may need to be involved in establishing a
pricing scheme or subsidizing the service to move toward universal service. The government may also need to
participate, at least in fi nancing, if provision of infrastructure services is to be used as a way of redistributing
income. Finally, the government may be required to regulate privatized fi rms, through regulation of service
quality and of prices.
A key to obtaining the benefi ts of privatization is to encourage competitive market pressures. Neither govern-
ment production nor close regulation may be necessary if the market is contestable. In many cases the private
market may not exist in developing countries, and needs to be encouraged to evolve. Also, competition can
be generated by allowing foreign fi rms to compete. Belize and Guatemala permitted foreign fi rms to compete
for road maintenance because no signifi cant domestic market existed. Government should seek to gain the
benefi ts of competitive market for service delivery by identifying aspects of infrastructure delivery that are
contestable and allowing the private sector to compete for these portions of service delivery, by allowing all
private fi rms equal access to shared infrastructure facilities (e.g., telephone and railroad lines), and by permit-
ting private sector alternatives that compete with infrastructure services.
Sources: Fox (1994) and Guthrie (2006).
with the notion that existing residents of a munici-
pality should not be required to pay for the costs of
infrastructure required by new residents; that is, “de-
velopment should pay its own way,” and the new resi-
dents are (in the absence of such charges) not paying
the full social costs of their activities. The obvious
remedy is to impose an additional charge on new resi-
dential and commercial/industrial construction that
MUNICIPAL FINANCE OF URBAN INFRASTRUCTURE 15
refl ects these added social costs. If, when faced with
the true social costs of their actions, individuals and
businesses believe that their own benefi ts are greater
than the costs of their actions, then such growth is
economically desirable and should not be further lim-
ited or controlled; if individuals and businesses believe
that the costs are greater than the benefi ts, then it
is appropriate that such growth be discouraged. It is
mainly this argument that underlies the increasingly
popular use of impact (or development) fees in locali-
ties across the United States. Of course, an additional
argument for impact fees is that they may generate
the revenues necessary to provide the infrastructure.
The main diffi culty in the practical application of de-
veloper exactions is the actual calculation of the fee.
In principle, the fee should measure the incremental
costs of new construction, including infrastructure
costs and also congestion costs. The calculation of the
latter costs is particularly diffi cult. Although develop-
ers often oppose impact fees, experience indicates
that developers in fact typically prefer impact fees to
other methods of growth controls (e.g., zoning, regula-
tions, outright growth limitations), primarily because
they are far less complicated and much more certain.
Another method is land value capture. The provision
of infrastructure is typically capitalized in land and
housing values, and the notion here is that the local
government should be able to appropriate some of
this increase in value. Various methods have been
used to capture the increases in value, especially bet-
terment levies (which tax some percentage of the
increase value via a one-time charge) and sale of land
whose value has increased from the infrastructure.
Betterment levies were used with some success in
Colombia in the past, but difficulties in accurately
assessing increases in values have proven diffi cult.
China has more recently used land sales.
A final method is land asset management, where
municipal governments exchange land assets for in-
frastructure assets. Cairo has used several variants
of this approach to generate close to $5 billion in
revenues.
Peterson (2008) argues that all three methods should
be part of an infrastructure strategy of municipal gov-
ernments: municipalities should fi rst conduct a thor-
ough inventory of land and other assets, they should
then use developer exactions for partial fi nance of
infrastructure, and they should fi nally use value cap-
ture to generate additional revenues to fi ll in specifi c
gaps.
Ongoing Operation and Maintenance ExpensesUser Fees as the “Ideal” SourceUser fees are widely seen as the most appropriate
source of revenues for operation and maintenance
expenses. If set at marginal cost of service provision,
user fees can generate the revenues necessary to pay
for ongoing variable costs of service provision. In ad-
dition, if set at appropriate levels, user fees can serve
the same basic function as market prices for market
commodities, as an indicator of consumer willingness
to pay for services. More generally, it is typically rec-
ommended that local governments should rely pre-
dominately upon user charges to fi nance goods that
provide measurable benefi ts to identifi able individuals
within a single jurisdiction.
However, the actual extent of cost recovery via user
fees is almost everywhere quite poor. Various reasons
have been suggested for this failure. See Box 8 for ex-
amples from Africa.
16 WOLFENSOHN CENTER FOR DEVELOPMENT
Municipal Tax Revenues Municipal governments can also fi nance infrastruc-
ture-related expenses from tax revenues. Although
there is much diversity in the fi scal structures of na-
tional and subnational governments, several general
“best practices” have emerged that provide a useful
point of departure (Musgrave, 1983; McLure, 1994,
2006; Bird, 1999; Bahl and Bird, 2008):
The Subsidiarity Principle should be applied to taxes
as well as to expenditures: taxes should be assigned
to the lowest level of government that can adminis-
ter the tax effi ciently, and for similar reasons.
Local governments should rely predominately
taxes, and taxes on immobile tax bases, to fi nance
local services for which it is diffi cult to identify indi-
vidual benefi ciaries and to measure individual costs
and benefi ts.
Local governments should rely predominately upon
user charges to fi nance goods that provide measur-
able benefi ts to identifi able individuals within the
jurisdiction.
Local governments should avoid taxes on mobile
tax bases, especially capital, and should also avoid
imposing progressive income taxes. Local govern-
ment attempts to redistribute income by progres-
•
•
•
•
sive income taxes will lead to the out-migration of
more mobile, higher income individuals, thereby
leaving more immobile, lower income individuals to
bear the burden of the taxes. As with progressive
income taxes, the potential mobility of capital or
other mobile factors of production will lead to out-
migration if these factors are taxed at higher-than-
average tax rates. By the same token, attempts to
induce in-migration of mobile factors can lead to
the so-called “race to the bottom,” as local govern-
ments compete with each to attract and to hold
these factors by extending tax breaks and other fi s-
cal incentives.
Local governments should be assigned adequate
sources of revenues consistent with their expen-
diture responsibilities. Local governments should
have discretion over the rate of some taxes to pro-
mote accountability of local offi cials and to estab-
lish a link between services demanded and the cost
of service provision. Locally assigned taxes should
exhibit adequate revenue elasticity so that collec-
tions can grow with the demand of services over
time. The assignment of taxes should also meet the
test of administrative feasibility.
Intergovernmental transfers should be used to fi -
nance those services that generate spillovers to
nearby jurisdictions, since strictly local fi nance will
lead to inefficient provision. The central govern-
•
•
Box 8: Cost Recovery from User Fees: The African Experience
Although data are often poor or even non-existent, the limited evidence that is available indicates that African
countries typically do not charge for public services – for water supply, sewerage, electricity, telecommunica-
tions, markets, housing, public transport, and land development – to the extent that is consistent with enhanc-
ing economic effi ciency and providing adequate revenues for service delivery. Prices are often charged for
services, in areas and sectors as diverse as: public toilets in Accra, Ghana; water delivery in Lagos, Nigeria,
Mombasa and Nairobi, Kenya; public utilities in Francistown, Botswana; and sanitation in Kitwe and Lusaka,
Zambia. However, with some exceptions, these prices are invariably subsidized at levels well below marginal
cost. Problems include inadequate billing and collection procedures, insuffi cient attention to operations and
maintenance, and political constraints.
Source: Fox and Edmiston (2000).
MUNICIPAL FINANCE OF URBAN INFRASTRUCTURE 17
ment should impose taxes on those tax bases that
are distributed unequally across jurisdictions, and
use the revenues from these taxes to equalize fi scal
capacities across these areas.
(Recall that borrowing should be used to fi nance long-
lived capital investments on infrastructure.) In short, a
“good” municipal tax system should not unduly distort
individual and fi rm decisions, should generate suffi -
cient revenues to allow the government to fi nance at
the margin their expenditures, and should burden only
local residents.6
The broad pattern of municipal finance in cities
around the world is consistent with some, but seldom
all, of these principles. Indeed, there is much diversity
in the fiscal structures of municipal governments.
Despite enormous efforts made over the years on tax
assignment issues, Bahl and Bird (2008) argue that
there is still no general consensus about what works
and what does not.
Around the world there are essentially two basic
models of revenue assignment that attempt to satisfy
these principles. In what might be called the Western
or Anglo-Saxon model of “fi scally strong local govern-
ments” (e.g., the United States, Canada, Australia),
local governments independently legislate and ad-
minister their own taxes, an approach that obviously
gives local governments signifi cant fi scal autonomy
and adequacy. However, this model is probably not ap-
propriate for many countries. Instead, in many other
countries the model is one of “fi scally weak local gov-
ernments” that do not generate much revenue from
their own sources, that do not independently legislate
and administer their own taxes, but that are often al-
lowed to add a local tax onto the back of some existing
central government tax. This approach is often and
increasingly used as part of decentralization reforms
around the world (Bahl and Linn, 1992).
It is useful to discuss in more detail the major types of
taxes that are used by many local governments, since
this discussion relates directly to the often limited
ability of municipal governments to generate funds
for infrastructure.
Although there is much diversity in country experi-
ences, the property tax is a common and important
tax for municipal governments, especially those in the
Western or Anglo-Saxon tradition. The property tax
is in many ways an attractive revenue source. If mea-
sured properly, its base should increase with urban
growth. Because property can be assessed by physical
inspection, the tax is diffi cult to evade. There is much
evidence that the tax has at least a proportional and
often a progressive effect upon the distribution of in-
come. The tax is unlikely to create serious distortions
in land markets, and may in some circumstances ac-
tually improve the effi ciency of resource use. Finally,
it is sometimes argued that the property tax is most
appropriately administered at the local government
level because offi cials there have a better motivation
to collect the tax and because the tax can be viewed
in part as payment for local services (especially if
property values are tied to the levels of some of those
services).
However, there are also major difficulties with the
property tax. The revenue potential of the property
tax is seldom realized, due largely to signifi cant ad-
ministrative problems in identifying properties, valu-
ing them, adjusting valuation over time, collecting
A “good” municipal tax system should not unduly distort individual and fi rm decisions, should generate suffi cient revenues to allow the government to fi nance at the margin their expenditures, and should burden only local residents.
18 WOLFENSOHN CENTER FOR DEVELOPMENT
revenues, and enforcing penalties. Also, the tax base is
typically distributed across local governments in very
uneven ways, thereby contributing to extreme hori-
zontal fi scal disparities across jurisdictions. Perhaps
as a result, despite compelling evidence to the con-
trary, the property tax is actually seen by individuals
as a regressive tax, one in which greater burdens are
imposed on lower- than on higher-income households.
All of these issues are well-known, but this recognition
has done little to improve the administration of the
tax, even in wealthy countries. Indeed, the property
tax is often rated by individuals in polls as among the
least popular of all taxes.
Many local governments impose taxes on automobile
ownership and use, such as an annual license tax, a
registration fee, a transfer tax, a parking fee, tolls, and,
at times, a fuel tax (although most countries reserve
fuel taxes for central government use). Because car
ownership is concentrated in upper income classes,
automotive taxes are likely to increase the progressiv-
ity of local government fi nances. Revenues are likely
to grow steadily with urban growth. The taxes can be
administered at relatively low cost. They can be used
for general fi nancing, but they can also be earmarked
to fi nance road construction and maintenance and
to decrease congestion and pollution in urban areas.
However, with a few exceptions, these taxes are a sig-
nifi cantly underused source of revenue.
There are several indirect taxes that are potential
revenue sources for local governments. Local govern-
ments often impose a range of specifi c excise taxes,
sometimes called sumptuary taxes, on commodities
like beer, liquor, and tobacco. These taxes generate
substantial revenues, they are easy to collect, and
they may well discourage consumption of harmful
or “immoral” commodities (or “sin taxes”). However,
such taxes are also unlikely to grow much over time,
they may be regressive, and their use is clouded by
the possibility of individuals buying commodities (or
smuggling them) from outside the boundaries of the
taxing jurisdiction. Furthermore, collection of excise
taxes tends to be concentrated at borders or factory
locations, so that they are often unevenly distributed
across local governments. It is possible that local gov-
ernments could obtain some revenues from, say, a
central government sales tax, by adding a surtax onto
the central government rate, by sharing a specifi ed
percentage of the national government collections, or
by having a separate retail sales taxes.
Finally, it is not uncommon for local governments to
impose a surtax, or an additional local government
tax, on a national government income tax, along the
same lines as a local surtax on a national government
sales tax. The use of such a “piggyback income tax”
is a common practice in Scandinavian and central
European countries. There are a number of reasons
for caution in the use of a local government piggyback
income tax, most of which are the same disadvantages
as for direct local income taxes. For example, a local
government income surtax could generate distortions
in resource use, as individuals move to avoid paying
the tax and as cities “compete” with one another by
changing the tax rate. Still, there are some clear ad-
vantages to local surtaxes. The central government
administers the tax, thereby avoiding unnecessary du-
plication of administrative efforts. The central govern-
ment also retains the authority to defi ne the tax base,
which reduces locational distortions from mobile
factors and which also reduces interferences of local
governments in national stabilization policies, even
if these coordination problems are not eliminated.
Importantly, local governments are given some discre-
tion in choosing tax rates, within some lower and up-
MUNICIPAL FINANCE OF URBAN INFRASTRUCTURE 19
per bounds, and this choice enhances their ability to
make effective fi scal decisions. Indeed, surcharges of
various types have been increasingly recommended
as part of decentralization efforts around the world,
especially in transition countries where it is necessary
to fi nd some fast and sustainable way to give cities a
signifi cant fi scal capacity.
Of course, tax systems are designed to achieve mul-
tiple objectives. An obvious purpose is to raise the
revenues necessary to fi nance government expendi-
tures (sometimes termed “adequacy”), and also to en-
sure that the growth in revenues is adequate to meet
expenditure requirements (“elasticity”). Another is to
distribute the burden of taxation in a way that meets
with a society’s notions of fairness and equity. Equity
is typically defi ned in terms of “ability to pay,” such
that those with equal ability should pay equal taxes
(“horizontal equity”) and those with greater ability
should pay greater taxes (“vertical equity”). Taxes can
also be used to infl uence behavior of those who pay
them; in choosing taxes, a common goal is to minimize
the interference of taxes in the economic decisions of
individuals and fi rms. Taxes should be simple, both to
administer and to comply with, because a complicated
tax system wastes the resources of tax administra-
tors and taxpayers. The appropriate design of taxes
requires balancing tradeoffs among these various
goals. Also, some of these various goals of taxation
can also be achieved by tax sharing among govern-
ments, although tax sharing does not typically give
local governments any real authority in the selection
of local tax rates and therefore does not promote ac-
countability and effi ciency in local expenditures.
Even so, tax assignment does not always follow these
principles. Common problems include:
Vertical imbalance (e.g., an inadequate correspon-
dence between expenditure responsibilities of mu-
nicipal governments and their assigned sources of
revenues);
Lack of meaningful tax autonomy, as refl ected in
excessive reliance on shared taxes and intergovern-
mental transfers;
Unstable and/or confused tax assignments;
Assignments with ineffi cient incentives; and
Horizontal imbalance (e.g., an inequitable or uneven
apportionment of tax revenues among subnational
jurisdictions).
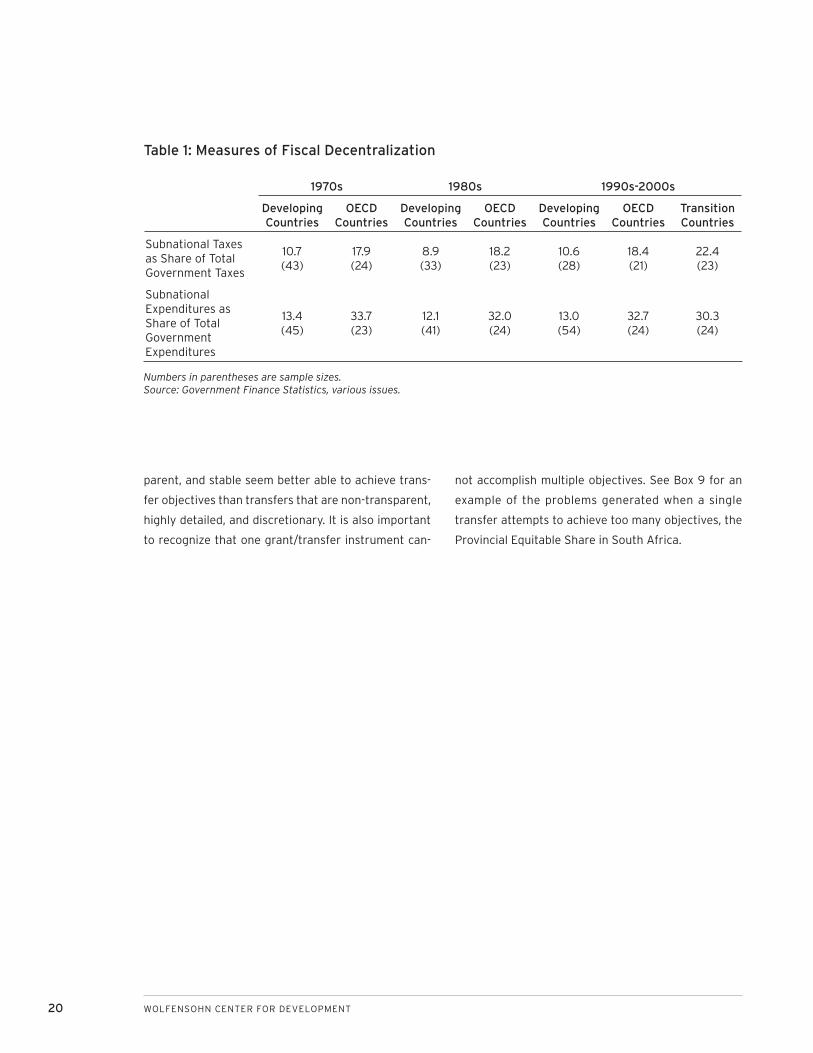
It is also the case that subnational revenue mobiliza-
tion remains extremely variable around the world, and
is often quite low. See Table 1.
Intergovernmental Transfers Once AgainThere are various ways by which transfers can be
classifi ed. One method focuses on the specifi c type
of grant: unconditional versus conditional transfers
(e.g., a transfer that can be spent on any service ver-
sus a transfer that must be spent on a specifi c and
designated category); non-matching versus matching
transfers, where “matching” refers to a specifi c per-
centage of recipient expenditures that is subsidized
by the donor government; and close-ended versus
open-ended transfers (e.g. a grant whose amount is
limited versus a grant that is not limited). Another
method focuses more on the details of grant system
design, and considers several dimensions of this de-
sign, typically the methods by which total divisible
pool of funds is determined and also the methods by
which the pool is allocated among eligible units.
As noted earlier, international experience suggests
that there is no single best approach to design capital
transfers. However, transfers that are simple, trans-
•
•
•
•
•
20 WOLFENSOHN CENTER FOR DEVELOPMENT
1970s 1980s 1990s-2000s
Developing Countries
OECD Countries
Developing Countries
OECD Countries
Developing Countries
OECD Countries
Transition Countries
Subnational Taxes as Share of Total Government Taxes
10.7(43)
17.9(24)
8.9(33)
18.2(23)
10.6(28)
18.4(21)
22.4(23)
Subnational Expenditures as Share of Total Government Expenditures
13.4(45)
33.7(23)
12.1(41)
32.0(24)
13.0(54)
32.7(24)
30.3(24)
parent, and stable seem better able to achieve trans-
fer objectives than transfers that are non-transparent,
highly detailed, and discretionary. It is also important
to recognize that one grant/transfer instrument can-
not accomplish multiple objectives. See Box 9 for an
example of the problems generated when a single
transfer attempts to achieve too many objectives, the
Provincial Equitable Share in South Africa.
Table 1: Measures of Fiscal Decentralization
Numbers in parentheses are sample sizes.Source: Government Finance Statistics, various issues.
MUNICIPAL FINANCE OF URBAN INFRASTRUCTURE 21
Box 9: Intergovernmental Transfers in South Africa – the Provincial Equitable Share
The Provincial Equitable Share (PES) transfer is a formula-driven grant program that distributes unconditional
transfers to provinces in South Africa. The formula consists of six components that capture the relative de-
mand for services between provinces and that take into account specifi c provincial circumstances:
An education share (51 per cent) based on the size of the school-age population (ages 5-17) and the num-
ber of learners (Grade R to 12) enrolled in public schools;
A health share (26 per cent) based on the proportion of the population with and without access to medi-
cal aid;
A basic share (14 per cent) derived from each province’s share of the national population;
An institutional component (5 per cent) divided equally between the provinces;
A poverty component (3 per cent) that reinforces the redistributive element; and
An economic output component (1 per cent) based on GDP by region.
A standard principle of policy design is to use one separate instrument for each different objective, and a
common problem in many countries with the design of transfers like equalization grants is that they get over-
loaded with many policy objectives; at the end it is not clear what is pursued or achieved with the transfer
system. The PES illustrates this problem: it attempts to achieve too many objectives, and it does not achieve
any one clearly. An important question therefore is: What is the primary goal of the PES in South Africa? The
PES can be defi ned as a constitutional entitlement on central government revenues for each sphere of gov-
ernment. In this view the PES formula should be concerned with how the shares can be allocated equitably.
However, an equitable distribution formula is not necessarily equivalent to an equalization formula in the tra-
ditional sense of addressing fi scal gaps or horizontal disparities between sub-national government units. For
example, the notion of equity may require the distribution of funds for reasons other than achieving greater
equality, such as providing more funds to those provincial governments that are more entitled for some reason
(e.g., the presence of natural resources in their territories). It is clear that currently there are too many objec-
tives other than equity/equalization being pursued with the PES transfer. For example, the “economic activity”
component of the formula is nothing more than some form of revenue sharing on a derivation basis. Revenue
sharing is a form of transfer used in many countries as a solution to closing vertical imbalances (since central
governments collect much more than the expenditure responsibilities demand), and it may also be a way to let
richer sub-national governments get their share in the wealth/revenues collected in their territories. As such,
South Africa can also make use of revenue sharing, but this “economic activity” component does not really
belong in a traditional equalization transfer. Indeed, in most countries revenue sharing is arranged separately
from other transfers, including equalization transfers. Thus, the most fundamental question that needs to be
answered is what exactly is the purpose of the PES. Is it to equalize, distribute, or redistribute public funds to
the provinces? Is it instead a general funding mechanism to enable the provinces to deliver constitutionally
mandated services? Or is it other things? These questions remain unanswered.
Source: Alm and Martinez-Vazquez (2009).
•
•
•
•
•
•
22 WOLFENSOHN CENTER FOR DEVELOPMENT
THE ROLE OF INSTITUTIONS
As noted earlier, the conditions under which de-
centralization “works” include a range of factors,
many of which relate to the institutional structures of
the relevant country, including the governance struc-
tures of urban areas and the administrative capacities
of municipal governments. This section examines the
potential impacts of governance institutions.
What Do Urban Governments Do?
The Subsidiarity Principle suggests a list of fairly spe-
cifi c functions for urban governments. These include
responsibilities for:
Roads and bridges
Public transit
Street lighting
Sidewalks
Water system
Sewer system
Garbage collection and disposal
Police protection
Fire suppression and prevention
Land use planning
Economic development
Parks and recreation
Libraries
Some other functions often performed (at least in
part) by municipal governments include welfare assis-
tance, child care services, housing, and public health,
although these types of functions have strong ele-
•
•
•
•
•
•
•
•
•
•
•
•
•
ments of income distribution, a function usually as-
signed to the central government.
Some Types of Municipal Governance Structures Around the World
As argued by Bird and Slack (2007), local governance
is critical in the physical and social character of city-
regions. The quality and nature of these institutions
affect both the quantity and the quality of local public
services and the effi ciency with which they are deliv-
ered.
Recall that the Subsidiarity Principle argues that the
effi cient provision of services requires decision mak-
ing to be carried out by the lowest level of govern-
ment that can do so effi ciently because a government
“closer to the people” will be better able to adjust
services to the demands of its citizens. There is also
the implication that smaller governments will stimu-
late competition between local jurisdictions, which will
in turn induce them to offer the best possible mix of
taxes and services to individuals who will “vote with
their feet” by moving between jurisdictions (Tiebout,
,1056). Factors that argue for a larger consolidated
government structure are economies of scale in ser-
vice provision and the existence of interjurisdictional
externalities, both of which suggest that a larger
government jurisdiction may be needed to consider
appropriately the full extent of benefits and costs
of public services. A larger government jurisdiction
may also be necessary to collect more effi ciently tax
revenues. The relevant choice of an appropriate gov-
ernance structure is therefore unclear, and depends
largely upon how one weighs these confl icting consid-
erations. Indeed, it is striking that no “one size fi ts all”
strategy emerges when these tradeoffs are fully con-
sidered. As is often the case with institutional design,
the broad questions that are relevant seem universal,
MUNICIPAL FINANCE OF URBAN INFRASTRUCTURE 23
but the answers are invariably dependent on specifi c
context.
Bird and Slack (2007) identify several main types
of municipal governance; see also Slack (2007) and
Slack and Chattopadhyay (2009). These include what
they term a one-tier model of municipal governance,
a two-tier model, a voluntary cooperation model, and
special-purpose districts. Consider each type.
Under the one-tier model a single local government
is responsible for providing the full range of local ser-
vices. The one-tier model can take two distinct forms:
a series of small fragmented municipalities in a met-
ropolitan area, or one large consolidated municipality
for the whole area. Fragmented one-tier governments
are common in the United States. The two-tier model
consists of an upper tier governing body (usually a re-
gion, district, or metropolitan area) that encompasses
a large geographic area and that is responsible for
services that have wide-scale benefi ts, that gener-
ate externalities, or that demonstrate economies of
scale; lower tier units cover smaller areas and are re-
sponsible for services that provide local benefi ts. The
voluntary cooperation model is closer to a de minimis
government structure, in which there is an area-wide
body based on voluntary cooperation between exist-
ing units of local government with no permanent,
independent institutional status. These structures are
politically easy to create—and to disband—but their
effectiveness is limited due to the purely voluntary
nature of the arrangements. A last form of organiza-
tion is special-purpose districts, which are typically
used to deliver services that extend beyond municipal
boundaries.
In sum, neither theory nor practice tells us clearly
which model of governance is “best” for large met-
ropolitan areas. Nonetheless, one main conclusion is
that a strong regional structure encompassing the
entire city-region is important. Metropolitan areas
have strong interdependencies (institutional and
economic), and some form of regional governance is
needed to address such problems of a regional nature.
Few problems stop at municipal boundaries, and most
solutions require coordinating the decisions of larger
geographical units than characterize a “typical” local
government.
However, what kind of regional structure is called for
here? Bird and Slack (2007) conclude that different
models have worked successfully in different places.
Indeed, it follows that a second main conclusion is
that what is more important than the precise form
of governance is simply that some form of gover-
nance—and some form of effective governance—be in
place. Bird and Slack (2007) also suggest that the real
choice usually comes down to one-tier versus two-tier
structures. Because a one-tier structure is simpler
to understand and more transparent than a two-tier
structure, a one-tier structure may improve account-
ability; a one-tier structure may also encourage
greater local government experimentation, and it may
give individuals more choices in where they choose to
live. Two-tier structures may be better able to achieve
effi ciencies (e.g., economies of scale, externalities),
but their greater complexity may result in confusion
among citizens about responsibilities and burdens
and so in less accountability.
24 WOLFENSOHN CENTER FOR DEVELOPMENT
SOME EVIDENCE: SELECTED INFORMATION ON MUNICIPAL CAPITAL INVESTMENTS
Data on the extent of subnational borrowing is
notoriously variable, non-standardized, and un-
reliable. In many cases, the data that are available are
collected by local experts, so that there is a strong
idiosyncratic element that is present. Even so, Table 2
gives some selected information on the relative reli-
ance of local governments on borrowing as a source
of own-source revenues, mainly for selected years in
the 1990s, as compiled by Alm and Indrawati (2004).
The extent of local government borrowing seems
quite variable but generally seems quite low.
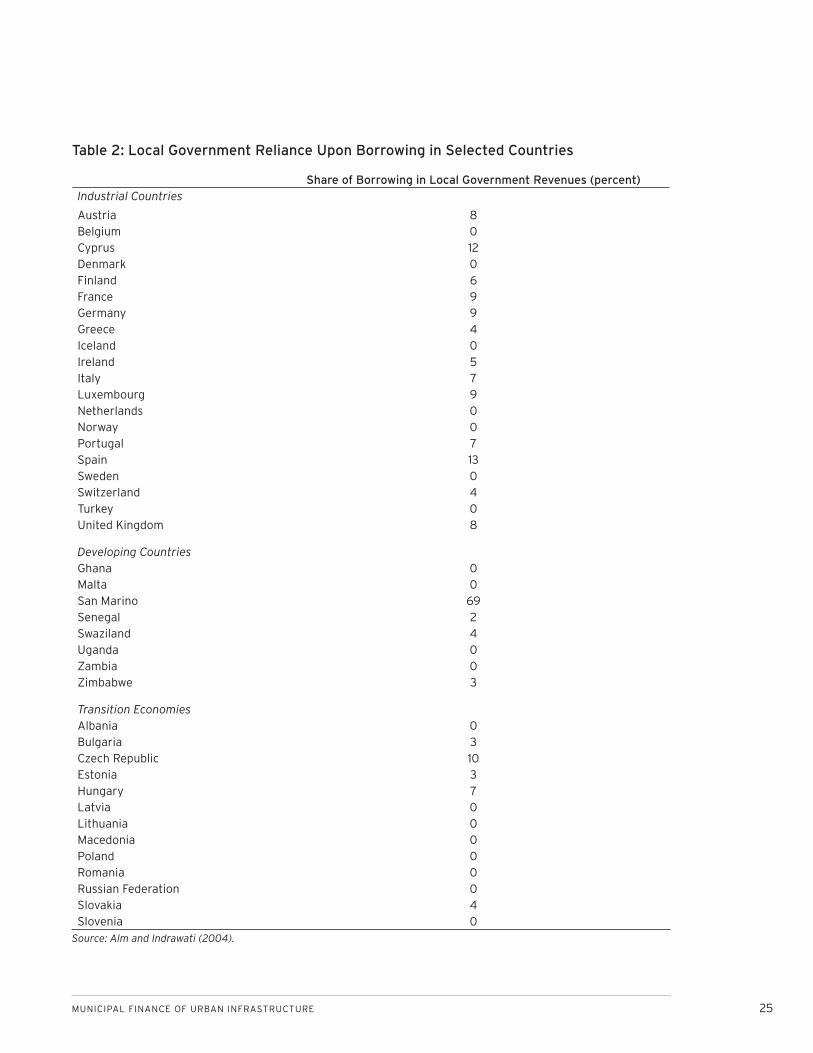
MUNICIPAL FINANCE OF URBAN INFRASTRUCTURE 25
Share of Borrowing in Local Government Revenues (percent)Industrial Countries
Austria 8Belgium 0Cyprus 12Denmark 0Finland 6France 9Germany 9Greece 4Iceland 0Ireland 5Italy 7Luxembourg 9Netherlands 0Norway 0Portugal 7Spain 13Sweden 0Switzerland 4Turkey 0United Kingdom 8
Developing CountriesGhana 0Malta 0San Marino 69Senegal 2Swaziland 4Uganda 0Zambia 0Zimbabwe 3
Transition EconomiesAlbania 0Bulgaria 3Czech Republic 10Estonia 3Hungary 7Latvia 0Lithuania 0Macedonia 0Poland 0Romania 0Russian Federation 0Slovakia 4Slovenia 0
Table 2: Local Government Reliance Upon Borrowing in Selected Countries
Source: Alm and Indrawati (2004).
26 WOLFENSOHN CENTER FOR DEVELOPMENT
CASE STUDIES: EXAMPLES OF SUCCESSFUL/UNSUCCESSFUL MUNICIPAL FINANCE
In this section I examine several specifi c case stud-
ies of urban infrastructure fi nance, using examples
from Indonesia, the United States, Korea, Bangladesh,
Bolivia, and China, all found in the existing literature.
The case studies examine different aspects of munici-
pal borrowing, municipal taxing, intergovernmental
transfers, user charges (congestion fees), land-assets,
privatization, and governance. These case studies il-
lustrate different results, but there are several com-
mon themes throughout, regardless of whether the
specifi c examples can be classifi ed as a “success” or
as a “failure.” The specific conclusions from these
studies are the following:
Establishing the conditions under which subnational
borrowing can take place is a diffi cult undertaking.
The ability of municipal governments to generate
significant amounts of own-source tax revenues,
especially from the property tax, is often quite lim-
ited.
User charges (including congestion fees) can be a
useful source of revenues and can also have posi-
tive impacts on resource allocation, but their record
is mixed.
Block transfers do not always achieve their in-
tended results.
Privatization must pay attention to its distributional
effects.
Land-acquisition by local governments can be
abused by the governments, which can generate
enormous hostility among land owners who feel ex-
ploited by the process of acquisition.
Urban governance has signifi cant impacts on the
expenditures of the relevant governments.
•
•
•
•
•
•
•
The more general and suggestive themes include:
There are multiple dimensions by which a project
can be evaluated, and success/failure is often differ-
ent across these dimensions.
The data necessary to conduct a thorough ex post
evaluation of a project are often poor, even non-
existent.
Indeed, it is often the case that s thorough ex ante
benefi t-cost analysis of a project is not done ad-
equately; data problems are often the overriding
issue.
The reasons for success/failure are often unclear.
In particular, the role of institutions in determining
success/failure is not well understood and often
neglected.
Subnational Borrowing in Indonesia
Following independence from the Dutch after World
War II, Indonesia had been established as a multi-tier
state, with provinces below the central government in
Jakarta and local governments as the third tier. Even
so, most authority was concentrated in the central
government, justifi ed largely as a way of maintaining
national unity and cohesion in a nation with over 200
million people spread across 14,000 islands. However,
in May 1999, the Government of Indonesia (GOI)
passed two laws that transformed intergovernmental
relations: Law No. 22/1999 on Regional Government
(UU PD) and Law No. 25/1999 on the Fiscal Balance
between the Central Government and the Regions (UU
PKPD). Part of these reforms related to borrowing by
subnational governments.
Before the passage of these laws, local government
borrowing had been controlled very tightly by the cen-
tral government under Law No. 4/1974. Under this law,
regional governments were permitted to borrow, but
•
•
•
•
•
MUNICIPAL FINANCE OF URBAN INFRASTRUCTURE 27
only with the approval of central government and only
under some limited circumstances. The extent of bor-
rowing was quite limited, or well less than 0.5 percent
of GDP; of this, most borrowing had been undertaken
by the regional water authorities (or PDAMs). Despite
the favorable terms, the repayment of loans had been
poor, and the arrears rate was high (Lewis, 2003).
With the passage of Law No. 25/1999, the GOI changed
to a new approach toward borrowing. In principle, the
law gave local governments substantial freedom to
borrow from domestic sources and also from foreign
sources (via the central government). More specifi -
cally, long-term borrowing (e.g., more than one year)
is only allowed for investment spending to build infra-
structure than can generate revenue for repayment.
Even some short-term borrowing is permitted but only
for the management of local government cash fl ow.
However, these new borrowing powers raised many
concerns about how local governments would actu-
ally respond, given especially ongoing worries about
the largely unchanged capacity of local governments
to manage their budgets (including their borrowing).
Accordingly, the central government faced pressure to
restrain local government borrowing.
Consequently, in practice, the central government has
over the last decade maintained very strict limitations
on local government borrowing, of various types. For
example, a government regulation on local borrow-
ing (No. 107/2000) requires that: maximum accumu-
lated debts must be less than 75 percent of general
revenues from the previous budget; the debt service
coverage ratio must be at least 2.5; maximum short-
term borrowing cannot exceed 1/6 of current spend-
ing; borrowing must be approved by either the central
government via the Ministry of Finance or by the local
parliament (depending on the source of borrowing);
and commercial/private foreign borrowings are not
allowed. Even after imposing these regulations, the
central government still felt the necessity—supported
strongly and explicitly by multilateral institutions such
as the International Monetary Fund and the World
Bank—twice to delay the implementation of the local
government borrowing regulations.
A relevant issue here is the actual borrowing ca-
pacity of local governments in Indonesia. Alm and
Indrawati (2004) used estimates from the University
of Indonesia on revenue and expenditures of local
governments to measure potential local government
borrowing capacity for the year 2001.7 8 According to
their estimates, as presented in Table 3, most local
governments in Indonesia have wide room to initiate
new borrowing. More than 80 percent of provincial
governments, almost 95 percent of district/ kabu-
paten governments, and roughly 50 percent of city
governments have the ability to borrow above Rp 10
billion.
Despite the apparent capacity of many local govern-
ments to borrow, central government controls have
remained quite severe, due to the presence of enor-
mous public debt, recurrent macroeconomic shocks
(e.g., the tsunami of 2004, earthquakes), and ongoing
concerns about the capacity of local governments to
manage their budgets. On balance, Alm and Indrawati
(2004) concluded that the GOI policies seem designed
mainly to deal with macroeconomic considerations of
the central government, and not to create a system to
allow local governments to gain access to credit mar-
kets. These central government restrictions remain
largely in place, even today.
In order to reduce the negative impacts of these gov-
ernment controls, Alm and Indrawati (2004) argued
that the central government must design a transition
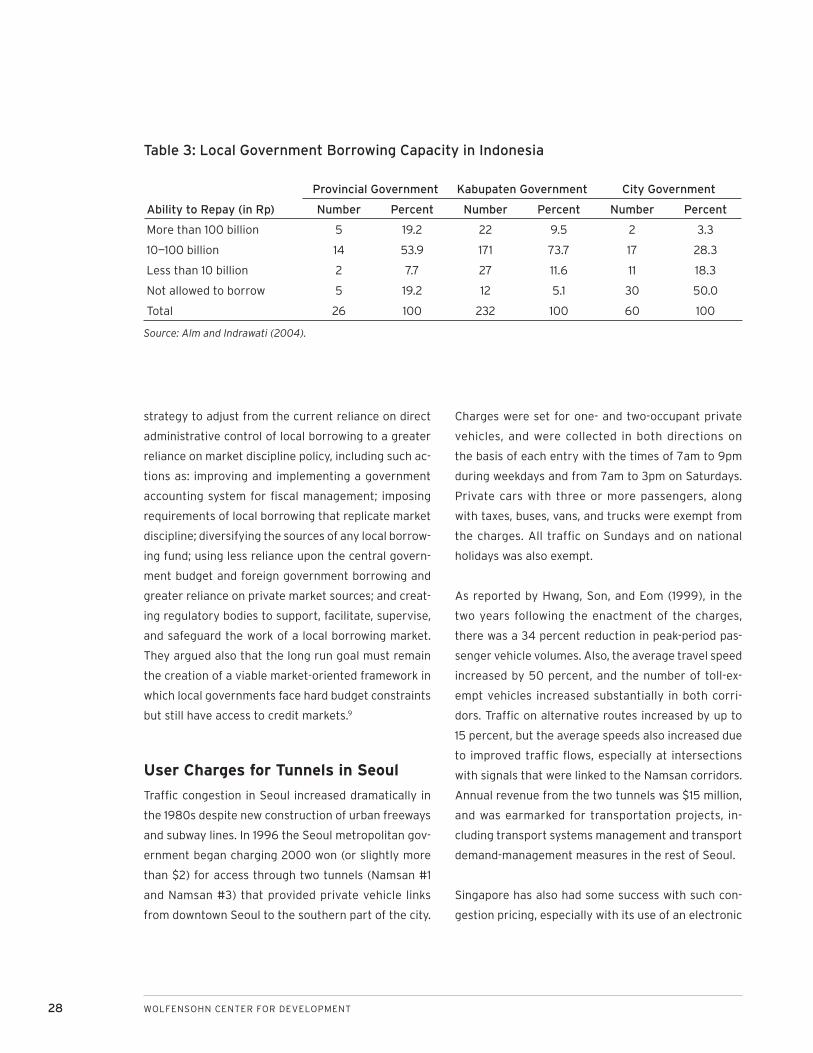
28 WOLFENSOHN CENTER FOR DEVELOPMENT
strategy to adjust from the current reliance on direct
administrative control of local borrowing to a greater
reliance on market discipline policy, including such ac-
tions as: improving and implementing a government
accounting system for fi scal management; imposing
requirements of local borrowing that replicate market
discipline; diversifying the sources of any local borrow-
ing fund; using less reliance upon the central govern-
ment budget and foreign government borrowing and
greater reliance on private market sources; and creat-
ing regulatory bodies to support, facilitate, supervise,
and safeguard the work of a local borrowing market.
They argued also that the long run goal must remain
the creation of a viable market-oriented framework in
which local governments face hard budget constraints
but still have access to credit markets.9
User Charges for Tunnels in Seoul
Traffi c congestion in Seoul increased dramatically in
the 1980s despite new construction of urban freeways
and subway lines. In 1996 the Seoul metropolitan gov-
ernment began charging 2000 won (or slightly more
than $2) for access through two tunnels (Namsan #1
and Namsan #3) that provided private vehicle links
from downtown Seoul to the southern part of the city.
Charges were set for one- and two-occupant private
vehicles, and were collected in both directions on
the basis of each entry with the times of 7am to 9pm
during weekdays and from 7am to 3pm on Saturdays.
Private cars with three or more passengers, along
with taxes, buses, vans, and trucks were exempt from
the charges. All traffi c on Sundays and on national
holidays was also exempt.
As reported by Hwang, Son, and Eom (1999), in the
two years following the enactment of the charges,
there was a 34 percent reduction in peak-period pas-
senger vehicle volumes. Also, the average travel speed
increased by 50 percent, and the number of toll-ex-
empt vehicles increased substantially in both corri-
dors. Traffi c on alternative routes increased by up to
15 percent, but the average speeds also increased due
to improved traffi c fl ows, especially at intersections
with signals that were linked to the Namsan corridors.
Annual revenue from the two tunnels was $15 million,
and was earmarked for transportation projects, in-
cluding transport systems management and transport
demand-management measures in the rest of Seoul.
Singapore has also had some success with such con-
gestion pricing, especially with its use of an electronic
Ability to Repay (in Rp)
Provincial Government Kabupaten Government City Government
Number Percent Number Percent Number Percent
More than 100 billion 5 19.2 22 9.5 2 3.3
10—100 billion 14 53.9 171 73.7 17 28.3
Less than 10 billion 2 7.7 27 11.6 11 18.3
Not allowed to borrow 5 19.2 12 5.1 30 50.0
Total 26 100 232 100 60 100
Table 3: Local Government Borrowing Capacity in Indonesia
Source: Alm and Indrawati (2004).
MUNICIPAL FINANCE OF URBAN INFRASTRUCTURE 29
pricing system. However, other countries have had
more limited success, including Kuala Lumpur and
Bangkok (Gwilliam, 2002)
Property Tax Mobilization in Bangla-desh Municipalities
Since at least the 1980s, the Government of
Bangladesh (GOB) has consistently stated that it
wishes to pursue fi scal decentralization. True decen-
tralization requires (among other things) that a local
government have some control of its own (fi scal) fate,
and this can be achieved only if the local government
can itself change on the margin the revenues it col-
lects and so the services it provides.
Alm (1997) examined the revenue capabilities and
performance of municipal governments (“pourasha-
vas”) in Bangladesh. He found that generally accepted
principles of tax assignment for municipalities were
largely followed in Bangladesh. The principle own-rev-
enue source for pourashavas was the holdings tax, a
simplifi ed form of a property tax, they also generated
revenues from other property-related bases, such as
leasing activities and a tax on the transfer of “immov-
able property. However, pourashava autonomy or dis-
cretion in the use of these revenue sources, especially
in the establishment of rates, was extremely limited.
Also, the ability of many of these existing tax sources
to generate adequate and signifi cant amounts of ad-
ditional revenues in the near-term was extremely
limited; in particular, it was diffi cult to increase—in a
fast, signifi cant, and sustainable way—the yield of the
holdings tax.
Second, the available evidence, collected by a spe-
cially commissioned survey of pourashavas, indicated
clearly that pourashavas generated extraordinarily
small amounts of revenues from these sources. The
level of collections from these own-revenue sources
was extremely and dismally low, varied enormously
across pourashavas, and had grown erratically across
pourashavas and over time. Collections of total own
revenues rarely exceeded Tk 100 per capita (relative
to per capita gross domestic product at the time of
about Tk 9000), except in larger cities and in city
corporations, and in some smaller pourashavas col-
lections were even lower. The variations in collections
of total own revenues per capita across pourashavas
were extremely great, and there were also extremely
large differences by pourashavas in their growth rates
of collections over time. Many revenue sources were
barely used at all. In large part because of low col-
lections from own sources, pourashavas were heavily
dependent on central government transfers for much
of their revenues.
Third, various explanations were given for the poor
pourashava revenue performance, including the po-
litical fears of raising taxes and the poverty of city
residents. More convincing reasons were the limited
administrative capabilities of the pourashava per-
sonnel (especially for the holdings tax), the extreme
undervaluation of the property tax base, the failure
to impose penalties (especially on arrears), and the
presence of corruption in pourashava administra-
tion. Indeed, Alm (1997) concluded that many of the
taxes assigned to pourashavas did not have any real
revenue potential (a “vertical” imbalance”), and were
more in the form of nuisance taxes.
In short, Alm (1997) concluded that the ability of mu-
nicipal governments to generate adequate revenues
from the property tax—indeed from any tax currently
assigned to pourashavas—was quite limited, even with
improved tax administration. He suggested that any in-
crease in revenue capabilities required that pourasha-
vas make greater use of the income potential from
30 WOLFENSOHN CENTER FOR DEVELOPMENT
their own properties, including income from leasing
and rentals. More importantly, he argued that the lim-
ited ability of existing pourashava revenue sources re-
quired that pourashava use of new tax sources should
be considered, especially a surcharge to the GOB
individual income tax (e.g., a pourashava “piggyback”
tax to the existing GOB income tax). He estimated that
a 10 percent or a 25 percent local surcharge (on the
income tax liability), for those pourashavas for which
information on income tax collections was available
from the National Board of Revenue, could give an im-
mense increase in revenues. For several pourashavas,
a 25 percent surcharge would generate collections in
excess of total own revenues from all current sources.
However, to date such piggyback taxes have not been
enacted in Bangladesh.
Grant Finance of Infrastructure: Les-sons from the United States
A signifi cant amount of infrastructure fi nance in many
municipalities comes from conditional block grants
from the central government. It is useful to examine
the experiences of other countries with such grants,
in particular that of the United States.
In 1966, the Partnership for Health Act combined
nine categorical health grants into one block grant
for health. Robbins (1976) and Stenberg and Walker
(1977) analyzed the results of this consolidation, and
concluded that the block grant increased the adminis-
trative fl exibility of state health offi cials, even though
state health planning agencies generally did not have
a major infl uence on the block grant and state health
planning agencies located in governors’ offi ces had
less infl uence over the block grant than those located
in state health departments. Most signifi cantly, the
new block grant did not generally result in a reorder-
ing of spending priorities, including any changes of in-
frastructure spending (e.g., hospital and other health
facility construction). Robbins (1976) and Stenberg
and Walker (1977) argued that the best explanation
for the unspectacular effect of combining several cat-
egorical grants into one block grant was that, without
an increase in the amount of the overall amount of the
transfer, the new administrative fl exibility given state
offi cials was insuffi cient to produce a substantive re-
ordering of program priorities.
More recently, Finegold, Wherry, and Schardin (2004)
examined the entire United States history of block
grants, beginning with the Partnership for Health Act
in 1966 and extending to: the Safe Streets program,
created under the Omnibus Crime Control and Safe
Streets Act of 1968; the Community Development
Block Grant, the Social Services Block Grant, and the
Comprehensive Employment and Training Act Block
Grant of the 1970s; the consolidation of 77 categori-
cal grants into 9 block grants as part of the Omnibus
Budget Reconciliation Act of 1981; and the Personal
Responsibility and Work Opportunity Reconciliation
Act, the welfare reform legislation that replaced the
Aid to Families with Dependent Children and related
programs with the Temporary Aid to Needy Families
(TANF) block grant. They concluded that funding
gradually declined over time for nearly all of the
block grants. They also found that Congress typically
eroded over time the fl exibility of the block grants by
adding restrictions, requiring that a share of funds be
set aside for particular purposes or creating new cate-
gorical programs with the same or related objectives.
These restrictions were justifi ed by Congress as an
attempt to deal with misuse or maladministration of
the block grants by state and local governments, but
were more likely enacted because of political benefi ts
from more narrowly targeting the grants to specifi c
constituents. Not surprisingly, Finegold, Wherry, and
Schardin (2004) concluded that block grants work
MUNICIPAL FINANCE OF URBAN INFRASTRUCTURE 31
best when state and local government administrative
capacities are strong and already exist. For example,
following implementation of the Reagan block grants,
state offi cials reported management improvements,
including better planning and budgeting methods,
changes in administrative procedures and standard-
ization across programs, and increased effi ciency in
the use of state personnel (Peterson et al. 1986; GAO
1985). Even so, the GAO (1982) found only a small re-
duction in overall administrative costs under the pre-
1981 block grant programs, with administrative costs
increasing in some cases, and few state administra-
tors claimed savings of more than 5 percent under the
Reagan block grants (Peterson and Nightingale 1995).
Indeed, implementation of new block grants has
tended to be smoothest when states were already re-
sponsible for administering the categorical programs
they replaced. Finally, Finegold, Wherry, and Schardin
(2004) reported mixed evidence from other studies
that state governments used the increased fl exibility
of block grants to redirect spending away from indi-
viduals or communities with the greatest need. The
GAO (1982) study of pre-1981 block grants found the
receipt of resources by target populations about the
same under categorical and block grant programs,
and Peterson et al. (1986) also found no indications
that states had used their fl exibility under the Reagan
block grants to directly shift resources from poor
or low-income families. However, Bennett and Perez
(1986) found that state allocations to local districts
under the education block grant were based more on
enrollment, and less on need, than under the cate-
gorical programs it replaced. In this regard, there was
little evidence from any study that the block grants
achieved (where relevant and intended) any change
in infrastructure spending, a result similar to that of
Robbins (1976) and Stenberg and Walker (1977).
Water Privatization—and Renational-ization—in Bolivia
The water sector in the Bolivian cities of La Paz and
El Alto was privatized between 1997 and 2005. When
the original concession contracts were formulated,
the municipal governments and the private company
agreed upon explicit coverage targets. The agreement
required that the company install 71,752 new water
connections by 2001, a coverage rate that provided
essentially universal coverage in La Paz and 82 per-
cent coverage in El Alto. These coverage rates were
largely achieved. However, the private contracts were
terminated in 2005, and the sector was renational-
ized.
Hailu, Osorio, and Tsukada (2009) examined the per-
formance of the private company during the 1997-
2005 period, and also explored the reasons for the
renationalization. Using data from national household
surveys conducted by Bolivia’s Instituto Nacional de
Estadistica, they found that access to water—mea-
sured by access to in-house piped water—expanded
at higher rates in La Paz and El Alto than in cities
with public provision. They also found that access
for poorer households increased substantially in the
privatized cities; by 2005, the difference in coverage
rates for the poorest 20 percent and the richest 20
percent fell from 30 to 4 percentage points in El Alto
and from 15 to 4 percentage points in La Paz.
Even so, the private contracts were terminated. One
factor was the failure of the private company to meet
all expansion-of-service contract stipulations. More
importantly, tariff increases allowed by the conces-
sion contracts and enacted by the private company
provoked major public outrage. Eventually, the un-
popularity of private company attempts to achieve
better cost recovery, together with the failure to meet
32 WOLFENSOHN CENTER FOR DEVELOPMENT
legally binding targets led the governments to end the
contracts.
Hailu, Osorio, and Tsukda (2009) concluded that at-
tempts to expand access to the poor cannot be met
solely through privatization and require public efforts.
Estupinan et al. (2007) also come to similar conclu-
sions on the importance of maintaining affordability
for the poor, in public subsidies for transportation.
Land-based Finance in China
China is currently undergoing a rapid process of ur-
banization, arguably on the largest scale in human
history. Rapid urban expansion has resulted in much
arable land being used for non-agricultural purposes.
Indeed, a major source of financing for this urban
expansion is “land fi nance,” or the use of land req-
uisition and public leasing, typically at “prices” that
are signifi cantly below true market value. The Land
Administration Law (LAL) was enacted in 1998, and
allows the government to acquire land owned by col-
lectives, if it is acting in the “public interest.” However,
there is no clear defi nition of the public interest, and
this lack of clarity has often led the local govern-
ments to expand the legal scope of land acquisition.
In practice, governments have used the legal right to
attain land from farmers or from farmers’ collectives
for urban infrastructure development. Of some note,
land used for non-public usage such as for industrial,
commercial, and residential projects also has to go
through the public land requisition procedure, so that
in practice nearly all the land used for urban develop-
ment—whether by public or private enterprises—must
be acquired by the local government, converted to
state-owned land, and then used for public or pri-
vate development purposes. This means that under
the current LAL neither farmers not collectives have
much power to negotiate directly on the price at which
their land will be acquired, and it also means that they
cannot make a private transfer of land rights on their
own. The compensation terms for land acquisitions
are, for the most part, decided unilaterally by the local
government that acquires the land.
Under the LAL, the compensation consists of three
cash components: compensation for the land (at 6-10
times the estimated land productivity), compensation
for resettlement (at 4-6 times the estimated land pro-
ductivity), and compensation for “accessory assets”
in land. Recently, some municipalities have promised
farmers a monthly pension upon reaching retirement
age, rather than providing cash compensation.
However, municipal governments have typically
abused their acquisition powers by offering compen-
sation far below true market value. Such low-cost
land acquisition has allowed municipal governments
to avoid heavy fiscal burdens of land acquisition,
but has also generated signifi cant distortions in land
use and major burdens on dispossessed land own-
ers. Cao, Feng, and Tao (2008) report the results of
a 17 province, 1962 farmer survey conducted in 2005,
which documents the 15-fold increase in local govern-
ment land acquisition in the previous 10 years and
the corresponding increase in farmers’ grievances.
Dissatisfaction has apparently contributed to social
unrest and political instability; in the fi rst 9 months
of 2006, China reported nearly 18,000 cases of “mas-
sive rural incidents” largely related to illegal acquisi-
tions, in which 385,000 farmers protested against the
government. They also report that there are roughly
40 million dispossessed farmers due to urban expan-
sion. In response, the central government has issued
several policy directives in the last several years, but
problems apparently remain.
MUNICIPAL FINANCE OF URBAN INFRASTRUCTURE 33
Government Structure and Govern-ment Spending in the United States
Recall that the structure of urban governance is ex-
pected to affect the quantity and quality of govern-
ment services. One aspect of this effect is the impact
on government spending. Zax (1989) examines this
issue by estimating the effects of the number of gov-
ernments in a geographical area on the magnitude of
government spending, using a sample of 3022 coun-
ties for the United States. The sector should shrink
if decentralization encourages competition among
governments; it should increase if decentralization
reduces the scope of scale economies. He fi nds that
larger county governments actually increase the size
of government spending relative to county income.
He also fi nds that cities and towns increase compe-
tition and reduce government size, while more spe-
cial districts sacrifi ce scale economies and increase
government spending. In short, decentralization that
encourages competition reduces the size of the local
public sector; decentralization that discourages scale
economies increases government. For some similar
evidence for India, see Lalvani (2002).
34 WOLFENSOHN CENTER FOR DEVELOPMENT
SOME “GAPS” IN OUR UNDERSTANDING
This review of the literature on urban infrastruc-
ture suggests a number of areas in which our
understanding is incomplete.
First, what is the extent of municipal infrastructure
spending? Data are virtually non-existent. Often the
data that exist are compiled by local “experts.” While
these data can be useful, they are seldom uniform,
representative, comprehensive, comparable across
countries, or available for multiple years.
Second, what is the extent of municipal government
borrowing for infrastructure? Again, signifi cant data
gaps exist.
Third, how can the long-run borrowing capacity of
municipal governments be built? The example of
Indonesia illustrates that the passage of legislation
does not automatically lead to the establishment of
the conditions under which local governments actu-
ally are able to borrow funds for infrastructure.
Fourth, how can local credit markets be built in de-
veloping countries, including establishment of credit
agencies?
Fifth, what is the extent of municipal government as-
sets? There is rarely a systematic effort made to com-
pile an “inventory” of local government assets? Given
the growth of land-based methods of infrastructure, it
is essential for municipal governments to have a com-
prehensive and accurate inventory of the assets at
their disposal. Such inventories simply do not exist.
Sixth, what is the extent of cost recovery from user
costs? Data here are typically more widely available,
at least on the aggregate level of revenues that are
generated.
Seventh, what are the distributional effects of differ-
ent fi nancing schemes? The case studies indicate the
dominant role of distributional issues in public accep-
tance of many pricing schemes, but full distributional
analyses are often unavailable. As only one example,
there is a large literature on the “incidence” of impact
fees in the United States; there is little comparable
work on developing countries, despite the growing use
of land-based methods of fi nance.
Eighth, what is the impact of intergovernmental trans-
fers on infrastructure spending? There is a large em-
pirical literature on how governments respond in their
spending decisions to the receipt of transfers, most
focusing on the experience of developed countries,
especially the United States. Even so, many basic
questions here remain unanswered, especially in the
context of developing countries. Does money “stick
where it hits” (e.g., the so-called “fl ypaper effect”)?
Which types of grants are most stimulative? Are the
impacts of capital transfers different than those of
transfers that fund personnel and other current ex-
penses?
Ninth, what is the impact of governance on infrastruc-
ture spending, including the impact of different gover-
nance structures on cost effi ciency of service delivery,
on the level of government expenditures, and on the
accountability of local governments? There is no
convincing evidence here. Indeed, the role of institu-
tions is often overlooked, and even when institutions
are considered, their roles are not fully understood.
Indeed, what are the metrics by which performance
can be measured? Is a “successful” infrastructure
project one that is fi nancially viability, that delivers
services effi ciently, that targets delivery to specifi c
MUNICIPAL FINANCE OF URBAN INFRASTRUCTURE 35
income groups, or that achieves some other goals?
Tenth, how can administrative capacity be built? The
limitations of administrative capacity (including the
existence of corruption) are routinely identifi ed as a
major bottleneck for municipal governments, in virtu-
ally all dimensions of local government performance.
However, the specifi c steps that should be taken to
improve capacity are diffi cult to identify and compli-
cated to implement. There is also no attempt made
to measure systematically the capacity of local gov-
ernment offi cials or administrators, beyond indica-
tors present in such publications as the World Bank’s
Doing Business or the World Economic Forum’s The
Global Competitiveness Report, both of which focus
mainly on national considerations of which only a
few relate to tax administration and capacity. Of per-
haps more relevance is the recent OECD publication
Tax Administration n OECD and Selected Non-OECD
Countries: Comparative Information Series (2008),
which continues earlier year OECD publications on
tax administration. Again, however, these indicators
are only available at the national level, and only for a
small number of mainly developed countries. There is
certainly no understanding of how a lack of capacity
affects project implementation, beyond the obvious—
and true—observation that poor administration makes
successful project implementation unlikely.
Finally, what are the lessons of “ancient” history on
infrastructure fi nance? There is an almost irresistible
tendency to focus on “recent” history in devising in-
frastructure strategies. However, governments have
been building infrastructure for thousands of years.
There is no doubt that circumstances have dramati-
cally changed over these years. Even so, there is no
need to ignore the lessons of this history in current
policy discussions. Boxes 10 and 11 indicate the rich-
ness—and the relevance—of such “ancient” strategies
for today.
Box 10: Some Lessons from “Ancient” History: 19th Century Financing of Railroads
Nineteenth-century infrastructure investments included canals, docks, electric power grids, sanitation sys-
tems, telegraph systems, tramways, and turnpikes, but railways were the most prominent and capital-intensive
of these investments. Private participation in fi nancing railroad construction was seen then—just as it is seen
today—as a way to minimize the ineffi ciencies of public administration, to reduce the fi nancial burden on gov-
ernments, and to avoid the need for external borrowing. In fact, for much of the nineteenth century infrastruc-
ture projects were privately fi nanced and built.
According to Eichengreen (1995), however, government intervention continued to be important, even with
private fi nancing. The ability of domestic fi nancial markets to underwrite the construction of ports, canals,
and railways was constrained, in part because of informational asymmetries characteristic of markets in the
early stages of development. To help with these problems and to attract private investment, lenders turned
to fi nancial institutions that specialized in assessing projects and monitoring management, typically foreign
institutions with foreign clienteles whose experience with privately fi nanced projects had given them a head
start in raising capital and judging risk. This approach relieved—but did not eliminate—concerns about inad-
equate information. Further, private investment did not reduce the government’s involvement or the need for
foreign borrowing. Often, however, government intervention simply replaced one set of problems with another.
Because of the diffi culties of assessing projects, investors were reluctant to commit their funds, and govern-
continued
36 WOLFENSOHN CENTER FOR DEVELOPMENT
ments were often forced to use subsidies and loan guarantees to encourage investment. However, investors
with government-guaranteed loans had no incentive to monitor the fi rm’s performance, a limitation that led to
the diversion of funds and that frustrated the public interest. At the same time, government policies to over-
come asymmetric information encouraged management to engage in bankruptcy for profi t (a problem termed
“looting”).
These nineteenth-century failings have implications for current attempts to exploit nontraditional approaches
to fi nancing infrastructure. Two further policy initiatives seem necessary, both of which necessitate govern-
ment involvement. First, efforts should be made to enhance the effectiveness of public administration, so that
government agencies are responsible for monitoring the effi ciency and performance of the enterprise, backed
by a credible threat of sanctions against managers who are tempted to enrich themselves. Second, policymak-
ers need to encourage the development of fi nancial institutions and instruments that can surmount informa-
tion problems and relieve the government of the need to provide subsidies and interest guarantees.
Source: Eichengreen (1995).
Box 10: Some Lessons from “Ancient” History: 19th Century Financing of Railroads (continued)
Box 11: Some Lessons from “Ancient” History: Resource Endowments and the Cost of Capital to Brazilian
State Governments
What determines the ability of governments to borrow, and to borrow at low cost? There is a large literature
that aims to explain what determines “country risk”, defi ned as the difference between the yield of a sover-
eign‘s bonds and the risk free rate; there is a much smaller literature that examines the determinants of risk
at the subnational level. Fritscher and Musacchio (2009) argue that an important explanatory factor for the
cost of capital in Brazilian state governments is the impact that resource endowments have on the capacity of
the government to pay. They use a newly created data base with state-level fi scal and risk premium data for
Brazil states between 1891 and 1930 to show that Brazilian states with natural endowments that allowed them
to export commodities that were in high demand (e.g., rubber and coffee) ended up having higher revenues per
capita and, thus lower costs of capital. The variation in revenues per capita was both a product of the varia-
tion in natural endowments that had differential impacts on the exports of the states and a commodity boom
that also had asymmetric effects among states. These two effects generated variation in revenues per capita
at the state level, in part because of the extreme form of fi scal decentralization that the Brazilian government
adopted in the Constitution of 1891, which gave states the sole right to tax exports. Their estimation results
show that the cost of capital for Brazilian states and the probability of issuing state debt in international capital
markets were highly correlated with state revenues per capita. They also fi nd that these variations in the cost
of capital had impacts on the states’ capacity to issue debt, their access to capital, and their ability to spend
on infrastructure. Indeed, Fritscher and Musacchio (2009) conclude that the setup of the 1891 Constitution
promoted some of the regional inequality that is still present today in Brazil.
After 1928 Brazilian states defaulted en masse, and the federal government had to assume all state debts,
which led to the end of state debt issues in international markets. By 1934 a new constitution was drafted, and
in 1937 Getulio Vargas rewrote the constitution to give the central government more powers, including a new
fi scal setup that destroyed the federalist pact of 1891-1930.
Source: Fritscher and Musacchio (2009).
MUNICIPAL FINANCE OF URBAN INFRASTRUCTURE 37
CONCLUSIONS: “BEST PRACTICES” AND AN AGENDA FOR RESEARCH
The key issues in infrastructure fi nance are simple
to state:
How can municipal governments choose the appro-
priate infrastructure project, including coordination
across government boundaries?
How can they fi nance it?
How can an overall federal structure be created in
which incentives—to get the means of fi nancing (e.g.,
pursue intergovernmental transfers simply because
the grant money is available, pursue borrowing
simply because it is believed that the central gov-
ernment will bail out municipal governments who
cannot repay loans), to maintain the facility (e.g.,
ignore maintenance simply because it is believed
that a new facility will be provided by “others”), to
use the facility effi ciently and equitably—are not un-
duly distorted?
Answering these questions is more difficult. The
process(es) by which finance schemes are actually
chosen is not well understood. The process(es) by
which facilities can be fi nanced is plagued with dif-
ficulties and uncertainties. It seems very unlikely
that municipal governments, especially in the poorer
countries, will be able soon to generate the funds
needed to build facilities: they do not have access to
capital markets, and they seldom generate signifi cant
revenues on their own (e.g., the property tax is unpro-
ductive, cost recovery is poor, access to productive
revenue sources is limited). The money must there-
fore come from elsewhere: transfers, private partner-
ships, privatization, or use of local government assets.
Even so, the immediate prospects for significant
funding of infrastructure seem, at best, quite cloudy.
The process (s) by which incentives can be improved
•
•
•
is also difficult to specify. Moral hazard problems
abound, especially on municipal borrowing and on
their maintenance of facilities.
Given these considerations, my basic conclusions are
somewhat pessimistic. As summarized earlier, these
conclusions are:
The “theory” of fi scal federalism has many useful
and general guidelines, but the practical and spe-
cific relevance of these guidelines remains quite
limited.
In the specifi c context of municipal infrastructure
fi nance, there is little in the theory that allows one
to determine whether one infrastructure “scheme”
is “better” than another, whether one scheme will
be selected in one scenario and not in another,
whether one scheme will “work” in one scenario
and not in another, and the like.
There are in fact numerous examples where one
infrastructure scheme “works” in one institutional
setting and not in another, seemingly similar setting.
There are also numerous examples where countries
with seemingly similar institutional settings follow
very different paths in infrastructure fi nance.
The reasons for these differential outcomes are
unclear. Clearly, the often-poor administrative ca-
pabilities (including corruption) of municipal gov-
ernment employees are a factor, but other factors
seem relevant as well.
The full effects of different schemes—on service
delivery, on income distribution, on poverty reduc-
tion, and so on—are seldom fully quantifi ed or un-
derstood.
The extent of municipal infrastructure finance
seems quite limited—a result that parallels the lim-
ited extent of municipal revenue mobilization more
generally, especially from “conventional” sources
(e.g., taxes, user charges)—and it seems unlikely that
this can and will be changed quickly, if at all.
•
•
•
•
•
•
38 WOLFENSOHN CENTER FOR DEVELOPMENT
In large part, the reasons for the lack of clarity of
many of these issues relate to limitations on the
availability of basic information: data problems are
serious and endemic.
Despite this pessimism, however, I believe that are
potentially productive avenues by which our under-
standing of infrastructure schemes can be enhanced.
These avenues include the following types of research
activities, which build upon but which also go beyond
the discussion of “Some ‘Gaps’ in Our Understanding”
in the previous section:
Generating more reliable data on various dimen-
sions of infrastructure fi nance. It is especially im-
portant to have basic information on such items
as the extent of municipal infrastructure spend-
ing and the extent of local government assets,
generated via a uniform methodology that al-
lows cross-sectoral, cross-country, and multi-year
comparisons of municipality behavior to be made.
Such basic information is currently unavailable.
Developing data on administrative capacities of
local governments. As noted earlier, the OECD has
recently begun compiling information for mainly
OECD countries on various aspects of the qual-
ity of central government tax administration. A
similar effort for major municipalities around the
world would allow more accurate assessments of
administrative capabilities of these governments.
Incorporating recent approaches to valuing risky
investments in project appraisal. Modern fi nance
theory has made important innovations in evalu-
ating private investment projects. These innova-
tions may provide useful insights in evaluating
public projects, or social benefi t-cost analysis.
Incorporating institutional factors, including po-
litical elements, in analyses. There is little ques-
tion that the institutional context, especially local
•
1.
2.
3.
4.
governance, affects the success or failure of infra-
structure schemes. However, the specifi c channels
by which these institutions operate are not fully
understood.
Recognizing the role of non-for-profi t organiza-
tions in service delivery. The importance of civic
society organizations in services is increasing rec-
ognized but insuffi ciently understood. Do these
organizations crowd out municipally provided ser-
vices, as fi nancially strapped local governments
opt out of services in sectors in which they believe
not-for-profi t organizations operate? Or do not-
for-profi t organizations act as a complement to
municipal government services?
In sum, let me return to and emphasize a common
theme throughout: our “theories” provide some gen-
eral guidance on how to provide infrastructure but lit-
tle specifi c advice on the mechanics of infrastructure
provision. In fact, Slack (2007) believes that, in a fun-
damental sense, economics plays little role in many of
these actual decisions:
“… rarely are these economic principles used to
determine the optimal government structure.
More often, the structures that are imposed are
dictated by politics, and not economics.
This does not mean, I believe, that our theories—in this
domain and elsewhere—are not useful: they provide
a necessary framework in which we can think about
these issues, and they also often allow us to identify
specifi c policies that are clearly inconsistent with our
theories and whose implementation would clearly
lead to ineffi ciencies and inequities. However, practi-
cal implementation requires that we also incorporate
the specifi cs of any country’s institutional structure in
devising and implementing specifi c policies.
5.
MUNICIPAL FINANCE OF URBAN INFRASTRUCTURE 39
REFERENCES
Ahmad, Ehtisham, Maria Ablino-War, and Raju
Singh (2005). “Subnational Public Financial
Management: Institutions and Macroeconomic
Considerations,” IMF Staff Working Paper ,
WP/05/108 (Washington, DC: International
Monetary Fund).
Alm, James (1997). “Revenue Assignment and
Mobilization in Bangladesh,” The World Bank
(Washington, DC).
Alm, James and Sri Mulyani Indrawati (2004).
“Decentral ization and Local Government
Bo r row i n g i n I n d o n es i a ,” i n Refo r m i n g
Intergovernmental Fiscal Relations and the
Rebuilding of Indonesia—The ‘Big Bang’ Program
and its Economic Consequences, James Alm,
Jorge Martinez-Vazquez, and Sri Mulyani
Indrawati, eds. (Cheltenham, UK—Northampton,
MA: Edward Elgar Publishing).
Alm, James and Jorge Martinez-Vazquez (1997).
Bangladesh Municipal Finance Management
Sector Study, Infrastructure Operations Division,
Country Department 1, South Asia Region, The
World Bank (Washington, DC).
Alm, James and Jorge Martinez-Vazquez (2009).
“Assessing South Africa’s Provincial Equitable
Share,” ISP Working Paper (Atlanta, GA: Andrew
Young School of Policy Studies).
Annez, Patricia Clark (2006). “Urban Infrastructure
Finance from Private Operators: What Have
We Learned from Recent Experience?” World
Bank Policy Research, Working Paper 4045
(Washington, DC: The World Bank).
Bahl, Roy (1999). “Implementation Rules for
Fiscal Decentralization,” Proceedings of the
International Seminar on Land Policy and
Economic Development (Taiwan: International
Center for Land Policy Studies and Training).
Bahl, Roy and Richard Bird (2008). “Subnational
Taxes in Developing Countries: The Way Forward,”
Public Budgeting & Finance, 29 (1), 1-25.
Bahl, Roy and Johannes Linn (1992). Urban Public
Finance in Developing Countries (Oxford: Oxford
University Press).
Bennett, Maybelle Taylor and Leticia Perez (1986).
Block Grants: Beyond the Rhetoric—An Assessment
of the Last Four Years (Washington, DC: Coalition
on Human Needs).
Bird, Richard M. (1999). “Rethinking Subnational
Taxes: A New Look at Tax Assignment,” IMF Staff
Working Paper, WP/99/165 (Washington, D. C.:
International Monetary Fund).
Bird, Richard M. and Enid Slack (2007). “An Approach
to Metropolitan Governance and Finance,”
Environment and Planning C: Government and
Policy, 25, 729-755.
Bird, Richard M. and Francois Vaillancourt, eds. (1998).
Fiscal Decentralization in Developing Countries
(Cambridge: Cambridge University Press).
Davey, Ken (1988). “Municipal Development Funds
and Intermediaries,” Background Paper for 1988
World Development Report (Washington, D. C.:
The World Bank).
Dillinger, William, Guillermo Perry, and Steven B.
Webb (1999). “Macroeconomic Management in
Decentralized Democracies: The Quest for Hard
Budget Constraints in Latin America,” Framework
for Fiscal Federalism, 85-105.
40 WOLFENSOHN CENTER FOR DEVELOPMENT
Eichengreen, Barry (1995). “Financing Infrastructure
in Developing Countries: Lessons from the
Railway Age,” The World Bank Research Observer,
10 (1), 75-91.
Finegold, Kenneth, Laura Wherry, and Stephanie
Schardin (2004). “Block Grants: Historical
Overview and Lessons Learned,” The Urban
Institute, New Federalism—Issues and Options for
the States, Series A, No. A-63 (Washington, DC).
Fox, William F. (1994). Strategic Options for Urban
Infrastructure Management (Washington, D. C.:
The World Bank).
Fox, William and Kelly Edmiston (2000). “User Charge
Financing of Urban Public Services in Africa,”
ISP Working Paper, Number 00-04 (Atlanta,
GA: International Studies Program, Andrew
Young School of Policy Studies, Georgia State
University).
Freire, Maria E., Marcela Huertas, and Benjamin Darche
(1999). “Subnational Credit Markets: Selected
Cases,” Local Financing and Management
Capacity, 375-393.
Frischer, Andre C. Martinez and Also Musacchio
(2009). “Endowments, Fiscal Federalism, and the
Cost of Capital for States: Evidence from Brazil,
1891-1930,” Harvard Business School Working
Paper Working Paper 10-027.
Guthrie, Graeme (2006). “Regulating Infrastructure:
The Impact of Risk and Investment,” The Journal
of Economic Literature, 44 (4), 925-972.
Gwilliam, Kenneth M. (2002). Cities on the Move: A
World Bank Urban Transport Strategy Review
(Washington, DC: The World Bank).
Ha i lu , Dego l , Rafae l Guerre i ro Osor io, and
Raquel Tsukada (2009). “Privatization and
Renationalization: What Went Wrong in Bolivia’s
Water Sector?” International Policy Center for
Inclusive Growth, Working Paper No. 58 (Brasilia,
Brazil).
Hwang, Son, and Eom (1999). “Road Pricing and
Traffi c Congestion in Korea.”
Lane, Timothy D. (1993). “Market Discipline,” IMF Staff
Papers, 40 (1), 53-88.
Lewis, Blane D. (2003). “Local Government Borrowing
and Repayment in Indonesia: Does Fiscal Capacity
Matter?” World Development, 31 (6), 1047-1063.
Lalvani, Mala (2002). “Can Decentralization Limit
Government Growth? A Test of the Leviathan
Hypothesis for the Indian Federation,” Publius, 32
(3), 25-46.
McLure, Charles E. Jr. (1994). “The Tax Assignment
Problem: Ends, Means, and Constraints,”
Australian Tax Forum 11 (2), 153-183.
Musgrave, Richard A. (1959). The Theory of Public
Finance (New York, NY: McGraw-Hill Book
Company).
Musgrave, Richard A. (1983). “Who Should Tax,
Where, What?” In Charles E. McLure, Jr. (ed.),
Tax Assignment in Federal Countries (Center for
Research on Federal Financial Relations, 2-19).
Nabutola , Wafula (2006) . “Financing Urban
Infrastructure Development and Maintenance
with Particular Reference to Nairobi,” Promoting
Land Administration and Good Governance 5th FIG
Regional Conference, Accra, Ghana.
MUNICIPAL FINANCE OF URBAN INFRASTRUCTURE 41
Nallathiga, Ramakrishna (2009). “Private Sector
Participation in the Provision of Urban Water
Supply: Examining the Options and Scope
in Mumbai,” The Icfai University Journal of
Infrastructure, 7 (2) 27-39.
Nallathiga, Ramakrishna (2009). “Envisioning
a Comprehensive Transport Strategy for
Mumbai,” Quarterly Indian Journal of Transport
Management, 9, 71-86.
Nicolini, Juan Pablo, Josephina Posadas, Juan
Sanguinetti, Pablo Sanguinetti, and Mariano
Tommasi (2002). “Decentralization, Fiscal
Discipline in Subnational Governments, and the
Bailout Problem: The Case of Argentina,” IDB
Working Paper, No. 467 (Washington, DC: Inter-
American Development Bank).
Noel, Michel (2000). “Building Sub-national Credit
Markets in Developing and Transition Countries—
A Framework for Analysis, Policy Reform, and
Assistance Strategy,” Private and Financial
Sector Development Department Working Paper
(Washington, DC: The World Bank).
Oates, Wallace (1972). The Economic Theory of
Federalism (Englewood Cliffs, NJ: Harcourt,
Brace, and Jovanovich).
Oates, Wallace E. (1993). “Federalism and Government
Finance.” In John M. Quigley and Eugene
Smolensky (eds.), Modern Public Finance (Boston,
MA: Harvard University Press, 126-151).
Oates Wallace (1999). “An Essay on Fiscal Federalism,”
The Journal of Economic Literature, 37 (3), 1120-
1149.
Olken, Benjamin A. and Monica Singhal (2009).
“Informal Taxation,” Working Paper.
Peterson, George E., Randall R. Bovbjerg, Barbara A.
Davis, Walter G. Davis, Eugene C. Durman, and
Theresa A. Gullo (1986). The Reagan Block Grants:
What Have We Learned? (Washington, DC: Urban
Institute Press).
Peterson, George (2000). “Building Local Credit
Systems,” Urban Management Program Working
Paper (Washington, DC: The World Bank).
Peterson, George (2009). Unlocking Land Values to
Finance Urban Infrastructure, Trends and Policy
Options Series (Washington, DC: PPIAF).
Robins, Leonard (1976). “The Impact of Converting
Categorical into Block Grants: The Lessons from
the 314(d) Block Grant in the Partnership for
Health Act,” Publius, 6 (1), 49-70.
Slack, Enid (2007). “Managing the Coordination of
Service Delivery in Metropolitan Cities: The Role
of Metropolitan Goverance,” World Bank Policy
Research Working Paper, WPS4317 (Washington,
D. C.: The World Bank).
Slack, Enid and Rupak Chattopadhyay, eds. (2009).
Finance and Governance of Capital Cities in
Federal Systems (McGill, Canada: McGill Queen’s
University Press).
Stenberg, Carl W. and David B. Walker (1977).
“The Block Grant: Lessons from Two Early
Experiments,” Publius, 7 (2), 31-60.
Tanz i , V i to ( 1996) . “F i sca l Federa l i sm and
Decentralization: A Review of Some Effi ciency and
Macroeconomic Aspects.” In Annual World Bank
Conference on Development Economics, Michael
Bruno and Boris Pleskovic, eds. (Washington, DC:
The World Bank).
42 WOLFENSOHN CENTER FOR DEVELOPMENT
Ter-Minassian, Teresa (1996). “Borrowing by
Subnational Governments: Issues and Selected
International Experiences,” International
Monetary Fund, Fiscal Affairs Department,
PPAA/96/4.
Ter-Minassian, Teresa and Jon Craig (1997). “Control
of Subnational Government Borrowing.” In Fiscal
Federalism in Theory and Practice, Teresa Ter-
Minassian, ed. (Washington, DC: International
Monetary Fund), 156-172.
Tiebout, Charles Charles M. Tiebout, A Pure Theory of
Local Expenditures, 64 J. Pol. Econ. 416 (1956);
U.S. General Accounting Offi ce (GAO) (1982). Lessons
Learned from Past Block Grants:
Implications for Congressional Oversight, GAO/IPE-82-
8 (Washington, DC).
Zax, Jeffrey S (1989). “Is There a Leviathan in Your
Neighborhood? The American Economic Review,
79 (3), 560-567.
Zhong, Lijin, Arthur P. J. Mol, and Tao Fu (2008).
“Public-private Partnerships in China’s Urban
Water Sector,” Environmental Management, 41,
863-877.
MUNICIPAL FINANCE OF URBAN INFRASTRUCTURE 43
ENDNOTESThere are of course mitigating factors here, all of
which argue against effi cient local government
provision. For example, if a public good provides
benefi ts not only locally but across jurisdictions,
then a local jurisdiction may discount some of
those benefi ts and under provide the good. In this
case, a higher level of government may be in a bet-
ter position to provide it; alternatively, the central
government may need to subsidize local govern-
ment expenditures. Similarly, there may be cases
where services can be provided more effi ciently at
larger scales than the local jurisdiction. An exam-
ple may be municipal solid waste: even large cities
may benefi t from sharing a single landfi ll rather
than procuring their own individually, and even
small towns and villages may benefi t from sharing
a single trash collection service. On the tax side,
if a local government tries to tax a mobile factor,
the factor can easily avoid the tax by moving out-
side the relevant jurisdiction, thereby leading to
a loss in revenues and causing distortions in the
economy. Generally speaking, because it is easier
for households, fi rms, and economic activities to
move within a nation than across nations, factors
are less mobile from the perspective of a central
government than from that of a local government.
This may be one reason for central governments
to subsidize local governments’ expenditures.
Finally, local governments may interact strategi-
cally, competing to attract and/or hold a larger
share of mobile tax bases. This phenomenon has
been characterized as a “race to the bottom”, as it
suggests poorer quality of public services as local
governments collectively cut tax rates.
For example, if the responsibility for some service
like infrastructure provision is not specifi cally
assigned to any government, or if the same re-
sponsibility is assigned to multiple levels of gov-
ernment, then it is commonly the case that each
level will assume – or argue – that it is the respon-
sibility of the other government (s) to provide the
1.
2.
service. The service will then be underprovided, if
provided at all.
See Tanzi (1996) and Ahmad, Albino-War, and
Singh (2005) for further discussion of the macro-
economic concerns stemming from decentraliza-
tion. See also Nicolini, Posadas, Sanguinetti, and
Tommas (2002) for analysis of these issues in the
specifi c case of Argentina.
A municipal “tax” can be defi ned as one that sat-
isfi es the following conditions:
The local governments decides whether or not to
levy the tax;
The government determines the tax base;
The government determines the tax rate;
The government administers the tax, including as-
sessment, enforcement, and collection; and
The government retains the revenues from the
tax.
Also, the payment of a “tax” (as opposed to a
“contribution” or a “fee”) does not entitle the tax-
payer to any specifi c government service.
5 See Tanzi (1996) and Ahmad, Albino-War, and
Singh (2005) for further discussion of the macro-
economic concerns stemming from decentraliza-
tion.
6. A “good” local tax should therefore have several
main characteristics: the tax base should be im-
mobile; the tax should generate adequate, pre-
dictable, and growing revenues; the tax should
be visible to and borne by local residents; the
tax should be perceived to be “fair”; and the tax
should be easy to administer by the local govern-
ment.
7. Note that local government revenues mainly
come three sources: fi scal transfers from the
central government (e.g., general block grants,
specifi c grants); revenue sharing from natural
resources (oil, gas, forestry, mining, fi shery), the
property tax, and user fees; and local own-source
revenues.
3.
4.
•
•
•
•
•
44 WOLFENSOHN CENTER FOR DEVELOPMENT
8. Projections of the revenue side were based upon
the following assumptions and procedures:
Local-own revenues were estimated using their
annual performance in 1999/2000.
Revenue sharing from natural resources was
based on Ministry of Finance calculations, which
project distributions to local governments in
2001.
Revenue sharing of property taxes and acquisition
fee was estimated using LPEM-FEUI simulations.
The general grant allocation was estimated us-
ing the LPEM-FEUI model, which will be used as
a grant allocation formula in the government
regulation.
Provincial governments were assumed to receive
revenue sharing from the income tax (20 per-
cent), which is not shared with district and city
governments.
Projections on the expenditure side used the fol-
lowing assumptions:
Routine expenditure was estimated using the fi g-
ure for 1999/2000.
Investment spending was calculated using the
DIK/List of investment activities that was submit-
ted by local governments to the central govern-
ment for the fi scal year 1999/2000.
9 For a detailed discussion of how to create local
credit systems, see especially Peterson (2000)
and Noel (2000).
•
•
•
•
•
•
•

Selected photos courtesy of the World Bank: cover left to right: (#4) Ami Vitale, (#6) John Isaac
The views expressed in this working paper do not necessarily refl ect the offi cial position of Brookings, its board or the advisory council members.
© 2010 The Brookings Institution
ISSN: 1939-9383

1775 Massachusetts Avenue, NWWashington, DC 20036202-797-6000www.brookings.edu/wolfensohncenter