Embed Size (px)
Citation preview
N. Šibalić i dr. Studija zavarivanja trenjem lima od aluminijske legure AlSi1MgMn
Tehnički vjesnik 23, 3(2016), 653-660 653
ISSN 1330-3651(Print), ISSN 1848-6339 (Online) DOI: 10.17559/TV-20131215184202
A STUDY ON FRICTION STIR WELDING OF AlSi1MgMn ALUMINIUM ALLOY PLATES Nikola Šibalić, Milan Vukčević, Mileta Janjić, Sreten Savićević
Original scientific paper Presented in this paper are an experimental investigation and numerical simulations of the Friction Stir Welding (FSW) process. The aim was to determine thermo-mechanical and kinematic parameters of the process of joining two AlSi1MgMn aluminium alloy plates with the thickness of 7,8 mm. Experimental study was designed based on the 2-level multifactorial design of experiment (DoE), with centre points. Parameters varied in the experiment were: welding speed, rotation speed, angle of pin slope, pin diameter and shoulder diameter. Based on the adopted geometric parameters, the family of tools was designed and manufactured for the experiment. The experiment was performed in laboratory conditions, which were similar to production environment. Numerical simulation of the FSW process was carried out using DEFORM-3D software. Detailed analysis of the process as well as comparison between experimental and numerical results is presented. Keywords: Friction Stir Welding - FSW; impact toughness; numerical simulation; pin; shoulder; tensile strength; welding forces Studija zavarivanja trenjem lima od aluminijske legure AlSi1MgMn
Izvorni znanstveni članak U radu su prezentirana eksperimentalna istraživanja i numeričke simulacije procesa zavarivanja trenjem (FSW). Cilj rada je određivanje termo-mehaničkih i kinematičkih parametara procesa spajanja lima od aluminijske legure AlSi1MgMn debljine 7,8 mm. Eksperimentalna istraživanja su projektirana na temelju usvojenog višefaktornog plana (DoE), s variranjem faktora na dvije razine i ponavljanjem u središnjoj točki plana. Parametri varirani u eksperimentu su: brzina zavarivanja, kutna brzina okretanja alata, kut nagiba trna, promjer trna i promjer čela alata. Na temelju usvojenih geometrijskih parametara projektirana je i izrađena familija alata. Eksperiment je proveden u laboratorijskim uvjetima, koji su slični proizvodnom okruženju. Za numeričku simulaciju procesa FSW, korišten je programski paket DEFORM-3D. U radu je prikazana detaljna analiza i usporedba istraživanih parametara dobivenih eksperimentalnim putem i numeričkom simulacijom. Ključne riječi: čelo alata; lomna žilavost; numerička simulacija; sile zavarivanja; trn; zatezna čvrstoća; zavarivanje trenjem - FSW 1 Introduction
During the nineties of the last century a new method
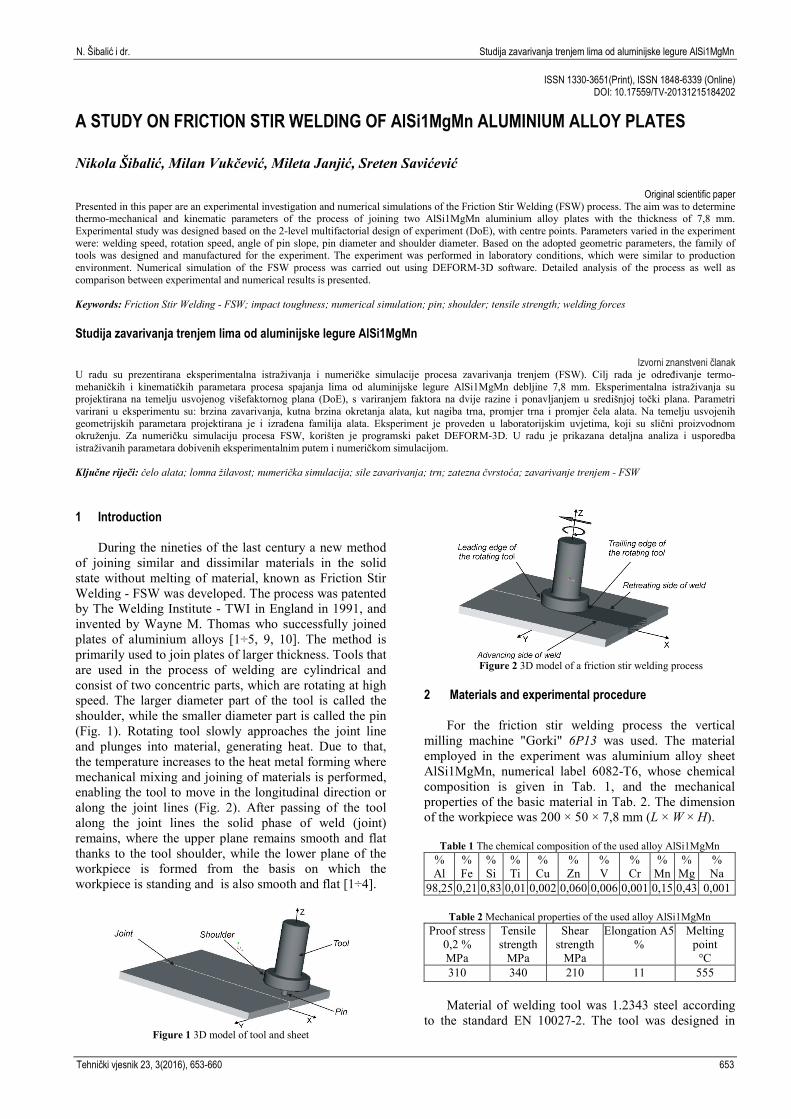
of joining similar and dissimilar materials in the solid state without melting of material, known as Friction Stir Welding - FSW was developed. The process was patented by The Welding Institute - TWI in England in 1991, and invented by Wayne M. Thomas who successfully joined plates of aluminium alloys [1÷5, 9, 10]. The method is primarily used to join plates of larger thickness. Tools that are used in the process of welding are cylindrical and consist of two concentric parts, which are rotating at high speed. The larger diameter part of the tool is called the shoulder, while the smaller diameter part is called the pin (Fig. 1). Rotating tool slowly approaches the joint line and plunges into material, generating heat. Due to that, the temperature increases to the heat metal forming where mechanical mixing and joining of materials is performed, enabling the tool to move in the longitudinal direction or along the joint lines (Fig. 2). After passing of the tool along the joint lines the solid phase of weld (joint) remains, where the upper plane remains smooth and flat thanks to the tool shoulder, while the lower plane of the workpiece is formed from the basis on which the workpiece is standing and is also smooth and flat [1÷4].
Figure 1 3D model of tool and sheet
Figure 2 3D model of a friction stir welding process
2 Materials and experimental procedure
For the friction stir welding process the vertical milling machine "Gorki" 6P13 was used. The material employed in the experiment was aluminium alloy sheet AlSi1MgMn, numerical label 6082-T6, whose chemical composition is given in Tab. 1, and the mechanical properties of the basic material in Tab. 2. The dimension of the workpiece was 200 × 50 × 7,8 mm (L × W × H).
Table 1 The chemical composition of the used alloy AlSi1MgMn % Al
% Fe
% Si
% Ti
% Cu
% Zn
% V
% Cr
% Mn
% Mg
% Na
98,25 0,21 0,83 0,01 0,002 0,060 0,006 0,001 0,15 0,43 0,001
Table 2 Mechanical properties of the used alloy AlSi1MgMn Proof stress
0,2 % MPa
Tensile strength
MPa
Shear strength
MPa
Elongation A5 %
Melting point °C
310 340 210 11 555
Material of welding tool was 1.2343 steel according to the standard EN 10027-2. The tool was designed in
A study on friction stir welding of AlSi1MgMn aluminium alloy plates N. Šibalić et al.
654 Technical Gazette 23, 3(2016), 653-660
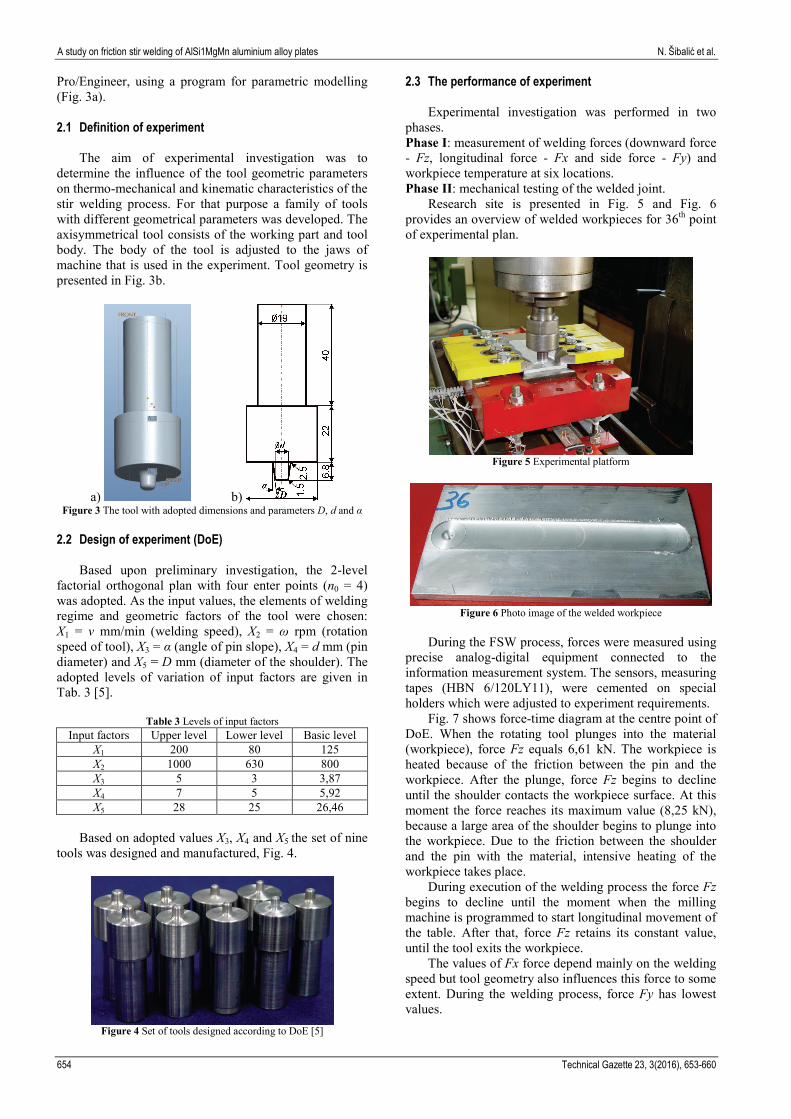
Pro/Engineer, using a program for parametric modelling (Fig. 3a).
2.1 Definition of experiment
The aim of experimental investigation was to determine the influence of the tool geometric parameters on thermo-mechanical and kinematic characteristics of the stir welding process. For that purpose a family of tools with different geometrical parameters was developed. The axisymmetrical tool consists of the working part and tool body. The body of the tool is adjusted to the jaws of machine that is used in the experiment. Tool geometry is presented in Fig. 3b.
a) b) Figure 3 The tool with adopted dimensions and parameters D, d and α
2.2 Design of experiment (DoE)
Based upon preliminary investigation, the 2-level factorial orthogonal plan with four enter points (n0 = 4) was adopted. As the input values, the elements of welding regime and geometric factors of the tool were chosen: X1 = v mm/min (welding speed), X2 = ω rpm (rotation speed of tool), X3 = α (angle of pin slope), X4 = d mm (pin diameter) and X5 = D mm (diameter of the shoulder). The adopted levels of variation of input factors are given in Tab. 3 [5].
Table 3 Levels of input factors Input factors Upper level Lower level Basic level
X1 200 80 125 X2 1000 630 800 X3 5 3 3,87 X4 7 5 5,92 X5 28 25 26,46
Based on adopted values X3, X4 and X5 the set of nine
tools was designed and manufactured, Fig. 4.
Figure 4 Set of tools designed according to DoE [5]
2.3 The performance of experiment
Experimental investigation was performed in two phases. Phase I: measurement of welding forces (downward force - Fz, longitudinal force - Fx and side force - Fy) and workpiece temperature at six locations. Phase II: mechanical testing of the welded joint.
Research site is presented in Fig. 5 and Fig. 6 provides an overview of welded workpieces for 36th point of experimental plan.
Figure 5 Experimental platform
Figure 6 Photo image of the welded workpiece
During the FSW process, forces were measured using
precise analog-digital equipment connected to the information measurement system. The sensors, measuring tapes (HBN 6/120LY11), were cemented on special holders which were adjusted to experiment requirements.
Fig. 7 shows force-time diagram at the centre point of DoE. When the rotating tool plunges into the material (workpiece), force Fz equals 6,61 kN. The workpiece is heated because of the friction between the pin and the workpiece. After the plunge, force Fz begins to decline until the shoulder contacts the workpiece surface. At this moment the force reaches its maximum value (8,25 kN), because a large area of the shoulder begins to plunge into the workpiece. Due to the friction between the shoulder and the pin with the material, intensive heating of the workpiece takes place.
During execution of the welding process the force Fz begins to decline until the moment when the milling machine is programmed to start longitudinal movement of the table. After that, force Fz retains its constant value, until the tool exits the workpiece.
The values of Fx force depend mainly on the welding speed but tool geometry also influences this force to some extent. During the welding process, force Fy has lowest values.
N. Šibalić i dr. Studija zavarivanja trenjem lima od aluminijske legure AlSi1MgMn
Tehnički vjesnik 23, 3(2016), 653-660 655
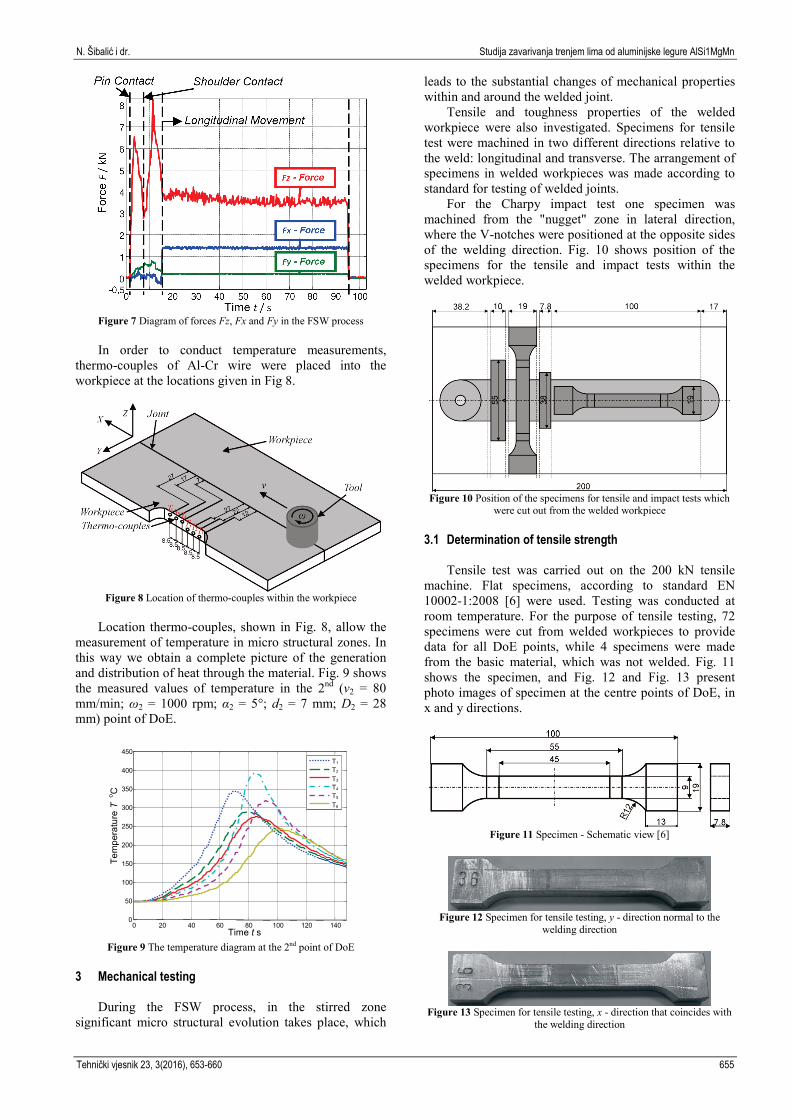
Figure 7 Diagram of forces Fz, Fx and Fy in the FSW process
In order to conduct temperature measurements,
thermo-couples of Al-Cr wire were placed into the workpiece at the locations given in Fig 8.
Figure 8 Location of thermo-couples within the workpiece
Location thermo-couples, shown in Fig. 8, allow the
measurement of temperature in micro structural zones. In this way we obtain a complete picture of the generation and distribution of heat through the material. Fig. 9 shows the measured values of temperature in the 2nd (v2 = 80 mm/min; ω2 = 1000 rpm; α2 = 5°; d2 = 7 mm; D2 = 28 mm) point of DoE.
Figure 9 The temperature diagram at the 2nd point of DoE
3 Mechanical testing
During the FSW process, in the stirred zone significant micro structural evolution takes place, which
leads to the substantial changes of mechanical properties within and around the welded joint.
Tensile and toughness properties of the welded workpiece were also investigated. Specimens for tensile test were machined in two different directions relative to the weld: longitudinal and transverse. The arrangement of specimens in welded workpieces was made according to standard for testing of welded joints.
For the Charpy impact test one specimen was machined from the "nugget" zone in lateral direction, where the V-notches were positioned at the opposite sides of the welding direction. Fig. 10 shows position of the specimens for the tensile and impact tests within the welded workpiece.
Figure 10 Position of the specimens for tensile and impact tests which
were cut out from the welded workpiece 3.1 Determination of tensile strength
Tensile test was carried out on the 200 kN tensile machine. Flat specimens, according to standard EN 10002-1:2008 [6] were used. Testing was conducted at room temperature. For the purpose of tensile testing, 72 specimens were cut from welded workpieces to provide data for all DoE points, while 4 specimens were made from the basic material, which was not welded. Fig. 11 shows the specimen, and Fig. 12 and Fig. 13 present photo images of specimen at the centre points of DoE, in x and y directions.
Figure 11 Specimen - Schematic view [6]
Figure 12 Specimen for tensile testing, y - direction normal to the
welding direction
Figure 13 Specimen for tensile testing, x - direction that coincides with
the welding direction
0 20 40 60 80 100 120 140 0 50
100 150 200 250 300 350 400 450
Time t s
Tem
pera
ture
T o C
T1 T2 T3 T4 T5 T6
A study on friction stir welding of AlSi1MgMn aluminium alloy plates N. Šibalić et al.
656 Technical Gazette 23, 3(2016), 653-660
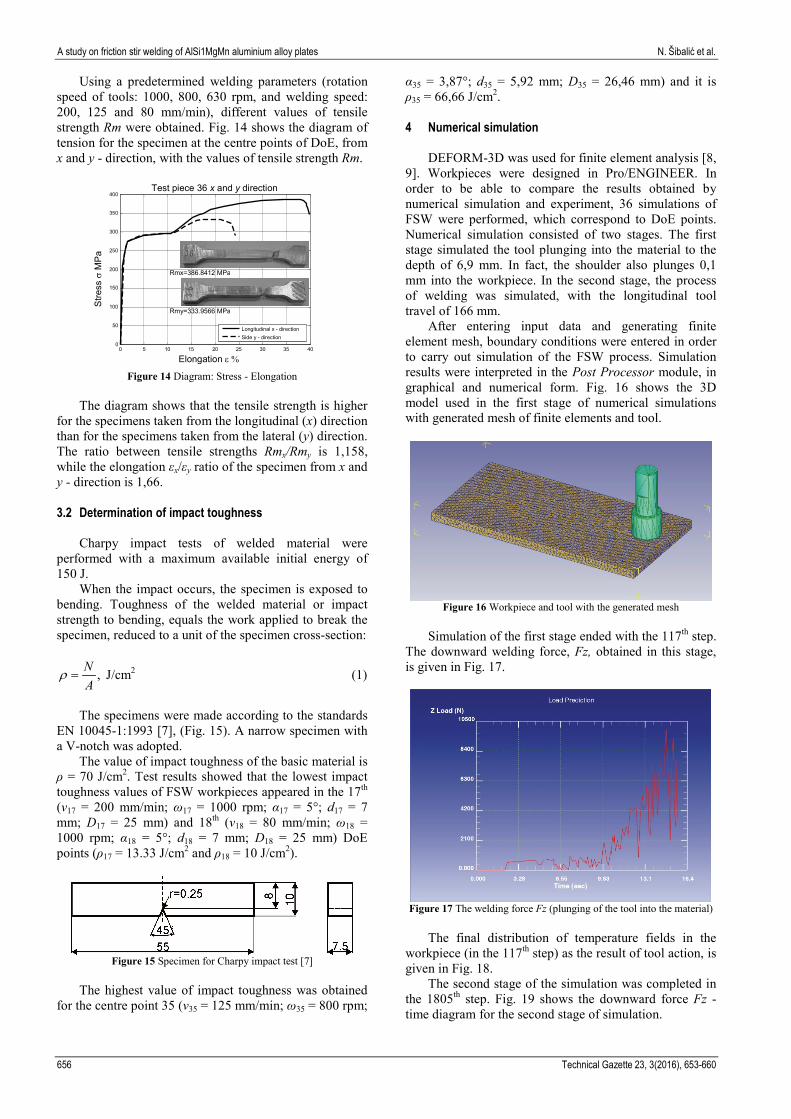
Using a predetermined welding parameters (rotation speed of tools: 1000, 800, 630 rpm, and welding speed: 200, 125 and 80 mm/min), different values of tensile strength Rm were obtained. Fig. 14 shows the diagram of tension for the specimen at the centre points of DoE, from x and y - direction, with the values of tensile strength Rm.
Figure 14 Diagram: Stress - Elongation
The diagram shows that the tensile strength is higher
for the specimens taken from the longitudinal (x) direction than for the specimens taken from the lateral (y) direction. The ratio between tensile strengths Rmx/Rmy is 1,158, while the elongation εx/εy ratio of the specimen from x and y - direction is 1,66. 3.2 Determination of impact toughness
Charpy impact tests of welded material were performed with a maximum available initial energy of 150 J.
When the impact occurs, the specimen is exposed to bending. Toughness of the welded material or impact strength to bending, equals the work applied to break the specimen, reduced to a unit of the specimen cross-section:
,AN
=ρ J/cm2 (1)
The specimens were made according to the standards
EN 10045-1:1993 [7], (Fig. 15). A narrow specimen with a V-notch was adopted.
The value of impact toughness of the basic material is ρ = 70 J/cm2. Test results showed that the lowest impact toughness values of FSW workpieces appeared in the 17th (v17 = 200 mm/min; ω17 = 1000 rpm; α17 = 5°; d17 = 7 mm; D17 = 25 mm) and 18th (v18 = 80 mm/min; ω18 = 1000 rpm; α18 = 5°; d18 = 7 mm; D18 = 25 mm) DoE points (ρ17 = 13.33 J/cm2 and ρ18 = 10 J/cm2).
Figure 15 Specimen for Charpy impact test [7]
The highest value of impact toughness was obtained
for the centre point 35 (v35 = 125 mm/min; ω35 = 800 rpm;
α35 = 3,87°; d35 = 5,92 mm; D35 = 26,46 mm) and it is ρ35 = 66,66 J/cm2. 4 Numerical simulation
DEFORM-3D was used for finite element analysis [8, 9]. Workpieces were designed in Pro/ENGINEER. In order to be able to compare the results obtained by numerical simulation and experiment, 36 simulations of FSW were performed, which correspond to DoE points. Numerical simulation consisted of two stages. The first stage simulated the tool plunging into the material to the depth of 6,9 mm. In fact, the shoulder also plunges 0,1 mm into the workpiece. In the second stage, the process of welding was simulated, with the longitudinal tool travel of 166 mm.
After entering input data and generating finite element mesh, boundary conditions were entered in order to carry out simulation of the FSW process. Simulation results were interpreted in the Post Processor module, in graphical and numerical form. Fig. 16 shows the 3D model used in the first stage of numerical simulations with generated mesh of finite elements and tool.
Figure 16 Workpiece and tool with the generated mesh
Simulation of the first stage ended with the 117th step.
The downward welding force, Fz, obtained in this stage, is given in Fig. 17.
Figure 17 The welding force Fz (plunging of the tool into the material)
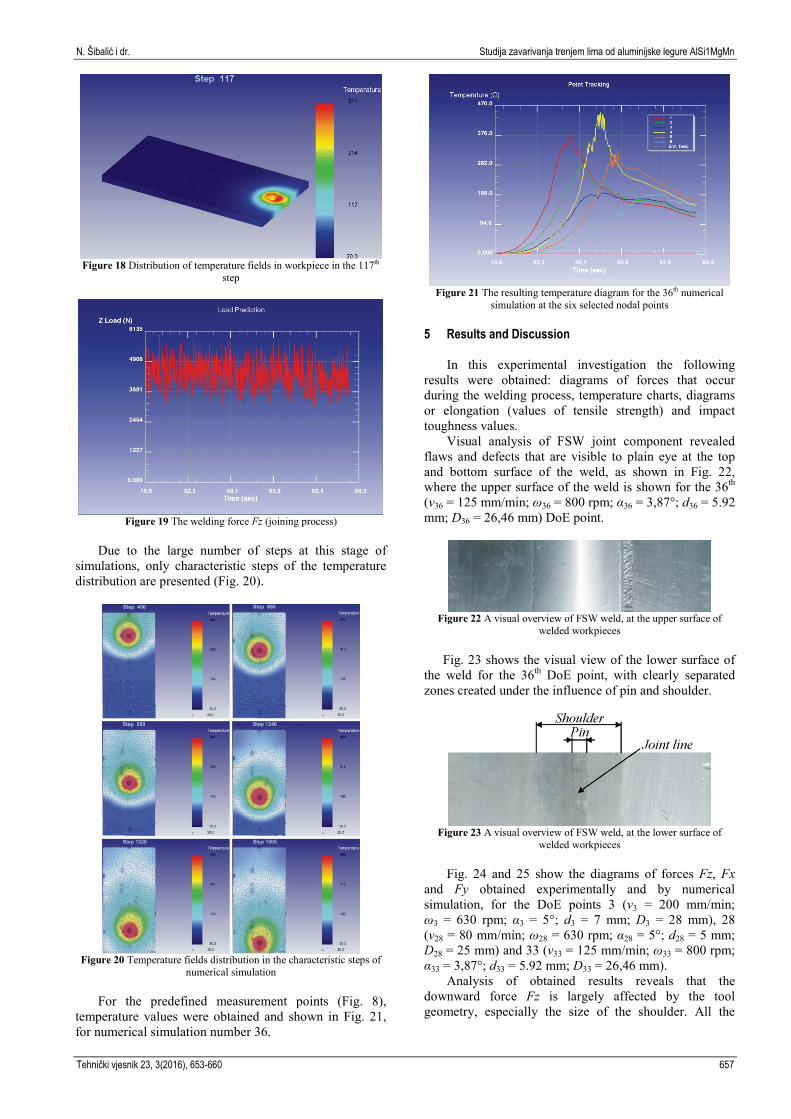
The final distribution of temperature fields in the
workpiece (in the 117th step) as the result of tool action, is given in Fig. 18.
The second stage of the simulation was completed in the 1805th step. Fig. 19 shows the downward force Fz - time diagram for the second stage of simulation.
0 5 10 15 20 25 30 35 40 0 50
100 150 200 250 300 350 400
Elongation ε %
Stre
ss σ
MP
a
Test piece 36 x and y direction
Rmx=386.8412 MPa
Rmy=333.9566 MPa Longitudinal x - direction Side y - direction
N. Šibalić i dr. Studija zavarivanja trenjem lima od aluminijske legure AlSi1MgMn
Tehnički vjesnik 23, 3(2016), 653-660 657
Figure 18 Distribution of temperature fields in workpiece in the 117th
step
Figure 19 The welding force Fz (joining process)
Due to the large number of steps at this stage of
simulations, only characteristic steps of the temperature distribution are presented (Fig. 20).
Figure 20 Temperature fields distribution in the characteristic steps of
numerical simulation For the predefined measurement points (Fig. 8),
temperature values were obtained and shown in Fig. 21, for numerical simulation number 36.
Figure 21 The resulting temperature diagram for the 36th numerical
simulation at the six selected nodal points 5 Results and Discussion
In this experimental investigation the following results were obtained: diagrams of forces that occur during the welding process, temperature charts, diagrams or elongation (values of tensile strength) and impact toughness values.
Visual analysis of FSW joint component revealed flaws and defects that are visible to plain eye at the top and bottom surface of the weld, as shown in Fig. 22, where the upper surface of the weld is shown for the 36th (v36 = 125 mm/min; ω36 = 800 rpm; α36 = 3,87°; d36 = 5.92 mm; D36 = 26,46 mm) DoE point.
Figure 22 A visual overview of FSW weld, at the upper surface of
welded workpieces
Fig. 23 shows the visual view of the lower surface of the weld for the 36th DoE point, with clearly separated zones created under the influence of pin and shoulder.
Figure 23 A visual overview of FSW weld, at the lower surface of
welded workpieces
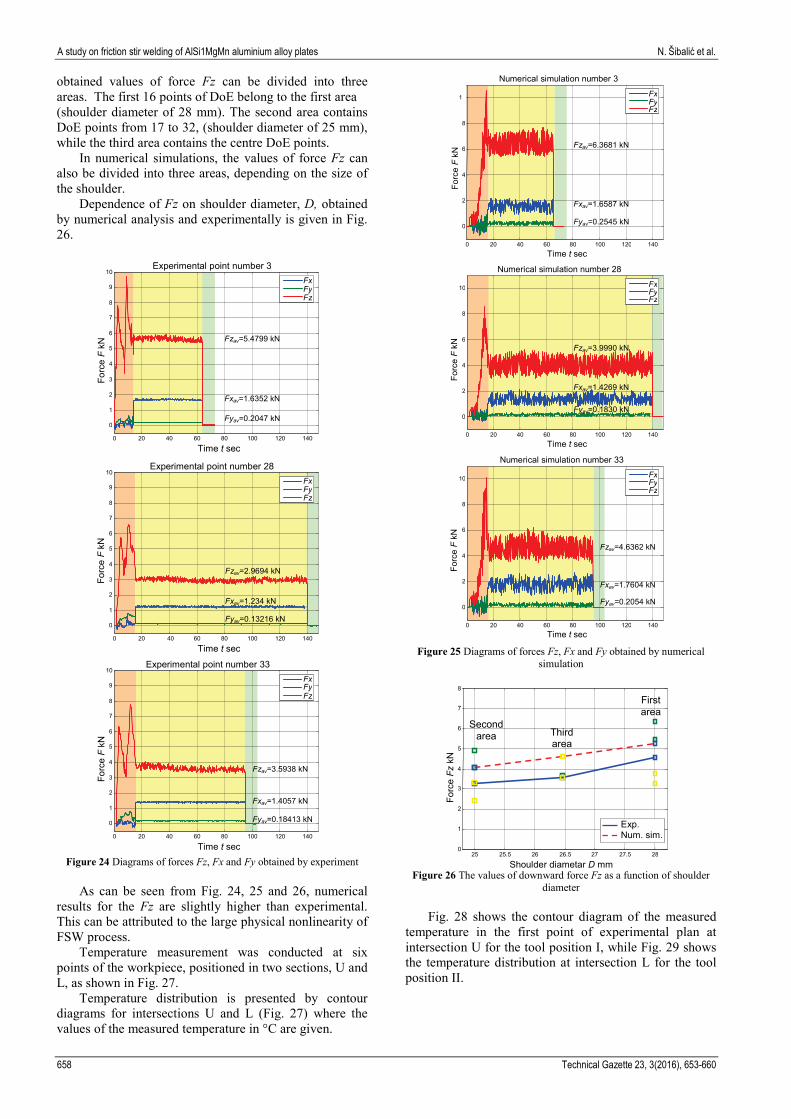
Fig. 24 and 25 show the diagrams of forces Fz, Fx and Fy obtained experimentally and by numerical simulation, for the DoE points 3 (v3 = 200 mm/min; ω3 = 630 rpm; α3 = 5°; d3 = 7 mm; D3 = 28 mm), 28 (v28 = 80 mm/min; ω28 = 630 rpm; α28 = 5°; d28 = 5 mm; D28 = 25 mm) and 33 (v33 = 125 mm/min; ω33 = 800 rpm; α33 = 3,87°; d33 = 5.92 mm; D33 = 26,46 mm).
Analysis of obtained results reveals that the downward force Fz is largely affected by the tool geometry, especially the size of the shoulder. All the
A study on friction stir welding of AlSi1MgMn aluminium alloy plates N. Šibalić et al.
658 Technical Gazette 23, 3(2016), 653-660
obtained values of force Fz can be divided into three areas. The first 16 points of DoE belong to the first area (shoulder diameter of 28 mm). The second area contains DoE points from 17 to 32, (shoulder diameter of 25 mm), while the third area contains the centre DoE points.
In numerical simulations, the values of force Fz can also be divided into three areas, depending on the size of the shoulder.
Dependence of Fz on shoulder diameter, D, obtained by numerical analysis and experimentally is given in Fig. 26.
Figure 24 Diagrams of forces Fz, Fx and Fy obtained by experiment
As can be seen from Fig. 24, 25 and 26, numerical
results for the Fz are slightly higher than experimental. This can be attributed to the large physical nonlinearity of FSW process.
Temperature measurement was conducted at six points of the workpiece, positioned in two sections, U and L, as shown in Fig. 27.
Temperature distribution is presented by contour diagrams for intersections U and L (Fig. 27) where the values of the measured temperature in °C are given.
Figure 25 Diagrams of forces Fz, Fx and Fy obtained by numerical
simulation
Figure 26 The values of downward force Fz as a function of shoulder
diameter
Fig. 28 shows the contour diagram of the measured temperature in the first point of experimental plan at intersection U for the tool position I, while Fig. 29 shows the temperature distribution at intersection L for the tool position II.
25 25.5 26 26.5 27 27.5 28 0
1
2
3
4
5
6
7
8
Shoulder diametar D mm
Forc
e Fz
kN
Third area
Exp. Num. sim.
Second area
First area
Numerical simulation number 33
0 20 40 60 80 100 120 140
0
2
4
6
8
10
Time t sec
Forc
e F
kN
Fzav=4.6362 kN
Fxav=1.7604 kN
Fyav=0.2054 kN
Fx Fy Fz
0 20 40 60 80 100 120 140
0
2
4
6
8
10
Time t sec Fo
rce
F kN
Numerical simulation number 28
Fzav=3.9990 kN
Fxav=1.4269 kN
Fx Fy Fz
Fyav=0.1830 kN
0 20 40 60 80 100 120 140
0
2
4
6
8
1
Time t sec
Forc
e F
kN
Numerical simulation number 3
Fzav=6.3681 kN
Fxav=1.6587 kN
Fx Fy Fz
Fyav=0.2545 kN
0 20 40 60 80 100 120 140 0
1
2
3
4
5
6
7
8
9
10
Time t sec
Forc
e F
kN
Experimental point number 33
Fzav=3.5938 kN
Fxav=1.4057 kN
Fx Fy Fz
Fyav=0.18413 kN
0 20 40 60 80 100 120 140 0
1
2
3
4
5
6
7
8
9
10
Time t sec
Forc
e F
kN
Experimental point number 28
Fzav=2.9694 kN
Fx Fy Fz
Fxav=1.234 kN
Fyav=0.13216 kN
0 20 40 60 80 100 120 140 0
1
2
3
4
5
6
7
8
9
10
Time t sec
Forc
e F
kN
Experimental point number 3
Fzav=5.4799 kN
Fxav=1.6352 kN
Fx Fy Fz
Fyav=0.2047 kN
N. Šibalić i dr. Studija zavarivanja trenjem lima od aluminijske legure AlSi1MgMn
Tehnički vjesnik 23, 3(2016), 653-660 659
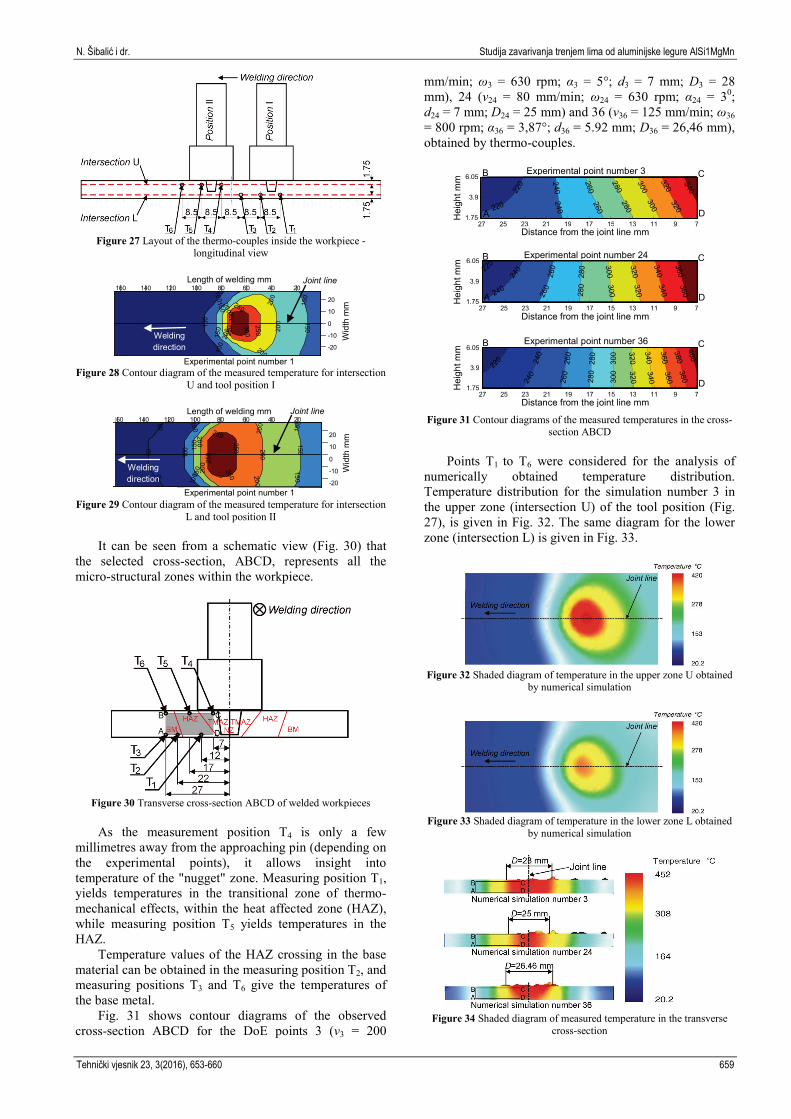
Figure 27 Layout of the thermo-couples inside the workpiece -
longitudinal view
Figure 28 Contour diagram of the measured temperature for intersection
U and tool position I
Figure 29 Contour diagram of the measured temperature for intersection
L and tool position II
It can be seen from a schematic view (Fig. 30) that the selected cross-section, ABCD, represents all the micro-structural zones within the workpiece.
Figure 30 Transverse cross-section ABCD of welded workpieces
As the measurement position T4 is only a few
millimetres away from the approaching pin (depending on the experimental points), it allows insight into temperature of the "nugget" zone. Measuring position T1, yields temperatures in the transitional zone of thermo-mechanical effects, within the heat affected zone (HAZ), while measuring position T5 yields temperatures in the HAZ.
Temperature values of the HAZ crossing in the base material can be obtained in the measuring position T2, and measuring positions T3 and T6 give the temperatures of the base metal.
Fig. 31 shows contour diagrams of the observed cross-section ABCD for the DoE points 3 (v3 = 200
mm/min; ω3 = 630 rpm; α3 = 5°; d3 = 7 mm; D3 = 28 mm), 24 (v24 = 80 mm/min; ω24 = 630 rpm; α24 = 30; d24 = 7 mm; D24 = 25 mm) and 36 (v36 = 125 mm/min; ω36 = 800 rpm; α36 = 3,87°; d36 = 5.92 mm; D36 = 26,46 mm), obtained by thermo-couples.
Figure 31 Contour diagrams of the measured temperatures in the cross-section ABCD
Points T1 to T6 were considered for the analysis of
numerically obtained temperature distribution. Temperature distribution for the simulation number 3 in the upper zone (intersection U) of the tool position (Fig. 27), is given in Fig. 32. The same diagram for the lower zone (intersection L) is given in Fig. 33.
Figure 32 Shaded diagram of temperature in the upper zone U obtained
by numerical simulation
Figure 33 Shaded diagram of temperature in the lower zone L obtained
by numerical simulation
Figure 34 Shaded diagram of measured temperature in the transverse
cross-section
27 25 23 21 19 17 15 13 11 9 7 1.75 3.9
6.05 Experimental point number 36
Distance from the joint line mm
Hei
ght m
m
B C
D
27 25 23 21 19 17 15 13 11 9 7 1.75 3.9
6.05 Experimental point number 3
Distance from the joint line mm
Hei
ght m
m B C
D A
27 25 23 21 19 17 15 13 11 9 7 1.75 3.9
6.05 Experimental point number 24
Distance from the joint line mm
Hei
ght m
m
B C
D A
20406080100120140160
-20
-10
0
10
20
150150
150
200200
200
250250
250
250
200
200100
150
150
100
100
50
5050
Wid
th m
m
Welding direction
Experimental point number 1
Joint line Length of welding mm
20406080100120140160
-20
-10
0
10
20
150
150
200
200
200
250
300
250
300
200
250
200
150100
100
15010
0
Wid
th m
m
Welding direction
Length of welding mm Joint line
Experimental point number 1
A study on friction stir welding of AlSi1MgMn aluminium alloy plates N. Šibalić et al.
660 Technical Gazette 23, 3(2016), 653-660
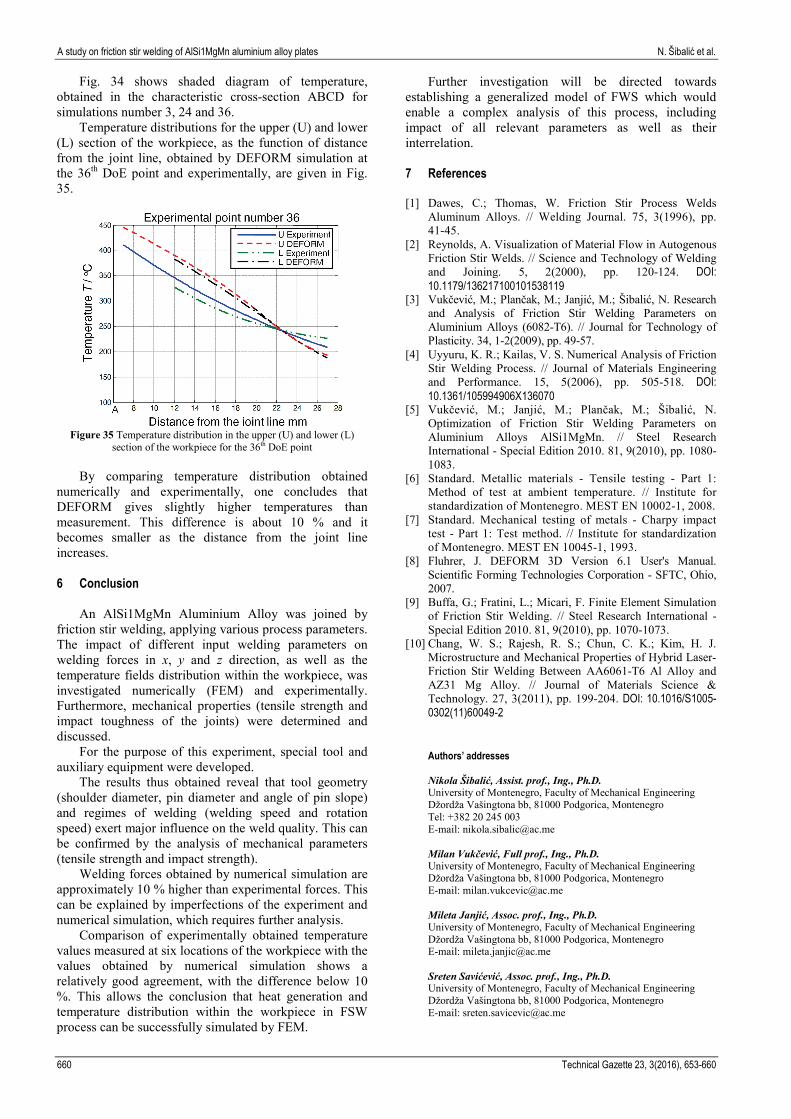
Fig. 34 shows shaded diagram of temperature, obtained in the characteristic cross-section ABCD for simulations number 3, 24 and 36.
Temperature distributions for the upper (U) and lower (L) section of the workpiece, as the function of distance from the joint line, obtained by DEFORM simulation at the 36th DoE point and experimentally, are given in Fig. 35.
Figure 35 Temperature distribution in the upper (U) and lower (L)
section of the workpiece for the 36th DoE point
By comparing temperature distribution obtained numerically and experimentally, one concludes that DEFORM gives slightly higher temperatures than measurement. This difference is about 10 % and it becomes smaller as the distance from the joint line increases. 6 Conclusion
An AlSi1MgMn Aluminium Alloy was joined by friction stir welding, applying various process parameters. The impact of different input welding parameters on welding forces in x, y and z direction, as well as the temperature fields distribution within the workpiece, was investigated numerically (FEM) and experimentally. Furthermore, mechanical properties (tensile strength and impact toughness of the joints) were determined and discussed.
For the purpose of this experiment, special tool and auxiliary equipment were developed.
The results thus obtained reveal that tool geometry (shoulder diameter, pin diameter and angle of pin slope) and regimes of welding (welding speed and rotation speed) exert major influence on the weld quality. This can be confirmed by the analysis of mechanical parameters (tensile strength and impact strength).
Welding forces obtained by numerical simulation are approximately 10 % higher than experimental forces. This can be explained by imperfections of the experiment and numerical simulation, which requires further analysis.
Comparison of experimentally obtained temperature values measured at six locations of the workpiece with the values obtained by numerical simulation shows a relatively good agreement, with the difference below 10 %. This allows the conclusion that heat generation and temperature distribution within the workpiece in FSW process can be successfully simulated by FEM.
Further investigation will be directed towards establishing a generalized model of FWS which would enable a complex analysis of this process, including impact of all relevant parameters as well as their interrelation. 7 References [1] Dawes, C.; Thomas, W. Friction Stir Process Welds
Aluminum Alloys. // Welding Journal. 75, 3(1996), pp. 41-45.
[2] Reynolds, A. Visualization of Material Flow in Autogenous Friction Stir Welds. // Science and Technology of Welding and Joining. 5, 2(2000), pp. 120-124. DOI: 10.1179/136217100101538119
[3] Vukčević, M.; Plančak, M.; Janjić, M.; Šibalić, N. Research and Analysis of Friction Stir Welding Parameters on Aluminium Alloys (6082-T6). // Journal for Technology of Plasticity. 34, 1-2(2009), pp. 49-57.
[4] Uyyuru, K. R.; Kailas, V. S. Numerical Analysis of Friction Stir Welding Process. // Journal of Materials Engineering and Performance. 15, 5(2006), pp. 505-518. DOI: 10.1361/105994906X136070
[5] Vukčević, M.; Janjić, M.; Plančak, M.; Šibalić, N. Optimization of Friction Stir Welding Parameters on Aluminium Alloys AlSi1MgMn. // Steel Research International - Special Edition 2010. 81, 9(2010), pp. 1080-1083.
[6] Standard. Metallic materials - Tensile testing - Part 1: Method of test at ambient temperature. // Institute for standardization of Montenegro. MEST EN 10002-1, 2008.
[7] Standard. Mechanical testing of metals - Charpy impact test - Part 1: Test method. // Institute for standardization of Montenegro. MEST EN 10045-1, 1993.
[8] Fluhrer, J. DEFORM 3D Version 6.1 User's Manual. Scientific Forming Technologies Corporation - SFTC, Ohio, 2007.
[9] Buffa, G.; Fratini, L.; Micari, F. Finite Element Simulation of Friction Stir Welding. // Steel Research International - Special Edition 2010. 81, 9(2010), pp. 1070-1073.
[10] Chang, W. S.; Rajesh, R. S.; Chun, C. K.; Kim, H. J. Microstructure and Mechanical Properties of Hybrid Laser-Friction Stir Welding Between AA6061-T6 Al Alloy and AZ31 Mg Alloy. // Journal of Materials Science & Technology. 27, 3(2011), pp. 199-204. DOI: 10.1016/S1005-0302(11)60049-2
Authors’ addresses Nikola Šibalić, Assist. prof., Ing., Ph.D. University of Montenegro, Faculty of Mechanical Engineering Džordža Vašingtona bb, 81000 Podgorica, Montenegro Tel: +382 20 245 003 E-mail: [email protected] Milan Vukčević, Full prof., Ing., Ph.D. University of Montenegro, Faculty of Mechanical Engineering Džordža Vašingtona bb, 81000 Podgorica, Montenegro E-mail: [email protected] Mileta Janjić, Assoc. prof., Ing., Ph.D. University of Montenegro, Faculty of Mechanical Engineering Džordža Vašingtona bb, 81000 Podgorica, Montenegro E-mail: [email protected] Sreten Savićević, Assoc. prof., Ing., Ph.D. University of Montenegro, Faculty of Mechanical Engineering Džordža Vašingtona bb, 81000 Podgorica, Montenegro E-mail: [email protected]