Embed Size (px)
Citation preview
*X7337511*
N5
©
NationalQualications2016
Total marks — 60
SECTION 1 — PHYSICAL ENVIRONMENTS — 20 marks
Attempt EITHER question 1 OR question 2. ALSO attempt questions 3, 4, and 5.
SECTION 2 — HUMAN ENVIRONMENTS — 20 marks
Attempt questions 6, 7 and 8
SECTION 3 — GLOBAL ISSUES — 20 marks
Attempt any TWO of the following
Question 9 — Climate Change
Question 10 — Impact of Human Activity on the Natural Environment
Question 11 — Environmental Hazards
Question 12 — Trade and Globalisation
Question 13 — Tourism
Question 14 — Health
Credit will always be given for appropriately labelled sketch maps and diagrams.
Write your answers clearly in the answer booklet provided. In the answer booklet you must clearly identify the question number you are attempting.
Use blue or black ink.
Before leaving the examination room you must give your answer booklet to the Invigilator; if you do not, you may lose all the marks for this paper.
X733/75/11 Geography
FRIDAY, 6 MAY
1:00 PM – 2:45 PM
A/PB
Page 02
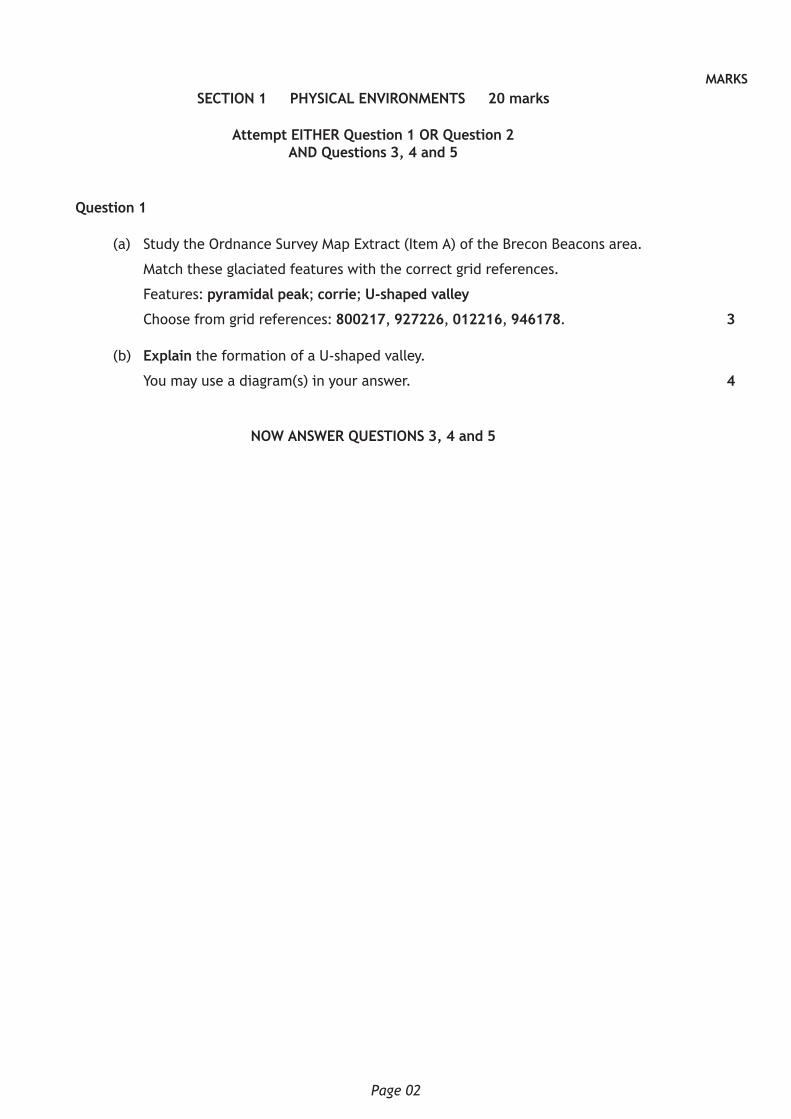
MARKSSECTION 1 — PHYSICAL ENVIRONMENTS — 20 marks
Attempt EITHER Question 1 OR Question 2AND Questions 3, 4 and 5
Question 1
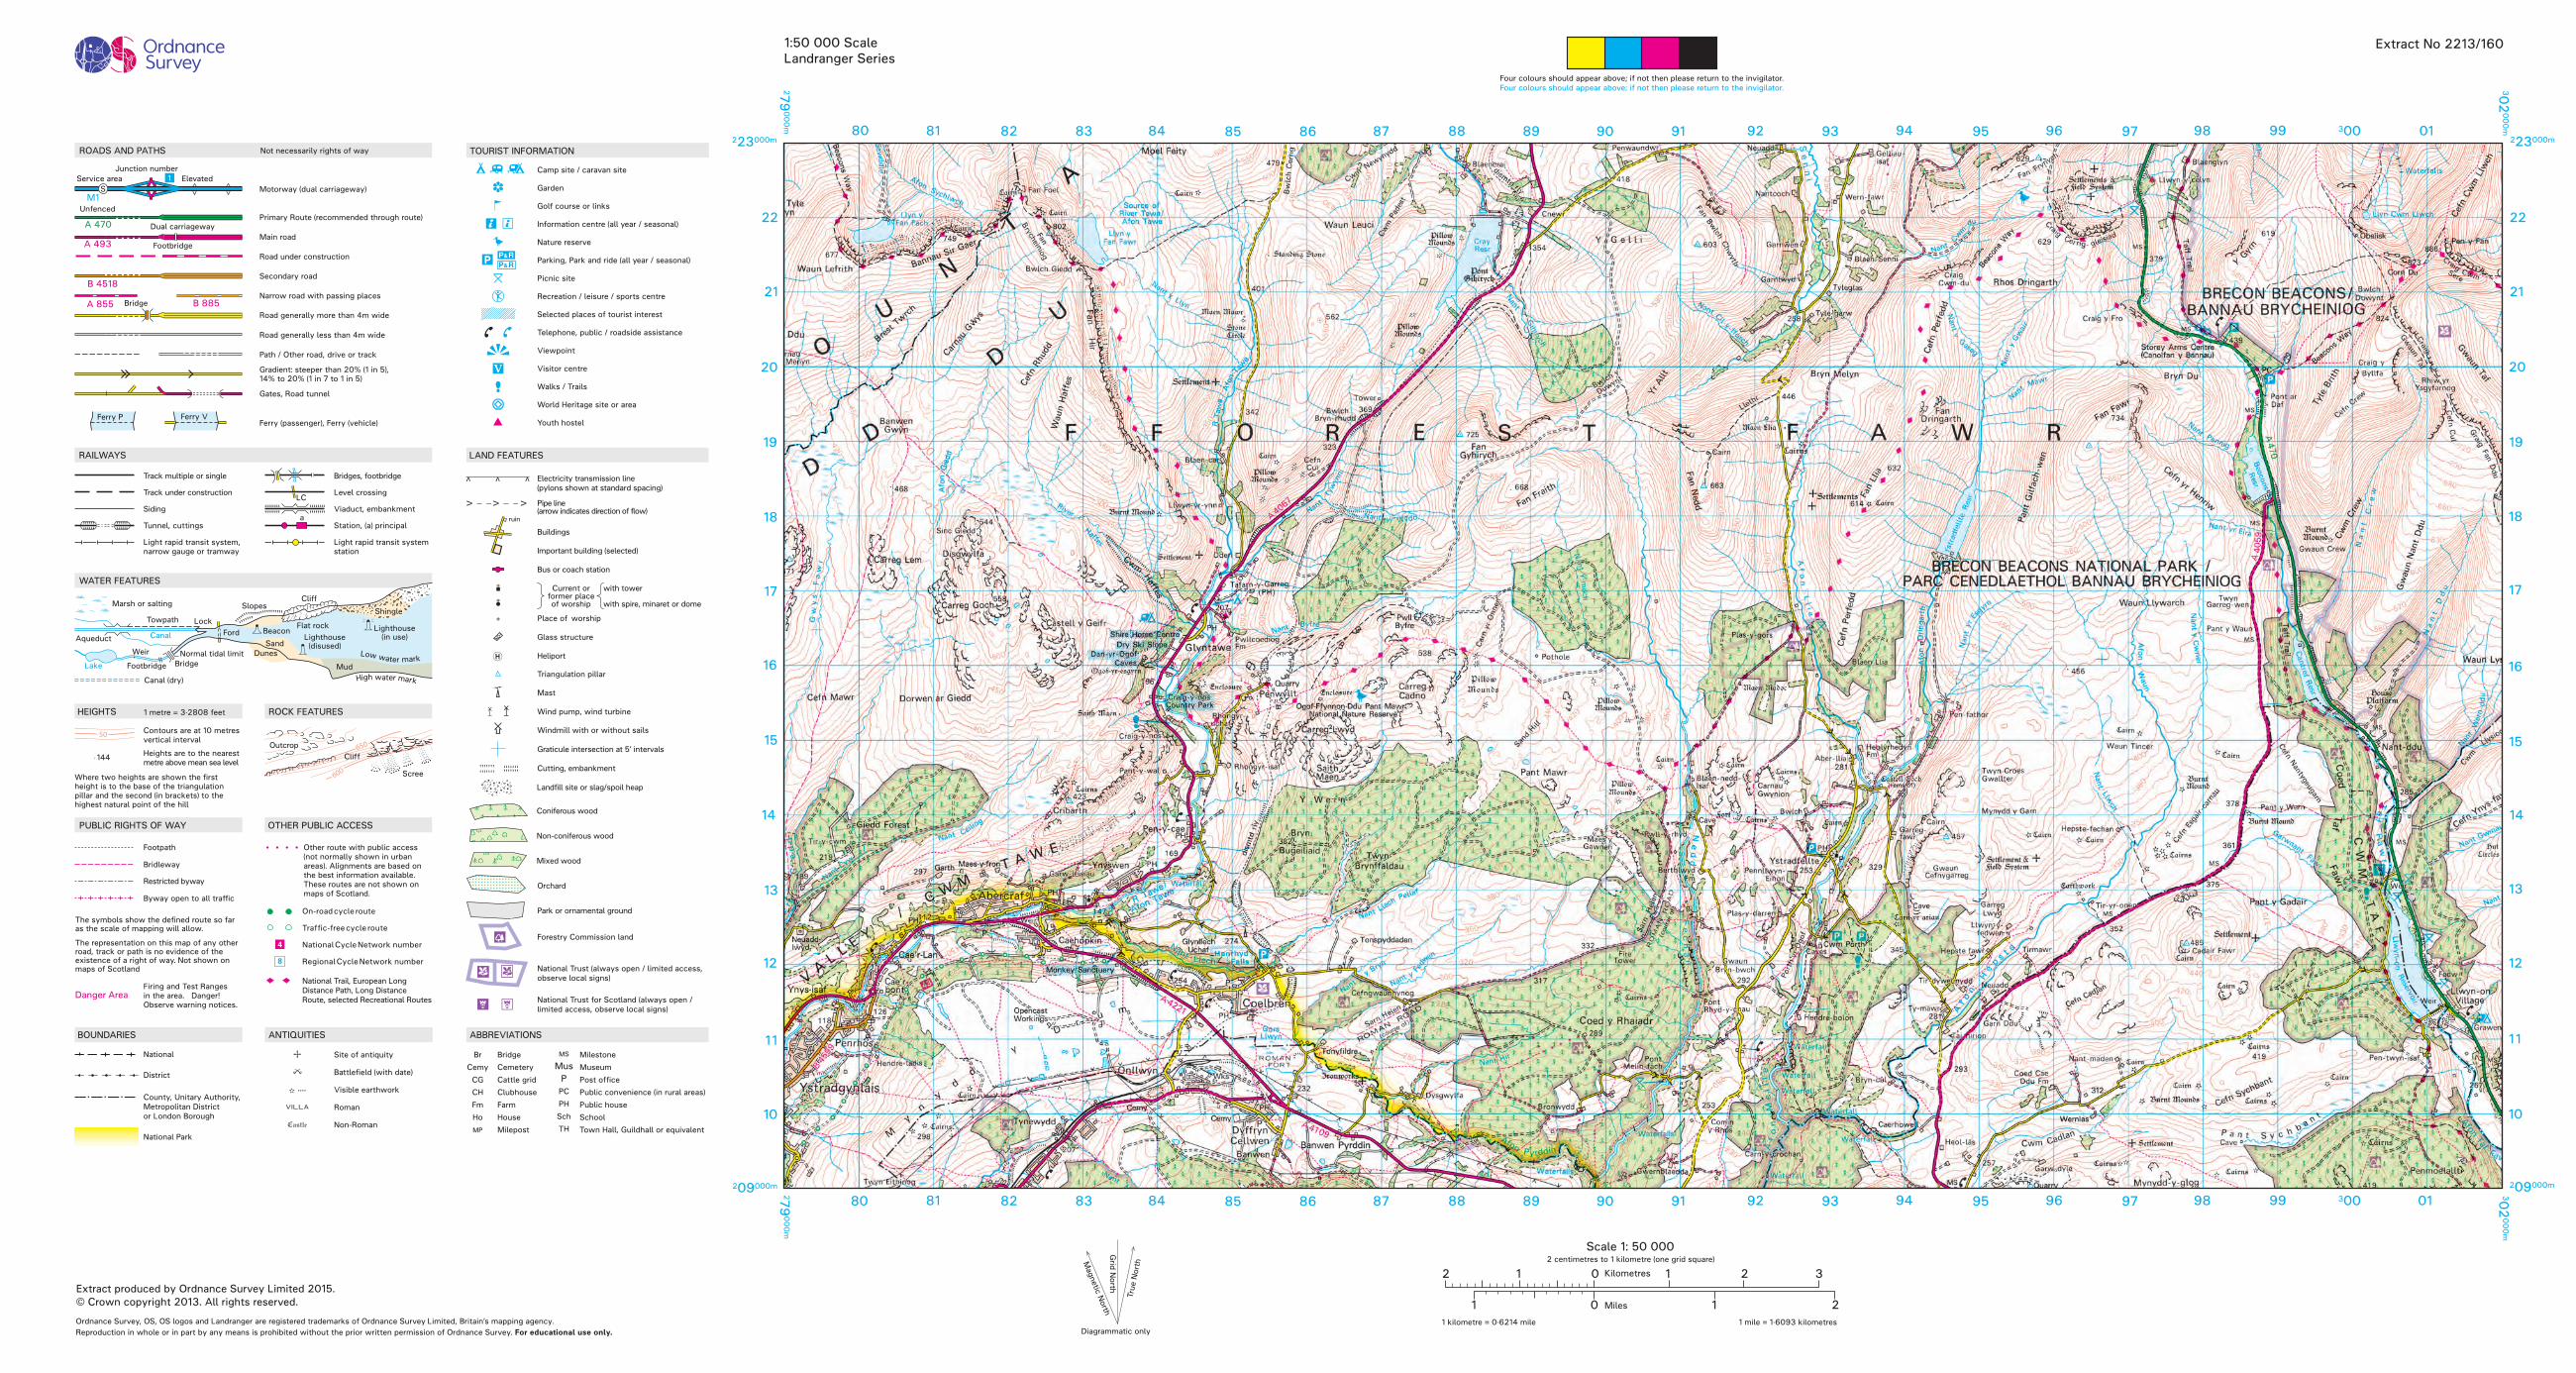
(a) Study the Ordnance Survey Map Extract (Item A) of the Brecon Beacons area.
Match these glaciated features with the correct grid references.
Features: pyramidal peak; corrie; U-shaped valley
Choose from grid references: 800217, 927226, 012216, 946178.
(b) Explain the formation of a U-shaped valley.
You may use a diagram(s) in your answer.
NOW ANSWER QUESTIONS 3, 4 and 5
3
4
Page 03
MARKSDO NOT ANSWER THIS QUESTION IF YOU HAVE ALREADY ANSWERED QUESTION 1
Question 2
(a) Study the Ordnance Survey Map Extract (Item A) of the Brecon Beacons area.
Match these upland limestone features with the correct grid references.
Features: caves; swallow hole; intermittent drainage
Choose from grid references: 891161, 837160, 823183, 966146.
(b) Explain the formation of a limestone cave/cavern.
You may use a diagram(s) in your answer.
NOW ANSWER QUESTIONS 3, 4 and 5
[Turn over
3
4
Page 04
MARKSQuestion 3
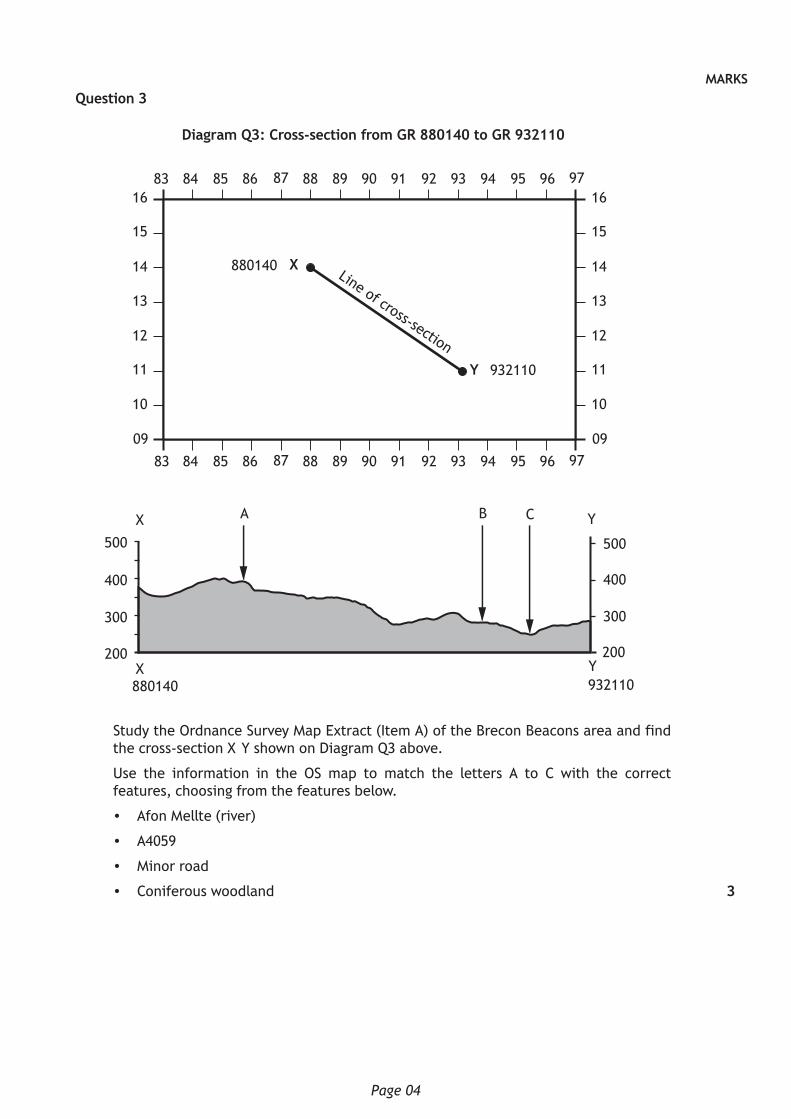
Diagram Q3: Cross-section from GR 880140 to GR 932110
83
83
84
84
85
85
86
86
87
87
88
88
89
89
90
90
91
91
92
92
93
93
94
94
95
95
96
96
97
97
16 16
15 15
14 14
13 13
12 12
11 11
10 10
09 09
880140
932110
Line of cross-section
X
Y
X
X
Y
Y
A B C
932110880140
500 500
400 400
300 300
200 200
Study the Ordnance Survey Map Extract (Item A) of the Brecon Beacons area and find the cross-section X–Y shown on Diagram Q3 above.
Use the information in the OS map to match the letters A to C with the correct features, choosing from the features below.
• Afon Mellte (river)
• A4059
• Minor road
• Coniferous woodland 3
Page 05
MARKSQuestion 4
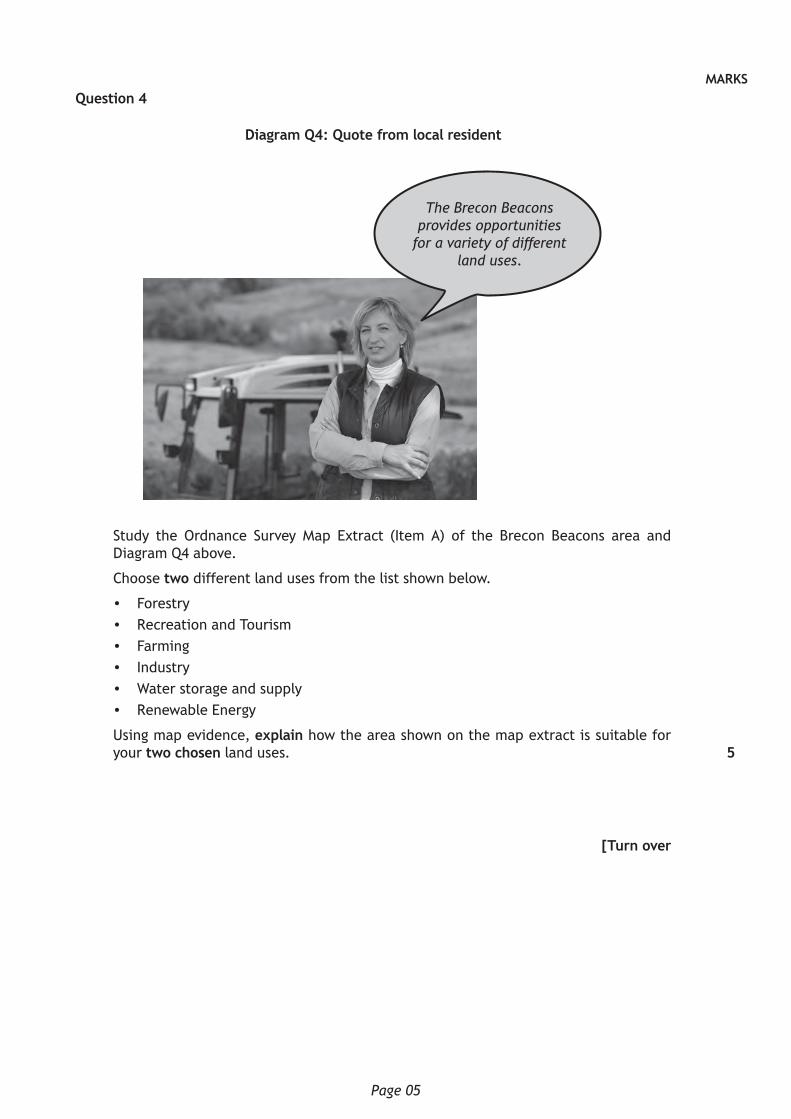
Diagram Q4: Quote from local resident
The Brecon Beacons provides opportunities
for a variety of different land uses.
Study the Ordnance Survey Map Extract (Item A) of the Brecon Beacons area and Diagram Q4 above.
Choose two different land uses from the list shown below.
• Forestry• Recreation and Tourism• Farming• Industry• Water storage and supply• Renewable Energy
Using map evidence, explain how the area shown on the map extract is suitable for your two chosen land uses.
[Turn over
5
Page 06
Question 5
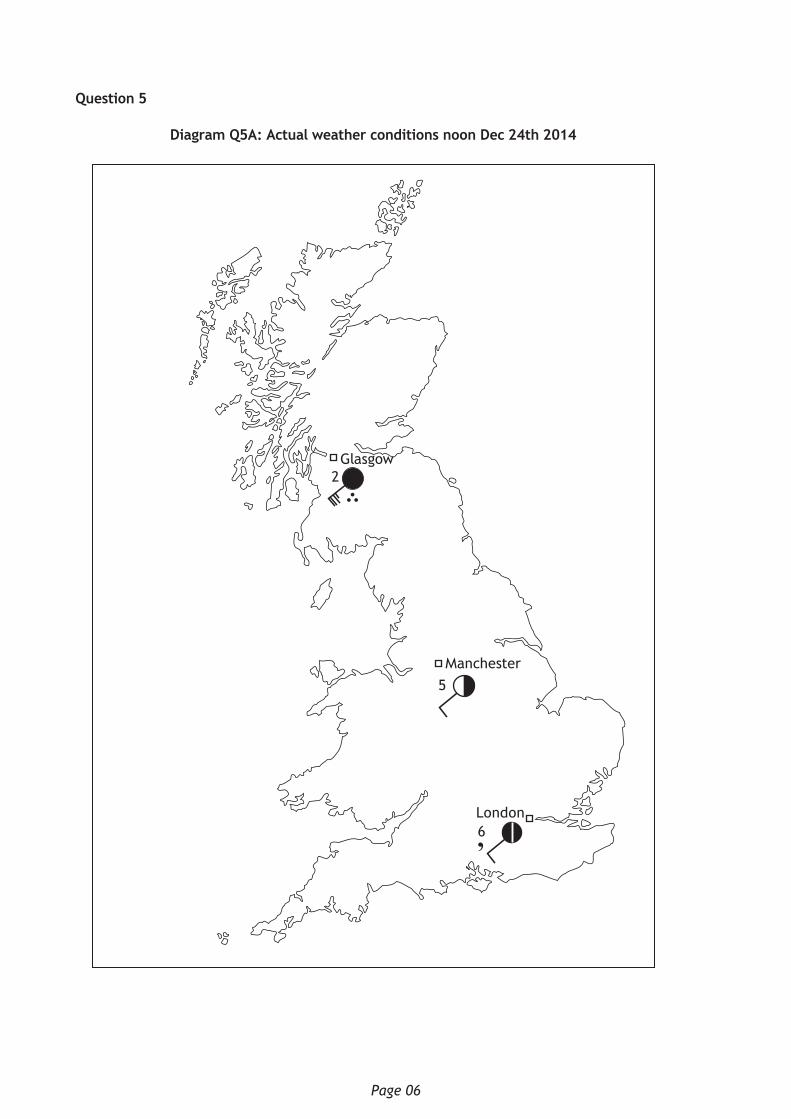
Diagram Q5A: Actual weather conditions noon Dec 24th 2014
Glasgow
Manchester
London
2
5
6
Page 07
MARKSQuestion 5 (continued)
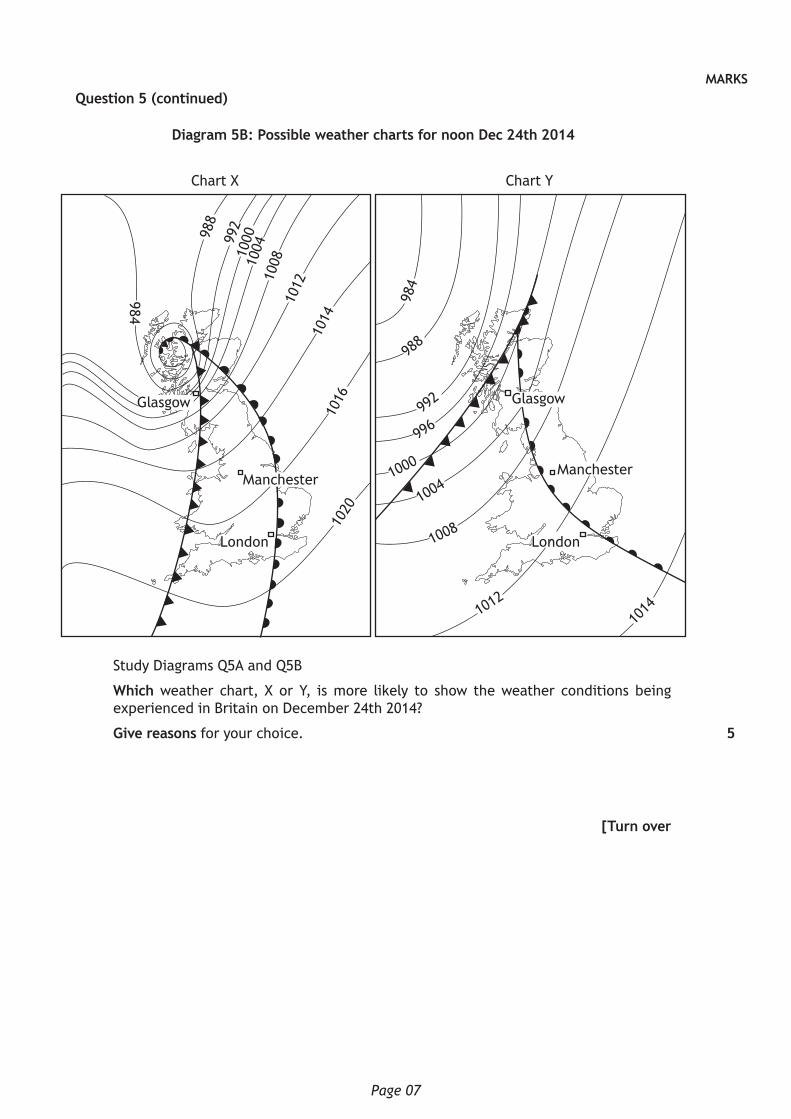
Diagram 5B: Possible weather charts for noon Dec 24th 2014
Chart X Chart Y
ManchesterManchester
Glasgow Glasgow
London London
988
992
1000
1004
1008
1012
1014
1016
1020
984
988
984
992
996
1000
1004
1008
101210
14
Study Diagrams Q5A and Q5B
Which weather chart, X or Y, is more likely to show the weather conditions being experienced in Britain on December 24th 2014?
Give reasons for your choice.
[Turn over
5
Page 08
MARKSSECTION 2 — HUMAN ENVIRONMENTS — 20 marks
Attempt Questions 6, 7 and 8
Question 6
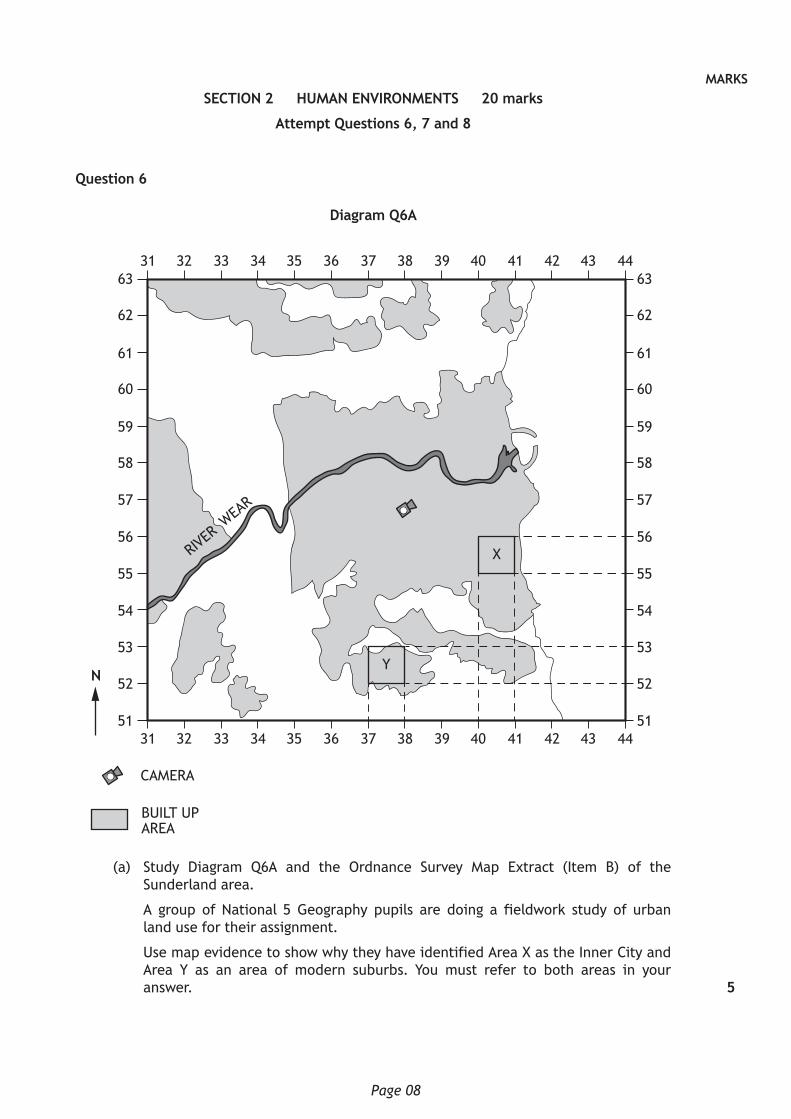
Diagram Q6A
31
31
32
32
33
33
34
34
35
35
36
36
37
37
38
38
39
39
40
40
41
41
42
42
43
43
44
44
63 63
62 62
61 61
60 60
59 59
58 58
57 57
56 56
55 55
54 54
53 53
52 52
51 51
N
CAMERA
BUILT UPAREA
Y
XRIVER W
EAR
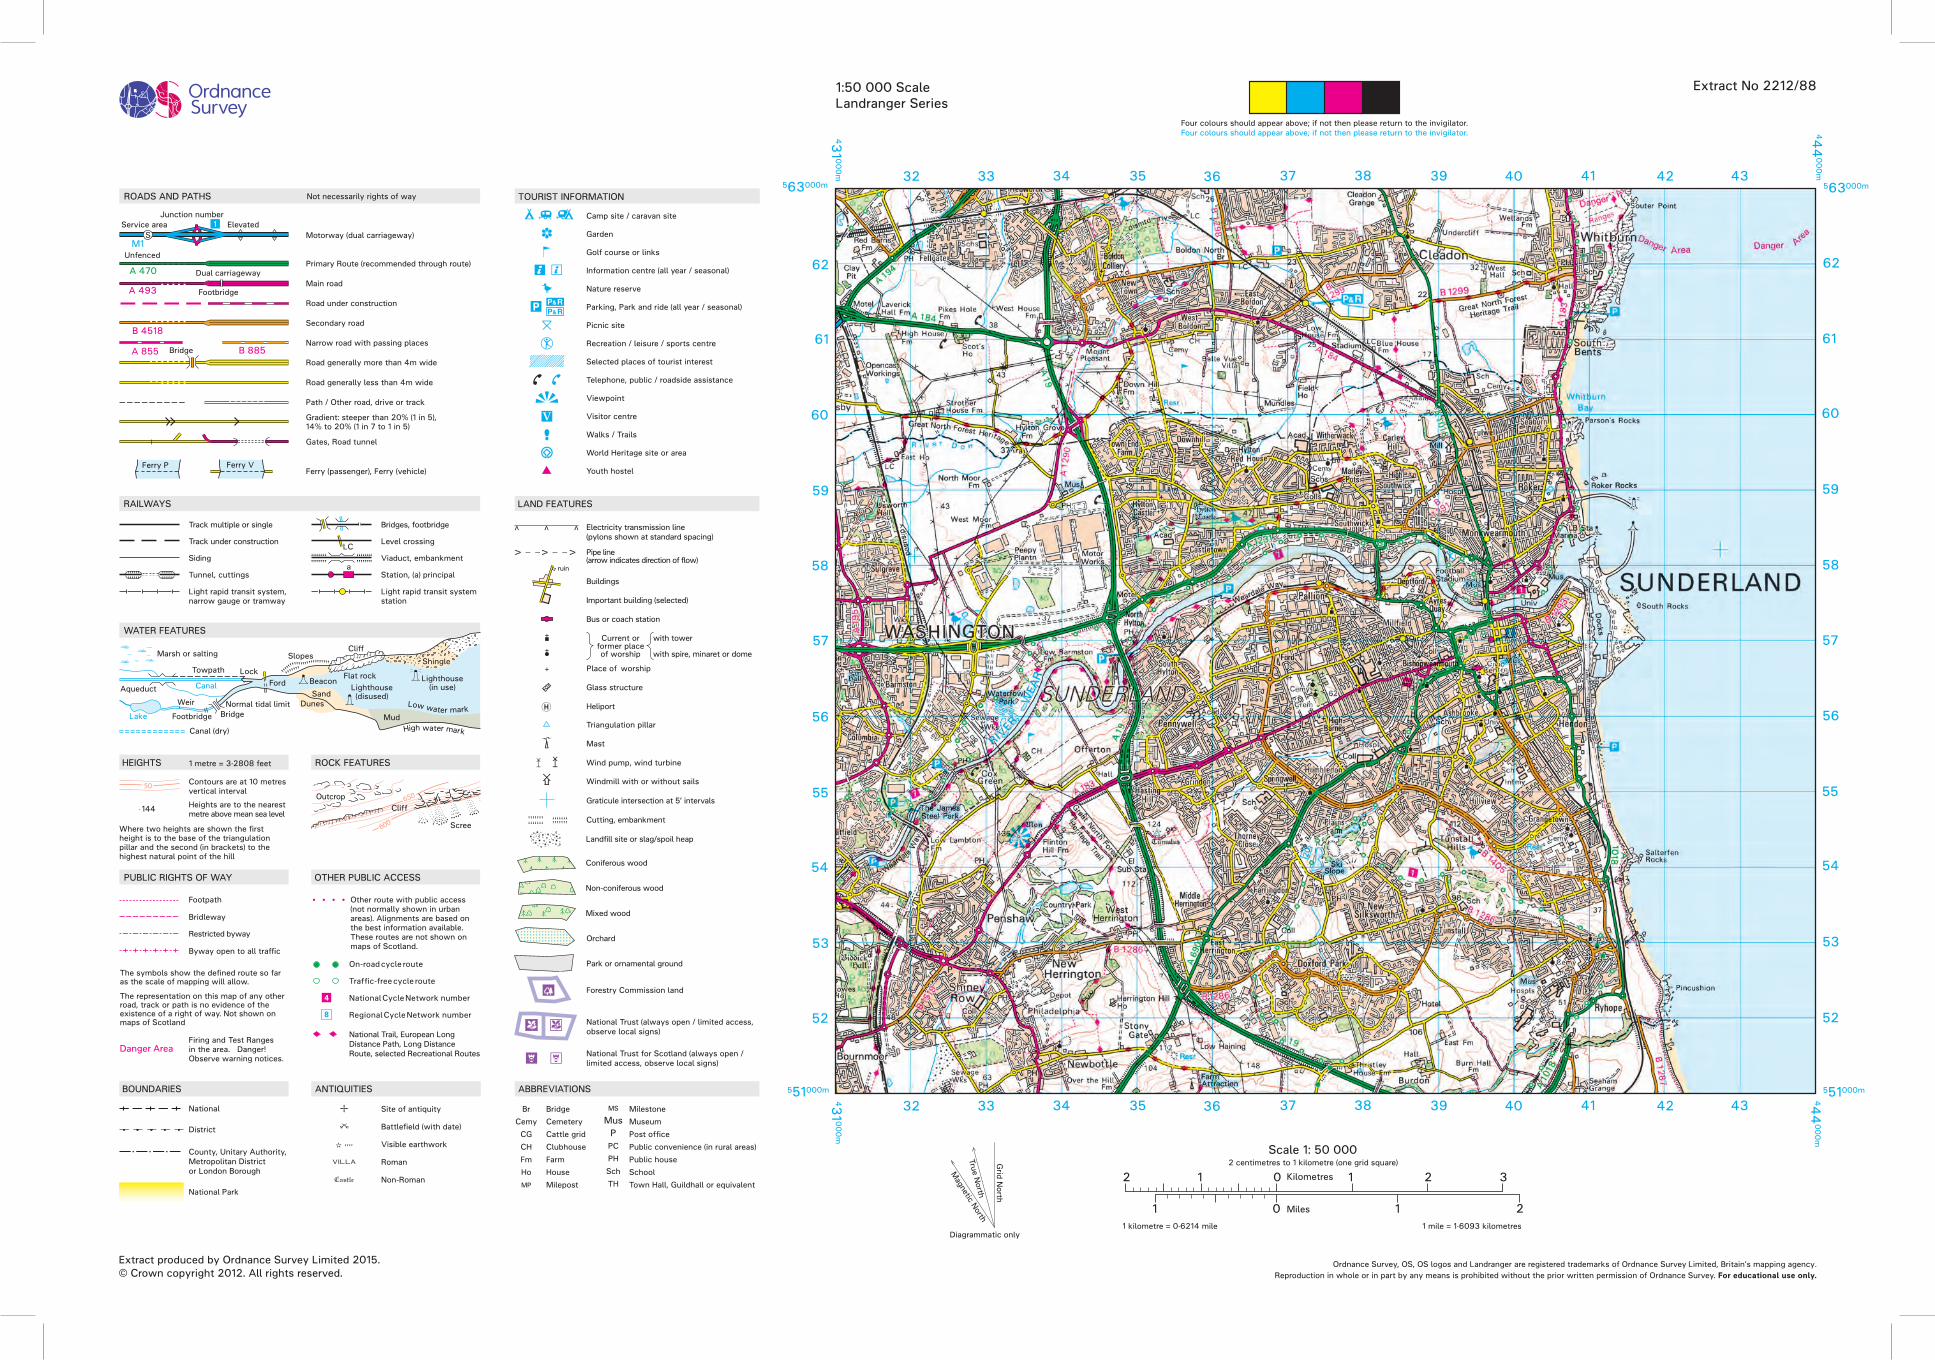
(a) Study Diagram Q6A and the Ordnance Survey Map Extract (Item B) of the Sunderland area.
A group of National 5 Geography pupils are doing a fieldwork study of urban land use for their assignment.
Use map evidence to show why they have identified Area X as the Inner City and Area Y as an area of modern suburbs. You must refer to both areas in your answer. 5
Page 09
MARKSQuestion 6 (continued)
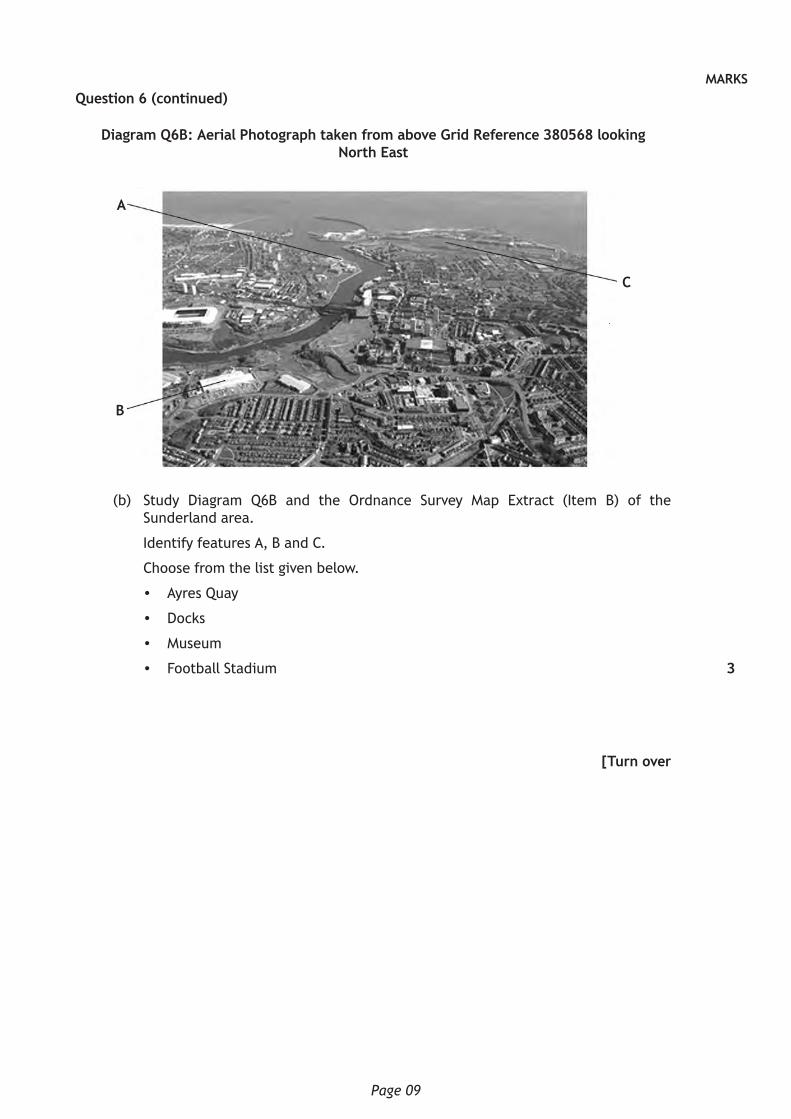
Diagram Q6B: Aerial Photograph taken from above Grid Reference 380568 lookingNorth East
A
B
C
(b) Study Diagram Q6B and the Ordnance Survey Map Extract (Item B) of the Sunderland area.
Identify features A, B and C.
Choose from the list given below.
• Ayres Quay
• Docks
• Museum
• Football Stadium
[Turn over
3
Page 10
MARKSQuestion 7
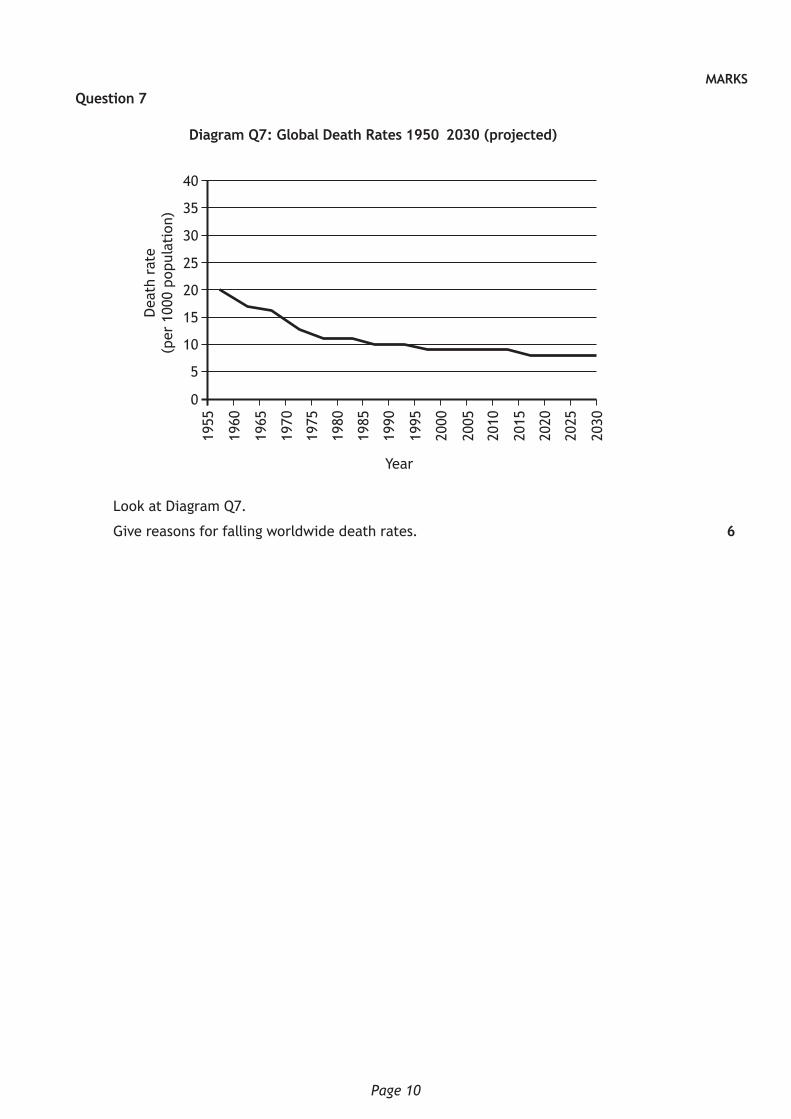
Diagram Q7: Global Death Rates 1950–2030 (projected)
40
35
30
25
20
15
10
5
0
1955
1960
1965
1970
1975
1980
1985
1990
1995
2000
2005
2010
2015
2020
2025
2030
Year
Dea
th r
ate
(per
100
0 po
pula
tion
)
Look at Diagram Q7.
Give reasons for falling worldwide death rates. 6
Page 11
MARKSQuestion 8
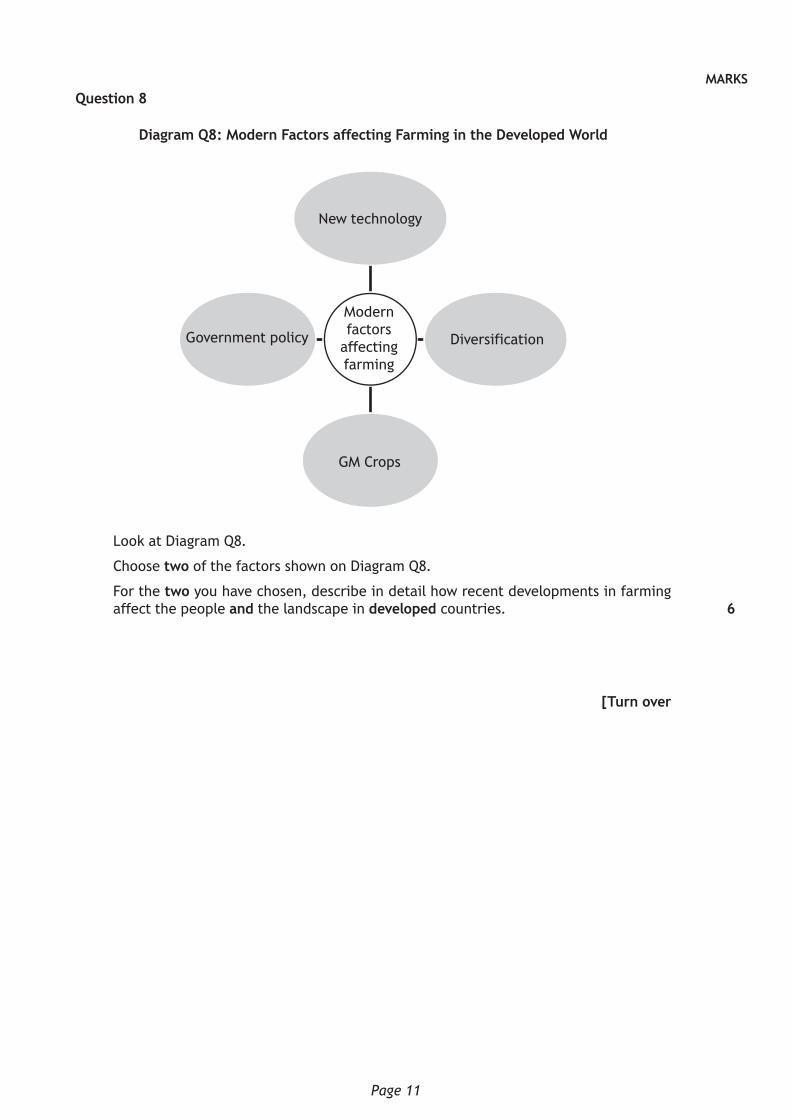
Diagram Q8: Modern Factors affecting Farming in the Developed World
New technology
DiversificationGovernment policy
GM Crops
Modernfactors
affectingfarming
Look at Diagram Q8.
Choose two of the factors shown on Diagram Q8.
For the two you have chosen, describe in detail how recent developments in farming affect the people and the landscape in developed countries.
[Turn over
6
Page 12
SECTION 3 — GLOBAL ISSUES — 20 marks
Attempt any TWO questions
Question 9 — Climate Change (Page 13)Question 10 — Impact of Human Activity on the Natural Environment (Page 14)Question 11 — Environmental Hazards (Page 16)Question 12 — Trade and Globalisation (Page 18)Question 13 — Tourism (Page 19)Question 14 — Health (Page 20)
Page 13
MARKSQuestion 9 — Climate Change
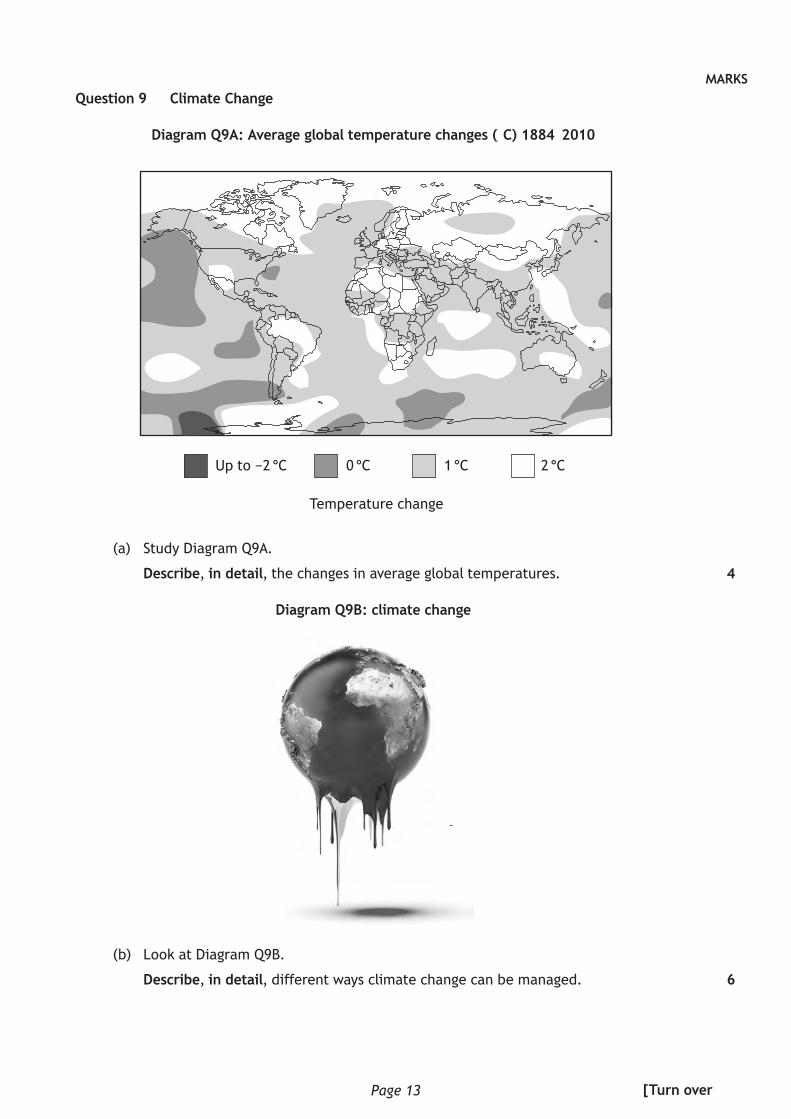
Diagram Q9A: Average global temperature changes (°C) 1884–2010
Upto−2°C 0°C 1°C 2°C
Temperature change
(a) Study Diagram Q9A.
Describe, in detail, the changes in average global temperatures.
Diagram Q9B: climate change
(b) Look at Diagram Q9B.
Describe, in detail, different ways climate change can be managed.
4
6
[Turn over
Page 14
MARKSQuestion 10 — Impact of Human Activity on the Natural Environment
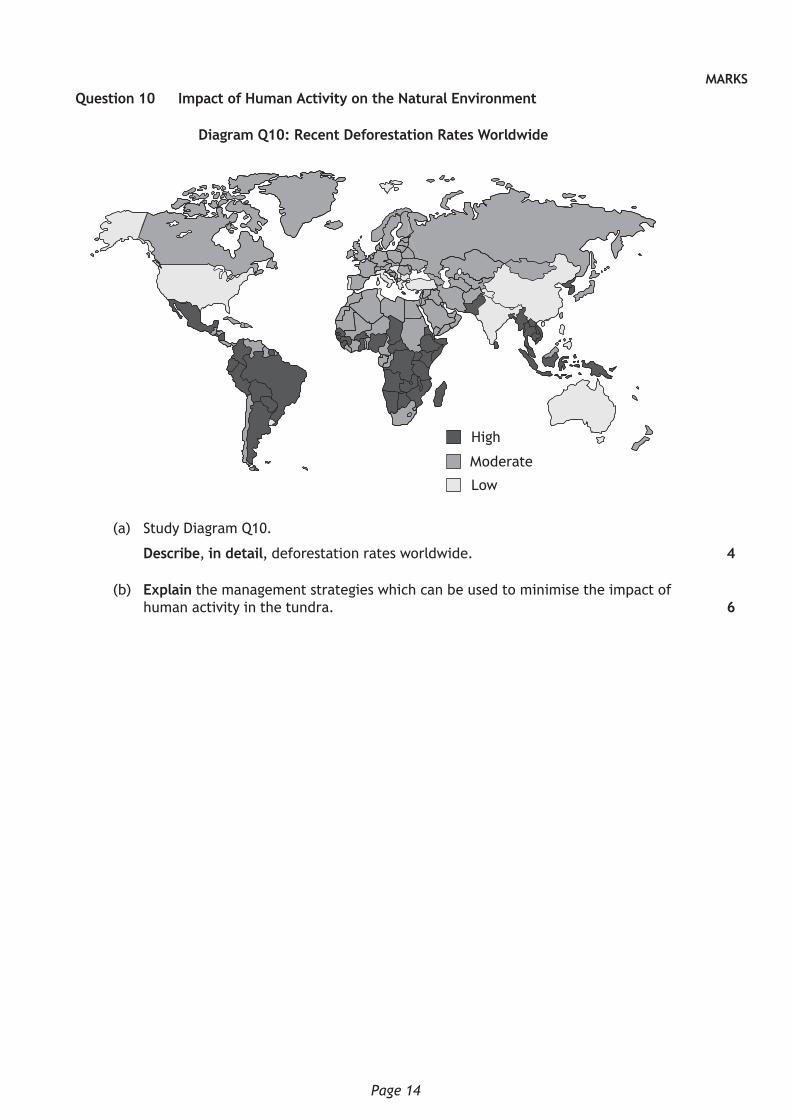
Diagram Q10: Recent Deforestation Rates Worldwide
High
Moderate
Low
(a) Study Diagram Q10.
Describe, in detail, deforestation rates worldwide.
(b) Explain the management strategies which can be used to minimise the impact of human activity in the tundra.
4
6

Page 15
[Turn over for next question
DO NOT WRITE ON THIS PAGE
Page 16
MARKSQuestion 11 — Environmental Hazards
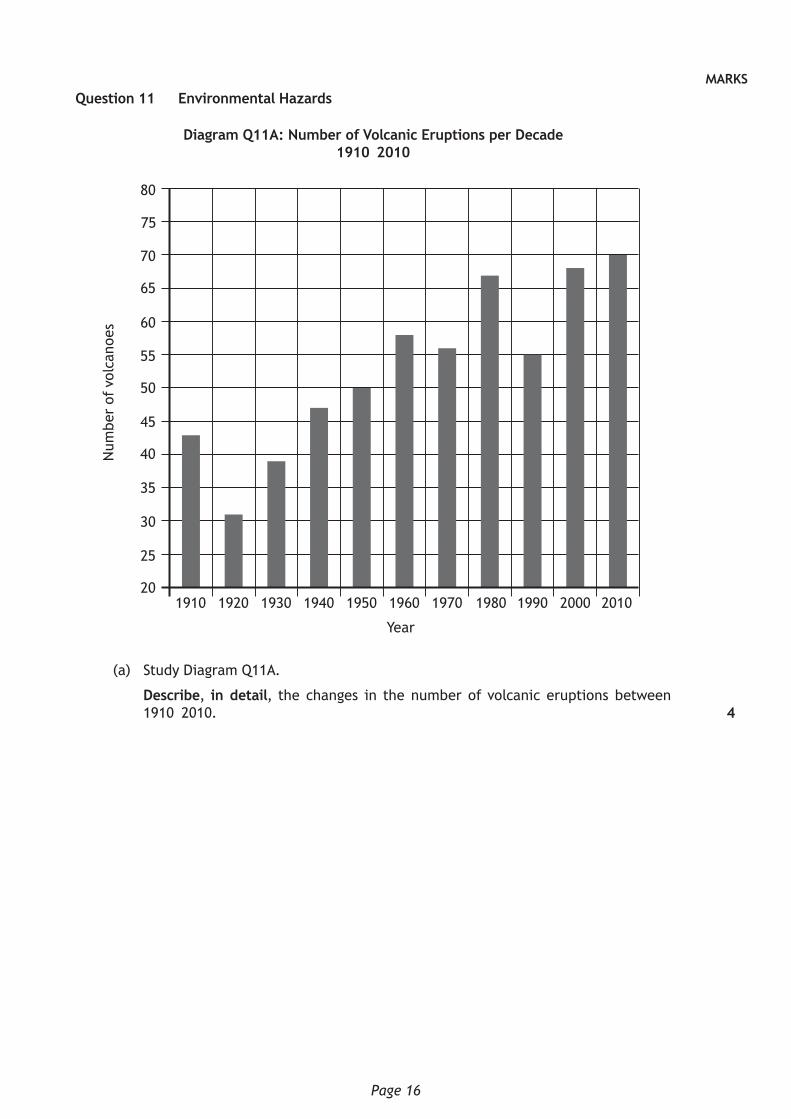
Diagram Q11A: Number of Volcanic Eruptions per Decade1910–2010
80
75
70
65
60
55
50
45
40
35
30
25
201910 1920 1930 1940 1950 1960 1970 1980 1990 2000 2010
Year
Num
ber
of v
olca
noes
(a) Study Diagram Q11A.
Describe, in detail, the changes in the number of volcanic eruptions between 1910–2010. 4
Page 17
MARKSQuestion 11 (continued)
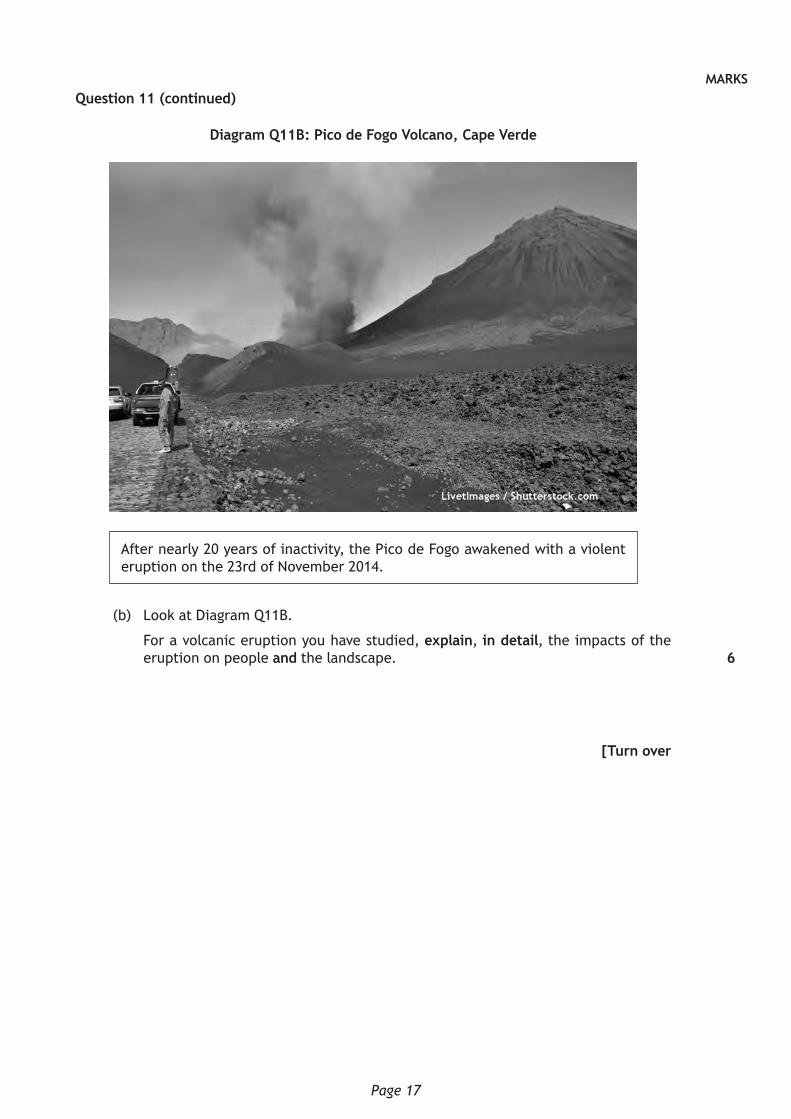
Diagram Q11B: Pico de Fogo Volcano, Cape Verde
After nearly 20 years of inactivity, the Pico de Fogo awakened with a violent eruption on the 23rd of November 2014.
(b) Look at Diagram Q11B.
For a volcanic eruption you have studied, explain, in detail, the impacts of the eruption on people and the landscape.
[Turn over
6
Page 18
MARKSQuestion 12 — Trade and Globalisation
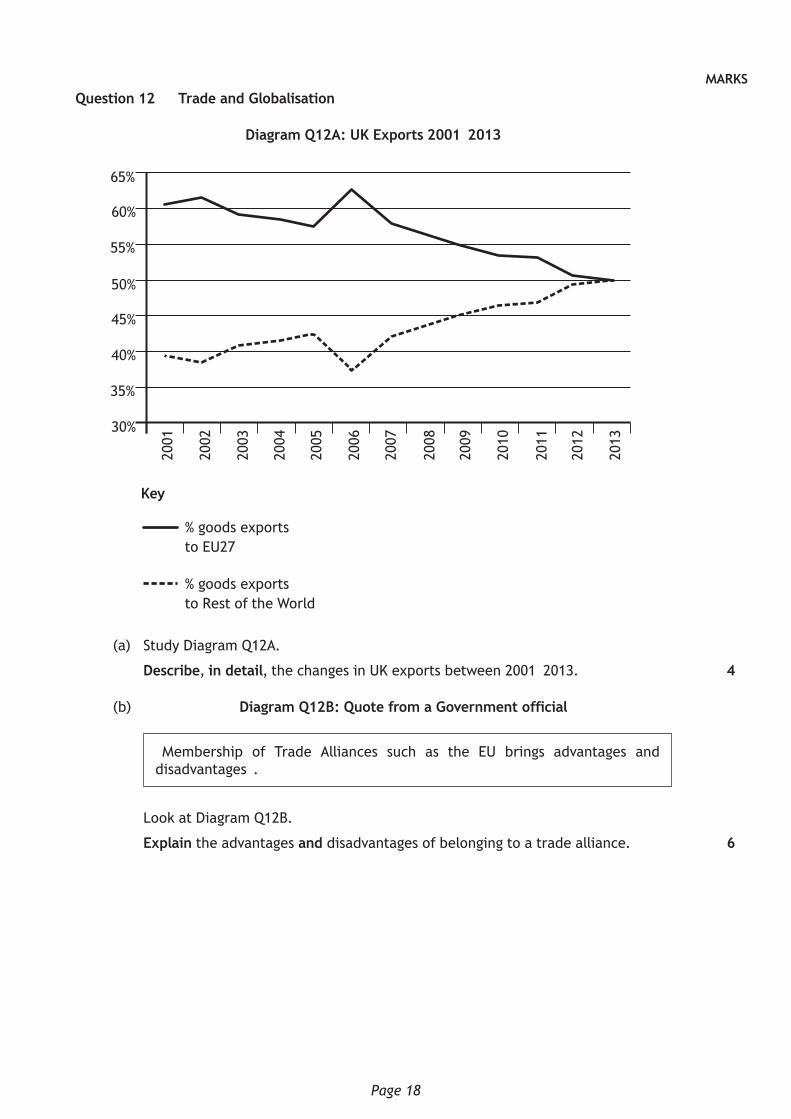
Diagram Q12A: UK Exports 2001–2013
65%
60%
55%
50%
45%
40%
35%
30%
2001
2002
2003
2004
2005
2006
2007
2008
2009
2010
2011
2012
2013
% goods exportsto EU27
% goods exportsto Rest of the World
Key
(a) Study Diagram Q12A.
Describe, in detail, the changes in UK exports between 2001–2013.
(b) Diagram Q12B: Quote from a Government official
“Membership of Trade Alliances such as the EU brings advantages and disadvantages”.
Look at Diagram Q12B.
Explain the advantages and disadvantages of belonging to a trade alliance.
4
6
Page 19
MARKSQuestion 13 — Tourism
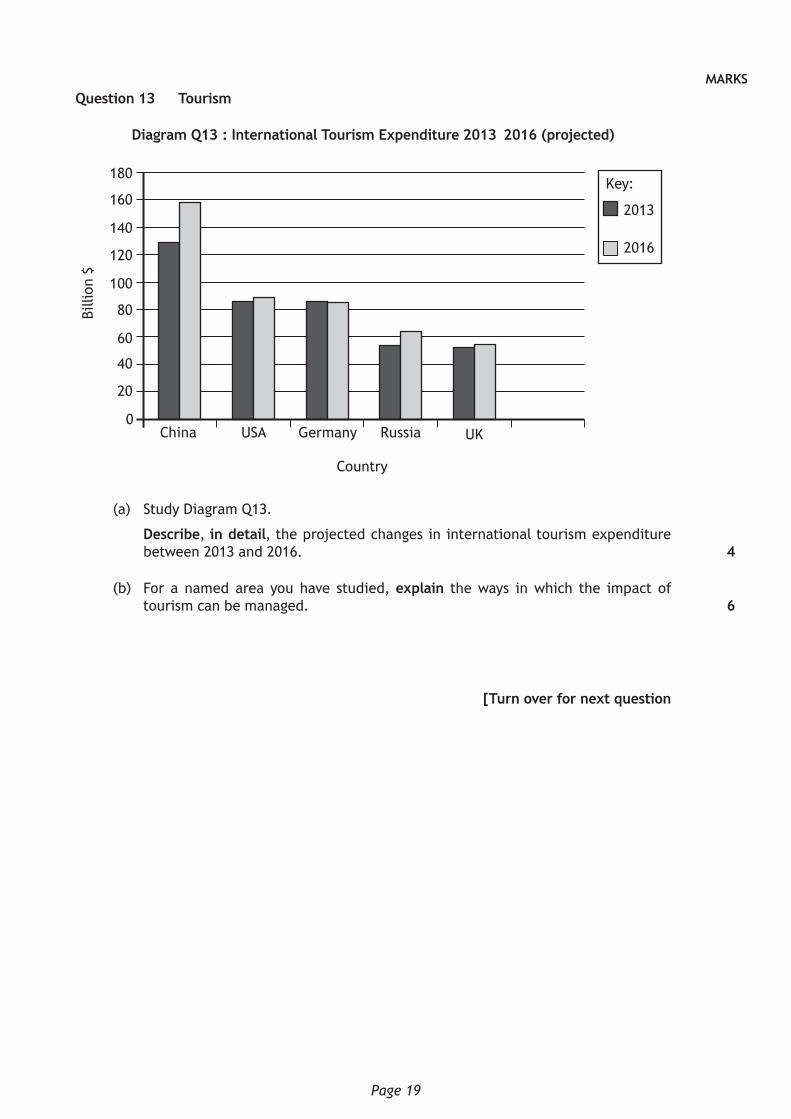
Diagram Q13 : International Tourism Expenditure 2013–2016 (projected)
180
160
140
120
100
80
60
40
20
0China USA Germany Russia UK
Country
Billi
on $
Key:
2013
2016
(a) Study Diagram Q13.
Describe, in detail, the projected changes in international tourism expenditure between 2013 and 2016.
(b) For a named area you have studied, explain the ways in which the impact of tourism can be managed.
[Turn over for next question
4
6
Page 20
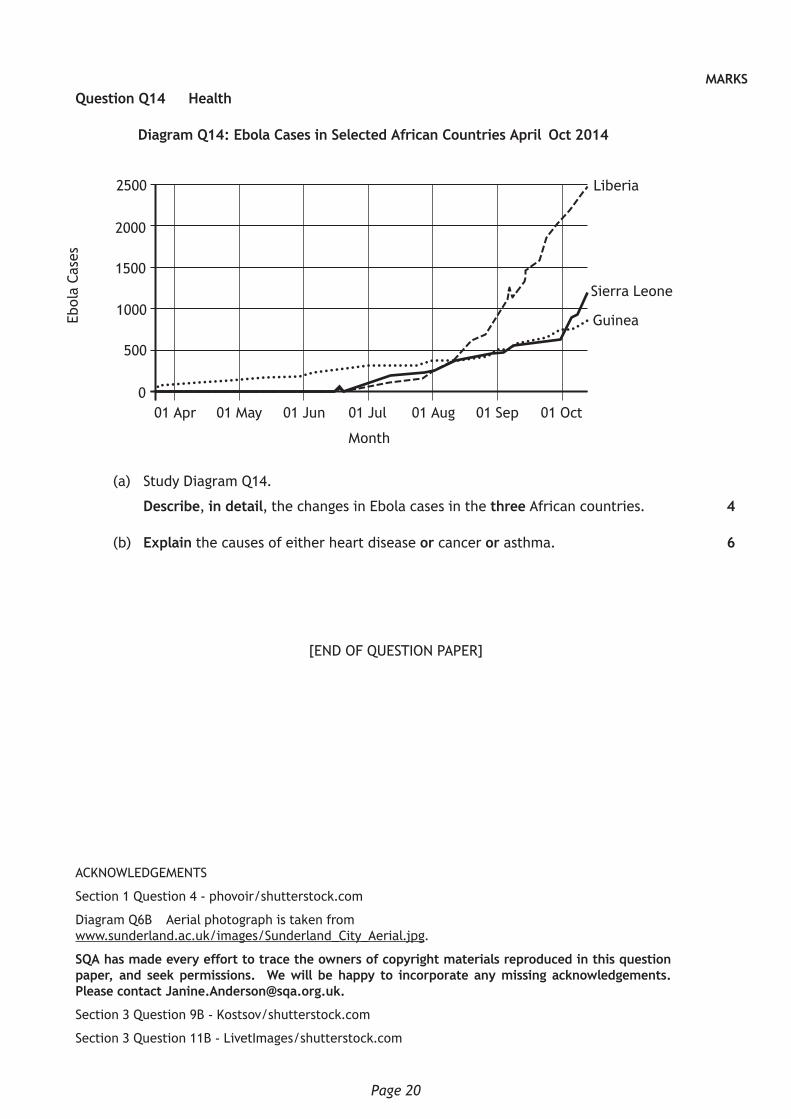
MARKSQuestion Q14 — Health
Diagram Q14: Ebola Cases in Selected African Countries April–Oct 2014
2500
2000
1500
1000
500
001 Apr 01 May 01 Jun 01 Jul 01 Aug 01 Sep 01 Oct
Month
Ebol
a Ca
ses
Liberia
Sierra Leone
Guinea
(a) Study Diagram Q14.
Describe, in detail, the changes in Ebola cases in the three African countries.
(b) Explain the causes of either heart disease or cancer or asthma.
4
6
[END OF QUESTION PAPER]
ACKNOWLEDGEMENTS
Section 1 Question 4 - phovoir/shutterstock.com
Diagram Q6B – Aerial photograph is taken from www.sunderland.ac.uk/images/Sunderland_City_Aerial.jpg.
SQA has made every effort to trace the owners of copyright materials reproduced in this question paper, and seek permissions. We will be happy to incorporate any missing acknowledgements. Please contact [email protected].
Section 3 Question 9B - Kostsov/shutterstock.com
Section 3 Question 11B - LivetImages/shutterstock.com

*X7337521*
N5
©
NationalQualications2016
The colours used in the printing of these map extracts are indicated in the four little boxes at the top of the map extract. Each box should contain a colour; if any does not, the map is incomplete and should be returned to the Invigilator.
X733/75/21 Geography Ordnance Survey Map
Item AFRIDAY, 6 MAY
1:00 PM – 2:45 PM
A/PB
*X7337531*
N5
©
NationalQualications2016
The colours used in the printing of these map extracts are indicated in the four little boxes at the top of the map extract. Each box should contain a colour; if any does not, the map is incomplete and should be returned to the Invigilator.
X733/75/31 Geography Ordnance Survey Map
Item BFRIDAY, 6 MAY
1:00 PM – 2:45 PM
A/PB


![repository.psa.edu.myrepository.psa.edu.my/bitstream/123456789/1188/1/JKE...Tentukan EMPAT (4) jenis pemindaharuh tekanan elektrik. QUESTION 6 SOALAN [4 marks] [4 markah] [4 marks]](https://img.pdfslide.tips/doc/110x75/6090eab443094c10e9584b6a/-tentukan-empat-4-jenis-pemindaharuh-tekanan-elektrik-question-6-soalan-4.jpg)

![Nyatakan LIMA (5) peranan penting Bank Negara Malaysia dalam Industri Takaful. [5 marks] [5 markah] SULIT CL02 CL02 SULIT QUESTION 2 2 DPD5053 : TA [3 marks] [3 markah] [3 marks]](https://img.pdfslide.tips/doc/110x75/6091d05104f82c6d1c01760b/-nyatakan-lima-5-peranan-penting-bank-negara-malaysia-dalam-industri-takaful.jpg)

![uploads.edubilla.comuploads.edubilla.com/question-papers/92/62/12th_JUNE...GgqLb:3Loeoi1 tffWW,kalViSOlai.COm lGLDrSp LDptlrGlLraiirs6ir:150 Time Al]o$,ed : 3 lJours ] [Maximum Marks](https://img.pdfslide.tips/doc/110x75/5e79339517a6d24ce3089a24/-ggqlb3loeoi1-tffwwkalvisolaicom-lgldrsp-ldptlrgllraiirs6ir150-time-aloed.jpg)


![€¦ · ΧΕΕD 2010 Θυεστιον παπερ 1 . Visual Perception and Design Sensitivity Question 1 (Answer all the questions) [15 Marks] 1.1 [2 Marks] The drawing below shows](https://img.pdfslide.tips/doc/110x75/605ae9101f91654b11317227/d-2010-f-1-visual-perception-and-design-sensitivity.jpg)
![Hujan perolakan (b) Orographic precipitation Hujan gunung QUESTION 5 SOALAN 5 [2 marks] [2 markah] [2 marks] [2 markah] Rain gauge X is out of operation for a month after a storm](https://img.pdfslide.tips/doc/110x75/5e36126df59bc11e60094868/-hujan-perolakan-b-orographic-precipitation-hujan-gunung-question-5-soalan.jpg)


![D Z P v ] X } X µ l W o } v } Á ] } v Z ] Z D Z P v ] X } X µ …(Total for question 3 is 2 marks) 74 80 81 91 (Total for question 4 is 2 marks) in cm, of tomato plants in Maggie's](https://img.pdfslide.tips/doc/110x75/5e85109566827564c726ab0e/d-z-p-v-x-x-l-w-o-v-v-z-z-d-z-p-v-x-x-total-for-question.jpg)

![repository.psa.edu.myrepository.psa.edu.my/bitstream/123456789/1560/1...Bandingkan cin-ciri sistem kawalan elektrik, pneumatik dan hidraulik. [9 marks] [9 markah] QUESTION 4 SOALAN](https://img.pdfslide.tips/doc/110x75/6098be12b5d954716b5adcc2/-bandingkan-cin-ciri-sistem-kawalan-elektrik-pneumatik-dan-hidraulik-9-marks.jpg)