Embed Size (px)
Citation preview
NEBRASKA
MIGRANT EDUCATION PROGRAM

Thanks to the Nebraska Service Delivery Plan (SDP) Committee
The following individuals gave freely of their time, expertise, and resources to participate as members of the 2015‐16 Nebraska SDP Committee
Nebraska Department of Education (NDE) Representatives Sue Henry – State MEP Director, Nebraska Department of Education Lindsay Ickes – Education Specialist, Nebraska Department of Education Brooke David – Title III, Nebraska Department of Education
MEP Directors/Staff Cynthia Alarcón, MEP Assistant Coordinator (ESU 7/Columbus) Diane Bruha, MEP Director (Crete) Pablo Cervantes, MEP Coordinator (Lincoln) Azucena Vera Chavez, Educational Liaison (ESU 15/McCook) Dee Condon, MEP Director (ESU 7/Columbus) Tina Crosley‐Witt, Instructional Coach (Lincoln) Veronica Estevez, MEP State PAC, MEP Quality Control (ESU 15/McCook) Cheryl Feeken, Records Clerk (Crete) Jamie Garner, MEP Director, Staff Development (ESU 15/McCook) Monica Goodel, Service Provider (ESU 15/McCook) Larianne Polk, ESU Administrator (ESU 7/Columbus) Kathleen Riley, MEP Director (Head Start/Hastings) Kiowa Rogers, MEP Director (ESU 13/Scottsbluff) Bob Uhing, ESU Administrator (ESU 1/Wakefield) Danielle Waite, Statewide MEP Data Coordinator (ESU 7/Columbus) Suzanne Wetzel, ESL/Migrant Teacher Trainer (Omaha) MEP Students and Parents Migrant Parents (sample of parents interviewed/surveyed) Migrant Secondary Students and Out‐of‐School Youth (sample interviewed/surveyed) Facilitators Dr. Susan Durón – Consultant Cari Semivan – Consultant
Abbreviations and Acronyms
BMEI Binational Migrant Education Initiative
CAMP College Assistance Migrant Program
CBO Community‐based Organization
CIG Consortium Incentive Grant
CNA Comprehensive Needs Assessment
COE Certificate of Eligibility
CSPR Consolidated State Performance Report
ECE Early Childhood Education
EL English learner
ESEA Elementary and Secondary Education Act of 2001
ESL English as a Second Language
ESU Educational Service Unit
GED General Educational Development
GOSOSY Graduation and Outcomes for Success for OSY CIG
ID&R Identification and Recruitment
IRRC Identification and Recruitment Rapid Response Consortium CIG
K‐12 Kindergarten through Grade 12
LEA Local Education Agency (also LOA for Local Operating Agency)
LEP Limited English Proficiency
MEP Migrant Education Program
MPO Measurable Program Outcomes
MSIX Migrant Student Information Exchange
NAC Needs Assessment Committee
NCLB No Child Left Behind Act of 2001
NDE Nebraska Department of Education
NeSA‐M Nebraska State Accountability Math Assessment
NeSA‐R Nebraska State Accountability Reading Assessment
OME Office of Migrant Education (of the U.S. Department of Education)
OSY Out‐of‐School Youth
PAC Parent Advisory Council
PASS Portable Assisted Study Sequence
PFS Priority for Services
PK Pre‐Kindergarten
PL Professional Learning
QAD Qualifying Arrival Date
SDP Service Delivery Plan
SEA State Education Agency (Nebraska Department of Education)

Nebraska SDP Table of Contents
Service Delivery Plan Committee Members
Abbreviations and Acronyms
Executive Summary
Introduction ....................................................................................................................... 2 Legislative Mandate ............................................................................................................ 2 Description of the Nebraska Migrant Education Program ................................................. 2 Description of the Nebraska Service Delivery Planning Process ........................................ 5 Purpose of the SDP Update ................................................................................................ 6 Building on the Comprehensive Needs Assessment (CNA) .................................................. 8 The CNA Process in Nebraska ............................................................................................. 8 Using CNA Results to Inform the Service Delivery Planning Process ................................. 9 Aligning CNA Results with State Systems and Resources ................................................. 10 General Framework: Plan Alignment ................................................................................ 11 State Performance Indicators and Targets ....................................................................... 11 Needs Assessment ............................................................................................................ 11 Service Delivery Strategies ................................................................................................ 17 Measurable Program Outcomes (MPOs) .......................................................................... 18 Evaluation Questions ........................................................................................................ 18 Nebraska MEP SDP/CNA/Evaluation Alignment Chart ..................................................... 19 Priority for Services Students ........................................................................................... 25 Identification and Recruitment Plan ................................................................................. 27 Parent Involvement Plan .................................................................................................. 30 Exchange of Student Records ........................................................................................... 32 Evaluation Plan ................................................................................................................. 33 Statutes, Regulations, & Non‐Regulatory Guidance Related to Program Evaluation ..... 33 Components of the Nebraska MEP Statewide Evaluation ............................................... 34 Evaluation Data Collection Plan ........................................................................................ 36 Interpreting and Using Evaluation Results ....................................................................... 40
Implementation and Accountability Plan .......................................................................... 42 Communication with Local MEPs about the SDP ............................................................. 42 Professional Development and Technical Assistance ....................................................... 42 Alignment of the MEP Application to the SDP .................................................................. 45 State Monitoring Process and Timelines .......................................................................... 45 Looking Forward ............................................................................................................... 47 Appendix A: Service Delivery Plan Committee Meeting Minutes and Agendas Appendix B: Nebraska Service Delivery Planning Chart
1
Executive Summary
The Nebraska Migrant Education Program (MEP) conducted an update to the service delivery plan (SDP) during the 2015‐16 school year. The reason for the update was to complete a periodic update of these documents and to reflect changes that have occurred in the migrant student population. Two SDP Committee meetings were held during 2015‐16 (November 2015 and February 2016). During these meetings, the committee developed strategies and measurable program outcomes (MPOs) to guide MEP implementation beginning in the 2016‐17 program year. In addition, the committee reviewed and updated SDP sections related to priority for services (PFS) designations, implementation and accountability in local programs, identification and recruitment, exchange of student records, and parent involvement. The following are the key findings from the SDP: Federal, state, and local goals and the needs of migrant students were organized within
the following three goal areas:
1. School Readiness 2. Reading/Writing and Mathematics 3. High School Graduation/Services to Out‐of‐School Youth (OSY)
There are gaps in achievement on state assessments between migrant students and
non‐migrant students requiring supplemental services.
The 13 revised strategies will be implemented beginning in the 2016‐17 school year.
The 16 revised MPOs aligned to the strategies will be reported in the 2016‐17 full evaluation report which includes implementation and performance results evaluations, implications, and recommendations for improvement.
2
Introduction
Legislative Mandate
The Migrant Education Program (MEP) is authorized under Title I, Part C of the Elementary and Secondary Education Act (ESEA) of 1965, reauthorized in 2001 as the No Child Left Behind Act (NCLB). The purpose of the MEP is to meet the unique educational needs of migratory children and their families in order to ensure that migrant students reach challenging academic standards and graduate from high school. Specifically, the goal of state MEP is to design programs to help migratory children overcome educational disruption, cultural and language barriers, social isolation, health‐related problems, and other factors inhibiting migratory children from doing well in school and making the transition to postsecondary education or employment [Title I, Part C, Sec. 1301(5)]. In order to identify and address these unique educational needs, State Education Agencies (SEAs) that receive Title I, Part C funds must develop a statewide Service Delivery Plan (SDP) based on a recent Comprehensive Needs Assessment (CNA). Specifically, the SDP addresses the following (pursuant to Title I, Part C, Sec. 1306 and 34 CFR 200.83). Provides for the integration of services with other ESEA programs. Ensures that the state and its local operating agencies identify and address the special
educational needs of migratory children. Reflects collaboration with migrant parents. Provides migratory children with opportunities to meet the same challenging state
academic content standards and challenging state student academic achievement standards that all children are expected to meet.
Specifies measurable program goals and outcomes. Encompasses the full range of services that are available for migratory children from
appropriate local, state, and federal educational programs. Reflects joint planning among local, state, and Federal programs.
The SDP is reviewed and revised to ensure that the services address the needs of changing student demographics. According to the Non‐Regulatory Guidance (2010) from the Office of Migrant Education (OME), State Education Agencies (SEAs) should conduct a CNA every three years, or more frequently if there is evidence of a change in the needs of the migrant student population.
Description of the Nebraska Migrant Education Program
The goal of the Nebraska MEP is to provide leadership to the field regarding programs and services that promote academic excellence and equity for the migrant students and youth of Nebraska. To achieve this goal, the Nebraska MEP strives to create conditions which empower educators working with migrant children to collaborate in designing programs which build upon
3
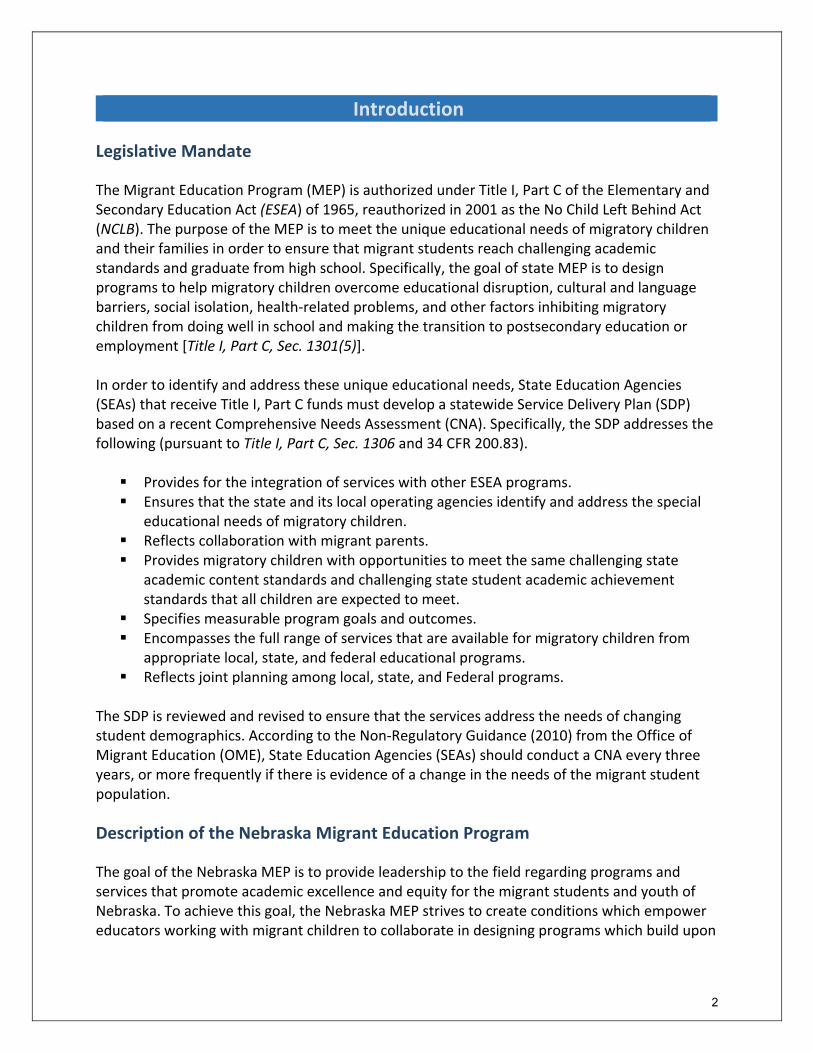
student strengths, eliminate barriers, provide continuity of education, and produce levels of performance for migrant students that meet or exceed those of the general student population. The Nebraska Department of Education (NDE) in Lincoln provides technical assistance, program development, parent engagement, binational teacher exchange, records transfer systems, graduation, resources to teachers serving migrant students, and assistance with identification and recruitment (ID&R). The Nebraska MEP helps migrant children and youth overcome challenges of mobility, frequent absences, late enrollment into school, social isolation, and other difficulties associated with a migratory life, so they can succeed in school. Furthermore, the Nebraska MEP must give priority for services to migrant children and youth who are failing, or most at risk of failing to meet the state’s content and performance standards, and whose education has been interrupted during the regular school year. In order to address the needs of the migrant student population, the Nebraska MEP funds regular school year projects and year‐round projects. Exhibit 1 illustrates the 13 local projects providing MEP services in Nebraska during 2015‐16.
1. Alliance 2. Crete 3. ESU 1/Wakefield 4. ESU 7/Columbus 5. ESU 13/Scottsbluff 6. ESU 15/McCook 7. Fremont 8. Grand Island 9. Hastings 10. Lexington 11. Lincoln 12. Madison 13. Omaha Projects provide instructional and support services aligned with the SDP and the CNA within the three goal areas of school readiness, reading/writing and mathematics, and high school graduation/services to OSY. The primary components of the Nebraska MEP include academic services, supportive and supplemental services, parent involvement, interstate coordination, ID&R, and professional development, which are guided by the program applications/sub‐granting process, CNA, SDP, and the program evaluation. In addition to migrant students migrating within the State of Nebraska, the majority of Nebraska’s migrant students migrate from Mexico, Texas, California, Colorado, Iowa, and Florida (in that order). The work encountered by migrant families is varied. Qualifying agricultural and fishing activities cover a broad spectrum of crops and industries. Below are the seasonal and temporary qualifying activities by county in Nebraska. Only the counties with
Exhibit 1: Map of Nebraska’s MEP Sites

4
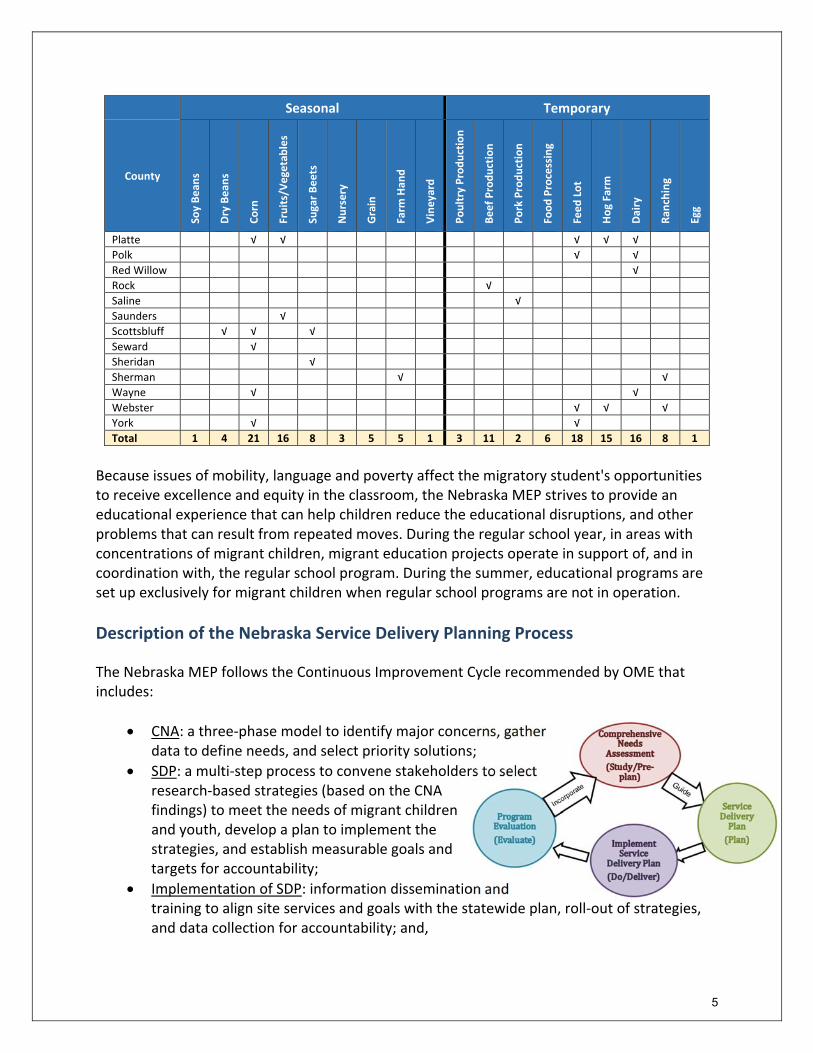
activities are listed. Seasonal/temporary activities occurring the most include corn (21 counties), feed lots (18 counties), fruits/vegetables and dairy (16 counties), and hog farms (15 counties).
Exhibit 2: Nebraska Qualifying Activities by County
Seasonal Temporary
County
Soy Bean
s
Dry Bean
s
Corn
Fruits/Vegetables
Sugar Beets
Nursery
Grain
Farm
Han
d
Vineyard
Poultry Production
Beef Production
Pork Production
Food Processing
Feed Lot
Hog Farm
Dairy
Ran
ching
Egg
Adams √ √ √ √
Antelope √ √ √
Box Butte √ √ √ √ √ √ √
Brown √ √ √
Buffalo √ √ √ √ √ √
Butler √
Cedar √ √
Chase √ √ √ √ √ √
Cheyenne √
Clay √ √ √
Colfax √ √ √ √
Cuming √
Custer √ √ √
Dakota √
Dawes √
Dawson √ √ √ √ √ √
Dixon √ √ √ √ √
Douglas √ √ √ √
Dundy √ √ √ √ √
Furnas √ √ √
Gage √
Gosper √
Hall √ √ √ √ √ √
Harlan √
Hamilton √
Hayes √ √
Hitchcock √ √
Holt √ √
Jefferson √
Johnson √
Kearney √ √ √
Keith √ √ √ √
Lancaster √ √ √ √
Lincoln √ √ √
Madison √ √ √ √
Morill √ √ √
Otoe √ √ √
Perkins √ √
Phelps √ √ √ √
Pierce √ √
5
Seasonal Temporary
County
Soy Bean
s
Dry Bean
s
Corn
Fruits/Vegetables
Sugar Beets
Nursery
Grain
Farm
Han
d
Vineyard
Poultry Production
Beef Production
Pork Production
Food Processing
Feed Lot
Hog Farm
Dairy
Ran
ching
Egg
Platte √ √ √ √ √
Polk √ √
Red Willow √
Rock √
Saline √
Saunders √
Scottsbluff √ √ √
Seward √
Sheridan √
Sherman √ √
Wayne √ √
Webster √ √ √
York √ √
Total 1 4 21 16 8 3 5 5 1 3 11 2 6 18 15 16 8 1
Because issues of mobility, language and poverty affect the migratory student's opportunities to receive excellence and equity in the classroom, the Nebraska MEP strives to provide an educational experience that can help children reduce the educational disruptions, and other problems that can result from repeated moves. During the regular school year, in areas with concentrations of migrant children, migrant education projects operate in support of, and in coordination with, the regular school program. During the summer, educational programs are set up exclusively for migrant children when regular school programs are not in operation.
Description of the Nebraska Service Delivery Planning Process
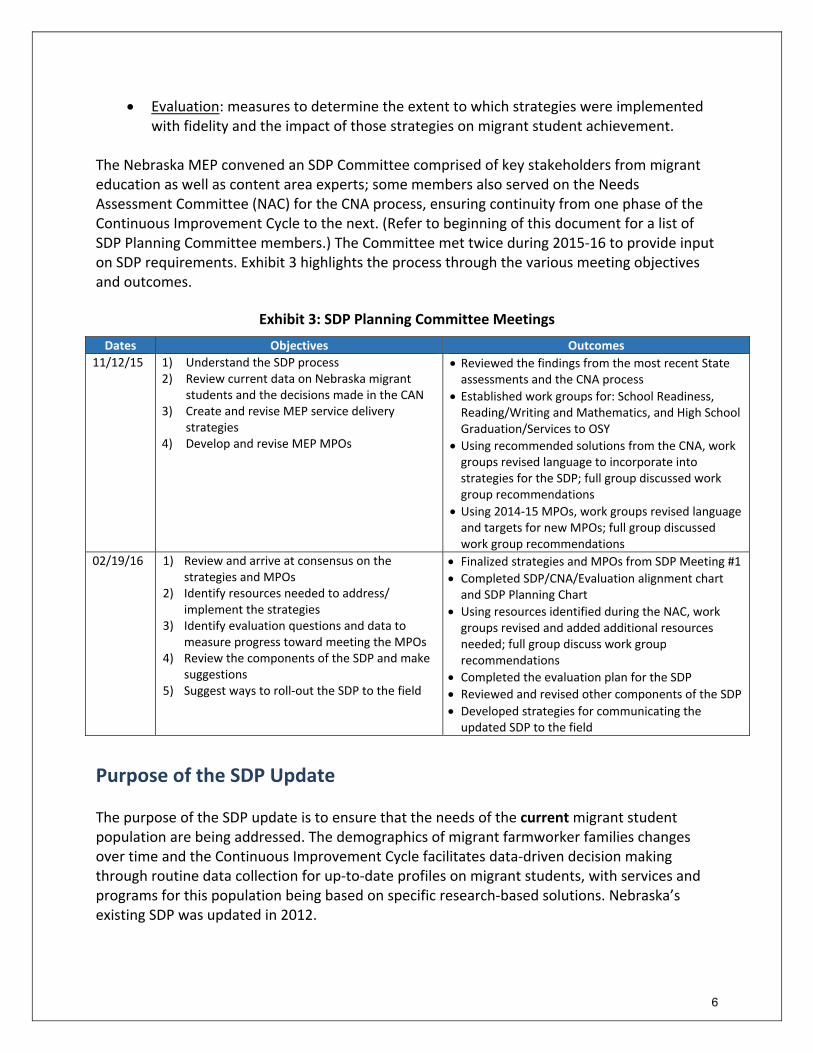
The Nebraska MEP follows the Continuous Improvement Cycle recommended by OME that includes:
CNA: a three‐phase model to identify major concerns, gather data to define needs, and select priority solutions;
SDP: a multi‐step process to convene stakeholders to select research‐based strategies (based on the CNA findings) to meet the needs of migrant children and youth, develop a plan to implement the strategies, and establish measurable goals and targets for accountability;
Implementation of SDP: information dissemination and training to align site services and goals with the statewide plan, roll‐out of strategies, and data collection for accountability; and,
6
Evaluation: measures to determine the extent to which strategies were implemented with fidelity and the impact of those strategies on migrant student achievement.
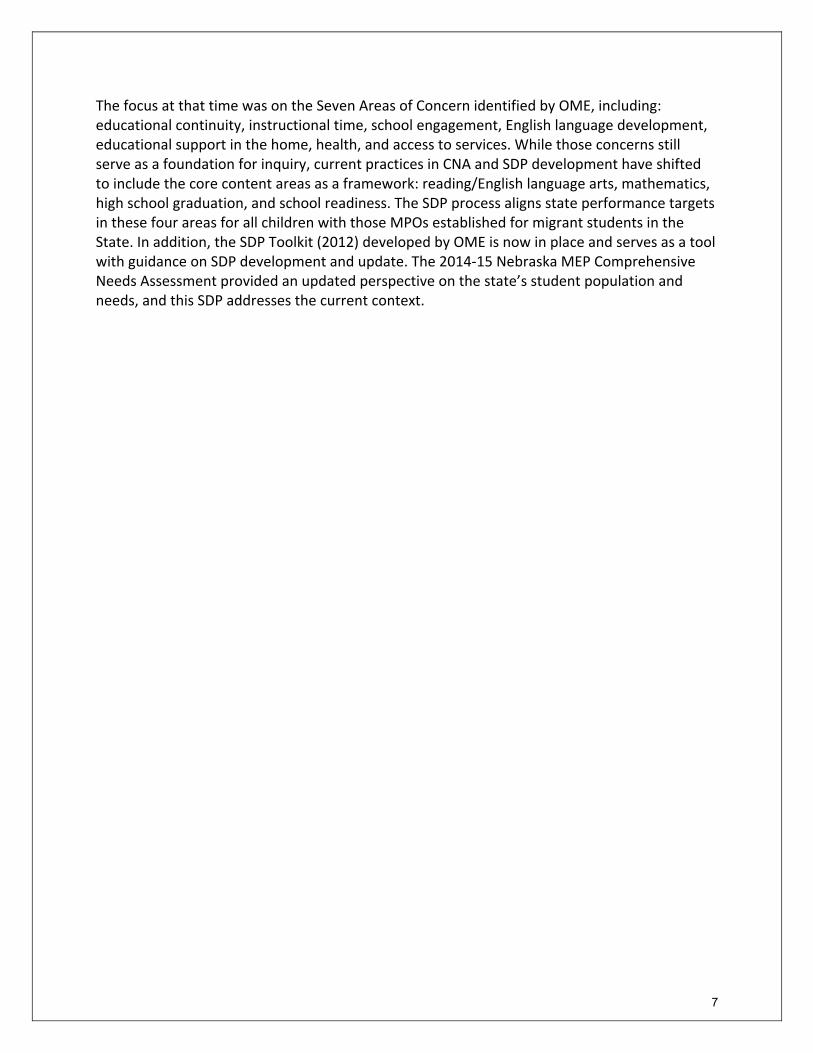
The Nebraska MEP convened an SDP Committee comprised of key stakeholders from migrant education as well as content area experts; some members also served on the Needs Assessment Committee (NAC) for the CNA process, ensuring continuity from one phase of the Continuous Improvement Cycle to the next. (Refer to beginning of this document for a list of SDP Planning Committee members.) The Committee met twice during 2015‐16 to provide input on SDP requirements. Exhibit 3 highlights the process through the various meeting objectives and outcomes.
Exhibit 3: SDP Planning Committee Meetings
Dates Objectives Outcomes
11/12/15 1) Understand the SDP process2) Review current data on Nebraska migrant
students and the decisions made in the CAN 3) Create and revise MEP service delivery
strategies 4) Develop and revise MEP MPOs
Reviewed the findings from the most recent State assessments and the CNA process
Established work groups for: School Readiness, Reading/Writing and Mathematics, and High School Graduation/Services to OSY
Using recommended solutions from the CNA, work groups revised language to incorporate into strategies for the SDP; full group discussed work group recommendations
Using 2014‐15 MPOs, work groups revised language and targets for new MPOs; full group discussed work group recommendations
02/19/16 1) Review and arrive at consensus on the strategies and MPOs
2) Identify resources needed to address/ implement the strategies
3) Identify evaluation questions and data to measure progress toward meeting the MPOs
4) Review the components of the SDP and make suggestions
5) Suggest ways to roll‐out the SDP to the field
Finalized strategies and MPOs from SDP Meeting #1
Completed SDP/CNA/Evaluation alignment chart and SDP Planning Chart
Using resources identified during the NAC, work groups revised and added additional resources needed; full group discuss work group recommendations
Completed the evaluation plan for the SDP
Reviewed and revised other components of the SDP
Developed strategies for communicating the updated SDP to the field
Purpose of the SDP Update The purpose of the SDP update is to ensure that the needs of the current migrant student population are being addressed. The demographics of migrant farmworker families changes over time and the Continuous Improvement Cycle facilitates data‐driven decision making through routine data collection for up‐to‐date profiles on migrant students, with services and programs for this population being based on specific research‐based solutions. Nebraska’s existing SDP was updated in 2012.
7
The focus at that time was on the Seven Areas of Concern identified by OME, including: educational continuity, instructional time, school engagement, English language development, educational support in the home, health, and access to services. While those concerns still serve as a foundation for inquiry, current practices in CNA and SDP development have shifted to include the core content areas as a framework: reading/English language arts, mathematics, high school graduation, and school readiness. The SDP process aligns state performance targets in these four areas for all children with those MPOs established for migrant students in the State. In addition, the SDP Toolkit (2012) developed by OME is now in place and serves as a tool with guidance on SDP development and update. The 2014‐15 Nebraska MEP Comprehensive Needs Assessment provided an updated perspective on the state’s student population and needs, and this SDP addresses the current context.

8
Building on the Comprehensive Needs Assessment
The CNA Process in Nebraska
The Nebraska MEP convened Needs Assessment Committee (NAC) meetings in November 2014 and February 2015 to implement the three‐phase CNA process (See Exhibit 4 below). The following graphic summarizes the phases used to explore the current needs of migrant children and youth, to confirm those needs through data analysis, and to establish priority solutions.
Exhibit 4: Three‐phase Model for CNA
During NAC meetings, concern statements were developed along with need indicators and need statements. The NAC reviewed data related to migrant student achievement, attendance, mobility, graduation, and participation in migrant activities. In addition, MEP staff and parents from across the State of Nebraska were surveyed to determine the types and extent of needs of migrant students. Data analysis and descriptions of the procedures are recorded in the 2015 CNA Report. The concerns outlined in the report reflected the Committee’s concerns about the needs of migrant students. Based on information collected from data in 2012‐13 and 2013‐14, the NAC was able to create a description of typical Nebraska migrant students. According to the 2013‐2014 Consolidated State Performance Report (CSPR), the number
of eligible migrant students identified in Nebraska was 5,429, and the number of
9
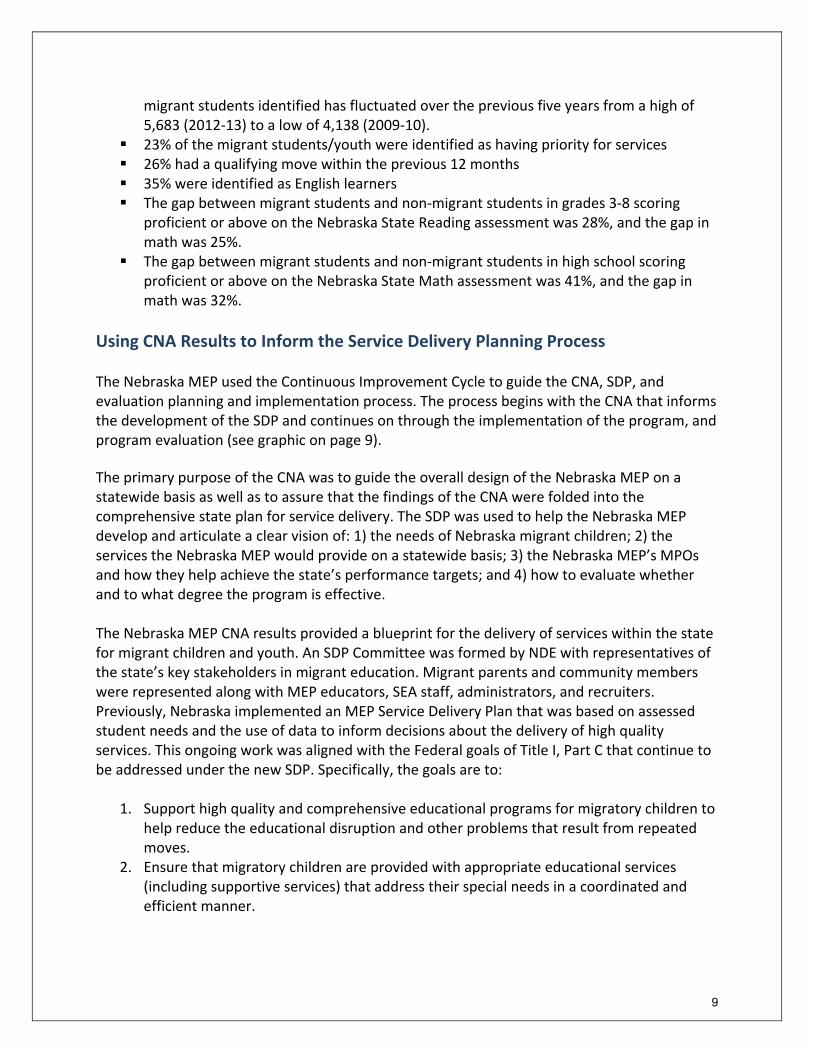
migrant students identified has fluctuated over the previous five years from a high of 5,683 (2012‐13) to a low of 4,138 (2009‐10).
23% of the migrant students/youth were identified as having priority for services 26% had a qualifying move within the previous 12 months 35% were identified as English learners The gap between migrant students and non‐migrant students in grades 3‐8 scoring
proficient or above on the Nebraska State Reading assessment was 28%, and the gap in math was 25%.
The gap between migrant students and non‐migrant students in high school scoring proficient or above on the Nebraska State Math assessment was 41%, and the gap in math was 32%.
Using CNA Results to Inform the Service Delivery Planning Process The Nebraska MEP used the Continuous Improvement Cycle to guide the CNA, SDP, and evaluation planning and implementation process. The process begins with the CNA that informs the development of the SDP and continues on through the implementation of the program, and program evaluation (see graphic on page 9).
The primary purpose of the CNA was to guide the overall design of the Nebraska MEP on a statewide basis as well as to assure that the findings of the CNA were folded into the comprehensive state plan for service delivery. The SDP was used to help the Nebraska MEP develop and articulate a clear vision of: 1) the needs of Nebraska migrant children; 2) the services the Nebraska MEP would provide on a statewide basis; 3) the Nebraska MEP’s MPOs and how they help achieve the state’s performance targets; and 4) how to evaluate whether and to what degree the program is effective. The Nebraska MEP CNA results provided a blueprint for the delivery of services within the state for migrant children and youth. An SDP Committee was formed by NDE with representatives of the state’s key stakeholders in migrant education. Migrant parents and community members were represented along with MEP educators, SEA staff, administrators, and recruiters. Previously, Nebraska implemented an MEP Service Delivery Plan that was based on assessed student needs and the use of data to inform decisions about the delivery of high quality services. This ongoing work was aligned with the Federal goals of Title I, Part C that continue to be addressed under the new SDP. Specifically, the goals are to:
1. Support high quality and comprehensive educational programs for migratory children to help reduce the educational disruption and other problems that result from repeated moves.
2. Ensure that migratory children are provided with appropriate educational services (including supportive services) that address their special needs in a coordinated and efficient manner.
10
3. Ensure that migratory children have the opportunity to meet the same challenging state content standards and student performance standards that all children are expected to meet.
4. Design programs to help migratory children overcome educational disruptions, cultural and language barriers, social isolation, various health‐related problems, and other factors that inhibit the ability of such children to do well in school, and to prepare such children to make a successful transition to postsecondary education or employment.
5. Ensure that migratory children benefit from State and local systemic reforms.
Aligning CNA Results with State Systems and Resources Members of the SDP Committee represented NDE staff from other offices to incorporate research‐based practices in the content focus areas and to ensure alignment with state priorities beyond the MEP. Along with surveys and outcome data, data included the most recent (2013‐14) student performance on the Nebraska State assessment exams in order to create CNA need statements. Those need statements, as well as results reported in the 2014‐15 Evaluation Report, informed the development of the MPOs by the SDP Committee.

11
General Framework: Plan Alignment
This section shows the alignment of the required components of the SDP (State performance targets, needs assessment, service delivery strategies, MPOs, and evaluation). Each component has its own function in the SDP, but all are aligned to provide a cohesive and consistent approach to enable migrant students to achieve State performance goals and targets. The chart on pages 23‐28 shows the alignment of these components.
State Performance Indicators The State Performance Targets for migrant students in reading, math, and graduation work in concert with Nebraska’s NCLB priorities and goals. Nebraska has not applied for an NCLB waiver, so the 100% performance targets for all grade levels in reading and math are still the targets for the State. The State target for high school graduation is 90%. No target has been set for dropout rates.
Needs Assessment The needs assessment results described in the 2015 Nebraska MEP CNA Report were used as a foundation for this SDP. Following is the Nebraska Migrant Student Profile using data from 2013‐14 which lists the needs identified in numerous categories.
Exhibit 5: Nebraska MEP Student Profile (data from 2013‐14)
Data Element Statistic
1 Total Number of Eligible Migrant Students (ages 0‐21) 5,429
2 Migrant Students Classified as Having Priority for Services (PFS) 1,247 (23%)
3 Migrant Students Classified as Limited English Proficient (LEP) 1,876 (35%)
4 Migrant Students Classified as Having a Disability under Part B/C of the IDEA 244 (4%)
5 Migrant Students with a Qualifying Arrival Date (QAD) within 12 months of the last day of the performance period
1,386 (26%)
6 Migrant Out‐of‐School Youth (OSY) 313 (6%)
7 Migrant Students Served during the Performance Period 3,523 (65%)
8 Instructional Services Received During the Performance Period 1,140 (32%)
9 Support Services Received During the Performance Period 3,459 (98%)
10 Counseling Services Received During the Performance Period 492 (14%)
11 Referred Services Received During the Performance Period 1,234 (35%)
12 Migrant Students Served during the Regular School Year 2,793 (51%)
13 PFS Migrant Students Served during the Regular School Year 839 (67%)
14 Migrant Students Served during the Summer 1,732 (32%)
15 PFS Migrant Students Served during the Summer 342 (27%)
16 Migrant Student Graduation Rate (Non‐migrant rate is 89.7%) 73.3%
17 PFS Migrant Student Graduation Rate 51.7%
18 Non‐PFS Migrant Student Graduation Rate 73.9%
19 Migrant Student Dropout Rate (Non‐migrant rate is 1.11%) 2.04%
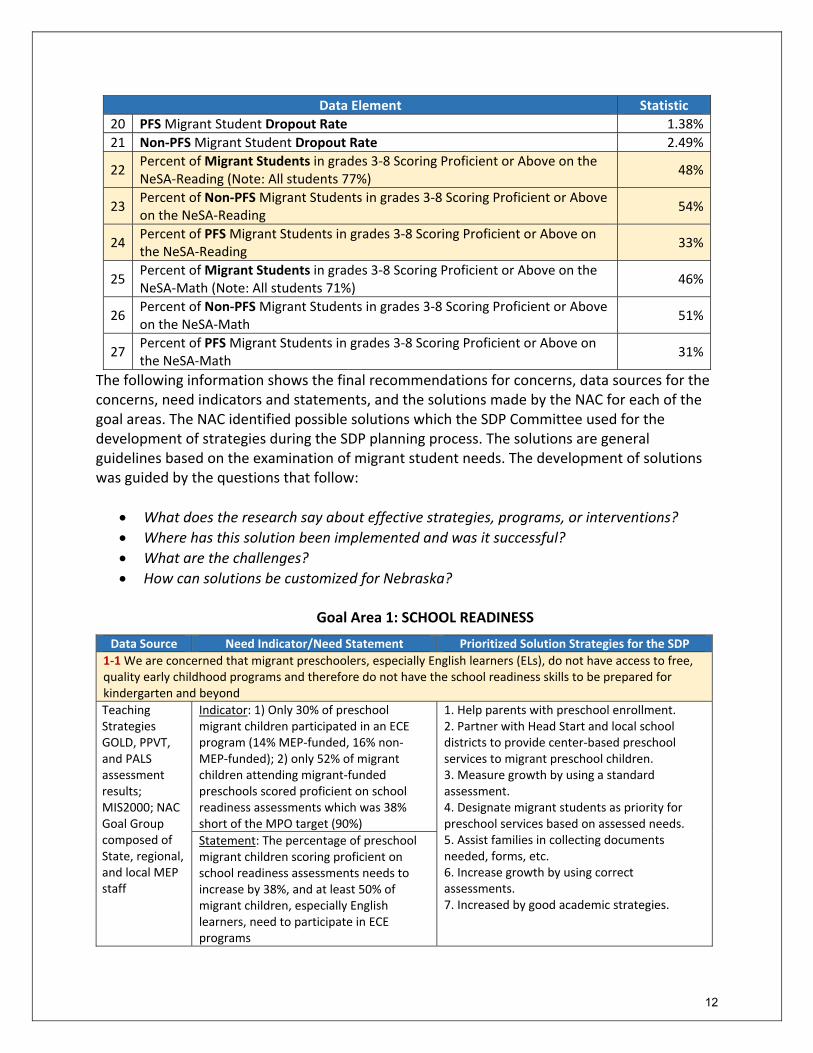
12
Data Element Statistic
20 PFS Migrant Student Dropout Rate 1.38%
21 Non‐PFS Migrant Student Dropout Rate 2.49%
22 Percent of Migrant Students in grades 3‐8 Scoring Proficient or Above on the NeSA‐Reading (Note: All students 77%)
48%
23 Percent of Non‐PFS Migrant Students in grades 3‐8 Scoring Proficient or Above on the NeSA‐Reading
54%
24 Percent of PFS Migrant Students in grades 3‐8 Scoring Proficient or Above on the NeSA‐Reading
33%
25 Percent of Migrant Students in grades 3‐8 Scoring Proficient or Above on the NeSA‐Math (Note: All students 71%)
46%
26 Percent of Non‐PFS Migrant Students in grades 3‐8 Scoring Proficient or Above on the NeSA‐Math
51%
27 Percent of PFS Migrant Students in grades 3‐8 Scoring Proficient or Above on the NeSA‐Math
31%
The following information shows the final recommendations for concerns, data sources for the concerns, need indicators and statements, and the solutions made by the NAC for each of the goal areas. The NAC identified possible solutions which the SDP Committee used for the development of strategies during the SDP planning process. The solutions are general guidelines based on the examination of migrant student needs. The development of solutions was guided by the questions that follow:
What does the research say about effective strategies, programs, or interventions?
Where has this solution been implemented and was it successful?
What are the challenges?
How can solutions be customized for Nebraska?
Goal Area 1: SCHOOL READINESS Data Source Need Indicator/Need Statement Prioritized Solution Strategies for the SDP
1‐1 We are concerned that migrant preschoolers, especially English learners (ELs), do not have access to free, quality early childhood programs and therefore do not have the school readiness skills to be prepared for kindergarten and beyond
Teaching Strategies GOLD, PPVT, and PALS assessment results; MIS2000; NAC Goal Group composed of State, regional, and local MEP staff
Indicator: 1) Only 30% of preschool migrant children participated in an ECE program (14% MEP‐funded, 16% non‐MEP‐funded); 2) only 52% of migrant children attending migrant‐funded preschools scored proficient on school readiness assessments which was 38% short of the MPO target (90%)
1. Help parents with preschool enrollment.2. Partner with Head Start and local school districts to provide center‐based preschool services to migrant preschool children. 3. Measure growth by using a standard assessment. 4. Designate migrant students as priority for preschool services based on assessed needs. 5. Assist families in collecting documents needed, forms, etc. 6. Increase growth by using correct assessments. 7. Increased by good academic strategies.
Statement: The percentage of preschool migrant children scoring proficient on school readiness assessments needs to increase by 38%, and at least 50% of migrant children, especially English learners, need to participate in ECE programs
13
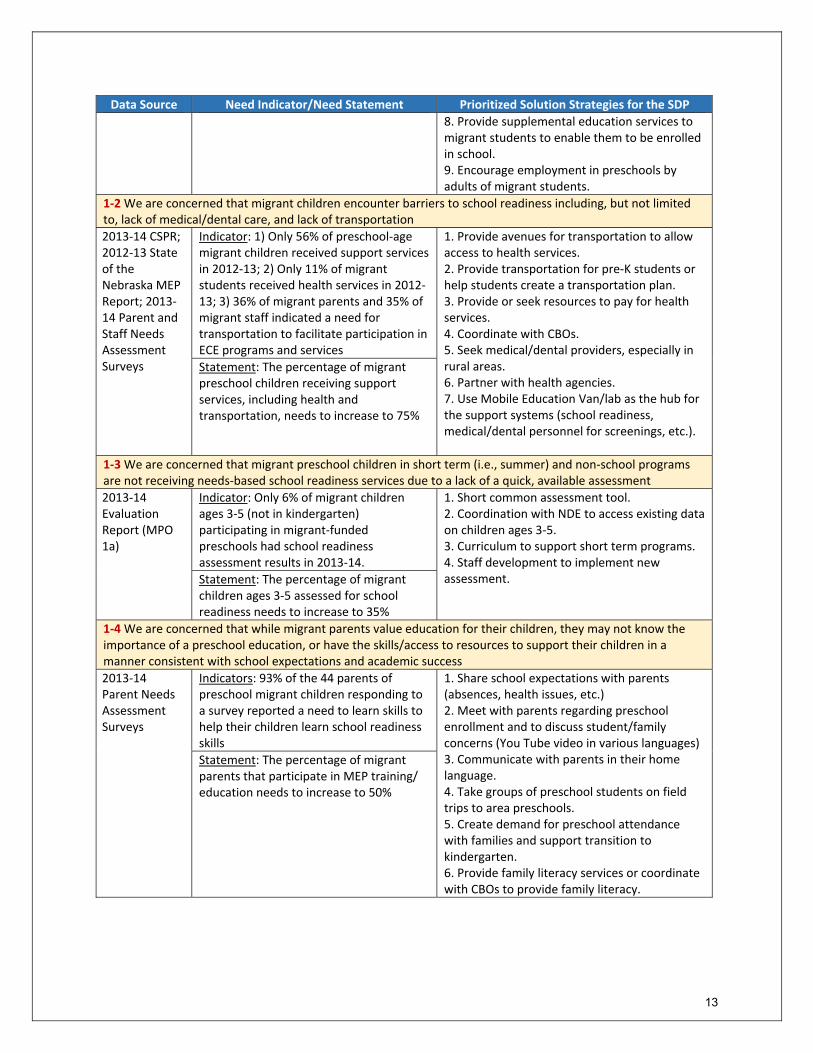
Data Source Need Indicator/Need Statement Prioritized Solution Strategies for the SDP
8. Provide supplemental education services to migrant students to enable them to be enrolled in school. 9. Encourage employment in preschools by adults of migrant students.
1‐2 We are concerned that migrant children encounter barriers to school readiness including, but not limited to, lack of medical/dental care, and lack of transportation
2013‐14 CSPR; 2012‐13 State of the Nebraska MEP Report; 2013‐14 Parent and Staff Needs Assessment Surveys
Indicator: 1) Only 56% of preschool‐age migrant children received support services in 2012‐13; 2) Only 11% of migrant students received health services in 2012‐13; 3) 36% of migrant parents and 35% of migrant staff indicated a need for transportation to facilitate participation in ECE programs and services
1. Provide avenues for transportation to allow access to health services. 2. Provide transportation for pre‐K students or help students create a transportation plan. 3. Provide or seek resources to pay for health services. 4. Coordinate with CBOs. 5. Seek medical/dental providers, especially in rural areas. 6. Partner with health agencies. 7. Use Mobile Education Van/lab as the hub for the support systems (school readiness, medical/dental personnel for screenings, etc.).
Statement: The percentage of migrant preschool children receiving support services, including health and transportation, needs to increase to 75%
1‐3 We are concerned that migrant preschool children in short term (i.e., summer) and non‐school programs are not receiving needs‐based school readiness services due to a lack of a quick, available assessment
2013‐14 Evaluation Report (MPO 1a)
Indicator: Only 6% of migrant children ages 3‐5 (not in kindergarten) participating in migrant‐funded preschools had school readiness assessment results in 2013‐14.
1. Short common assessment tool. 2. Coordination with NDE to access existing data on children ages 3‐5. 3. Curriculum to support short term programs. 4. Staff development to implement new assessment. Statement: The percentage of migrant
children ages 3‐5 assessed for school readiness needs to increase to 35%
1‐4 We are concerned that while migrant parents value education for their children, they may not know the importance of a preschool education, or have the skills/access to resources to support their children in a manner consistent with school expectations and academic success
2013‐14 Parent Needs Assessment Surveys
Indicators: 93% of the 44 parents of preschool migrant children responding to a survey reported a need to learn skills to help their children learn school readiness skills
1. Share school expectations with parents (absences, health issues, etc.) 2. Meet with parents regarding preschool enrollment and to discuss student/family concerns (You Tube video in various languages) 3. Communicate with parents in their home language. 4. Take groups of preschool students on field trips to area preschools. 5. Create demand for preschool attendance with families and support transition to kindergarten. 6. Provide family literacy services or coordinate with CBOs to provide family literacy.
Statement: The percentage of migrant parents that participate in MEP training/ education needs to increase to 50%
14
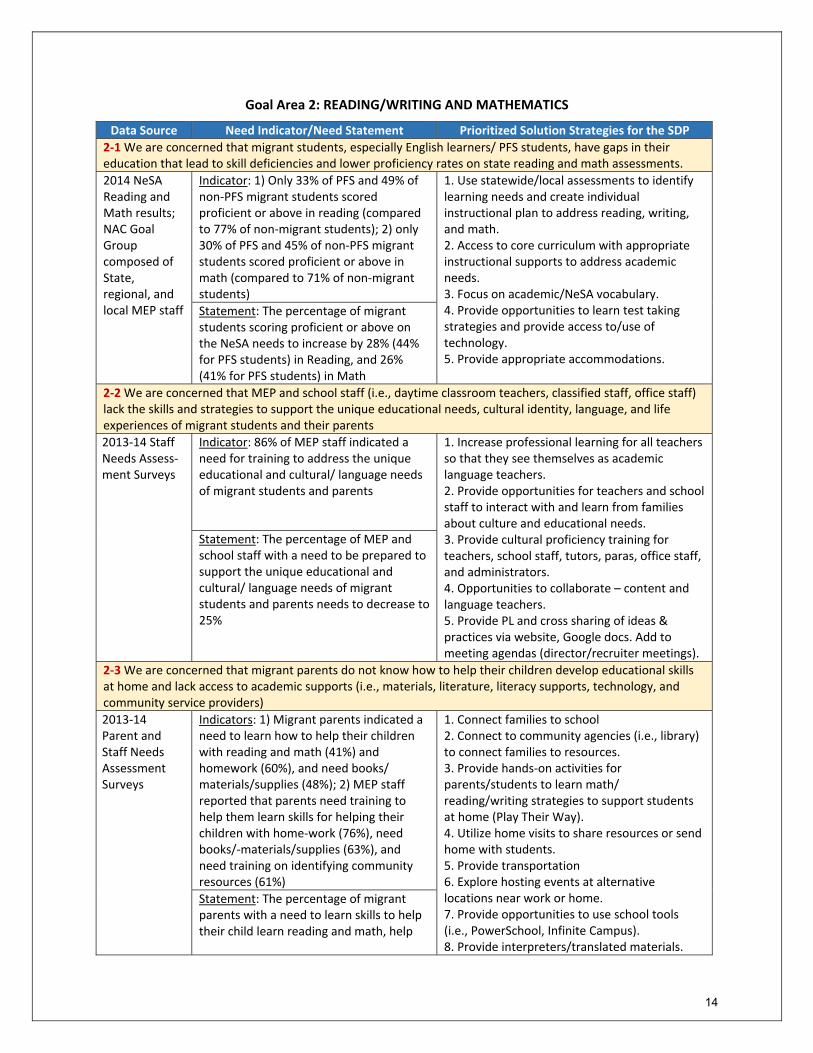
Goal Area 2: READING/WRITING AND MATHEMATICS Data Source Need Indicator/Need Statement Prioritized Solution Strategies for the SDP
2‐1 We are concerned that migrant students, especially English learners/ PFS students, have gaps in their education that lead to skill deficiencies and lower proficiency rates on state reading and math assessments.
2014 NeSA Reading and Math results; NAC Goal Group composed of State, regional, and local MEP staff
Indicator: 1) Only 33% of PFS and 49% of non‐PFS migrant students scored proficient or above in reading (compared to 77% of non‐migrant students); 2) only 30% of PFS and 45% of non‐PFS migrant students scored proficient or above in math (compared to 71% of non‐migrant students)
1. Use statewide/local assessments to identify learning needs and create individual instructional plan to address reading, writing, and math. 2. Access to core curriculum with appropriate instructional supports to address academic needs. 3. Focus on academic/NeSA vocabulary. 4. Provide opportunities to learn test taking strategies and provide access to/use of technology. 5. Provide appropriate accommodations.
Statement: The percentage of migrant students scoring proficient or above on the NeSA needs to increase by 28% (44% for PFS students) in Reading, and 26% (41% for PFS students) in Math
2‐2 We are concerned that MEP and school staff (i.e., daytime classroom teachers, classified staff, office staff) lack the skills and strategies to support the unique educational needs, cultural identity, language, and life experiences of migrant students and their parents
2013‐14 Staff Needs Assess‐ment Surveys
Indicator: 86% of MEP staff indicated a need for training to address the unique educational and cultural/ language needs of migrant students and parents
1. Increase professional learning for all teachers so that they see themselves as academic language teachers. 2. Provide opportunities for teachers and school staff to interact with and learn from families about culture and educational needs. 3. Provide cultural proficiency training for teachers, school staff, tutors, paras, office staff, and administrators. 4. Opportunities to collaborate – content and language teachers. 5. Provide PL and cross sharing of ideas & practices via website, Google docs. Add to meeting agendas (director/recruiter meetings).
Statement: The percentage of MEP and school staff with a need to be prepared to support the unique educational and cultural/ language needs of migrant students and parents needs to decrease to 25%
2‐3 We are concerned that migrant parents do not know how to help their children develop educational skillsat home and lack access to academic supports (i.e., materials, literature, literacy supports, technology, and community service providers)
2013‐14 Parent and Staff Needs Assessment Surveys
Indicators: 1) Migrant parents indicated a need to learn how to help their children with reading and math (41%) and homework (60%), and need books/ materials/supplies (48%); 2) MEP staff reported that parents need training to help them learn skills for helping their children with home‐work (76%), need books/‐materials/supplies (63%), and need training on identifying community resources (61%)
1. Connect families to school 2. Connect to community agencies (i.e., library) to connect families to resources. 3. Provide hands‐on activities for parents/students to learn math/ reading/writing strategies to support students at home (Play Their Way). 4. Utilize home visits to share resources or send home with students. 5. Provide transportation 6. Explore hosting events at alternative locations near work or home. 7. Provide opportunities to use school tools (i.e., PowerSchool, Infinite Campus). 8. Provide interpreters/translated materials.
Statement: The percentage of migrant parents with a need to learn skills to help their child learn reading and math, help
15
Data Source Need Indicator/Need Statement Prioritized Solution Strategies for the SDP
with homework, and access resources needs to decrease to less than 20%
9. Identify needs and best times to meet (individualized learning plan). 10. Include extended family members, not just parents. 11. Send monthly “tip sheets” with practical ideas. 12. Discuss parent academic expectations.
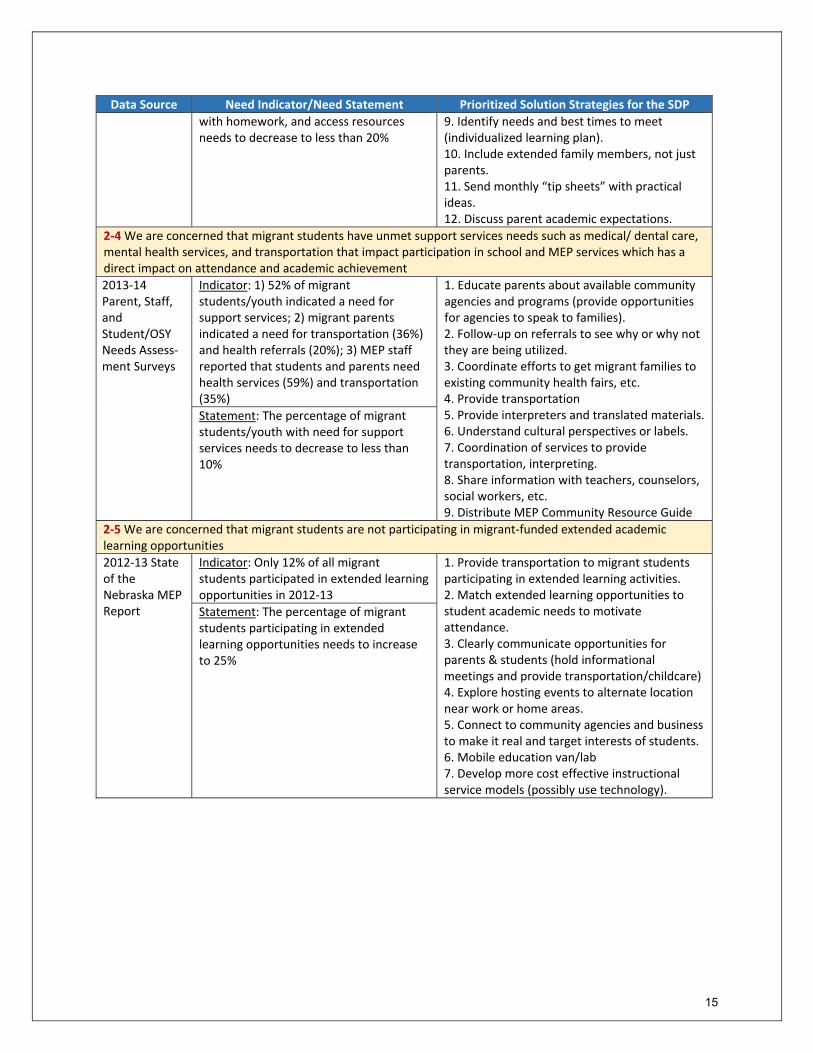
2‐4 We are concerned that migrant students have unmet support services needs such as medical/ dental care, mental health services, and transportation that impact participation in school and MEP services which has a direct impact on attendance and academic achievement
2013‐14 Parent, Staff, and Student/OSY Needs Assess‐ment Surveys
Indicator: 1) 52% of migrant students/youth indicated a need for support services; 2) migrant parents indicated a need for transportation (36%) and health referrals (20%); 3) MEP staff reported that students and parents need health services (59%) and transportation (35%)
1. Educate parents about available community agencies and programs (provide opportunities for agencies to speak to families). 2. Follow‐up on referrals to see why or why not they are being utilized. 3. Coordinate efforts to get migrant families to existing community health fairs, etc. 4. Provide transportation 5. Provide interpreters and translated materials.6. Understand cultural perspectives or labels. 7. Coordination of services to provide transportation, interpreting. 8. Share information with teachers, counselors, social workers, etc. 9. Distribute MEP Community Resource Guide
Statement: The percentage of migrant students/youth with need for support services needs to decrease to less than 10%
2‐5 We are concerned that migrant students are not participating in migrant‐funded extended academic learning opportunities
2012‐13 State of the Nebraska MEP Report
Indicator: Only 12% of all migrant students participated in extended learning opportunities in 2012‐13
1. Provide transportation to migrant students participating in extended learning activities. 2. Match extended learning opportunities to student academic needs to motivate attendance. 3. Clearly communicate opportunities for parents & students (hold informational meetings and provide transportation/childcare) 4. Explore hosting events to alternate location near work or home areas. 5. Connect to community agencies and business to make it real and target interests of students. 6. Mobile education van/lab 7. Develop more cost effective instructional service models (possibly use technology).
Statement: The percentage of migrant students participating in extended learning opportunities needs to increase to 25%
16
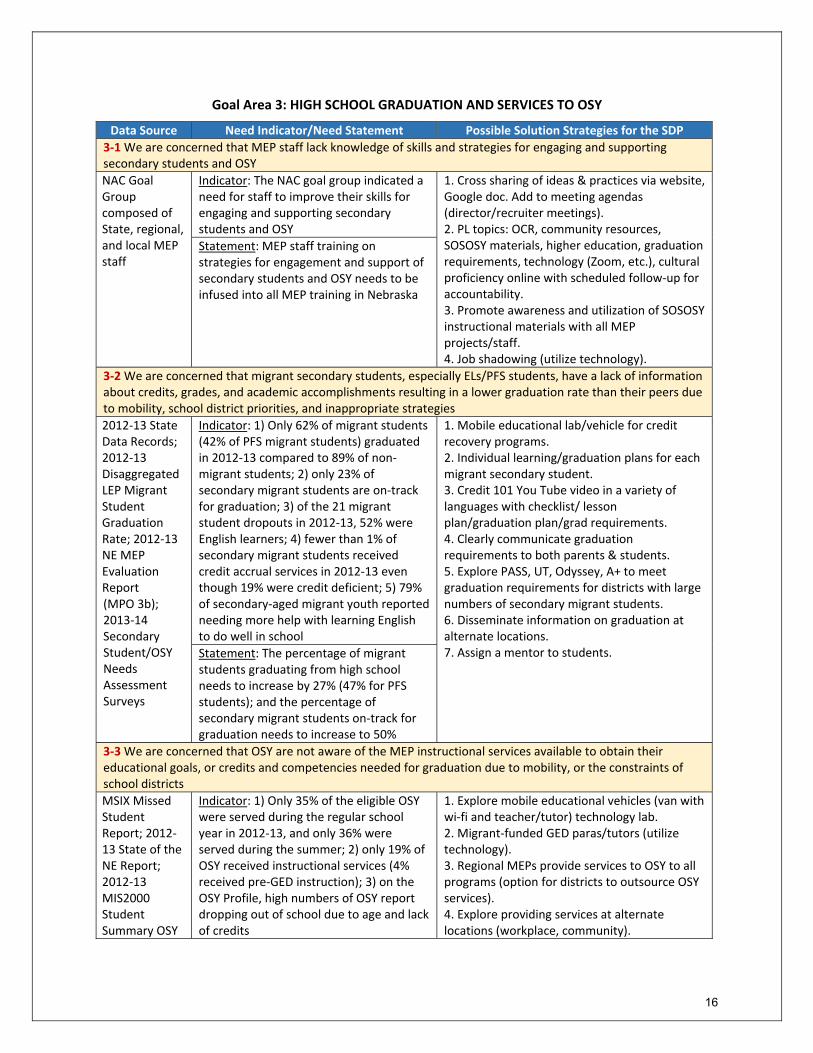
Goal Area 3: HIGH SCHOOL GRADUATION AND SERVICES TO OSY Data Source Need Indicator/Need Statement Possible Solution Strategies for the SDP
3‐1 We are concerned that MEP staff lack knowledge of skills and strategies for engaging and supporting secondary students and OSY
NAC Goal Group composed of State, regional, and local MEP staff
Indicator: The NAC goal group indicated a need for staff to improve their skills for engaging and supporting secondary students and OSY
1. Cross sharing of ideas & practices via website, Google doc. Add to meeting agendas (director/recruiter meetings). 2. PL topics: OCR, community resources, SOSOSY materials, higher education, graduation requirements, technology (Zoom, etc.), cultural proficiency online with scheduled follow‐up for accountability. 3. Promote awareness and utilization of SOSOSY instructional materials with all MEP projects/staff. 4. Job shadowing (utilize technology).
Statement: MEP staff training on strategies for engagement and support of secondary students and OSY needs to be infused into all MEP training in Nebraska
3‐2 We are concerned that migrant secondary students, especially ELs/PFS students, have a lack of information about credits, grades, and academic accomplishments resulting in a lower graduation rate than their peers due to mobility, school district priorities, and inappropriate strategies
2012‐13 State Data Records; 2012‐13 Disaggregated LEP Migrant Student Graduation Rate; 2012‐13 NE MEP Evaluation Report (MPO 3b); 2013‐14 Secondary Student/OSY Needs Assessment Surveys
Indicator: 1) Only 62% of migrant students (42% of PFS migrant students) graduated in 2012‐13 compared to 89% of non‐migrant students; 2) only 23% of secondary migrant students are on‐track for graduation; 3) of the 21 migrant student dropouts in 2012‐13, 52% were English learners; 4) fewer than 1% of secondary migrant students received credit accrual services in 2012‐13 even though 19% were credit deficient; 5) 79% of secondary‐aged migrant youth reported needing more help with learning English to do well in school
1. Mobile educational lab/vehicle for credit recovery programs. 2. Individual learning/graduation plans for each migrant secondary student. 3. Credit 101 You Tube video in a variety of languages with checklist/ lesson plan/graduation plan/grad requirements. 4. Clearly communicate graduation requirements to both parents & students. 5. Explore PASS, UT, Odyssey, A+ to meet graduation requirements for districts with large numbers of secondary migrant students. 6. Disseminate information on graduation at alternate locations. 7. Assign a mentor to students.
Statement: The percentage of migrant students graduating from high school needs to increase by 27% (47% for PFS students); and the percentage of secondary migrant students on‐track for graduation needs to increase to 50%
3‐3 We are concerned that OSY are not aware of the MEP instructional services available to obtain their educational goals, or credits and competencies needed for graduation due to mobility, or the constraints of school districts
MSIX Missed Student Report; 2012‐13 State of the NE Report; 2012‐13 MIS2000 Student Summary OSY
Indicator: 1) Only 35% of the eligible OSY were served during the regular school year in 2012‐13, and only 36% were served during the summer; 2) only 19% of OSY received instructional services (4% received pre‐GED instruction); 3) on the OSY Profile, high numbers of OSY report dropping out of school due to age and lack of credits
1. Explore mobile educational vehicles (van with wi‐fi and teacher/tutor) technology lab. 2. Migrant‐funded GED paras/tutors (utilize technology). 3. Regional MEPs provide services to OSY to all programs (option for districts to outsource OSY services). 4. Explore providing services at alternate locations (workplace, community).
17
Data Source Need Indicator/Need Statement Possible Solution Strategies for the SDP
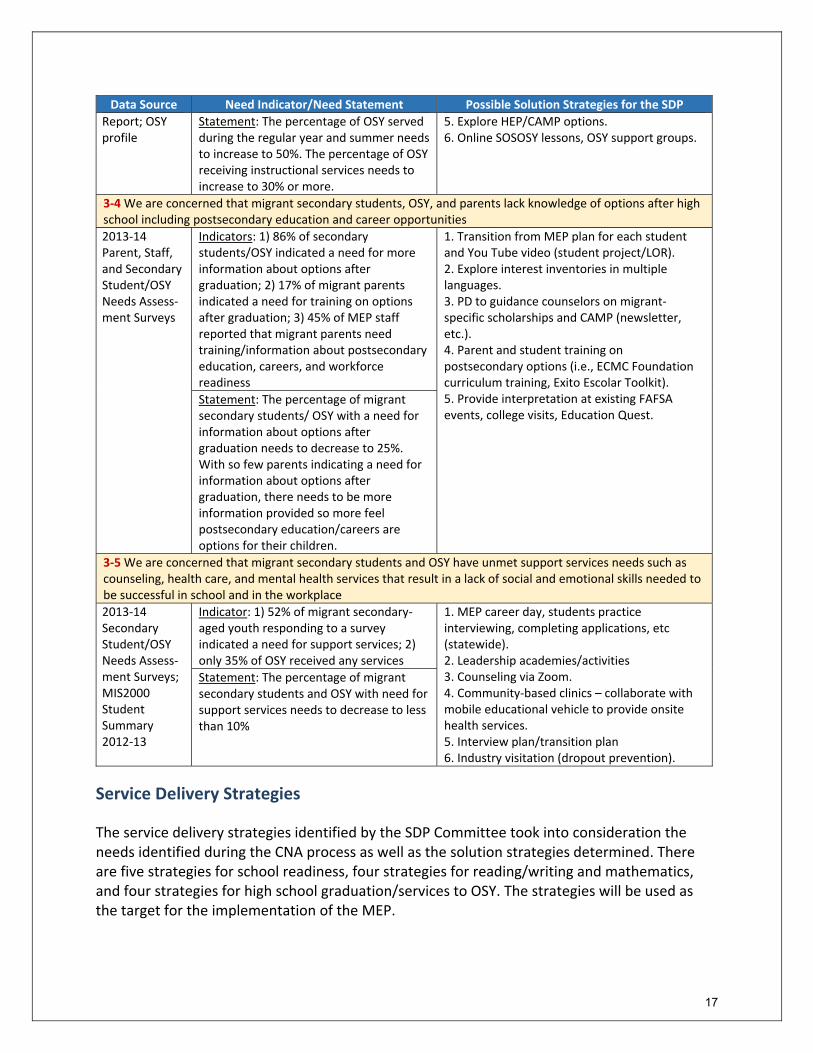
Report; OSY profile
Statement: The percentage of OSY served during the regular year and summer needs to increase to 50%. The percentage of OSY receiving instructional services needs to increase to 30% or more.
5. Explore HEP/CAMP options. 6. Online SOSOSY lessons, OSY support groups.
3‐4 We are concerned that migrant secondary students, OSY, and parents lack knowledge of options after high school including postsecondary education and career opportunities
2013‐14 Parent, Staff, and Secondary Student/OSY Needs Assess‐ment Surveys
Indicators: 1) 86% of secondary students/OSY indicated a need for more information about options after graduation; 2) 17% of migrant parents indicated a need for training on options after graduation; 3) 45% of MEP staff reported that migrant parents need training/information about postsecondary education, careers, and workforce readiness
1. Transition from MEP plan for each student and You Tube video (student project/LOR). 2. Explore interest inventories in multiple languages. 3. PD to guidance counselors on migrant‐specific scholarships and CAMP (newsletter, etc.). 4. Parent and student training on postsecondary options (i.e., ECMC Foundation curriculum training, Exito Escolar Toolkit). 5. Provide interpretation at existing FAFSA events, college visits, Education Quest.
Statement: The percentage of migrant secondary students/ OSY with a need for information about options after graduation needs to decrease to 25%. With so few parents indicating a need for information about options after graduation, there needs to be more information provided so more feel postsecondary education/careers are options for their children.
3‐5 We are concerned that migrant secondary students and OSY have unmet support services needs such as counseling, health care, and mental health services that result in a lack of social and emotional skills needed to be successful in school and in the workplace
2013‐14 Secondary Student/OSY Needs Assess‐ment Surveys; MIS2000 Student Summary 2012‐13
Indicator: 1) 52% of migrant secondary‐aged youth responding to a survey indicated a need for support services; 2) only 35% of OSY received any services
1. MEP career day, students practice interviewing, completing applications, etc (statewide). 2. Leadership academies/activities 3. Counseling via Zoom. 4. Community‐based clinics – collaborate with mobile educational vehicle to provide onsite health services. 5. Interview plan/transition plan 6. Industry visitation (dropout prevention).
Statement: The percentage of migrant secondary students and OSY with need for support services needs to decrease to less than 10%
Service Delivery Strategies
The service delivery strategies identified by the SDP Committee took into consideration the needs identified during the CNA process as well as the solution strategies determined. There are five strategies for school readiness, four strategies for reading/writing and mathematics, and four strategies for high school graduation/services to OSY. The strategies will be used as the target for the implementation of the MEP.

18
Measurable Program Outcomes (MPOs)
The SDP Committee updated the MPOs from previous years to reflect the State performance targets, needs identified in the 2015 CNA, and solutions identified during the CNA process. MPOs are the desired outcomes of the strategies that quantify the differences that the MEP will make. MPOs provide the foundation for the SDP and can be clearly communicated, implemented with fidelity, and evaluated.
Evaluation Questions
The SDP Committee developed an Evaluation Plan for results (that relate to the State Performance Indicators/Targets and MPOs) and for implementation (that relate to the strategies). The charts that follows provides a foundation for the MEP evaluation based on the questions identified during the SDP planning process. Please refer to the Evaluation Plan located on pages 37‐45 of this SDP for a detailed description of the Nebraska MEP Evaluation Plan.
19
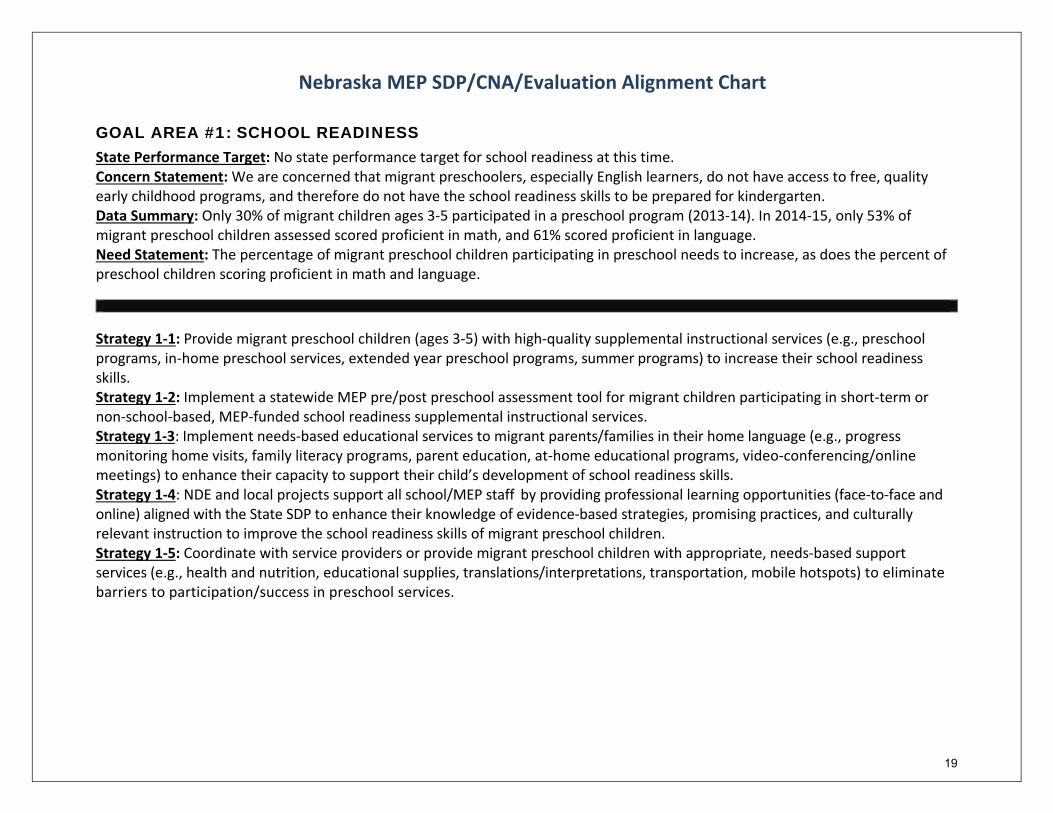
Nebraska MEP SDP/CNA/Evaluation Alignment Chart GOAL AREA #1: SCHOOL READINESS State Performance Target: No state performance target for school readiness at this time. Concern Statement: We are concerned that migrant preschoolers, especially English learners, do not have access to free, quality early childhood programs, and therefore do not have the school readiness skills to be prepared for kindergarten. Data Summary: Only 30% of migrant children ages 3‐5 participated in a preschool program (2013‐14). In 2014‐15, only 53% of migrant preschool children assessed scored proficient in math, and 61% scored proficient in language. Need Statement: The percentage of migrant preschool children participating in preschool needs to increase, as does the percent of preschool children scoring proficient in math and language.
Strategy 1‐1: Provide migrant preschool children (ages 3‐5) with high‐quality supplemental instructional services (e.g., preschool programs, in‐home preschool services, extended year preschool programs, summer programs) to increase their school readiness skills. Strategy 1‐2: Implement a statewide MEP pre/post preschool assessment tool for migrant children participating in short‐term or non‐school‐based, MEP‐funded school readiness supplemental instructional services. Strategy 1‐3: Implement needs‐based educational services to migrant parents/families in their home language (e.g., progress monitoring home visits, family literacy programs, parent education, at‐home educational programs, video‐conferencing/online meetings) to enhance their capacity to support their child’s development of school readiness skills. Strategy 1‐4: NDE and local projects support all school/MEP staff by providing professional learning opportunities (face‐to‐face and online) aligned with the State SDP to enhance their knowledge of evidence‐based strategies, promising practices, and culturally relevant instruction to improve the school readiness skills of migrant preschool children. Strategy 1‐5: Coordinate with service providers or provide migrant preschool children with appropriate, needs‐based support services (e.g., health and nutrition, educational supplies, translations/interpretations, transportation, mobile hotspots) to eliminate barriers to participation/success in preschool services.
20
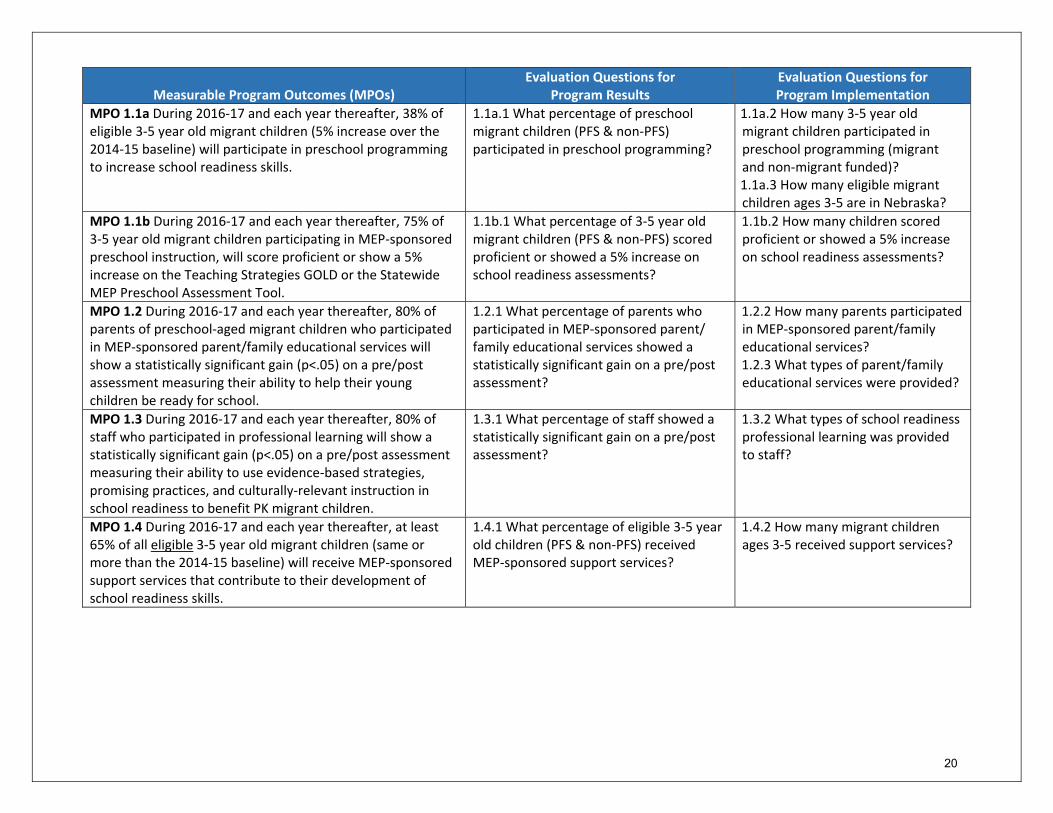
Measurable Program Outcomes (MPOs) Evaluation Questions for
Program Results Evaluation Questions for Program Implementation
MPO 1.1a During 2016‐17 and each year thereafter, 38% of eligible 3‐5 year old migrant children (5% increase over the 2014‐15 baseline) will participate in preschool programming to increase school readiness skills.
1.1a.1 What percentage of preschool migrant children (PFS & non‐PFS) participated in preschool programming?
1.1a.2 How many 3‐5 year old migrant children participated in preschool programming (migrant and non‐migrant funded)? 1.1a.3 How many eligible migrant children ages 3‐5 are in Nebraska?
MPO 1.1b During 2016‐17 and each year thereafter, 75% of 3‐5 year old migrant children participating in MEP‐sponsored preschool instruction, will score proficient or show a 5% increase on the Teaching Strategies GOLD or the Statewide MEP Preschool Assessment Tool.
1.1b.1 What percentage of 3‐5 year old migrant children (PFS & non‐PFS) scored proficient or showed a 5% increase on school readiness assessments?
1.1b.2 How many children scored proficient or showed a 5% increase on school readiness assessments?
MPO 1.2 During 2016‐17 and each year thereafter, 80% of parents of preschool‐aged migrant children who participated in MEP‐sponsored parent/family educational services will show a statistically significant gain (p<.05) on a pre/post assessment measuring their ability to help their young children be ready for school.
1.2.1 What percentage of parents who participated in MEP‐sponsored parent/ family educational services showed a statistically significant gain on a pre/post assessment?
1.2.2 How many parents participated in MEP‐sponsored parent/family educational services? 1.2.3 What types of parent/family educational services were provided?
MPO 1.3 During 2016‐17 and each year thereafter, 80% of staff who participated in professional learning will show a statistically significant gain (p<.05) on a pre/post assessment measuring their ability to use evidence‐based strategies, promising practices, and culturally‐relevant instruction in school readiness to benefit PK migrant children.
1.3.1 What percentage of staff showed a statistically significant gain on a pre/post assessment?
1.3.2 What types of school readiness professional learning was provided to staff?
MPO 1.4 During 2016‐17 and each year thereafter, at least 65% of all eligible 3‐5 year old migrant children (same or more than the 2014‐15 baseline) will receive MEP‐sponsored support services that contribute to their development of school readiness skills.
1.4.1 What percentage of eligible 3‐5 year old children (PFS & non‐PFS) received MEP‐sponsored support services?
1.4.2 How many migrant children ages 3‐5 received support services?

21
GOAL AREA #2: READING/WRITING AND MATHEMATICS State Performance Target: In 2016‐17, 100% of students will score proficient or above in reading and math on the NeSA Reading and Math Assessments. Concern Statement: We are concerned that as a result of migrancy, migrant students, especially English learners, have gaps in their education that lead to skill deficiencies and lower proficiency rates on state reading and math assessments. Data Summary: In 2014‐15, 53% of migrant students (40% of PFS students) scored proficient or above in reading compared to 80% of non‐migrant students; and 49% of migrant students (36% of PFS students) scored proficient or above in math compared to 72% of non‐migrant students. Need Statement: The percentage of migrant students scoring proficient or above on the NeSA needs to increase by 27% (40% for PFS students) in reading, and 23% (36% for PFS students) in math to eliminate the gap between migrant and non‐migrant students.
Strategy 2‐1: Provide migrant students with high‐quality supplemental instructional services (e.g., extended day programs, summer or intersession programs, in‐home instruction, online/technology‐based programs, individualized learning programs, instructional supports during the school day, intervention support services) to increase their reading/writing and math achievement. Strategy 2‐2: Implement needs‐based educational services to migrant parents/families in their home language (e.g., progress monitoring home visits, family literacy programs, parent education, at‐home educational programs, videoconferencing/online meetings) to enhance their capacity to support their child’s success in reading/writing and math. Strategy 2‐3: NDE and local projects support all school/MEP staff by providing professional learning opportunities (face‐to‐face and online) aligned with the State SDP to enhance their knowledge of evidence‐based strategies, promising practices, and culturally relevant instruction to increase migrant student achievement in reading/writing and math. Strategy 2‐4: Coordinate with service providers or provide migrant children with appropriate needs‐based support services (e.g., health and nutrition; educational supplies, interpretation, transportation, access to technology) to eliminate barriers to participation/success in school.
Measurable Program Outcomes (MPOs) Evaluation Questions for
Program Results Evaluation Questions for Program Implementation
MPO 2.1a During 2016‐17 and each year thereafter, 60% of K‐12 migrant students who receive MEP‐sponsored supplemental instructional services aimed at increasing student achievement in reading/writing and/or mathematics, will score proficient or above, or show a 20% increase on pre/post district assessments.
2.1a.1 What percentage of K‐12 migrant students (PFS & non‐PFS) scored proficient or above, or showed a 20% increase on pre/post district assessments?
2.1a.2 How many migrant students received reading/math instruction? 2.1a.3 What types of supplemental instructional services were provided?
22
Measurable Program Outcomes (MPOs) Evaluation Questions for
Program Results Evaluation Questions for Program Implementation
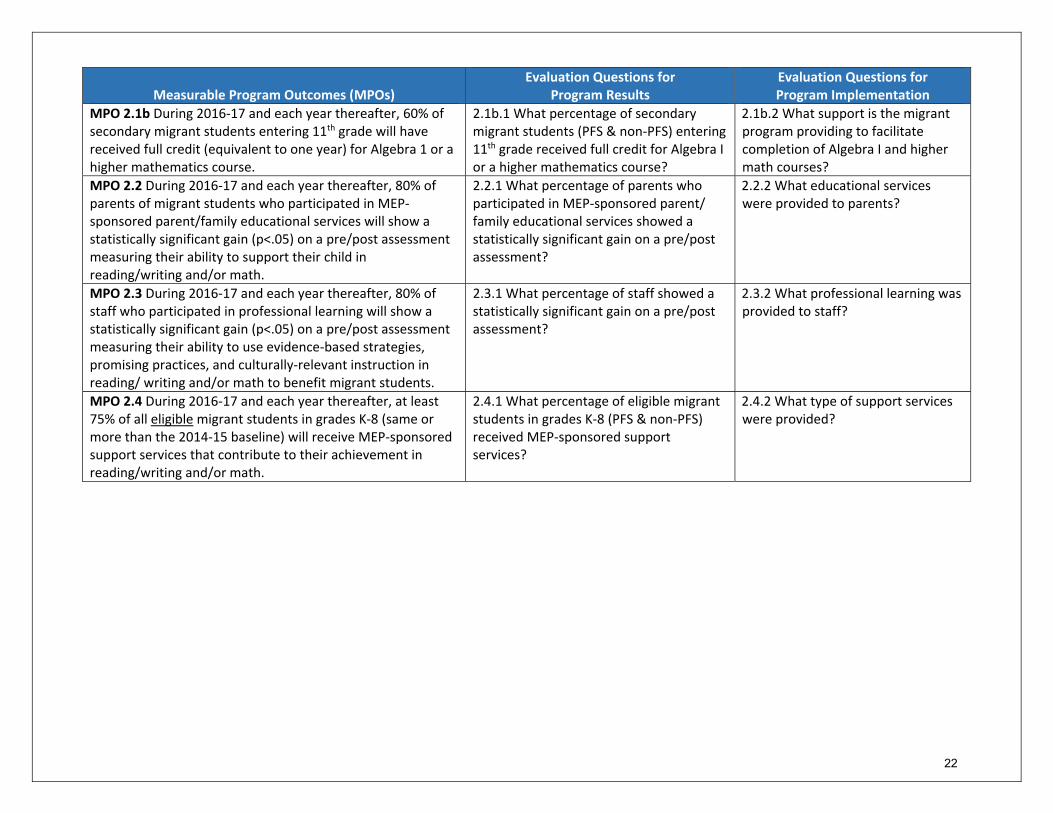
MPO 2.1b During 2016‐17 and each year thereafter, 60% of secondary migrant students entering 11th grade will have received full credit (equivalent to one year) for Algebra 1 or a higher mathematics course.
2.1b.1 What percentage of secondary migrant students (PFS & non‐PFS) entering 11th grade received full credit for Algebra I or a higher mathematics course?
2.1b.2 What support is the migrant program providing to facilitate completion of Algebra I and higher math courses?
MPO 2.2 During 2016‐17 and each year thereafter, 80% of parents of migrant students who participated in MEP‐sponsored parent/family educational services will show a statistically significant gain (p<.05) on a pre/post assessment measuring their ability to support their child in reading/writing and/or math.
2.2.1 What percentage of parents who participated in MEP‐sponsored parent/ family educational services showed a statistically significant gain on a pre/post assessment?
2.2.2 What educational services were provided to parents?
MPO 2.3 During 2016‐17 and each year thereafter, 80% of staff who participated in professional learning will show a statistically significant gain (p<.05) on a pre/post assessment measuring their ability to use evidence‐based strategies, promising practices, and culturally‐relevant instruction in reading/ writing and/or math to benefit migrant students.
2.3.1 What percentage of staff showed a statistically significant gain on a pre/post assessment?
2.3.2 What professional learning was provided to staff?
MPO 2.4 During 2016‐17 and each year thereafter, at least 75% of all eligible migrant students in grades K‐8 (same or more than the 2014‐15 baseline) will receive MEP‐sponsored support services that contribute to their achievement in reading/writing and/or math.
2.4.1 What percentage of eligible migrant students in grades K‐8 (PFS & non‐PFS) received MEP‐sponsored support services?
2.4.2 What type of support services were provided?
23
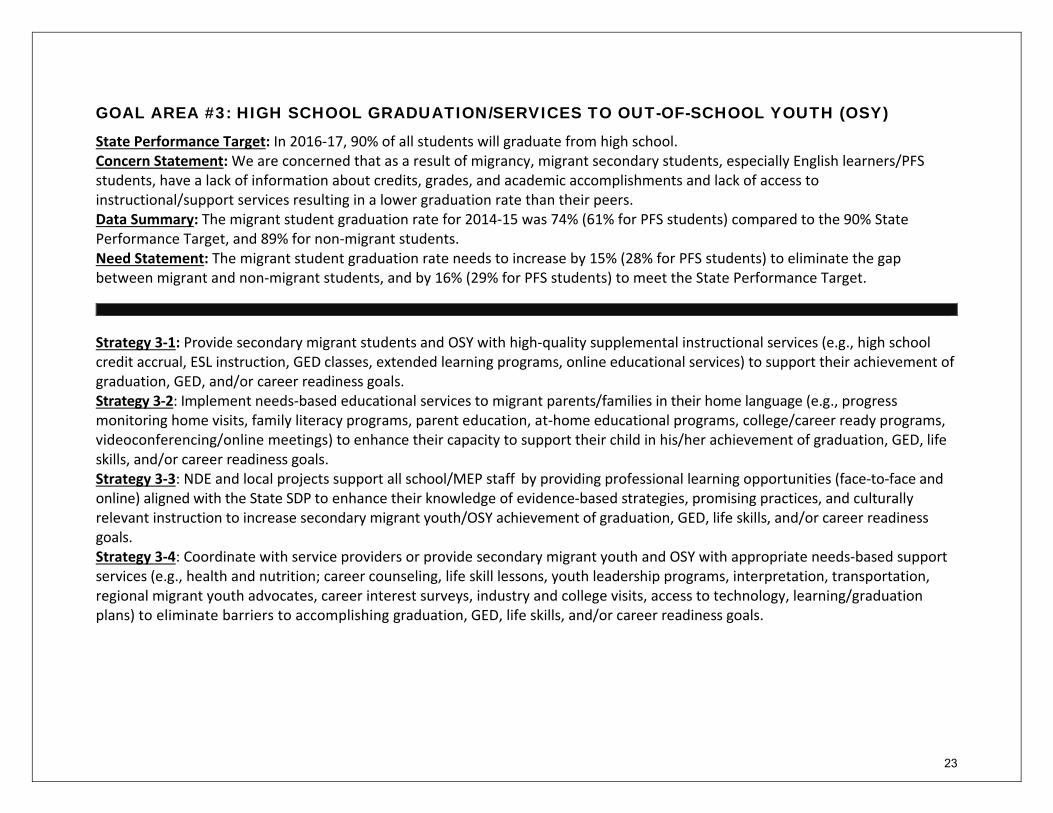
GOAL AREA #3: HIGH SCHOOL GRADUATION/SERVICES TO OUT-OF-SCHOOL YOUTH (OSY)
State Performance Target: In 2016‐17, 90% of all students will graduate from high school. Concern Statement: We are concerned that as a result of migrancy, migrant secondary students, especially English learners/PFS students, have a lack of information about credits, grades, and academic accomplishments and lack of access to instructional/support services resulting in a lower graduation rate than their peers. Data Summary: The migrant student graduation rate for 2014‐15 was 74% (61% for PFS students) compared to the 90% State Performance Target, and 89% for non‐migrant students. Need Statement: The migrant student graduation rate needs to increase by 15% (28% for PFS students) to eliminate the gap between migrant and non‐migrant students, and by 16% (29% for PFS students) to meet the State Performance Target.
Strategy 3‐1: Provide secondary migrant students and OSY with high‐quality supplemental instructional services (e.g., high school credit accrual, ESL instruction, GED classes, extended learning programs, online educational services) to support their achievement of graduation, GED, and/or career readiness goals. Strategy 3‐2: Implement needs‐based educational services to migrant parents/families in their home language (e.g., progress monitoring home visits, family literacy programs, parent education, at‐home educational programs, college/career ready programs, videoconferencing/online meetings) to enhance their capacity to support their child in his/her achievement of graduation, GED, life skills, and/or career readiness goals. Strategy 3‐3: NDE and local projects support all school/MEP staff by providing professional learning opportunities (face‐to‐face and online) aligned with the State SDP to enhance their knowledge of evidence‐based strategies, promising practices, and culturally relevant instruction to increase secondary migrant youth/OSY achievement of graduation, GED, life skills, and/or career readiness goals. Strategy 3‐4: Coordinate with service providers or provide secondary migrant youth and OSY with appropriate needs‐based support services (e.g., health and nutrition; career counseling, life skill lessons, youth leadership programs, interpretation, transportation, regional migrant youth advocates, career interest surveys, industry and college visits, access to technology, learning/graduation plans) to eliminate barriers to accomplishing graduation, GED, life skills, and/or career readiness goals.
24
Measurable Program Outcomes (MPOs) Evaluation Questions for
Program Results Evaluation Questions for Program Implementation
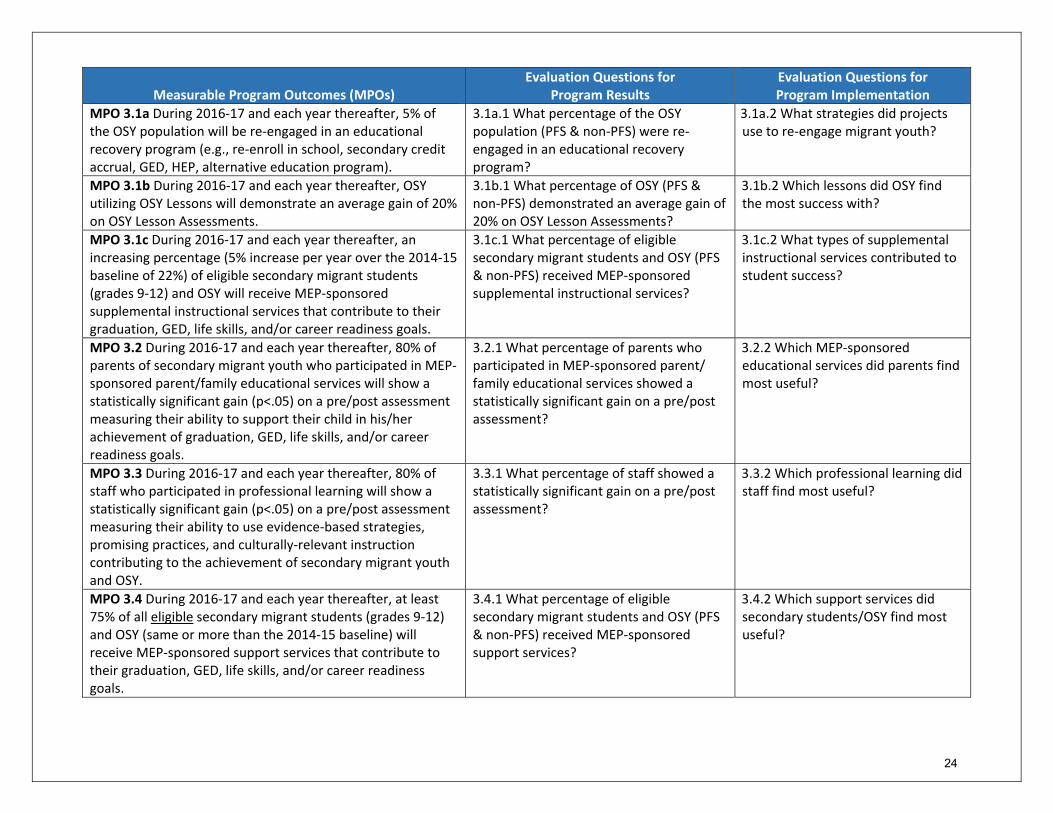
MPO 3.1a During 2016‐17 and each year thereafter, 5% of the OSY population will be re‐engaged in an educational recovery program (e.g., re‐enroll in school, secondary credit accrual, GED, HEP, alternative education program).
3.1a.1 What percentage of the OSY population (PFS & non‐PFS) were re‐engaged in an educational recovery program?
3.1a.2 What strategies did projects use to re‐engage migrant youth?
MPO 3.1b During 2016‐17 and each year thereafter, OSY utilizing OSY Lessons will demonstrate an average gain of 20% on OSY Lesson Assessments.
3.1b.1 What percentage of OSY (PFS & non‐PFS) demonstrated an average gain of 20% on OSY Lesson Assessments?
3.1b.2 Which lessons did OSY find the most success with?
MPO 3.1c During 2016‐17 and each year thereafter, an increasing percentage (5% increase per year over the 2014‐15 baseline of 22%) of eligible secondary migrant students (grades 9‐12) and OSY will receive MEP‐sponsored supplemental instructional services that contribute to their graduation, GED, life skills, and/or career readiness goals.
3.1c.1 What percentage of eligible secondary migrant students and OSY (PFS & non‐PFS) received MEP‐sponsored supplemental instructional services?
3.1c.2 What types of supplemental instructional services contributed to student success?
MPO 3.2 During 2016‐17 and each year thereafter, 80% of parents of secondary migrant youth who participated in MEP‐sponsored parent/family educational services will show a statistically significant gain (p<.05) on a pre/post assessment measuring their ability to support their child in his/her achievement of graduation, GED, life skills, and/or career readiness goals.
3.2.1 What percentage of parents who participated in MEP‐sponsored parent/ family educational services showed a statistically significant gain on a pre/post assessment?
3.2.2 Which MEP‐sponsored educational services did parents find most useful?
MPO 3.3 During 2016‐17 and each year thereafter, 80% of staff who participated in professional learning will show a statistically significant gain (p<.05) on a pre/post assessment measuring their ability to use evidence‐based strategies, promising practices, and culturally‐relevant instruction contributing to the achievement of secondary migrant youth and OSY.
3.3.1 What percentage of staff showed a statistically significant gain on a pre/post assessment?
3.3.2 Which professional learning did staff find most useful?
MPO 3.4 During 2016‐17 and each year thereafter, at least 75% of all eligible secondary migrant students (grades 9‐12) and OSY (same or more than the 2014‐15 baseline) will receive MEP‐sponsored support services that contribute to their graduation, GED, life skills, and/or career readiness goals.
3.4.1 What percentage of eligible secondary migrant students and OSY (PFS & non‐PFS) received MEP‐sponsored support services?
3.4.2 Which support services did secondary students/OSY find most useful?
25
Priority for Services Students
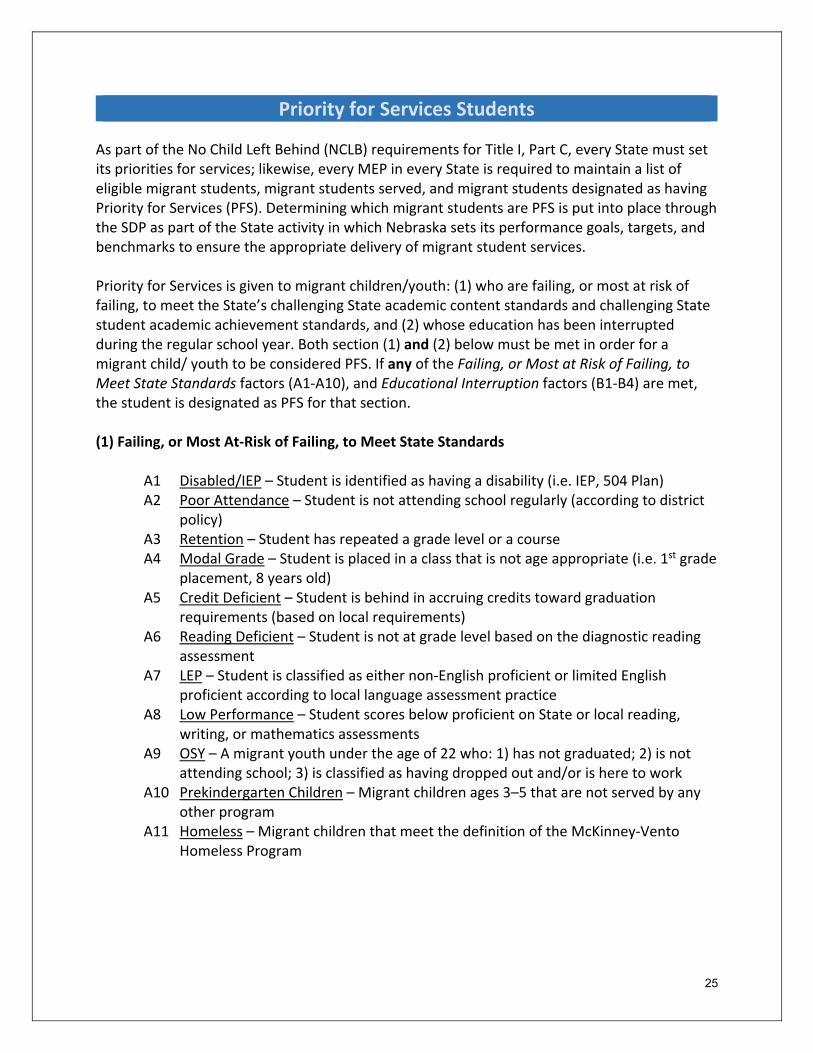
As part of the No Child Left Behind (NCLB) requirements for Title I, Part C, every State must set its priorities for services; likewise, every MEP in every State is required to maintain a list of eligible migrant students, migrant students served, and migrant students designated as having Priority for Services (PFS). Determining which migrant students are PFS is put into place through the SDP as part of the State activity in which Nebraska sets its performance goals, targets, and benchmarks to ensure the appropriate delivery of migrant student services. Priority for Services is given to migrant children/youth: (1) who are failing, or most at risk of failing, to meet the State’s challenging State academic content standards and challenging State student academic achievement standards, and (2) whose education has been interrupted during the regular school year. Both section (1) and (2) below must be met in order for a migrant child/ youth to be considered PFS. If any of the Failing, or Most at Risk of Failing, to Meet State Standards factors (A1‐A10), and Educational Interruption factors (B1‐B4) are met, the student is designated as PFS for that section. (1) Failing, or Most At‐Risk of Failing, to Meet State Standards
A1 Disabled/IEP – Student is identified as having a disability (i.e. IEP, 504 Plan) A2 Poor Attendance – Student is not attending school regularly (according to district
policy) A3 Retention – Student has repeated a grade level or a course A4 Modal Grade – Student is placed in a class that is not age appropriate (i.e. 1st grade
placement, 8 years old) A5 Credit Deficient – Student is behind in accruing credits toward graduation
requirements (based on local requirements) A6 Reading Deficient – Student is not at grade level based on the diagnostic reading
assessment A7 LEP – Student is classified as either non‐English proficient or limited English
proficient according to local language assessment practice A8 Low Performance – Student scores below proficient on State or local reading,
writing, or mathematics assessments A9 OSY – A migrant youth under the age of 22 who: 1) has not graduated; 2) is not
attending school; 3) is classified as having dropped out and/or is here to work A10 Prekindergarten Children – Migrant children ages 3–5 that are not served by any
other program A11 Homeless – Migrant children that meet the definition of the McKinney‐Vento
Homeless Program

26
(2) Educational Interruption
B1 Intra‐District Move – Migrant students who move within the regular school year from one school to another school within the district
B2 Inter‐District Move – Migrant students who move across district boundaries within the school year. These students may have a new Qualifying Arrival Date (QAD).
B3 Two Weeks Absent – Migrant students who do not officially withdraw from a school and are gone for at least two weeks due to the child’s or family’s migrant lifestyle
B4 Re‐Enroll – Migrant students who officially withdraw from a school and are gone for at least two weeks due to the child’s or family’s migrant lifestyle
Every local migrant project in Nebraska is required to enter At‐Risk information on every migrant child/youth into MIS2000. This provides information to determine which migrant children/youth should receive services first, provides other districts/States information should the child/youth move, informs audits, and assists the State MEP in determining allocations. All local migrant projects in Nebraska are to have a list of eligible migrant students; a list of students identified as PFS; a list of services available; and a list of students receiving migrant services.

27
Identification and Recruitment Plan
Finding and enrolling eligible migrant children is a cornerstone of the Nebraska MEP and its importance cannot be overemphasized. The Nebraska MEP is responsible for the proper and timely identification and recruitment (ID&R) of all eligible migrant children and youth in the State, including securing pertinent information to document the basis of a child’s eligibility. Ultimately, it is the State’s responsibility to implement procedures to ensure that migrant children and youth are both identified and determined to be eligible for the MEP. The Statewide ID&R Plan includes five statewide centers divided into regions: Panhandle (ESU 13), Southwest (ESU 15), Central (Hastings HSCFDP, Inc.), Northeast (ESU 1), and East (ESU 7). The centers serve the State with 11 regional recruiters collaborating with eight project recruiters and numerous community and district liaisons. In all five regions, recruiters and liaisons work together to ensure collaboration, coordination, and a statewide perspective toward Nebraska ID&R efforts. A referral network has been established amongst regional and project recruiters and local liaisons. The referral network increases the likelihood of addressing all MEP needs. The ID&R plan continues to advocate a statewide perspective in the supervision and staff development of all ID&R personnel within the community, the local districts, and among the regional recruiters. The plan includes a State ID&R Coordinator who is responsible for the coordination of all recruitment efforts. This statewide recruiting system: a) provides year‐round recruitment; b) provides ID&R coverage on a statewide basis with a focus on all aspects of the migrant population and the support services required by the unique demands of the migrant lifestyle; and c) blends local and statewide perspectives into a substantial and resourceful system of migrant support. Not only does the ID&R plan fulfill federal regulations, but it also ensures all qualifying MEP children are identified and recruited in Nebraska. Nebraska’s ID&R Manual (2016‐17) provides the plan for ID&R throughout Nebraska for professional development, statewide ID&R procedures, quality control, and interstate and intrastate coordination. A copy of the Manual can be found on the Nebraska MEP website. The Manual identifies the mission, goals, measurable program objectives, and strategies for Nebraska ID&R which includes the following: Mission: Through the implementation of the plan, we strive to provide support and resources to strengthen and enhance the ID&R process and to fully comply with all federal laws and regulations pertaining to the ID&R of migrant children in Nebraska. Goals: The Nebraska MEP has established the following goals to ensure the proper and timely identification of eligible migrant children through an active statewide ID&R process.
28
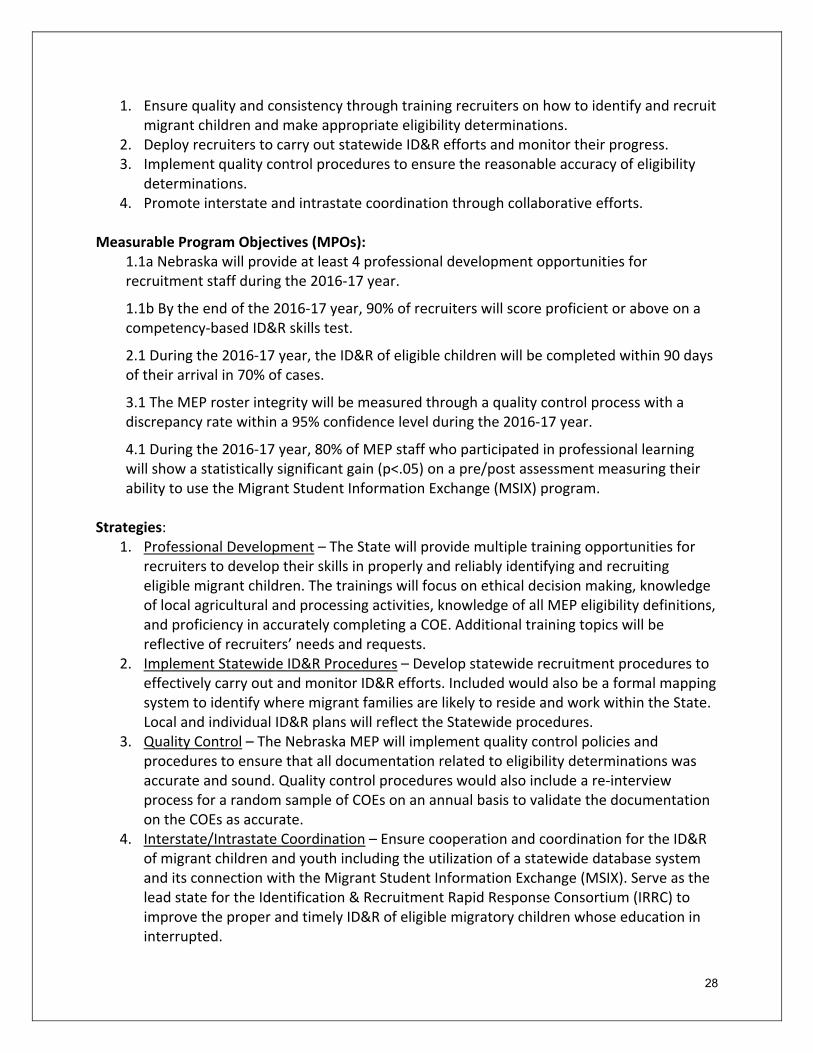
1. Ensure quality and consistency through training recruiters on how to identify and recruit migrant children and make appropriate eligibility determinations.
2. Deploy recruiters to carry out statewide ID&R efforts and monitor their progress. 3. Implement quality control procedures to ensure the reasonable accuracy of eligibility
determinations. 4. Promote interstate and intrastate coordination through collaborative efforts.
Measurable Program Objectives (MPOs):
1.1a Nebraska will provide at least 4 professional development opportunities for recruitment staff during the 2016‐17 year.
1.1b By the end of the 2016‐17 year, 90% of recruiters will score proficient or above on a competency‐based ID&R skills test.
2.1 During the 2016‐17 year, the ID&R of eligible children will be completed within 90 days of their arrival in 70% of cases.
3.1 The MEP roster integrity will be measured through a quality control process with a discrepancy rate within a 95% confidence level during the 2016‐17 year.
4.1 During the 2016‐17 year, 80% of MEP staff who participated in professional learning will show a statistically significant gain (p<.05) on a pre/post assessment measuring their ability to use the Migrant Student Information Exchange (MSIX) program.
Strategies:
1. Professional Development – The State will provide multiple training opportunities for recruiters to develop their skills in properly and reliably identifying and recruiting eligible migrant children. The trainings will focus on ethical decision making, knowledge of local agricultural and processing activities, knowledge of all MEP eligibility definitions, and proficiency in accurately completing a COE. Additional training topics will be reflective of recruiters’ needs and requests.
2. Implement Statewide ID&R Procedures – Develop statewide recruitment procedures to effectively carry out and monitor ID&R efforts. Included would also be a formal mapping system to identify where migrant families are likely to reside and work within the State. Local and individual ID&R plans will reflect the Statewide procedures.
3. Quality Control – The Nebraska MEP will implement quality control policies and procedures to ensure that all documentation related to eligibility determinations was accurate and sound. Quality control procedures would also include a re‐interview process for a random sample of COEs on an annual basis to validate the documentation on the COEs as accurate.
4. Interstate/Intrastate Coordination – Ensure cooperation and coordination for the ID&R of migrant children and youth including the utilization of a statewide database system and its connection with the Migrant Student Information Exchange (MSIX). Serve as the lead state for the Identification & Recruitment Rapid Response Consortium (IRRC) to improve the proper and timely ID&R of eligible migratory children whose education in interrupted.
29
Parent Involvement Plan
Title I supports parent involvement by enlisting parents to help their children do well in school. In order to receive MEP funds, a local school district must implement programs, activities, and procedures that effectively involve migrant parents. As the first teachers of their children, parents know the needs of their children best and can provide insight into their children’s strengths and challenges. As such, migrant parents can play a pivotal role in planning the educational programs in which their children participate. Involving migrant parents in planning the MEP also builds their capacity to assist in their children’s learning at home. In addition, parent involvement in the planning of the program enables parents to understand the program and have informed conversations with MEP and school staff regarding their children’s education. Through their participation in the planning process, migrant parents also are more likely to become advocates and supporters of the program because they have a personal stake in its success. Nebraska offers general and specific information for parents to learn about the MEP, and to understand the ID&R process to determine whether their family qualifies for the program. Further, the Nebraska MEP offers ideas for parents to help their children experience success in school. Each local MEP sponsors parent development, family events for sharing information and resources, and culminating activities to which parents are invited to participate and bring their families. The State PAC Coordinator oversees the Nebraska State Parent Advisory Council (PAC). The State PAC serves in an advisory capacity to NDE MEP staff and the State PAC Coordinator. Their advice assists NDE staff in making decisions to improve the program. Face‐to‐face and online (webinar) PAC meetings provide information as well as parent development each year. The State PAC Facebook page can be found at: https://www.facebook.com/State‐PAC‐Nebraska‐1163264427033312/ The State PAC Coordinator also works with local/regional MEPs to support their migrant PACs which are required by the State to be implemented as part of the application process. Each PAC must hold a minimum of four meetings annually. All local MEPs in Nebraska have PACs, all of which have been active and successful. Local MEPs may use MEP funds to provide transportation, child care, or other reasonable and necessary costs to facilitate attendance. Local MEPs retain copies of attendance records, meeting agendas, minutes, and any other relevant materials for auditing purposes by the Nebraska MEP. Information useful to parents and families is contained on the NDE website at: http://www.education.ne.gov/ciptoolkit/familycommunity/resources.html. The NDE website includes links useful to migrant parents are provided to the National Standards for Parent/Family Involvement, National Coalition for Parent Involvement in Education, Parent’s
30
Right to Know, Helping Your Child With Homework, Community Help, and Action Teams for School/Family/Community Involvement. The NDE MEP webpage also contains information for parents and staff facilitating parent involvement and development at: http://www.education.ne.gov/Migrant/parental involvement.html
31
Exchange of Student Records
Nebraska State MEP Student Records Exchange Section 1304(b)(3) requires SEAs to promote interstate and intrastate coordination by providing for educational continuity through the timely transfer of pertinent school records (including health information) when children move from one school to another, whether or not the move occurs during the regular school year. The Nebraska MEP uses MIS2000 to record this information. MIS2000 is a solution for the information needs of states serving migrant children. MIS2000 provides for the storage, retrieval, and reporting of student information. Records are electronically transferred without a dependency on a national database. The installation process establishes a state database which is served by multiple sub‐state installation sites with region, county, or district levels. Each sub‐state site communicates directly with the state system. States using MIS2000 can easily transfer student information from state to state. The Nebraska MEP promotes interstate and intrastate coordination through the continuity of records. Information on MIS2000, links to student exchange resources, and information on the State Data Coordinator can be found on the NDE website: http://www.education.ne.gov/Migrant/data collection and reporting.html
The Migrant Student Records Exchange (MSIX) The U.S. Department of Education was mandated by Congress, in Section 1308 (b) of ESEA, as amended by the No Child Left Behind Act of 2001, to assist States in developing effective methods for the electronic transfer of student records and in determining the number of migratory children in each State. Further, it must ensure the linkage of migrant student record systems across the country. In accordance with the mandate, the Department has implemented the Migrant Student Information Exchange (MSIX) initiative whose primary mission is to ensure the appropriate enrollment, placement, and accrual of credits for migrant children. Nebraska is fully operational in MSIX and the Nebraska Migrant System/MIS2000 interfaces with it successfully to allow the State to complete reports on interstate and intrastate student records. Nebraska is able to provide student data, as required, for the State Comprehensive State Performance Report (CSPR) and to meet other Federal and State data requirements.

32
Evaluation Plan
Statutes, Regulations, and Non‐Regulatory Guidance Related to Program Evaluation The evaluation of the Nebraska Migrant Education Program (MEP) is completed by the State with the assistance of an external evaluation firm knowledgeable about migrant education, evaluation design, Federal reporting requirements and the Office of Migrant Education (OME) guidelines, and the Nebraska MEP. The evaluation systematically collects information to improve the program and help the State make decisions about program improvement and success. The evaluation of the Nebraska MEP includes a program implementation and outcome (results) evaluation that maintains fidelity to the requirements in the Nebraska MEP SDP and the U.S. Department of Education’s regulations and guidance for the evaluation of Title I Part C programs. In addition, the evaluation plan utilizes OME’s “Checklist for State MEP Evaluation” (revised in 2013) with special attention to the boldface items that are required of the State MEP. Items that appear in plain type are best practice, but not required.
Checklist to Guide the Nebraska MEP Evaluation
Activities before the Evaluation
The State MEP collects performance results data on state performance targets related to Performance Goals 1 and 5 (the percentage of students attaining proficiency in Reading/Language Arts and Mathematics for each grade, and the percentage of students who graduate from high school), disaggregated for PFS, other migrant (i.e., non‐PFS), and non‐migrant students (34 CFR Sections 200.83 and 200.84).
The State MEP collects performance results data on additional State performance targets for school readiness and other needs, disaggregated for PFS, other migrant and non‐migrant students, if applicable (34 CFR Sections 200.83 and 200.84).
The State MEP collects performance results data on MPOs established in the SDP for all MEP activities and services, disaggregated for PFS and non‐PFS migrant students (34 CFR Section 200.83).
The State MEP collects performance results data on GPRA measures and reports it annually to the Office of Migrant Education, to be used in the evaluation of the Federal MEP (34 CFR Section 80.40).
The State MEP notifies local MEPs in advance of specific data needed for the statewide evaluation and provides guidance for how to collect the necessary data.
The State MEP provides guidance to local MEPs on what to evaluate locally and how to evaluate it. The Evaluation Plan
The State MEP includes an evaluation plan in the statewide SDP, which specifies how the state will collect data related to the implementation of MEP activities and services as well as the performance results achieved through these services and activities (34 CFR Section 200.83).
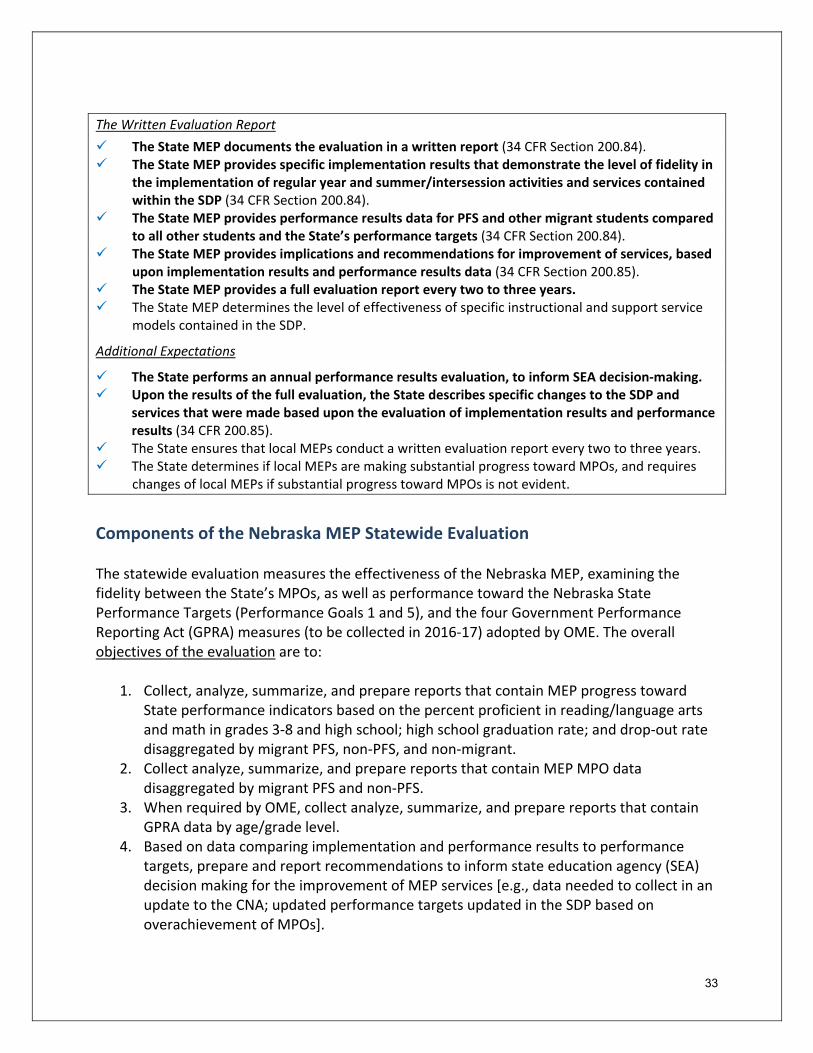
33
The Written Evaluation Report
The State MEP documents the evaluation in a written report (34 CFR Section 200.84). The State MEP provides specific implementation results that demonstrate the level of fidelity in
the implementation of regular year and summer/intersession activities and services contained within the SDP (34 CFR Section 200.84).
The State MEP provides performance results data for PFS and other migrant students compared to all other students and the State’s performance targets (34 CFR Section 200.84).
The State MEP provides implications and recommendations for improvement of services, based upon implementation results and performance results data (34 CFR Section 200.85).
The State MEP provides a full evaluation report every two to three years. The State MEP determines the level of effectiveness of specific instructional and support service
models contained in the SDP.
Additional Expectations
The State performs an annual performance results evaluation, to inform SEA decision‐making. Upon the results of the full evaluation, the State describes specific changes to the SDP and
services that were made based upon the evaluation of implementation results and performance results (34 CFR 200.85).
The State ensures that local MEPs conduct a written evaluation report every two to three years. The State determines if local MEPs are making substantial progress toward MPOs, and requires
changes of local MEPs if substantial progress toward MPOs is not evident.
Components of the Nebraska MEP Statewide Evaluation The statewide evaluation measures the effectiveness of the Nebraska MEP, examining the fidelity between the State’s MPOs, as well as performance toward the Nebraska State Performance Targets (Performance Goals 1 and 5), and the four Government Performance Reporting Act (GPRA) measures (to be collected in 2016‐17) adopted by OME. The overall objectives of the evaluation are to:
1. Collect, analyze, summarize, and prepare reports that contain MEP progress toward State performance indicators based on the percent proficient in reading/language arts and math in grades 3‐8 and high school; high school graduation rate; and drop‐out rate disaggregated by migrant PFS, non‐PFS, and non‐migrant.
2. Collect analyze, summarize, and prepare reports that contain MEP MPO data disaggregated by migrant PFS and non‐PFS.
3. When required by OME, collect analyze, summarize, and prepare reports that contain GPRA data by age/grade level.
4. Based on data comparing implementation and performance results to performance targets, prepare and report recommendations to inform state education agency (SEA) decision making for the improvement of MEP services [e.g., data needed to collect in an update to the CNA; updated performance targets updated in the SDP based on overachievement of MPOs].
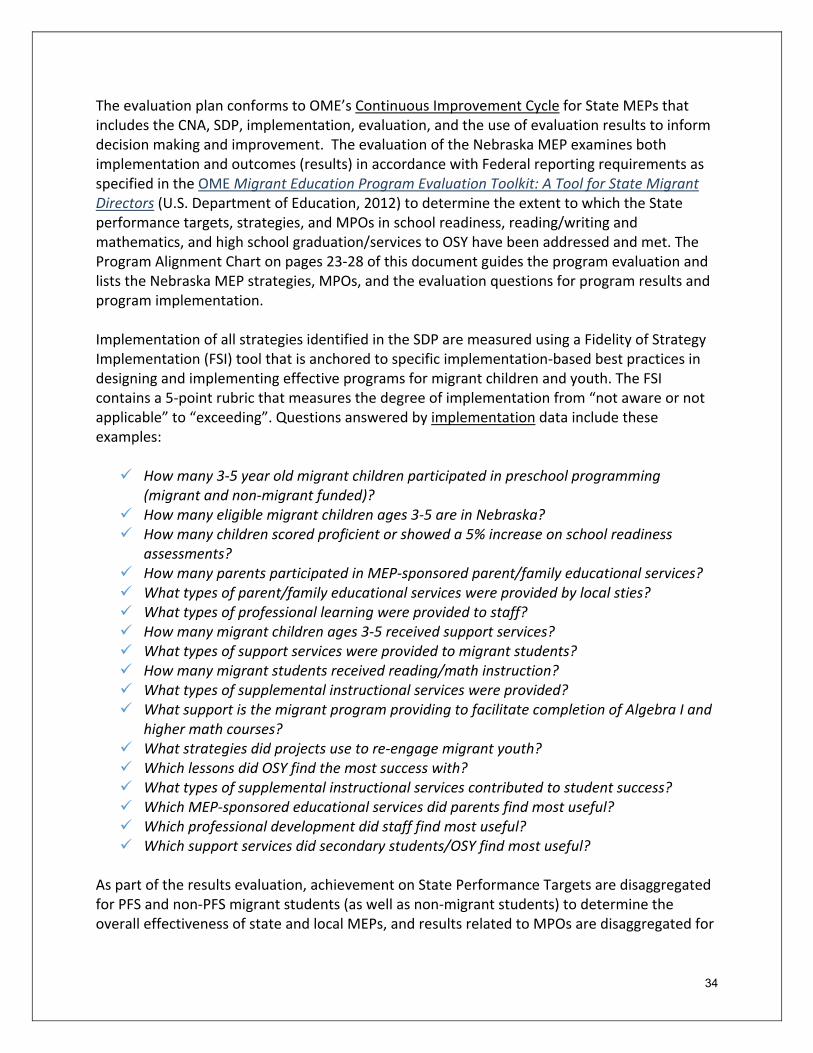
34
The evaluation plan conforms to OME’s Continuous Improvement Cycle for State MEPs that includes the CNA, SDP, implementation, evaluation, and the use of evaluation results to inform decision making and improvement. The evaluation of the Nebraska MEP examines both implementation and outcomes (results) in accordance with Federal reporting requirements as specified in the OME Migrant Education Program Evaluation Toolkit: A Tool for State Migrant Directors (U.S. Department of Education, 2012) to determine the extent to which the State performance targets, strategies, and MPOs in school readiness, reading/writing and mathematics, and high school graduation/services to OSY have been addressed and met. The Program Alignment Chart on pages 23‐28 of this document guides the program evaluation and lists the Nebraska MEP strategies, MPOs, and the evaluation questions for program results and program implementation. Implementation of all strategies identified in the SDP are measured using a Fidelity of Strategy Implementation (FSI) tool that is anchored to specific implementation‐based best practices in designing and implementing effective programs for migrant children and youth. The FSI contains a 5‐point rubric that measures the degree of implementation from “not aware or not applicable” to “exceeding”. Questions answered by implementation data include these examples: How many 3‐5 year old migrant children participated in preschool programming
(migrant and non‐migrant funded)? How many eligible migrant children ages 3‐5 are in Nebraska? How many children scored proficient or showed a 5% increase on school readiness
assessments? How many parents participated in MEP‐sponsored parent/family educational services? What types of parent/family educational services were provided by local sties? What types of professional learning were provided to staff? How many migrant children ages 3‐5 received support services? What types of support services were provided to migrant students? How many migrant students received reading/math instruction? What types of supplemental instructional services were provided? What support is the migrant program providing to facilitate completion of Algebra I and
higher math courses? What strategies did projects use to re‐engage migrant youth? Which lessons did OSY find the most success with? What types of supplemental instructional services contributed to student success? Which MEP‐sponsored educational services did parents find most useful? Which professional development did staff find most useful? Which support services did secondary students/OSY find most useful?
As part of the results evaluation, achievement on State Performance Targets are disaggregated for PFS and non‐PFS migrant students (as well as non‐migrant students) to determine the overall effectiveness of state and local MEPs, and results related to MPOs are disaggregated for
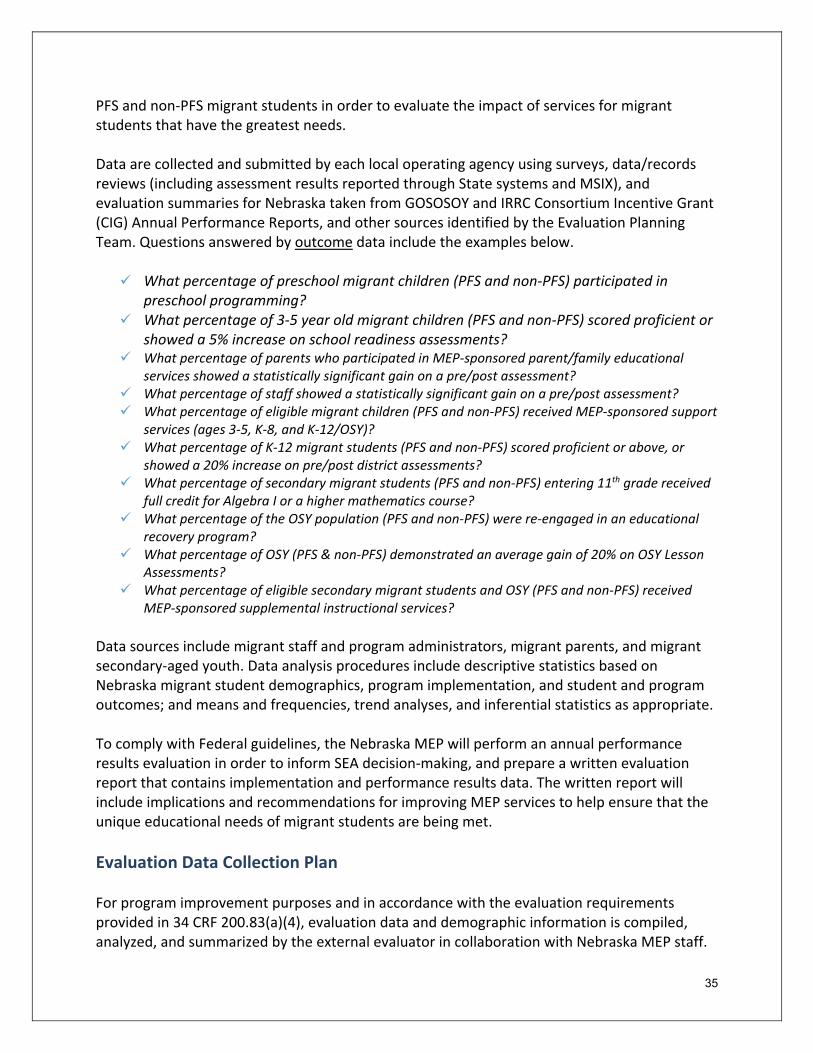
35
PFS and non‐PFS migrant students in order to evaluate the impact of services for migrant students that have the greatest needs. Data are collected and submitted by each local operating agency using surveys, data/records reviews (including assessment results reported through State systems and MSIX), and evaluation summaries for Nebraska taken from GOSOSOY and IRRC Consortium Incentive Grant (CIG) Annual Performance Reports, and other sources identified by the Evaluation Planning Team. Questions answered by outcome data include the examples below. What percentage of preschool migrant children (PFS and non‐PFS) participated in
preschool programming? What percentage of 3‐5 year old migrant children (PFS and non‐PFS) scored proficient or
showed a 5% increase on school readiness assessments? What percentage of parents who participated in MEP‐sponsored parent/family educational
services showed a statistically significant gain on a pre/post assessment? What percentage of staff showed a statistically significant gain on a pre/post assessment? What percentage of eligible migrant children (PFS and non‐PFS) received MEP‐sponsored support
services (ages 3‐5, K‐8, and K‐12/OSY)? What percentage of K‐12 migrant students (PFS and non‐PFS) scored proficient or above, or
showed a 20% increase on pre/post district assessments? What percentage of secondary migrant students (PFS and non‐PFS) entering 11th grade received
full credit for Algebra I or a higher mathematics course? What percentage of the OSY population (PFS and non‐PFS) were re‐engaged in an educational
recovery program? What percentage of OSY (PFS & non‐PFS) demonstrated an average gain of 20% on OSY Lesson
Assessments? What percentage of eligible secondary migrant students and OSY (PFS and non‐PFS) received
MEP‐sponsored supplemental instructional services?
Data sources include migrant staff and program administrators, migrant parents, and migrant secondary‐aged youth. Data analysis procedures include descriptive statistics based on Nebraska migrant student demographics, program implementation, and student and program outcomes; and means and frequencies, trend analyses, and inferential statistics as appropriate. To comply with Federal guidelines, the Nebraska MEP will perform an annual performance results evaluation in order to inform SEA decision‐making, and prepare a written evaluation report that contains implementation and performance results data. The written report will include implications and recommendations for improving MEP services to help ensure that the unique educational needs of migrant students are being met.
Evaluation Data Collection Plan For program improvement purposes and in accordance with the evaluation requirements provided in 34 CRF 200.83(a)(4), evaluation data and demographic information is compiled, analyzed, and summarized by the external evaluator in collaboration with Nebraska MEP staff.
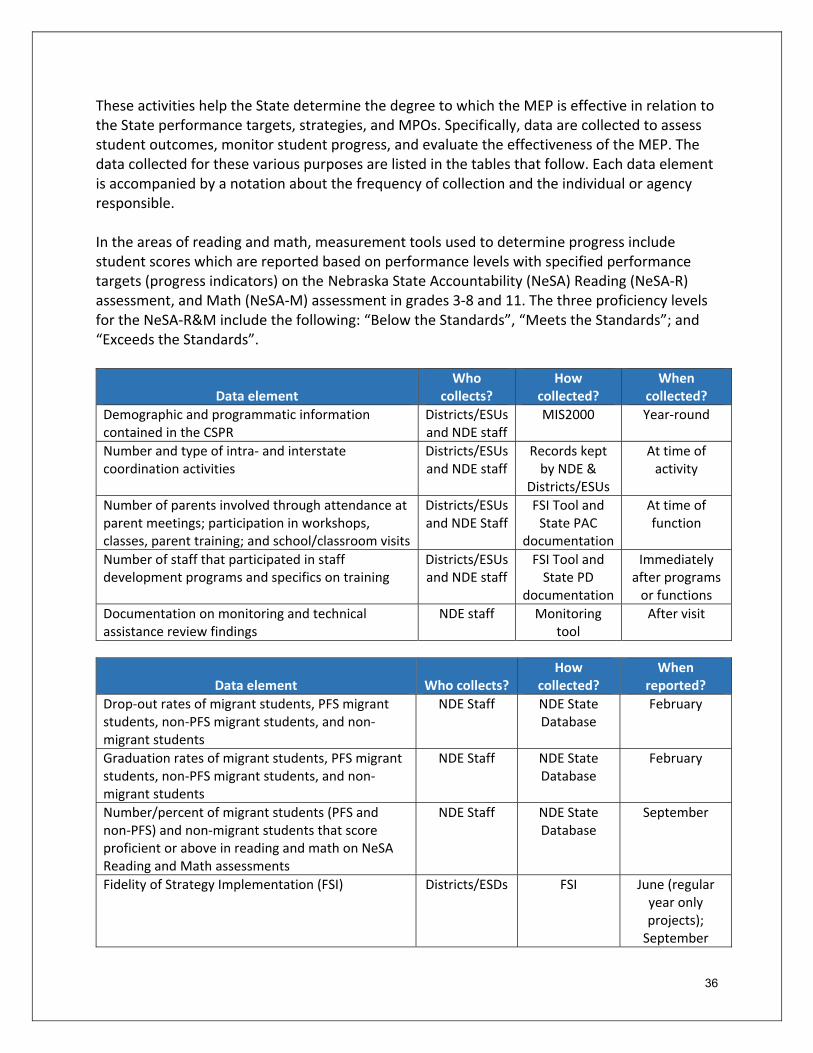
36
These activities help the State determine the degree to which the MEP is effective in relation to the State performance targets, strategies, and MPOs. Specifically, data are collected to assess student outcomes, monitor student progress, and evaluate the effectiveness of the MEP. The data collected for these various purposes are listed in the tables that follow. Each data element is accompanied by a notation about the frequency of collection and the individual or agency responsible. In the areas of reading and math, measurement tools used to determine progress include student scores which are reported based on performance levels with specified performance targets (progress indicators) on the Nebraska State Accountability (NeSA) Reading (NeSA‐R) assessment, and Math (NeSA‐M) assessment in grades 3‐8 and 11. The three proficiency levels for the NeSA‐R&M include the following: “Below the Standards”, “Meets the Standards”; and “Exceeds the Standards”.
Data element Who
collects? How
collected? When
collected?
Demographic and programmatic information contained in the CSPR
Districts/ESUs and NDE staff
MIS2000 Year‐round
Number and type of intra‐ and interstate coordination activities
Districts/ESUs and NDE staff
Records kept by NDE &
Districts/ESUs
At time of activity
Number of parents involved through attendance at parent meetings; participation in workshops, classes, parent training; and school/classroom visits
Districts/ESUs and NDE Staff
FSI Tool and State PAC
documentation
At time of function
Number of staff that participated in staff development programs and specifics on training
Districts/ESUs and NDE staff
FSI Tool and State PD
documentation
Immediately after programs or functions
Documentation on monitoring and technical assistance review findings
NDE staff Monitoring tool
After visit
Data element Who collects? How
collected? When
reported?
Drop‐out rates of migrant students, PFS migrant students, non‐PFS migrant students, and non‐migrant students
NDE Staff NDE State Database
February
Graduation rates of migrant students, PFS migrant students, non‐PFS migrant students, and non‐migrant students
NDE Staff NDE State Database
February
Number/percent of migrant students (PFS and non‐PFS) and non‐migrant students that score proficient or above in reading and math on NeSA Reading and Math assessments
NDE Staff NDE State Database
September
Fidelity of Strategy Implementation (FSI) Districts/ESDs FSI June (regular year only projects); September
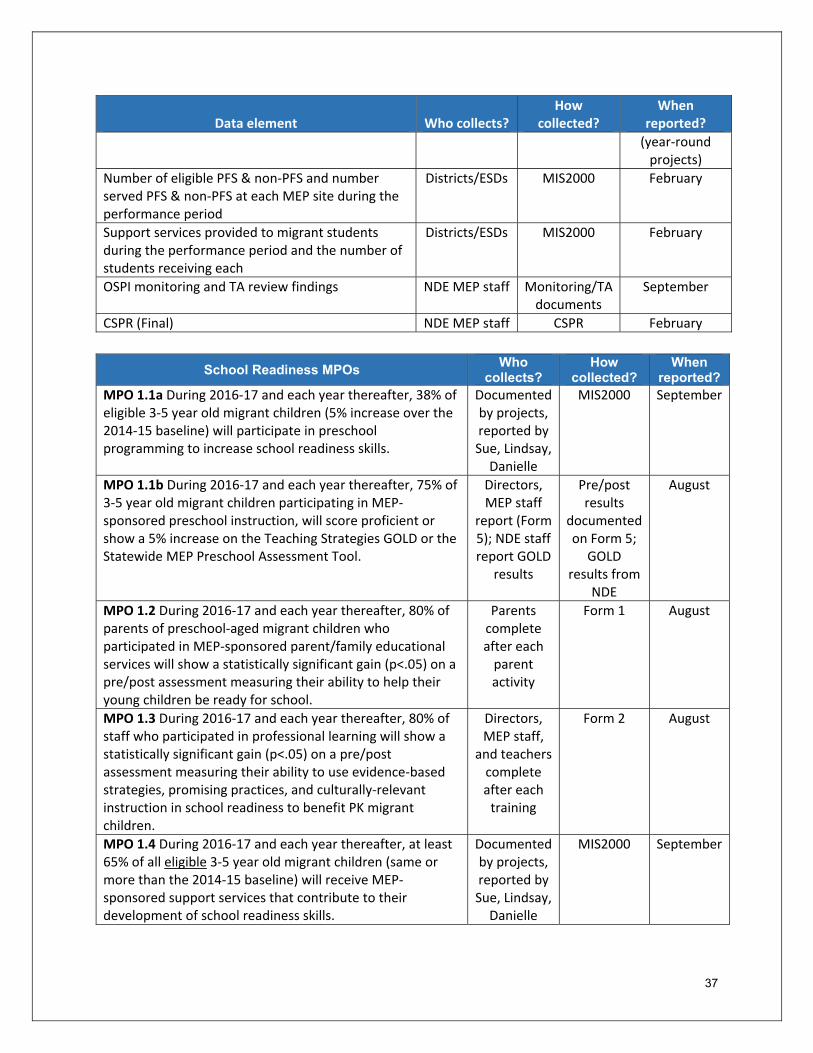
37
Data element Who collects? How
collected? When
reported?
(year‐round projects)
Number of eligible PFS & non‐PFS and number served PFS & non‐PFS at each MEP site during the performance period
Districts/ESDs MIS2000 February
Support services provided to migrant students during the performance period and the number of students receiving each
Districts/ESDs MIS2000 February
OSPI monitoring and TA review findings NDE MEP staff Monitoring/TA documents
September
CSPR (Final) NDE MEP staff CSPR February
School Readiness MPOs
Who collects?
How collected?
When reported?
MPO 1.1a During 2016‐17 and each year thereafter, 38% of eligible 3‐5 year old migrant children (5% increase over the 2014‐15 baseline) will participate in preschool programming to increase school readiness skills.
Documented by projects, reported by Sue, Lindsay, Danielle
MIS2000 September
MPO 1.1b During 2016‐17 and each year thereafter, 75% of 3‐5 year old migrant children participating in MEP‐sponsored preschool instruction, will score proficient or show a 5% increase on the Teaching Strategies GOLD or the Statewide MEP Preschool Assessment Tool.
Directors, MEP staff
report (Form 5); NDE staff report GOLD
results
Pre/post results
documented on Form 5;
GOLD results from
NDE
August
MPO 1.2 During 2016‐17 and each year thereafter, 80% of parents of preschool‐aged migrant children who participated in MEP‐sponsored parent/family educational services will show a statistically significant gain (p<.05) on a pre/post assessment measuring their ability to help their young children be ready for school.
Parents complete after each parent activity
Form 1 August
MPO 1.3 During 2016‐17 and each year thereafter, 80% of staff who participated in professional learning will show a statistically significant gain (p<.05) on a pre/post assessment measuring their ability to use evidence‐based strategies, promising practices, and culturally‐relevant instruction in school readiness to benefit PK migrant children.
Directors, MEP staff,
and teacherscomplete after each training
Form 2 August
MPO 1.4 During 2016‐17 and each year thereafter, at least 65% of all eligible 3‐5 year old migrant children (same or more than the 2014‐15 baseline) will receive MEP‐sponsored support services that contribute to their development of school readiness skills.
Documented by projects, reported by Sue, Lindsay, Danielle
MIS2000 September

38
Reading/Writing and Mathematics MPOs Who
collects? How
collected? When
reported? MPO 2.1a During 2016‐17 and each year thereafter, 60% of K‐12 migrant students who receive MEP‐sponsored supplemental instructional services aimed at increasing student achievement in reading/writing and/or mathematics, will score proficient or above, or show a 20% increase on pre/post district assessments.
Directors, MEP staff/ teachers report
Assessment results
documented on Form 6
August
MPO 2.1b During 2016‐17 and each year thereafter, 60% of secondary migrant students entering 11th grade will have received full credit (equivalent to one year) for Algebra 1 or a higher mathematics course.
Directors Districts document on Form 7
August
MPO 2.2 During 2016‐17 and each year thereafter, 80% of parents of migrant students who participated in MEP‐sponsored parent/family educational services will show a statistically significant gain (p<.05) on a pre/post assessment measuring their ability to support their child in reading/writing and/or math.
Parents complete after each parent activity
Form 1 August
MPO 2.3 During 2016‐17 and each year thereafter, 80% of staff who participated in professional learning will show a statistically significant gain (p<.05) on a pre/post assessment measuring their ability to use evidence‐based strategies, promising practices, and culturally‐relevant instruction in reading/ writing and/or math to benefit migrant students.
Directors, MEP staff,
and teacherscomplete after each training
Form 2 August
MPO 2.4 During 2016‐17 and each year thereafter, at least 75% of all eligible migrant students in grades K‐8 (same or more than the 2014‐15 baseline) will receive MEP‐sponsored support services that contribute to their achievement in reading/writing and/or math.
Documented by projects, reported by Sue, Lindsay, Danielle
MIS2000 September
Graduation/Services to OSY MPOs Who
collects? How
collected? When
reported? MPO 3.1a During 2016‐17 and each year thereafter, 5% of the OSY population will be re‐engaged in an educational recovery program (e.g., re‐enroll in school, secondary credit accrual, GED, HEP, alternative education program).
Sue, Lindsay, Danielle
MIS2000 September
MPO 3.1b During 2016‐17 and each year thereafter, OSY utilizing OSY Lessons will demonstrate an average gain of 20% on OSY Lesson Assessments.
Directors, MEP staff/ teachers report
OSY Assessments
August
MPO 3.1c During 2016‐17 and each year thereafter, an increasing percentage (5% increase per year over the 2014‐15 baseline of 22%) of eligible secondary migrant students (grades 9‐12) and OSY will receive MEP‐sponsored supplemental instructional services that contribute to their graduation, GED, life skills, and/or career readiness goals.
Documented by projects, reported by Sue, Lindsay, Danielle
MIS2000 September
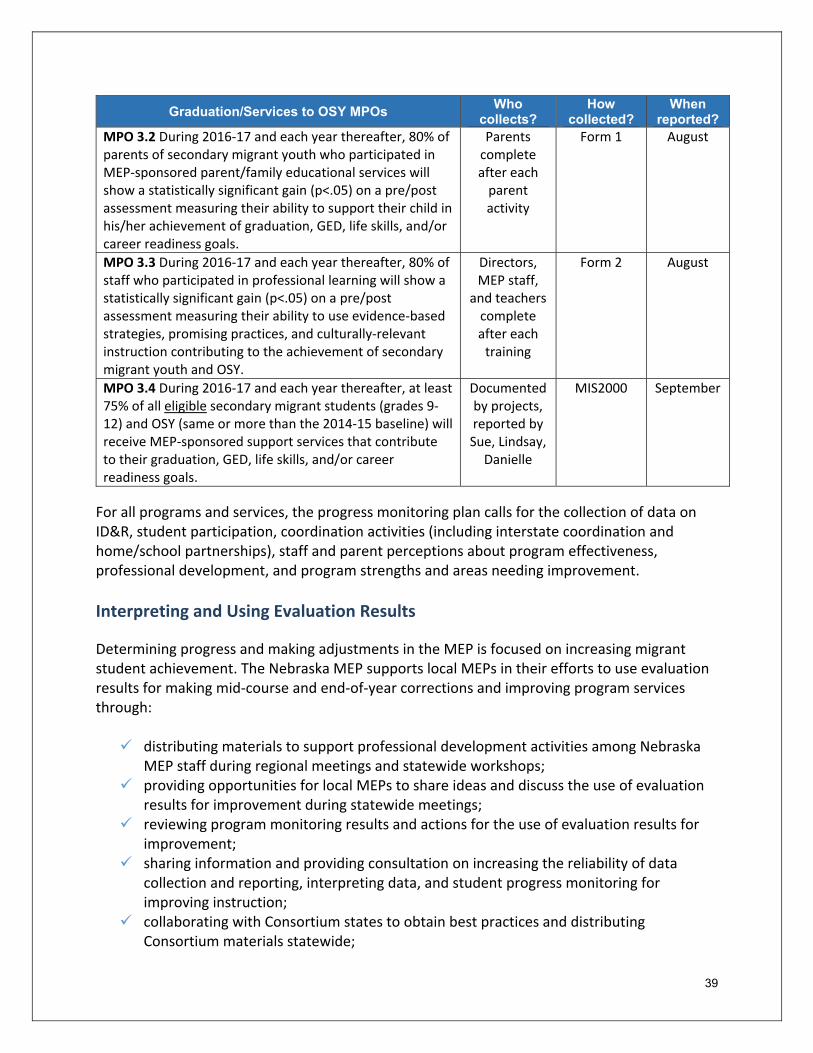
39
Graduation/Services to OSY MPOs Who
collects? How
collected? When
reported? MPO 3.2 During 2016‐17 and each year thereafter, 80% of parents of secondary migrant youth who participated in MEP‐sponsored parent/family educational services will show a statistically significant gain (p<.05) on a pre/post assessment measuring their ability to support their child in his/her achievement of graduation, GED, life skills, and/or career readiness goals.
Parents complete after each parent activity
Form 1 August
MPO 3.3 During 2016‐17 and each year thereafter, 80% of staff who participated in professional learning will show a statistically significant gain (p<.05) on a pre/post assessment measuring their ability to use evidence‐based strategies, promising practices, and culturally‐relevant instruction contributing to the achievement of secondary migrant youth and OSY.
Directors, MEP staff,
and teachers complete after each training
Form 2 August
MPO 3.4 During 2016‐17 and each year thereafter, at least 75% of all eligible secondary migrant students (grades 9‐12) and OSY (same or more than the 2014‐15 baseline) will receive MEP‐sponsored support services that contribute to their graduation, GED, life skills, and/or career readiness goals.
Documented by projects, reported by Sue, Lindsay, Danielle
MIS2000 September
For all programs and services, the progress monitoring plan calls for the collection of data on ID&R, student participation, coordination activities (including interstate coordination and home/school partnerships), staff and parent perceptions about program effectiveness, professional development, and program strengths and areas needing improvement.
Interpreting and Using Evaluation Results Determining progress and making adjustments in the MEP is focused on increasing migrant student achievement. The Nebraska MEP supports local MEPs in their efforts to use evaluation results for making mid‐course and end‐of‐year corrections and improving program services through: distributing materials to support professional development activities among Nebraska
MEP staff during regional meetings and statewide workshops; providing opportunities for local MEPs to share ideas and discuss the use of evaluation
results for improvement during statewide meetings; reviewing program monitoring results and actions for the use of evaluation results for
improvement; sharing information and providing consultation on increasing the reliability of data
collection and reporting, interpreting data, and student progress monitoring for improving instruction;
collaborating with Consortium states to obtain best practices and distributing Consortium materials statewide;
40
including language in the local MEP application asking sites to discuss how evaluation results will be used for program improvement purposes;
coordinating with the external evaluator to review processes, procedures, and supports provided to local MEPs;
sharing information among local MEPs from State and national meetings, conferences, and forums that focus on the use of data for improvement; and
offering training‐of‐trainers sessions for MEP directors to support their efforts in assisting local MEPs to use evaluation results to make mid‐course corrections and improve MEP programs and services.

41
Implementation and Accountability in Local Programs
Communication with Local MEPs about the SDP Nebraska’s plan for communication about the SDP with local MEPs will occur with and through the local project directors. Each MEP director will be trained on the new SDP, and each will have the responsibility of ensuring the communication about the SDP with administrators, instructors, recruiters and clerks, other MEP staff, as well as migrant parents. Ongoing local coordination meetings with MEP staff, State/local PAC meetings, and regional meetings and trainings provide opportunities for communication. Further, the State MEP offers professional development for recruiters and instructional staff where training on the SDP will occur. The SDP Committee recommended the following means for rolling‐out the SDP to MEP staff, parents, and stakeholders. Sessions at the State Migrant Conference Webinars covering each goal area posted on the website Short video Email to staff with SDP attachment A PowerPoint presentation to share with parents Webinars covering each goal area posted on the website YouTube video (bilingual)
Professional Development and Technical Assistance Following are examples of national professional development resources that the Nebraska MEP employs for migrant staff and in some cases, regular school staff who work with migrant children:
The Migrant Services Directory: Organizations and Resources provides summaries and
contact information for major Federal programs and national organizations that serve migrant farmworkers and their families. (www.ed.gov/about/offices/list/oese/ome/migrantdirectory.pdf)
Federal Resources for Educational Excellence sponsored by the U.S. Department of
Education reports on effective educational programs, practices, and products. (www.free.ed.gov/displaydate.cfm)
The Interstate Migrant Education Council (IMEC), an independent organization to advocate policies that ensure the highest quality education and other needed services for migrant children, facilitates opportunities for members to examine policy issues at all levels of government related to coordination between public and private agencies to benefit migrant students and programs. (http://imec‐migranted.org/)
42
ESCORT is a national center dedicated to improving educational opportunities for migrant children. They provide professional development in the areas of migrant student needs and services, ID&R, MEP planning, and effective instructional strategies to help improve services to migrant children and English learners. (www.escort.org)
Sponsored by the Geneseo Migrant Center, the books listed in the Migrant Library serve as
an introduction to migrant farmworker literature, both fiction and non‐fiction. These resources may be useful inside the classroom, for research, or to increase understanding of the migrant experience in other areas. (www.migrantlibrary.org)
The National Association of State Directors of Migrant Education offers its annual National Migrant Education Conference held each spring. Nebraska typically sends about two dozen staff to this event to learn strategies in curriculum and instruction, parent involvement, assessment, ID&R, and program administration. (www.nasdme.org)
The National Center for Families Learning offers information and materials on migrant family literacy. (http://www.familieslearning.org/)
The Office of Migrant Education (OME) of the U.S. Department of Education administers grant programs that provide academic and supportive services to eligible migrant students. OME also sponsors workshops, institutes, and meetings (e.g., the annual MEP Directors’ meeting). (www.ed.gov/about/offices/list/oese/ome/index.html)
The U.S. Department of Education’s Office of English Language Acquisition provides a Summit for English learners with a strand and sessions for migrant education. (http://www2.ed.gov/about/offices/list/oela/index.html)
The GOSOSY (Graduation and Outcomes for Success for OSY) MEP Consortium Incentive Grant provides online resources and face‐to‐face training for Consortium States. http://www.osymigrant.org/
The IRRC (Identification and Recruitment Rapid Response Consortium) MEP Consortium Incentive Grant provides online resources and face‐to‐face training for Consortium States. http://www.idr‐consortium.net/
At the State level, examples of resources that Nebraska shares among local migrant education programs include: The Nebraska MEP website provides web resources, contact information for Nebraska
MEP sites, information on various topics of interest, operating procedures for identification and recruitment, upcoming events, and a portal for questions/answers. (http://www.education.ne.gov/Migrant/index.html)
43
The NDE website provides an A‐Z topic list, State of the Schools and other reports, an Ask NDE section, and a portal to the MEP. (http://www.education.ne.gov/)
The Latino/Hispanic Summit offers opportunities for students, parents, and staff to work together around issues of education and health. (www.latinosummit.org)
The State of Nebraska’s Teacher Education Programs has a statewide focus in which the NDE partners with the Nebraska P‐16 Initiative offering resources provided by the Nebraska Partnership for Quality Teacher Education project (funded by the Higher Education Act of 1998) and administered by the Teacher Education section at NDE. These resources support activities such as annual statewide conferences and alignment projects in mathematics and English/language arts. For more information, see: http://p16.nebraska.edu/what‐is‐p‐16.html
The Nebraska Department of Education’s AQuESTT (A Quality Education System Today and Tomorrow) is a next generation accountability system that integrates components of accountability, assessment, accreditation, career education, and data into a system of school improvement and support. For more information, see: http://aquestt.com/
Professional learning for local and State MEP staff aim to further staff knowledge, encourage application of learning, and feature impact to support staff professional growth with a focus on migrant student learning and achievement of standards. The Nebraska State MEP and the regional/local MEP sites attend national meetings and training and offer professional development within Nebraska such as meetings for local MEP directors and coordinators two times per year; annual statewide and regional trainings and meetings for recruiters; local and regional data collection training opportunities; regional parent involvement activities; and National MEP conferences, IMEC meetings, BMEI Forums, ID&R meetings, and MEP Consortium Incentive Grant meetings and workgroups. Technical assistance is available through State‐initiated follow‐up as a result of compliance monitoring, contact initiated by a local or regional director in response to needs identified by an MEP site, or when a new initiative is undertaken (i.e., implementing aspects of the new SDP). Nebraska sponsors activities to encourage collaboration and sharing among regional and local migrant entities. Some examples include the following. Hispanic/Latino Summit held annually Nebraska MEP meetings held twice each year Nebraska State website with a link to the State MEP ID&R meetings for recruiters and project administrators Statewide and regional migrant PAC meetings/webinars State‐sponsored meetings around a specific theme or innovation Technical assistance and program compliance monitoring visits from NDE MEP staff ID&R Training (2 times each year) Data Training on MIS2000 and MSIX (2 times each year)

44
Collaboration and resource sharing around the Nebraska MEP SDP continues to be a priority. Full implementation of the updated SDP will begin in the fall of 2016 to incorporate the work that was done by the SDP Committee during 2015‐16 to align the updated SDP with other State systems as well as the State MEP application, sub‐allocation process, MEP monitoring, and the evaluation systems and tools.
Alignment of the MEP Application to the SDP Upon completion of the SDP, the Nebraska MEP application will be updated to align with the revised Strategies and MPOs, so that all projects are working toward the same outcomes, and implementing the same Strategies.
State Monitoring Process and Timelines Monitoring local migrant education programs is the responsibility of NDE. This includes compliance monitoring and follow‐up/technical assistance that supports project implementation and student achievement. Resources for MEP staff can be found on the NDE MEP website at: http://www.education.ne.gov/Migrant/technical assistance and monitoring.html The Title I, Part C Migrant Education Program Monitoring Guide provides the requirements of the programs in the NCLB Consolidated Application and other formula grants funded under this legislation, including Title I Part C Migrant Education Programs. It is presented as a checklist that can be used by grant recipients to ensure programs operate in compliance with the law and guidance. The Monitoring Guide is to be used during onsite, virtual, and desk audit monitoring. All NCLB programs also are monitored through the application and financial reporting approval processes. Monitoring by NDE MEP staff through onsite visits is required under NCLB‐Title I to occur at least once every three years. However, the MEP monitors its programs annually via ongoing “desk monitoring,” telephone and email follow‐up, and onsite monitoring. Further, meetings with MEP directors are scheduled bi‐annually to discuss issues of importance and share information about project implementation. Six to eight weeks in advance of a monitoring visit, the district or Educational Service Unit (ESU) is contacted by the NDE reviewer to arrange the details of the monitoring visit. The district/ESU completes the Monitoring Checklist and submits it to the reviewer at least one week prior to the scheduled visit. The form is designed to identify areas where technical assistance may be needed as well as options for documentation to support compliance with the requirements. NDE requires that some pieces of evidence or documentation be submitted prior to or during the monitoring visit. Onsite visits include a review of documentation and a meeting with appropriate program directors or staff members. Following the review, the project has 30 days

45
to submit any documentation or evidence that was not available during the review as requested by the reviewer. The district/ESU will receive a written report within 90 days if additional evidence was submitted. If a review report includes a finding of non‐compliance, a plan for correcting the issue is required within 60 days of receipt of the report and may involve a follow‐up visit. In addition to NCLB monitoring, the accuracy of Certificates of Eligibility (COEs) and other quality control processes is verified by NDE as part of its MEP monitoring process. This aspect of monitoring is described in detail in the Identification and Recruitment Plan. Further, monitoring budgetary and programmatic aspects is documented through an MEP Onsite Monitoring Tool.
46
Looking Forward
This SDP will be implemented beginning in the fall of 2016. The strategies and MPOs will be added to the local application language in in the summer of 2016, with technical assistance and training delivered as outlined in the Implementation and Accountability Plan section of this SDP. The Nebraska MEP will continue its annual evaluation during the 2015‐16 program year with the current strategies and MPOs, and during the 2016‐17 program year incorporating the new strategies and MPOs. Data from that effort will inform program improvement and planning. As specified in the guidance found in OME’s CNA Toolkit (2012), the Nebraska MEP will revisit its CNA in three years (or more frequently if there are substantial changes in student demographics or in program services) to update the data and solution strategies as needed, and will revise the SDP accordingly as part of the Continuous Improvement Cycle. Beginning in the spring of 2016, the Nebraska MEP will continue its planning by undertaking the following key activities: Revisit all forms and other data collection tools to ensure their alignment with the
evaluation plan described in the SDP.
Review the MEP sub‐allocation program application and revise it to align with the new MPOs, strategies, and resources. Ensure that the updated application is distributed to local sites with sufficient time to respond to the SDP updates.
Review existing structures for professional development for migrant administrators, parents, advocates, instructional aides, recruiters, clerks, and other stakeholders to ensure that professional development activities include general and specific information about the new SDP as well as professional development content to carry out the activities of the SDP.
Revisit the Nebraska MEP monitoring tool to align it with the strategies and MPOs and other facets of the updated SDP.
Consider existing program evaluation activities and align the evaluation with the evaluation and data collection plan outlined in the SDP. Ensure that all needed data are collected annually, that a performance results evaluation is conducted annually, and that an implementation evaluation is done at least every two years.