Embed Size (px)
Citation preview


NEW ZEALAND HEALTH AND DISABILITY SYSTEM REVIEW | HAUORA MANAAKI KI AOTEAROA WHĀNUI
PAGE | i i
Published August 2019 by the Health and Disability System Review
This work is licensed under the Creative Commons Attribution 4.0 International licence. In essence, you are free to
copy, distribute and adapt the work, as long as you attribute the work to the Crown (Health and Disability Sector
Review, New Zealand) and abide by the other licence terms. To view a copy of this licence, visit
https://creativecommons.org/licenses/by/4.0/. Attribution should be in written form and not by reproduction of any
such emblem, logo, or Coat of Arms.
Liability While all care and diligence has been used in processing, analysing, and extracting data and information in this
publication, the Health and Disability System Review gives no warranty it is error free and will not be liable for any loss
or damage suffered by the use directly, or indirectly, of the information in this publication.
ISBN print: 978-0-473-49315-8
ISBN online: 978-0-473-49102-4
Citation: Health and Disability System Review. 2019. Health and Disability System Review - Interim Report. Hauora
Manaaki ki Aotearoa Whānui – Pūrongo mō Tēnei Wā.Wellington: HDSR.
This report is available from www.systemreview.health.govt.nz/interim-report
INTERIM REPORT | PŪRONGO MŌ TĒNEI WĀ
PAGE | i i i
Tīhei Mauri Ora
Ko te wehi ki a Ihowa, nāna nei ngā mea katoa.
Kei ngā maunga whakahī, ngā tai mihi tāngata, ngā awa e
rere nei, ngā mana whenua, toitū ki a koutou.
He tātai whetu ki te rangi, mau tonu, he tātai tangata ki
te whenua ngaro noa. Kei ngā mate o te wā whakangaro
atu ra koutou.
Me aro ki te hā o te tangata – kei ngā mataora, tēnā
koutou katoa. He mihinui tēnei kia koutou ngā kai pānui
tēnei ripoata hauora hauā arotake wā poto.
Ko te whakaaro I te mutunga ka whai matauranga koutou
ki hea Pūrongo mō Tēnei Wā – Hauora Manaaki ki
Aotearoa Whānui.
Noho ora mai, HEATHER SIMPSON
NEW ZEALAND HEALTH AND DISABILITY SYSTEM REVIEW | HAUORA MANAAKI KI AOTEAROA WHĀNUI
PAGE | iv
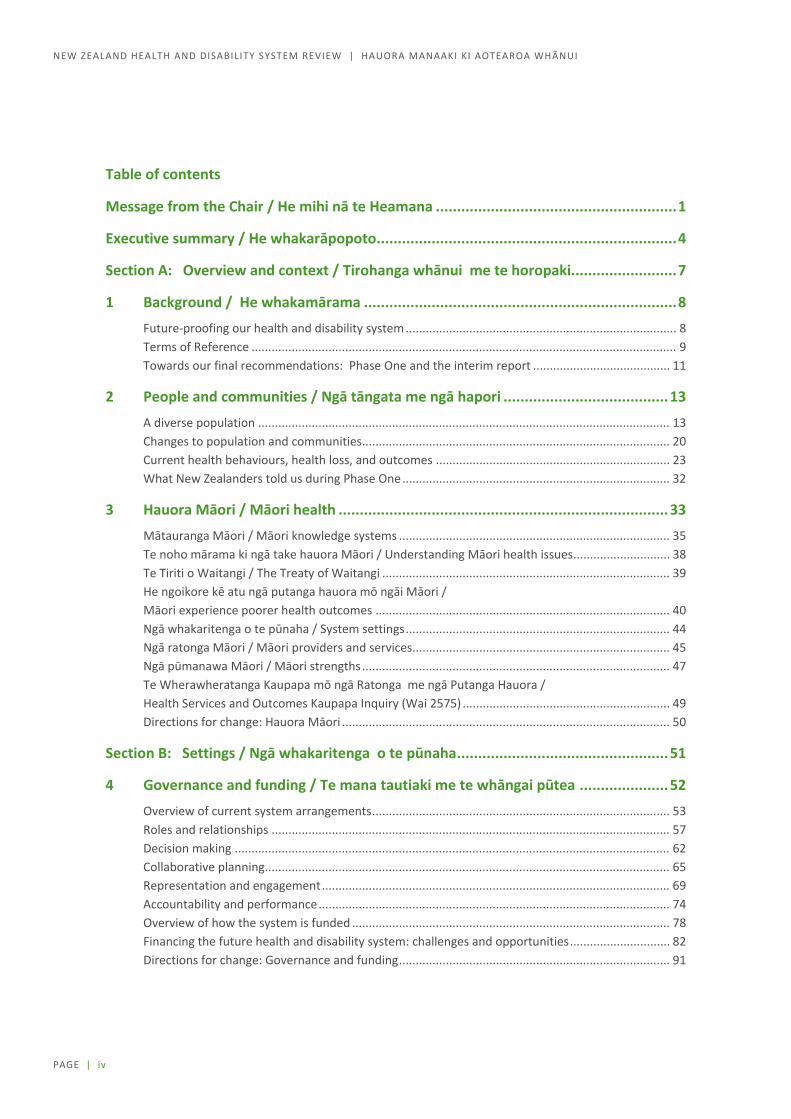
Table of contents
Message from the Chair / He mihi nā te Heamana ......................................................... 1
Executive summary / He whakarāpopoto ....................................................................... 4
Section A: Overview and context / Tirohanga whānui me te horopaki ......................... 7
1 Background / He whakamārama .......................................................................... 8
Future-proofing our health and disability system ................................................................................. 8 Terms of Reference ............................................................................................................................... 9 Towards our final recommendations: Phase One and the interim report ......................................... 11
2 People and communities / Ngā tāngata me ngā hapori ....................................... 13
A diverse population ........................................................................................................................... 13 Changes to population and communities ............................................................................................ 20 Current health behaviours, health loss, and outcomes ...................................................................... 23 What New Zealanders told us during Phase One ................................................................................ 32
3 Hauora Māori / Māori health .............................................................................. 33
Mātauranga Māori / Māori knowledge systems ................................................................................. 35 Te noho mārama ki ngā take hauora Māori / Understanding Māori health issues ............................. 38 Te Tiriti o Waitangi / The Treaty of Waitangi ...................................................................................... 39 He ngoikore kē atu ngā putanga hauora mō ngāi Māori / Māori experience poorer health outcomes ........................................................................................ 40 Ngā whakaritenga o te pūnaha / System settings ............................................................................... 44 Ngā ratonga Māori / Māori providers and services ............................................................................. 45 Ngā pūmanawa Māori / Māori strengths ............................................................................................ 47 Te Wherawheratanga Kaupapa mō ngā Ratonga me ngā Putanga Hauora / Health Services and Outcomes Kaupapa Inquiry (Wai 2575) .............................................................. 49 Directions for change: Hauora Māori .................................................................................................. 50
Section B: Settings / Ngā whakaritenga o te pūnaha .................................................. 51
4 Governance and funding / Te mana tautiaki me te whāngai pūtea ..................... 52
Overview of current system arrangements ......................................................................................... 53 Roles and relationships ....................................................................................................................... 57 Decision making .................................................................................................................................. 62 Collaborative planning ......................................................................................................................... 65 Representation and engagement ........................................................................................................ 69 Accountability and performance ......................................................................................................... 74 Overview of how the system is funded ............................................................................................... 78 Financing the future health and disability system: challenges and opportunities .............................. 82 Directions for change: Governance and funding ................................................................................. 91

INTERIM REPORT | PŪRONGO MŌ TĒNEI WĀ
PAGE | v
Section C: Services / Ngā Ratonga .............................................................................. 93
5 Service overview / Te tirohanga whānui ki te ratonga ......................................... 94
Service delivery context ...................................................................................................................... 94 Setting the direction for integrated care and equity focus ................................................................ 94 Why the changes to the system are important ................................................................................... 96 Framework for the system review ...................................................................................................... 98 Current service delivery arrangements ............................................................................................... 99
6 Population health / Te hauora taupori .............................................................. 101
What is population health ................................................................................................................. 101 Current population health service arrangements ............................................................................. 102 How population health services are funded ..................................................................................... 106 Facing the future: population health challenges ............................................................................... 107 Designing a system to meet the challenges ...................................................................................... 110 Directions for change: Population health .......................................................................................... 114
7 Tier 1 / Taumata 1 ............................................................................................. 115
Overview of current arrangements ................................................................................................... 116 Tier 1 service funding and copayments ............................................................................................. 117 Primary Health Care Strategy – new ways of working ...................................................................... 121 Service snapshots .............................................................................................................................. 126 Community pharmacy ....................................................................................................................... 126 Oral Health ....................................................................................................................................... 129 Maternity ....................................................................................................................................... 133 Well Child / Tamariki Ora .................................................................................................................. 135 Aged residential care ......................................................................................................................... 137 PHOs and primary care through general practices ............................................................................ 141 Contracting approaches .................................................................................................................... 146 Business models ................................................................................................................................ 148 PHOs and general practice ownership .............................................................................................. 149 Directions for change: Tier 1 ............................................................................................................. 153
8 Disability / Te Huātanga .................................................................................... 155
What do we mean by disability? ....................................................................................................... 155 Disability across the population ........................................................................................................ 157 Disability support across Government .............................................................................................. 157 Health and disability system role in disability support ...................................................................... 159 Equity, acceptability and effectiveness of disability support ............................................................ 164 Beyond disability support, wider health and disability system roles ................................................ 170 What the future looks like ................................................................................................................. 174 Directions for change: Disability ........................................................................................................ 176

NEW ZEALAND HEALTH AND DISABILITY SYSTEM REVIEW | HAUORA MANAAKI KI AOTEAROA WHĀNUI
PAGE | vi
9 Tier 2 / Taumata 2 ............................................................................................. 177
Introduction ....................................................................................................................................... 177 Inter-district flows ............................................................................................................................. 183 Variation in Tier 2 delivery ................................................................................................................ 185 Determining priorities and setting standards .................................................................................... 192 Longer-term, comprehensive planning ............................................................................................. 195 Future role of hospitals ..................................................................................................................... 196 Collaborative and new ways of working ............................................................................................ 199 Workforce ....................................................................................................................................... 204 Directions for change: Tier 2 ............................................................................................................. 206
Section D: Enablers / Ngā rawa e tika ai te pūnaha ................................................... 207
10 System enablers overview / Tirohanga whānui ki ngā rawa e tika ai te pūnaha 208
Society and business models are changing ....................................................................................... 208 What technology changes mean for health ...................................................................................... 209 Workforce ....................................................................................................................................... 211 Digital and data ................................................................................................................................. 211 Facilities and equipment ................................................................................................................... 212
11 Workforce / Te tira kaimahi .............................................................................. 213
Overview of the workforce ................................................................................................................ 213 Current system arrangements ........................................................................................................... 217 Workforce training and supply .......................................................................................................... 219 Employment models and relations.................................................................................................... 224 Health could do more for the wellbeing of its workforce ................................................................. 225 Growing a workforce that reflects New Zealand’s many communities ............................................ 229 Working differently ........................................................................................................................... 232 Directions for change: Workforce ..................................................................................................... 236
12 Digital and data / Te matihiko me ngā raraunga ................................................ 238
Importance of data ............................................................................................................................ 238 Effective data collection and sharing ................................................................................................ 240 Privacy and data sovereignty ............................................................................................................. 244 Vendors, systems, and interoperability ............................................................................................. 247 Equity ....................................................................................................................................... 254 Ways of working inhibit the potential of technology ........................................................................ 256 Directions for change: Digital and data ............................................................................................. 262
13 Facilities and equipment / Ngā rauhanga me ngā taputapu .............................. 263
Overview ....................................................................................................................................... 263 Managing to a system plan ............................................................................................................... 265 Delivery of major capital projects ..................................................................................................... 267 More effective management of existing assets needed ................................................................... 268 Capital charge .................................................................................................................................... 269 Directions for change: Facilities and equipment ............................................................................... 270

INTERIM REPORT | PŪRONGO MŌ TĒNEI WĀ
PAGE | vii
Section E: Moving forward / Te haerenga whakamua ............................................... 271
14 Next steps / Ka whai ake nei ............................................................................. 272
Settings ....................................................................................................................................... 273 Services ....................................................................................................................................... 274 Enablers ....................................................................................................................................... 275 What happens next? ......................................................................................................................... 276
Section F: Notes / Kupu āpiti .................................................................................... 277
Notes ....................................................................................................................................... 278
NEW ZEALAND HEALTH AND DISABILITY SYSTEM REVIEW | HAUORA MANAAKI KI AOTEAROA WHĀNUI
PAGE | viii
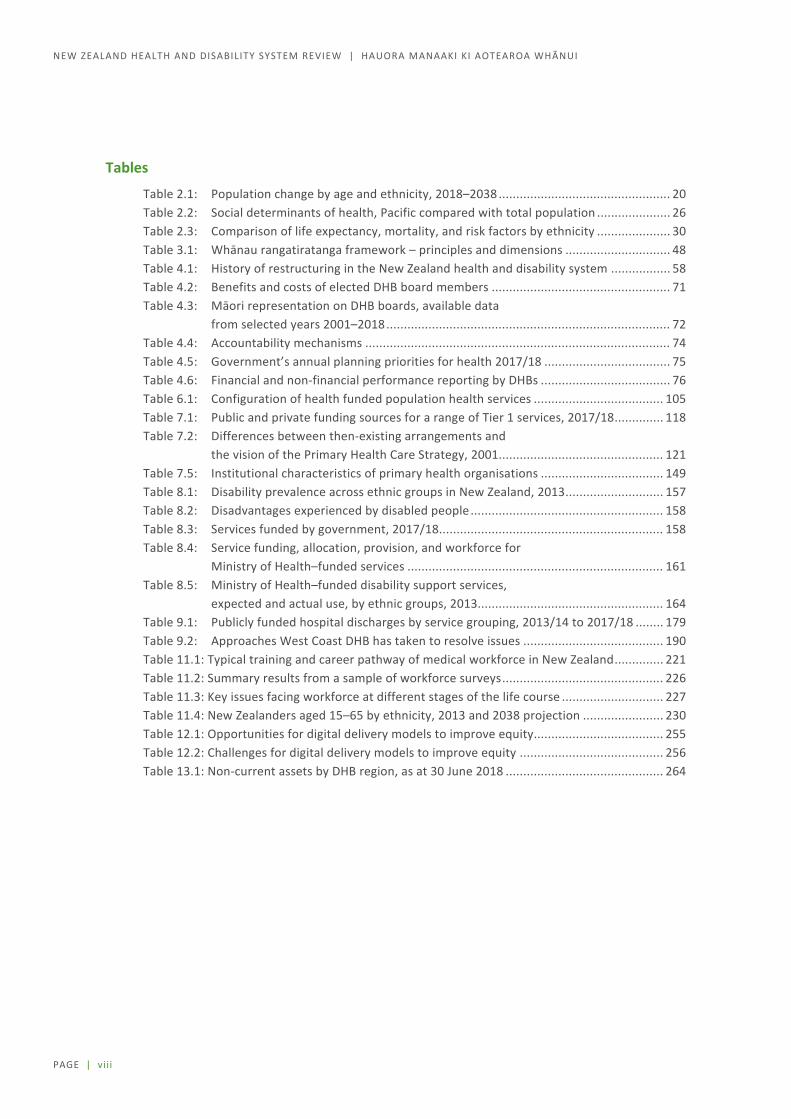
Tables
Table 2.1: Population change by age and ethnicity, 2018–2038 ................................................. 20 Table 2.2: Social determinants of health, Pacific compared with total population ..................... 26 Table 2.3: Comparison of life expectancy, mortality, and risk factors by ethnicity ..................... 30 Table 3.1: Whānau rangatiratanga framework – principles and dimensions .............................. 48 Table 4.1: History of restructuring in the New Zealand health and disability system ................. 58 Table 4.2: Benefits and costs of elected DHB board members ................................................... 71 Table 4.3: Māori representation on DHB boards, available data
from selected years 2001–2018 ................................................................................. 72 Table 4.4: Accountability mechanisms ....................................................................................... 74 Table 4.5: Government’s annual planning priorities for health 2017/18 .................................... 75 Table 4.6: Financial and non-financial performance reporting by DHBs ..................................... 76 Table 6.1: Configuration of health funded population health services ..................................... 105 Table 7.1: Public and private funding sources for a range of Tier 1 services, 2017/18 .............. 118 Table 7.2: Differences between then-existing arrangements and
the vision of the Primary Health Care Strategy, 2001 ............................................... 121 Table 7.5: Institutional characteristics of primary health organisations ................................... 149 Table 8.1: Disability prevalence across ethnic groups in New Zealand, 2013 ............................ 157 Table 8.2: Disadvantages experienced by disabled people ....................................................... 158 Table 8.3: Services funded by government, 2017/18 ................................................................ 158 Table 8.4: Service funding, allocation, provision, and workforce for
Ministry of Health–funded services ......................................................................... 161 Table 8.5: Ministry of Health–funded disability support services,
expected and actual use, by ethnic groups, 2013..................................................... 164 Table 9.1: Publicly funded hospital discharges by service grouping, 2013/14 to 2017/18 ........ 179 Table 9.2: Approaches West Coast DHB has taken to resolve issues ........................................ 190 Table 11.1: Typical training and career pathway of medical workforce in New Zealand .............. 221 Table 11.2: Summary results from a sample of workforce surveys .............................................. 226 Table 11.3: Key issues facing workforce at different stages of the life course ............................. 227 Table 11.4: New Zealanders aged 15–65 by ethnicity, 2013 and 2038 projection ....................... 230 Table 12.1: Opportunities for digital delivery models to improve equity ..................................... 255 Table 12.2: Challenges for digital delivery models to improve equity ......................................... 256 Table 13.1: Non-current assets by DHB region, as at 30 June 2018 ............................................. 264

INTERIM REPORT | PŪRONGO MŌ TĒNEI WĀ
PAGE | ix
Figures
Figure 1.1: Life expectancy at birth ............................................................................................................... 8 Figure 2.1: Share of population by ethnic group, 2018 .............................................................................. 14 Figure 2.2: Distribution of New Zealand’s population, 2018 ...................................................................... 15 Figure 2.3: Age distribution of Māori, European, Pacific, and Asian populations, 2018 ........................... 16 Figure 2.4: Share of population by ethnicity and district area, 2018 ......................................................... 17 Figure 2.5: Socioeconomic deprivation decile – ethnicity distribution, 2013 ............................................ 17 Figure 2.6: Socioeconomic deprivation, deciles 9 and 10 , by ethnicity, 2013 .......................................... 18 Figure 2.7: Areas by deprivation decile, 2013 ............................................................................................. 19 Figure 2.8: Distribution of New Zealand’s population, 2038 ...................................................................... 20 Figure 2.9: Projected increase in population area type, 2018 to 2038 ...................................................... 21 Figure 2.10: Ratios of labour force to non-labour force and working age to
non-working age populations, 2018–2038 ............................................................................... 22 Figure 2.11: Global and regional trends ........................................................................................................ 23 Figure 2.12: Factors that influence our health and wellbeing ...................................................................... 25 Figure 2.13: Rate ratio for mental health service use by deprivation quintile, 2018 ................................. 26 Figure 3 1: Māori cultural wellbeing in 2013 – poster ................................................................................ 34 Figure 4.1: Overview of the health and disability system, as at July 2019 ................................................. 54 Figure 4.2: Timeline of health and disability strategies since 2000 (New Zealand) ................................... 59 Figure 4.3: Overview OF values in use across health and disability organisations .................................... 61 Figure 4.4: Allocation of DHB funding ($millions), 2017/18 ....................................................................... 64 Figure 4.5: DHB board and mayoral election turn-outs, 2001–2016 ......................................................... 70 Figure 4.6: Government and private health spending as a percentage
of gross domestic product by country ...................................................................................... 78 Figure 4.7: Distribution of healthcare spending, 2018 ............................................................................... 79 Figure 4.8: Groups of countries sharing broadly similar institutions ......................................................... 80 Figure 4.9: Potential gains in life expectancy, by group ............................................................................. 81 Figure 4.10: Per capita core Crown health expenditure adjusted for inflation, 1972–2017 ....................... 83 Figure 4.11: DHB deficits as a percentage of total DHB revenue
(including inter-district flows), 2006–2018 ............................................................................... 84 Figure 4.12: Share of DHB spending by category, 2009 and 2018 ............................................................... 84 Figure 4.13: Breakdown of funding appropriated through Vote Health, 2017/18 ..................................... 85 Figure 4.14: Share of total revenue allocated to DHB provider arms, 2009–2018 ..................................... 86 Figure 4.15: Per person spending by age group and ethnicity, hospital services
compared with primary services ............................................................................................... 87 Figure 5.1: Services overview ...................................................................................................................... 98 Figure 5.2: Snapshot of services, organisations and health care workers across the system ................. 100 Figure 6.1: Public Health Services Appropriation allocation 2017/18 ..................................................... 106 Figure 7.1: Funding flows to different service areas, 2017/18 ................................................................. 119 Figure 7.2: Out-of-pocket share of total spending on health and disability services, 2016/17 .............. 120 Figure 7.3: Share of dentist by practice type, 2018 .................................................................................. 130

NEW ZEALAND HEALTH AND DISABILITY SYSTEM REVIEW | HAUORA MANAAKI KI AOTEAROA WHĀNUI
PAGE | x
Figure 7.4: Births per 1000 females of reproductive age, 2017 ............................................................... 133 Figure 7.5: Share of infants receiving all WCTO core contacts, 2018 ...................................................... 136 Table 7.3: People receiving aged residential care in 2017/18 ................................................................ 138 Table 7.4: Median staffing hours per resident per day in 2017/18 ........................................................ 139 Figure 7.6: Average number of GP and nurse consultations per person per year
by age group, 2018 .................................................................................................................. 141 Figure 7.7: Average number of GP consultations per year, by age and ethnicity, 2018 ......................... 143 Figure 7.8: General practice fees based on ethnicity, 2019 ..................................................................... 144 Figure 7.9: Access barriers from the national primary care patient experience survey, 2018 ............... 145 Figure 7.10: Share of contracts by term of agreement, Māori providers and
all providers, 2017/18 ............................................................................................................. 147 Figure 8.1: Main disability clusters for people using Ministry of Health–funded
support services, 2016 ............................................................................................................ 160 Figure 9.1: Bed demand forecasts in Northern Region ............................................................................ 181 Figure 9.2: DHB of service – % of discharges that are patients from other DHBs, 2017/18 ................... 183 Figure 9.3: Ambulatory sensitive hospitalisation (ASH) rates by age groups and
ethnicity, 2014–2019 ............................................................................................................... 186 Figure 9.4: Standardised acute bed day rate by deprivation quintile and ethnicity, 2018 ..................... 186 Figure 9.5: New Zealand urban/rural profile (experimental) classification categories ........................... 188 Figure 9.6: Three-year child cancer survival rates by demographic indicators
(sex, ethnicity, socioeconomic status, domicile) .................................................................... 201 Figure 10.1: Technology adoption as at 2019 ............................................................................................. 209 Figure 11.1: People in the New Zealand health and disability workforce ................................................. 214 Figure 11.2: Private–public split of the regulated health workforce ......................................................... 215 Figure 11. 3: Percentage changes in the total and health and disability workforces
annually, 2001–2017 ............................................................................................................... 216 Figure 11.4: Registrations for international medical graduates (overseas-trained doctors) and
internationally qualified nurses compared with New Zealand graduates, 2011–2017 ........ 222 Figure 11.5: Māori and Pacific workforce populations ............................................................................... 229 Figure 12.1: National reporting framework ................................................................................................ 242 Figure 12.2: Changing the balance of information effort ........................................................................... 244 Figure 12.3: Systems and data flows in Auckland DHB............................................................................... 248

MESSAGE FROM THE CHAIR | HE MIHI NĀ TE HEAMANA
PAGE | 1
Message from the Chair / He mihi nā te Heamana
The attached report is both too short and too long.
It is too short because the health and disability system we have been tasked with reviewing is a huge network of interrelated organisations each of which is committed to providing quality care or services to their customers. Almost 8.5% of the entire New Zealand workforce is employed in some form in the health sector. This is a group of professional and committed individuals who often go above and beyond what is expected of them to assist those in need and to make the system as effective as it can be.
To do full justice to the range of issues facing this system and provide real insight into where the system could improve in the future could easily fill many volumes.
But it is also too long because we recognise that it is the complexity of the system, and the difficulty this causes for people to navigate it, that is often at the heart of individuals’ and organisations’ dissatisfaction with the way the system performs. For this reason, it would have been nice to produce a simple, easily readable, short analysis of the challenges and future directions that would have allowed everyone to understand and comment on the issues and potential solutions.
The reality, however, is that, despite the commitment and good intentions of most of those working in it, the current system is not performing equally with respect to all New Zealanders.
> continued
H E A T H E R S I M P S O N | C H A I R

NEW ZEALAND HEALTH AND DISABILITY SYSTEM REVIEW | HAUORA MANAAKI KI AOTEAROA WHĀNUI
PAGE | 2
Significantly, te Tiriti o Waitangi / the Treaty of Waitangi guaranteed Māori their full rights and benefits as citizens, yet more than 80 years after the establishment of our public health system, the health and wellbeing outcomes for Māori are still significantly poorer than for non-Māori New Zealanders.
When we project forward and consider the demographic, technological, societal, cultural, and environmental changes that are rapidly overtaking us, it is clear there are challenges ahead. Continuing with the current model of care, based largely on a Western medical model, employing more and more medically qualified staff focused on treating illness, rather than promoting wellness, will not only be ineffective in achieving the equitable outcomes we desire, it will not be sustainable. The numbers of staff required will not be available and the cost would be prohibitive.
This interim report aims to achieve three things. It reflects back the issues people and organisations have told us are hampering the achievement of better outcomes, checks whether the available evidence supports what we have heard, and signals our initial thoughts on where we believe the biggest gains can be made to improve the performance of the system.
The distressing part of listening to and reading the wide variety of submissions we received was the degree of concurrence in the views of what people want the system to achieve and how they want it to behave. This would seem to be a good thing, but the reality is that these views have been being expressed, and supposedly agreed with, for decades. Yet the system changes have been only marginal at best.
We have seen many great examples of professionals working together to achieve real progress in some areas. We have seen rural communities demonstrating a degree of flexibility and cohesiveness that could be a model for the rest of the system. We have observed examples of where the adoption of new technologies or processes has fundamentally changed the outlook for patients in particular areas. And we have seen examples of governance arrangements between iwi, Māori and DHBs which are supported by all parties.
But we have also seen many examples where the system continues with practices that the evidence no longer supports. We see communities and whānau facing a system that looms as a confusing monolith, telling people what is good for them, rather than a system that works with them to improve their overall wellbeing in ways designed for them not for the system. And we have seen rural communities forced to make do with a level of service accessibility that is simply unacceptable.
The challenge is not to reinvent the wheel. Many strategies are already in place, and this interim report is a reality check on where the system is at.
The work of the Panel in the next phase will focus on the specific changes we believe will have maximum effect on moving the system on the path to equity, responsiveness, and sustainability.

MESSAGE FROM THE CHAIR | HE MIHI NĀ TE HEAMANA
PAGE | 3
There are no recommendations in this interim report. That needs to wait for further analysis and much more discussion, but it is clear to us from this phase of our work that if the system is to be more equitable and more sustainable, significant change needs to happen.
The system needs to work:
– in a much more cohesive, collective, and collaborative style within a set of agreed values and principles that apply throughout the publicly funded system
– in partnerships both within the system and, more importantly, with those who choose or need to use it.
The system needs stronger leadership at all levels and clearer, enforceable mandates and accountabilities.
Māori need to be able to apply their Tiriti / Treaty rights and to have authority within the system to design and provide services that best suit their needs and allow them to embrace mātauranga Māori and fully express their cultural identity, and the system needs to support this.
The long talked about move to give more emphasis to preventive care and the promotion of wellness needs to become a reality. This requires the growth of more multidisciplinary services and a reduced dependence on models that drive throughput ahead of service.
Health services need to be planned more strategically, with more meaningful engagement with communities and better connections to other agencies with responsibilities impacting on key socioeconomic and cultural determinants of health.
Workforce strategies need to be strengthened to ensure the future workforce better reflects the community it serves and has the skills necessary to operate effectively under different models of care.
Data needs to be much more at the centre of decision making in the system, and this requires us to be much more determined about the type, standard, and relevance of the data that is collected.
The urgency for making improvements to outcomes for Māori, Pacific peoples, and low-income and rural households means priority needs to be given to getting more appropriate services to these communities, rather than simply making system-wide changes in the hope that the benefits trickle down.
The prospect of ever-increasing numbers of people with disabilities compels us to recognise that living with disability should no longer be treated as the exception. People living with disabilities have the right to expect equitable outcomes from the system, and we must ensure services strive to achieve that.
This report notes many other changes that the Panel considers need to happen.
Phase Two of the review will focus on building the details of changes to achieve the above. This will be done in conjunction with the sector and will include further consultation on specific proposals.

PAGE | 4
NEW ZEALAND HEALTH AND DISABILITY SYSTEM REVIEW | HAUORA MANAAKI KI AOTEAROA WHĀNUI
Executive summary / He whakarāpopoto
The Health and Disability System Review is charged with taking a system-wide approach to what needs to change to ensure the health and disability system of the future achieves better and more equitable health and wellbeing outcomes.
The canvas is huge. The health and disability sector employs more people than any other sector in the country and it impacts on the lives of every New Zealander.
The interim report does not provide specific change recommendations. It indicates the direction of change the Panel believes is necessary in key areas and points to questions which still need to be answered to arrive at final recommendations due in March 2020. This report reflects the messages received from meetings, submissions, analysis of the current state of the New Zealand system, and what is known about local and global trends that will impact on the system in the future.
Overall New Zealand has a good health system. Outcomes and spending are in line with other OECD countries, and the system has a dedicated staff who work hard to provide the best care for patients. There are many good examples of innovation in service delivery and initiatives achieving sustainable improvements in patient outcomes.
But it is clear that there is room to do better. The system is already facing many challenges and demand pressures are increasing. On the other hand new technology and new ways of working offer many opportunities. For the system to produce better and more equitable results in the future, significant changes will need to occur.
Panel members visited DHBs, met with key stakeholder organisations, held workshops and wānanga around the country, and conducted an online submission process open to all.
Key themes clearly emerged:
The current system is overly complicated and very fragmented from a consumer’s perspective, which leads to a lack of confidence or trust in the system
Leadership is lacking at all levels and this partly results from a lack of clear decision making frameworks with confused accountabilities and little effective enforcement
There is reasonable consensus around strategies in many parts of the system but little evidence of consistent implementation
Concern about the inequity of outcomes is widespread

PAGE | 5
MESSAGE FROM THE CHAIR | HE MIHI NĀ TE HEAMANA
Māori, as Tiriti/Treaty partners, have not been well served by the system and in the future mātauranga Māori and rights under te Tiriti o Waitangi/the Treaty of Waitangi, must be fully implemented
There is recognition that the health and disability system alone cannot eliminate all differences in health and wellbeing outcomes, because most of the differences arise from social determinants
Consumers want the system to work better for them. They need the system to respond to what consumers value and need, rather than being designed primarily around provider interests
Disabled people want more control over their own lives, and more flexibility and inclusion from the system
The way people work in the system is not leading to the most productive results. Healthcare organisations do not cooperate well, many professionals resist collaborating across disciplines, there is a lack of flexibility in employment arrangements, and a general resistance to change at many levels
While consumers report facing barriers to access within the system, it is clear these do not simply relate to monetary costs. Time, transport, or lack of culturally appropriate services are often as, if not more, significant barriers
Rural communities face particular challenges and need solutions designed specifically for them.
Directions for change Combining the information from submitters with analysis of the current state of the system, and consideration of previous reviews, shows there are a number of areas where change could lead to more consistent and equitable results.
The interim report, in each of its sections, indicates the direction of change the Panel believes needs to be taken to formulate recommendations for the final report. Some of the common threads running through Panel thinking include:
Leadership focus and culture change The system needs to work in a collaborative, collective, and cooperative way. Culture and attitudinal changes are needed. These changes need to be led from the centre and applied consistently throughout the system with a common set of values and principles guiding the behaviours of all parts of the system.
Mandates need to be clarified, accountabilities clearly defined, and enforced.
Placing consumers, whānau and communities at the heart of the system The system will need to be driven more by what consumers value and need most, with more choice about how needs are met.
The system will need to be much more focused on preventing ill health and promoting wellbeing. A more deliberate population health approach will be needed at all levels if future demand is to be managed, equitable health outcomes achieved, and the system is to be financially sustainable.

PAGE | 6
NEW ZEALAND HEALTH AND DISABILITY SYSTEM REVIEW | HAUORA MANAAKI KI AOTEAROA WHĀNUI
Within Tier 1 (the broad spectrum of self-care, home and community services), more emphasis on community health hubs, offering a broader range of services in localities that suit consumers, will be essential, and funding systems will need to reflect more emphasis on prevention and wellbeing, and less on throughput.
Developing an effective Tiriti/Treaty based partnership within health that delivers a health and disability system that works for Māori Te Tiriti o Waitangi / the Treaty of Waitangi must be fully incorporated to provide a framework for meaningful and substantive relationships between iwi, Māori and the Crown. This will provide a positive flow on effect linked to leadership, governance and decision making, and assist in strengthening Māori provider, workforce and service development.
Integration, planning and longer term thinking At the governance level there needs to be more deliberate and longer term, national, regional and local level planning which engages communities effectively in planning and decision making.
At the operational level the system needs less duplication and more collaboration and integration, with hospital and specialist services operating as a comprehensive network.
Workforce strategies need to effectively address projected shortages, so the workforce of the future better reflects the community it is serving, is trained appropriately and is able to achieve better work/life balance.
Data systems which are of better quality and more integrated both within and between Tier 1 and Tier 2 (hospital, specialist and diagnostic services) are a prerequisite for implementing models of care which effectively use technology and best practice to provide better care and access for customers.
Major facilities and equipment in the system need to be managed within a national asset management plan, with transparent decision making, within a longer term capital funding path which encourages system-wide over local prioritisation.
Moving towards final recommendations Clearly this summary cannot do justice to the breadth of input and analysis incorporated into the body of the report. It does however point to the direction of the work the review will be focusing on during the next phase of its deliberations.
The interim report details a number of questions which need answers before recommendations for action can be finalised. The process now will be to engage again to develop that detail.
The challenge and opportunity now is to build on the foundations of the existing system and leverage the commitment of those involved, and the service and innovations delivered, to create a more responsive, equitable and adaptable health and disability system.
INTERIM REPORT | PŪRONGO MŌ TĒNEI WĀ
PAGE | 7
Section A: Overview and context / Tirohanga whānui me te horopaki

NEW ZEALAND HEALTH AND DISABILITY SYSTEM REVIEW | HAUORA MANAAKI KI AOTEAROA WHĀNUI
PAGE | 8
1 Background / He whakamārama
Future-proofing our health and disability system Aotearoa New Zealand’s health and disability system has many strengths. As a whole, New Zealanders are living longer and healthier lives, with high levels of self-rated health and wellbeing and good access to acute and emergency care. A dedicated health and disability workforce delivers support and services each day to thousands of individuals and their whānau across an extensive hospital, community, and home-based network. By international standards New Zealand’s expenditure on health as a proportion of gross domestic product is in the mid-range of OECD countries, and its outcomes on several key metrics, such as life expectancy at birth, are comparable (Figure 1.1).
F I G U R E 1 . 1 : L I F E E X P E C T A N C Y A T B I R T H
NZ
81.7years
OECD
80.6years
Japan
83.9years
74.5years
Lithuania
S O U R C E : O E C D / W O R L D H E A L T H O R G A N I Z A T I O N 2 0 1 8 .
The system, however, is under pressure and does not cater well for all. Despite progress, outcomes are not
equitable across populations and life course, particularly for Māori, Pacific peoples, disabled people, and
people experiencing poverty. Rural New Zealanders also look for sustainable and equitable access to health
and disability services. As has been signalled in recent reviews and inquiries, New Zealanders’ mental
INTERIM REPORT | PŪRONGO MŌ TĒNEI WĀ
PAGE | 9
health outcomes are of particular concern, and the populations being underserved by the health and disability system are, in most instances, the same populations being underserved by other systems. Focusing on what New Zealanders value to improve their health and wellbeing remains critical including quality, diversity, transparency, and the timeliness of the system.
The current complex mix of governance, accountability, business arrangements, and workforce cannot deliver the responsive and smart system New Zealanders require for future health and wellbeing. A rapidly changing social, environmental, technological, and economic landscape, coupled with sizeable demographic shifts, severely threatens sustainability.
The New Zealand Health and Disability System Review / Hauora Manaaki ki Aotearoa Whānui (the Review) was established to respond to these and other challenges.
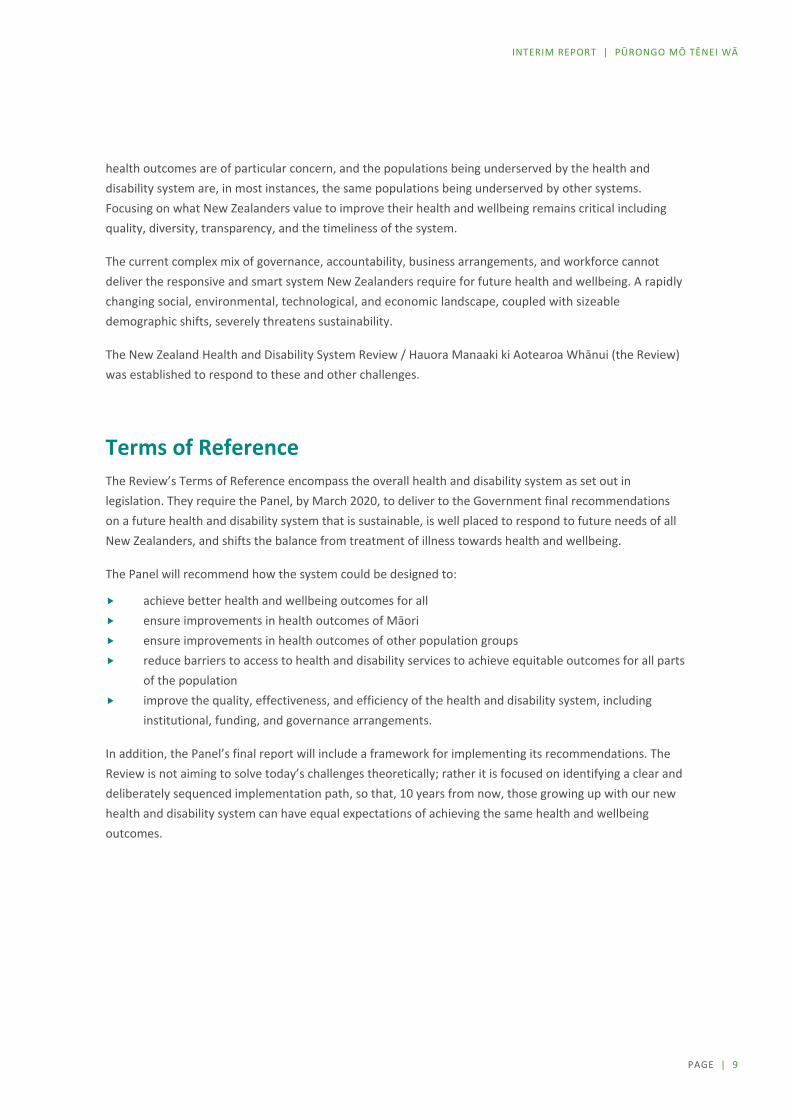
Terms of Reference The Review’s Terms of Reference encompass the overall health and disability system as set out in legislation. They require the Panel, by March 2020, to deliver to the Government final recommendations on a future health and disability system that is sustainable, is well placed to respond to future needs of all New Zealanders, and shifts the balance from treatment of illness towards health and wellbeing.
The Panel will recommend how the system could be designed to:
achieve better health and wellbeing outcomes for all ensure improvements in health outcomes of Māori ensure improvements in health outcomes of other population groups reduce barriers to access to health and disability services to achieve equitable outcomes for all parts
of the population improve the quality, effectiveness, and efficiency of the health and disability system, including
institutional, funding, and governance arrangements.
In addition, the Panel’s final report will include a framework for implementing its recommendations. The Review is not aiming to solve today’s challenges theoretically; rather it is focused on identifying a clear and deliberately sequenced implementation path, so that, 10 years from now, those growing up with our new health and disability system can have equal expectations of achieving the same health and wellbeing outcomes.

NEW ZEALAND HEALTH AND DISABILITY SYSTEM REVIEW | HAUORA MANAAKI KI AOTEAROA WHĀNUI
PAGE | 10
Outside the scope of the Review are:
the accident compensation scheme (although the relationship between the health and disability system and the compensation scheme is in scope)
the Pharmaceutical Management Agency (PHARMAC) (although the relationship between the health and disability system and PHARMAC is in scope)
private health insurance (although its interaction with demographic drivers of health care need is in scope)
the MidCentral Prototype (for disability service delivery) that is under way (although lessons from this work will be considered when the Review’s recommendations are developed).
The full Terms of Reference are in Appendix A online.
The Minister of Health appointed Heather Simpson to chair the Review and lead an Expert Panel to identify opportunities to improve the performance, structure, and sustainability of the system with a goal of achieving equity of outcomes and contributing to wellness for all, particularly Māori and Pacific peoples.
Expert Review Panel
Heather Simpson (Chair) Dr Winfield Bennett Shelley Campbell Professor Peter Crampton Dr Lloyd McCann Sir Brian Roche Dr Margaret Southwick.
The Panel appointed a Māori Expert Advisory Group to support the Review and to help ensure that the advice it provides appropriately incorporates Māori views, including those relating to hauora (health and wellbeing) and mātauranga Māori (knowledge), in order to improve Māori health outcomes, equity, and broader wellbeing.
Māori Expert Advisory Group
Sharon Shea (Chair) Dr Dale Bramley Associate Professor Terryann Clark Associate Professor Sue Crengle Takutai Moana Natasha Kemp Linda Ngata.
INTERIM REPORT | PŪRONGO MŌ TĒNEI WĀ
PAGE | 11
Meaningful implementation of te Tiriti o Waitangi / the Treaty of Waitangi Te Tiriti o Waitangi / the Treaty of Waitangi places obligations on the Crown regarding the health of Māori communities. Both Māori and non-Māori are seeking meaningful implementation of te Tiriti/the Treaty. This was widely discussed at our wānanga and during wider stakeholder engagement. Submissions also discussed the role and importance of honouring te Tiriti/the Treaty as being essential to improving Māori health outcomes. Several submissions also argued that failure to achieve equity for Māori is a breach of articles 23 and 24 of the United Nations Declaration of the Rights of Indigenous People.
Currently, the Government is considering new provisions to strengthen the Crown–Māori relationship within an updated Public Service Act. The Waitangi Tribunal / Te Rōpū Whakamana i te Tiriti o Waitangi also recently published its initial report from stage 1 of the Health Services and Outcomes Kaupapa Inquiry. The findings from this inquiry echo many of the challenges and solutions we heard from Māori during Phase One.
A key focus for the final recommendations of this Review will be to consider how the system can embed rangatiratanga (authority, ownership, leadership), and mana motuhake (self-determination, autonomy) appropriately throughout the system.
Chapter 3: Hauora Māori raises issues, challenges and opportunities heard during Phase One – these are also threaded throughout this report.
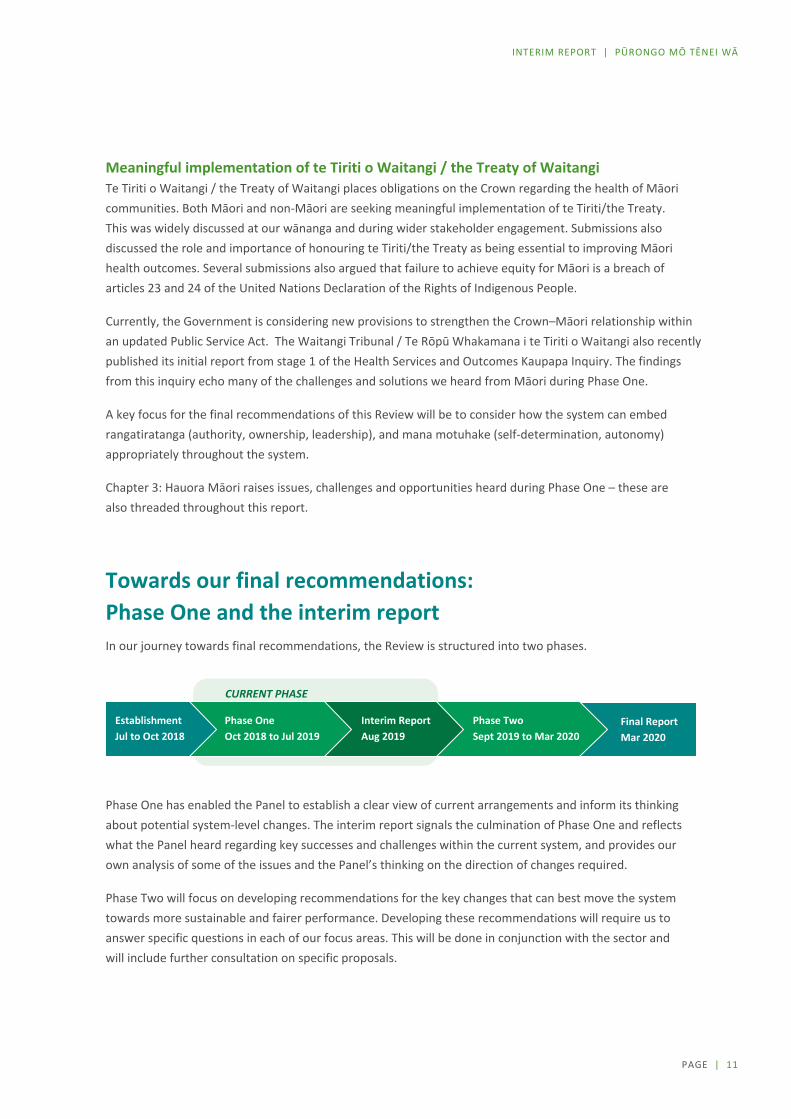
Towards our final recommendations: Phase One and the interim report In our journey towards final recommendations, the Review is structured into two phases.
Phase One has enabled the Panel to establish a clear view of current arrangements and inform its thinking about potential system-level changes. The interim report signals the culmination of Phase One and reflects what the Panel heard regarding key successes and challenges within the current system, and provides our own analysis of some of the issues and the Panel’s thinking on the direction of changes required.
Phase Two will focus on developing recommendations for the key changes that can best move the system towards more sustainable and fairer performance. Developing these recommendations will require us to answer specific questions in each of our focus areas. This will be done in conjunction with the sector and will include further consultation on specific proposals.
Final Report Mar 2020
Phase Two Sept 2019 to Mar 2020
Interim Report Aug 2019
Phase One Oct 2018 to Jul 2019
Establishment Jul to Oct 2018
CURRENT PHASE

NEW ZEALAND HEALTH AND DISABILITY SYSTEM REVIEW | HAUORA MANAAKI KI AOTEAROA WHĀNUI
PAGE | 12
E N G A G E M E N T D U R I N G P H A S E O N E
met with over 300 organisations, workforce representatives, boards, consumer and disabled people’s representatives, government, professional and allied health bodies, and provider, business and private hospitals groups
visited District Health Boards (DHBs) and met with representatives from their districts
received over 650 written submissions (online, email and delivered) in response to the public request for feedback. Our survey was available in English, te reo Māori, NZ sign language and easy read.
held wānanga with over 300 Māori leaders, specialists, researchers, and healthcare providers across four locations (Kaikohe, Rotorua, Wellington, and Dunedin)
met with Pacific health leaders and organisations held workshops focusing on the provision of home and community health and
disability services across four locations (Auckland, Hamilton, Palmerston North, and Christchurch)
met with international healthcare organisations and service providers, including the NHS (United Kingdom), Norwegian Healthcare, Nuka System of Care (Alaska), First Nations Health Authority (Canada), Intermountain Healthcare (United States), and Kaiser Permanente (United States)
commissioned reports from government departments and external agencies.
INTERIM REPORT | PŪRONGO MŌ TĒNEI WĀ
PAGE | 13
2 People and communities / Ngā tāngata me ngā hapori
The health and disability system exists only to serve the needs of New Zealanders and their communities. Consideration of system changes to effectively address inequities requires us to have a good understanding of population characteristics both now and in the future. We need to understand what is driving inequity, what global trends are likely to impact the system, and what people think.
A diverse population Aotearoa New Zealand is a diverse society with a large indigenous Māori population, and a range of other cultures, including significant Pacific and Asian populations, and a majority New Zealand European/Pākehā population. Around 10% of New Zealanders identify with more than one of these ethnic groups. There is also a small but growing Middle Eastern, Latin American, and African (MELAA) population (Figure 2.1).
New Zealand officially recognises three languages (English, te reo Māori and New Zealand Sign Language). Almost one-fifth of the population is multilingual (with one in five multilingual speakers having te reo as one of their languages).
As the indigenous population, Māori are highly connected through whakapapa (kinship ties), and the wellbeing of individuals is strongly associated with the wellbeing of the wider whānau (family). Irrespective of where they reside, most Māori hold strong connections and sense of belonging to their tūrangawaewae (ancestral lands) and marae, and their ability to access and participate in Te Ao Māori (Māori world view). These familial and cultural connections provide a strong and enduring sense of identity and are prerequisites to good health.1

PAGE | 14
NEW ZEALAND HEALTH AND DISABILITY SYSTEM REVIEW | HAUORA MANAAKI KI AOTEAROA WHĀNUI
F I G U R E 2 . 1 : S H A R E O F P O P U L A T I O N B Y E T H N I C G R O U P , 2 0 1 8
Note: Shares do not sum to 100% as people can identify with more than one ethnic group.
S O U R C E : S T A T S N Z , P O P U L A T I O N P R O J E C T I O N S .
Pacific peoples are a youthful and diverse population made up of more over 16 distinct ethnic groups with different, languages and cultures. The five largest groups in New Zealand are Samoan (49%), Cook Island Māori (21%), Tongan (20%), Niuean (8%), and Fijian (5%). Samoan is the third most common language spoken in New Zealand. One in four Pacific people (and 40% of Pacific children aged 0-4) identify with more than one ethnic group (compared with 7% of non-Pacific people).2
Although from many different countries, Pacific peoples share cultural values such as:
the central place of family (which contributes to identity and feelings of belonging) collectivism and communitarianism (everyone working together to achieve common goals) the importance of spirituality (attributing life events to a higher power) reciprocity (mutual help and interdependence) respect (particularly towards elders, parents, women, and people in positions of authority).
The Asian population is very broad, comprising ethnic groups from Afghanistan to Japan. Despite this diversity, Asian New Zealanders share common values, such as those based on family, education, and community ties.3 They also share the experience of negotiating between traditional values and those of the dominant Pākehā culture.4 Although 77% of the Asian population is overseas-born, Asian communities have been present in New Zealand since the 1800s. The largest groups are Chinese (35%), Indian (30%), Filipino (9%), and South Korean (6%). Only 1% of the total New Zealand population identify with at least one MELAA ethnicity.
European New Zealanders are people of European descent, including British and Irish, and people indirectly of European descent, including North Americans, South Africans, Canadians, and Australians. In the 2013 census, at least 74% of the New Zealand population identified with one or more European ethnicities.

INTERIM REPORT | PŪRONGO MŌ TĒNEI WĀ
PAGE | 15
New Zealand accepts around 1,000 refugees and 150 asylum seekers from diverse backgrounds annually.
New Zealand is also becoming more religiously diverse. Other than Christians groups, the large religious groups include Hindu (90,000), Buddhist (60,000), Muslim (50,000), Sikh (20,000) and Jewish (7,000). Non-Christian religious groups have grown from 4% of the population in 2001 to around 6% (2013). Around 40% of those in Asian ethnic groups affiliate with a religion other than Christianity. Given that Asian populations are projected to increase by over half a million over the next two decades, New Zealand is likely to become more religiously diverse.
One in four New Zealanders identifies as disabled A quarter of New Zealanders live with one or more disabilities – 11% of children (14% of Māori children), 21% of young and working age people (32% of Māori young and working age), and 59% of seniors (62% of Māori seniors).
There is no precise definition of disability, rather, similar to ethnicity, it is self-identified, and the term broadly encompasses wide variations of physical, mental, sensory, communication, and other impairments, and their effects on people’s lives. Definitions in use uniformly include two broad aspects: impairment, and social and environmental impacts (such as discrimination and limits to accessibility).
Māori have significantly higher rates of disability across all age groups, and Pacific peoples have slightly higher rates. Higher rates of disability are also found in families with low incomes and people living in communities experiencing high socioeconomic deprivation. For example, in 2013, disabled people had an 80% higher rate of living in a low-income household than all people.
Ethnic populations have different age distributions
F I G U R E 2 . 2 : D I S T R I B U T I O N O F N E W Z E A L A N D ’ S P O P U L A T I O N , 2 0 1 8
Note: MELAA = Middle Eastern, Latin American, and African.
S O U R C E : S T A T S N Z , P O P U L A T I O N P R O J E C T I O N S .

PAGE | 16
NEW ZEALAND HEALTH AND DISABILITY SYSTEM REVIEW | HAUORA MANAAKI KI AOTEAROA WHĀNUI
Age distribution differs greatly between ethnic groups. Māori and Pacific peoples are significantly younger on average than the European population, with over half being under 25 years. The European population is older on average, and this difference becomes more pronounced with age. The Asian population has a higher proportion of people aged 20–39, reflecting large inward migration in these age groups. (See Figure 2.3).
F I G U R E 2 . 3 : A G E D I S T R I B U T I O N O F E U R O P E A N , M Ā O R I , P A C I F I C , A N D A S I A N P O P U L A T I O N S , 2 0 1 8
S O U R C E : S T A T S N Z , P O P U L A T I O N P R O J E C T I O N S .
Urban and rural living arrangements vary by ethnicity Roughly a third of New Zealand’s population lives in the Auckland council area, a third in other city council areas, and a third in district council areas (non-city areas). However, this split of population masks significant differences across ethnic groups.
Over 60% of the Pacific and Asian populations live in Auckland, compared with only one-third of the total population (see Figure 2.4). Auckland’s Pacific population is also highly concentrated with almost one-third in just three of 21 Auckland local board areas: Māngere-Ōtāhuhu, Ōtara–Papatoetoe, and Manurewa.
Only 12% of the Asian population and 14% of the Pacific population live in district council areas (non-city areas). In contrast, Māori are less likely to live in main urban areas, with just under half living in district council areas.

INTERIM REPORT | PŪRONGO MŌ TĒNEI WĀ
PAGE | 17
F I G U R E 2 . 4 : S H A R E O F P O P U L A T I O N B Y E T H N I C I T Y A N D D I S T R I C T A R E A , 2 0 1 8
S O U R C E : S T A T S N Z , P O P U L A T I O N P R O J E C T I O N S .
Socioeconomic deprivation varies by ethnicity and location Māori and Pacific peoples are significantly more likely to live in areas of high socioeconomic deprivation than are other populations. Forty percent of Māori and over half of the Pacific population live in the two most deprived areas (deciles 9 and 10). Although by population size, the largest ethnic group to live in deciles 9 and 10 is New Zealand European, by proportion this group tends to live in less deprived areas. New Zealand’s Asian population is relatively evenly distribution across socioeconomic deprivation deciles. (See Figure 2.5)
F I G U R E 2 . 5 : S O C I O E C O N O M I C D E P R I V A T I O N D E C I L E – E T H N I C I T Y D I S T R I B U T I O N , 2 0 1 3
S O U R C E : S T A T S N Z , C E N S U S D A T A .

PAGE | 18
NEW ZEALAND HEALTH AND DISABILITY SYSTEM REVIEW | HAUORA MANAAKI KI AOTEAROA WHĀNUI
F I G U R E 2 . 6 : S O C I O E C O N O M I C D E P R I V A T I O N , D E C I L E S 9 A N D 1 0 , B Y E T H N I C I T Y , 2 0 1 3
Note: MELAA = Middle Eastern, Latin American, and African.
S O U R C E : S T A T S N Z , C E N S U S 2 0 1 3 .
Some regions of New Zealand have significantly higher rates of socioeconomic deprivation than others. In general, the North Island has more areas of high socioeconomic deprivation. Over a third of the population in Northland and nearly half of the population in Gisborne live in the highest socioeconomic deprivation quintile (10). Large populations also live in deprived urban areas that are less prominent in Figure 2.7.
Figure 2.7 also shows areas of socioeconomic deprivation in Auckland. Almost all of south Auckland is in the four highest deciles of socioeconomic deprivation (7–10), with large areas in the highest decile of deprivation (10). Significant parts of west Auckland also have high socioeconomic deprivation. Small pockets of high deprivation occur in central Auckland and the North Shore.
Other population-based characteristics intersect with demographics and can influence health behaviours and outcomes. These characteristics include family composition, living arrangements, sexual and gender identity, religious affiliation, life course, and occupation.

INTERIM REPORT | PŪRONGO MŌ TĒNEI WĀ
PAGE | 19
F I G U R E 2 . 7 : A R E A S B Y D E P R I V A T I O N D E C I L E , 2 0 1 3
S O U R C E : U N I V E R S I T Y O F A U C K L A N D , I N D E X O F M U L T I P L E D E P R I V A T I O N .

PAGE | 20
NEW ZEALAND HEALTH AND DISABILITY SYSTEM REVIEW | HAUORA MANAAKI KI AOTEAROA WHĀNUI
Changes to population and communities The next 20 years will bring sizeable shifts to New Zealand’s population in terms of age, ethnicity, and geographic spread. In addition to demographic shifts, environmental, social, technological, and cultural changes will provide both opportunities and pressures on the sustainability and efficiency of the health and disability system.
F I G U R E 2 . 8 : D I S T R I B U T I O N O F N E W Z E A L A N D ’ S P O P U L A T I O N , 2 0 3 8
Note: MELAA = Middle Eastern, Latin American, and African.
S O U R C E : S T A T S N Z , P O P U L A T I O N P R O J E C T I O N S .
T A B L E 2 . 1 : P O P U L A T I O N C H A N G E B Y A G E A N D E T H N I C I T Y , 2 0 1 8 – 2 0 3 8
2018 2038 Change
European 3,489,100 72% 3,781,400 66% 292,300 8%
Māori 765,900 16% 1,059,400 18% 293,500 38%
Asian 749,900 15% 1,272,200 22% 522,300 70%
Pacific 389,700 8% 590,200 10% 200,500 51%
MELAA 77,500 2% 171,400 3% 93,900 121%
0-24 1,613,100 33% 1,669,500 29% 56,400 3%
25-44 1,284,600 26% 1,467,400 25% 182,800 14%
45-64 1,219,200 25% 1,329,300 23% 110,100 9%
65-84 661,000 14% 1,089,300 19% 428,300 65%
85+ 86,800 2% 214,100 4% 127,300 147%
Total 4,864,700 5,769,600 904,900 19%
Note: MELAA = Middle Eastern, Latin American, and African. Ethnicity does not sum to 100% as people can identify with more than one ethnic group.
S O U R C E : S T A T S N Z , P O P U L A T I O N P R O J E C T I O N S .

INTERIM REPORT | PŪRONGO MŌ TĒNEI WĀ
PAGE | 21
New Zealand’s population is getting older and more ethnically diverse New Zealand’s population is projected to grow by almost 1 million people over the next two decades. Over half of this increase will identify with an Asian ethnicity.
Table 2.1 shows how the age distribution of New Zealand is projected to change over 20 years. In 2038, a larger share of the population will be aged over 64, and a smaller share of the population will be aged under 30. This trend is seen across all ethnic groups, but is most pronounced for the Asian population. Although Māori and Pacific populations are projected to be older, they will still be younger on average and make up a smaller share of the older population. For example, by 2038, the Māori and Pacific populations are projected to make up 6% and 3%, respectively, of the population aged 85 and over.
New Zealand will still have a significant rural population in 20 years Although around half of the population growth over the next 20 years will be in Auckland (increasing Auckland’s population by 23%), rural areas are projected to grow slightly faster than other main urban areas at 14% (an increase of 100,000 people on current numbers). (Figure 2.9).
F I G U R E 2 . 9 : P R O J E C T E D I N C R E A S E I N P O P U L A T I O N B Y A R E A , 2 0 1 8 T O 2 0 3 8
S O U R C E : S T A T S N Z , P O P U L A T I O N P R O J E C T I O N S .
Future workforce a smaller share With the population as a whole ageing, a smaller share of the population will be available for the workforce. However, the extent of this change depends on labour force participation rates.
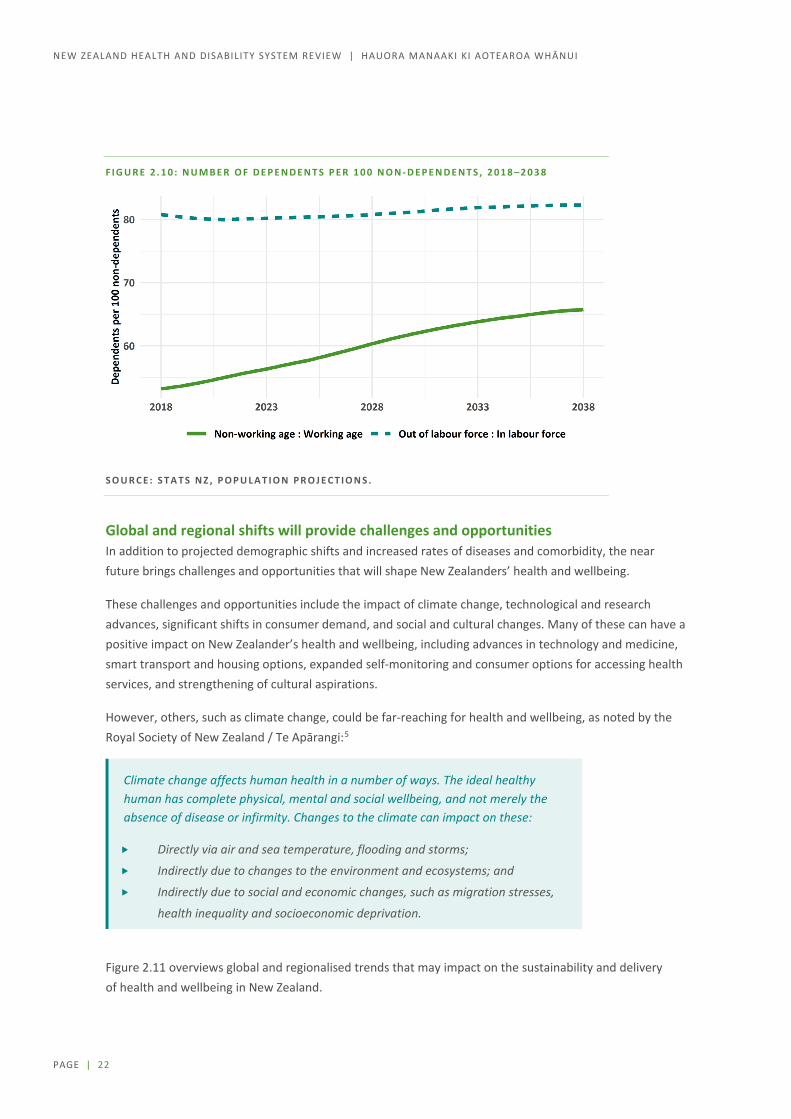
Comparing the working age population (15–64 years) with the non-working age population (0–14, and 65 and over) shows a significant increase in the ‘dependency ratio’, from 55 dependents to 100 workers in 2018, to 65 dependents to 100 workers in 2038 (see Figure 2.10). However, projections from Stats NZ assume more people will stay in paid work past the age of 65, making the increase in the dependency ratio smaller.
Regardless of which projection is more accurate, the health and disability system will need to do a better job of attracting new workers and ensuring the existing workforce is effective even as they age.
PAGE | 22
NEW ZEALAND HEALTH AND DISABILITY SYSTEM REVIEW | HAUORA MANAAKI KI AOTEAROA WHĀNUI
F I G U R E 2 . 1 0 : N U M B E R O F D E P E N D E N T S P E R 1 0 0 N O N - D E P E N D E N T S , 2 0 1 8 – 2 0 3 8
S O U R C E : S T A T S N Z , P O P U L A T I O N P R O J E C T I O N S .
Global and regional shifts will provide challenges and opportunities In addition to projected demographic shifts and increased rates of diseases and comorbidity, the near future brings challenges and opportunities that will shape New Zealanders’ health and wellbeing.
These challenges and opportunities include the impact of climate change, technological and research advances, significant shifts in consumer demand, and social and cultural changes. Many of these can have a positive impact on New Zealander’s health and wellbeing, including advances in technology and medicine, smart transport and housing options, expanded self-monitoring and consumer options for accessing health services, and strengthening of cultural aspirations.
However, others, such as climate change, could be far-reaching for health and wellbeing, as noted by the Royal Society of New Zealand / Te Apārangi:5
Climate change affects human health in a number of ways. The ideal healthy human has complete physical, mental and social wellbeing, and not merely the absence of disease or infirmity. Changes to the climate can impact on these:
Directly via air and sea temperature, flooding and storms;
Indirectly due to changes to the environment and ecosystems; and
Indirectly due to social and economic changes, such as migration stresses,
health inequality and socioeconomic deprivation.
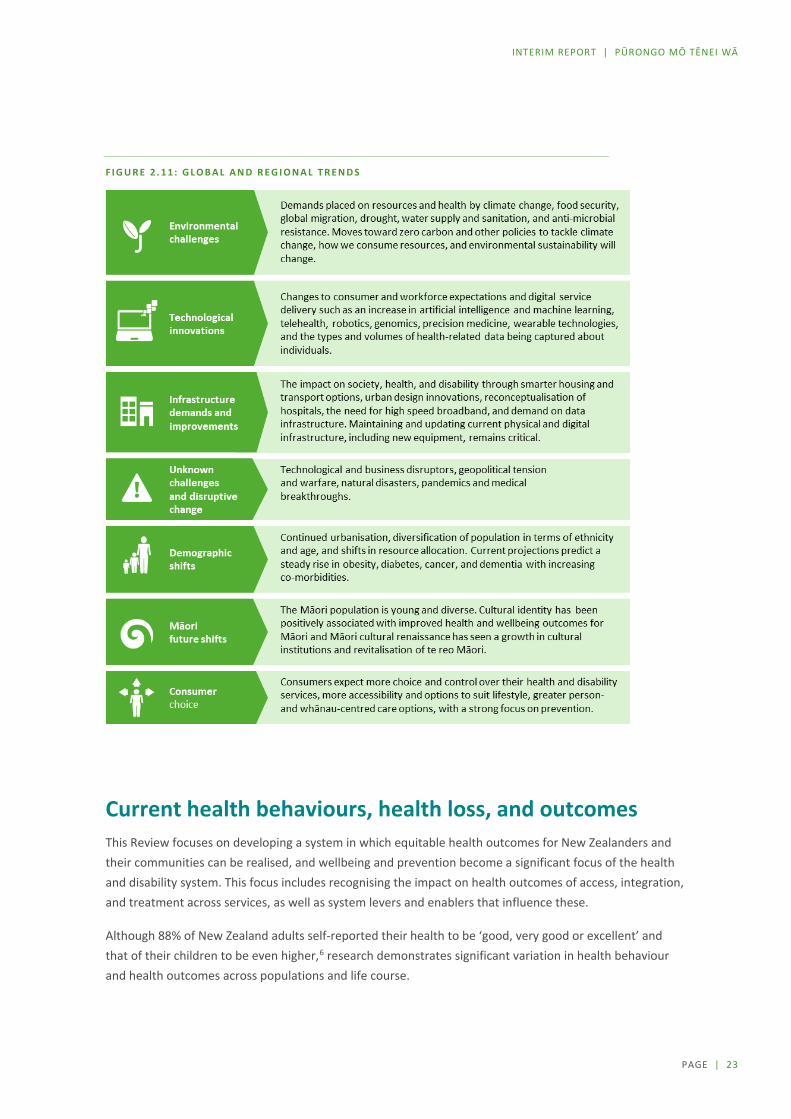
Figure 2.11 overviews global and regionalised trends that may impact on the sustainability and delivery of health and wellbeing in New Zealand.
INTERIM REPORT | PŪRONGO MŌ TĒNEI WĀ
PAGE | 23
F I G U R E 2 . 1 1 : G L O B A L A N D R E G I O N A L T R E N D S
Current health behaviours, health loss, and outcomes This Review focuses on developing a system in which equitable health outcomes for New Zealanders and their communities can be realised, and wellbeing and prevention become a significant focus of the health and disability system. This focus includes recognising the impact on health outcomes of access, integration, and treatment across services, as well as system levers and enablers that influence these.
Although 88% of New Zealand adults self-reported their health to be ‘good, very good or excellent’ and that of their children to be even higher,6 research demonstrates significant variation in health behaviour and health outcomes across populations and life course.

PAGE | 24
NEW ZEALAND HEALTH AND DISABILITY SYSTEM REVIEW | HAUORA MANAAKI KI AOTEAROA WHĀNUI
In Aotearoa New Zealand, people have differences in health that are not only avoidable but unfair and unjust. Equity recognises different people with different levels of advantage require different approaches and resources to get equitable health outcomes. (Ministry of Health)
Insight into health loss The most recent data (2013) shows that three categories of conditions account for over half (53%) of all health loss in the total New Zealand population with some variation across gender, age, ethnicity, and life course.7 These conditions are:
neuropsychiatric disorder (number one health loss in 19% of the population), includes neurological disorders, mental disorders, and addiction disorders
cancers (number two health loss, 17% of population), includes benign and malignant neoplasms cardiovascular disease and diabetes (number three health loss, 17% of population), includes cardiac
and vascular diseases and diabetes mellitus (which is included in the definition because much diabetes-related health loss is vascular in nature).
Conditions causing health loss vary across the life course. For example, the number one health loss for:
children (mainly under-fives) is from neonatal, nutritional deficiency, infectious disorders and birth defects (40% of health loss in children)
young people and young adults is from neuropsychiatric disorders (35% and 31%, respectively) adults into middle age is from cancer (23%) older people is from cardiovascular disorders including diabetes (28%).
New Zealand’s mental health challenges and suicide rates remain high, recognised by the Government’s recent acceptance of many recommendations from the Government Inquiry into Mental Health and Addiction.8 Suicide rates remain higher for males than females, for Māori than non-Māori, and for people in rural areas than in urban areas.9 Patterns of use for both inpatient and community mental health specialist services show higher rates for Māori, Pacific peoples, recently released prisoners, young people (13–24 years), and people who identify as LGBTQIA+.10
The Global Burden of Disease study provides insights into health behaviours that have contributed most to ill health and mortality in New Zealand over the past 25 years and require population-level approaches to prevent. The five leading risk factors in 2016 were:
being overweight (a high body mass index) dietary risks tobacco use high blood pressure alcohol and other drug use.

INTERIM REPORT | PŪRONGO MŌ TĒNEI WĀ
PAGE | 25
Socioeconomic deprivation and wider determinants of health Although many people continue to consider health care in the context of clinical and medical care only, it is widely acknowledged that this accounts for only about 20% of a person’s health and wellbeing status. The other 80% arises from the conditions in which a person is born, grows, lives, works, and ages, including physical, cultural and natural environments, housing, education, the distribution of power and income, and health behaviours.11 The impacts of these can accumulate over a life time.
A strong body of evidence shows that tackling the determinants of health and wellbeing will improve equity across a variety of societal outcomes.12 In the New Zealand context, we also need to overlay cultural determinants (eg. cultural identity), and the negative impacts of racism and colonisation.
F I G U R E 2 . 1 2 : F A C T O R S T H A T I N F L U E N C E O U R H E A L T H A N D W E L L B E I N G
S O U R C E : I N S T I T U T E F O R C L I N I C A L S Y S T E M S I M P R O V E M E N T , 2 0 1 4 .
Socioeconomic deprivation, including poverty, income deprivation, and material deprivation, is a significant social determinant. One of the main determining factors of poverty and income is employment status.
Of all ethnic groups in New Zealand, Pacific peoples are amongst those most affected by inequities in the socioeconomic determinants of health, including living in areas of high socioeconomic deprivation, being unemployed, and having low weekly earnings (see Table 2.2). These factors can affect health directly (for example, through damp, cold, and overcrowded conditions, which increase the transmission of infectious diseases) and indirectly (for example, by limiting opportunities to engage in health-promoting behaviours).

PAGE | 26
NEW ZEALAND HEALTH AND DISABILITY SYSTEM REVIEW | HAUORA MANAAKI KI AOTEAROA WHĀNUI
T A B L E 2 . 2 : S O C I A L D E T E R M I N A N T S O F H E A L T H , P A C I F I C C O M P A R E D W I T H T O T A L P O P U L A T I O N
Population
Labour force participation
rate1 (%)
Unemploy-ment1
(%)
Living in areas of high deprivation2
(%)
Median weekly
earnings3
Home ownership4
(%)
Over-crowding4
(%)
English language
speakers5 (%)
Pacific 65.4 9.0 55.6 $485 18.5 23.7 89.0
Total 70.4 4.2 20.0 $670 50.2 2.7* 90.1
Notes : 1, 2, 4, 5 Stats NZ. 2019. Labour market statistics. Stats NZ census data. 3 Median weekly earnings and household overcrowding compared with New Zealand Europeans.
S O U R C E : D R Y A N , G R E Y , C , A N D M I S C H E W S K I , B . 2 0 1 9 . T O F A S A I L I : A R E V I E W O F E V I D E N C E A B O U T H E A L T H E Q U I T Y F O R P A C I F I C P E O P L E S I N N E W Z E A L A N D . W E L L I N G T O N : P A C I F I C P E R S P E C T I V E S .
F I G U R E 2 . 1 3 : R A T E R A T I O F O R M E N T A L H E A L T H S E R V I C E U S E
B Y D E P R I V A T I O N Q U I N T I L E , 2 0 1 8
SOURCE: S GIBB AND R CUNNINGHAM. 2018. MENTAL HEALTH AND ADDICTION IN AOTEAROA NEW ZEALAND: RECENT TRENDS IN SERVICE USE, UNMET NEED, AND INFORMATION GAPS. MENTAL HEALTH AND ADDICTION INQUIRY. https://www.mentalhealth.inquiry.govt.nz/assets/Summary-reports/Otago-mental-health.pdf
1
10
Inpatient Outpatient Crisis Forensic Addiction Emergency dept Support
Rate ratio
Quintile 2 Quintile 3 Quintile 4 Quintile 5 (most deprived)

INTERIM REPORT | PŪRONGO MŌ TĒNEI WĀ
PAGE | 27
Disabled New Zealanders report, on average, lower life satisfaction, being more likely to live in low-income households, and having poorer outcomes across health, economic, and social indicators.13 Disabled people have half the employment rate of non-disabled people, with younger disabled people (15–24 years) having only one-quarter of the employment rate as their non-disabled peers. Disabled children are more likely to be in households that are under low-household income thresholds, that report having not enough or just enough money, and having one parent.
The compounding effects of socioeconomic deprivation on health outcomes are well researched.14 For example, people living in more socioeconomically deprived areas are 2.5 times more likely to experience psychological distress than those in less deprived areas (adjusting for age, gender, and ethnicity).15 The rates of mental health service use is also significantly higher among those from high socioeconomic deprivation quintiles (Figure 2.13).16
Intersections between ethnicity, socioeconomic deprivation, age, disability, and geographic location exacerbate inequitable outcomes and access to healthcare.
Variations in access to primary care services Timely access to primary services is important for reducing health inequities, preventing the development of health conditions, avoiding hospitalisation, and ensuring the system as a whole works for optimal health and wellbeing. Research notes barriers to access include cost, availability of appointments, and transport, but experience, health literacy, and cultural factors can often prevent people from seeking help until their condition worsens and requires urgent care.17 One-third of New Zealanders over the age of 15 experienced one or more types of unmet need for primary health care in the past 12 months.18
Cost barriers include not only the cost of the appointment but also the cost of transport or unpaid time taken off from work. Policies that have made GP visits free for children have positively improved access and attendance rates. However inequities remain for some groups, indicating challenges beside financial strain.
Pacific enrolment in primary care is high, and the Pacific GP utilisation rate is similar to that of non-Māori non-Pacific people. However, the New Zealand Health Survey also shows that Pacific peoples experience very high rates of unmet need for care compared with the total New Zealand population. About one-third (33%) of Pacific peoples report not seeing their primary care practitioner when needed, with most of this unmet need being related to cost. Similarly, 18% of Pacific peoples report not filling a prescription because of cost. Given the high rates of chronic conditions and multimorbidity among Pacific peoples, this data indicates that significant financial barriers to optimal medical management of long-term conditions remain.

PAGE | 28
NEW ZEALAND HEALTH AND DISABILITY SYSTEM REVIEW | HAUORA MANAAKI KI AOTEAROA WHĀNUI
Māori health outcomes Clear disparities in health outcomes exist for Māori. Life expectancy remains one key indicator. On average, Māori live seven years less than non-Māori non-Pacific people (see Table 2.3). Māori life expectancy tends to be lower in DHB areas with higher levels of socioeconomic deprivation, ranging from 73 years in Lakes and Northland DHBs to 80 years in Waitematā DHB. Similarly the gap in life expectancy between Māori and non-Māori non-Pacific is highest in DHB areas with higher levels of socioeconomic deprivation. Life expectancy of non-Māori and non-Pacific varies less across DHB areas.
For Māori, inequities of health span the life course.19 Examples include:
childhood immunisation rates have fallen since 2014, with 15% lower rates among Māori than non-Māori
Māori children with asthma are more likely to receive suboptimal asthma control with less preventative medication being prescribed, potentially contributing to the 30% higher hospitalisation rate for asthma in Māori children
adult Māori are more likely than adult non-Māori to wait longer than three months for an appointment to see a specialist
older Māori are more likely to be prescribed a combination of medications than older non-Māori, increasing their risk of acute kidney injury
following a hip fracture, the proportion of Māori having an operation on the day of admission to hospital or the next day has decreased steadily since 2013, while the rate for non-Māori has steadily improved.20
Health equity for Māori is substantially influenced by the unequal distribution of the social and economic determinants of health. However, healthcare services do have a significant role to play. For Māori, there is evidence that inadequate access to services, poorer quality of care, and a failure of improvements in health services to improve outcomes for Māori can and do lead to inequities in health outcomes.
Feedback from submissions and wānanga noted that improving equity for Māori requires the issues of racism and socioeconomic deprivation to be addressed alongside honouring te Tiriti o Waitangi / the Treaty of Waitangi and supporting community-led responses to Māori health needs.
Chapter 3: Hauora Māori more thoroughly explores the challenges and opportunities we heard from Māori during Phase One of the Review.

INTERIM REPORT | PŪRONGO MŌ TĒNEI WĀ
PAGE | 29
Pacific peoples’ health outcomes In the 2016/17 social wellbeing survey, Pacific peoples were just as likely as New Zealand Europeans to rate their overall life satisfaction as high (66%), their life as worthwhile (73%), and their health as very good or excellent (58%).21 However, research using a variety of data sources has shown long-standing inequities in health outcomes between Pacific and non-Māori non-Pacific peoples in New Zealand.22, 23, 24, Inequities include shorter life expectancy, a higher amenable mortality rate, multimorbidity, and a higher rate of death from cancer compared with non-Māori non-Pacific people (see Table 2.3).25
Pacific childhood immunisation rates are among the highest of all ethnic groups.26 However, persistent health inequities are seen in rates of hospitalisation, chronic respiratory and infectious diseases, and serious skin diseases. For example, the rate of hospitalisation for rheumatic fever, a potentially preventable condition with serious lifelong consequences, is 50 times higher in Pacific children than in New Zealand European children.27
In 2015, the diabetes prevalence rate was 20% for Pacific adults (20–79 years) in New Zealand, the highest of all ethnic groups (Māori 10%, Asian 8%, and New Zealand European 6%) and far above the OECD average of 7%.28 These percentages mask substantial disparities in the prevalence of diabetes by age: by the age of 65, more than half of all Pacific peoples are living with diabetes.
Evidence shows that the burden of risk factors for long-term conditions such as smoking, obesity, hypertension, and infectious diseases are prevalent in Pacific populations, but data is limited on how equitably interventions to address these risk factors and conditions are being provided by the health sector.
Some researchers have noted that Pacific peoples commonly associate health care with treating illness, not prevention or wellbeing, and often feel overwhelmed and disoriented when diagnosed with a health condition. Spirituality is closely related to health and wellbeing, and fatalism (the subjugation of events and actions to destiny) and denial are commonly reported.29
Stakeholders and a significant number of submissions to the Review identified key issues relating to achieving equity of health outcomes for Pacific people, including the need to support and grow Pacific leadership, for partnership with Pacific populations in the design of services, for a people-centred approach to care in the community, to deliberately address access (for example, more accessible transport and more flexible booking practices), for culturally appropriate health promotion, and to strengthen the workforce.
In addition, many challenges exist with presenting a picture of the current state of Pacific health and, more importantly, identifying why disparities in outcomes, problems with access and quality of services, and unmet need persist.30 These challenges are, in part, due to the disparate sources of information that are collected for different purposes, a lack of standardised data related to ethnicity, and the ability to access primary care data by ethnicity. Research has noted there appear to be no secondary care data governance requirements to support a national policy on equity for Pacific peoples.

PAGE | 30
NEW ZEALAND HEALTH AND DISABILITY SYSTEM REVIEW | HAUORA MANAAKI KI AOTEAROA WHĀNUI
T A B L E 2 . 3 : C O M P A R I S O N O F L I F E E X P E C T A N C Y , M O R T A L I T Y , A N D R I S K F A C T O R S B Y E T H N I C I T Y
Notes Category Date Māori Pacific
Non-Māori
non-Pacific New Zealand
Life expectancy
Life expectancy 2015–17 75.6 76.5 82.8 81.7
Life expectancy gap 2015–17 7.2 6.3 - -
Gap attributable to potentially avoidable causes of death (male)
2013–15 5.0 3.4 - -
Gap attributable to potentially avoidable causes of death (female)
2013–15 4.4 3.3 - -
Mortality
1, 3 Mortality rate per 100,000 population 2017 631.3 619.5 339.3 378.6
3 % of deaths potentially avoidable 2013–15 53.0% 47.3% 23.2% 27.3%
1, 3 Amenable mortality rate per 100,000 population* 2015 188.8 179.9 74.7 90.8
1, 3 Cardiovascular disease mortality rate per 100,000 population*
2015 200.8 185.6 99.5 111.1
1, 3 Cancer mortality rate per 100,000 population* 2015 200.9 168.5 113.9 123.5
1, 2 Infant mortality rate per 1,000 live births* 2018 4.7 - 3.3 3.7
1, 3 Suicide rate per 100,000 population* 2013–15 15.9 7.9 9.8 10.9
Hospitalisations
1 Ambulatory sensitive hospitalisations (0–4 years) per 100,000 population*
2018 8,503 12,658 5,519 6,948
1 Ambulatory sensitive hospitalisations (45–64 years) per 100,000 population*
2018 7,794 8,966 3,101 3,916
1 Acute hospital bed days per 1,000 population* 2018 574.1 700.5 341.8 385
Risk factors
4 % adults who are daily smokers 2017/18 31.2% 20.0% 11.7% 13.1%
5 % adults who are current smokers 2017/18 33.5% 22.9% 13.5% 14.9%
6 % adults obese 2017/18 47.5% 65.0% 30.7% 32.2%
7 % children obese 2017/18 16.9% 30.0% 9.8% 12.4%
Notes 1 Rate age standardised except for ambulatory sensitive hospitalisations and infant mortality. 2 Non-Māori non-Pacific includes Pacific in this instance. 3 Mortality rates use year death registered. 4 Non-Māori non-Pacific (excludes Asian) – Asian is 6.5%. 5 Non-Māori non-Pacific (excludes Asian) - Asian is 7.8%. 6 Non-Māori non-Pacific (excludes Asian) – Asian is 15.1%. 7 Non-Māori non-Pacific (excludes Asian) – Asian is 7.0%.
Source: New Zealand Mortality Collection; M Walsh and Grey, C. 2019. The contribution of avoidable mortality to the life expectancy gap in Māori and Pacific populations in New Zealand: A decomposition analysis. New Zealand Medical Journal 132(1,492): 46–60; Statistics NZ (Infoshare); Ministry of Health (National Minimum Dataset and New Zealand Health Survey).
INTERIM REPORT | PŪRONGO MŌ TĒNEI WĀ
PAGE | 31
Health outcomes for disabled people As noted, a quarter of New Zealanders live with disability, and the overall prevalence of disability is rising – both through population growth in older age groups and, more importantly, through increases in disability in adulthood from the effects of long-term conditions such as diabetes and dementia. During Phase One, we heard from organisations that inequities are well documented, yet little progress has been made to address them.
Many health information collections do not collect information about disability, so information about disabled people’s health is limited. However, at an overall population level, research indicates:
50 percent of disabled adults aged 15 and over rate their health as good (excellent, very good or good) compared with 89 percent of non-disabled adults31
people with intellectual disabilities have a life expectancy 18 years shorter for males and nearly 23 years shorter for females than the same sex in the total population, and they have much higher rates of several chronic conditions (from 1.5 times the rate of chronic respiratory disease and cancer to 15 times the rate of dental care in a public hospital). 32
Disabled people are more likely to feel the impacts of the social determinants of health. These are lower employment, having sufficient income, having secure and warm housing, and experiencing higher rates of discrimination.
Rural health outcomes Rural New Zealand is a diverse population, and access to health services varies significantly across New Zealand. Rural populations continue to be resilient and innovative in solutions to health care. However, while data is limited, indications are that people living in rural towns can have poorer health outcomes, including lower life expectancy, than people living in cities or surrounding rural areas, an effect that is accentuated for rural Māori and disabled people.33 As noted, mental health challenges and access to health and support services in rural areas remain a priority.
One challenge when considering equity of health outcomes in rural populations is in the use of rural and urban categorisation, which does not accurately account for the populations that access rural or urban health services. As a result, significant numbers of the population designated as ‘rural’ live near to large urban centres and can access urban health services. Conversely, some small rural communities are grouped with larger centres and defined as ‘independent urban’, despite some communities having fewer than 1,000 residents and accessing rural health services.34
Much of the analysis is, therefore, research based.
A rural health report by the National Health Committee in 2010 concluded that life expectancy and other measures of health status were similar for rural and urban populations. Life expectancy for rural Māori was slightly lower than for urban Māori. Factors identified as contributing to poorer access to health services in rural communities were socioeconomic deprivation, geographical and distance barriers, transport, telecommunications, cost of access to service, and service acceptability.35
Research in 2016 identified disparity in disease rates, access to services, and outcomes when comparing rural and urban communities.36

PAGE | 32
NEW ZEALAND HEALTH AND DISABILITY SYSTEM REVIEW | HAUORA MANAAKI KI AOTEAROA WHĀNUI
Recognising experiences of racism in the health system Racism is a social system based on historical and political inequalities that results in systematic privileging some groups over others.37, 38 Racism can be manifest in three ways: institutional (systemic), interpersonal (personally mediated), and internalised.39 While all three manifestations impact on health, the effects of institutional and personally mediated racism are particularly important.
New Zealand research shows that self-reported experience of racism, including by health professionals, is higher for Māori, Pacific peoples, and Asian peoples than for European/Other people.40, 41, 42, 43, 44
National and international literature consistently highlights a clear link between experiences of racism and negative health outcomes for adults, youth, and children.45 A dose-response relationship between exposure to racism and adverse outcomes has been reported among adults 46 and children. 47 That is, the adverse effects of exposure to racism increase as the amount of racism experienced increases.
What New Zealanders told us during Phase One During Phase One of the Review we heard from New Zealanders across ethnicities, age groups, geographical locations, and occupations. We asked about values, equity, and future improvements to the health and disability system. Unsurprisingly, there was a degree of consistency across themes. Many of the responses we heard during this consultation also reflected those from extensive public engagements of recently completed or ongoing initiatives across other domains including mental health, education, social security, and child wellbeing (see Appendix B online).
New Zealanders told us that their health and wellbeing is important and need to be prioritised and protected, and that it should be everyone’s right to live well with equal opportunities. This includes being empowered to make choices, with respect and without discrimination, and recognising good health requires more than a biomedical response to illness.
We heard that consistency of service access, integration, and treatment across services in the community, home, and hospital were important for all, no matter where a person lives, and that new and innovative ways of delivering services need to cater for modern consumer demands and expectations. This includes access to services that valued a person’s time and were fit for modern society: opening hours that suited consumers, access to information via digital health technology, and using data to enhance health outcomes and provide an integrated experience so people don’t have to repeat their story at each step of their health journey. People understood the value of quality data to improving healthcare, but wanted confidence that their information and privacy were secure.
We were assured that many had good experiences in the health system or with individual staff, but changes were needed to ensure equitable outcomes particularly for Māori, Pacific peoples, and disabled people. Changes included services and a workforce that reflect New Zealand’s diverse population and expansion of whānau-centred care. Some had experienced discrimination and racism within the system and were aware of the need to combat these at personal and institutional levels.
Many wanted the system to be more accountable and transparent, and to be heard, seen, listened to, and treated fairly.

INTERIM REPORT | PŪRONGO MŌ TĒNEI WĀ
PAGE | 33
3 Hauora Māori / Māori health
Tuia a Ranginui e tū iho nei, tuia a Papatuanuku e takoto nei
Tuia te here tangata, ka rongo te pō ka rongo te ao ki te Whei Ao, ki te Ao
Mārama Tihei mauriora!
Māori as tangata whenua are Treaty partners with the Crown. The health and disability system has not served Māori well. It has not properly recognised different world views, different knowledge bases, or different cultural norms. This section aims to help better understand mātauranga Māori, and to learn from what has and has not worked well in the current system for Māori. We reflect on the voices from the wānanga to understand the aspirations of whānau and communities so future changes can be based in a strong and effective partnership.
Whānau and culture are important to Māori wellbeing. Connectedness through whakapapa, the ability to speak te reo and participate in tikanga Māori, as well as being able to access Māori cultural domains, such as marae, are fundamental to a secure cultural identity so that Māori might live as Māori 48, 49
Since the early 1970s, Māori have been experiencing a cultural and economic renaissance that reaffirms Māori tangata whenua status and enduring indigenous rights for Māori in Aotearoa. During this time there was also a reclaiming and reinvigorating of cultural practices and te reo Māori. This in turn has contributed to the burgeoning of Māori-centred development, including establishment of kōhanga reo (preschool), kura kaupapa and whare kura (primary and secondary education), and whare wānanga (tertiary education), which provide education opportunities deeply grounded in Māori tikanga (values and customs), and, importantly, centred on the revitalisation of te reo Māori (Māori language).50
In health too, growth in kaupapa Māori health services has been strong and positive with increasing acceptance that Māori health models and practitioners are critical to improving Māori health outcomes.51 The resurgence and acknowledgement of mātauranga Māori (Māori knowledge) in the health system (discussed later in this chapter) has contributed to a growing awareness in the health system of the different values, beliefs, and approaches Māori apply in their pursuit of health and wellbeing.

PAGE | 34
NEW ZEALAND HEALTH AND DISABILITY SYSTEM REVIEW | HAUORA MANAAKI KI AOTEAROA WHĀNUI
Mātauranga Māori is intrinsically linked to people and the human experience. A critical defining characteristic of mātauranga is its connection to tikanga and te reo Māori, the language in which it is intended to be expressed and conveyed.52
As with other indigenous populations, Māori hold a view of health that is holistic and recognises the relationships between people’s physical wellbeing, their whānau and social connections, spirituality, and the wider physical and social environment as important determinants of wellbeing. This is further supported by being able to lead healthy lifestyles, participate effectively in the economy and wider society, and be able to express self-determination and leadership.53
Whānau has been recognised as the foundational basis of Māori society and communities and a source of strength, support, identity, and wellbeing for Māori individually and collectively.54 Whanaungatanga (kinship relationships) are one of the determinants for Māori life satisfaction. The interdependence of strong relationships between whānau members is an essential element of Māori culture and these relationships have been shown to be important in maintaining both collective and individual wellbeing.55
Cultural identity has also been positively associated with improved health and wellbeing outcomes for Māori. Data collected in 2013 showed that 83% of Māori felt their whānau was doing well, 89% knew their iwi, 55% had some ability to speak te reo Māori (compared with 42% in 2001), and 70% reported that it was at least somewhat important for them to be involved in Māori culture (Figure 3 1). Between 2001 and 2013, there was a large increase in the number of rangatahi (young people) who reported some ability to speak te reo Māori.56
For rangatahi Māori, a strong sense of cultural identity was associated with wellbeing and reduced depression, whereas experiences of racism were associated with poor wellbeing outcomes, increased depression, and higher suicide attempts.57 Similar findings have been identified for Māori adults, where connectedness to whānau and a strong sense of cultural identity are consistently correlated to mental wellbeing.58
F I G U R E 3 1 : M Ā O R I C U L T U R A L W E L L B E I N G I N 2 0 1 3 – P O S T E R
S O U R C E : S T A T I S T I C S N E W Z E A L A N D . 2 0 1 4 . M Ā O R I C U L T U R A L W E L L - B E I N G I N 2 0 1 3 – P O S T E R .

INTERIM REPORT | PŪRONGO MŌ TĒNEI WĀ
PAGE | 35
Mātauranga Māori / Māori knowledge systems All indigenous peoples have their own knowledge systems, reflected to a large extent in their unique languages. But their knowledge systems also reflect longstanding relationships with the environment, with the human life cycle, with social and economic interactions, and with inevitable challenges that arise over time. Together, those dimensions constitute a distinctive heritage and continue to remain foundations for societal change and evolving cultures.
In effect, indigenous knowledge:
reflects indigenous ways of thinking, relating, and discovering links indigenous peoples with their environments and is often inspired by environmental encounters is conveyed within the distinctiveness of indigenous languages and cultural practices.59
Like other indigenous knowledge systems, mātauranga Māori draws on past knowledge so it can be applied to current contexts and realities to support flourishing Māori communities. Like all forms of knowledge, mātauranga Māori is adaptive and represents interconnected and interwoven bodies of knowledge. Māori often assign equal value to mātauranga Māori as to Western knowledge, and when it is applied in settings that are inconsistent with Māori values and guiding principles there is a greater risk for the use of mātauranga to breach the tapu (protections) for the person, the process, or the knowledge itself. Māori assert that it is for this reason Māori leadership and control over the use and application of mātauranga in contemporary health settings is critical to ensure the appropriate protections and processes are in place to protect the integrity of mātauranga in health.60
Mātauranga Māori and kaupapa Māori approaches are synonymous and closely interlinked. Over the decades, leaders in domains such as education, health, and research have explained the principles that underpin kaupapa Māori as being:
tino rangatiratanga – self-determination – independence and control over destiny taonga tuku iho – aspirations and validity of cultural beliefs and practices Ako Māori – culturally preferred pedagogy or Māori ways of knowing, valuing, and doing kia piki ake i ngā raruraru i te kainga – socioeconomic mediation of disadvantages experienced by Māori whānau – recognising the importance of strong and connected extended family structures kaupapa – collective aspirations and philosophy ata – growing respectful relationships and notions of equality and reciprocity Te Tiriti o Waitangi – affirmation of the rights and status of Māori as tangata whenua and the
importance of building effective relationships between Māori and the Crown.61
Te Mātauranga i roto i ngā mahi hora o nāianei / Mātauranga in current health delivery Over the last four decades there has been a strong and positive new era in which mātauranga Māori has been incorporated into health care. There has also been an increase in Māori health services offering kaupapa Māori services or mātauranga approaches as alternative or complementary care options in the health system.62
PAGE | 36
NEW ZEALAND HEALTH AND DISABILITY SYSTEM REVIEW | HAUORA MANAAKI KI AOTEAROA WHĀNUI
M A H I A A T U A ( T E K Ū W A T A W A T A )
Established in 2017 in Tairāwhiti (Gisborne), Te Kūwatawata was a service designed as a single point of entry into the services available to people experiencing mental distress to those based in Gisborne and the wider Tūranga-nui-ā Kiwa area. It is provided to Māori and non-Māori alike.
As a Te Ao Māori approach inside a mainstream mental health service, Te Kūwatawata uses pūrakau (Māori creation stories) and Mahi a Atua (footsteps of the ancestor-gods) as a ‘Māori-resonate portal’ into a therapeutic treatment pathway. All staff, whether administrative staff or cultural, artistic, or clinical experts, are referred to as Mataora (workers trained in Mahi a Atua) and work in teams to meet the needs of the particular person or whānau.
An evaluation review of Te Kūwatawata, conducted in 2018 63 suggests that deliberately making the clinical process secondary to a more meaningful process encourages Māori to readily engage with clinical professionals. Importantly, the rate of referral of Māori to the Te Tai Rāwhiti DHB child and adolescent psychiatric team had reduced significantly, from 80 people monthly to somewhere between 5-10 per month. While few non-Māori patients and their families were referred to the service the evaluation reported increased access rates for both Māori and non- Māori via self-referrals.
The evaluation of Te Kūwatawata highlighted institutional racism as a threat to both the viability and sustainability of the Mahi a Atua model and Te Kūwatawata itself. The report describes and defines institutional racism in this context and within the broader use of the term itself, as ‘inaction in the face of need’ 64.
Examples of the role of mātauranga Māori with wide acceptance and common usage in health include:
models of Māori health such as Te Whare Tapa Whā and Te Pae Mahutonga, Te Wheke, and Maramataka
Māori health and healing practices such as rongoā (traditional Māori medicine), mirimiri (massage), karakia (prayer), whānau awhi (whānau support), whānau pēpi (birthing practices), oriori (whakapapa lullabies), and tangihanga (funerals)
tikanga Māori (values and concepts) in the delivery of health care (for example, the removal, retention, disposal, and return of body parts, tissues, and substances and organ donations)65
initiatives and interventions such as Te Kūwatawata (see the case study below), wahakura (see the case study below), rongoā, whitiwhiti kōrero (cultural support), and karakia (pastoral support)
data management and protection such as the National Kaitiaki Group (which ensures protection of Māori women’s cervical screening data66) and Te Mana Raraunga (the Māori Data Sovereignty Network)67
leadership and governance mechanisms such as Te Kāhui Tāwharautanga o ngā Rongoā (established in response to the Waitangi Tribunal / Te Rōpū Whakamana i te Tiriti o Waitangi claim for the protection of indigenous flora and fauna, including in relation to traditional Māori healing practices)68
Māori workforce development and leadership strategies e.g. Te Rau Ora (formerly Te rau Matatini) and Ngā Manukura o Āpōpō (Māori nursing leadership).

INTERIM REPORT | PŪRONGO MŌ TĒNEI WĀ
PAGE | 37
W A H A K U R A – A P P L I C A T I O N O F M Ā T A U R A N G A M Ā O R I A T T H E B E G I N N I N G O F L I F E
Wahakura involves the application of mātauranga Māori at the beginning of life for newborn tamariki but also their whāea (mothers). Wahakura are woven pods made from an indigenous fibre known as harakeke (a native flax) that safely protect newborn babies from the risks associated with parental bed sharing and the associated the risk of SUDI (sudden unexplained death of an infant), providing a safe, separate sleeping for the infant. The processes and tikanga of weaving wahakura represent a reaffirmation of Māori cultural identity and whakapapa.69
A randomised trial of wahakura, compared with bassinets, for safe infant sleep confirmed the safety of wahakura and identified additional benefits such as a higher rate of sustained breastfeeding in the wahakura group70 and a higher level of maternal and infant bonding.71
Iwi are increasingly supporting provision of wahakura for new mothers and whānau in the knowledge that a wider mātauranga or curriculum accompanies the process of weaving wahakura. Beyond their role as a safe infant sleeping device, wahakura have a much deeper and more culturally profound distinction and significance.72 Wahakura wānanga have been established across New Zealand to support pregnant women and their whānau to learn how to weave their own wahakura. The process of weaving creates an opportunity for whānau to not only learn about tikanga Māori and weaving, but also to prepare them for welcoming their baby into their world and to discuss infant safety and child-rearing practices.73
Ngā take nunui mō āpōpō / Future considerations for mātauranga Māori An important driving aspect of mātauranga is that health services should have the appropriate level of competency to engage with Māori in ways that are meaningful to them, but also that Māori providers delivering kaupapa Māori approaches need to have the appropriate proficiencies to ensure Māori are accessing high-quality clinical care. The relationship between cultural and clinical excellence is key to improving Māori health care and outcomes.74
Submitters to the Review noted that hauora is broader than the Western concept of health, encompassing the dynamic and interconnected nature of health in Aotearoa New Zealand and embracing social, physical, environmental, and spiritual dimensions.
Submitters also conveyed the view that tikanga Māori should be normalised within the health system, and the health system should be configured in a way that reflects Māori culture, theories of health, wellbeing, and aspirations. It was also noted that the development and adoption of a wairua-centred approach would ground Māori ways of working in cultural strengths and beliefs, which would benefit all New Zealanders
There was a call for support and funding for mātauranga Māori and kaupapa Māori services which were seen as lacking in the health system, and that investing in research on rongoā Māori would provide an evidence base in relation to traditional Māori medicines.
The Panel agrees that mātauranga Māori must be an integral part of all tiers of the health and disability system.

PAGE | 38
NEW ZEALAND HEALTH AND DISABILITY SYSTEM REVIEW | HAUORA MANAAKI KI AOTEAROA WHĀNUI
Te noho mārama ki ngā take hauora Māori / Understanding Māori health issues
Mā te rongo, ka mohio, Mā te mohio, ka mārama,
Mā te mārama, ka matatau, Mā te matatau, ka whai te oranga.
From listening comes knowledge, from knowledge comes understanding,
From understanding comes wisdom, from wisdom comes well-being.
The Māori Expert Advisory Group (MEAG) identified the key issues that affect Māori health outcomes. In developing these issues, their advice to the Review was informed by many sources, including:
the Health Services and Outcomes Kaupapa Inquiry (Wai 2575) the Government Inquiry into Mental Health and Addiction the Whānau Ora Review, Ministry of Health reports, and other published material tier 1 workshops held with funders, planners, providers, and academics who work in the primary
health care sector wānanga held across the country.
The key issues raised were discussed as part of a series of four wānanga with Māori leaders and stakeholders and were reiterated in submissions.
The wānanga were an opportunity for the Review to hear whakaaro Māori about the issues impacting on Māori within the system, as well as ideas and inspiration about a future system designed to prioritise Māori health equity, outcomes, and aspirations. Participants were asked to think about the system-level changes that might be needed to drive improved Māori wellbeing for the benefits to be realised within the next 5–10 years.
The wānanga discussed the need for the system to respond to Māori whānau needs rather than expecting individuals to simply conform to system requirements. So for example, continually measuring ‘did not attend rates’ implies this is somehow the fault of the service user. Turning this around would have us focusing on rates of where the system ‘did not adequately respond’ instead. Discussion also highlighted the ‘monocultural design bias75’ that has contributed to Māori inequities in health, and in particular considered how we can create a system that responds to diversity and how we might measure the impact of this for Māori health outcomes.
Te Tiriti o Waitangi / the Treaty of Waitangi was referenced frequently by most participants to highlight the political position of Māori. They felt the position of te Tiriti / the Treaty had mainly been rhetoric, and that the relationship between Māori and the Crown continued to be challenging. Wānanga participants were strong in their belief that te Tiriti / the Treaty is the enduring foundation on which Māori and the Crown are obliged to establish a trustworthy relationship to reduce inequities in Māori health.
INTERIM REPORT | PŪRONGO MŌ TĒNEI WĀ
PAGE | 39
When presented with a summary of issues the MEAG and the Panel had heard, most wānanga participants could relate to the key issues outlined and used their understandings and work experiences to contrast, support, discuss, and extend their views towards an ideal future health system for Māori. Many of the issues raised in this chapter were reiterated and supported by wānanga participants. Participants also contributed to developing a vision of what the system would look like in 5-10 years time if it was designed to better meet Māori needs. An executive summary of wānanga feedback is included as Appendix C online.
Te Tiriti o Waitangi / The Treaty of Waitangi Mā pango mā whero, ka oti te mahi
With black and with red the work is completed
In relation to te Tiriti o Waitangi / the Treaty of Waitangi, a significant number of responses were received from Māori and non-Māori organisations. The main theme that sums up many these submissions is that honouring te Tiriti o Waitangi / the Treaty of Waitangi is essential to improving Māori health outcomes and is the most important value that needs to underpin the health system.
It was noted that not only does te Tiriti /the Treaty describe Crown obligations and Māori rights, but it is also a “key improvement tool for achieving health equity for Māori and improving the health system” and “the principles and the detail of the articles of te Tiriti o Waitangi / the Treaty of Waitangi provide useful guidance for effective partnering with Māori”.76
Several submissions strongly emphasised the role of te Tiriti / the Treaty in providing a framework for meaningful and substantive relationships between iwi, Māori and the Crown. It was also discussed as a mechanism to reaffirm Crown obligations to enable Māori to participate in health leadership, workforce, and governance and exercise tino rangatiratanga and to reaffirm accountability for ensuring Māori achieve equitable health outcomes.
Submissions also raised issues of culturally competent services, racism, the rights and wellbeing of Māori children, Māori health leadership and advice, poor service performance, government policy, and the protection of Māori cultural concepts, values, and practices in relation to te Tiriti / the Treaty.

PAGE | 40
NEW ZEALAND HEALTH AND DISABILITY SYSTEM REVIEW | HAUORA MANAAKI KI AOTEAROA WHĀNUI
He ngoikore kē atu ngā putanga hauora mō ngāi Māori / Māori experience poorer health outcomes Despite the significant progress noted above, evidence is clear that non-Māori still live longer, healthier lives than Māori. On average, Māori live seven years less than non-Māori and are 2.5 times more likely to die from diseases that can be addressed through health care.77
Recognition is increasing that Māori health inequity requires a more determined focus on equity as a te Tiriti / the Treaty and indigenous right78 as well as a basic human right.79
Achieving equity for Māori requires multifaceted solutions that address intergenerational and intersectoral system failures, Treaty breaches, racism, and language, culture, and identity.80, 81, 82, 83 Academics conclude that normalisation and acceptance of inequalities in health for Māori are demonstrated by the health system’s failure to respond, despite overwhelming and consistent inequities in Māori health outcomes, higher exposure to determinants of ill health and disease, and continued under-representation of Māori in the health workforce.84
The evidence clearly shows that Māori experience inequities in health outcomes across the life course.85, 86, 87 Examples include:
Nearly 50% of Māori women do not have a lead maternity caregiver in the first trimester of their pregnancy (17% less likely than non-Māori),88 and perinatal-related death rates for Māori are significantly higher than for New Zealand Europeans.89
There is a nearly 20% difference between Māori and non-Māori preschool oral health enrolment (one-third of Māori preschool children receive no oral care), and more than half of 5-year-old Māori children have dental caries (33% higher than for non-Māori children).90
Data about 27,000 young people, including nearly 5,800 Māori, from the Youth2000 surveys (2001, 2007, 2012) shows despite improved wellbeing outcomes for rangatahi over the last 12 years, significant gaps in outcomes between Māori and non-Māori young people persist. These include poorer general physical and mental health, weight, substance use, and higher exposure to violence.91
Hospital admissions for self-harm are higher for Māori aged 15–24 and have been increasing since 2016, and suicide rates among Māori aged 15–24 is more than twofold than that for non-Māori in the same age group.92
Māori develop diabetes up to 10 years younger and progress earlier to more serious disease, yet are less likely to receive appropriate HbA1 monitoring and appropriate diabetes-related renal-screening tests than non-Māori. The rate of admission to hospital with diabetic ketoacidosis is higher for Māori, and, while still rare, the rate of lower limb amputation linked to poor diabetes management is a third higher for Māori.93
Despite being significantly more likely to report multiple disabilities, Māori aged 65 and over are much more likely to have unmet need for a disability aid than non-Māori.94
INTERIM REPORT | PŪRONGO MŌ TĒNEI WĀ
PAGE | 41
Participants at the wānanga and submitters noted that improving Māori health outcomes would require deliberate and concerted efforts to address the unequal distribution of the social and economic determinants that influence the levels of health advantage and disadvantage between individuals and population groups in New Zealand. They also noted the need to embed a lifecourse approach to social investment and funding in health and social support systems, including a call for a focus on the health of children, in particular, of Māori children, to reduce life-long and avoidable inequities in health.
Te pānga o ngā manaaktitanga hauora ki te whiwhinga ōrite / Health care impacts on equity In addition to the socioeconomic determinants of health, equity of outcomes is influenced by three factors in the delivery of health care:
inequity in access – services are less accessible for some population groups inequity in quality – services are not providing the same benefits to everyone improvement – efforts to improve the quality of healthcare services do not always improve equity.95
Te taurite o te wātea mai o ngā ratonga / Equity of access to services Access to comprehensive, quality health care services is important for promoting and maintaining health, but Māori and some of New Zealand’s other vulnerable population groups continue to experience issues of access to services.
The ability to access appropriate health services can be affected by various factors, including the cost of care, geographical location (rural compared with urban), and the level of an individual’s health literacy and ability to navigate the system across the continuum of care. For example, the cost of general practitioner visits is a barrier to accessing primary care. One in seven (15%) adults reported not accessing primary care due to cost in the 2016/17 Health Survey, with Māori being 1.4 times more likely to report cost as barrier than non-Māori.96
Māori were also less likely than non-Māori to report being offered a choice of appointment times, to be seen on time, or to be seen within their preferred timeframes in general practice. Māori adults and children are more than twice as likely not to have collected prescription medications because of cost than non-Māori adults and children.97 Approximately 22% of rangatahi Māori were unable to access the care they needed in the previous year and were significantly less likely than Pākehā youth to be able to access the care they needed98.
Te taurite me te kounga ratonga / Equity and quality of care Evidence shows that engagement with the health system increases advantages for non-Māori and disadvantages for Māori across the life course. Where Māori are accessing health services, they do not always receive optimal quality of care, and this negatively affects outcomes for Māori. Lower quality of care includes suboptimal prescribing and over-prescribing to Māori, poor communication between professionals and Māori patients, delays in treatment and surgical interventions, and longer hospital bed stays after acute admissions.99

PAGE | 42
NEW ZEALAND HEALTH AND DISABILITY SYSTEM REVIEW | HAUORA MANAAKI KI AOTEAROA WHĀNUI
The pattern of inequities shown suggests engagement with health services does not reduce inequity. In fact, results suggest a further accumulation of advantages for non-Māori and disadvantages for Māori through engagement with the health system across the life course. (Organisation submission)
The recent Government Inquiry into Mental Health and Addiction heard similar accounts. 100
Ngā pikinga ake o te kounga o ngā ratonga / Improvements in service quality Efforts to improve quality of services have seen a significant impact on health outcomes, including for Māori. One example is in improving surgical site infection rates following orthopaedic surgery, which has seen a rapid reversal of high infection rates and achieved equity for Māori in four years of implementation. The key success factors were standardisation of clinical practice and guidelines, monitoring and reporting of implementation of best practice, and monitoring and reporting of outcomes.
Another example is a pilot screening programme for abdominal aortic aneurism in Waitematā DHB among nearly 2,500 Māori. The study confirmed a high burden of undetected abdominal aortic aneurism among Māori adults; culturally-robust, person-centred processes contributed to high levels of participation; and robust clinical processes led to a high follow up and intervention rate in those with identified aneurisms. These two examples relate to conditions that are relatively simple and able to be resolved primarily through improvements in clinical practice.101
However, evidence also exists that often general improvements in service quality do not achieve equity for Māori, particularly in areas that are more complex and require improvements at multiple levels of the system. Examples include failure to achieve and/or maintain equity in Māori childhood immunisation rates, the management and treatment of diabetes in Māori adults, and screening for renal failure in Māori adults despite higher risk factors.102
There was a call from participants at the wānanga and submitters to enable more Māori and community-led services, and for this to sit at the centre of the system. It was noted that there was tension between universal and/or national approaches and community-led and driven approaches in health care services that constrained local flexibility and innovation to meet the unique and diverse needs of Māori. It was also expressed by many that central to the pursuit of health equity is recognition and honouring of te Tiriti o Waitangi and tackling racism in the system.
Ngā mamae whakatoihara / Impacts of racism
Kaua e takahia te mana o te tāngata
Do not trample on the dignity of people
The Review heard that Māori experiences of colonisation and intergenerational trauma are closely linked to experiences of racism and have had a significant impact on Māori health and wellbeing.103 Māori are almost 10 times more likely to experience multiple forms of discrimination than the New Zealand European population.104

INTERIM REPORT | PŪRONGO MŌ TĒNEI WĀ
PAGE | 43
A cross-sectional study of secondary students showed that students who experienced ethnic discrimination were less likely to report excellent or good health and to feel safe in their neighbourhood and were more likely to report an episode of binge drinking in the previous four weeks.105
racism doesn’t have to be deliberate. It can be the unintended … outcome of well-intentioned people … But … it’s a failure in imagination, it’s a failure in monitoring, it’s a failure in reporting and it’s a failure for consequences for poor performance. (Came-Friar. H. p152).106
In addition to racial discrimination, Māori report institutional racism, including differential access to the health care services and opportunities.
non-Māori are more advantaged than Māori across all socio-economic indicators including personal income, education level and living circumstances (including household crowding, rented accommodation and access to motor vehicles). There is compelling, and growing, evidence of the role of racism as a determinant of health. (Organisation submission)
Submitters noted that there is evidence of implicit bias by professionals in the health system, which perpetuates and maintains power imbalances in the system, and impacts on the quality of care Māori receive. One submission noted that a core goal for the health system must be to prevent people from enacting approaches that perpetuate power imbalances and inequity, whether these are due to personal unconscious or conscious bias or institutional racism. But it was also noted that in order to be effective, eliminating racism needed to also be a goal for wider social service agencies whose services contributed to poorer Māori health outcomes.
It was noted that eliminating racism in the system is everyone’s responsibility from those working in administration to service delivery and leadership and governance, and that this needs to be in both personal and organisational performance plans. Further, submitters noted that this should be monitored, and reported on in accountability documents.
There was a call for a stronger research evidence base identifying and assessing programmes and interventions that are effective in addressing the frequency and impact of racism on health outcomes for Māori.
PAGE | 44
NEW ZEALAND HEALTH AND DISABILITY SYSTEM REVIEW | HAUORA MANAAKI KI AOTEAROA WHĀNUI
Ngā whakaritenga o te pūnaha / System settings
Ngā kaupapa here hauora me ngā takohanga / Health policy implementation and accountability During this phase of the Review, concerns were raised around the strength of the accountability mechanisms available to ensure the implementation of health policies is appropriate, but also flexible enough to allow for tailored approaches to addressing Māori health needs at a local level. It was noted that in particular that there has been a failure to adequately address Māori equity needs as part of the recent New Zealand Health Strategy and that Māori-specific policy development and implementation is lacking. One submission referred to a study of 10 years of public health policies to understand how te Tiriti / the Treaty was represented in health policy frameworks. The study found that there were inconsistencies in policy engagement. Over the 49 policies reviewed for that period, only 12 mentioned te Tiriti o Waitangi / the Treaty of Waitangi.107
Ngā tikanga pūtea / Funding mechanisms Chapter 4: governance and funding, sets out and describes the current funding arrangements for the system. A number of issues and concerns were raised by Māori about funding during the wānanga, in submissions and during the Wai 2575 Inquiry. A common theme raised by Māori was related to the belief that funding formulas, such as primary care capitation, failed to meet the high, and diverse needs of Māori communities and whānau. It was also suggested that funding was largely driven by political electoral cycles and ideology, rather than need, and did not adequately allow for Māori-specific responses. In particular, it was noted that the lack of a specific national Māori investment plan for health services meant that health funding is not invested where it’s most needed, particularly in relation to achieving health equity for Māori and the provision of rural health services. Submitters also raised concerns about insufficient investment in preventive care approaches.
There were also significant concerns raised about contracting models and underfunding of Māori providers and services. It was noted that Māori health providers were not funded to a level that allowed delivery of holistic services consistent with Māori models of practice and recognising the complexity of the circumstances of their client base. It was also raised that contracting arrangements lacked the flexibility to allow for innovation in service delivery. Submitters also noted that contracts awarded to Māori providers did not allow for pay equity and did not recognise the dual clinical/technical and cultural competencies of Māori practitioners and health workers. This is discussed further in chapter 4: governance and funding.
There was a strong call from a number of submitters, phase one claimants to the Wai 2575, and during wānanga for a dedicated Māori funding entity that focuses on Māori health needs and responses.
Te ārahi i te pūnaha me te mana tautiaki / System leadership and governance Issues Māori raised relating to health system governance, leadership, and decision making focused primarily on the need to improve and develop Māori participation and representation across the sector at the governance level. This includes shared power and decision making between the Crown and Māori and the influence of funding and contracting arrangements on the distribution of decision-making power.

INTERIM REPORT | PŪRONGO MŌ TĒNEI WĀ
PAGE | 45
There was a view from submissions and wānanga participants that support for Māori leadership development was lacking and that there is a need for developing stronger iwi partnerships with DHBs. The need for flexibility to work across boundaries when defining what is local and regional, and a willingness to collaborate with iwi across DHB boundaries was identified, including a focus on, and investment in, local leadership to deliver on local priorities.
Te mana o te raraunga / Data sovereignty Quality health data collection provides the knowledge base for health and social investments, health service planning, and data sharing. Health technology is also progressing to improve the delivery of health services. Māori have expressed particular interests and concerns in the way that Māori data is collected, analysed, and used. On the one hand Māori data is a powerful tool of self-determination, on the other a method by which Māori are analysed, categorised and described. These issues are discussed more fully in chapter 12: digital and data.
Ngā ratonga Māori / Māori providers and services Te tira kaimahi hauora Māori / Māori health workforce
Mā te mahi tahi ka anga whakamua
By working together we move forward
A diverse and representative health workforce that understands the importance of achieving health equity is critical to the delivery of equitable health services to Māori. It is clear that New Zealand’s Māori health workforce challenges centre on the capacity and capability of the Māori workforce, attracting and retaining Māori health professionals to work in rural areas, and the level of government investment in building the Māori health workforce. It has also been noted that in addition to growing the Māori health workforce, investment and training is required to ensure the non-Māori health workforce is skilled and competent to work with Māori whānau and communities.
We heard from submitters that the current health workforce lacks diversity, that attracting a Māori workforce to rural communities is challenging, and that lack of pay parity between health professionals working for Māori providers and those working for mainstream providers is a challenge for recruitment and retention.
We also heard that the system does not give enough attention to growing the Māori health workforce, appropriate training for Māori health providers is lacking, as is support and investment in mātauranga Māori and kaupapa Māori health workforce. It was suggested that there was a need for dedicated Māori enrolment targets across all health training programmes and specific targets for health employers.

PAGE | 46
NEW ZEALAND HEALTH AND DISABILITY SYSTEM REVIEW | HAUORA MANAAKI KI AOTEAROA WHĀNUI
Ngā ratonga Māori / Māori providers Most commonly, Māori health service providers are iwi or Māori owned and community based, Māori governed, and deeply rooted in Māori values and cultural practices. These providers generally provide services to predominantly Māori high-needs communities. It has been noted that such Māori providers are uniquely placed to deliver on Māori aspirations and concepts of health and wellbeing alongside the delivery of treatment and care.108.
The Māori Provider Development Scheme was established in 1997 to provide funding grants to support the development of Māori providers. This funding is still in place and has been shown to contribute to the capacity and capability development of Māori providers as well as enabling the establishment, maintenance, and advancements of information technology systems. The scheme has also contributed to the development and growth of the Māori health workforce, including an increase in the number of staff who have received additional training and have certified and tertiary qualifications. One challenge Māori providers face is that their staff then became highly sought after and paid better by other providers.109
There is also a lot to learn from Māori providers. Recent work undertaken by the Ministry of Health to look at Stop Smoking Services and, in particular, to design services that support wāhine Māori (Māori women) to quit, led to a series of co-designed prototype services being trialled with Māori providers.110 Findings from an evaluation of these prototypes has led to new guidance documents being developed for national stop smoking services.
A number of the challenges for Māori providers raised by submissions related to concerns about the funding of Māori providers and services, which is addressed in the section on funding above, but one submission provided a useful summary:
Māori PHOs/providers are not financially sustainable due to significant underfunding on an annual basis, and the disparity in resources caused by the uneven playing field in the primary health sector. Māori PHOs are also prejudiced by the DHB model in providing kaupapa Māori models of care across multiple DHB districts. (Organisation Submission)
Submitters also noted that Māori providers bring value to the system, for example, by delivering kaupapa Māori services, such as oral health services, and in communities with high and complex needs that are being underserved. It was also noted that the Whānau Ora model has had success in improving outcomes, and mainstream services could learn much from that model. There was a call to create opportunities for Māori providers to participate more effectively in local and regional planning and decision making to improve action on health equity for Māori.

INTERIM REPORT | PŪRONGO MŌ TĒNEI WĀ
PAGE | 47
Ngā pūmanawa Māori / Māori strengths
Hāpaitia te ara tika pūmau ai te rangatiratanga mo ngā uri whakatupu
Foster the pathway of knowledge to strength, independence, and growth
for future generations
Māori have a long history of adaptation and innovation to improve outcomes towards Māori flourishing, and health and wellbeing are no exception. In its submission to the Government Inquiry into Mental Health and Addiction, Tumu Whakarae (National Reference Group of Māori Health Strategy Managers within DHBs) noted the considerable strengths of Māori to find their own solutions. These strengths include the resilience of whānau, leadership of tūpuna (ancestors), iwi advancement, post-Treaty settlements, Māori leadership in government, visionary and strategic Māori leaders, a highly skilled and professional Māori health workforce, and Māori-determined research. Tumu Whakarae contends that achieving the vision of Pae Ora (the ultimate goal of He Korowai Oranga – the Māori Health Strategy) for Māori requires meaningful partnership consistent with te Tiriti / the Treaty:
The best sort of society for the mental health of all people is a society based on the best of what tangata whenua as the indigenous people of Aotearoa can offer, in partnership with what non-Māori as Te Tiriti based partners can provide.111
Te Rangatiratanga o te Whānau / Connected and Capable Whānau
Whānau possess an unlimited potential to transfer positive values, to promote healthy lifestyles, and to attain good health through customs and concepts akin to their cultural identity (Waitai and Kingi p127) 112
The concept of ‘whānau ora’ is not new and can best be described as ‘Māori families supported to achieve their maximum health and wellbeing’. For whānau to achieve the state of wellbeing or oranga, they need to achieve a sense of purpose and control or rangatiratanga over their own health and wellbeing. This concept of whānau rangatiratanga relates to the right of people and whānau to participate in decision making about their own health aspirations and health care needs and to exercise a measure of control over how services are delivered to them..113
In 2016, the Social Policy Evaluation and Research Unit developed a conceptual framework and
measurement tool to identify the key principles and dimensions for measuring whānau wellbeing and
empowerment (summarised in Table 3.1). The intention of the measurement framework was to move
from deficit framing for measuring whānau outcomes towards measuring and reporting on the
development of whānau capability over time.114
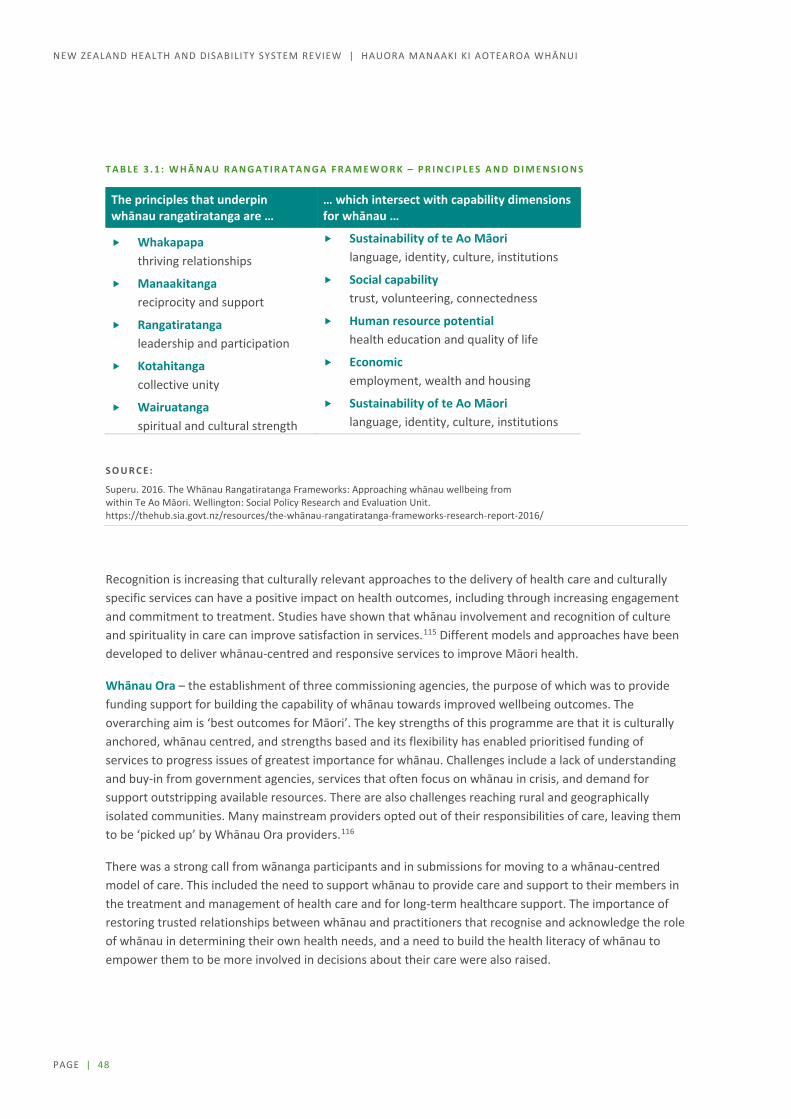
PAGE | 48
NEW ZEALAND HEALTH AND DISABILITY SYSTEM REVIEW | HAUORA MANAAKI KI AOTEAROA WHĀNUI
T A B L E 3 . 1 : W H Ā N A U R A N G A T I R A T A N G A F R A M E W O R K – P R I N C I P L E S A N D D I M E N S I O N S
The principles that underpin whānau rangatiratanga are …
… which intersect with capability dimensions for whānau …
Whakapapa thriving relationships
Sustainability of te Ao Māori language, identity, culture, institutions
Manaakitanga reciprocity and support
Social capability trust, volunteering, connectedness
Rangatiratanga leadership and participation
Human resource potential health education and quality of life
Kotahitanga collective unity
Economic employment, wealth and housing
Wairuatanga spiritual and cultural strength
Sustainability of te Ao Māori language, identity, culture, institutions
S O U R C E :
Superu. 2016. The Whānau Rangatiratanga Frameworks: Approaching whānau wellbeing from within Te Ao Māori. Wellington: Social Policy Research and Evaluation Unit. https://thehub.sia.govt.nz/resources/the-whānau-rangatiratanga-frameworks-research-report-2016/
Recognition is increasing that culturally relevant approaches to the delivery of health care and culturally specific services can have a positive impact on health outcomes, including through increasing engagement and commitment to treatment. Studies have shown that whānau involvement and recognition of culture and spirituality in care can improve satisfaction in services.115 Different models and approaches have been developed to deliver whānau-centred and responsive services to improve Māori health.
Whānau Ora – the establishment of three commissioning agencies, the purpose of which was to provide funding support for building the capability of whānau towards improved wellbeing outcomes. The overarching aim is ‘best outcomes for Māori’. The key strengths of this programme are that it is culturally anchored, whānau centred, and strengths based and its flexibility has enabled prioritised funding of services to progress issues of greatest importance for whānau. Challenges include a lack of understanding and buy-in from government agencies, services that often focus on whānau in crisis, and demand for support outstripping available resources. There are also challenges reaching rural and geographically isolated communities. Many mainstream providers opted out of their responsibilities of care, leaving them to be ‘picked up’ by Whānau Ora providers.116
There was a strong call from wānanga participants and in submissions for moving to a whānau-centred model of care. This included the need to support whānau to provide care and support to their members in the treatment and management of health care and for long-term healthcare support. The importance of restoring trusted relationships between whānau and practitioners that recognise and acknowledge the role of whānau in determining their own health needs, and a need to build the health literacy of whānau to empower them to be more involved in decisions about their care were also raised.
INTERIM REPORT | PŪRONGO MŌ TĒNEI WĀ
PAGE | 49
Te Wherawheratanga Kaupapa mō ngā Ratonga me ngā Putanga Hauora / Health Services and Outcomes Kaupapa Inquiry (Wai 2575) The Health Services and Outcomes Kaupapa Inquiry117 commenced on 30 November 2016 to inquire into nationally significant health issues for Māori. The inquiry is being conducted in three stages. In stage 1, which relates to “priority themes that demonstrate system issues”, the Waitangi Tribunal has heard two claims – from the National Hauora Coalition and the Māori Primary Health Organisations. The remaining claims will be considered in stages 2 and 3 of the inquiry.
The inquiry identified four thematic issues that need to be addressed from the claimant submissions:
Treaty-compliance of the New Zealand Public Health and Disability Act 2002 and policy framework funding arrangements for primary care accountability arrangements for primary health care the nature of Treaty partnership arrangements in the primary health sector.
The findings of the Inquiry were published as this report was being finalised so while the Panel acknowledges the significance of the inquiry report (Wai 2575) and the findings and recommendations of the Waitangi Tribunal, this report does not fully consider the specific recommendations. The Tribunal report is summarised in Appendix D (online). The Review will fully consider these in the next phase of the Review.

PAGE | 50
NEW ZEALAND HEALTH AND DISABILITY SYSTEM REVIEW | HAUORA MANAAKI KI AOTEAROA WHĀNUI
Directions for change: Hauora Māori Māori as Tiriti / Treaty partners have not been well served by the health and disability system. Despite many good examples of kaupapa Māori services proving their effectiveness, the system overall has not delivered Māori health and wellbeing outcomes that are fair.
While issues relating to Māori health are addressed throughout the report, key issues include:
R E C O G N I S I N G T H E T I R I T I / T R E A T Y R E L A T I O N S H I P
The Panel believes a health system tailored to meet the needs of all New Zealanders must:
Fully incorporate te Tiriti o Waitangi / the Treaty of Waitangi to provide a framework for meaningful and substantive relationships between iwi, Māori and the Crown and recognise the importance of considering the heterogeneous realities of Māori and kaupapa Māori aspirations
better meet its obligations regarding the health of Māori communities and embed rangatiratanga (authority, ownership, leadership) and mana motuhake (self-determination, autonomy)
E M B R A C I N G M Ā T A U R A N G A M Ā O R I
The Panel recognises that the New Zealand health and disability system has evolved with a strong western medical tradition. The inequities which have arisen for Māori from this system cannot be fully addressed without ensuring that going forward the system also embraces the Māori world view of health
The Panel recognises that progress has been made in incorporating mātauranga Māori into many of our practices but there will need to be an ongoing and deliberate policy to ensure that practice continues to grow and that kaupapa Māori services are more readily available.

PAGE | 51
INTERIM REPORT | PŪRONGO MŌ TĒNEI WĀ
Section B: Settings / Ngā whakaritenga o te pūnaha

PAGE | 52
NEW ZEALAND HEALTH AND DISABILITY SYSTEM REVIEW | HAUORA MANAAKI KI AOTEAROA WHĀNUI
4 Governance and funding / Te mana tautiaki me te whāngai pūtea
The current health and disability system is complicated and for many, confusing. There are multiple layers, overlapping mandates, and as a result unclear accountabilities. This section aims to make sense of current governance arrangements, consider what submitters and others within the system believe is working or not, and suggest key changes to clarify decision making rights, improve accountability and ensure communities are able to engage effectively in both planning and decision making.
No system can operate effectively without adequate funding and the current system has experienced a sustained period of little real growth which has added to the stress within the system. On the other hand, increasing funding alone will not guarantee equitable outcomes. This section looks at the big picture questions regarding what money is currently spent on, does that spending pattern explain the inequitable outcomes, and DHB deficits.
Engagement undertaken during Phase One of the Review has stressed the importance of the following areas of governance:
quality of the leadership at all levels cohesiveness of the system and a culture that is driven by consistent values and behaviours clarity of mandates, decision making and accountability improved intersectoral collaboration improved responsiveness to local communities improved responsiveness to iwi, Māori
INTERIM REPORT | PŪRONGO MŌ TĒNEI WĀ
PAGE | 53
During Phase One of the Review, we have not focused on the level of funding, or the details of particular funding mechanisms. We are focussed first on identifying how the system needs to change to achieve better health equity. Only once we are clear on how the system should operate can we ensure the funding mechanisms are right.
We have also heard concerns about funding in particular areas of the system. These include cost pressures in disability support services, the Waitangi Tribunal’s findings on primary care funding, and contracting practices that impose costs on small non-government providers. These issues are discussed principally in the Service Section.
Overview of current system arrangements The New Zealand health and disability system is often described as a mixed system due to services being provided by a mix of public and private entities (both for-profit and not-for-profit). It is a major contributor to New Zealand’s economy, accounting for around 9% of GDP and as a sector is the largest employer.
The structure of the health and disability system is illustrated in Figure 4.1. Key players in the system are the Ministry of Health, Crown entities, including district health boards (DHBs), primary health organisations (PHOs), non-government organisations (NGOs), public health units, local authorities, responsible authorities, and other government agencies.
The system’s statutory framework consists of over 25 pieces of legislation and several international conventions (see Appendix E online). The most significant Acts are the New Zealand Public Health and Disability Act 2000, Health Act 1956, Accident Compensation Act 2001, Crown Entities Act 2004, and Public Finance Act 1989. Together, these Acts set the limits within which the system can practice.
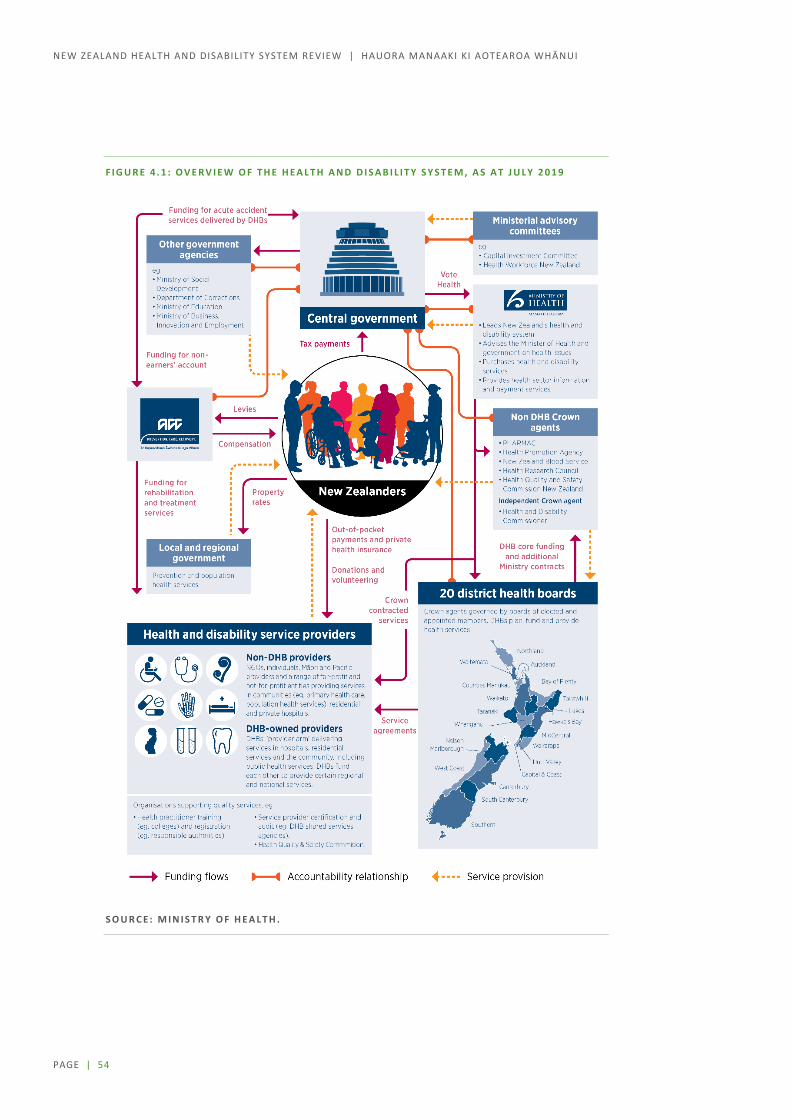
NEW ZEALAND HEALTH AND DISABILITY SYSTEM REVIEW | HAUORA MANAAKI KI AOTEAROA WHĀNUI
PAGE | 54
F I G U R E 4 . 1 : O V E R V I E W O F T H E H E A L T H A N D D I S A B I L I T Y S Y S T E M , A S A T J U L Y 2 0 1 9
S O U R C E : M I N I S T R Y O F H E A L T H .

INTERIM REPORT | PŪRONGO MŌ TĒNEI WĀ
PAGE | 55
KEY SYSTEM AGENCIES AND ORGANISATIONS
M I N I S T R Y O F H E A L T H
The Ministry leads the health and disability system and has overall responsibility for its management and development. It advises the Minister of Health and government on health and disability issues, directly purchases a variety of health and disability support services, monitors district health boards (DHBs) and other Crown entities, and provides health and disability sector information and payment services.
D I S T R I C T H E A L T H B O A R D S ( D H B S )
Twenty DHBs are responsible for providing and funding health and disability services in their districts. DHBs directly provide hospital services as well as some community and public health services, and contract with non-government providers for primary care, community, disability, and other services. DHBs make decisions on the mix, level, and quality of health and disability services within parameters set nationally. DHBs also jointly plan some services at a regional level.
P R I M A R Y H E A L T H O R G A N I S A T I O N S ( P H O S )
Primary healthcare is funded through 30 primary health organisations (PHOs). DHBs fund PHOs to ensure the provision of essential primary healthcare services to people enrolled with a PHO through general practitioners. A PHO can provide primary health care services directly or through its provider members. The PHO Services Agreement is a contract between DHBs and PHOs for nationally defined services.
D I S T R I C T A L L I A N C E S
District alliances are local leadership teams which work to support system integration and service planning. They have been a mandatory requirement through the PHO Service Agreement since 2013. They aim to promote integration and improve patient outcomes through DHB and PHO partnerships.
H E A L T H C R O W N E N T I T I E S
Other significant entities include the Health Promotion Agency, Health Quality and Safety Commission, Health Research Council of New Zealand, New Zealand Blood Service, Pharmaceutical Management Agency (PHARMAC), Health and Disability Commissioner (independent), and NZ Health Partnerships (Crown-owned company).
N O N - G O V E R N M E N T O R G A N I S A T I O N S
The Ministry of Health and DHBs fund non-government organisations (NGOs) to provide services to consumers at a community level. NGOs include a wide variety of organisations providing services such as public health, primary health care, mental health, rehabilitation and detox, and disability support services.

NEW ZEALAND HEALTH AND DISABILITY SYSTEM REVIEW | HAUORA MANAAKI KI AOTEAROA WHĀNUI
PAGE | 56
O F F I C E F O R D I S A B I L I T Y I S S U E S
The Office for Disability Issues serves as the focal point within government for disability issues and, as part of its core functions, helps to facilitate an effective working relationship between the disability sector and government agencies. The Health and Disability Commissioner promotes and protects the rights of consumers as set out in the Code of Health and Disability Services Consumers’ Rights. This includes resolving complaints in a fair, timely, and effective way.
P U B L I C H E A L T H U N I T S
Thirteen DHB-owned public health units deliver public health services through contracts with the Ministry of Health. Public health units focus on environmental health, communicable disease control, tobacco and alcohol control, health promotion programmes, health status assessment and surveillance, and public health capacity development.
L O C A L A U T H O R I T I E S
Local authorities increasingly deliver initiatives that promote community wellbeing. These initiatives vary between regional councils and territorial authorities and depend on council resources and priorities. Core activities that promote public health include resource management and the provision of drainage, sewerage, drinking water, recreation facilities and areas, and refuse collection. The Local Government Act 2002 was amended in 2019 and now requires local authorities to “play a broad role in promoting the social, economic, environmental and cultural well-being of their communities, taking a sustainable development approach” (section 3(d)).
R E S P O N S I B L E A U T H O R I T I E S
The Health Practitioners Competence Assurance Act 2003 covers 16 health professional authorities that define scopes of practice for their professions and the qualifications necessary, register practitioners, and issue annual practising certificates. They also set standards of competence. Authorities are funded through professional levies.
O T H E R G O V E R N M E N T A G E N C I E S
Other agencies fund, purchase, subsidise, or provide health and disability services that contribute to health and wellbeing through determinants of health. This includes intersectoral initiatives. Key agencies include the Accident Compensation Corporation, New Zealand Police, Sport New Zealand, Department of Corrections, Oranga Tamariki, Ministry of Social Development, Ministry of Education, Ministry of Business, Innovation and Employment, and Ministry of Justice.
A C C I D E N T C O M P E N S A T I O N C O M M I S S I O N
The commission manages the no-fault accident compensation scheme that covers injuries and accidents (commonly referred to as ‘ACC’). Cover includes payment towards treatment, help at home and work, and help with income.

INTERIM REPORT | PŪRONGO MŌ TĒNEI WĀ
PAGE | 57
Roles and relationships
Working effectively within an inherently complex system New Zealand’s health and disability system, like that of any other country, is inherently complex and will always be so given the breadth of services being delivered, the multiplicity of organisations involved, and the number of people being served.
However, we heard from organisations, providers and consumers that the system is more muddled and confusing than it needs to be. Management theory talks of healthcare systems as being ‘complex adaptive systems’, recognising that the impact of any single change or movement in one part of the system is unlikely to be linear or predictable on another part. International literature suggests that the most effective complex adaptive systems share two characteristics:
a clearly defined purpose with effective feedback loops, which make the systems highly adaptable118 distributed leadership that passes control from one to many. This is generally more effective than
traditional, hierarchical ways of operating; ‘command and control’ systems seldom work in these systems.
Neither of these characteristics are very evident in the New Zealand system.
Restructuring is disruptive – changing how we work in current structures could improve performance Since its establishment, the New Zealand health and disability system has been through a variety of significant structural changes (summarised in Table 4.1). Like many health systems, rather than being purposefully designed, it has evolved in response to new health challenges, growing population demands, and political and professional drivers.
Policy researchers have commented that this system evolution results in systems with boundaries based on professional preferences, with frameworks retrospectively applied and processes developed to meet the requirements of service providers rather than the people they serve. One view is that this is exacerbated by a disproportionate focus on reform of the structural components as a solution to pressures.119
In discussions at stakeholder workshops, some held a view that the existing core structure of the system is fit for purpose but the way we work within it is flawed. These stakeholders said that legislation sets out a valid and appropriate role for DHBs but problems, such as how we approach implementation of policy change, lead to poorer outcomes than could have been achieved. People observed that an initial response to pressures on the system seems to be a jump to further structural change or to set up another institution. However, this response may not always address the root cause of the problems and may create further silos and confusion around accountabilities.
Substantial structural changes … have resulted in significant disruption and caused the sector to stand still for at least two years. (Group submission)

NEW ZEALAND HEALTH AND DISABILITY SYSTEM REVIEW | HAUORA MANAAKI KI AOTEAROA WHĀNUI
PAGE | 58
T A B L E 4 . 1 : H I S T O R Y O F R E S T R U C T U R I N G I N T H E N E W Z E A L A N D H E A L T H A N D D I S A B I L I T Y S Y S T E M
1938–1983
Social Security Act 1938 (replaced by the Social Security Act 1964) and Disabled Persons Community Welfare Act 1975
The health system developed as a dual system of public and private provision. Disability support straddled the health (hospital based) and welfare (community based) systems.
In 1974, the Accident Compensation Corporation was established as a Crown entity, responsible for delivering New Zealand’s accident compensation scheme, which seeks to minimise both the overall incidence and impact of injury.
1983–1992
Area Health Boards Act 1983
Fourteen area health boards funded by a population-based formula were gradually established.
This was a period of deinstitutionalisation as hospitals providing long-term care for people with mental illnesses and disabilities were replaced by community services.
1993–1997
Health and Disability Services Act 1993
Four regional health authorities were established. Purchasing and provision of health services were separated. Area health boards were reconfigured into 23 Crown health enterprises structured as for-profit organisations and subject to ordinary company law. Disability support services funding was transferred from the Department of Social Welfare to the regional health authorities. Public health services were unbundled and a separate public health purchasing agency, the Public Health Commission, was established. Māori Co-Purchasing Agencies were established in the Northern region. Purposeful approach to Māori providers being established and funded.
1997–2000
Health and Disability Services Amendment Act 1998
In 1998, four regional health authorities were combined into one national purchasing agency, the Health Funding Authority. The 23 Crown health enterprises were reconfigured as 24 not-for-profit Crown-owned companies and renamed Hospital and Health Services. Regional health authorities continued to invest in and grow Māori providers and to contract for a wide range of Māori health and disability services. This period saw significant growth in the number of Māori providers. The Māori Provider Development Scheme, managed by the Ministry of Health, was initiated in 1997.
2000-current
New Zealand Public Health and Disability Act 2000
In 2000, the first New Zealand Health Strategy was developed and further health system reform was initiated. In 2001, 21 (now 20) district health boards (DHBs) were formed with dual purchasing and provisioning responsibilities.
Purchasing functions of the Health Funding Authority were devolved to DHBs except for the purchasing of public health services, “national services”, and disability support for people aged under 65.
The Ministry of Health led development of the first New Zealand Disability Strategy, and the following year leadership responsibility transferred to the newly established Office for Disability Issues.
Primary health organisations were established early 2000s to coordinate primary care services for their enrolled population.
The last Māori Co-Purchasing Agency was disestablished in 2010.
S O U R C E : A D A P T E D F R O M P A R L I A M E N T A R Y S E R V I C E S . 2 0 0 9 . N E W Z E A L A N D H E A L T H S Y S T E M R E F O R M S ( R E S E A R C H P A P E R 0 9 / 0 3 ) .
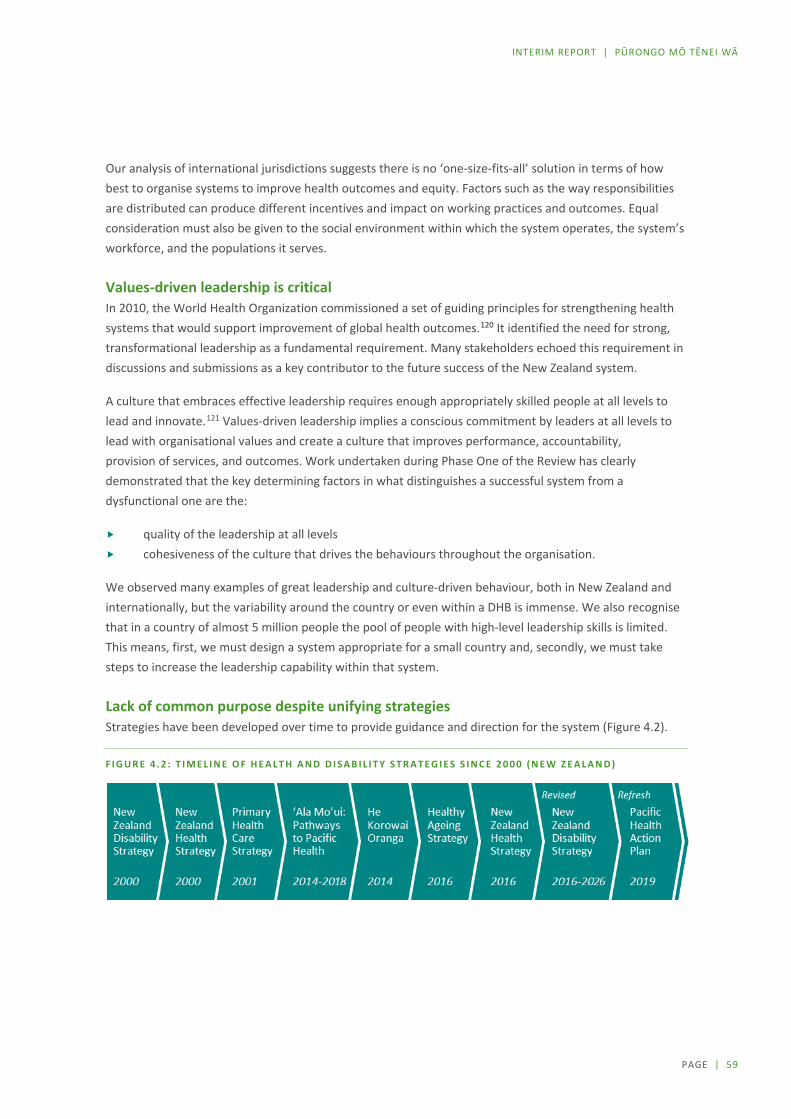
INTERIM REPORT | PŪRONGO MŌ TĒNEI WĀ
PAGE | 59
Our analysis of international jurisdictions suggests there is no ‘one-size-fits-all’ solution in terms of how best to organise systems to improve health outcomes and equity. Factors such as the way responsibilities are distributed can produce different incentives and impact on working practices and outcomes. Equal consideration must also be given to the social environment within which the system operates, the system’s workforce, and the populations it serves.
Values-driven leadership is critical In 2010, the World Health Organization commissioned a set of guiding principles for strengthening health systems that would support improvement of global health outcomes.120 It identified the need for strong, transformational leadership as a fundamental requirement. Many stakeholders echoed this requirement in discussions and submissions as a key contributor to the future success of the New Zealand system.
A culture that embraces effective leadership requires enough appropriately skilled people at all levels to lead and innovate.121 Values-driven leadership implies a conscious commitment by leaders at all levels to lead with organisational values and create a culture that improves performance, accountability, provision of services, and outcomes. Work undertaken during Phase One of the Review has clearly demonstrated that the key determining factors in what distinguishes a successful system from a dysfunctional one are the:
quality of the leadership at all levels cohesiveness of the culture that drives the behaviours throughout the organisation.
We observed many examples of great leadership and culture-driven behaviour, both in New Zealand and internationally, but the variability around the country or even within a DHB is immense. We also recognise that in a country of almost 5 million people the pool of people with high-level leadership skills is limited. This means, first, we must design a system appropriate for a small country and, secondly, we must take steps to increase the leadership capability within that system.
Lack of common purpose despite unifying strategies Strategies have been developed over time to provide guidance and direction for the system (Figure 4.2).
F I G U R E 4 . 2 : T I M E L I N E O F H E A L T H A N D D I S A B I L I T Y S T R A T E G I E S S I N C E 2 0 0 0 ( N E W Z E A L A N D )

NEW ZEALAND HEALTH AND DISABILITY SYSTEM REVIEW | HAUORA MANAAKI KI AOTEAROA WHĀNUI
PAGE | 60
The overarching strategy for health in New Zealand, the New Zealand Health Strategy,122 was refreshed in 2016 after extensive consultation and involvement of sector leaders, independent experts, and researchers. It sets out the high-level direction for the health system from 2016 to 2026, identifying five strategic themes that would move the system toward that future. The vision articulated in that strategy reflects the Review’s task of delivering a system that delivers hauora, wellbeing, and equity of outcomes for all New Zealanders.
All New Zealanders have the right to a system that enables everyone to live well, stay well, and get well.
Our Phase One discussions have confirmed this strategy is generally widely supported, although it is also recognised that it lacks adequate recognition of Tiriti/Treaty related issues. However, fragmentation in the way organisations within the system work leads to disconnect between strategy and outcomes: the objectives are not owned and shared across the system. For many, there is little sense that everyone is working to a shared set of values and towards a common goal.
The system is also characterised by a range of organisational forms operating under different incentives, values, and drivers of behaviour. These include public service departments, Crown agents, not-for-profit entities, and private businesses. We recognise in this a significant difference in configuration to other largely public national systems, such as NHS in the United Kingdom. In our system, commercial entities play a significant role in the provision of health care across all tiers of services. This has its roots in debates around the introduction of the Social Security Act 1938 in which clinical professions held fast to their freedom to engage in both public and private practice. Clearly, different incentives and drivers of behaviour are at play.
Need for common values and unifying principles The Panel is firmly of the view that New Zealand needs to create a more cohesive health and disability system that is underpinned by a:
common set of values that aligns workforce behaviour, culture, and cooperation in delivering exceptional patient and whānau-centred outcomes across all publicly funded services
unifying set of principles that aligns the system toward a common set of objectives and shapes funding, governance, accountability, data, and service delivery within in the home, community, and hospital
Analysis of values in use across health and disability organisations in New Zealand has highlighted that, although commonalties exist, there is no core set of principles or values overarching the system. Wide variability also exists in terms of focus, tone, bilingual representation, and style. This includes lack of a consistent reference to te Tiriti o Waitangi /the Treaty of Waitangi (Figure 4.3).
A review was also undertaken of some international health systems. Four well respected but very different health organisations who deliver a core set of system-level principles and values that drives leadership, culture, and behaviour are noted (see Appendix F online).
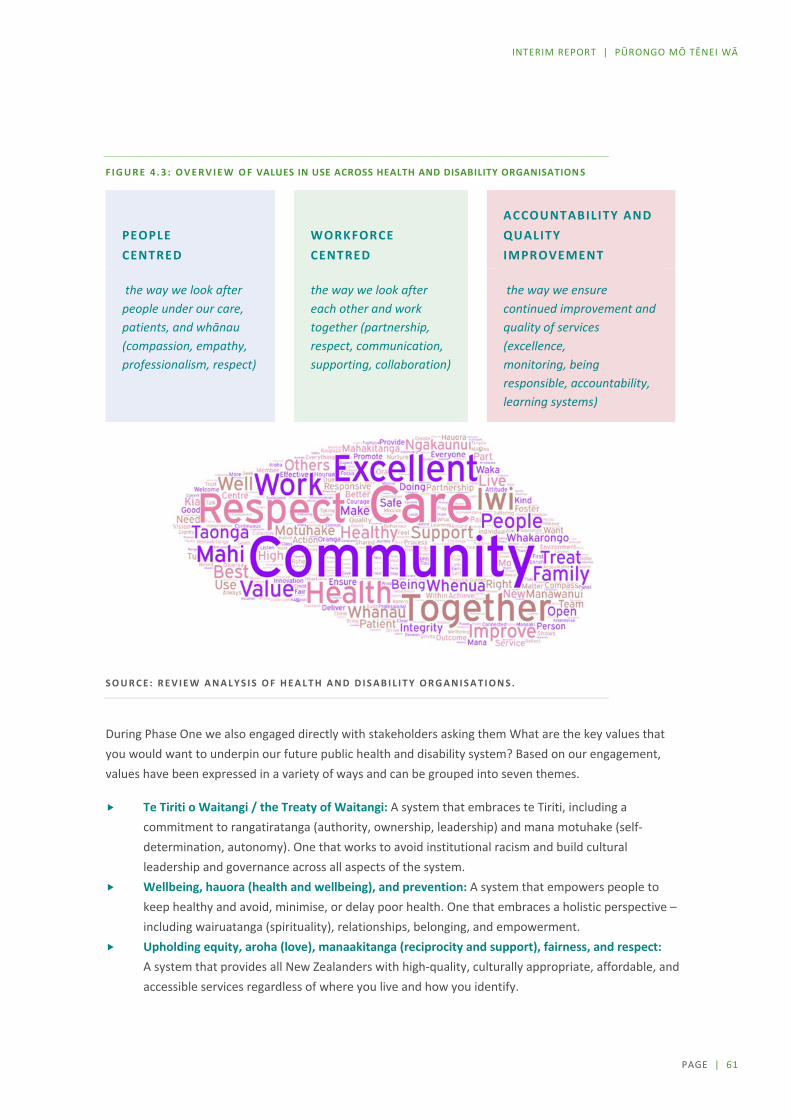
INTERIM REPORT | PŪRONGO MŌ TĒNEI WĀ
PAGE | 61
F I G U R E 4 . 3 : O V E R V I E W O F VALUES IN USE ACROSS HEALTH AND DISABILITY ORGANISATION S
PEOPLE CENTRED
WORKFORCE CENTRED
ACCOUNTABILITY AND QUALITY IMPROVEMENT
the way we look after people under our care, patients, and whānau (compassion, empathy, professionalism, respect)
the way we look after each other and work together (partnership, respect, communication, supporting, collaboration)
the way we ensure continued improvement and quality of services (excellence, monitoring, being responsible, accountability, learning systems)
S O U R C E : R E V I E W A N A L Y S I S O F H E A L T H A N D D I S A B I L I T Y O R G A N I S A T I O N S .
During Phase One we also engaged directly with stakeholders asking them What are the key values that you would want to underpin our future public health and disability system? Based on our engagement, values have been expressed in a variety of ways and can be grouped into seven themes.
Te Tiriti o Waitangi / the Treaty of Waitangi: A system that embraces te Tiriti, including a commitment to rangatiratanga (authority, ownership, leadership) and mana motuhake (self-determination, autonomy). One that works to avoid institutional racism and build cultural leadership and governance across all aspects of the system.
Wellbeing, hauora (health and wellbeing), and prevention: A system that empowers people to keep healthy and avoid, minimise, or delay poor health. One that embraces a holistic perspective – including wairuatanga (spirituality), relationships, belonging, and empowerment.
Upholding equity, aroha (love), manaakitanga (reciprocity and support), fairness, and respect: A system that provides all New Zealanders with high-quality, culturally appropriate, affordable, and accessible services regardless of where you live and how you identify.

NEW ZEALAND HEALTH AND DISABILITY SYSTEM REVIEW | HAUORA MANAAKI KI AOTEAROA WHĀNUI
PAGE | 62
Trust: A mana-enhancing system that builds trust within and across communities and organisations, treating people as partners in care and actively collaborating to enhance health and wellbeing. A system that builds and values intersectoral relationships.
Integrated, collaborative, and connected: A system that is cohesive and well-coordinated, exemplified by high levels of collaboration within the entire system and intersectorally. A system that supports cooperation and transitions between services, with a workforce that works together to deliver seamless support to all.
Outstanding leadership, work practice, and whakawhanaungatanga (relationship building): A system with a shared understanding of purpose and clarity of leadership that values its workforce and provides secure and supported workplaces cross the system.
Supporting excellence, integrity, and innovation: An evidence-based system that makes best use of available resources for all New Zealanders and strives for quality of care in all it does. This includes using data effectively and ethically across the system, valuing expertise of communities in service delivery, and welcoming fresh thinking and innovation.
Submitters also referred to a common set of principles, including a system based on hauora, equity, human rights, universal health services regardless of pathway, strong leadership, a whole of system approach, and Tiriti/Treaty-based delivery of health and disability services. Those who identified as having a disability focused particularly on inclusion and participation.
Decision making
Inconsistency in decision making In our discussions, people raised concern about how decisions are made within and across organisations in the sector. They commented that the current complex set of arrangements leads to a lack of clarity about how to influence change, resulting in delays and, sometimes, impasses that are hard to progress.
Previous reviews highlighted that decision making across DHBs is unduly messy. In 2009, the Ministerial Review Group found that the incentives for regional collaboration were not strong and parochial interests could prevent collective regional decision making from occurring. At that time, Treasury commented on “fragmented decision-making” in the sector and noted that “collaborative mechanisms and accountabilities are weak, and do not lead to rational and coherent service and capacity planning or efficient use of resources”.123
The changes proposed to strengthen regional decision making did not progress as anticipated. In 2015, the Capability and Capacity Review commented that that “DHBs [are] often operating in regional and financial isolation”, suggesting that a new system operating model needed to “[r]eject the approach that regional DHB silos are acceptable” and move towards a “cooperative and collaborative national approach of delivery of outcomes”.124
Increasingly in health systems in developed countries, jurisdictions have moved toward decentralised systems with a high degree of devolved and networked decision-making arrangements. The New Zealand Productivity Commission, in its work to support improved outcomes from social services, identified two system-level architectural designs that are characterised by their approach to distribution of decision

INTERIM REPORT | PŪRONGO MŌ TĒNEI WĀ
PAGE | 63
rights. These are ‘top-down control’ (where decision-making power sits primarily with the relevant minister or chief executive of a central government agency) and ‘devolution’ (where substantial decision-making powers and responsibilities are devolved to autonomous or semi-autonomous organisations with separate governance structures).125
In reality, our system includes a complex mix of different decision-making models, leading the Ministry of Health to characterise it as being ‘semi-devolved’.126 There is a mix of centrally prescribed direction (for example, regarding specification of the range of services required), that runs alongside a degree of devolved decision rights (with DHBs required to assess and meet local need) and many other examples of different arrangements in between.
The role of the [Ministry of Health] in providing the health system stewardship over the next five-ten years is critical to driving the change we require in health outcomes. The DHB model is well placed to respond to local needs. However, it currently occurs in a vacuum of poor strategic vision from the centre about how services should be organised nationally, regionally and, most importantly, sub regionally. (Group submission)
From our discussions with stakeholders and analysis of the system, we have identified that there is still no coherent decision-making framework to guide the sector. There are no transparent, consistent principles to guide what decisions should be taken where within the system. It appears that existing collaborative efforts are mainly dependent on goodwill and personal relationships.
Limited flexibility and autonomy for DHBs at a district level Improving responsiveness to local populations was a key aim of the reforms in the early 2000s. At face value, the system created under the New Zealand Public Health and Disability Act 2000 appears to have a high degree of devolved decision rights.
However, people have highlighted significant constraints on DHBs’ flexibility to take strategic decisions so they can tailor responses to local need.
Commonly identified barriers include:
the service coverage schedule (which specifies minimum requirements for access to a range of services and standards for safety and quality)
nationally agreed contracts for devolved services (for example, such as the PHO Service Agreement) multi-employer collective agreements (negotiated between DHBs and employee unions) that
specify terms and conditions for the majority of staff.
For example, nearly two-thirds of DHB spending with non-DHB providers is through nationally negotiated contracts. Around $2.5 billion of devolved DHB spending is allocated to national contracts for primary care, community pharmacy, and aged residential care. A further $871 million is controlled by the Pharmaceutical Management Agency (PHARMAC) to purchase pharmaceuticals.

NEW ZEALAND HEALTH AND DISABILITY SYSTEM REVIEW | HAUORA MANAAKI KI AOTEAROA WHĀNUI
PAGE | 64
F I G U R E 4 . 4 : A L L O C A T I O N O F D H B F U N D I N G , 2 0 1 7 / 1 8
Note: CPB = combined pharmaceutical budget; IDF = inter-district flow; PHARMAC - Pharmaceutical Management Agency; PHO = primary health organisation.
S O U R C E : M I N I S T R Y O F H E A L T H , D H B F I N A N C I A L A C C O U N T S .
National prioritisation overrides locally determined prioritisation Research undertaken about how much autonomy DHBs have to steer the direction towards local priorities also concluded that “the priorities and requirements of central government and the weight of institutional history were found to be the most influential factors on DHB decision making and practice, with flexibility and innovation only exercised at the margins“.127
However, against this, we recognise both the need for consistency in ensuring equitable access and the potential efficiencies from managing some DHB contract negotiations on a national basis. The system needs to balance how far the level of constraint imposed impacts on the ability of DHBs to deliver on their prescribed functions.
Mandates are unclear and functions overlap across organisations Many stakeholders have commented on the overlap in the functions of organisations and a lack of clarity on mandates, leading to duplication of effort, inefficiency, and reduced accountability for performance. Calls have been made to clarify roles and relationships between entities.
This lack of clarity was a key theme in the findings of the Ministerial Review Group in 2009, which led at the time to a conclusion that the sector was not well placed to meet current and forthcoming clinical and fiscal challenges. Treasury commented then on the “lack of clarity in the roles and functions, and relationships between, the organisations in the sector, including the Ministry, DHBs, and PHOs”.128 Sector feedback we received indicates this view remains current, as the following quote exemplifies:
$b $2b $4b $6b $8b $10b $12b $14b $16b
Non-national contract spending
Pharmac CPB
Community pharmacy
Aged residential care
PHO spending
Funder arm spending
Provider arm spending
IDFs
Total expenses (including IDFs)
INTERIM REPORT | PŪRONGO MŌ TĒNEI WĀ
PAGE | 65
The delineation between the commissioning functions of the Ministry of Health …, DHBs and PHOs is sometimes unclear. This can result in a lack of coordination of services, unplanned variation in the delivery of services, and ineffective use of funding resources. There is also a need for improved coordination with national bodies that have commissioning functions, such as the Accident Compensation Corporation … and the Ministry of Social Development … (Group submission)
There are also numerous examples of where processes, or analysis, are being replicated in numerous boards when it could be argued that “doing it once” would be much more cost effective. While shared services agencies are assisting in reducing some of this duplication, we have observed many examples where costs might be reduced by more sharing of knowledge or expertise; or by combining to improve purchasing power in the market, especially as digital technologies become more pervasive.
We need to re-think our approach to procurement of digital resources, shifting from a local approach to a coherent national strategy and framework … There are significant opportunities for DHBs to coordinate their combined investment, to communicate their requirements and more effectively influence suppliers and markets. (Organisation submission)
Collaborative planning
Long-term service planning framework Service planning has been defined as the process of determining the health needs of a population and how those needs can be met through the effective allocation and deployment of existing and anticipated future resources.129 It focuses on developing and implementing change in service design and configuration and happens within the broader context of planning that spans government policies, strategies, and formal accountability documents.
The starting point for planning should be understanding population health needs, assessing how well these needs are being met, and deciding priorities to drive towards the goal of equitable health and wellbeing outcomes for all New Zealanders. The current planning framework places little emphasis on a formal requirement to undertake health needs assessments or to develop medium-term strategic priorities at national, regional, or local levels. The system does not have a coherent service policy and planning framework or a national overview of the current configuration of publicly funded services.
Rather, the focus appears to be on specifying the requirements for the provision of particular services, which are then referenced throughout many planning and accountability documents. These documents include:
nationally focused service strategies and action plans (for example, in relation to cancer and mental health services)
the Operational Policy Framework the Nationwide Service Framework.

NEW ZEALAND HEALTH AND DISABILITY SYSTEM REVIEW | HAUORA MANAAKI KI AOTEAROA WHĀNUI
PAGE | 66
There was a consistent view that the short-term and fragmented nature of planning and the requirement for DHBs to meet zero or low deficits every year, negatively affects how the sector works. The approach to improving health outcomes and equity requires a long-term approach yet it sometimes appears that the system is run as a series of unconnected short-term projects that do not use standardised planning tools and methods.
No mechanisms to enforce or hold DHBs accountable collectively for regional planning decisions As noted previously, the need to formalise and strengthen regional decision-making structures was
a key theme from the 2009 Ministerial Review Group, including a recommendation that DHBs should collaborate to produce regional service plans and that DHB chairs and chief executives should have delegated authority to make decisions at the regional level. Any disputes would be escalated to a new entity, the National Health Board. These recommendations were not implemented.
This theme was also prominent in the Long-Term Service Framework programme (established in the Ministry of Health) that called for the rebalance of some decisions towards regions.
In 2010, legislation was changed to lay the foundation for increased levels of regional collaboration. Previously, the New Zealand Public Health and Disability Act 2000 had required individual DHBs to develop annual plans and three-yearly district strategic plans. The 2010 change set aside the requirement for district strategic plans (that included a requirement for consultation with the public) in favour of annual regional plans (set out in the New Zealand Public Health and Disability (Planning) Regulations 2011).
These regulations require the regional plans to include a strategic element and an implementation element, set out expectations about the content for each element, and define the procedural elements for the development of these plans as being (under regulation 7):
(1) A DHB that is involved in preparing a regional service plan must consult with the public in relation to the plan if the Minister considers that—
(a) the plan proposes changes to services, including to service eligibility, access, or the way services are provided; and
(b) the proposed changes will have a significant impact on recipients of services, their caregivers, or providers.
(2) Before the Minister and the DHBs agree on the regional service plan, the chief executive and the chairperson of the board of each DHB that is to participate in the plan must agree to and sign the plan on behalf of the DHB.
(3) The implementation element of a regional service plan must be reviewed annually.
(4) Regional service plans must be updated annually.
In the system today, we see some regional collaboration across DHBs through development of regional services and plans and some commitment to the shared support agencies. We can also see examples in the sector of clinically driven regional initiatives.

INTERIM REPORT | PŪRONGO MŌ TĒNEI WĀ
PAGE | 67
However, while the legislation provides a clear indication that coordination is important, the overall accountability framework does not hold DHBs to account collectively for regional performance. DHB Boards are required to sign off the regional service plans, but individual DHBs still need full board sign off for collective spending decisions.
The individual financial and service accountability for each DHB means that the shared accountability for regional services is often unclear and competing imperatives around resources or service sustainability can get in the way of a broader agreement in the interest of a region. (Group submission)
Our recent discussions with stakeholders suggest that the challenges highlighted in previous reviews of the system still exist. There have been calls for increased levels of coordination and accountability at a regional level.
It is entirely proper that there be district specific input into the running of local health services so the current structure will suffice but should be coordinated at regional level. (Individual submission)
Currently, there are no standards or clear expectations against which to assess either a region’s collective planning efforts or the contributions made by individual DHBs. Arrangements are still largely dependent on relationships and goodwill.
Supporting better intersectoral collaboration The World Health Organization emphasises the need for health agencies to engage with other sectors of government to improve health equity. It has provided evidence from a broad range of case studies in many countries and cultures, demonstrating the positive impact of intersectoral action and the importance that populations attach to such approaches.130
Stakeholders in New Zealand strongly endorsed the value of intersectoral approaches:
There are certain themes that emerge repeatedly during our discussions with our workforce, our population and our community. The social determinants are the biggest challenge; warm, dry, affordable and appropriate housing for our diverse populations (for example, housing that accommodates our Pacific households who do not configure easily into a two bedroom structure). Wages that reflect the realities and pressures of life in [New Zealand], access to transport, nutritious food, and more subsidisation of healthcare in areas that hit diverse populations hardest, such as dental care and pharmaceuticals. We need better intersectoral collaboration. If we want to address the social determinants of health, then the decision makers from the agencies that can affect change in these areas need to be in communication and designing solutions, with the community that achieve the community’s outcomes. (Organisation submission)

NEW ZEALAND HEALTH AND DISABILITY SYSTEM REVIEW | HAUORA MANAAKI KI AOTEAROA WHĀNUI
PAGE | 68
However, stakeholders have commented that while a willingness to engage and work across sectors exists, the time and energy to do so must be balanced against a vast array of competing demands.
There are many New Zealand examples of where cross-sector collaboration has had positive impacts for communities. Whāngaia Ngā Pā Harakeke coordinates help from across sectors for people, including children, involved in police family violence callouts. Housing First gives homeless people with mental health and addiction needs a home with secure tenancy and supports to remain in that home, regardless of problems. Mana Whaikaha connectors are working with disabled people, employers, education providers, and community groups to build opportunities for disabled people to gain skills and get into sustainable jobs.
E X A M P L E S O F S U C C E S S F U L C R O S S - S E C T O R I N I T I A T I V E S
Healthy Families Lower Hutt The cross-sector initiative Healthy Families Lower Hutt, led by Hutt City Council, involves representatives from local iwi, the district health board, primary health organisations, the education sector, a sports trust, and the Ministry of Health, along with private sector representation from a New World owner and Catalyst Pacific Ltd.
A collaborative work programme created four examples of local systems change.
Healthy Active Streets and Spaces – leading development of the Streets Alive framework, which will provide practical guidance and measurable indicators to inform design decisions for streets and public spaces.
Active Transport – working closely with the community and council planners to encourage active transport, creating connections to local and city destinations.
Increasing Access to Water – reorienting funding towards water fountains and enabling pro-water and water-only places where people live, learn, work, and play (such as in schools), reaching close to 4,000 students, sports clubs, and community facilities.
Player of the Day – design of an alternative approach to break the association of food sponsorship of junior sport. For sports organisations that demonstrate a pro-water kaupapa (strategy, theme), player of the day certificates include free swimming pool passes. (Hutt Valley DHB provided this example.)
SmartStart An online service for expectant and new parents. It provides a single source of information on having a baby from a variety of different agencies (including from the health and disability sector, the Ministry of Social Development, and Inland Revenue) to reduce the burden on new parents interacting with government. (The Government Chief Digital Officer provided this example.)
INTERIM REPORT | PŪRONGO MŌ TĒNEI WĀ
PAGE | 69
Representation and engagement
Community ownership and engagement Meaningful and respectful partnership and engagement enables the aspirations, values, and needs of communities, consumers, and whānau to be reflected in the delivery of health and disability services, policies, and other decisions.
Key engagement mechanisms deployed by DHBs and other parts of the system include:
having community representation on DHB boards, including Māori representation proportional to population
establishing advisory councils and committees, including consumer councils involved in how health and disability services are delivered within and across communities
holding board and other meetings that are open to the public establishing other engagement groups managing active engagement programmes within community settings, for example to consulting on
specific initiatives. collecting and reporting patient feedback to the health-care system, usually through patient
surveys; for example, the Health Quality and Safety Commission routinely measures patient experience for adult inpatients and in primary healthcare settings
working with advocacy and patient-affiliated groups, such as the Cancer Society and other NGOs, that may also be contracted to provide services and advice.
Institutions also play a key role, including the Office for Disability Issues, serving as the focal point within government on disability issues and, as part of its core functions, helps to facilitate an effective working relationship between the disability sector and government agencies.
While the importance of consumer involvement in shaping health care is widely acknowledged and supported, evidence of the effectiveness of specific mechanisms is limited.131 For example, one of the primary ways consumers have been involved is by acting as representatives on advisory councils and committees, bringing with them the unique first-hand knowledge acquired through their experience of being active users of the system and providing insights that might otherwise be overlooked.132 However, research argues that some individuals may find it difficult to participate actively in conversations with ‘professionals’. Further, the ‘representatives’ may not accurately represent the views of an entire cohort of consumers, which may limit the range of interests and diversity of experiences being represented for consideration in the decision-making process.133
Impact of elected DHB board members The election of DHB board members is seen as a critical means of ensuring community engagement. DHB boards comprise seven members elected by the community every three years (concurrently with local government elections) and up to four members appointed by the Minister of Health. The Minister of Health appoints the chair and the deputy chair of each board from among elected and appointed members. Under the legislation, the Minister must endeavour to ensure that Māori membership on the board is proportional to the number of Māori in the DHB’s resident population and that the board has at least two Māori members.
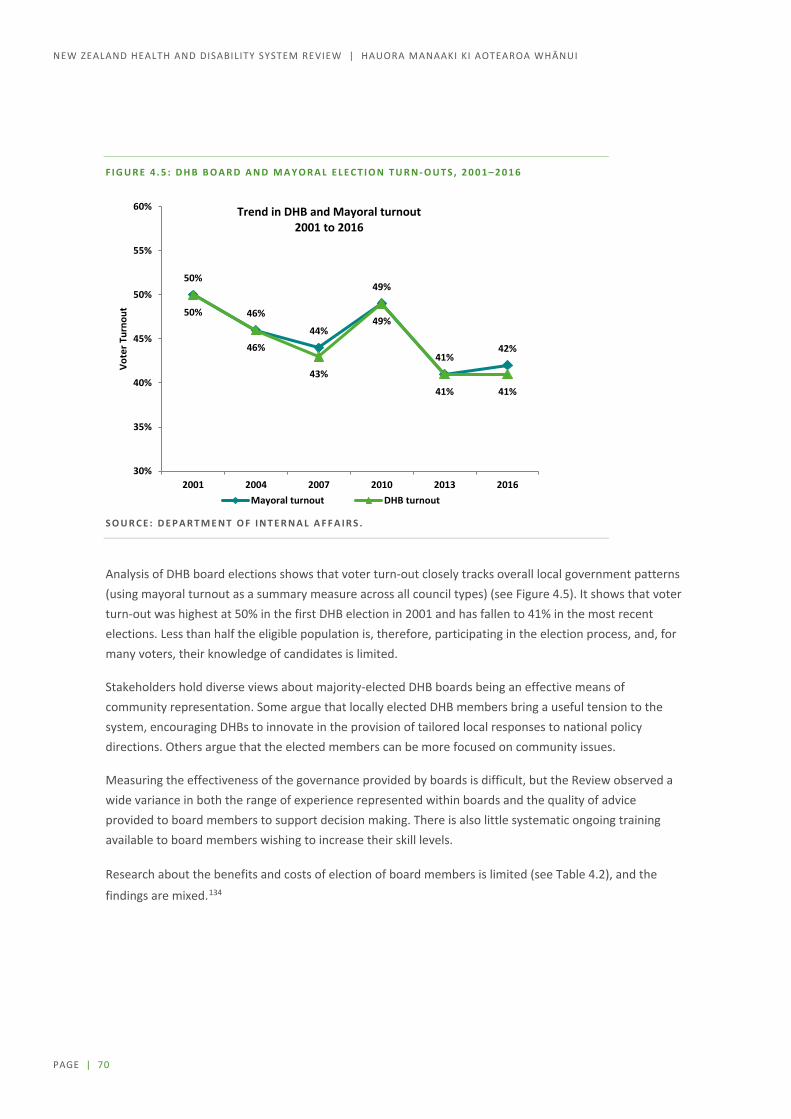
NEW ZEALAND HEALTH AND DISABILITY SYSTEM REVIEW | HAUORA MANAAKI KI AOTEAROA WHĀNUI
PAGE | 70
F I G U R E 4 . 5 : D H B B O A R D A N D M A Y O R A L E L E C T I O N T U R N - O U T S , 2 0 0 1 – 2 0 1 6
S O U R C E : D E P A R T M E N T O F I N T E R N A L A F F A I R S .
Analysis of DHB board elections shows that voter turn-out closely tracks overall local government patterns (using mayoral turnout as a summary measure across all council types) (see Figure 4.5). It shows that voter turn-out was highest at 50% in the first DHB election in 2001 and has fallen to 41% in the most recent elections. Less than half the eligible population is, therefore, participating in the election process, and, for many voters, their knowledge of candidates is limited.
Stakeholders hold diverse views about majority-elected DHB boards being an effective means of community representation. Some argue that locally elected DHB members bring a useful tension to the system, encouraging DHBs to innovate in the provision of tailored local responses to national policy directions. Others argue that the elected members can be more focused on community issues.
Measuring the effectiveness of the governance provided by boards is difficult, but the Review observed a wide variance in both the range of experience represented within boards and the quality of advice provided to board members to support decision making. There is also little systematic ongoing training available to board members wishing to increase their skill levels.
Research about the benefits and costs of election of board members is limited (see Table 4.2), and the
findings are mixed.134
50%
46%
44%
49%
41%42%
50%
46%
43%
49%
41% 41%
30%
35%
40%
45%
50%
55%
60%
2001 2004 2007 2010 2013 2016
Vote
r Tur
nout
Trend in DHB and Mayoral turnout2001 to 2016
Mayoral turnout DHB turnout
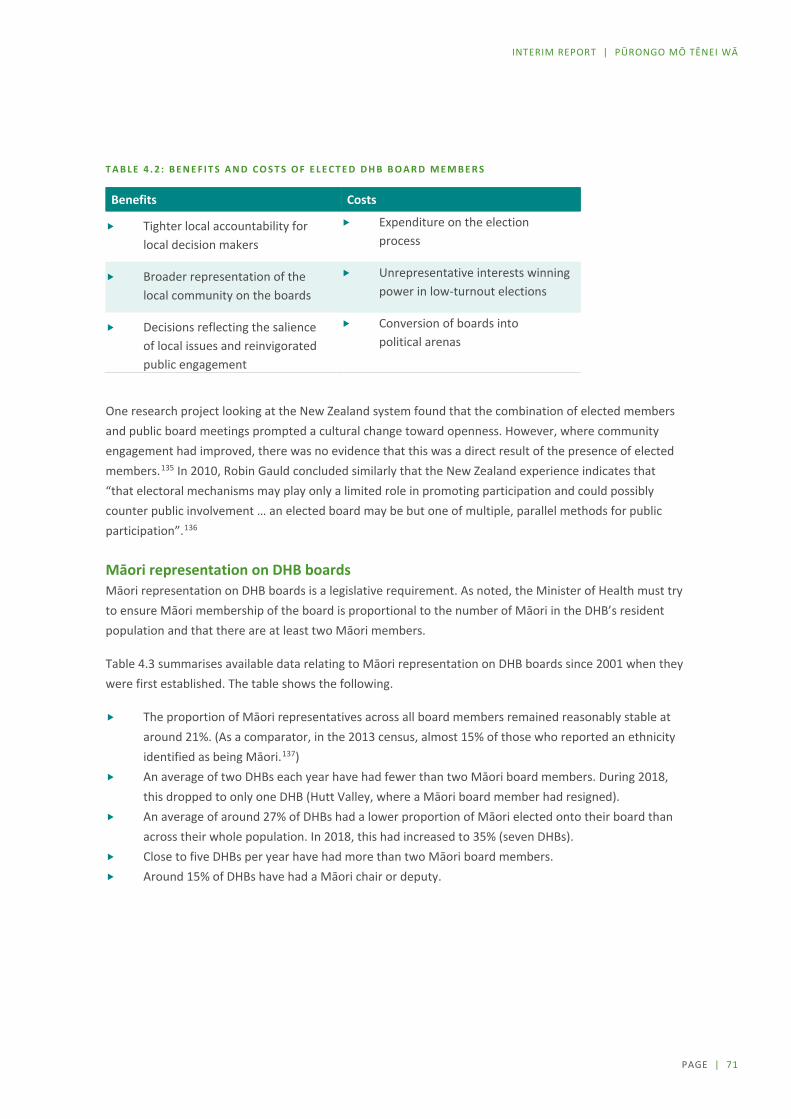
INTERIM REPORT | PŪRONGO MŌ TĒNEI WĀ
PAGE | 71
T A B L E 4 . 2 : B E N E F I T S A N D C O S T S O F E L E C T E D D H B B O A R D M E M B E R S
Benefits Costs
Tighter local accountability for local decision makers
Expenditure on the election process
Broader representation of the local community on the boards
Unrepresentative interests winning power in low-turnout elections
Decisions reflecting the salience of local issues and reinvigorated public engagement
Conversion of boards into political arenas
One research project looking at the New Zealand system found that the combination of elected members and public board meetings prompted a cultural change toward openness. However, where community engagement had improved, there was no evidence that this was a direct result of the presence of elected members.135 In 2010, Robin Gauld concluded similarly that the New Zealand experience indicates that “that electoral mechanisms may play only a limited role in promoting participation and could possibly counter public involvement … an elected board may be but one of multiple, parallel methods for public participation”.136
Māori representation on DHB boards Māori representation on DHB boards is a legislative requirement. As noted, the Minister of Health must try to ensure Māori membership of the board is proportional to the number of Māori in the DHB’s resident population and that there are at least two Māori members.
Table 4.3 summarises available data relating to Māori representation on DHB boards since 2001 when they were first established. The table shows the following.
The proportion of Māori representatives across all board members remained reasonably stable at around 21%. (As a comparator, in the 2013 census, almost 15% of those who reported an ethnicity identified as being Māori.137)
An average of two DHBs each year have had fewer than two Māori board members. During 2018, this dropped to only one DHB (Hutt Valley, where a Māori board member had resigned).
An average of around 27% of DHBs had a lower proportion of Māori elected onto their board than across their whole population. In 2018, this had increased to 35% (seven DHBs).
Close to five DHBs per year have had more than two Māori board members. Around 15% of DHBs have had a Māori chair or deputy.

NEW ZEALAND HEALTH AND DISABILITY SYSTEM REVIEW | HAUORA MANAAKI KI AOTEAROA WHĀNUI
PAGE | 72
T A B L E 4 . 3 : M Ā O R I R E P R E S E N T A T I O N O N D H B B O A R D S , A V A I L A B L E D A T A
F R O M S E L E C T E D Y E A R S 2 0 0 1 – 2 0 1 8
2001 2004 2007 2010 2013 2016 2018
DHBs with fewer than two Māori board members
0 1 5 2 5 0 1
DHBs with lower proportion of Māori on board than in population
4 5 5 4 8 6 7
DHBs with more than two Māori board members
4 3 6 5 5 5 5
DHBs with Māori chair or deputy 5 4 4 1 1 3 3
Total number of Māori board members across all DHBs
50 51 47 44 40 45 46
Percentage Māori board members across all DHBs
22% 22% 20% 20% 18% 22% 22%
Total number of board members across all DHBs
231 231 231 220 220 209 208
Note: Southern DHB has been under the control of a Commissioner (under section 31 of the New Zealand Public Health and Disability Act 2000) since June 2015.
S O U R C E : D A T A S U B M I T T E D B Y T H E M I N I S T R Y O F H E A L T H T O T H E W A I T A N G I T R I B U N A L ( W A I 2 5 7 5 ) .
Clearly, Māori representation on boards is only one level of Māori participation in health sector governance.
Developing Māori representation across the sector at the governance level and shared decision making with the Crown The NZ Public Health and Disability Act 2000 specifies te Tiriti o Waitangi/ the Treaty of Waitangi obligations of DHBs, which includes, but is not limited to, ensuring and providing relevant information on meeting the DHBs obligations to:
establish and maintain processes that enable Māori to participate in, and contribute to, strategies for Māori health improvement
foster the development of Māori capacity for participating in the health and disability sector and for providing for the needs of Māori through building the capability of all DHB staff in Māori cultural competency and te Tiriti o Waitangi/The Treaty of Waitangi.
The Ministry of Health requires all DHBs to report on how they are meeting these obligations as part of their annual planning process. Most Boards have some type of ‘partnership board’ arrangement in place between the DHB and manawhenua (local iwi groups). While the form and role of these groups differ across DHBs, commonly their main focus is on improving local and regional Māori health outcomes.

INTERIM REPORT | PŪRONGO MŌ TĒNEI WĀ
PAGE | 73
Functions of these partnership agreements vary but examples include: Māori needs assessment and strategic planning; developing cultural competency and Tiriti / Treaty understanding of the health workforce and recruitment and retention strategies for Māori staff; incorporating tikanga and Māori knowledge into service planning and delivery; and engagement in decision making, and accountability monitoring.
However, it was acknowledged by the Crown and witnesses at Wai 2575138 that these partnership boards were regionally variable, were not always involved in decision making at the governance level, had less ‘mana’ than a statutory board, and had become a ‘tokenistic’ ‘tick box’ for DHBs. Further, a number of those on the partnership boards lacked the capacity and capability to contribute effectively, and as iwi/hapū representatives on a number of boards were not always able to regularly attend meetings.
Stakeholders raised several significant issues focused on the need to improve and develop Māori participation and representation across the sector at the governance level and to redistribute decision-making power in relation to funding and contracting arrangements.
Specific themes include:
a perceived lack of support for Māori (and Pacific) leadership development a lack of focus on and investment in local leadership to deliver on local priorities the need for developing stronger iwi partnerships with DHBs a lack of Māori-specific policy development and implementation decision-making models (and funding arrangements) constraining local health providers from taking
innovative approaches to local health issues and insufficient investment in preventive care approaches
contract-driven decision making, including a distribution of resources and power in the system that constrains decisions and choices.
The best health and disability system for New Zealand in 2030 is one that has been designed with Iwi and Māori, and as such, will have seen a drastic reduction in health disparity. The holistic approach and world view of Māori will be at the heart of investment, planning, design and delivery. We say this with the conviction that what works for Māori will work for all New Zealanders. (Organisation submission)

NEW ZEALAND HEALTH AND DISABILITY SYSTEM REVIEW | HAUORA MANAAKI KI AOTEAROA WHĀNUI
PAGE | 74
Accountability and performance
Accountability and reporting requirements are labour intensive Current extensive accountability mechanisms for DHBs are set out in Table 4.4. Reporting requirements relating to financial and other performance against specific measures (such as health targets) are covered later in this section.
T A B L E 4 . 4 : A C C O U N T A B I L I T Y M E C H A N I S M S
Government expectations These documents set out the policies of the government of the day and the role DHBs are expected to play in implementing those policies.
Annual letter of expectations – sets out the strategic priorities of the government for the health and disability system.
Enduring letter of expectations – is issued periodically by the Minister of Finance and Minister of State Services to all Crown entities (including DHBs) to provide a more general set of expectations, including, for example, the need to achieve value for money and strong entity performance.
Planning documents These documents set out the short-term course DHBs intend to follow to best meet the health needs of their populations.
Annual plan – sets out how a DHB delivers health services locally to meet government priorities, with a focus on health equity, and how this can be provided in a financially responsible manner and in line with the DHB’s role and functions. Māori health plans are incorporated into the annual plans.
Regional service plan – identifies shared goals for a region and sets out how these will be achieved.
Accountability documents These documents allow Parliament and the public to measure the performance of DHBs and to hold them accountable.
Statement of intent – is required every three years to set out the high-level objectives and strategic focus for the current and next three years.
Statement of performance expectations – is a component of the annual plan, provides forecast financial statements for the current year.
Crown funding agreement – sets out the agreement (including accountability requirements) between the Minister and DHBs on the public funding the DHB will receive in return for providing services to its resident population.
Operational policy framework – is a set of business rules, policies, and principles for the operating functions of DHBs.
Service coverage schedule – sets out the national minimums for the range and nature of health services to be funded by DHBs. For some services, the schedule also covers subsidies and user charges as well as specific quality and audit requirements.
Annual report – reports on DHB performance for the year against the measures set out in the DHB’s statement of performance expectations and their current statement of intent.
Quality accounts – is a means by which healthcare providers account annually for the quality of the services they deliver, just as financial accounts show how an organisation uses its money.

INTERIM REPORT | PŪRONGO MŌ TĒNEI WĀ
PAGE | 75
DHB stakeholders commented that accountability mechanisms and associated reporting requirements are resource intensive. They also highlighted the tendency of the centre to add priorities to an ever-expanding list of demands (see Table 4.5 as an example), rather than reassessing and removing items from the list:
T A B L E 4 . 5 : G O V E R N M E N T ’ S A N N U A L P L A N N I N G P R I O R I T I E S F O R H E A L T H 2 0 1 7 / 1 8
As an example, see the Government’s Annual Planning Priorities for 2017/18. The priorities seem to be … everything. (Organisation submission)
Better Help for Smokers to Quit Bowel Screening Child Health Childhood Obesity Plan Disability Support Services Faster Cancer Treatment Healthy Ageing Healthy Mums and Babies Improved Access to Elective Surgery Improving Quality Increased Immunisation Keeping Kids Healthy Living Well with Diabetes Living Within our Means Mental Health Pharmacy Action Plan Primary Care Integration Prime Minister’s Youth Mental Health Project Raising Healthy Kids Reducing Unintended Teenage Pregnancy Shorter Stays in Emergency Departments Supporting Vulnerable Children
Issues relating to measurement of system performance The Ministry of Health is responsible for monitoring system performance and provides reports to the Minister of Health (and, in some cases, the Minister of Finance) each month. Over and above the accountability mechanisms and associated reporting outlined above, DHBs must complete a variety of financial and non-financial performance reporting (Table 4.6).

NEW ZEALAND HEALTH AND DISABILITY SYSTEM REVIEW | HAUORA MANAAKI KI AOTEAROA WHĀNUI
PAGE | 76
T A B L E 4 . 6 : F I N A N C I A L A N D N O N - F I N A N C I A L P E R F O R M A N C E R E P O R T I N G B Y D H B S
Type Mechanism
Financial performance
DHB monthly financial report – Each DHB provides templated financial data to the Ministry the end of each month.
DHB sector financial report – The Ministry of Health completes a monthly sector wide report, provided to ministers each month and, in due course, these are published on the Ministry’s website. The report summarises the DHBs’ financial performance (for example, operating results and capital expenditure) for the year to date based on data and comments provided by DHBs in their monthly financial reports. It includes reports on the Ministry’s interactions with the sector and highlights where the sector or an individual DHB reports a significant variance against financial budgets set in the DHB’s annual plan. There is also commentary on sector-wide issues with financial implications.
Non-financial performance
Additional mechanisms for monitoring non-financial performance of DHBs include:
Health targets – a set of national performance measures designed to improve the performance of health services that reflect significant public and government priorities. The Ministry of Health is developing a new set of performance measures, with a focus on population health outcomes.
DHB quarterly summaries – spreadsheet files reporting each DHB’s performance against each of the health targets as a percentage are published quarterly on the Ministry’s website.
PHO quarterly summaries – a dashboard summary (referred to as the ‘PHO league table’ of each PHO’s performance against two of the health targets (Increased Immunisation and Better Help for Smokers to Quit) is published quarterly on the Ministry’s website.
Elective Services Patient Flow Indicators – a measure of whether DHBs are meeting the required performance standard at various points in the patient journey towards provision of elective surgery. These indicators are published by DHB and collated on a national basis, including standardised values that allows comparison of DHB results irrespective of their size.
Stakeholders, particularly those from DHBs and PHOs, have raised concerns about measurement of system performance, saying no common view exists about what ‘good performance’ or success for the system would look like. As a result, financial performance (with a focus on DHB deficits) becomes the key driver – there is no sense of seeking a balanced view across other dimensions of performance.

INTERIM REPORT | PŪRONGO MŌ TĒNEI WĀ
PAGE | 77
It is important at a national level that consistent aggregated measures exist across DHBs to enable the health system to understand performance, opportunities for improvement and to articulate an authoritative performance narrative to central agencies and wider stakeholders. (Organisation submission)
The Health Quality and Safety Commission also plays an active role in monitoring and improving performance. The Commission’s Atlas of Healthcare Variation is a well-developed tool that shows variation in health services and outcomes by DHB. The Commission’s role is to work with the sector to improve performance and reduce unwarranted variation in patterns of care, but it does not have a mandate to hold an organisation to account for addressing such variation.
In addition to the performance management mechanisms outlined above, the Ministry of Health also runs a system quality improvement programme. The System-Level Measures (SLMs) framework aims to improve health outcomes for people by supporting DHBs to work in collaboration with health system partners (primary, community, and hospital) using specific quality improvement measures. It provides a foundation for continuous quality improvement and system integration.
District alliances are responsible for developing local relationships and trust between health system partners in their district, having a whole-of-system focus, and leading the development and implementation of the SLM improvement plan.
PHOs have an obligation, through the PHO Services Agreement, to participate in the development and implementation of the SLM improvement plan. $23 million of PHO performance funding is used to build capacity and capability for development and implementation of the annual SLM improvement plan. Based on the enrolment register, PHOs are paid 25% in quarter 1, followed by 50% in quarter 2 on the Ministry’s approval of the SLM plan. The last 25% is paid in quarter 4 and is ‘at-risk’ based on achieving milestones.
The settlement of the remaining 25% of SLM payment has generally been based on whether the alliance implemented the plan. The Ministry makes this decision, and so far no such payments have been withheld despite milestones being frequently missed.
Limited options to enforce accountabilities or impose sanctions We have identified an array of accountability mechanisms and note that the associated reporting requirements are standardised – the demands are the same on smaller DHBs that work within lower levels of capacity as they are on the largest. However, despite the numerous mechanisms and significant reporting required, the accountability arrangements apparently have few ‘teeth’, and there is little evidence of change happening as a result of accountability mechanisms being applied.
The Ministry of Health monitors the performance of the DHBs. In the case of repeated performance failure, the Minister of Health may exercise specific powers of sanction, for example appointing a Crown monitor or replacing a DHB’s board with a commissioner. However, this has occurred in only rare circumstances.
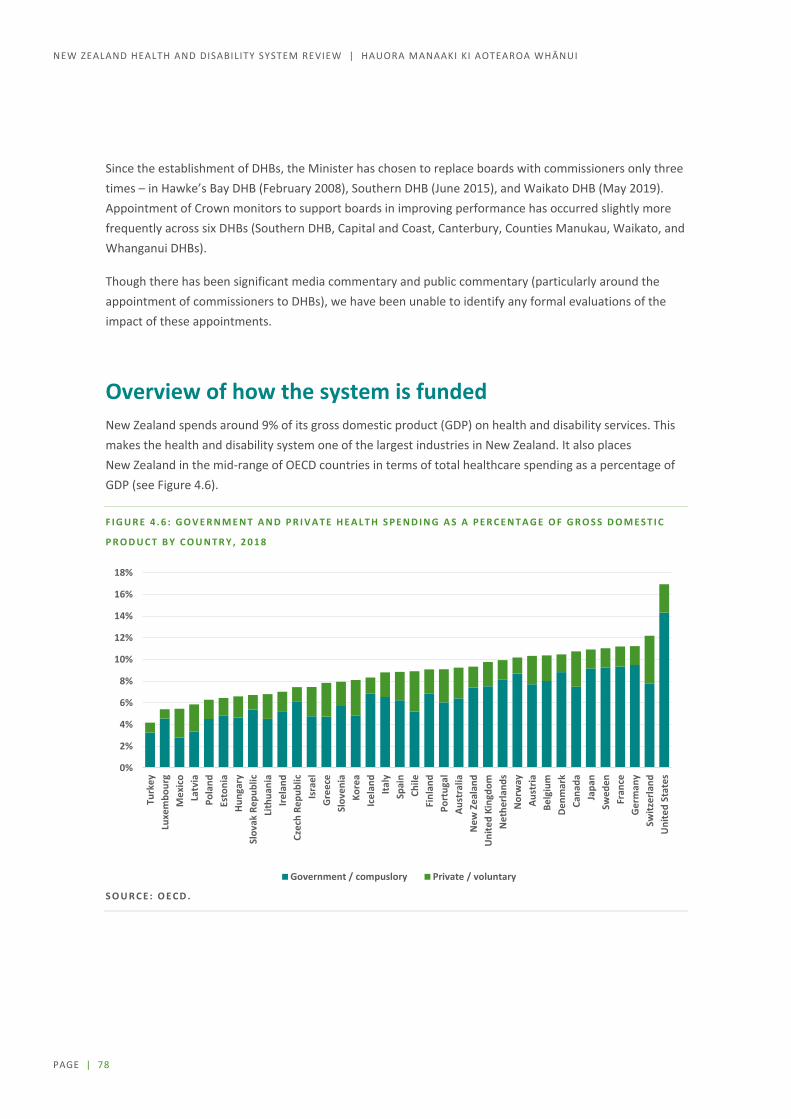
NEW ZEALAND HEALTH AND DISABILITY SYSTEM REVIEW | HAUORA MANAAKI KI AOTEAROA WHĀNUI
PAGE | 78
Since the establishment of DHBs, the Minister has chosen to replace boards with commissioners only three times – in Hawke’s Bay DHB (February 2008), Southern DHB (June 2015), and Waikato DHB (May 2019). Appointment of Crown monitors to support boards in improving performance has occurred slightly more frequently across six DHBs (Southern DHB, Capital and Coast, Canterbury, Counties Manukau, Waikato, and Whanganui DHBs).
Though there has been significant media commentary and public commentary (particularly around the appointment of commissioners to DHBs), we have been unable to identify any formal evaluations of the impact of these appointments.
Overview of how the system is funded New Zealand spends around 9% of its gross domestic product (GDP) on health and disability services. This makes the health and disability system one of the largest industries in New Zealand. It also places New Zealand in the mid-range of OECD countries in terms of total healthcare spending as a percentage of GDP (see Figure 4.6).
F I G U R E 4 . 6 : G O V E R N M E N T A N D P R I V A T E H E A L T H S P E N D I N G A S A P E R C E N T A G E O F G R O S S D O M E S T I C
P R O D U C T B Y C O U N T R Y , 2 0 1 8
S O U R C E : O E C D .
0%
2%
4%
6%
8%
10%
12%
14%
16%
18%
Turk
eyLu
xem
bour
gM
exic
oLa
tvia
Pola
ndEs
toni
aHu
ngar
ySl
ovak
Rep
ublic
Lith
uani
aIre
land
Czec
h Re
publ
icIs
rael
Gre
ece
Slov
enia
Kore
aIc
elan
dIta
lySp
ain
Chile
Finl
and
Port
ugal
Aust
ralia
New
Zea
land
Uni
ted
King
dom
Net
herla
nds
Nor
way
Aust
riaBe
lgiu
mDe
nmar
kCa
nada
Japa
nSw
eden
Fran
ceG
erm
any
Switz
erla
ndU
nite
d St
ates
Government / compuslory Private / voluntary

INTERIM REPORT | PŪRONGO MŌ TĒNEI WĀ
PAGE | 79
Around 81% of healthcare spending is funded through Government, with 71% coming from Vote Health and 10% coming through the accident compensation scheme. The remaining 19% comes through private health insurance (5%) and out-of-pocket payments by individuals (14%). Once again, this is broadly in line with other OECD countries.
F I G U R E 4 . 7 : D I S T R I B U T I O N O F H E A L T H C A R E S P E N D I N G , 2 0 1 8
S O U R C E S : T R E A S U R Y , A C C , H O U S E H O L D E C O N O M I C S U R V E Y ( 2 0 1 6 / 1 7 ) , I N T E R N A L C A L C U L A T I O N S .
Evidence that some system and funding arrangements perform better The OECD’s more recent classification of health systems classifies systems in two broad groups – those characterised by a reliance on market mechanisms in service provision and those characterised largely by public provision and public insurance (illustrated in Figure 4.8).
Using this classification system, New Zealand is in group 6 alongside Hungary, Ireland, Italy, Norway, Poland, and the United Kingdom. The OECD describes this group as having:
heavily regulated public health systems, where gate-keeping exists and the budget constraint for health expenditure is more stringent than most other OECD countries. However, there are choices available in terms of providers and complementary/ supplementary private insurance.
71%
10%
5%
14%
Vote health ACC Private Insurance Out of pocket
Total spending
Spending per person
Vote Health $16,176 million $3,340
ACC $2,171 million $448
Private insurance
$1,244 million $257
Out of pocket payments
$3,188 million $658

NEW ZEALAND HEALTH AND DISABILITY SYSTEM REVIEW | HAUORA MANAAKI KI AOTEAROA WHĀNUI
PAGE | 80
F I G U R E 4 . 8 : G R O U P S O F C O U N T R I E S S H A R I N G B R O A D L Y S I M I L A R I N S T I T U T I O N S
S O U R C E : I J O U M A R D , H O E L L E R , P , A N D R É , C , A N D N I C Q , C . 2 0 1 0 . H E A L T H C A R E S Y S T E M S : E F F I C I E N C Y A N D I N S T I T U T I O N S ( O E C D E C O N O M I C S D E P A R T M E N T W O R K I N G P A P E R S 7 6 9 ) .
The OECD undertook an analysis across 29 countries to determine whether certain institutional characteristics were related to higher life expectancy, after accounting for the level of spending and other socioeconomic and lifestyles factors. The results are outlined above in Figure 4.9.

INTERIM REPORT | PŪRONGO MŌ TĒNEI WĀ
PAGE | 81
F I G U R E 4 . 9 : P O T E N T I A L G A I N S I N L I F E E X P E C T A N C Y , B Y G R O U P
Note: Potential gains in life expectancy are derived from an output oriented data envelopment analysis with per capita health care spending and a composite indicator of socio-economic environment and lifestyle factors as inputs for 2007.
S O U R C E : I J O U M A R D , H O E L L E R , P , A N D R É , C , A N D N I C Q , C . 2 0 1 0 . H E A L T H C A R E S Y S T E M S : E F F I C I E N C Y A N D I N S T I T U T I O N S ( O E C D E C O N O M I C S D E P A R T M E N T W O R K I N G P A P E R S 7 6 9 ) .
Overall, the analysis found that adjusted life expectancy varied more within each of these clusters than it did between clusters. Countries performing well can be found in all institutional groups.
This suggests that changing the New Zealand system to align with systems overseas would be no guarantee of success. It also suggests significant opportunities exists to improve the current system without fundamental changes in how the system is structured or funded.

NEW ZEALAND HEALTH AND DISABILITY SYSTEM REVIEW | HAUORA MANAAKI KI AOTEAROA WHĀNUI
PAGE | 82
Should we move to a social insurance scheme? Some submitters have advocated for expanding the accident compensation scheme to cover all health and disability needs, not just accidents. This would essentially move New Zealand to a social insurance model, where individuals pay insurance premiums ring-fenced to be spent on health and disability services, rather than the current model where spending primarily comes from general taxation.
Significant differences exist between the model used for accident compensation and the health and disability system. One of the foundation principles for the accident compensation scheme is that the scheme compensates for the loss that a person has suffered. This recognises that introducing the accident compensation scheme removed the right of people injured to sue for losses. The scheme is also entitlement based. If someone is entitled to cover under the scheme, the accident compensation corporation (ACC) is legislatively required to provide income compensation, treatment, and rehabilitation to return that person to their previous level of independence, but has no obligation to provide anything further. In contrast, the health and disability system is needs based and focuses on achieving equitable health outcomes for the population. This means the health and disability system does guarantee access to some services (for example, waitlists for elective surgeries), but the system also funds a wider set of services than the entitlements under the accident compensation scheme (for example, population-based health services).
The Review’s Terms of Reference exclude changes to the accident compensation scheme, but allow consideration of the boundary between the scheme and the health and disability system. Given the OECD analysis cited above, it is unlikely that shifting to a social insurance scheme will in and of itself improve equity. However, as we progress our Phase Two work, we will explore what can be learnt from what the accident compensation scheme does well (such as case management), how the scheme and the health and disability system can better collaborate to improve services, and how the inequities created between individuals with similar needs arising from different causes can be better addressed.
Financing the future health and disability system: challenges and opportunities
Funding has not kept pace with increasing costs Many stakeholders were concerned that increases in funding have not kept pace with increasing costs in the sector. Other stakeholders said the problem is not a lack of funding, but how the system functions.
Adjusting for population growth and inflation, government health expenditure had a sustained period of growth from the mid-1990s to around 2010. However, since then, real per capita spending has been flat (as shown in Figure 4.10).
Periods of little growth in funding clearly add pressure to the system and may have contributed to issues such as staff burnout and underinvestment in capital maintenance. However, the Panel is not convinced that funding pressures alone are the main reason for the current inequity of health outcomes.
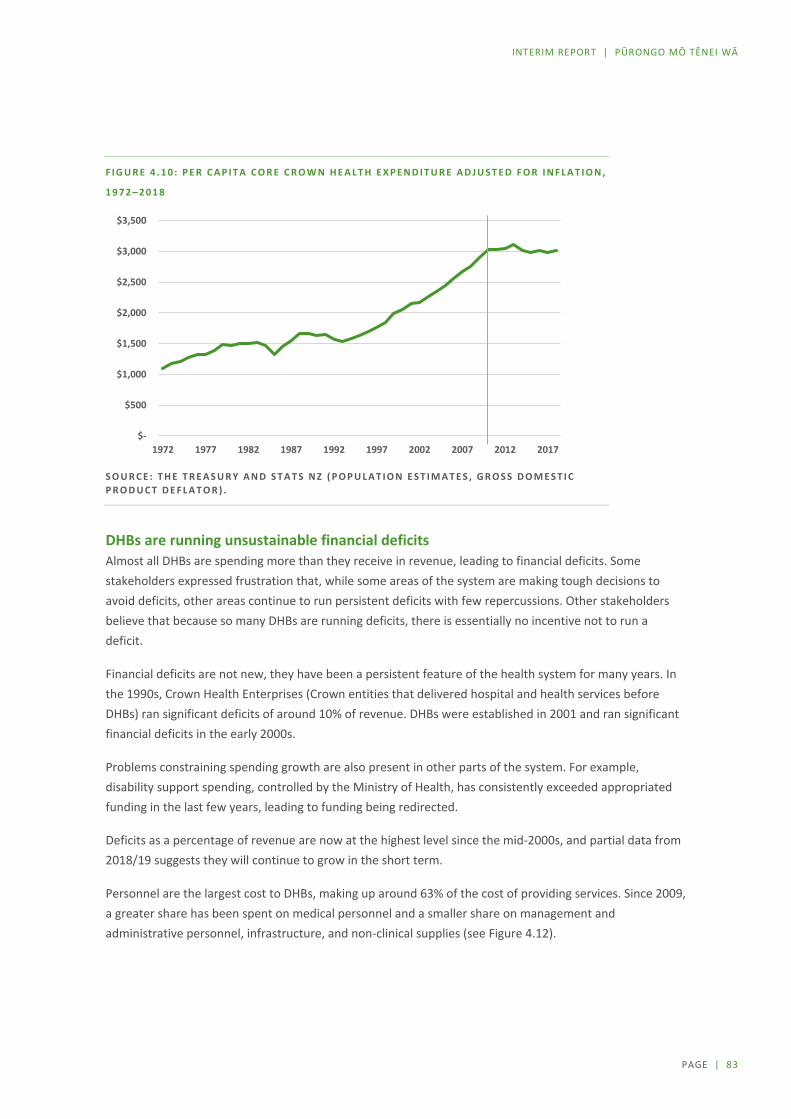
INTERIM REPORT | PŪRONGO MŌ TĒNEI WĀ
PAGE | 83
F I G U R E 4 . 1 0 : P E R C A P I T A C O R E C R O W N H E A L T H E X P E N D I T U R E A D J U S T E D F O R I N F L A T I O N ,
1 9 7 2 – 2 0 1 8
S O U R C E : T H E T R E A S U R Y A N D S T A T S N Z ( P O P U L A T I O N E S T I M A T E S , G R O S S D O M E S T I C P R O D U C T D E F L A T O R ) .
DHBs are running unsustainable financial deficits Almost all DHBs are spending more than they receive in revenue, leading to financial deficits. Some stakeholders expressed frustration that, while some areas of the system are making tough decisions to avoid deficits, other areas continue to run persistent deficits with few repercussions. Other stakeholders believe that because so many DHBs are running deficits, there is essentially no incentive not to run a deficit.
Financial deficits are not new, they have been a persistent feature of the health system for many years. In the 1990s, Crown Health Enterprises (Crown entities that delivered hospital and health services before DHBs) ran significant deficits of around 10% of revenue. DHBs were established in 2001 and ran significant financial deficits in the early 2000s.
Problems constraining spending growth are also present in other parts of the system. For example, disability support spending, controlled by the Ministry of Health, has consistently exceeded appropriated funding in the last few years, leading to funding being redirected.
Deficits as a percentage of revenue are now at the highest level since the mid-2000s, and partial data from 2018/19 suggests they will continue to grow in the short term.
Personnel are the largest cost to DHBs, making up around 63% of the cost of providing services. Since 2009, a greater share has been spent on medical personnel and a smaller share on management and administrative personnel, infrastructure, and non-clinical supplies (see Figure 4.12).
$-
$500
$1,000
$1,500
$2,000
$2,500
$3,000
$3,500
1972 1977 1982 1987 1992 1997 2002 2007 2012 2017
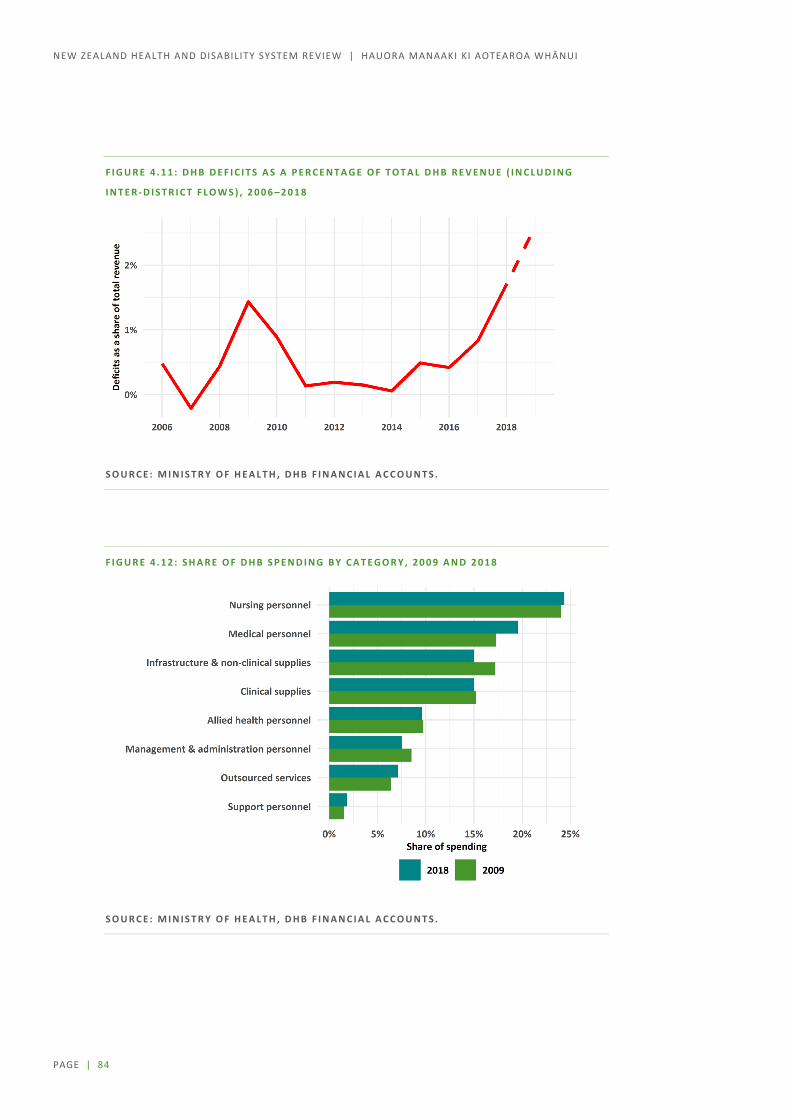
NEW ZEALAND HEALTH AND DISABILITY SYSTEM REVIEW | HAUORA MANAAKI KI AOTEAROA WHĀNUI
PAGE | 84
F I G U R E 4 . 1 1 : D H B D E F I C I T S A S A P E R C E N T A G E O F T O T A L D H B R E V E N U E ( I N C L U D I N G
I N T E R - D I S T R I C T F L O W S ) , 2 0 0 6 – 2 0 1 8
S O U R C E : M I N I S T R Y O F H E A L T H , D H B F I N A N C I A L A C C O U N T S .
F I G U R E 4 . 1 2 : S H A R E O F D H B S P E N D I N G B Y C A T E G O R Y , 2 0 0 9 A N D 2 0 1 8
S O U R C E : M I N I S T R Y O F H E A L T H , D H B F I N A N C I A L A C C O U N T S .
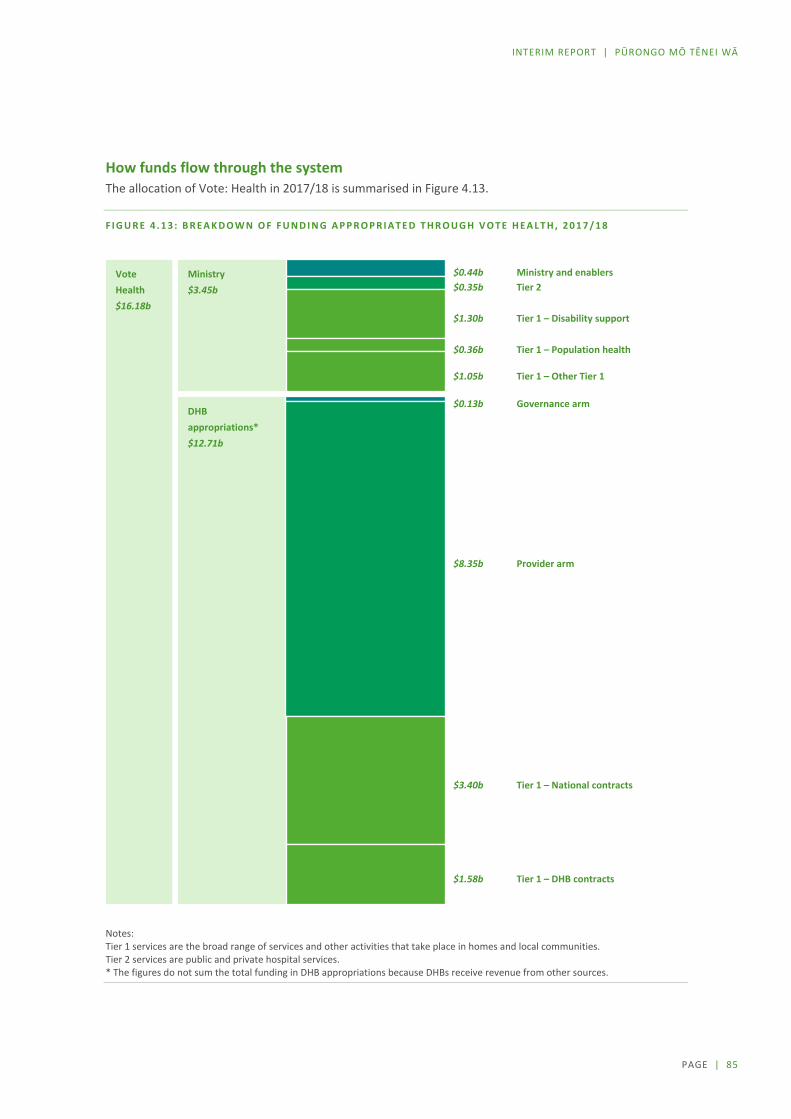
INTERIM REPORT | PŪRONGO MŌ TĒNEI WĀ
PAGE | 85
How funds flow through the system The allocation of Vote: Health in 2017/18 is summarised in Figure 4.13.
F I G U R E 4 . 1 3 : B R E A K D O W N O F F U N D I N G A P P R O P R I A T E D T H R O U G H V O T E H E A L T H , 2 0 1 7 / 1 8
Notes: Tier 1 services are the broad range of services and other activities that take place in homes and local communities. Tier 2 services are public and private hospital services. * The figures do not sum the total funding in DHB appropriations because DHBs receive revenue from other sources.
Vote Health $16.18b
$0.35b Ministry $3.45b
DHB appropriations* $12.71b
$0.44b Ministry and enablers Tier 2
$1.30b Tier 1 – Disability support
$0.36b Tier 1 – Population health
$1.05b Tier 1 – Other Tier 1
$0.13b Governance arm
$8.35b Provider arm
$3.40b Tier 1 – National contracts
$1.58b Tier 1 – DHB contracts

NEW ZEALAND HEALTH AND DISABILITY SYSTEM REVIEW | HAUORA MANAAKI KI AOTEAROA WHĀNUI
PAGE | 86
About three-quarters of public health spending is devolved to New Zealand’s 20 DHBs. The Ministry of Health retains a quarter of public health spending for purchasing services including disability support, population health, and child health services (see Figure 4.13).
Concerns over funding allocations We heard concern that a disproportionate share of funding is being spent on hospital services, leaving little for other services such as primary care or population health services.
Evidence exists of growing spending on hospital services. DHB revenue can be allocated to services provided directly by the DHB (the ‘provider arm’) and services contracted with other providers (the ‘funder arm’). The provider arm provides predominantly Tier 2 services (public and private hospital services). The funder arm provides predominantly Tier 1 services (the broad range of services and other activities that take place in homes and local communities).
Over the past decade, revenue allocated to DHB provider arms as a share of total DHB revenue increased (see Figure 4.14). Provider arm spending grew 47% from 2009 to 2018, compared with 34% growth in funder arm spending.
However, from 2004 to 2008 the share of spending in provider arms actually fell from around 62% to around 58%. This was due, in part, to an increase in spending on primary care following the release of the Primary Health Care Strategy.
It is more difficult to establish why growth in hospital spending since 2009 occurred. Submitters and other reviews have noted that DHBs owning hospitals may lead to a conflict of interest. DHBs may be biased towards spending in their provider arms, since they have greater control over this spending and, potentially, because hospital employees can have a greater influence over decision making.
F I G U R E 4 . 1 4 : S H A R E O F T O T A L R E V E N U E A L L O C A T E D T O D H B P R O V I D E R A R M S , 2009–2018
S O U R C E : M I N I S T R Y O F H E A L T H , D H B F I N A N C I A L A C C O U N T S .

INTERIM REPORT | PŪRONGO MŌ TĒNEI WĀ
PAGE | 87
However, other factors may have contributed to higher provider arm spending, including accountability mechanisms that focus on hospital services. Significant variation also exists in spending within DHB provider arms. For example, DHBs also own and control the provision of many mental health services, yet growth in spending on these services has been slower than overall funder arm spending.
F I G U R E 4 . 1 5 : P E R P E R S O N S P E N D I N G B Y A G E G R O U P A N D E T H N I C I T Y , H O S P I T A L S E R V I C E S
C O M P A R E D W I T H P R I M A R Y S E R V I C E S
S O U R C E : M I N I S T R Y O F H E A L T H .

NEW ZEALAND HEALTH AND DISABILITY SYSTEM REVIEW | HAUORA MANAAKI KI AOTEAROA WHĀNUI
PAGE | 88
Is funding being spent equitably? A major concern we heard is that funding is not being equitably spent on population groups with high needs. In some instances, this was linked to a discussion about the population-based funding formula (PBFF) (which is the tool used to distribute DHB funding according to the needs of each DHB’s population), in other instances it was raised as a more general concern.
The first graph in Figure 4.15 shows average per person expenditure on hospital services by age group and ethnicity. Older age groups have more, and more complex, health needs, so have higher levels of expenditure. All Māori and Pacific age groups have higher levels of expenditure than non-Māori non-Pacific (other) age groups. However, this difference is very small for age groups under 20. These expenditure comparisons do not reflect whether the expenditure is sufficient to meet the needs of different populations.
The second graph in Figure 4.15 shows average per person expenditure on ‘primary services’ by age group and ethnicity. Primary services include PHO services, immunisations, pharmaceuticals, pharmacy services, and laboratory services. Again, older age groups tend to have higher levels of expenditure. However, for Māori and Pacific people aged under 45, spending per person is roughly the same as for non-Māori non-Pacific people. Māori and Pacific children (under 19 years) have lower levels of expenditure than non-Māori non-Pacific children. This is particularly concerning, given that around 75% of Māori and 80% of Pacific people are aged under 45 years. Māori and Pacific peoples aged 45 and over have higher levels of expenditure, but this difference is smaller than in hospital and community services.
Different appropriations grow at different rates Most government spending in the health and disability system comes through Vote Health. Funding is allocated to 51 appropriations within Vote Health that define what public money can be spent on. Each DHB has its own appropriation, but there are also appropriations for non-DHB services such as national disability support services and population health services.
Vote Health has ‘fixed nominal baselines’, which means the amount of funding received each year does not automatically increase to match volume, population, or cost increases. Instead, in each Budget cycle, the Minister of Health submits bids requesting additional funding for new initiatives or to help provide existing services given population and cost pressures. Separate bids are submitted for different parts of Vote Health, and some parts (such as population health services) have not received cost pressure increases.
Cabinet has the discretion to reject any Budget bid. However, in practice, DHB cost pressures have always been at least partially funded (that is, funded with an efficiency adjustment).
Therefore, different parts of Vote Health grow at different rates depending on the Government’s competing priorities. For example, spending within the public health service purchasing appropriation was flat or falling in nominal terms from 2010 to 2018, while DHB appropriations grew around 3.2% per year over the same period. National elective services grew more rapidly at around 4.9% per year.
INTERIM REPORT | PŪRONGO MŌ TĒNEI WĀ
PAGE | 89
Some votes and appropriations do not have fixed nominal baselines. Appropriations covering benefits and superannuation are automatically adjusted based on forecasts of future benefit increases and increases in the number of benefit recipients. Eligibility rules and changes in benefit rates are set in legislation, so there is little discretion to change spending. In contrast, appropriations for education are automatically adjusted for forecast changes in student numbers, teacher numbers, and teacher pay rates. Further consideration needs to be given to whether changes to budget-setting procedures would provide any greater certainty for the health and disability system in the future.
Population based funding formula is complicated and poorly understood Most DHBs support a population- and needs-based method of allocating funding. In theory, this method can lead to an equitable share of funding to different areas based on population size and need. However, the PBFF is difficult to understand, and many DHBs feel they are not receiving an equitable share of funding.
The process of allocating funding to DHBs is complicated and has many different stages. The full process is described in a supporting working paper139, and involves five service models, three adjustors, top-sliced funding that isn’t allocated on a population basis, and other factors. In addition, DHBs also receive funding through contracts with the Ministry of Health or services such as electives and population health, direct contracts with ACC and other government entities, and other sources such as donations.
It is not surprising that such a complicated process is not well understood. However, limited transparency of what data is used and how it is used, leads to concern that the allocation process may be flawed.
For example, the Waitangi Tribunal noted that in the 2013 Census Māori were undercounted by 6.1% compared with 1.9% of non-Māori. Some giving evidence to the Tribunal believed that this undercounting led to lower funding for Māori, because PBFF allocations are based on census data. However, the PBFF is not based on census-night counts, but on ‘estimated residential population’, which Statistics New Zealand publishes separately. These estimates use census data, but also adjust for factors including people not filling out a census form and people choosing not to report their ethnicity in the census. They are also updated annually using birth, death, and migration data (and including PHO enrolment data).
The appropriateness of the PBFF allocation is limited by the quality of available data. In total, around 12% of DHB spending could not be modelled due to lack of data, and this share is as high as 24% in some service areas.
Because the PBFF uses past service use to determine the funding allocations for different populations, it does not capture unmet need. An unmet need adjustor is included to account for this, but this adjustor accounts for only about 1.5% of overall funding. This suggests the health and disability system meets 98.5% of all health needs, which appears implausible given the large inequitable difference in health outcomes between population groups.

NEW ZEALAND HEALTH AND DISABILITY SYSTEM REVIEW | HAUORA MANAAKI KI AOTEAROA WHĀNUI
PAGE | 90
DHB funding growth can be volatile and DHBs have little forewarning We heard concerns from DHBs that they have little advanced notice of the funding they will be receiving in the next financial year, limiting their ability to develop annual plans. Furthermore, the increases in funding they do receive can be quite volatile and can appear unrelated to the growth in population or health need in their district.
If the process for calculating each DHB’s level of funding is complicated, then calculating each DHB’s annual funding increase is doubly so. Each DHB’s funding increase in a particular year will depend on multiple factors, including:
the overall increase in DHB funding decided by Cabinet changes in the relative size and composition of each DHB’s population changes to top-sliced funding other technical changes (such as debt to equity transfers) revisions to past population estimates.
The result of this process is increases in individual DHB funding that are hard to predict and that can appear to be unrelated to underlying population growth or changes in demand.
Revisions to past population estimates can be significant and are often unrelated to actual population growth. For example, Auckland DHB is projected to be the fastest growing DHB in 2019/20, yet its funding growth is slightly less than average in 2019/20. This was because Statistics New Zealand revised down the estimated population of Auckland by 0.8% based on the most recent data. In contrast, Wairarapa DHB’s population growth was lower than average in 2019/20, yet it received the largest percentage increase in funding, because of a significant upward revision in its estimated population.
We have heard from DHBs that the volatility in their funding growth and the lack of an early funding signal reduces their ability to plan future services. Although an early funding signal may provide some support for DHB planning, it is certainly not the only barrier to more effective planning in the sector. For example, half of the annual plans for the 2014/15 financial year had not been signed off five months into the financial year, even though an early funding signal was provided. Furthermore, an early funding signal would do little to address the significant absence of long-term planning in the system.

INTERIM REPORT | PŪRONGO MŌ TĒNEI WĀ
PAGE | 91
Directions for change: Governance and funding The function of the health and disability system is to improve the health and wellbeing of the population it is set up to serve. Too often in the past, the way the system has been designed or managed appears to have been driven by the interests of the system rather than the interests of those most in need of help. Inequitable outcomes have been the result.
The Panel is strongly of the view that priority for change must be given to areas that will most benefit those who are currently least advantaged.
A M O R E C O H E S I V E S Y S T E M W I T H C O N S I S T E N T A N D E F F E C T I V E L E A D E R S H I P
The Panel believes that while the shape of the particular structures within the health system are important, they are not the key reason for the lack of effective performance.
If New Zealand is to develop a system that operates effectively with equitable outcomes throughout, it must first operate as a cohesive, integrated system that works in a collaborative, collective, and cooperative way. Behavioural and attitudinal changes are needed. These changes need to be led from the centre and applied consistently throughout the system.
To this end, the Panel believes a clearly defined set of values and principles that appropriately reflects the diversity of cultures and Māori as tangata whenua should guide the behaviours and operation of the entire system.
A C L E A R E R D E C I S I O N - M A K I N G F R A M E W O R K
The Panel believes a clearer decision-making framework is needed across the system that allows decisions to be made in a timely manner, made at the appropriate level, and enforced effectively.
Decisions should support the best use of available resources across the whole system, rather than being driven by the interests of a region, discipline, or organisation. Governors should be responsible (and held accountable) for both local and system-wide impacts.
C O L L A B O R A T I V E L O N G - T E R M P L A N N I N G
The Panel strongly believes that the lack of mandatory longer-term integrated planning throughout the system makes it impossible for communities or government to have confidence in the effective performance of the system. Planning needs to be strategic and undertaken within a system-wide framework.
Effective strategic planning will require more systematic community and stakeholder engagement, both within the health and disability sector and intersectorally. Such engagement will be necessary in both the development and implementation of plans. Iwi and Māori must be fully involved.

NEW ZEALAND HEALTH AND DISABILITY SYSTEM REVIEW | HAUORA MANAAKI KI AOTEAROA WHĀNUI
PAGE | 92
A S Y S T E M T H A T I S L E S S C O M P L I C A T E D
The Panel recognises that the health and disability system will always be complex, but believes the objective should be to make it less complicated with fewer, not more, agencies.
C O N S U M E R R E P R E S E N T A T I O N
The Panel believes that if the system is to be reoriented so it purposely focuses on the needs of the community it is serving, communities need more effective avenues for guiding the direction of health service planning and delivery. The Panel has not formed a definite view on whether DHB elections are an effective or an essential way of achieving this.
A C C E S S T O E N H A N C E D A N A L Y T I C A L A N D B A C K - O F F I C E F U N C T I O N S
The population and geographic sizes of the current DHB regions vary significantly, yet all DHBs are mandated to perform the same range of functions. The Panel believes that before deciding the solution is to have fewer DHBs, it is worth considering whether the system as a whole should provide more analytical or back-office functions to smaller DHBs in other ways.
M O R E F U N D I N G A L O N E I S N O T T H E A N S W E R
The Panel recognises that there will always be worthwhile ways to spend more money within a health and disability system and that the relatively slow growth in expenditure in recent years has added to stresses within the system.
Projected changes in demographic and disease profiles mean demand for health services will continue to grow strongly, which, along with recent adjustments in staffing costs, will require further increases in the overall funding envelope over time, even with improvements in efficiency.
The Panel recognises however, that increasing funding alone will not guarantee improvements in the equity of outcomes. The Panel’s initial focus is, therefore, on how the system could operate differently to make better use of whatever financial resources are available to it.
The Panel also recognises that previous funding levels have not been the sole cause of the system continually running financial deficits and believes accountability mechanisms need to change to hold the system more accountable for staying within future funding paths.

PAGE | 93
INTERIM REPORT | PŪRONGO MŌ TĒNEI WĀ
Section C: Services / Ngā Ratonga

NEW ZEALAND HEALTH AND DISABILITY SYSTEM REVIEW | HAUORA MANAAKI KI AOTEAROA WHĀNUI
PAGE | 94
5 Service overview / Te tirohanga whānui ki te ratonga
Service delivery context The key vehicle for the provision and funding of health and disability services in New Zealand are the 20 DHBs that were established under the New Zealand Public Health and Disability Act 2000. The primary objectives for DHBs set out in the Act include, but are not limited to:
improve, promote, and protect the health of people and communities seek the optimum arrangement for the most effective and efficient delivery of health services to
meet local, regional, and national needs promote effective care or support for those in need of personal health services or disability support
services promote the inclusion and participation in society and independence of people with disabilities reduce health disparities by improving health outcomes for Māori and other population groups.
Setting the direction for integrated care and equity focus DHBs were established with the aim of widening the focus from treatment of illness to improving health and wellbeing and addressing health inequities. The expectation of greater service delivery integration via a mixed model of public and non government organisations was also set out in the Health and Disability Act.
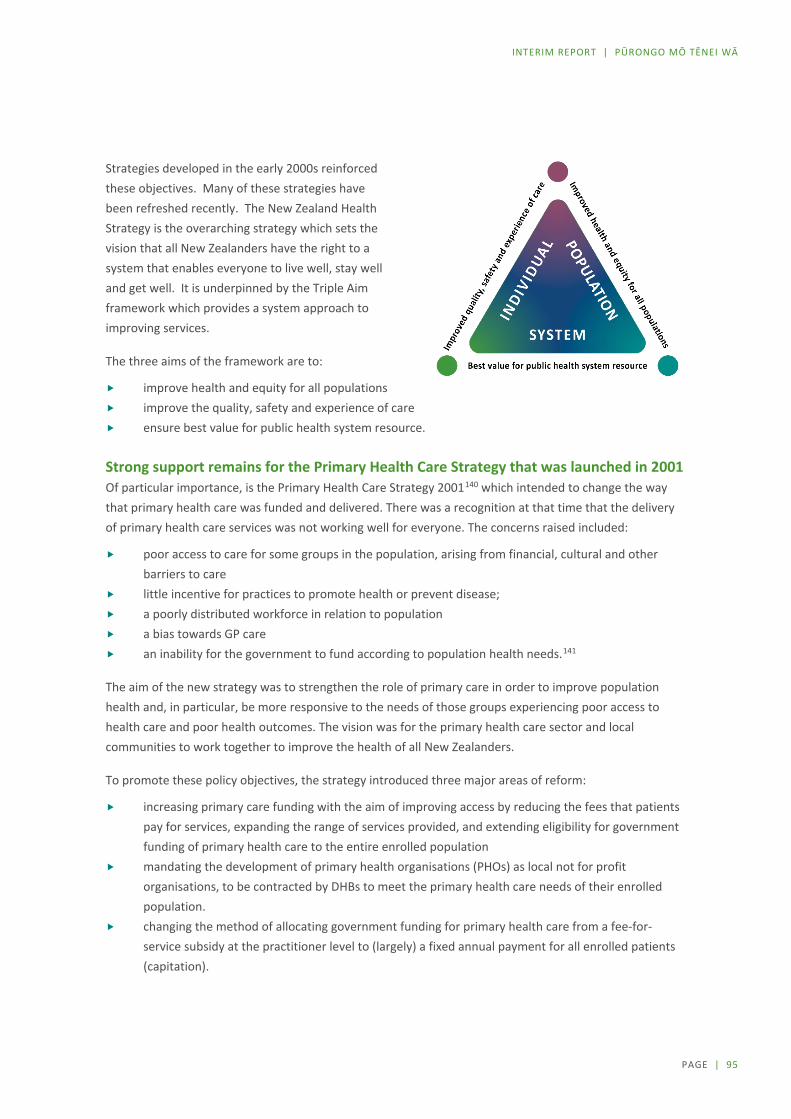
PAGE | 95
INTERIM REPORT | PŪRONGO MŌ TĒNEI WĀ
Strategies developed in the early 2000s reinforced these objectives. Many of these strategies have been refreshed recently. The New Zealand Health Strategy is the overarching strategy which sets the vision that all New Zealanders have the right to a system that enables everyone to live well, stay well and get well. It is underpinned by the Triple Aim framework which provides a system approach to improving services.
The three aims of the framework are to:
improve health and equity for all populations improve the quality, safety and experience of care ensure best value for public health system resource.
Strong support remains for the Primary Health Care Strategy that was launched in 2001 Of particular importance, is the Primary Health Care Strategy 2001140 which intended to change the way that primary health care was funded and delivered. There was a recognition at that time that the delivery of primary health care services was not working well for everyone. The concerns raised included:
poor access to care for some groups in the population, arising from financial, cultural and other barriers to care
little incentive for practices to promote health or prevent disease; a poorly distributed workforce in relation to population a bias towards GP care an inability for the government to fund according to population health needs.141
The aim of the new strategy was to strengthen the role of primary care in order to improve population health and, in particular, be more responsive to the needs of those groups experiencing poor access to health care and poor health outcomes. The vision was for the primary health care sector and local communities to work together to improve the health of all New Zealanders.
To promote these policy objectives, the strategy introduced three major areas of reform:
increasing primary care funding with the aim of improving access by reducing the fees that patients pay for services, expanding the range of services provided, and extending eligibility for government funding of primary health care to the entire enrolled population
mandating the development of primary health organisations (PHOs) as local not for profit organisations, to be contracted by DHBs to meet the primary health care needs of their enrolled population.
changing the method of allocating government funding for primary health care from a fee-for-service subsidy at the practitioner level to (largely) a fixed annual payment for all enrolled patients (capitation).

PAGE | 96
NEW ZEALAND HEALTH AND DISABILITY SYSTEM REVIEW | HAUORA MANAAKI KI AOTEAROA WHĀNUI
At the time, the Primary Health Care Strategy was welcomed and well supported across the sector. Eighteen years later, the Primary Health Care Strategy continues to be recognised as a strong piece of government policy, however there is broad consensus that shifts towards a more multidisciplinary model of delivery with more proactive population and patient, family and whānau centred approaches have been slow. In particular, ongoing concerns from Māori about primary care were highlighted in the recent Waitangi Tribunal report. More detail about this is included in chapter 3: Hauora Māori.
Key reasons cited for the slow shift include:
lack of consistent leadership over time a lack of resourcing to lead and roll-out new models funding formulas that fail to cover the costs associated with very high needs populations the significant proportion of general practice income that is still derived from patient co-payments.
This has resulted in practices being incentivised to prioritise patient volume rather than introducing new, more innovative models of care.142
Why the changes to the system are important While progress has been slow, a review of evidence and submissions reaffirms that population health approaches and early community based interventions are critical to the delivery of improved and more equitable health and wellbeing outcomes:
Population health approaches have led to some of the greatest improvements in wellbeing and life expectancy. Examples include the control of infectious diseases through clean water and improved sanitation, prevention of infectious diseases through immunisation, and the recognition of tobacco use as a health hazard.
There is now a strong body of evidence to support the case for investing in population health interventions, particularly for diseases and risk factors that contribute to significant health loss and inequity in New Zealand. A 2014 WHO review showed that a wide range of preventative approaches are cost effective, including addressing the environmental and social determinants of health, building resilience and promoting health behaviours.143
A further recent systematic review of a range of public health interventions estimated the mean return on investment (ROI) from a range of existing population health interventions in high-income countries with universal healthcare (including New Zealand) was 14.3 to 1. Some interventions produced rapid returns (for example community based falls prevention), while larger returns were seen over a 10-20 year horizon for other initiatives (for example immunisations against communicable diseases).144 145 146 That review also showed that health protection and legislative interventions at a national level are likely to provide the highest return (mean ROI = 46), although many local level public health interventions are still cost effective.147
In general, evidence also shows that investing in upstream population-based prevention is more effective at reducing health inequities than more downstream prevention148

PAGE | 97
INTERIM REPORT | PŪRONGO MŌ TĒNEI WĀ
There is also evidence that how we empower and engage patients and deliver services in primary care settings is key to achieving more equitable health outcomes and improving wellbeing. A recent World Health Organization review concluded that there is powerful evidence to suggest that primary care can produce a range of economic benefits including:
Health outcomes - primary care can improve population health in terms of life expectancy, all-cause mortality, maternal, infant and neonatal mortality as well as mental health outcomes.
Health system efficiency - primary care can reduce total hospitalisations, avoidable admissions, and emergency admissions and hospitalisations.
Health equity - primary care improves equitable access to health care and equitable health outcomes.149
Life course approaches that are organised around patients and their whānau rather than around providers and single diseases are being demonstrated to be more effective in patient cohorts where comorbidities and patient complexity are high.
Understanding what matters most to patients and their whānau and empowering patients by providing them with the knowledge, skills and confidence to manage their own health and health care will reduce inequities in a health system which has historically underserved Māori and Pacific peoples.
While greater investment in prevention and early intervention will help to slow demand, high quality hospital and specialist services will continue to be needed. Clinical practice, genomics, artificial intelligence and a growing range of technologies will continue to advance the range of diagnostic and treatment services that can be provided. Patient expectations will continue to grow as knowledge of what is available locally and internationally becomes more readily available. It is expected that demand for services will continue to outstrip resources and that we will need to continue to engage in discussions about service prioritisation.
There will also be an increasing proportion of the population who will be living with disability associated with the effects of long term conditions (such as diabetes and arthritis) in adulthood, and increases in the numbers in older age groups who have higher (though not increasing) rates of disability. The system will need to ensure that the needs of this population are understood and services are delivered in a way that enables individuals and their whānau to live well with disability, rather than just providing support for impairment.

PAGE | 98
NEW ZEALAND HEALTH AND DISABILITY SYSTEM REVIEW | HAUORA MANAAKI KI AOTEAROA WHĀNUI
Framework for the system review The Panel is very supportive of the direction set out in the strategies which align with the objectives that have been set for the Review. The delivery of high quality treatment services will always be needed, but there is also a need for the system to better support patient and whānau wellbeing throughout their life and to ensure that the system understands and delivers what matters most to people.
Although there are a multitude of ways to talk about service delivery, the Review has focused its considerations around four main components: population health, Tier 1, Tier 2 and disability. The concept of ‘tiers’ has been used to place a broad set of parameters around the complexity of service delivery, as well as initiate discussion about how to shape the system for the future (see Figure 5.1 ).
F I G U R E 5 . 1 : S E R V I C E S O V E R V I E W

PAGE | 99
INTERIM REPORT | PŪRONGO MŌ TĒNEI WĀ
Definitions include:
Population health services: including public health action, public health policy, health promotion, and preventative initiatives such as screening programmes.
Tier 1: The layer of the system focused on a broad range of services and other activities taking place in homes and local communities. This includes: – Self-care (maintaining well-being and self–management of chronic conditions within
whānau); – Other services delivered in the community (including but not limited to general practice,
school health services, disability supports, aged care, laboratory and radiology services, maternity care, oral health and allied health that take place outside of hospital settings)
Tier 2: The layer of the system focused on the delivery of public and private hospital and specialist treatment and diagnostic services. This includes, services delivered for the local population or a regional catchment and those provided for more than one region and in some instances all of New Zealand
Disability: Services provided to people with disabilities that support the enable them to live well with disability. The requirement for services varies from short term to life long. The majority of services are delivered in Tier 1, but many people, will also access Tier 2 services at different stages.
There are no definitive boundaries between these service areas and in an effective integrated systems the boundaries will become more blurred. However, for the purposes of these initial discussions, we have used this taxonomy which largely reflects current state service provision arrangements around which many submissions were framed.
Current service delivery arrangements New Zealand’s health and disability system delivers prevention, care, and treatment through an extensive range of hospital, community and home based arrangements. This includes 83 certified public and 77 certified non-government hospitals, 30 Primary Health Organisations (PHOs), and thousands of community and home based services.
Services are organised in a variety of ways including by:
condition or issue (e.g. maternity care, mental health and addiction, vision, hearing, speech, family violence, oral health care, palliative care)
life stage (e.g. Well-Child Tamariki Ora, youth health services, aged residential care) service type (e.g. kaupapa Māori, pharmacy, general practice, nursing, social work, Pacific services,
occupational therapy, physiotherapy, podiatry, diagnostic imaging, residential care, rehabilitative support, disability services, laboratory services)
delivery method (e.g. telehealth or e-therapy, school-based service, mobile service, marae based health service, home based service)
geographic area cultural communities they serve.

PAGE | 100
NEW ZEALAND HEALTH AND DISABILITY SYSTEM REVIEW | HAUORA MANAAKI KI AOTEAROA WHĀNUI
Utilisation of current services The health and disability system is used extensively by New Zealanders, with some examples of the broad range of services commonly used, set out below (Figure 5.2).
FIGURE 5.2: SNAPSHOT OF SERVICES, ORGANISATIONS AND HEALTH CARE WORKERS ACROSS THE SYSTEM

PAGE | 101
INTERIM REPORT | PŪRONGO MŌ TĒNEI WĀ
6 Population health / Te hauora taupori
A core role of the health system is to not only support and treat people when they are unwell or injured, but to prevent illness and promote health and wellbeing. This will be essential if the New Zealand system is to remain financially sustainable in the future. This section looks in more detail at how the system delivers population services, where the funding comes from, how effective they have been in changing behaviours, and why such services should take a stronger leadership role in the future.
What is population health The terms ‘public health’ and ‘population health’ are often used interchangeably even though they have specific meanings. In this report, to avoid confusion with the terms ‘public health system’ and ‘publicly funded health system’, we use the term ‘population health’ with the understanding that it incorporates the broad definition and meaning of ‘public health’.
Population health uses various approaches to reduce health inequities, keep communities safe, create healthier environments, and encourage healthy behaviours. The core functions of population health in New Zealand have been described as comprising:
health assessment and surveillance: gathering evidence about health status, health determinants, how illness is distributed across the population, and how to improve it
population health capacity development: enhancing the system’s capacity and ability to improve population health
health promotion: working with a range of sectors (including health) and communities to create physical, social and cultural environments that support health and wellbeing
health protection: organising to protect communities against population health threats and hazards preventive interventions: population programmes delivered to individuals such as immunisation,
well-child checks, breast screening, and help to quit smoking.150

PAGE | 102
NEW ZEALAND HEALTH AND DISABILITY SYSTEM REVIEW | HAUORA MANAAKI KI AOTEAROA WHĀNUI
The evidence is clear, as discussed in the earlier chapter, that the effective delivery of population health functions can add value to the whole health and disability system, by both reducing demand for health care services over the long term and promoting greater health and wellbeing throughout our lives.
Population health is a core system enabler, contributing to improved health and wellbeing outcomes and improved equity, with flow-on effects for society.
Strong mandate for a population health approach but accountability lacking The Health Act 1956 is New Zealand’s core piece of population health legislation, setting out the roles and responsibilities of specific organisations and individuals to safeguard population health. These include the Ministry of Health, the Director of Public Health, and designated officers for public health. The Health Act contains provisions for managing environmental health, infectious diseases, health emergencies, and the National Cervical Screening Programme. This Act is considered by many to now be outdated and in need of review.
The New Zealand Health and Disability Act 2000 provides an explicit legislative mandate for a population health approach. The purpose of this Act is the improvement, promotion, and protection of the health of all New Zealanders. The Act sets out that the role of the Ministry of Health is to provide leadership and stewardship of the health and disability system and the role of DHBs is to:
improve, promote, and protect the health of people and communities seek the optimum arrangement for the most effective and efficient delivery of health services to
meet local, regional, and national needs reduce health disparities by improving health outcomes for Māori and other population groups.
Current population health service arrangements Many agencies and providers are engaged in providing population health services. The key entities
and their roles are set out below.
KEY AGENCIES AND PROVIDERS OF POPULATION HEALTH SERVICES M I N I S T R Y O F H E A L T H :
The Ministry provides national leadership on all public health issues. Under the Health Act 1956, the Director of Public Health has a statutory role to advise the Director General of Health and Minister of Health “on matters relating to public health”.
The Ministry’s policy and regulatory functions span a broad variety of issues such as emergency response, communicable disease control, environmental health, drinking water, border health, population screening, immunisation, tobacco control, population health monitoring, oral health, public health workforce, climate change and health, nutrition and physical activity, health promotion, public health policy development and implementation, capability development of statutory officers, and international obligations.
The Ministry plays a significant role in planning, commissioning, and monitoring population health services at national, regional, and local levels. It also performs the critical role of working with other government agencies on issues that impact on population health.
PAGE | 103
INTERIM REPORT | PŪRONGO MŌ TĒNEI WĀ
D H B S :
Play a significant role in planning, commissioning, and monitoring population health services at a local level. They incorporate, in their normal operations, elements of all of the key population health functions including funding and delivering population health interventions such as screening and immunisation services.
P U B L I C H E A L T H U N I T S :
Thirteen units are ‘owned’ by their host DHBs, but funded directly from the Ministry. They deliver a variety of population health services that are expected to:
respond to legislative requirements, international obligations and Government priorities maintain critical mass, in terms of the infrastructure, and the multi-disciplinary, specialised
workforce required to deliver core public health functions maintain adequate pandemic and emergency preparedness and responsiveness respond to changing demographics (population growth, distribution and diversity) contribute to the provision of comprehensive public health responses to address the
growing health and fiscal burdens associated with non-communicable and communicable diseases.151
C R O W N E N T I T I E S :
The Ministry funds several Crown entities to deliver population health services. For example, it funds the Health Promotion Agency, which delivers health promotion services and has legislated functions in relation to researching and advising on the sale, supply, consumption, misuse, and harm of alcohol; the Institute of Environmental Science and Research, which provides scientific, analytical, and advisory services; and the University of Auckland to provide immunisation advisory services.
R E G I O N A L A N D L O C A L S E R V I C E S :
A large number of organisations, most of which are non-government organisations, deliver population health services at local levels. These providers and their approaches vary, reflecting the geographic, social, and cultural contexts they work within.
P R I M A R Y H E A L T H O R G A N I S A T I O N S ( P H O S ) :
The PHO agreement contains provisions for the delivery of health promotion interventions but this is not standardised. Each DHB and PHO determines the types of services required to be delivered each year
O T H E R G O V E R N M E N T A G E N C I E S A N D L O C A L G O V E R N M E N T :
Various government agencies, as well as local government, have important roles in delivering population health functions, including the Ministry for Primary Industries, the Ministry for the Environment, the Ministry of Housing and Urban Development, WorkSafe New Zealand, Sport New Zealand, the Accident Compensation Corporation, the New Zealand Transport Agency, the Ministry of Education, the Environmental Protection Agency, the Ministry of Justice, and the Ministry of Social Development.
PAGE | 104
NEW ZEALAND HEALTH AND DISABILITY SYSTEM REVIEW | HAUORA MANAAKI KI AOTEAROA WHĀNUI
Fragmentation of roles and accountabilities Despite the legislative mandate for public health functions, we heard a common theme in our engagement of a lack of clarity in the roles, responsibilities, and accountabilities across these functions.
Currently, public health is unnecessarily fragmented and complex given New Zealand’s small size. (Organisation submission)
We understand the fragmentation is due, in part, to the partial devolution of population health services to DHBs. When the DHBs were established in 2001, the Ministry of Health retained overall responsibility for planning and funding population health services, with the intention that DHBs would progressively assume these functions. The intended full devolution of local or regional population health services to DHBs has not occurred, and the Ministry continues to hold responsibility for planning and funding most population health services at national and local levels.
The configuration, scope, and volume of activities each public health unit delivers varies considerably. This is particularly so for non-regulatory services, such as health promotion, and is not surprising given the population served by each unit varies from around 250,000 to almost 2 million, the number and type of borders (for example, ports and international airports), the mix of other population health service providers in the area of coverage, and the demographics and needs of the populations served. The extent to which each unit’s activities are integrated with their DHB’s planning and service delivery also varies.
[Public health units] are diverse in size, specialisation, service scope, levels of service provision, and ability to deliver services across the five core public health functions. (Organisation submission)
The configuration of services at national, multi-DHB, and single DHB or local levels is summarised in Table 6.1.

PAGE | 105
INTERIM REPORT | PŪRONGO MŌ TĒNEI WĀ
T A B L E 6 . 1 : C O N F I G U R A T I O N O F H E A L T H F U N D E D P O P U L A T I O N H E A L T H S E R V I C E S
Level Function or service
National Ministry of Health functions or services delivered directly, such as:
administration of public health legislation (including regulations) leadership of key programmes (for example, screening, environmental health, and tobacco) interagency and cross-government collaboration participation in global initiatives policy, advice, and guidelines health status surveillance and analysis service contracting and monitoring development of health resources leadership and coordination of emergency response participation in international agreements and global initiatives.
Lead organisations the Ministry contracts with to deliver national services, such as:
Health Promotion Agency (health promotion campaigns and resources) Institute of Environmental Science and Research (scientific, analytical, and advisory services) Tertiary education institutions, such as the University of Auckland for delivery of immunisation advisory
services some DHB-based public health units, such as the Auckland Regional Public Health Service, which is the lead
organisation for national refugee screening services for all new refugees non-government organisations (NGOs), such as the National Heart Foundation (heart health promotion
initiatives), AIDS Foundation (prevention programmes, HIV testing, and support services), and Mental Health Foundation (mental health promotion). Hapai Te Hauora Tapui Ltd, which provides guidance and support to the four regional lead providers and 20 DHBs to implement the National SUDI Prevention Programme (for prevention of sudden and unexpected death in infancy.
National services that are part of a wider (often nationwide) programme delivered by a variety of providers, such as:
national screening programmes, such as the five national population-based screening programmes (for breast, bowel, and cervical cancer and for metabolic screening and hearing of newborns)
Healthy Families NZ (10 initiatives in local communities) Community Action on Youth Alcohol and Drugs (18 initiatives in local communities) Kia Piki te Ora Māori suicide prevention programmes (initiatives in 9 DHB regions).
Multi-DHB Services delivered to more than one DHB region that the Ministry, DHBs, or public health organisations (PHOs) contract and may be delivered by:
a DHB (for example, the four SUDI prevention services and regional public health networks, such as the South Island Public Health Partnership that facilitates planning and decisions around the delivery of public health unit services for the South Island DHBs)
a PHO (for example, ProCare stop smoking services across Auckland DHB and Waitemata DHB areas) a public health unit (five of the 13 units cover more than one DHB area) an NGO (for example, Age Concern NZ Inc delivers regional healthy ageing services in the South Island, Central
North Island, and Midlands regions).
Single DHB or local
Local providers that deliver services within one DHB area, that the Ministry of Health, some DHBs, or some PHOs contract, and that many be delivered by:
a DHB for its geographical area (for example, the DHB Tobacco Control contract focuses on leadership and implementation of the DHB’s Tobacco Control Plan and supporting and monitoring its smoking cessation activity to achieve tobacco control outcomes)
a public health unit (seven units cover one DHB area) a PHO – a variety of health promotion services are delivered at a local level by primary care services, which
deliver population health interventions to individuals, such as smoking cessation, immunisation, and screening)
an NGO (for example, West Fono Health Trust delivers physical activity services to Pacific communities in West Auckland, Pirirakau Hauora Charitable Trust delivers sexual and reproductive health services and mental health promotion services within the rohe (area) of Te Puna and Western Bay of Plenty).

PAGE | 106
NEW ZEALAND HEALTH AND DISABILITY SYSTEM REVIEW | HAUORA MANAAKI KI AOTEAROA WHĀNUI
How population health services are funded It is difficult to have a clear picture of the proportion of government funding going to population health with population health services being funded by the Ministry, DHBs, and primary health organisations (PHOs) and through various government appropriations and government departments.
The Ministry of Health’s Public Health Services Appropriation, for example, does not include funding for services that have been devolved to DHBs such as immunisation services; nor does it include funding for health promotion services funded through PHOs or for services that DHBs might choose to deliver out of DHB population-based funding under the Crown funding agreement. 152 Also, over time, some services have been reclassified out of the Public Health Services Appropriation into other appropriations, such as the National Telehealth Service, which moved into personal health appropriations.
Looking, therefore, at just the Public Health Services Appropriation, in 2017/18 $414 million was allocated to funding population health services. Of this amount, half (51%) was allocated to NGOs, 27% to DHBs, 15% to public health units, and 7% to Crown entities.
F I G U R E 6 . 1 : P U B L I C H E A L T H S E R V I C E S A P P R O P R I A T I O N A L L O C A T I O N 2 0 1 7 / 1 8
S O U R C E : M I N I S T R Y O F H E A L T H .
The Public Health Services Appropriation in recent years has received new funding only for specific new services or initiatives, which has left services that are funded through this route with limited ability to respond to changes in population needs or priorities, or respond to cost-pressures. In contrast, other appropriations (such as DHB appropriations) usually receive funding increases to partially cover population growth and cost pressures.
DHBs (ex PHUs),$111.25m, 27%
Crown Entities$28.73m, 7%
Non Crown Entities,$210.89m, 51%
PHUs, $63.36m, 15%
PAGE | 107
INTERIM REPORT | PŪRONGO MŌ TĒNEI WĀ
Facing the future: population health challenges
Challenges require reorienting our health system More than a third of illness and disability New Zealanders experience is caused by known modifiable population-level risk factors, so is potentially preventable. Without significant population health investment, it is likely that this burden of disease and disability will continue to increase year on year.
Diet is the leading modifiable population risk factor, followed by high body mass index (BMI), tobacco use, and high blood pressure.153 Population health efforts have been, thus far, effective in reducing tobacco use, however, the ongoing impact of tobacco remains significant. Based on current trends, the prevalence of obesity is set to continue to increase presenting significant health and societal challenges.
Throughout our engagement, we heard that the challenges arising from changes in our global, environmental, societal, and technological contexts will require a fundamental shift in focus. A consistent theme was the need for a strengthened system that is better balanced towards wellness, prevention, equity, and sustainability.
[We need a] reorientation of the health and disability system to move ‘beyond its responsibility for providing clinical and curative services’ and embrace a wider mandate for supporting and promoting the wellbeing of our population. (Organisation submission)
If not tackled comprehensively and early, the health and wellbeing consequences of poverty, racism, alcohol, emerging (and re-emerging) infectious diseases, climate change, changes to our urban environment, depletion of environmental resources, antimicrobial resistance, natural disasters, and the pressures of commercial drivers of poor health, poor mental health, and age-related conditions such as dementia will put significant pressure on our health system.
The scale of these [environmental health and infectious disease] threats is growing, with notable examples being recurrent pandemics, the rise of [antimicrobial resistance] … and the effects of climate change and environmental disruption. There is an increasing need to have a co-ordinated and critical mass of specialist expertise and national infrastructure to assess and manage these threats. Core functions include surveillance and monitoring, risk assessment and management, responding to health emergencies, coordination and communication, prevention policy and guidelines, workforce development and infrastructure. (Organisation submission)
PAGE | 108
NEW ZEALAND HEALTH AND DISABILITY SYSTEM REVIEW | HAUORA MANAAKI KI AOTEAROA WHĀNUI
Using evidence to guide action Given the growing burden of disease from non-communicable diseases internationally, the World Health Organization (WHO) developed a menu of 88 highly cost-effective interventions.154 This has become known as WHO’s ‘best buys’, with interventions for each of the four key risks for non-communicable diseases (tobacco, harmful alcohol, unhealthy diet, and physical inactivity) and the four disease areas (cardiovascular disease, diabetes, cancer, and chronic respiratory disease).
Here in New Zealand, the Burden of Disease Epidemiology, Equity and Cost Effectiveness Programme (BODE³) at the University of Otago, Wellington, has developed a New Zealand specific health intervention league table that allows researchers, health professionals and policy makers to compare health interventions impacts on health gains, health system costs or cost-effectiveness155.
The strong body of evidence that prevention is cost effective in both the short and longer terms provides a good rationale for reorienting our efforts towards prevention and to work alongside other sectors to promote, protect, and improve health and wellbeing.156
A local example of a successful population health interventions is tobacco control, which is one of the most cost-effective interventions in the health sector.
Twenty years ago, about a quarter of all adults smoked. Most recent figures from the New Zealand Health Survey show this proportion has declined to 15%. For young people aged 15–17, the rate dropped from 16% in 2006/07 to under 4% in 2017/18.
However, smoking rates are still higher for Māori adults and (33%), Pacific (23%) adults. Adults living in the most socioeconomic deprived neighbourhoods are three times more likely to smoke as people living in the least deprived neighbourhoods
Reducing the harm from smoking remains the single most effective method of improving population health and reducing health inequalities.
Clear evidence exists that the combined effect of the components of New Zealand’s comprehensive tobacco control programme has resulted in the sharp decline in smoking rates. The components are legislation, including regulation (to prohibit sales to people aged under 18, restrict marketing and the display of products, and promote smoke-free environments), tobacco taxation, mass media campaigns and public education, and smoking cessation support.
Although it is difficult to disentangle the impact of each component, it is clear that raising the price of tobacco products by increasing taxation has been the single most important contributor to, in particular, the decrease in tobacco consumption and the decline in young people smoking.157

PAGE | 109
INTERIM REPORT | PŪRONGO MŌ TĒNEI WĀ
Working across sectors to influence health and wellbeing Health and health inequities are shaped by many powerful forces, most of which lie outside the direct influence of the health sector. Evidence shows that tackling the determinants of health and wellbeing will improve equity across a variety of societal outcomes.158
An important role of population health action is to actively seek out opportunities at all levels (global, national, regional, and local) to collaborate with and influence other sectors and key stakeholders to improve health and wellbeing. This role requires influencing all the determinants that affect health and wellbeing, in all parts of society, as well as ensuring the country has sufficient capacity and expertise to respond to emerging threats and emergencies.
We recognise that the risk factors for ill health and factors that promote health sit largely outside of the health sector. Therefore, all public health agencies must engage with and influence the decision-making and priority setting functions of these agencies for example, housing, urban design, education, air quality, water quality, transport, food safety etc. The [name of organisation] … highly recommends that public health must work across the whole of the government including local government. (Organisation submission)
The WHO established the Commission on Social Determinants of Health to compile the evidence on what can be done to promote health equity and to foster a global movement to achieve health equity. The commission’s report identified clear actions that need to be taken, underpinned by three principles:
improve the conditions of daily life – the circumstances in which people are born, grow, live, work, and age.
tackle the inequitable distribution of power, money, and resources – the structural drivers of those conditions of daily life – globally, nationally, and locally.
measure and understand the problem and assess the impact of action – expand the knowledge base, develop a workforce that is trained in the social determinants of health, and raise public awareness about the social determinants of health.159
Addressing the determinants of health requires working at multiple levels, using tools such as legislation (including regulation) at national levels, and building community partnerships at local levels.
Recent developments placing wellbeing central to a variety of government activities and Treasury’s Living Standards Framework should make it easier for a focus on the determinants of health and wellbeing.160 Opportunities also exist for improved cross-sectoral planning, commissioning, and delivery, particularly for complex issues with shared outcomes.

PAGE | 110
NEW ZEALAND HEALTH AND DISABILITY SYSTEM REVIEW | HAUORA MANAAKI KI AOTEAROA WHĀNUI
The 2019 amendments to the Local Government Act 2002 reinstated four aspects of community wellbeing into the responsibilities of local authorities, which will support stronger population health efforts in communities. Councils are now required to “play a broad role in promoting the social, economic, environmental, and cultural well-being of their communities, taking a sustainable development approach”.161 Given the breadth of functions local government hold that contribute to health, this new requirement offers a significant opportunity for the population health sector to work alongside local authorities to lift the health and wellbeing of communities and the health of the environment.
Local territorial authorities are important partners in that they are better positioned to engage their community in the discourse on including health in the planning for their communities and promoting innovative ideas. (Organisation submission)
Through our engagement we heard of positive examples where population health is effective in working across sectors. One framework often cited was Health in All Policies.162 Health in All Policies has been effectively applied in New Zealand at a regional level, often led by public health units, on issues such as water management, transport, housing, psychosocial wellbeing, and family harm. Another example is He Kainga Oranga, the Housing and Health Research Programme, which examines and clarifies the association between poor housing and ill health. This programme draws together existing and new research to identify effective housing-related interventions to improve individual, whānau, and community health.
Having a focus on the determinants of health will be essential for improving Māori health outcomes and this will require cross-agency collaboration.
Designing a system to meet the challenges
Having the right mix of functions at national, regional, and local levels Population health functions could be configured in many different ways to better meet current and future challenges. In a recent examination of population health jurisdictions outside New Zealand, Canterbury DHB found that differences in configuration exist despite broadly common objectives of universal access, effective care, improved health outcomes, efficient use of resources, high-quality services, and responsiveness.163 The DHB noted how population health systems in many developed countries have undergone multiple rounds of reform over the last 20–30 years. It concluded there is little in the literature to suggest one “ideal” configuration for a population health system, but aspects of system configuration can either enhance, or inhibit its effectiveness.164
A proposal for how population health functions might be best configured across national, regional and local levels in New Zealand was published in the NZ Medical Journal in 2015. This, alongside international learnings could provide a useful starting point for reassessing current configurations.
PAGE | 111
INTERIM REPORT | PŪRONGO MŌ TĒNEI WĀ
N A T I O N A L S E R V I C E S
For reasons of effectiveness or efficiency, some public health services should be delivered once for the country. These services include:
legislative oversight and a variety of technical support, including specialised advice, reference laboratory services, and nationally used manuals for communicable disease control and environmental health
surveillance and analysis of national and international communicable and non-communicable disease trends.
coordination of inter-district emergency responses national programmes, registers, and information systems such as the National Immunisation
Register and immunisation policy, screening programmes, and the drinking-water programme public health workforce planning and development national public health and intersectoral policy analysis and development development and maintenance, for the full spectrum of public health services, of a clear strategic
direction, consistent service specifications, and a transparent funding model that takes into account the particular public health needs of New Zealand’s varied local communities.
R E G I O N A L S E R V I C E S
Some services should be accessible to all districts and public health providers, but can be provided or supported by regional public health services or networks. Potential exists to improve the coordination of these services across the country to improve efficiency and effectiveness. These services include:
advanced surveillance and analysis, including the geographic information system (GIS) public health policy analysis programme design and evaluation environmental health technical expertise support for outbreak investigation and control, including surge capacity support health impact assessments development of consistent operational protocols to suit local needs public health workforce training.
L O C A L S E R V I C E S
Most public health programmes are provided in partnership by a variety of health and non-health providers. Effective delivery depends on well-supported local public health staff, local relationships, and an understanding of local communities and their needs. Delivery of regulatory services also requires national consistency and strong national links. Local services include:
identification of locally emerging public health issues communicable disease and outbreak control. public health emergency response regulatory controls on alcohol, tobacco, and the physical environment and associated health
promotion immunisation coordination liaison with and support for local authorities, DHBs, and primary care organisations support and coordination for health promotion in settings such as workplaces, education, primary
care. planning and funding of health care and public health programmes to meet local needs165.

PAGE | 112
NEW ZEALAND HEALTH AND DISABILITY SYSTEM REVIEW | HAUORA MANAAKI KI AOTEAROA WHĀNUI
Population health approach needs to be strengthened and integrated at all levels While we heard differences in views about how services should be commissioned and configured, one theme was consistent: population health leadership, functions, and accountabilities must be designed and delivered in a way that is coherent, coordinated and agile.
The need for greater population health leadership was the focus of a 2019 book by Sir David Skegg, an eminent New Zealand epidemiologist and professor of preventive and social medicine: 166
“The indispensable requirement is for national leadership and coordination by a critical mass of public health professionals …
Without such leadership, New Zealand will keep failing to deal with challenges such as our epidemic of obesity and the continuing burden of smoking-related diseases, and we will not be properly equipped to protect citizens from environmental hazards or to respond to pandemic threats.”
We heard suggestions throughout our engagement for how public health leadership could be strengthened. Some suggested stronger leadership using existing structures and building a wider consortium of population health support throughout the system. Others suggested new roles and entities such as a minister for population health, a separate ministry for population health, and an independent agency or commissioner with the authority to make evidence-based policy recommendations.
Strong national public health leadership, articulating a collective vision and providing strong direction will then enable the capacity and direction for more regionally coordinated public health approaches. (Organisation submission)
Emergency preparedness requires clear accountabilities and strong relationships Not having a clearly designed system with well-defined roles and accountabilities and a sufficient critical mass of expertise presents a risk to New Zealand’s ability to prevent and manage current and emerging environmental health and disease threats. Vulnerabilities in the current system have been exposed. The 2016 campylobacteriosis outbreak in Havelock North was frequently cited as an example of an avoidable population health ‘disaster’.
Clearer accountability structures are required to ensure an effective response to significant and consequential public health issues. For example, on matters of food safety, [public health units] are focused on outbreak recognition and control, whilst the Ministry [for] Primary Industries … has the primary regulatory role for food safety. It is essential that the responsibility to protect people from food-borne illnesses is prioritised equally by all of the organisations concerned, and that there is a non-negotiable mandate to protect public health. (Organisation submission)

PAGE | 113
INTERIM REPORT | PŪRONGO MŌ TĒNEI WĀ
Clear accountabilities and strong working relationships are most critical in emergency response situations, such as responding to natural disasters (for example, flood, forest fires, and earthquakes) when community action needs to be harnessed rapidly. However, these are equally important for addressing the ‘slower burning’ population health emergencies such as the obesity epidemic.
Having the right mix of skills and a critical mass of expertise Looking to the future, it is important that our population health efforts are led by a workforce with the right mix of skills at every level. This means having a strong core, as well as a strong flexible workforce to respond to changing local population needs.
Capacity and capability gaps have emerged in some parts of the system. We heard, for example, of a skill gap in health status assessment and surveillance, which is critical to an intelligent, adaptive system. Population health intelligence functions include monitoring and analysing the changing population, investigating patterns of disease and health, interpreting and providing information to support health and disability service activities, investigating variations in health outcomes, and helping to ensure strategic decisions are taken on the basis of evidence. Greater engagement of senior population health specialists will be important not only for their specific functions and skills but also in influencing the culture of the organisation. These functions need to be agile, smart, and responsive and are essential enablers for health system strategy, governance, and management.
A sustainable highly trained workforce is a strategic investment in public health. This investment is critical to be able to address future societal and environmental challenges, including preparedness for public health emergencies and large scale events, as well as providing leadership within and beyond the health sector. Nationally coordinated public health workforce planning and development is essential. (Organisation submission)
For the leadership functions of population health to be exercised, systematic investment in and development of population health leadership capability that fully reflects the diversity of Māori, Pacific, Asian, and other communities is urgently needed.
PAGE | 114
NEW ZEALAND HEALTH AND DISABILITY SYSTEM REVIEW | HAUORA MANAAKI KI AOTEAROA WHĀNUI
Directions for change: Population health For the system to be more effective in the future, population health needs to be recognised as a foundational element for the entire system. This requires that capacity is both increased and better integrated across the system, and that the system operates more effectively with other sectors.
POPULATION HEALTH IS FUNDAMENTAL TO THE SYSTEM
The Panel believes that the focus of the system needs to be much more on the population, not just the individual who presents for treatment.
Communities need to be more actively engaged in needs analysis and system planning. Greater emphasis on intersectoral work is also necessary to properly address the wider determinants of health.
A continued focus on the basics, such as clean water, immunisations, and the provision of robust emergency preparedness capacity able to react immediately at the local level, will become more, not less, important as issues such as climate change and antimicrobial resistance, have an increasing impact.
The Panel is well aware of ongoing debates about the desirability or otherwise of recreating a standalone Public Health Agency and consideration of which functions are best undertaken nationally, regionally, and locally. Further analysis and input from stakeholders is needed before we reach a view on this.

PAGE | 115
INTERIM REPORT | PŪRONGO MŌ TĒNEI WĀ
7 Tier 1 / Taumata 1
Tier 1 is critical. It is the part of the system offering the greatest opportunity to reduce the burden of disease, improve the health and wellbeing of future generations, and slow the growth in demand for hospital and specialist services.
The current system works well for many people. But services are still predominantly delivered within a “western medical model” which leaves Māori facing particular barriers to accessing services to meet their needs.
The system has many different funding regimes, different eligibility rules, different business and employment models, all expected to work together. Consumers are often confused and the lack of integration within the Tier means patient pathways are more complicated and less effective than they could be.
This section reports on what we heard in Phase One, looks at how the key parts of Tier 1 are currently managed and funded, and questions why it is that the changes promised by the Primary Health Care Strategy have not materialised.
Common themes from submissions in Phase One include the need to:
adopt a more holistic approach to care that recognises what patients and their whānau value and better recognises different beliefs
ensure there is a greater emphasis on Māori health and equity improve accessibility, which is not just about the cost of services, but also about the cost of patients’
time, travel costs, hours that services are available, and locations of services adopt a life course approach that empowers patients and their whānau to make decisions about
their care ensure the system is less fragmented and is organised in a more comprehensible and service user–
oriented way ensure there is greater involvement of servicer users, whānau, and communities throughout the
planning, service design, and decision-making processes. develop different models of service provision to better meet the needs of people who live in rural areas address workforce shortages and the need to develop workers with different skill sets.
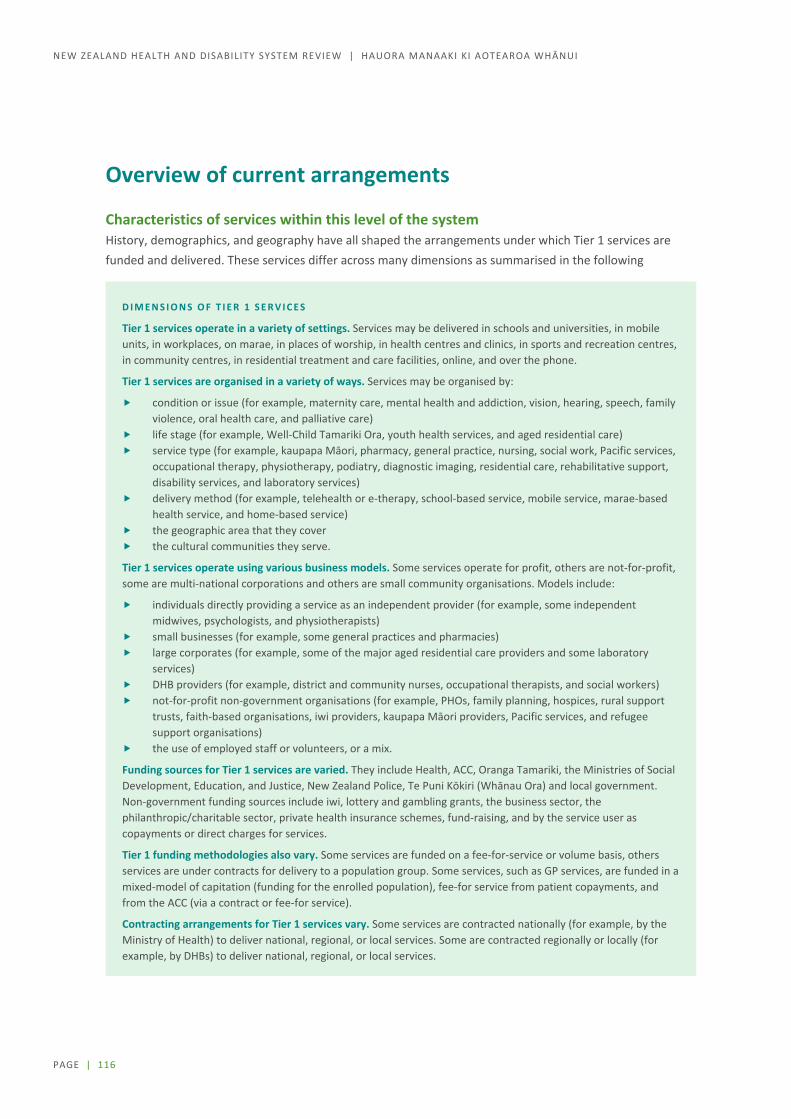
PAGE | 116
NEW ZEALAND HEALTH AND DISABILITY SYSTEM REVIEW | HAUORA MANAAKI KI AOTEAROA WHĀNUI
Overview of current arrangements
Characteristics of services within this level of the system History, demographics, and geography have all shaped the arrangements under which Tier 1 services are funded and delivered. These services differ across many dimensions as summarised in the following
D I M E N S I O N S O F T I E R 1 S E R V I C E S
Tier 1 services operate in a variety of settings. Services may be delivered in schools and universities, in mobile units, in workplaces, on marae, in places of worship, in health centres and clinics, in sports and recreation centres, in community centres, in residential treatment and care facilities, online, and over the phone.
Tier 1 services are organised in a variety of ways. Services may be organised by:
condition or issue (for example, maternity care, mental health and addiction, vision, hearing, speech, family violence, oral health care, and palliative care)
life stage (for example, Well-Child Tamariki Ora, youth health services, and aged residential care) service type (for example, kaupapa Māori, pharmacy, general practice, nursing, social work, Pacific services,
occupational therapy, physiotherapy, podiatry, diagnostic imaging, residential care, rehabilitative support, disability services, and laboratory services)
delivery method (for example, telehealth or e-therapy, school-based service, mobile service, marae-based health service, and home-based service)
the geographic area that they cover the cultural communities they serve.
Tier 1 services operate using various business models. Some services operate for profit, others are not-for-profit, some are multi-national corporations and others are small community organisations. Models include:
individuals directly providing a service as an independent provider (for example, some independent midwives, psychologists, and physiotherapists)
small businesses (for example, some general practices and pharmacies) large corporates (for example, some of the major aged residential care providers and some laboratory
services) DHB providers (for example, district and community nurses, occupational therapists, and social workers) not-for-profit non-government organisations (for example, PHOs, family planning, hospices, rural support
trusts, faith-based organisations, iwi providers, kaupapa Māori providers, Pacific services, and refugee support organisations)
the use of employed staff or volunteers, or a mix.
Funding sources for Tier 1 services are varied. They include Health, ACC, Oranga Tamariki, the Ministries of Social Development, Education, and Justice, New Zealand Police, Te Puni Kōkiri (Whānau Ora) and local government. Non-government funding sources include iwi, lottery and gambling grants, the business sector, the philanthropic/charitable sector, private health insurance schemes, fund-raising, and by the service user as copayments or direct charges for services.
Tier 1 funding methodologies also vary. Some services are funded on a fee-for-service or volume basis, others services are under contracts for delivery to a population group. Some services, such as GP services, are funded in a mixed-model of capitation (funding for the enrolled population), fee-for service from patient copayments, and from the ACC (via a contract or fee-for service).
Contracting arrangements for Tier 1 services vary. Some services are contracted nationally (for example, by the Ministry of Health) to deliver national, regional, or local services. Some are contracted regionally or locally (for example, by DHBs) to deliver national, regional, or local services.
PAGE | 117
INTERIM REPORT | PŪRONGO MŌ TĒNEI WĀ
Tier 1 service funding and copayments
Inconsistencies in service coverage A wide variety of providers deliver Tier 1 services, and considerable variability exists in the ‘rules’ around which Tier 1 services are publicly funded. Some services are fully funded (for example, maternity care) and others are mostly available on only a user-pays basis (for example, adult dental care, podiatry, and talking therapies for people with mild to moderate mental health problems).
Table 7.1 illustrates the diversity of funding sources, including service user contributions, for different Tier 1 services. This table is not exhaustive, but shows the variability in funding approaches.
Around 70% of Tier 1 public health expenditure is accounted for by four services:
General practice and PHO services. Most general practice funding is through a nationally negotiated contract between DHBs and PHOs. In this national contract, funding is provided on a capitated basis to PHOs. PHOs are required to pass around $750 million of this funding through to individual practices on a capitation basis. ACC pays directly to GPs around $150 million for primary care services on a fee-for-service basis. About $395 million is paid by individuals or private insurance companies, again on a fee-for-service basis.
Disability support services. Accountability for purchasing these services remains with the Ministry of Health, with most providers being community-based non-government organisations (NGOs). Access to funded services is based on the outcome of a needs assessment, and for those who meet eligibility criteria there is no copayment. Expenditure on services provided for people who do not meet the eligibility criteria cannot be tracked, but we expect most providers will have a mix of public and private funding.
Aged care (residential) services. Although these services are traditionally thought of as government funded, almost half of their funding comes from the residents in two forms. First, aged residential care subsidies are means and asset tested, with an estimated $240 million being paid by people with assets above the threshold. Second, people falling below the asset threshold have a portion of their superannuation payment paid directly to the residential care facility. Since this money would have been paid to the resident, this is effectively an out-of-pocket payment. In addition, residents can pay extra for additional services and amenities. That spending is not included in Figure 7.1.
Aged care (home-based) services. DHBs are accountable for purchasing these services, with most providers being community-based NGOs, some of which also provide disability support services. Access to funded services is based on the outcome of a needs assessment, and for those who meet eligibility criteria there is no copayment. Expenditure on services provided for people who do not meet the eligibility criteria cannot be tracked.
Figure 7.1 shows the flow of funding into different service areas. Though services are often thought of as being inside or outside the public system, it’s clear that most Tier 1 services are funded through a complex mix of streams.

PAGE | 118
NEW ZEALAND HEALTH AND DISABILITY SYSTEM REVIEW | HAUORA MANAAKI KI AOTEAROA WHĀNUI
T A B L E 7 . 1 : P U B L I C A N D P R I V A T E F U N D I N G S O U R C E S F O R A R A N G E O F T I E R 1 S E R V I C E S , 2 0 1 7 / 1 8
Public Funding $m Private Funding $m Total Expenditure $m
DHB Ministry
of Health
ACC Sub total
Private insurance
Out of pocket
Sub total Total
Public funding share
General practice and PHO services
1,164 149 1,313 31 364 395 1,708 77%
Pharmaceuticals and community pharmacy1
1,312 1,312 8 772 780 2,092 63%
Disability support services2,4
1,256 1,256 4 1,256 100%
Aged care (residential)2,3
1,025 1,025 860 860 1,885 54%
Aged care
(home based)2,4 678 678 4 678 100%
Social rehabilitation 480 480 480 100%
Community mental health
360 41 401 19 19 420 95%
Community referred laboratory services
317 317 3 3 320 99%
Oral health 200 29 229 31 702 733 962 24%
Maternity 64 163 227 7 7 234 97%
Ambulance and other transport
111 101 212 8 8 220 96%
Child health 99 55 154 154 100%
Physiotherapy 143 143 75 75 218 66%
Radiology 74 58 132 128 41 169 301 44%
Vocational rehabilitation
103 103 103 100%
Māori health services 50 50 50 100%
Telehealth 27 27 27 100%
Optometry 22 345 367 367 0%
Total 5,343 1,653 1063 8,059 227 3,189 3,416 11,475 70%
47% 14% 9% 70% 2% 28% 30%
Notes: 1 This comprises government contribution of $871 million for pharmaceutical costs and $441 million for community pharmacy
services. 2 Expenditure does not include pay equity costs. 3 Out-of-pocket contribution includes superannuation contributions. 4 Data for out-of-pocket payments is poor. It is likely that some should be attributed to this and other items showing 100% public
funding.
SOURCE: MINISTRY OF HEALTH, STATS NZ HOUSEHOLD ECONOMIC SURVEY, ACC, INTERNAL CALCULATIONS.
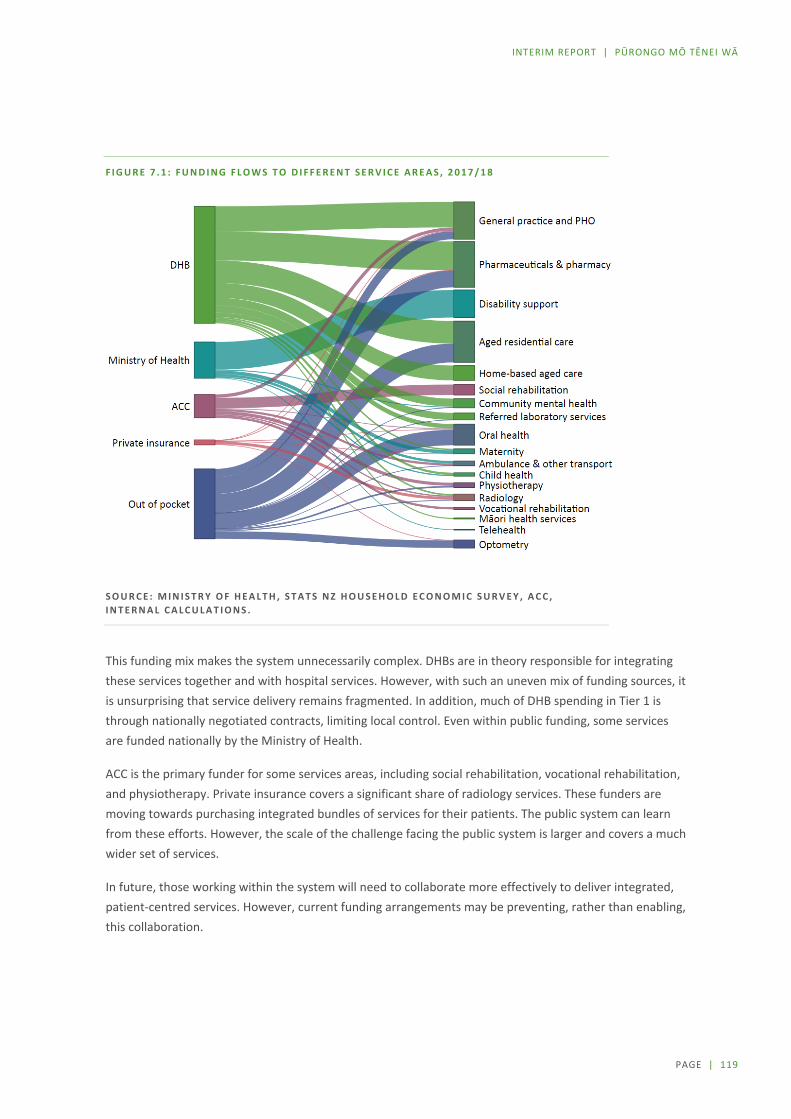
PAGE | 119
INTERIM REPORT | PŪRONGO MŌ TĒNEI WĀ
F I G U R E 7 . 1 : F U N D I N G F L O W S T O D I F F E R E N T S E R V I C E A R E A S , 2 0 1 7 / 1 8
S O U R C E : M I N I S T R Y O F H E A L T H , S T A T S N Z H O U S E H O L D E C O N O M I C S U R V E Y , A C C , I N T E R N A L C A L C U L A T I O N S .
This funding mix makes the system unnecessarily complex. DHBs are in theory responsible for integrating these services together and with hospital services. However, with such an uneven mix of funding sources, it is unsurprising that service delivery remains fragmented. In addition, much of DHB spending in Tier 1 is through nationally negotiated contracts, limiting local control. Even within public funding, some services are funded nationally by the Ministry of Health.
ACC is the primary funder for some services areas, including social rehabilitation, vocational rehabilitation, and physiotherapy. Private insurance covers a significant share of radiology services. These funders are moving towards purchasing integrated bundles of services for their patients. The public system can learn from these efforts. However, the scale of the challenge facing the public system is larger and covers a much wider set of services.
In future, those working within the system will need to collaborate more effectively to deliver integrated, patient-centred services. However, current funding arrangements may be preventing, rather than enabling, this collaboration.

PAGE | 120
NEW ZEALAND HEALTH AND DISABILITY SYSTEM REVIEW | HAUORA MANAAKI KI AOTEAROA WHĀNUI
Copayments are significant and affect access The complex mix of funding in Tier 1 means that patient copayments are required for many services.
Out-of-pocket spending accounts for around 13% of total health spending. As DHBs cannot charge New Zealand residents for hospital services, most of the out-of-pocket spend is on Tier 1 services (see Figure 7.2).
F I G U R E 7 . 2 : P R I V A T E S H A R E O F T O T A L S P E N D I N G O N H E A L T H A N D D I S A B I L I T Y S E R V I C E S ,
2 0 1 7 / 1 8
S O U R C E : M I N I S T R Y O F H E A L T H , S T A T S N Z H O U S E H O L D E C O N O M I C S U R V E Y , A C C , I N T E R N A L C A L C U L A T I O N S .
Evidence exists that cost prevents some people from using these Tier 1 services (this is discussed further below). This contributes to poorer health outcomes and can lead to health conditions becoming more serious or chronic or disabling.
Across Tier 1 a variety of different approaches have been adopted to reduce the cost of health and disability services. Some of the ways in which eligibility for lower costs are determined include whether a person:
holds a health entitlement card such as a Community Services Card or Prescription Subsidy Scheme meets the criteria of a scheme or an initiative, for example, enrolment in a Very Low Cost Access
(VLCA) practice entitles individuals to low cost general practice visits belongs to a particular group (for example, an age group, a gender, or an ethnic group) for whom
services are subsidised (such as free dental services for people aged 0–18) has a certain health condition (for example, some health conditions are the basis for free flu
vaccinations).
0% 20% 40% 60% 80%
Maternity
Ambulance and other transport
Community mental health
General Practice and PHO services
Physiotherapy
Pharmaceuticals andcommunity pharmacy
Aged care (residential)
Radiology
Oral health
Private share of spending
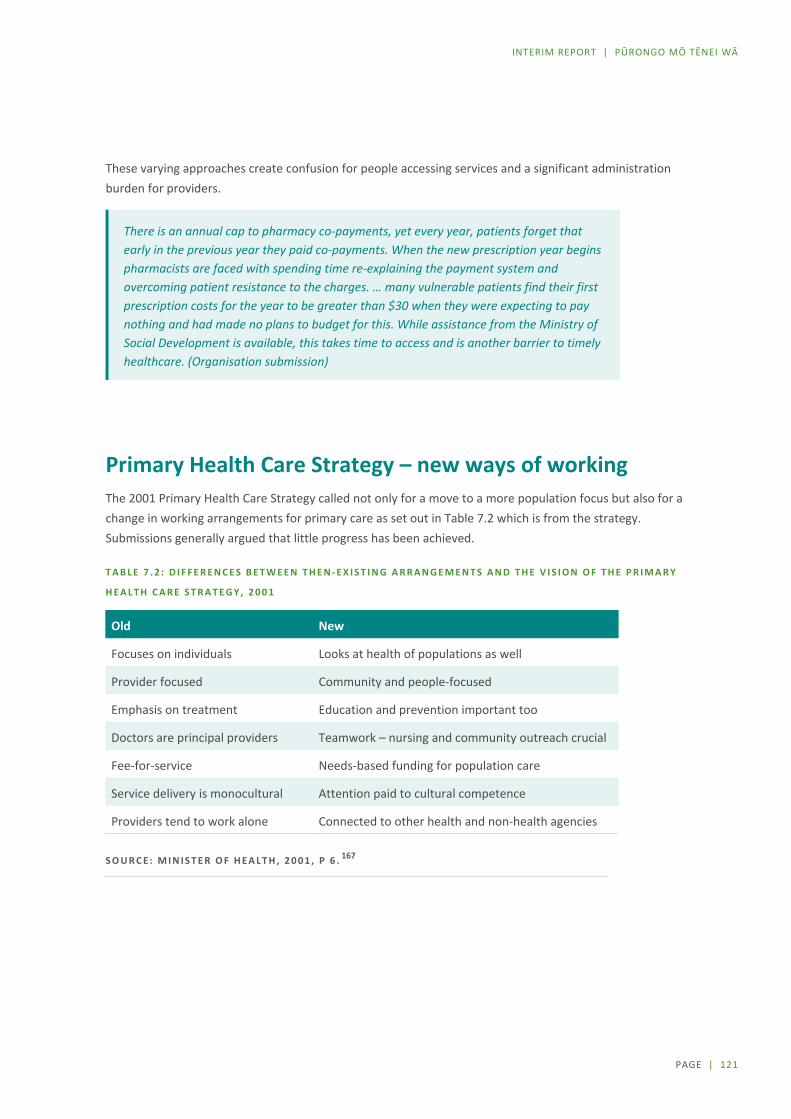
PAGE | 121
INTERIM REPORT | PŪRONGO MŌ TĒNEI WĀ
These varying approaches create confusion for people accessing services and a significant administration burden for providers.
There is an annual cap to pharmacy co-payments, yet every year, patients forget that early in the previous year they paid co-payments. When the new prescription year begins pharmacists are faced with spending time re-explaining the payment system and overcoming patient resistance to the charges. … many vulnerable patients find their first prescription costs for the year to be greater than $30 when they were expecting to pay nothing and had made no plans to budget for this. While assistance from the Ministry of Social Development is available, this takes time to access and is another barrier to timely healthcare. (Organisation submission)
Primary Health Care Strategy – new ways of working The 2001 Primary Health Care Strategy called not only for a move to a more population focus but also for a change in working arrangements for primary care as set out in Table 7.2 which is from the strategy. Submissions generally argued that little progress has been achieved.
T A B L E 7 . 2 : D I F F E R E N C E S B E T W E E N T H E N - E X I S T I N G A R R A N G E M E N T S A N D T H E V I S I O N O F T H E P R I M A R Y
H E A L T H C A R E S T R A T E G Y , 2 0 0 1
Old New
Focuses on individuals Looks at health of populations as well
Provider focused Community and people-focused
Emphasis on treatment Education and prevention important too
Doctors are principal providers Teamwork – nursing and community outreach crucial
Fee-for-service Needs-based funding for population care
Service delivery is monocultural Attention paid to cultural competence
Providers tend to work alone Connected to other health and non-health agencies
S O U R C E : M I N I S T E R O F H E A L T H , 2 0 0 1 , P 6 . 167

PAGE | 122
NEW ZEALAND HEALTH AND DISABILITY SYSTEM REVIEW | HAUORA MANAAKI KI AOTEAROA WHĀNUI
New ways of working have made a difference Significant government funding has contributed to reducing some of the cost-related access barriers for some population groups, and patches of innovative services and models are providing more integrated patient and whānau-focused, and culturally-centred services.
E X A M P L E S O F N E W W A Y S O F W O R K I N G
Taumarunui Community Kōkiri Trust (TCKT) – He Mate Huka Oranga. TCKT is a kaupapa Māori organisation operating across the Waikato, Ruapēhu, and Waitomo districts. With 3 GP clinics, TCKT serves an enrolled population of 6,800, 52% of which are Māori, and 73% live in quintile 4 and 5 areas. Diabetes was identified as a significant concern with over 500 of their clients aged 45+ being diagnosed with Type 2 Diabetes. A nurse-led improvement team was formed to develop an integrated, whānau ora pathway to improve diabetes outcomes. This is based on a collaborative approach through the Taumarunui Integrated Health care model where every door is the right door, whether by self, internal or external referral. Contact is made and at assessment the holistic needs of a person or family household are identified and the appropriate support services are put in place for them.
Farmstrong. Farmstrong is a nationwide rural wellbeing programme to help farmers and growers live well to farm well. It was launched in 2015 by the founding partners Mental Health Foundation and rural insurer FMG with support from the Movember Foundation. ACC also joined as a strategic partner.168 The initiative is designed to help farmers identify health and wellbeing changes they want to make. It is based on collaboration and partnerships between individuals and organisations to educate, inform, inspire and motivate. The initiative undertakes audience research to better understand the health and wellbeing needs of farmers and growers and offers practical ways to help them make improvements.169
Mapu Maia Integrated Health Promotion and Counselling. An integrated approach to health promotion and clinical interventions (counselling) has been adopted by the team at Mapu Maia where they have dual roles. This allows counsellors to be in the community delivering health promotion messages and engaging and participating in community groups and projects. The interaction builds rapport and trust with the community which in turn leads to the opening of doors for a conversation to happen (a clinical intervention). Allowing counsellors to be immersed in communities, educating and raising awareness increases access to service and decreases stigma. A key aspect of the engagement process includes the use of traditional concepts: Va Nofo (understanding where you sit in a relationship); Va Fealoa’i (understanding how you connect and relate to others from your Va Nofo); Va Tuaoi (understanding cultural speaking protocols); and Va Tapuia (understanding the relationships between people, family, ancestors, the spirits, land and sea, the environment, and all living things). Fundamental to the process of Mapu Maia is talatalanoa, or inclusive, participatory, and transparent dialogue that provides space to share stories, and build empathy and rapport towards building shared outcomes.170
Atu-Mai / Aunty Dee (Le Va) – Confident and resilient Pacific youth. Pacific young people embracing their culture to create healthy communities is at the heart of Atu-Mai. It is a violence prevention programme that supports Pacific young people to be confident and resilient, and experience healthy family and social relationships. An online tool supporting the programme is Aunty Dee, an app designed to support young people’s wellbeing. Aunty Dee draws on cognitive behavioural therapy, helping people work through real life problems to generate evidence-based solutions and actions. Aunty Dee is assisting Pacific youth in particular to actively solve their problems and learn how to problem solve in the process. Use of the tool is demonstrating some promising outcomes, most significantly, results show that if users indicate suicidality, Aunty Dee is an effective platform to connect them to a free trained counsellor through its webchat function, any time of the day.
Overall, the Atu-Mai programme combines evidence-based approaches with expert knowledge, community leadership, and co-design with Pacific young people to ensure it is culturally relevant, family-focused and community-led. It is inspired by Pacific values, concepts and identity to change the way issues of violence are addressed using a systems approach to realise meaningful and positive change in a collective and holistic way. This innovative framework measures success by tracking values that are important to Pacific such as family relations and building cultural capital tracked over time. 171

PAGE | 123
INTERIM REPORT | PŪRONGO MŌ TĒNEI WĀ
Changes that have been introduced include:
workforces are taking on roles previously undertaken by others, for example nurse-led models are being adopted, particularly in rural areas, and nurse prescribers and nurse practitioners are playing an important role in supporting the management of patients with chronic conditions
kaupapa Māori models that have a more holistic and whānau-focused approach are being adopted to improve health outcomes
technology is being used to improve access to services, for example e-mental health approaches such as SPARX which is a computerised CBT intervention for treating depression in young people that takes the form of an interactive 3D fantasy game
peer support, self-management programmes, and coaching models are being adopted particularly to support behavioural change
changing approaches within existing services – for example there are over 150 general practices now operating the Healthcare Home model. This model bundles several evidence based elements into four core domains, urgent and unplanned care, proactive care, routine and preventative care and business efficiency and sustainability. A collaborative has been developed to support general practices to adopt this model, with developments including telephone triaging of appointments, extended hours, multidisciplinary working, and patient portals.
Māori health provider delivery of whānau-centred models is effective It is recognised that Māori providers are uniquely placed to deliver on Māori aspirations and concepts of health and wellbeing alongside the delivery of treatment and care.172 Most commonly, Māori health service providers are iwi or Māori owned and community based, Māori governed, and deeply rooted in Māori values and cultural practices.173 These providers generally provide services to predominantly Māori high-needs communities.
In particular, recognition is increasing that whānau-centred service delivery can have positive impacts on health and wellbeing outcomes for Māori. Studies show that whānau involvement and recognition of culture in care can improve access and satisfaction in services.174 175 176Examples of different models and approaches developed to deliver whānau-centred and culturally responsive services to improve Māori health and wellbeing are set out in whānau-centred service delivery.
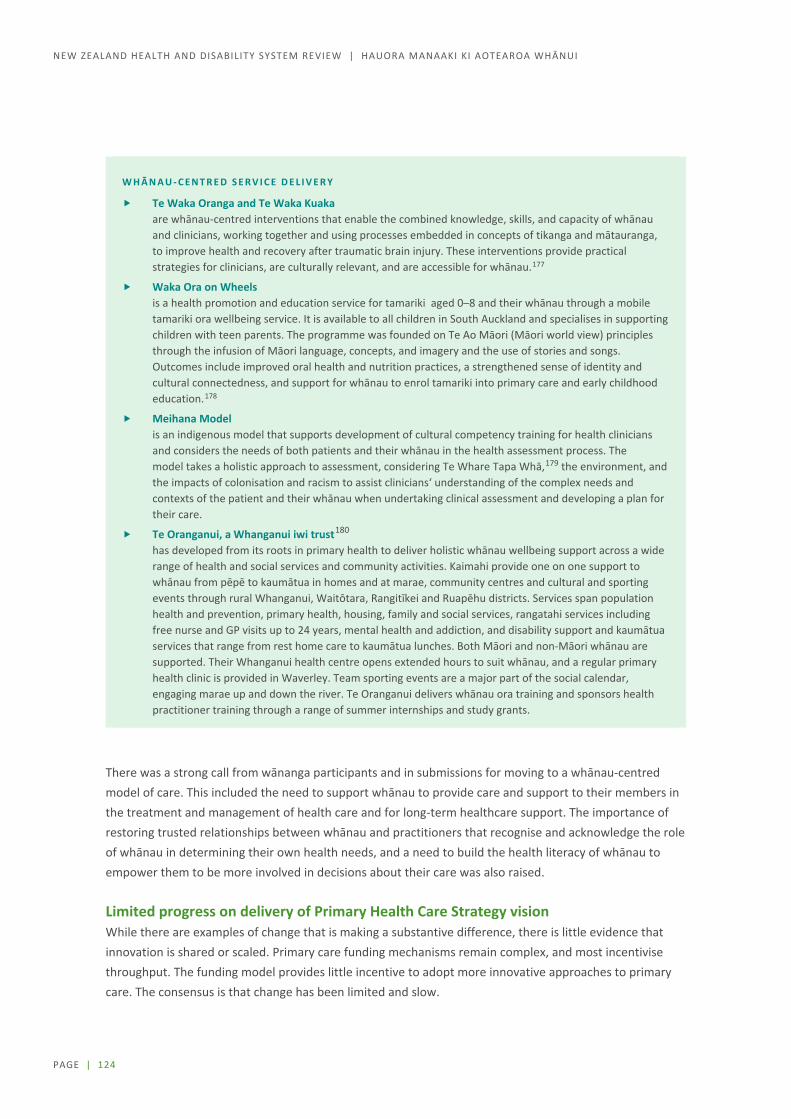
PAGE | 124
NEW ZEALAND HEALTH AND DISABILITY SYSTEM REVIEW | HAUORA MANAAKI KI AOTEAROA WHĀNUI
W H Ā N A U - C E N T R E D S E R V I C E D E L I V E R Y
Te Waka Oranga and Te Waka Kuaka are whānau-centred interventions that enable the combined knowledge, skills, and capacity of whānau and clinicians, working together and using processes embedded in concepts of tikanga and mātauranga, to improve health and recovery after traumatic brain injury. These interventions provide practical strategies for clinicians, are culturally relevant, and are accessible for whānau.177
Waka Ora on Wheels is a health promotion and education service for tamariki aged 0–8 and their whānau through a mobile tamariki ora wellbeing service. It is available to all children in South Auckland and specialises in supporting children with teen parents. The programme was founded on Te Ao Māori (Māori world view) principles through the infusion of Māori language, concepts, and imagery and the use of stories and songs. Outcomes include improved oral health and nutrition practices, a strengthened sense of identity and cultural connectedness, and support for whānau to enrol tamariki into primary care and early childhood education.178
Meihana Model is an indigenous model that supports development of cultural competency training for health clinicians and considers the needs of both patients and their whānau in the health assessment process. The model takes a holistic approach to assessment, considering Te Whare Tapa Whā,179 the environment, and the impacts of colonisation and racism to assist clinicians‘ understanding of the complex needs and contexts of the patient and their whānau when undertaking clinical assessment and developing a plan for their care.
Te Oranganui, a Whanganui iwi trust180 has developed from its roots in primary health to deliver holistic whānau wellbeing support across a wide range of health and social services and community activities. Kaimahi provide one on one support to whānau from pēpē to kaumātua in homes and at marae, community centres and cultural and sporting events through rural Whanganui, Waitōtara, Rangitīkei and Ruapēhu districts. Services span population health and prevention, primary health, housing, family and social services, rangatahi services including free nurse and GP visits up to 24 years, mental health and addiction, and disability support and kaumātua services that range from rest home care to kaumātua lunches. Both Māori and non-Māori whānau are supported. Their Whanganui health centre opens extended hours to suit whānau, and a regular primary health clinic is provided in Waverley. Team sporting events are a major part of the social calendar, engaging marae up and down the river. Te Oranganui delivers whānau ora training and sponsors health practitioner training through a range of summer internships and study grants.
There was a strong call from wānanga participants and in submissions for moving to a whānau-centred model of care. This included the need to support whānau to provide care and support to their members in the treatment and management of health care and for long-term healthcare support. The importance of restoring trusted relationships between whānau and practitioners that recognise and acknowledge the role of whānau in determining their own health needs, and a need to build the health literacy of whānau to empower them to be more involved in decisions about their care was also raised.
Limited progress on delivery of Primary Health Care Strategy vision While there are examples of change that is making a substantive difference, there is little evidence that innovation is shared or scaled. Primary care funding mechanisms remain complex, and most incentivise throughput. The funding model provides little incentive to adopt more innovative approaches to primary care. The consensus is that change has been limited and slow.
PAGE | 125
INTERIM REPORT | PŪRONGO MŌ TĒNEI WĀ
A recent report ‘Hauora’ from the Waitangi Tribunal articulates claimant concerns about the legislative and policy framework that underpins the primary health care system and its services. In particular, claimants noted that while the Primary Health Care Strategy provided a strong foundation towards pursuing equity in health outcomes for Māori, it had not been adequately implemented to achieve this goal.181
A number of submissions also proposed that changes to the system should be focused on equity and improving the way the system works to better meet the needs of those who currently have less equitable outcomes.
In changing the model of care in general practice, it is imperative that the sector responds to not just the articulate and demanding, but also reaches out to those population groups whose voices are often not heard and who experience the greatest health inequities. Proposed customer focus initiatives must be assessed to ensure that they address the needs of the vulnerable population groups and hence can be expected to reduce inequities – or at least not worsen existing inequities. (Organisation submission)
Phase One discussions and submissions noted a variety of issues that made it challenging to move more towards the vision of the Primary Health Care Strategy, including the following:
Decision-making processes have not sufficiently engaged communities in discussions about what matters most to them, and historical models of service delivery have prevailed. The strong focus on cultural competence and improving equity of outcomes mapped out in the vision has not been fully realised in the implementation of the strategy.
Providers determine locations and working hours; consumers have limited ability to influence this. This has resulted in higher concentrations of providers in some areas and shortages in other areas, particularly in remote rural and high deprivation areas. There have also been requests for extended hours as part of business as usual.
Funding for capitation-based general practice services must be channelled through PHOs. This constrains the system’s ability to offer consumers different ways of accessing these services that may better suit their needs and makes it challenging to integrate general practice services into other provider models of delivery.
The complexity and mix of funding and contracting mechanisms in place in Tier 1 have inhibited changes in service delivery arrangements. The scope of services offered by most providers has not broadened significantly over the last 18 years. The focus of PHOs and general practice is still narrow (for example, pharmacy and behavioural services have not generally been embedded in general practice). Likewise, it has been challenging for community pharmacies to broaden the variety of services they offer.
Changes in the ways Tiers 1 and 2 interact have been limited. In general, access to specialists is still via referral, and transitions of care between Tier 1 and Tier 2 are still unwieldly. The increased use of electronic referrals and tele- and video-links is assisting, but more fundamental change in work practices will be required if this is to grow at pace (see further chapter 9: Tier 2).

PAGE | 126
NEW ZEALAND HEALTH AND DISABILITY SYSTEM REVIEW | HAUORA MANAAKI KI AOTEAROA WHĀNUI
Fragmented IT systems do not make it easy for providers to share information and work together in a seamless way. The introduction of patient portals has improved access for some patients to their records and has facilitated communication with practices. However, the variety of systems being used without guaranteed interoperability does not facilitate the sharing of patient information in the way required for integrated care.
Public reporting of primary care utilisation and outcomes is seen as an important mechanism for public accountability for the investment in primary health care services. Evidence presented to the Waitangi Tribunal showed that only limited data was provided to DHBs by PHOs and that this data was often incomplete. The Waitangi Tribunal also noted that the paucity of publicly available data limits opportunities to monitor and evaluate the performance of the health sector and in particular that there is a lack of measurement of Māori specific outcomes.
‘It is difficult to know how the Ministry of Health and DHBs work to hold PHOs to account, including in relation to Māori health, as such research does not, to my knowledge, currently exist.’ (p132)182
Service snapshots The observations set out above are generally common across Tier 1. Alongside this, preliminary analysis and discussions have been undertaken around national contracts that have high levels of public funding. These include:
Community pharmacy Oral health Maternity Well Child / Tamariki Ora Aged residential care PHOs and primary care through general practice
Brief summaries of the first five areas are provided below with a fuller discussion of PHOs and primary care. Additional information is included in Appendix G (online).
Community pharmacy Medicines to prevent, treat or manage illnesses or conditions are the most common intervention in health care. People can purchase some medicines over the counter and can self-refer for advice from community pharmacies. There is also an agreed list of funded medicines that are accessed by a prescription from an authorised prescriber. Many visits to a general practitioner or specialist result in a prescription. In 2017/18 around 72 million items were dispensed, at a total cost of $1,312m. This cost covered both the medicines cost ($871m) and the cost of the community pharmacy services ($441m).

PAGE | 127
INTERIM REPORT | PŪRONGO MŌ TĒNEI WĀ
Current arrangements Community pharmacy services are provided from just over 1,000 community pharmacies, most of which are located in community shopping areas, providing the public with convenient access to their services. All pharmacies are required to operate under the immediate supervision and control of a registered pharmacist. General practitioners cannot own pharmacies and there are restrictions on authorised prescribers of medicines having an interest in a pharmacy.
Community pharmacy services are funded by DHBs through a nationally agreed contract. In the most recent negotiation a new national contract, the Integrated Community Pharmacy Services Agreement (ICPSA), was established. A tiered model has been adopted that cover the provision of nationally agreed core services for the supply of medicines and standardised services, while allowing DHBs scope to commission some services locally.
The bulk of community pharmacy funding remains directly linked to the number of prescription items dispensed. Some additional funding is provided where community pharmacies provide additional pharmaceutical and clinical advisory services to specific populations.
For people who are prescribed medicines, there is a standard prescription copayment of $5 per item for those 14 years of age and above. The Community Service Card (CSC) holders are subject to the same fee as non-card holders. However the prescription copayment is waived for any individual after 20 items have been dispensed to a family in a year.
This Prescription Subsidy Scheme creates a considerable administrative burden for community pharmacies. Its inconsistency with fee subsidy approaches adopted for general practice services creates confusion for patients.
Equity of access In contrast to many other areas of the health system, there is a single robust process by which PHARMAC determines what medicines will be funded nationally and this list is then used by all providers of community pharmacy services. Extensive independent medical advice is sought, and economic analysis undertaken as part of the consideration of which medicines to fund.
While there is a consistent list of funded medicines that are able to be prescribed, recent analysis has identified that the age-standardised rates (medicines dispensed) by ethnicity (Māori to non-Māori) are similar and so look equal, but when the burden of disease (health need) of Māori is factored in, inequality becomes apparent.183 This means Māori are not benefiting from medicines in the same way as non-Māori, despite their health need being higher, leading to greater inequities in health.
Cost is a key barrier to accessing medicines. An estimated 257,000 adults (6.6%) in 2017/18 reported they did not collect their prescriptions due to cost in the past year. Around 28,000 children (3.0%) had a prescription that was not collected due to cost in the past year, down from 6.6% in 2011/12, presumably due to the expansion of free prescription access for children. Māori and Pacific adults and children were more than twice as likely to not have collected a prescription due to cost as non-Pacific and non-Māori adults and children respectively, after adjusting for age and gender differences.184

PAGE | 128
NEW ZEALAND HEALTH AND DISABILITY SYSTEM REVIEW | HAUORA MANAAKI KI AOTEAROA WHĀNUI
Pharmaceutical co-payments create access barriers to medicines for our most needy and vulnerable. This leads to avoidable downstream impacts on health outcomes for these populations. (Organisation submission)
Barriers to medicines are broader than just cost. Recent analysis of the current process for a patient to access a funded medicine points to barriers at each stage that may contribute inequities in medicines access. 185
There is also research that medicine adherence is poor. Research has shown that as few as 16% of patients who are prescribed a new medicine take it as prescribed, experience no problems and receive as much information as they need.186 Addressing issues relating to utilisation and adherence will be important in addressing health outcomes across the population.
Opportunities for change Looking to the future, technology developments, patient expectations for greater convenience and the use of robotics will change the way medicines are dispensed. This technology is already available in New Zealand with some people having funded and non-funded prescription medicines delivered direct to their home. Medicines apps are also being used by some patients that provide medicines instructions and information, daily reminders, and coordinates repeat prescriptions. Internationally, other models such as medicine dispensing robots are being used that allow people to order repeat prescriptions online and pick them up from a secure collection facility which is open 24/7. 187
Innovations such as these have the potential to improve medicine access and adherence but will also free up pharmacist time to enable them to better utilise their skills and focus on delivering enhanced patient care. They will also likely change the distribution channels for medicines considerably with people choosing home delivery or collection points other than a community pharmacy.
Expanding the role of pharmacists Historically community pharmacy services have been isolated from other primary care providers. An enhanced role for pharmacists and the need for a pharmacy to be better integrated in the health care system has been a recurrent theme for a number of years. 188 189 190 191
We see an opportunity exists for an increased role for community pharmacy services to support people staying well and in their own homes through more population and personal health initiatives, minor aliment and referral services and complex medicine management services, as well as essential medicine dispensing services for consumers. (Organisation submission)
The concept of pharmacist integration into general practice has been gaining momentum internationally, such as in Australia, England, Canada and the US. Economic benefits attributed to practice pharmacists have been savings in medication costs and freeing up general practitioner time, alongside improvements to the quality of patient care in terms of reduced medication errors and improvements in chronic disease management.192

PAGE | 129
INTERIM REPORT | PŪRONGO MŌ TĒNEI WĀ
Clinical pharmacists can provide medicine therapy assessments or utilisation reviews. Such services can improve prescribing, particularly for patients with complex long term conditions, and can help to address issues of adherence and patient literacy with medicines. This can be important for the elderly, but also for Māori and Pacific populations that experience a disproportionate burden of long term conditions. (Organisation submission)
A 2017 study identified 31 pharmacists working in general practice, 193 mainly in the Hawke’s Bay, Waikato, Otago and Southland, but this model was very much still in its infancy. There is considerable scope for pharmacists to be a more integral part of team based care, in a variety of roles including, prescribing advice, medicines utilisation reviews and assisting with medicines adherence. In addition some may take on a prescribing role.
Oral Health
The World Health Organization defines oral health as:
“A state of being free from chronic mouth and facial pain, oral and throat cancer, oral infection and sores, periodontal (gum) disease, tooth decay, tooth loss, and other diseases and disorders that limit an individual’s capacity in biting, chewing, smiling, speaking, and psychosocial wellbeing”194
Most oral health conditions are preventable. Preventive interventions include community water fluoridation and promotion of fluoride toothpaste, tobacco and alcohol controls, measures to reduce the consumption of sugary drinks and foods, and health promotion to improve oral health literacy. At the broader determinants level, reducing poverty is also likely to contribute to improved oral health.
Poor oral health is associated with poor general health. Conditions such as diabetes and chronic kidney disease management, cardiovascular conditions, aspiration pneumonia, and medical and pharmacological therapies contribute to increasing the severity of oral health conditions, and poor oral health complicates these and other medical conditions.195
Current service provision arrangements In 2017/18, Vote Health, funded $198m of services which included:
free basic dental care for pre-school and primary school children (up to and including Year 8) delivered by dental therapists within the Community Oral Health Service largely via school dental services
free basic dental care for adolescents (Year 9 up to 18th birthday) delivered by private dentists in the community under contract to DHBs. This contract generally also includes special dental services for younger children who require more complex treatment than can be delivered by a dental therapist.

PAGE | 130
NEW ZEALAND HEALTH AND DISABILITY SYSTEM REVIEW | HAUORA MANAAKI KI AOTEAROA WHĀNUI
DHB provided services for:
– people with a physical or intellectual disability that cannot see a private provider – people such as head or neck cancer patients where dental treatment is part of the overall
treatment – emergency treatment for relief of pain and treatment of infection for low income adults
with CSC card (part charges may apply) – complex dental services and those that need to be delivered under anaesthetic
some DHBs also provided free or low cost oral health services through DHB dentist and Māori Oral Health Service providers
ACC funded around $29m of dental care arising from an accident or injury. Some of these services incurred a part charge. In addition the Department of Correction provides primary dental health care for prisoners and the Defence Force provides free oral health care for all service personnel
The Dental Council of New Zealand regulates six professions under the Health Practitioners Competence Assurance Act 2003: dentistry, dental hygiene, clinical dental technology, dental technology, dental therapy and oral health therapy. The Council is appointed by the Minister of Health and has ten members. In 2018 there were 4,845 oral health professionals registered of which there were 2,936 dentists, 517 oral health therapists, 508 dental therapists, 477 dental hygienists and 407 dental technicians.
Based on an analysis of those dentists who provide information on their employment model, the majority of dentists (88%) work in private practice.
F I G U R E 7 . 3 : S H A R E O F D E N T I S T S B Y P R A C T I C E T Y P E , 2 0 1 8
S O U R C E : A D A P T E D F R O M D E N T A L C O U N C I L O F N E W Z E A L A N D .
1%
2%
4%
6%
9%
22%
57%
Iwi
Other
Faculty of Dentistry
DHB
Private employee
Solo practice
Group practice
0% 10% 20% 30% 40% 50% 60% 70%Share of dentists by practice type
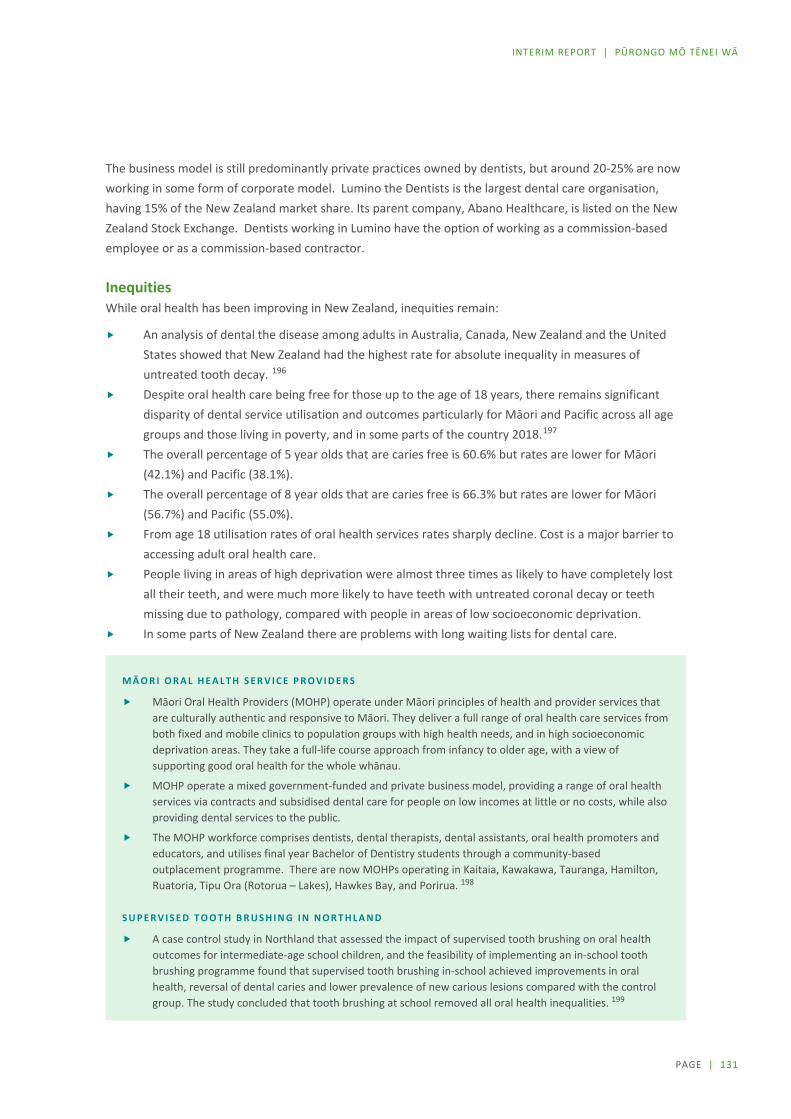
PAGE | 131
INTERIM REPORT | PŪRONGO MŌ TĒNEI WĀ
The business model is still predominantly private practices owned by dentists, but around 20-25% are now working in some form of corporate model. Lumino the Dentists is the largest dental care organisation, having 15% of the New Zealand market share. Its parent company, Abano Healthcare, is listed on the New Zealand Stock Exchange. Dentists working in Lumino have the option of working as a commission-based employee or as a commission-based contractor.
Inequities While oral health has been improving in New Zealand, inequities remain:
An analysis of dental the disease among adults in Australia, Canada, New Zealand and the United States showed that New Zealand had the highest rate for absolute inequality in measures of untreated tooth decay. 196
Despite oral health care being free for those up to the age of 18 years, there remains significant disparity of dental service utilisation and outcomes particularly for Māori and Pacific across all age groups and those living in poverty, and in some parts of the country 2018.197
The overall percentage of 5 year olds that are caries free is 60.6% but rates are lower for Māori (42.1%) and Pacific (38.1%).
The overall percentage of 8 year olds that are caries free is 66.3% but rates are lower for Māori (56.7%) and Pacific (55.0%).
From age 18 utilisation rates of oral health services rates sharply decline. Cost is a major barrier to accessing adult oral health care.
People living in areas of high deprivation were almost three times as likely to have completely lost all their teeth, and were much more likely to have teeth with untreated coronal decay or teeth missing due to pathology, compared with people in areas of low socioeconomic deprivation.
In some parts of New Zealand there are problems with long waiting lists for dental care.
M Ā O R I O R A L H E A L T H S E R V I C E P R O V I D E R S
Māori Oral Health Providers (MOHP) operate under Māori principles of health and provider services that are culturally authentic and responsive to Māori. They deliver a full range of oral health care services from both fixed and mobile clinics to population groups with high health needs, and in high socioeconomic deprivation areas. They take a full-life course approach from infancy to older age, with a view of supporting good oral health for the whole whānau.
MOHP operate a mixed government-funded and private business model, providing a range of oral health services via contracts and subsidised dental care for people on low incomes at little or no costs, while also providing dental services to the public.
The MOHP workforce comprises dentists, dental therapists, dental assistants, oral health promoters and educators, and utilises final year Bachelor of Dentistry students through a community-based outplacement programme. There are now MOHPs operating in Kaitaia, Kawakawa, Tauranga, Hamilton, Ruatoria, Tipu Ora (Rotorua – Lakes), Hawkes Bay, and Porirua. 198
S U P E R V I S E D T O O T H B R U S H I N G I N N O R T H L A N D
A case control study in Northland that assessed the impact of supervised tooth brushing on oral health outcomes for intermediate-age school children, and the feasibility of implementing an in-school tooth brushing programme found that supervised tooth brushing in-school achieved improvements in oral health, reversal of dental caries and lower prevalence of new carious lesions compared with the control group. The study concluded that tooth brushing at school removed all oral health inequalities. 199
PAGE | 132
NEW ZEALAND HEALTH AND DISABILITY SYSTEM REVIEW | HAUORA MANAAKI KI AOTEAROA WHĀNUI
Concerns about access barriers and high levels of untreated dental disease among Māori led to a number of Māori health providers establishing oral health services co-located alongside their existing primary care services as outlined on the previous page.
Addressing equity issues was a key concern raised in Phase One engagement. Many have called for state funded dental care to be increased. Some proposed this should be for all New Zealanders, while other suggested this should be for young adults (generally to 25 years), and to those on limited incomes.
Oral health should be fully integrated into the publicly funded health and disability system and treated the same as any other medical area. Oral health care should be free to everyone and the service should be tailored to meet the needs of diverse groups with a particular focus on children and groups that experience health inequities. (Organisation submission)
There was also acknowledgement that population health approaches to improving oral health were equally important. Given the preventive nature, stakeholders suggested stated that more needs to be done at a population level to reduce consumption and availability of sugary drinks and foods, improve oral health literacy, and fluoridation in water supplies.
It is concerning that the potentially high cost of a widespread adult dental care system simply puts people off even starting to tackle the issue. We submit that universal free dental health care is unlikely to be necessary. Instead, a mixed policy and targeted policy approach could address many of the most urgent oral health needs and have greater likelihood of successfully addressing the underlying equity issues, and at a fraction of the cost. (Organisation submission)
There is a large body of epidemiological evidence that confirms water fluoridation prevents and reduces dental decay and that the greatest benefits go to those who have the poorest oral health, making Community Water Fluoridation (CWF) a good intervention to improve equity. CWF coverage in New Zealand is much lower than it could be. Public drinking water supplies serve 3.8 million New Zealanders, or about 85% of the population. Of those on public water supplies 60% (or 54% of the total population) receive fluoridated water. A recent report suggests that extending CWF to the rest of New Zealand’s networked water supplies would generate net savings of more than $600 million over 20 years – mostly to consumers, and some to Vote Health. 200

PAGE | 133
INTERIM REPORT | PŪRONGO MŌ TĒNEI WĀ
Maternity There are around 59,000 births annually in New Zealand. The number of births has been declining slightly over the last decade with the total fertility rate at 1.71 being the lowest on record in 2018.
F I G U R E 7 . 4 : B I R T H S P E R 1 0 0 0 F E M A L E S O F R E P R O D U C T I V E A G E , 2 0 1 7
S O U R C E : M I N I S T R Y O F H E A L T H M A T E R N I T Y D A T A C O L L E C T I O N . 201
There is considerable variation in birth rates, ranging from 42.3 to 80.6 per 1,000 female of reproductive age in different DHB regions. Birth rates per 1000 females of reproductive age were highest for Māori (90.6) and Pacific (83.2), followed by Asian (60.6) and European or Other (50.9).202
There is strong evidence that confirms the importance of the first 1000 days (from conception to two years) as a critical period for shaping lifelong health, wellbeing and learning and development outcomes. Many inequities start early in life and compound along the lifelong trajectory. 203
Current working arrangements Free maternity care, is in policy if not in practice, universally available to all eligible women. Under the model introduced to New Zealand in the early 1990’s, women choose one lead professional (Lead Maternity Carer (LMC)) to provide her and her baby with continuity of care throughout her pregnancy, labour and birth, and the postnatal period up to six weeks after birth. An LMC can be a midwife, an obstetrician or GP (with a diploma in obstetrics).
0 20 40 60 80 100
Auckland
Capital & Coast
Southern
Canterbury
Nelson Marlborough
Waitemata
MidCentral
South Canterbury
West Coast
Hutt Valley
Waikato
Taranaki
Counties Manukau
Wairarapa
Hawke's Bay
Lakes
Tairāwhiti
Bay of Plenty
Whanganui
Northland
Births per 1000 females of reproductive age

PAGE | 134
NEW ZEALAND HEALTH AND DISABILITY SYSTEM REVIEW | HAUORA MANAAKI KI AOTEAROA WHĀNUI
The vast majority of primary maternity services are provided by independent community midwives (LMCs). In 2017, only 0.2% of LMCs were GPs, and 5.1% were obstetricians. Women who choose an obstetrician LMC will pay a copayment of around $3,000 - 4,000.
The Ministry funds the majority of primary maternity services through the Primary Maternity Services Notice 2009 (often referred as the Section 88 Notice). This is a modular, fee for service model that specifies service expectations and sets fees for LMC and non-LMC services (non-LMC first trimester and urgent care, primary maternity ultrasounds and some specialist services). These fees are the same for every women. Community Midwife and GP LMCs cannot charge women on top of the fee they receive from the Government, but private obstetricians may charge additional fees (copayments), whilst still claiming LMC fees from the Ministry of Health.
DHBs fund and either directly deliver (through its provider arm) or contract all other [public] primary, secondary and tertiary maternity services, including free pregnancy, childbirth and parenting education services. The minimum service requirements for all publicly funded maternity services provided by DHBs are set out in the nationwide service specifications (to provide national consistency).
Key issues and opportunities On the whole the New Zealand maternity system is well regarded internationally for its outcomes and most women report very positive experiences. The window of the ‘first 1000 days’ provides an important opportunity to ensure we have an optimal maternity system in place that promotes the best start to life for the baby and to support parents and whānau.
Phase One engagement raised the following as areas of concern/opportunities for improvement:
Delays in accessing care - despite having a policy that mandates universal free access to maternity care, there are significant equity issues for Māori, Pacific, and women living in the most deprived neighbourhoods. A particular concern are delays in LMC registrations. In 2017, on average 73.3% of women registered with an LMC in the first trimester registration, but first trimester registration was less common among:
– young women (47.8% of women) – Māori women (55.2% of women) – Pacific women (35.5% of women) – women residing in the most deprived neighbourhoods (51.9% in quintile 5).
Need for a more family and whānau centred approach to delivery of services – It was suggested that service delivery should better reflect Māori aspirations, including mātauranga Māori and the provision of kaupapa Māori models of care. Models of care should be more responsive to the cultural needs of women and their families, in particular taking a ‘family/whānau-centred’ approach.
Workforce does not reflect the women it is serving - there is continued ethnic disproportionality between the midwifery workforce and the fertile female (15 to 49 years) population of New Zealand. In 2017, 88.5% of the total midwifery workforce were NZ European and other European ethnicities, 5.7% were Māori and 2.2% were Pacific.

PAGE | 135
INTERIM REPORT | PŪRONGO MŌ TĒNEI WĀ
Workforce shortages - There are critical midwifery shortages in many parts of New Zealand. The New Zealand Midwifery Council data shows the number of midwives increased from 3,210 to 3,309 practising midwives (holding an Annual Practicing Certificate) between 2018 and 2019. The current workforce shortages are suggested to be due to more midwives working part-time, intermittently or not at all. There are varying reasons given as contributing factors to this, including, burn out and stress amongst current midwives, working arrangements that generally mean midwives are working as sole practitioners which makes it hard to manage workload and take leave. There are also issues with low completion rates on university midwifery courses.
Integration and coordination of services could be enhanced - key areas identified were:
– stronger linkage with Well Child/Tamariki Ora – transitions between community and hospital maternity services., particularly for women with
complex health and social needs, and for women who live in rural or remote areas – referral and liaison with other health and social services (e.g. mental health and addiction,
family violence, disability support, housing, education, income support, primary care, oral health, social support, sexual and reproductive health etc.)
Funding and business model arrangements – concerns have been raised that the current modular payment system for midwives and contract terms do not support holistic models of service delivery. The segmentation of primary maternity care into a national contract does not facilitate integration with well child services or other services required by the mother or baby. There is also confusion about who is accountable for the overall outcomes for women, their babies and their families/whānau.
Well Child / Tamariki Ora
Current arrangements Well Child / Tamariki Ora (WCTO) is a free health service offered to all New Zealand children from birth to five years. The programme aims to increase protective factors and reduce risks that impact on children’s health, development and wellbeing. It aims to provide early identification and referral to targeted specialist health, education and social services for children, families and whānau with additional needs.
The programme provides a universal health assessment, screening, education and support service for all children and their whānau from birth to five years of age. The current WCTO model is based on 13 scheduled ‘core contacts’ (often referred to as the National Schedule204.). These include postnatal visits delivered by the lead maternity carer (LMC), newborn and early childhood screening services, the six week check delivered by general practice at the time of the first immunisation, infant and child core contacts delivered by a WCTO provider and the B4 School Check. Additional contacts are based on need.
The service delivery model for WCTO is based on the core contacts being delivered initially in the home setting, and then in a clinic or other setting for whānau who are able to make that transition.

PAGE | 136
NEW ZEALAND HEALTH AND DISABILITY SYSTEM REVIEW | HAUORA MANAAKI KI AOTEAROA WHĀNUI
The model aims to achieve 100% enrolment in WCTO services and coverage for all scheduled contacts. It is designed to provide an integrated package of care for each child and their whānau, based on three parallel streams:
health and development clinical assessment family and whānau care and support health education.205
The B4 School Check was introduced in 2008 to promote health and wellbeing in preschool children, ensure they are prepared for school and to identify any health, behavioural or developmental concerns, and make appropriate referrals to improve health and educational outcomes and reduce inequalities.206
WTCO services currently provide 728,500 contacts to 185,000 children in any one year, and around 56,000 children each year receive their B4 School Checks (B4SCs).
Funding and provider arrangements No single provider delivers the entire schedule, and different parts of the schedule are delivered under different funding models and contracting arrangements. There are also a broad range of professionals involved such as midwives, nurses, community health workers, social workers, community kaiawhina, GP or paediatrician, and a variety of organisations.
Funding for these services comes through a national appropriation to the Ministry of Health. The vast majority of funding goes to Plunket which holds a contract directly with the Ministry. The Ministry also contracts with DHBs for WCTO and B4SC services for their populations. DHBs then contract with a large number of community providers, most of which are smaller Māori and Pacific providers, many of whom also deliver other community health services.
WCTO Reviews Previous reviews of the WCTO programme have identified issues with reach and equity.207 208Māori, Pacific and people living in high socioeconomic deprivation areas have lower uptake of WCTO services.
F I G U R E 7 . 5 : S H A R E O F I N F A N T S R E C E I V I N G A L L W C T O C O R E C O N T A C T S , 2 0 1 8
S O U R C E : M I N I S T R Y O F H E A L T H .
0% 10% 20% 30% 40% 50% 60% 70% 80% 90%
Highest deprivation quintile
Pacific peoples
Māori
Non-Māori /Non-Pacific
Total
Share of infants receiving all WCTO core contacts
PAGE | 137
INTERIM REPORT | PŪRONGO MŌ TĒNEI WĀ
A further review of the WCTO programme was announced in November 2018. The WCTO Review’s objectives are to:
improve sustainability and performance of the WCTO programme drive equitable health and development outcomes for children enable the WCTO programme to more effectively contribute to wider child wellbeing ensure value for money.209
The WCTO Review has a 12 month timeframe to deliver a new equitable funding and service delivery model for the WCTO programme.
The Health and Disability System Review has a longer term and broader focus in regard to how the overall delivery of Tier 1 services will improve equity of outcomes and wellbeing for all populations. In discussions and through submissions we have heard concerns about the fragmentation of purchasing between national and local levels and the challenges that this poses for ensuring services are designed and coordinated to best meet the needs of populations that the system has generally not served well.
Most health services are planned, delivered, and coordinated locally through DHBs, but primary maternity services and Plunket, the national provider of Well Child/Tamariki Ora services, continue to be funded centrally by the Ministry of Health. Achieving local integration is difficult when some services are funded and planned centrally from the Ministry of Health in Wellington. (Group submission)
Aged residential care As people age, they may become frail, develop significant cognitive or mobility impairments, or have multiple or complex health conditions requiring care. Over the last decade considerable progress has been made supporting more older people to live independently for longer. While the over 65 years age group has increased by 24% since 2012, the number of aged residential care bed-days has increased by only 5%.210
However when older people can no longer live safely in their own or whānau home, aged residential care in a rest home or hospital can provide 24-hour supervision.211 It is available for all people over 65 who are assessed as needing it, on a means tested, user pays basis subsidised by public funding. (This care is also used by some people aged 50-64 with disability or illness who need 24-hour care long-term.)212
People using aged residential care In 2017/18, around 34,000 people were receiving aged residential care. Almost half were receiving the basic level, rest home care. Three higher levels of care (hospital, dementia care, and specialised psychogeriatric hospital care) involve specialised facilities and higher care.
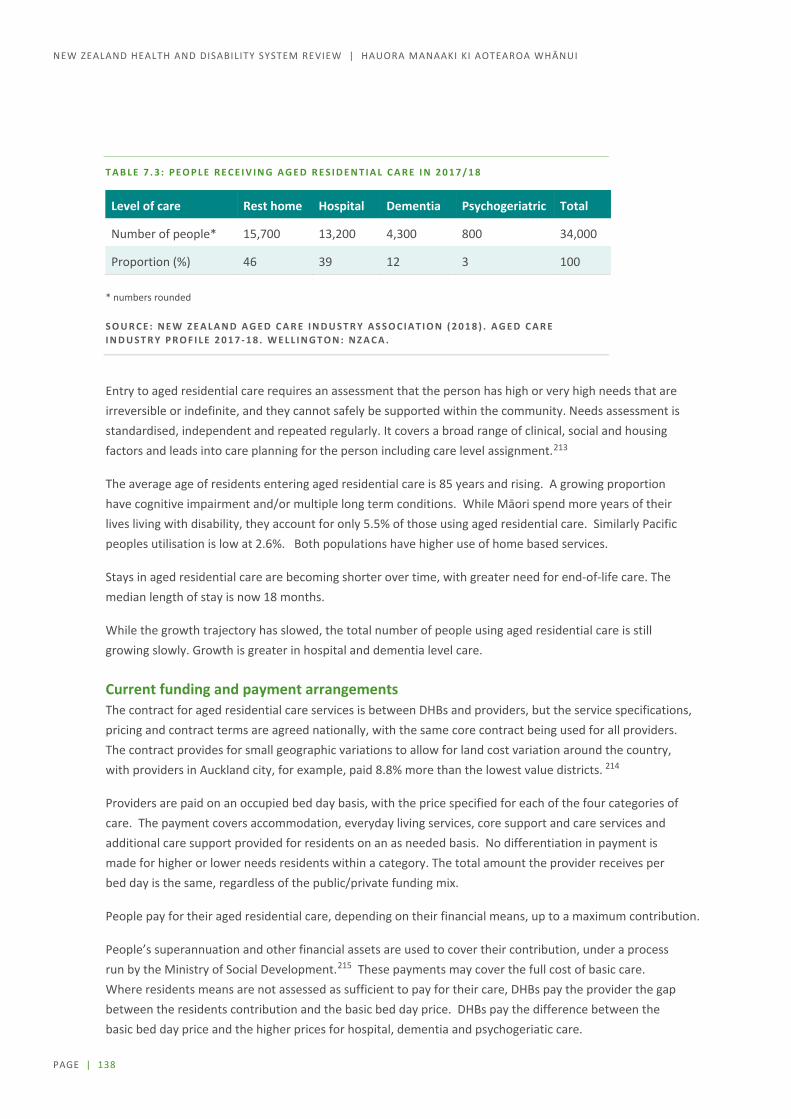
PAGE | 138
NEW ZEALAND HEALTH AND DISABILITY SYSTEM REVIEW | HAUORA MANAAKI KI AOTEAROA WHĀNUI
T A B L E 7 . 3 : P E O P L E R E C E I V I N G A G E D R E S I D E N T I A L C A R E I N 2 0 1 7 / 1 8
Level of care Rest home Hospital Dementia Psychogeriatric Total
Number of people* 15,700 13,200 4,300 800 34,000
Proportion (%) 46 39 12 3 100 * numbers rounded
S O U R C E : N E W Z E A L A N D A G E D C A R E I N D U S T R Y A S S O C I A T I O N ( 2 0 1 8 ) . A G E D C A R E I N D U S T R Y P R O F I L E 2 0 1 7 - 1 8 . W E L L I N G T O N : N Z A C A .
Entry to aged residential care requires an assessment that the person has high or very high needs that are irreversible or indefinite, and they cannot safely be supported within the community. Needs assessment is standardised, independent and repeated regularly. It covers a broad range of clinical, social and housing factors and leads into care planning for the person including care level assignment.213
The average age of residents entering aged residential care is 85 years and rising. A growing proportion have cognitive impairment and/or multiple long term conditions. While Māori spend more years of their lives living with disability, they account for only 5.5% of those using aged residential care. Similarly Pacific peoples utilisation is low at 2.6%. Both populations have higher use of home based services.
Stays in aged residential care are becoming shorter over time, with greater need for end-of-life care. The median length of stay is now 18 months.
While the growth trajectory has slowed, the total number of people using aged residential care is still growing slowly. Growth is greater in hospital and dementia level care.
Current funding and payment arrangements The contract for aged residential care services is between DHBs and providers, but the service specifications, pricing and contract terms are agreed nationally, with the same core contract being used for all providers. The contract provides for small geographic variations to allow for land cost variation around the country, with providers in Auckland city, for example, paid 8.8% more than the lowest value districts. 214
Providers are paid on an occupied bed day basis, with the price specified for each of the four categories of care. The payment covers accommodation, everyday living services, core support and care services and additional care support provided for residents on an as needed basis. No differentiation in payment is made for higher or lower needs residents within a category. The total amount the provider receives per bed day is the same, regardless of the public/private funding mix.
People pay for their aged residential care, depending on their financial means, up to a maximum contribution.
People’s superannuation and other financial assets are used to cover their contribution, under a process run by the Ministry of Social Development.215 These payments may cover the full cost of basic care. Where residents means are not assessed as sufficient to pay for their care, DHBs pay the provider the gap between the residents contribution and the basic bed day price. DHBs pay the difference between the basic bed day price and the higher prices for hospital, dementia and psychogeriatic care.

PAGE | 139
INTERIM REPORT | PŪRONGO MŌ TĒNEI WĀ
In 2017/18, DHBs spent $1.025 billion subsidising care for two thirds of residents, and residents paid a further $840 million towards the cost of their care (at basic level – some also pay extra for “premium” rooms or other additions).216
Service provision Over 38,000 aged residential care beds are provided in some 670 facilities throughout New Zealand. Almost all facilities are run by the private or non-government sectors.
This capacity also provides for assessment, rehabilitation, respite and palliative care services; 96% of facilities offer respite care, the costs of which are also subsidised by government contributions.
Facilities are subject to regular quality and safety review, and are certified for provision of particular care levels. Staffing is by nurses, caregivers and allied health practitioners as well as non-care staff.217
T A B L E 7 . 4 : M E D I A N S T A F F I N G H O U R S P E R R E S I D E N T P E R D A Y I N 2 0 1 7 / 1 8
Level of care
Staff position Rest home Hospital Dementia Psychogeriatric
Registered nurse 0.36 1.00 0.38 1.04
Enrolled nurse 0.21 0.16 0.26 0.35
Caregiver 1.88 2.72 2.63 2.74
Activities co-ordinator 0.21 0.20 0.32 0.32
S O U R C E : N E W Z E A L A N D A G E D C A R E I N D U S T R Y A S S O C I A T I O N ( 2 0 1 8 ) . A G E D C A R E I N D U S T R Y P R O F I L E 2 0 1 7 - 1 8 . W E L L I N G T O N : N Z A C A .
Flexibility in bed use is increasing. Dual service beds, used for either rest home care or hospital care depending on the needs of the resident, now make up over 31% of beds. On-site retirement units or apartments and co-location with retirement villages is increasing, along with additional facilities such as ensuites or larger rooms for residents who choose to pay. Retirement village units or apartments are now being certified for care provision at rest home, hospital or dementia care level in the person’s own unit. 218
Integration with other health services Aged residential care providers are required to meet primary health care costs, and many provide physiotherapy and occupational therapy as part of their operation. Oral health care is not included and may be unaffordable for people with no income aside from the $40 per week (approximately) they can keep from their superannuation.219
Primary health care arrangements vary widely, and only a minority of facilities have arrangements for more than a weekly GP visit (for example, for 24-hour emergency support, telephone support, nurse practitioner visits, more frequent GP visits or regular health assessments). 220

PAGE | 140
NEW ZEALAND HEALTH AND DISABILITY SYSTEM REVIEW | HAUORA MANAAKI KI AOTEAROA WHĀNUI
Key themes Issues identified during Phase One included:
Concern that linkages and access to Tier 1 services and hospital services needs to be strengthened. However there are also instances of good practice where aged residential care facilities have strong working relationships with general practice or with the DHB’s gerontology team
Most of the growth in beds over the last 5 years has been in larger corporate, often co-located with a retirement village. There has also been consolidation in group operators, and the number of small privately owned aged care hospitals has declined.
It has been suggested by some stakeholders that the current funding model is not sustainable, particularly for smaller stand alone facilities that tend to have higher running costs per resident. Smaller facilities were seen as being important in maintaining choice such as for culture-driven care, or for care close to people’s own communities, especially in small towns and rural areas.
Some have raised concern that the supply of facilities providing care to people with low personal wealth may not keep up with growth in demand, and that choice may be limited for people from different cultures and from non-English speaking backgrounds.
While there are some kaumātua rest homes run by iwi, concern was raised that some facilities are not meeting the needs of Māori and Pacific people. A wider range of choices, especially more home-based care, are being sought by older people and families
Increase support for kaumātua to access home help; services that are relevant that meet the needs of Māori elders and whānau and rest home access for respite and/or permanent placement. (Group submission)
There are challenges attracting and retaining staff. Staff turnover is above 20% in almost all staff groups. Turnover of registered nurses grew to 37.8% in 2017. While pay equity and pay parity settlements will likely improve this situation, difficulties in visa extension remain. Across all facilities, 21% of staff, and in major group care facilities 27%, are working on temporary visas.221

PAGE | 141
INTERIM REPORT | PŪRONGO MŌ TĒNEI WĀ
PHOs and primary care through general practices Following the publication of the Primary Health Care Strategy in 2001,222 PHOs were introduced with the intention of moving towards a more population and prevention focus. Capitation payments replaced the general medical subsidy as a key means of rewarding practices for keeping an enrolled population well, rather than just treating people who are unwell.
Enrolment and utilisation New Zealand has a high rate of primary care enrolment. Most New Zealanders (94%) are enrolled in a PHO through their general practice. Enrolment is highest among Pacific peoples (over 100%) and lowest among Māori (90%). Enrolment rates have grown steadily over the last five years, with the growth rate for Māori slightly outstripping population growth.223
In 2017, around 17 million GP and nurse consultations were delivered in primary care (see Figure 7.6).
F I G U R E 7 . 6 : A V E R A G E N U M B E R O F G P A N D N U R S E C O N S U L T A T I O N S P E R P E R S O N P E R
Y E A R B Y A G E G R O U P , 2 0 1 8
S O U R C E : M I N I S T R Y O F H E A L T H , P H O R E P O R T I N G .
The young and the old are the greatest users of primary care services, and as the population ages we can expect the demand for these services to increase.
Between 2008 and 2016, the number of GP consultations increased nearly 12%, which was slightly higher than the population growth of 10.2% in the same period.224 By ethnicity, growth in GP consultations was higher for Māori, Pacific, and ‘other’ groups (27%, 29%, and 38%, respectively) compared with European New Zealanders (5%). Māori, Pacific, and ‘other’ groups also had higher than average population growth. Changing demographics and a growing older population is relevant to understanding demand trends, as this group is likely to have the most ongoing and complex health needs.225

PAGE | 142
NEW ZEALAND HEALTH AND DISABILITY SYSTEM REVIEW | HAUORA MANAAKI KI AOTEAROA WHĀNUI
Primary care receives funding from a variety of sources Around 68% of funding for PHOs and general practice comes from Vote Health ($1,164 million). The remaining funding comes through ACC ($150 million or 9%), private insurance ($31 million or 2%), and patient copayments (around $395 million or 23%).
Most public funding is provided through a nationally negotiated contract between DHBs and PHOs (the National PHO Services Agreement). DHBs are required to contract with PHOs for primary care services. South Canterbury DHB is the only DHB that does not contract with a separate PHO. This required ministerial approval.
Around $750 million is paid to PHOs, which is then passed through to individual practices. Payments are made on a capitation basis – based on the enrolled population, regardless of the level of service provided. First-contact capitation rates vary significantly with age, ranging from $70 per year for young adult males to $450 for people over 65.
Around $160 million is also paid on a capitation basis, but held in a flexible funding pool. The PHO services agreement requires this funding to be spent on services agreed to by the local district alliance or on health promotion, management, or services to improve access. There is little information or reporting on how this funding is used, but variation across the country is clear.
The remaining funding ($260 million) is used to fund immunisations, after-hours services, rural sustainability, and services outside the scope of the national agreement.
Impact of funding arrangements Stakeholder engagement signalled that the funding provided to Māori PHOs and practices with Māori populations is insufficient to meet the higher needs of Māori. This is echoed strongly in the Waitangi Tribunal’s report Hāuora, which cites analysis performed by Deloitte and commissioned by the Ministry of Health.226
Modelling work undertaken during Phase One suggests that after accounting for lower copayment revenue, practices with larger shares of Māori or Pacific enrolees on average earn no more than other practices. Given that Māori and Pacific populations tend to have higher needs (as demonstrated by higher rates of ambulatory sensitive (avoidable) hospital admissions and higher amenable mortality rates), this supports the argument that funding has not reflected the needs of Māori and Pacific peoples. There is also evidence that VCLA practices are under-funded for their high need populations and much of their populations are Māori or Pacific.
Stakeholders also stated that because first-contact funding is adjusted for only age and gender, it does not meet the higher needs of Māori, Pacific, and high socioeconomic deprivation populations. Some suggested including ethnicity and socioeconomic deprivation as factors on which first-contact funding should be allocated.

PAGE | 143
INTERIM REPORT | PŪRONGO MŌ TĒNEI WĀ
However, given the current method for constructing the capitation formula, there is no guarantee that this would result in a more equitable distribution of funding. Capitation funding rates are based on historic service utilisation. Including ethnicity and socioeconomic deprivation as factors would allocate more funding to high needs groups only if they have higher historical utilisation. However, for many age groups this is not the case. Figure 7.7 shows that for groups aged under 45, Māori have the same or lower levels of service utilisation than Europeans. Including ethnicity as a factor could actually reduce the funding allocated for Māori, effectively embedding existing inequities into funding arrangements.
F I G U R E 7 . 7 : A V E R A G E N U M B E R O F G P C O N S U L T A T I O N S P E R Y E A R , B Y A G E A N D
E T H N I C I T Y , 2 0 1 8
S O U R C E : M I N I S T R Y O F H E A L T H , P H O R E P O R T I N G .
The more fundamental problem is that historic use of GP services is a poor proxy for need because it:
does not account for the fact copayments are a barrier to access does not account for other barriers to access, such as lack of transportation and lack of culturally
appropriate services is based on only one service type, a standard GP consultation, rather than the more holistic range of
services that primary care funding is, in theory, intended to support.
Measures to reduce copayment impacts Several funding streams have been introduced to cap copayments charged to specific populations. Under the PHO services agreement, these funding streams must be passed on in full to practices. The key schemes are:
Zero Fees Under 14s, which requires no fees to be charged to people aged under 14 Very Low Cost Access (VLCA), which caps all copayments charged by a practice (at $19) and includes
around a third of practices, which are practices where over 50% of their population is Māori, Pacific peoples, or living in a high socioeconomic deprivation area
Community Services Card (CSC), which caps copayments charged to CSC card holders and gives those with CSCs access to VLCA copayment rates, regardless of the practice they enrol in.

PAGE | 144
NEW ZEALAND HEALTH AND DISABILITY SYSTEM REVIEW | HAUORA MANAAKI KI AOTEAROA WHĀNUI
Figure 7.8 shows the share of different ethnic groups that are charged different fees.
F I G U R E 7 . 8 : G E N E R A L P R A C T I C E F E E S B A S E D O N E T H N I C I T Y , 2 0 1 9
S O U R C E : M I N I S T R Y O F H E A L T H P H O R E P O R T I N G , I N T E R N A L C A L C U L A T I O N S .
For groups other than European, over 50% of the population have access to consultations that are free or cost no more than $19.
For Pacific peoples, around a quarter are eligible for free fees through the Zero Fees Under 14s scheme, over 50% are charged up to $19 through Very Low Cost Access and the CSC, with only an estimated 15% of the population charged uncapped fees. For Māori, the proportion charged uncapped fees is estimated to be slightly higher at 21%, with just under half charged up to $19, and around 30% under 14 and eligible for free fees.
This pattern is similar for different socioeconomic deprivation quintiles, with 80% of those living in the most deprived areas being able to access zero or capped copayments. This suggests:
the current copayment reduction schemes have been effective in reducing copayments for Māori, Pacific peoples, and people in high socioeconomic deprivation areas
further efforts to reduce uncapped copayments are likely to predominantly benefit non-Māori and non-Pacific peoples
reducing copayments within Very Low Cost Access practices or through the CSC scheme may be more effective at targeting Māori, Pacific peoples, and people in high socioeconomic deprivation areas.
Some groups face major access barriers to primary care services The immediate cost of a copayment can be a barrier to access but there are other barriers including, the
availability of appointments, cost of transport, cost of taking time off work to attend the appointment, and
availability of child care (see Figure 7.9). Health literacy and cultural factors can also prevent people from
seeking help until their condition worsens and they require urgent care.
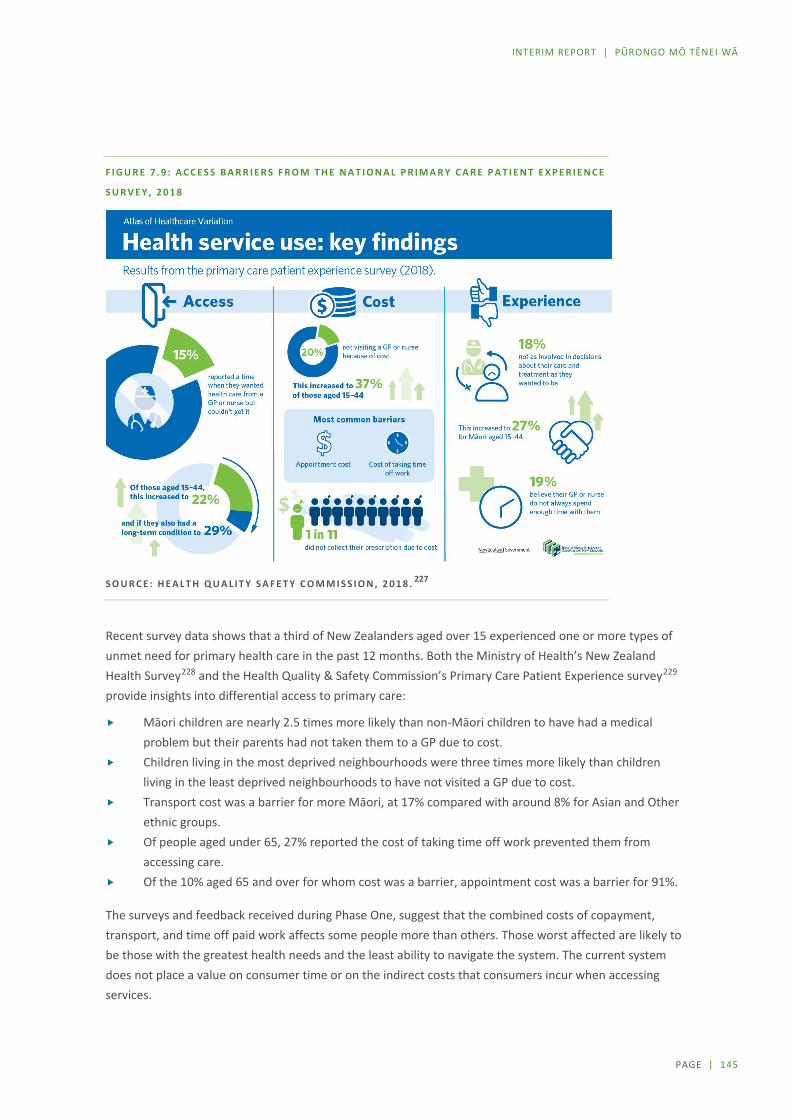
PAGE | 145
INTERIM REPORT | PŪRONGO MŌ TĒNEI WĀ
F I G U R E 7 . 9 : A C C E S S B A R R I E R S F R O M T H E N A T I O N A L P R I M A R Y C A R E P A T I E N T E X P E R I E N C E
S U R V E Y , 2 0 1 8
S O U R C E : H E A L T H Q U A L I T Y S A F E T Y C O M M I S S I O N , 2 0 1 8 . 227
Recent survey data shows that a third of New Zealanders aged over 15 experienced one or more types of unmet need for primary health care in the past 12 months. Both the Ministry of Health’s New Zealand Health Survey228 and the Health Quality & Safety Commission’s Primary Care Patient Experience survey229 provide insights into differential access to primary care:
Māori children are nearly 2.5 times more likely than non-Māori children to have had a medical problem but their parents had not taken them to a GP due to cost.
Children living in the most deprived neighbourhoods were three times more likely than children living in the least deprived neighbourhoods to have not visited a GP due to cost.
Transport cost was a barrier for more Māori, at 17% compared with around 8% for Asian and Other ethnic groups.
Of people aged under 65, 27% reported the cost of taking time off work prevented them from accessing care.
Of the 10% aged 65 and over for whom cost was a barrier, appointment cost was a barrier for 91%.
The surveys and feedback received during Phase One, suggest that the combined costs of copayment, transport, and time off paid work affects some people more than others. Those worst affected are likely to be those with the greatest health needs and the least ability to navigate the system. The current system does not place a value on consumer time or on the indirect costs that consumers incur when accessing services.
PAGE | 146
NEW ZEALAND HEALTH AND DISABILITY SYSTEM REVIEW | HAUORA MANAAKI KI AOTEAROA WHĀNUI
Contracting approaches Given the many providers involved in the delivery of Tier 1 services and the mix of public and private funding sources, it is not surprising that a large number of contracts are in place. Phase One engagement signalled that some key system-level issues will require further consideration. As discussed below, these issues include national compared with local contracting, constraints under the Commerce Act 1986, and the administrative burden associated with contracting with NGOs.
National versus local contracting impacting integration and accountability Tier 1 services are purchased using a mix of national and local contracts. The fragmentation of contracting introduces complexity and duplication and can make it challenging to deliver integrated services. DHBs are not party to the negotiations with some important services that are funded nationally (for example, community midwifery and WCTO), yet the integration with local service delivery arrangements is critical if DHBs are to meet the objectives for a child’s first 1,000 days and address local equity gaps.
During Phase One, some argued that the national role in contracting should focus more on stewardship, purchasing highly specialised services, and engagement with national bodies such as ACC and MSD, that are also commissioning health and disability services. Undertaking the remaining activity at local levels was viewed as enabling stronger clinical, iwi, and community engagement in decision making and providing an opportunity to integrate services at a local level by focusing on planning across a full range of services.
Counter views argued that this could lead to unacceptable variation in service delivery and that there may not be sufficient scale and expertise to fulfil the national role cost-effectively.
The commissioning task is complex, requiring a team with a high level of strategic and analytical skill, with deep understanding of the challenges of delivering services, and a commitment to addressing health inequity. (Group submission)
Commerce Act constraints on collaboration The Commerce Act 1986 states that no person shall enter a contract or arrangement that is likely to substantially lessen competition in a market. This provision applies to Crown entities including DHBs and ACC. Given the significant size of the public health and disability system and ACC as purchasers of health and disability services, this limits the ability for DHBs and ACC to jointly purchase services.
The Accident Compensation Act 2001 contains a specific exception for joint purchasing arrangements for emergency transport services. This allows ACC, the Ministry of Health or DHBs to jointly purchase emergency transport services, even where this would substantially lessen competition (although the Commerce Act restriction on taking advantage of market power remains). Similar exceptions apply in other sectors, such as telecommunications, air transport, and agriculture.
ACC also purchases a variety of other services that are purchased by the health and disability system, including general practice services and elective surgery. As part of its Health Services Strategy, ACC is moving towards purchasing “bundled services for clinical pathways”, and away from paying for isolated inputs.
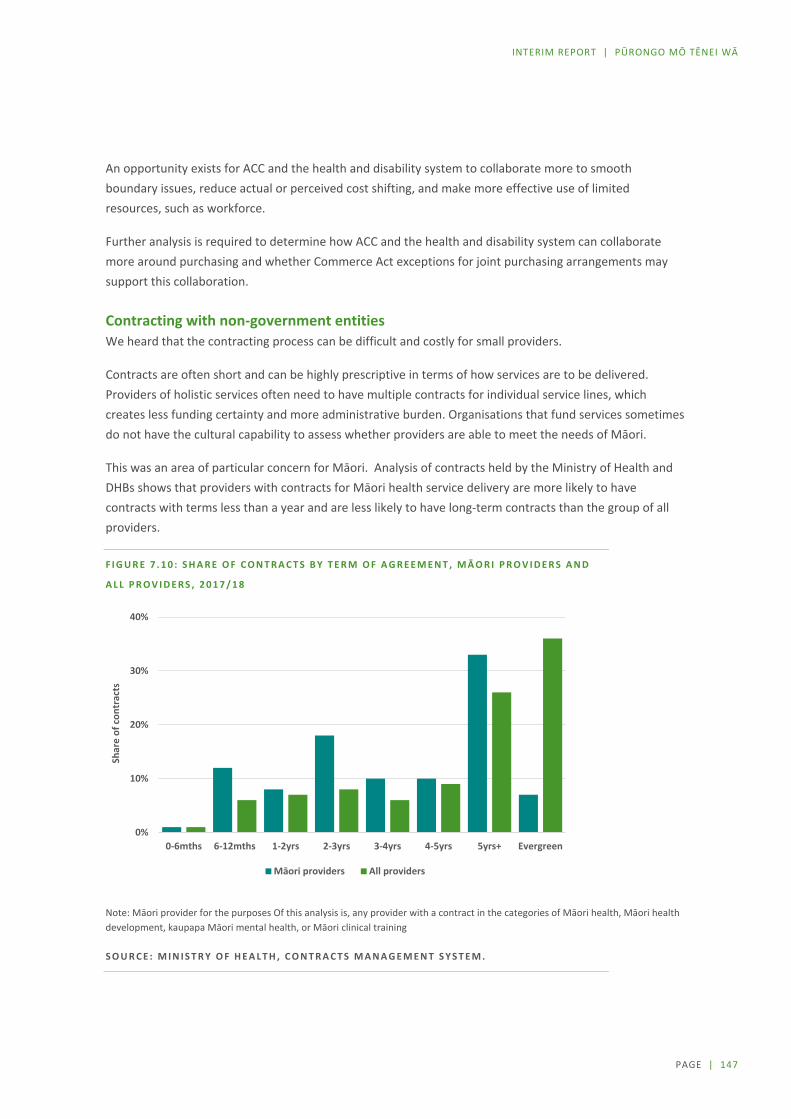
PAGE | 147
INTERIM REPORT | PŪRONGO MŌ TĒNEI WĀ
An opportunity exists for ACC and the health and disability system to collaborate more to smooth boundary issues, reduce actual or perceived cost shifting, and make more effective use of limited resources, such as workforce.
Further analysis is required to determine how ACC and the health and disability system can collaborate more around purchasing and whether Commerce Act exceptions for joint purchasing arrangements may support this collaboration.
Contracting with non-government entities We heard that the contracting process can be difficult and costly for small providers.
Contracts are often short and can be highly prescriptive in terms of how services are to be delivered. Providers of holistic services often need to have multiple contracts for individual service lines, which creates less funding certainty and more administrative burden. Organisations that fund services sometimes do not have the cultural capability to assess whether providers are able to meet the needs of Māori.
This was an area of particular concern for Māori. Analysis of contracts held by the Ministry of Health and DHBs shows that providers with contracts for Māori health service delivery are more likely to have contracts with terms less than a year and are less likely to have long-term contracts than the group of all providers.
F I G U R E 7 . 1 0 : S H A R E O F C O N T R A C T S B Y T E R M O F A G R E E M E N T , M Ā O R I P R O V I D E R S A N D
A L L P R O V I D E R S , 2 0 1 7 / 1 8
Note: Māori provider for the purposes Of this analysis is, any provider with a contract in the categories of Māori health, Māori health development, kaupapa Māori mental health, or Māori clinical training
S O U R C E : M I N I S T R Y O F H E A L T H , C O N T R A C T S M A N A G E M E N T S Y S T E M .
0%
10%
20%
30%
40%
0-6mths 6-12mths 1-2yrs 2-3yrs 3-4yrs 4-5yrs 5yrs+ Evergreen
Shar
e of
con
trac
ts
Māori providers All providers

PAGE | 148
NEW ZEALAND HEALTH AND DISABILITY SYSTEM REVIEW | HAUORA MANAAKI KI AOTEAROA WHĀNUI
Analysis also shows that Māori health providers are much more likely to hold multiple contracts. For providers with Māori health contracts, only 15% have one contract, compared with 75% of all providers. Nearly a quarter of providers with Māori health contracts have 10 or more contracts compared with only 2% of all providers.
Several NGOs voiced similar concerns about the administrative burden of multiple contracts and the uncertainty and risk they faced because of the short-term nature of many of their contracts.
Academic research and reviews also support the concerns we heard.
Māori providers have shorter contracts, higher compliance costs, and are more frequently audited than non-Māori providers.230
He Ara Oranga, the Government Inquiry into Mental Health and Addiction services, noted contracting issues, including short contract terms, onerous compliance and reporting requirements, multiple funders, and a lack of focus on outcomes.231
In 2015 the Productivity Commission described problems with contracting, including the cost of tender processes, the lack of information provided about tendering processes, short-term contracts, and an overall unfairness towards smaller providers due to larger providers being able to bear the cost of navigating complex tender processes.232
Business models There has always been a range of different business model in Tier 1, ranging from individuals who are contracted to deliver a service and are predominantly publically funded (for example midwives) through to corporates that may operate nationally (for example Life Pharmacy, Lumino Dental, Ryman and Somerset) and may have international ownership interests. There are many not for profit organisations operating in the market also, which again vary in size.
Some operate in a discrete geographic area, while others deliver services for a more dispersed population in part of the country or nationally. Some derive most of their funding privately and others are predominantly publically funded.
For many providers that deliver a range of services, or services for more than one DHB this means multiple contracts that may have different services specification, funding mechanisms and reporting requirements.
For smaller providers this creates considerable administrative burden. Some have also indicated that they perceive that competitive contracting processes favour larger organisations.
While it is anticipated that there will continue to be a range of business models operating in the sector, over the last 5 years the following trends have been observed:
A number of professional groups are moving from self-employed to an employed workforce model There is an increasing presence of not for profit and corporate entities.
An overview of business models in PHOs and general practice is discussed below.

PAGE | 149
INTERIM REPORT | PŪRONGO MŌ TĒNEI WĀ
PHOs and general practice ownership The 2001 Primary Health Care Strategy mandated the development of PHOs as local not-for-profit organisations to be contracted by DHBs to meet the primary health care needs of their enrolled population. The institutional characteristics expected of PHOs are summarised in Table 7.5.
T A B L E 7 . 5 : I N S T I T U T I O N A L C H A R A C T E R I S T I C S O F P R I M A R Y H E A L T H O R G A N I S A T I O N S
Characteristic Description
Established by PHOs were established by the Primary Health Care Strategy 2001. They are non-government organisations and are not established by any particular legislation.
Role under national agreement
The PHO’s roles and responsibilities are set out in the national PHO Services Agreement.1
Functions: The agreement says the PHO will:
provide the services (as specified within various schedules to the agreement) facilitate and promote service development, coordination, and integration participate in the development and agreement of the DHB’s annual plan promote continuous quality improvement in the delivery of the services ensure accountability for the delivery of the services provide infrastructure, administrative, and support services in respect of the
services.
Outcomes: The agreement says the PHO will:
support its enrolled population and other eligible people to stay well contribute to ensuring the clinical and financial sustainability of the health
system ensure its enrolled population and other eligible people receive quality,
coordinated care that is delivered by multidisciplinary teams and is easy to access and provided close to home
support all population groups to achieve optimum health outcomes and reduce disparities
achieve outcomes determined by the alliance.
Funded by District Health Boards Ministry of Health
Establishment criteria (set by the Ministry of Health)
PHOs must be not-for-profit bodies with full and open accountability for the use of public funds and the quality and effectiveness of services.
PHOs must demonstrate that their communities, iwi, and consumers are involved in their governing processes and that the PHO is responsive to its community.
DHBs must be satisfied that the PHO’s planning, prioritisation, and service delivery will contribute to a reduction in health inequalities.
1 PHO Services Agreement (version 6), 1 December 2018.233

PAGE | 150
NEW ZEALAND HEALTH AND DISABILITY SYSTEM REVIEW | HAUORA MANAAKI KI AOTEAROA WHĀNUI
There is wide variation in the size geographic distribution and ownership structure of PHOs.
The five largest PHOs account for over half of all PHO enrolments. The largest PHO, Procare Network Limited, has nearly 900,000 enrolees, which on a population basis makes it larger than any DHB in the country. In contrast, the smallest 20 PHOs account for around one quarter of all enrolees.
There are advantages and disadvantages to having large PHOs. The scale of large PHOs may allow them to make investments in things like workforce development and data analytics. Small PHOs may have a better understanding of their local community and have the flexibility to respond to local needs.
Fourteen PHOs cover areas that cross DHB lines, including National Hauora Coalition which covers five DHB areas. This can lead to coordination problems, as DHBs and PHOs are tasked with assessing the needs of and providing services to overlapping populations. PHOs also do not have set areas, which can lead to ‘competition’ between PHOs for practices. These boundary issues can be exacerbated in urban areas, as people can live in one DHB area, enrol with a practice in a second DHB area, and that practice can belong to a PHO that primarily works in a third DHB area.
PHOs often have very complex structural arrangements that make it hard to understand who ultimately owns and controls these organisations. For example:
Many large PHOs are legally owned and controlled by other entities. PHOs can be established as a not for profit “shell entity” that is ultimately owned and controlled by healthcare providers and practitioners within the PHO network. For example, Midlands Regional Health Network Charitable Trust is a PHO that receives around $40 million in revenue.234 It has zero employees and zero volunteers, and pays the majority of its revenue out to Pinnacle Incorporated and its subsidiaries.235, 236 Pinnacle Incorporated is a non-profit that has general practitioner members. These members elect an executive committee, which runs the organisation.237
Some PHOs have ownership and governance arrangements that evenly share decision making power between providers and iwi / community groups. For example, Western Bay of Plenty PHO Limited is 50% owned by two iwi, Ngāti Ranginui Iwi Incorporated and Te Runanga o Ngāi Te Rangi Iwi Trust, and 50% owned by Western Bay of Plenty Primary Care Providers Inc, an umbrella organisation for general practice and other providers.238 The two groups also each appoint half of the PHO’s board.239
Three PHOs are owned and controlled by iwi. These three PHOs are also the three smallest PHOs in the country, combined covering less than 40,000 enrolees.
Over the last 10 years there has been considerable consolidation of PHOs, from a peak of 80 PHOs in 2008 to the current 30 PHOs. Analysis of PHOs before this consolidation found that around 30 PHOs were formed from iwi or community groups.240 Of those, only two exist now in the same legal form. This suggests the other PHOs were either disestablished, or merged with other PHOs (e.g. National Hauora Coalition).

PAGE | 151
INTERIM REPORT | PŪRONGO MŌ TĒNEI WĀ
The seven largest PHOs by enrolment account for 60% of enrolments and hold over $100 million of assets241. Within the Operating Policy Framework, DHBs are required to monitor PHOs with large or increasing cash balances. Cash balances are necessary to meet short-term liabilities, but could also be used for less appropriate purposes (PHOs are not governed by the Public Finance Act). Where cash balances are large or increasing, PHOs are required to develop forecast expenditure plans.
Many PHOs have broadened their business models beyond funding practices. Several PHOs now directly own practices and are directly providing other services, such as call centre support and information systems. These services are usually not provided by the PHO itself, but by parent companies, or their subsidiaries. Given that most practices are relatively small businesses, these developments may help the sector introduce innovations that require scale. However, there is often little transparency around whether public funding is being used to deliver these services, and how any surplus cash flows are distributed. The public system may need to take a more deliberate approach to how it funds these services.
General practice ownership models are changing Given the inherent incentives in funding structures and how these influence PHOs as well as GPs, it is valuable to consider changing trends in general practice business models. Limited information is available publicly about GP business models and asset bases given the commercial sensitivity of that information. However, work is under way to gather some aspects of this information as part of research looking at models of care (to compare the Health Care Home approach with more traditional practice models). 242
In New Zealand, general practices mainly function as small businesses, usually owned by a single doctor or small group of doctors. Results from the 2018 Royal College of General Practitioners Workforce Survey show that almost half (48%) were long-term employees or contractors, while 36% were practice owners or partners.243 Long-term employees or contractors make up more than 50% of the workforce in all age bands up to 50–54 where it drops to 46%. The practice owner or partner workforce peaks at 57% in the age band 60–64.
A more diverse range of ownership models is seen among rural practices than urban practices. Practices owned by a trust or charity are more likely to have relatively smaller enrolled patient numbers (under 9,000), whereas practices under corporate ownership (9%) are more likely to have enrolled populations of more than 9,000. Other practice types include those fully or partially owned by a PHO or GP organisation (4%), a DHB (1%), iwi (2%), a university (1%), and ‘other’ (5%).244

PAGE | 152
NEW ZEALAND HEALTH AND DISABILITY SYSTEM REVIEW | HAUORA MANAAKI KI AOTEAROA WHĀNUI
Establishment of Alliances District alliances between DHBs and PHOs have been introduced to promote greater integration and service planning and integration at a local level. These alliances are clinically led, community engaged fora that bring different parts of the health and disability system together with the aim of transforming services so that they are best for the patient and best for the system. District alliances have been a mandatory requirement through the PHO services agreement since 2013.
Alliances vary significantly in approach, maturity, and function across the country. District alliances do not constitute a new legal entity and are reliant for operations on the legal, contracting, analytical, and other resources of their participants. Many participants have indicated that they must take part in several alliance teams (for example, where geographic boundaries overlap or relating to specific service areas) that often involve the same set of people. Some have questioned the value delivered through the alliancing approach and the fact it is mandated through the national PHO Services Agreement.
Qualitative research involving interviews with sector stakeholders revealed a high degree of variation in feedback about the value of alliances to those participating.245 Some valued the approach as having provided a platform for relationship building and shared decision making, while others struggled to get arrangements up and running. A key determinant seems to be the maturity of the alliance and the commitment of participants.
It is difficult to assess the impact of these alliances – the nature of the system-level measure as high-level outcomes inevitably will require long-term change to achieve impact and it would be difficult to attribute improvement to any specific mechanism or factor.
while there are numerous examples of integrated health services in New Zealand, overall [alliancing] has been a rather dreary story of isolated areas of progress brought about by local leadership that did not diffuse through the system.246

PAGE | 153
INTERIM REPORT | PŪRONGO MŌ TĒNEI WĀ
Directions for change: Tier 1 Strengthening the role that Tier 1 services play in the system is critical. This view has been espoused for over 20 years, but progress has been limited. Equity is a priority and New Zealand needs to be more ambitious with Tier 1 services, as there is good evidence that enhanced Tier 1 service delivery can improve equity and support health and wellbeing for Māori and others for whom the current system is not working.
The system is very fragmented with 1000s of provider organisations operating under different pricing and access arrangements. In many instances, service delivery arrangements have not considered the burden of chronic disease, comorbidities and mental health issues that now exist in communities. Nor have these arrangements kept pace with how New Zealanders expect to be able to access services or health information for themselves.
S Y S T E M D E S I G N E D F O R T H E C O N S U M E R A N D T H E I R W H Ā N A U N O T T H E P R O V I D E R
The measures of value and cost the system uses needs to reflect much more what consumers and whānau value, not simply what the system deems important.
Services should be established where they best suit the community (now and into the future), rather than allowing the location of services to be determined by the preference of providers alone. More services also need to be available for longer hours.
The system needs to be better integrated so patients can move more readily through it.
P R O M O T I N G W E L L N E S S
Refocusing the system on promoting wellness rather than principally treating sickness also requires changes in attitudes and for health promotion and behavioural health services to be a much more integral part of the system. A bigger role for Population Health services will be essential in this.
M U L T I D I S C I P L I N A R Y C O L L A B O R A T I V E T E A M W O R K T H E N O R M
A more determined effort is needed to embed more collaborative approaches to service provision, particularly if we are to address the equity issues experienced by Māori, Pacific peoples, disabled people, people living in rural communities, and other vulnerable populations. The sector needs to be less dominated by standalone service providers and be more driven by community-focused, integrated service provision hubs. A culture of collaboration between providers should be encouraged.
The approach of general practices and community pharmacies being largely funded on the basis of throughput is unlikely to be appropriate in areas where the emphasis needs to be on encouraging behavioural change and early intervention.
Different approaches need to reflect not only different business models but also different cultural perspectives.
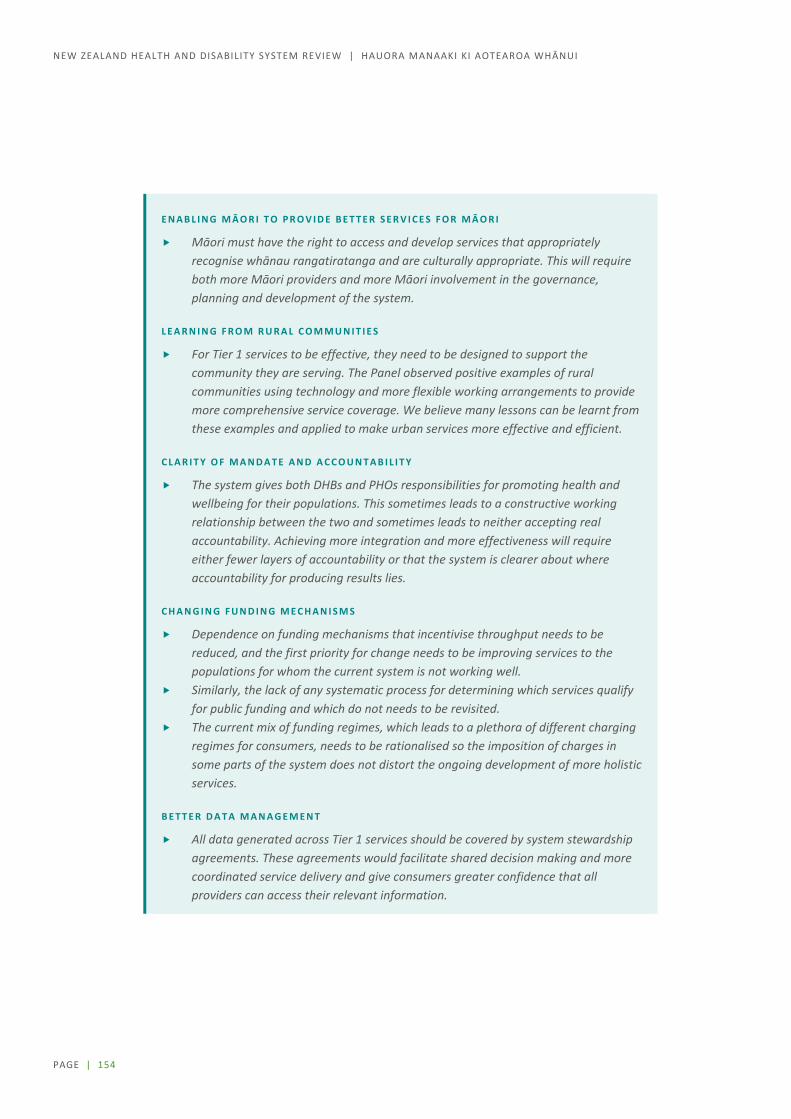
PAGE | 154
NEW ZEALAND HEALTH AND DISABILITY SYSTEM REVIEW | HAUORA MANAAKI KI AOTEAROA WHĀNUI
E N A B L I N G M Ā O R I T O P R O V I D E B E T T E R S E R V I C E S F O R M Ā O R I
Māori must have the right to access and develop services that appropriately recognise whānau rangatiratanga and are culturally appropriate. This will require both more Māori providers and more Māori involvement in the governance, planning and development of the system.
L E A R N I N G F R O M R U R A L C O M M U N I T I E S
For Tier 1 services to be effective, they need to be designed to support the community they are serving. The Panel observed positive examples of rural communities using technology and more flexible working arrangements to provide more comprehensive service coverage. We believe many lessons can be learnt from these examples and applied to make urban services more effective and efficient.
C L A R I T Y O F M A N D A T E A N D A C C O U N T A B I L I T Y
The system gives both DHBs and PHOs responsibilities for promoting health and wellbeing for their populations. This sometimes leads to a constructive working relationship between the two and sometimes leads to neither accepting real accountability. Achieving more integration and more effectiveness will require either fewer layers of accountability or that the system is clearer about where accountability for producing results lies.
C H A N G I N G F U N D I N G M E C H A N I S M S
Dependence on funding mechanisms that incentivise throughput needs to be reduced, and the first priority for change needs to be improving services to the populations for whom the current system is not working well.
Similarly, the lack of any systematic process for determining which services qualify for public funding and which do not needs to be revisited.
The current mix of funding regimes, which leads to a plethora of different charging regimes for consumers, needs to be rationalised so the imposition of charges in some parts of the system does not distort the ongoing development of more holistic services.
B E T T E R D A T A M A N A G E M E N T
All data generated across Tier 1 services should be covered by system stewardship agreements. These agreements would facilitate shared decision making and more coordinated service delivery and give consumers greater confidence that all providers can access their relevant information.

PAGE | 155
INTERIM REPORT | PŪRONGO MŌ TĒNEI WĀ
8 Disability / Te Huātanga
Disability is an important and growing issue worldwide. New Zealand, like other countries, is working to improve accessibility, inclusion and participation of disabled people and reducing discrimination. Disabled people aspire to be empowered to live the life of their choosing, and to be included in decision-making processes. It is incumbent on the health and disability system to support that effectively.
This section looks at how we define disability, how disability is spread across the population, and how the system is currently funding and providing support. It looks at new approaches being trialled to improve support and considers the issues which still need to be addressed if the system in the future is to be able to sustainably support an aging population. The section also considers the role the health system should play as an employer to improve wellbeing for disabled people and to ensure its workforce is more representative.
What do we mean by disability?
N E W Z E A L A N D U S E S T H E U N I T E D N A T I O N S ’ D E F I N I T I O N O F D I S A B I L I T Y .
Persons with disabilities include those who have long-term physical, mental, intellectual or sensory impairments which in interaction with various barriers may hinder their full and effective participation in society on an equal basis with others.247
Disabilities are diverse. Even when people have a similar degree of the same impairment, the impacts for those people can vary substantially. A variety of social, environmental and economic factors can make it much easier or much harder for people to go about their lives. Their environment and amenities that help them navigate it, the attitudes and inclusivity of people around them, and the opportunities available to them are all important.248

PAGE | 156
NEW ZEALAND HEALTH AND DISABILITY SYSTEM REVIEW | HAUORA MANAAKI KI AOTEAROA WHĀNUI
The physical, mental, intellectual and sensory impairments that persons with disabilities experience can hinder … full and effective participation in society and open the way to social exclusion and discrimination. … Physical barriers and societal attitudes contribute to … disability and often result in lower incomes, less fulfilling jobs and exclusion.249
Impairments themselves cover a wide spectrum, with origins often unknown – half of disabled children have impairments since birth. Through life, many more people become disabled through illness or injury and many have more than one impairment or health condition. Overall, across countries, the main sources of disability are illnesses, then injuries, and then those existing from birth.250
Who are disabled New Zealanders? The New Zealand Disability Survey, last undertaken in 2013, shows as many as a quarter of New Zealanders are disabled.251 Eleven percent of children and 27% of adults have difficulty doing everyday things, even with equipment that helps. Difficulties are in hearing, vision, mobility, agility, intellectual, mental health, speaking, learning, memory (for adults) and developmental delay (for children).
Many people who are disabled find that their impairment has little effect on their ability to function. They may find, however, that societal and environmental structures, and attitudes, create barriers. For example, a person in a wheelchair would find it less disabling if there was smooth and speedy access, power lifting and turning room everywhere and most activities were easy to do at sitting height.
Society can disable people who have differences of any kind, including different abilities.
… being Māori and being disabled may not be discreet oppressions, but instead “interconnected” parts of a whole way of looking at the world in which difference is considered inferior and in which unequal relationships are demarcated’252
A functional approach is often used to gauge the impacts of disability across the population. Surveys use functional questions to identify disabled people and look into how well they are faring. Example of functional questions about disability:
1. Do you have difficulty seeing, even if wearing glasses?
2. Do you have difficulty hearing, even if using a hearing aid?
3. Do you have difficulty walking or climbing steps?
4. Do you have difficulty remembering or concentrating?
5. Do you have difficulty washing all over or dressing?
6. Using your usual language, do you have difficulty communicating, for example understanding or being understood?
R E S P O N S E O P T I O N S
a. No – no difficulty at all
b. Yes – some difficulty
N O T D I S A B L E D
c. Yes – a lot of difficulty
d. Cannot do at all
D I S A B L E D
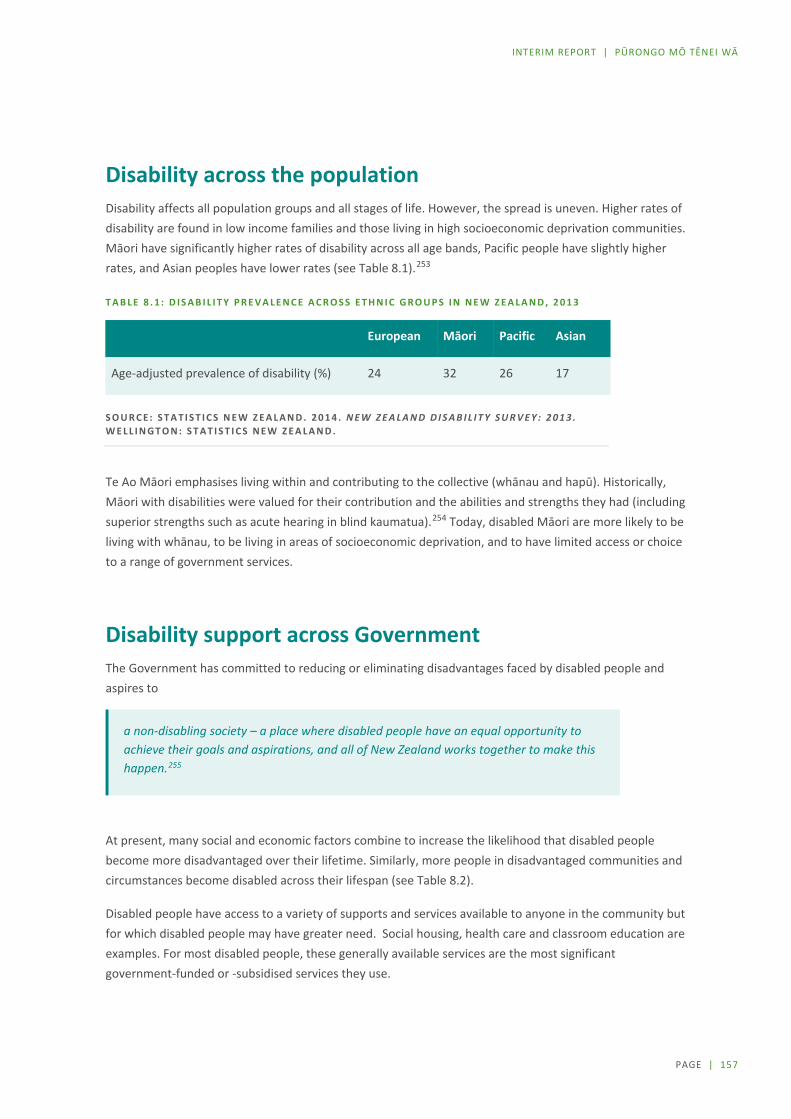
PAGE | 157
INTERIM REPORT | PŪRONGO MŌ TĒNEI WĀ
Disability across the population
Disability affects all population groups and all stages of life. However, the spread is uneven. Higher rates of disability are found in low income families and those living in high socioeconomic deprivation communities. Māori have significantly higher rates of disability across all age bands, Pacific people have slightly higher rates, and Asian peoples have lower rates (see Table 8.1).253
T A B L E 8 . 1 : D I S A B I L I T Y P R E V A L E N C E A C R O S S E T H N I C G R O U P S I N N E W Z E A L A N D , 2 0 1 3
European Māori Pacific Asian
Age-adjusted prevalence of disability (%) 24 32 26 17
S O U R C E : S T A T I S T I C S N E W Z E A L A N D . 2 0 1 4 . N E W Z E A L A N D D I S A B I L I T Y S U R V E Y : 2 0 1 3 . W E L L I N G T O N : S T A T I S T I C S N E W Z E A L A N D .
Te Ao Māori emphasises living within and contributing to the collective (whānau and hapū). Historically, Māori with disabilities were valued for their contribution and the abilities and strengths they had (including superior strengths such as acute hearing in blind kaumatua).254 Today, disabled Māori are more likely to be living with whānau, to be living in areas of socioeconomic deprivation, and to have limited access or choice to a range of government services.
Disability support across Government The Government has committed to reducing or eliminating disadvantages faced by disabled people and aspires to
a non-disabling society – a place where disabled people have an equal opportunity to achieve their goals and aspirations, and all of New Zealand works together to make this happen.255
At present, many social and economic factors combine to increase the likelihood that disabled people become more disadvantaged over their lifetime. Similarly, more people in disadvantaged communities and circumstances become disabled across their lifespan (see Table 8.2).
Disabled people have access to a variety of supports and services available to anyone in the community but for which disabled people may have greater need. Social housing, health care and classroom education are examples. For most disabled people, these generally available services are the most significant government-funded or -subsidised services they use.
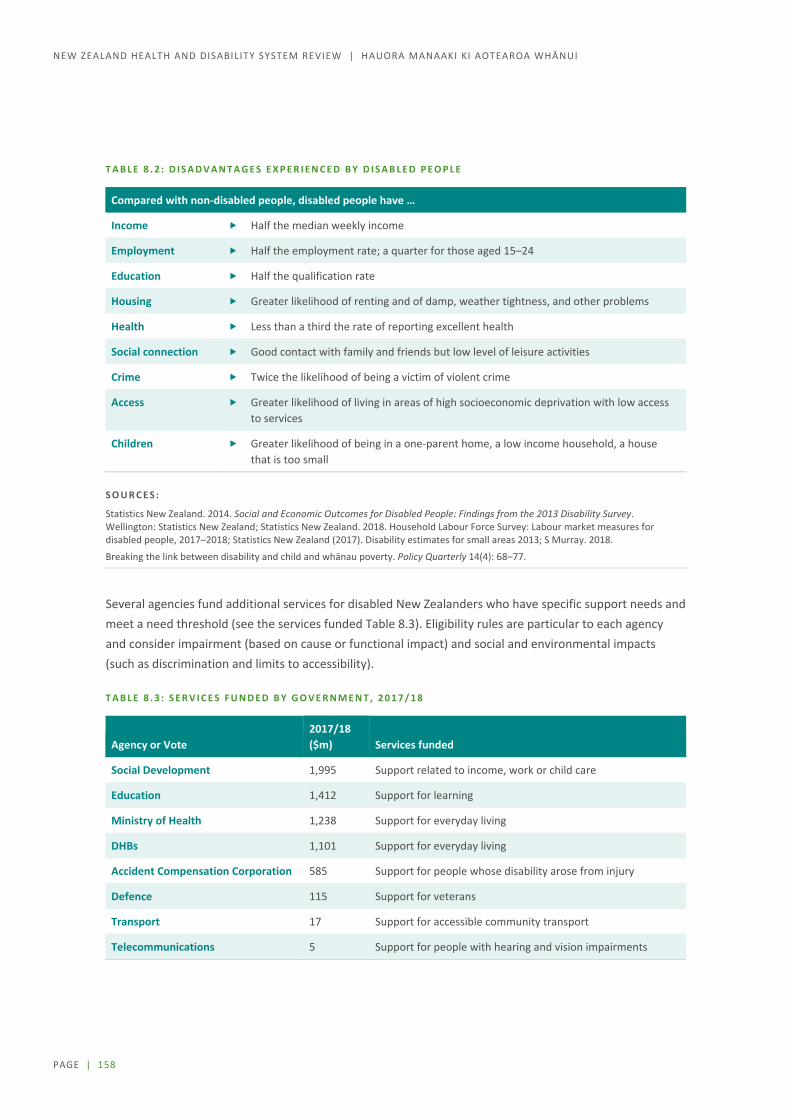
PAGE | 158
NEW ZEALAND HEALTH AND DISABILITY SYSTEM REVIEW | HAUORA MANAAKI KI AOTEAROA WHĀNUI
T A B L E 8 . 2 : D I S A D V A N T A G E S E X P E R I E N C E D B Y D I S A B L E D P E O P L E
Compared with non-disabled people, disabled people have …
Income Half the median weekly income
Employment Half the employment rate; a quarter for those aged 15–24
Education Half the qualification rate
Housing Greater likelihood of renting and of damp, weather tightness, and other problems
Health Less than a third the rate of reporting excellent health
Social connection Good contact with family and friends but low level of leisure activities
Crime Twice the likelihood of being a victim of violent crime
Access Greater likelihood of living in areas of high socioeconomic deprivation with low access to services
Children Greater likelihood of being in a one-parent home, a low income household, a house that is too small
S O U R C E S :
Statistics New Zealand. 2014. Social and Economic Outcomes for Disabled People: Findings from the 2013 Disability Survey. Wellington: Statistics New Zealand; Statistics New Zealand. 2018. Household Labour Force Survey: Labour market measures for disabled people, 2017–2018; Statistics New Zealand (2017). Disability estimates for small areas 2013; S Murray. 2018.
Breaking the link between disability and child and whānau poverty. Policy Quarterly 14(4): 68–77. 256257258
Several agencies fund additional services for disabled New Zealanders who have specific support needs and meet a need threshold (see the services funded Table 8.3). Eligibility rules are particular to each agency and consider impairment (based on cause or functional impact) and social and environmental impacts (such as discrimination and limits to accessibility).
T A B L E 8 . 3 : S E R V I C E S F U N D E D B Y G O V E R N M E N T , 2 0 1 7 / 1 8
Agency or Vote 2017/18 ($m) Services funded
Social Development 1,995 Support related to income, work or child care
Education 1,412 Support for learning
Ministry of Health 1,238 Support for everyday living
DHBs 1,101 Support for everyday living
Accident Compensation Corporation 585 Support for people whose disability arose from injury
Defence 115 Support for veterans
Transport 17 Support for accessible community transport
Telecommunications 5 Support for people with hearing and vision impairments

PAGE | 159
INTERIM REPORT | PŪRONGO MŌ TĒNEI WĀ
Many submitters to the Review commented on the broad government functions needed to promote a non-disabling environment. For example, many are seeking better urban, building, and transport design standards so that an accessible community environment becomes the norm and retrofitting for a disabled person is not needed. Others raised the difficulty people and their whānau have in dealing with several different agencies when they need information, advice, or help. People dealing with disability issues often have multiple stressors in their lives and would value seamless and helpful information and advice on all matters touching on disability.
Health and disability system role in disability support
Disability support funding and provision across the health and disability system For all New Zealanders, the health and disability system aims to improve, promote and protect health, and provide the best care or support for those in need. In addition, for people with disabilities the system aims to promote inclusion, participation and independence. 259 This additional focus for people with disabilities is concentrated on the funding and provision of disability support services. These services help people with everyday activities of life that would otherwise be difficult or impossible for them.
Disability support includes services (such as a person to help in the home), equipment (such as hearing aids or a wheelchair) and home modifications (such as ramps or lifts instead of stairs). These types of help are available to people with higher levels of need and may be provided free (such as hearing aids for children and young people) or be subsidised (hearing aids for older people). Family and whānau members often provide help also.260
Responsibilities for disability support funding are divided across the system.
The Ministry of Health funds disability support services for 34,000 disabled people, aged under 65 years when entering the system, and funds equipment and modifications (such as to homes and vehicles) for 77,000 people of all ages.
DHBs fund disability support services for:
– people aged over 65 years, of whom some 75,000 receive home and community-based support, and 30,000 receive aged residential care
– people disabled by mental health conditions and associated social and attitudinal consequences, with some 3,000 people receiving work, employment or vocational support and around 200 receiving community residential or planned respite services.
ACC funds support services, equipment and modifications for people disabled by or recovering from injury.
How people get disability support services People who are being discharged from hospital and/or are injured have their initial support arranged for them. Most other people with disability support needs are first referred to a Needs Assessment and Service Coordination (NASC) agency. There are different NASCs around the country and several in each district, often specialising in particular categories such as whether the person is younger, aged over 65, or have a mental illness or a severe chronic illness or another disability.

PAGE | 160
NEW ZEALAND HEALTH AND DISABILITY SYSTEM REVIEW | HAUORA MANAAKI KI AOTEAROA WHĀNUI
The relevant NASC will assess the person’s abilities and disabilities, look at what help they already have in their home and through friends and whānau, and decide on the person’s level of need. They will then help the person and whānau to decide which supports would work best for them from what is available in the area. This might include, for example, a carer coming to their home for particular help at particular times, or to go with them to a community activity and help them participate. Other choices might be for the family and whānau to provide care for them most of the time and have a carer or respite provider give full time care for a few days at a time to give the family a break.
Ministry of Health funded disability support services The current disability definition for Ministry-funded service eligibility is:
People who have a physical, intellectual, or sensory disability (or a combination of these) that:
is likely to continue for at least 6 months limits their ability to function independently, to the extent that ongoing support is required.
These are mainly people aged under 65.
The Ministry will also fund disability support services for people with:
some neurological conditions that result in permanent disabilities some developmental disabilities in children and young people, such as autism spectrum disorder a physical, intellectual, or sensory disability that co-exists with a health condition and/or injury.
About 120 specific and many other non-specific causes of ‘principal’ disability are clustered into six main groups (Figure 8.1). Each group includes multiple categories, and each category includes a wide variety of impacts and severity. The majority of service users have more than one disability, and many have health conditions as well.261
F I G U R E 8 . 1 : M A I N D I S A B I L I T Y C L U S T E R S F O R P E O P L E U S I N G M I N I S T R Y O F H E A L T H –
F U N D E D S U P P O R T S E R V I C E S , 2 0 1 6
S O U R C E : M I N I S T R Y O F H E A L T H . 2 0 1 7 .
Demographic Report on Clients Allocated the Ministry of Health’s Disability Support Services as at September 2016. Wellington: Ministry of Health.
Other
Intellectual
Autism spectrum disorder
Sensory
Neurological
Physical

PAGE | 161
INTERIM REPORT | PŪRONGO MŌ TĒNEI WĀ
Both the number of people receiving support services, and the level of their needs, have been rising. The biggest increases have been in autistic spectrum disorders (added as a funded disability in 2014) and intellectual disability.262
Ministry of Health disability funding In 2017/18 the Ministry purchased $1.24 billion of disability support services (see Table 8.4). Funding for Ministry-funded disability supports has grown at a similar rate to overall health funding.
Funding growth in the last decade has funded new technologies (such as cochlear implants), growth in services (for example, support for autism spectrum disorder; housing modifications for chronic disease and aging; hearing aids) and workforce wage and condition improvements. In most of the recent financial years, appropriations for disability support have been topped up as service costs have exceeded budgeted appropriations. Attempts to manage demand have for the most part been by keeping to a tight, historic definition of disability or carer that excludes particular classes of disability or family carer. Serial court cases have overturned these attempts.
T A B L E 8 . 4 : S E R V I C E F U N D I N G , A L L O C A T I O N , P R O V I S I O N , A N D W O R K F O R C E F O R
M I N I S T R Y O F H E A L T H – F U N D E D S E R V I C E S
Services Funding ($m)
in 2017/18* Recipients* Needs assessors Providers* Workforce*
Residential care 540 7,000
15 NASCs
60 25,000
Community support 300 29,000 250
Individualised & EGL 4,000 4,500
Funded family care 500 500 500
High and complex 80 250 1 10
Equipment & modifications
75 77,000 2 2
Other environmental 75
Other (eg child development)
170
TOTAL 1,240 18
Notes: Numbers have been rounded. * Needs assessment and service coordination agencies
Sources: Ministry of Health unpublished information; Ministry of Health. 2017. Demographic Report on Clients Allocated the Ministry of Health’s Disability Support Services as at September 2016. Wellington: Ministry of Health.

PAGE | 162
NEW ZEALAND HEALTH AND DISABILITY SYSTEM REVIEW | HAUORA MANAAKI KI AOTEAROA WHĀNUI
The Ministry funds services in a number of categories, and people may receive a combination of services. Most people use self- or family-organised services, and large numbers also use residential services, provider-organised community support, and respite care.263 The service frameworks are highly prescribed and relatively inflexible.264
Distribution of these service types across the country varies widely.265 Auckland has significantly lower per capita use of services except for carer support, home support and respite. Service use may depend on service availability based on historical provision, and may also be influenced by the age profile of the population. There are reports of people shifting to regions with availability of more intensive support.266
While over 300 organisations deliver residential and community disability support services, five large providers employ some 70% of full time equivalent staff positions. The workforce is 75% female, a third are aged over 55 years, employed part time. Three quarters have a health and disability qualification, and of these half have a level 2 and a further 40% a level 3 qualification and 6% level 4.267 Māori (17%) and Pacific (10%) workers are well represented, especially in direct care and support roles. Disabled people make up 7% of the workforce.268 As well as workers employed through provider organisations, several thousand workers, mostly part-time, are employed directly by people using their services.
As well as the paid workforce, at least 2,500 people volunteer in roles linked with disability support, and 430,000 family members provide care. 269
Environmental supports As well as disability support services, the Ministry funds a range of other supports, from child development teams to cochlear implants. One-off aids, equipment and modifications to homes or vehicles account for about 6% of overall funding but are a fast-growing area270. Around 77,000 people received equipment and modifications (such as to homes or vehicles) in 2017/18271. The number of requests has increased by more than 14%, and costs by 30%, in the last 4 years.272 Three quarters of people receiving these services were aged over 65 years.
Many equipment items are purchased from large-scale international suppliers, but frequently require individual fitting or adaptation to their user’s needs, as well as individualised training and rehabilitation programmes to use them effectively. Some are custom built. Many specialised allied health and other workforce roles are needed and experienced practitioners are often hard to replace.
Learning from four approaches to purchasing disability support 2002-2018 Disability support funding for mental health and for people aged over 65 years was devolved to DHBs from 2002. Other disability support funding was centralised in the Ministry of Health. Rising demand has characterised all three areas. ACC serious injury management is a comparator. System responses to changes over the period 2002-18 are summarised below.
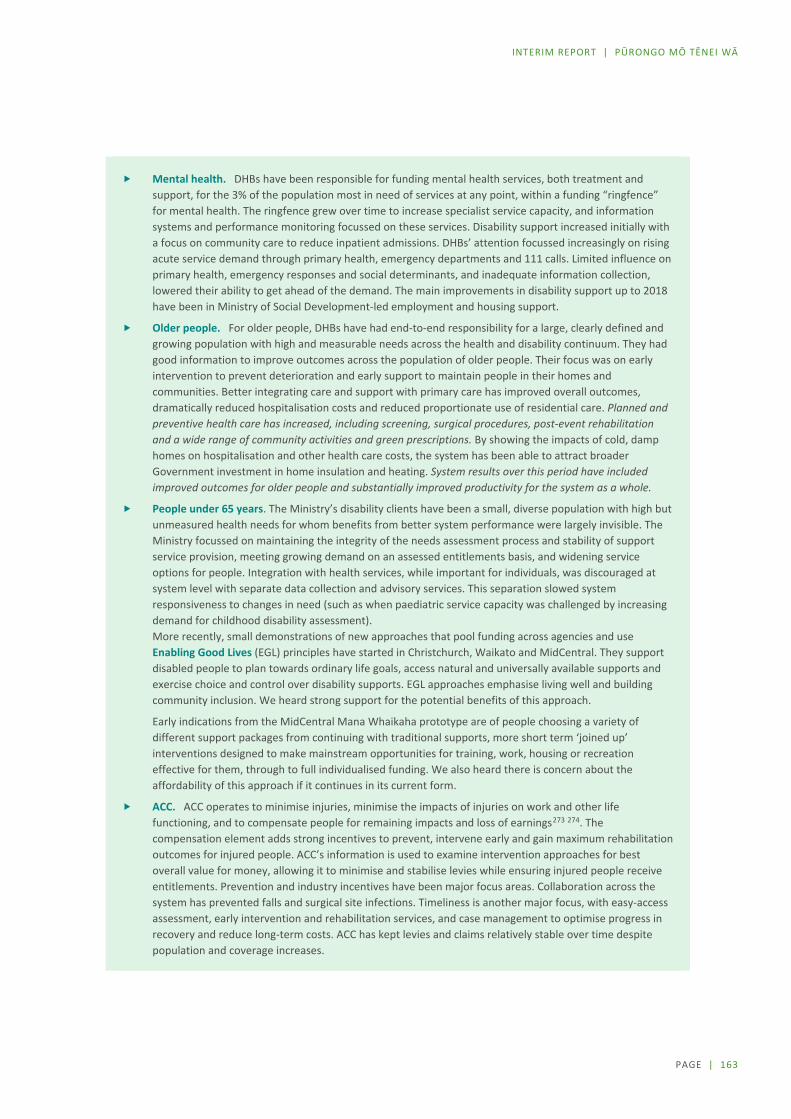
PAGE | 163
INTERIM REPORT | PŪRONGO MŌ TĒNEI WĀ
Mental health. DHBs have been responsible for funding mental health services, both treatment and support, for the 3% of the population most in need of services at any point, within a funding “ringfence” for mental health. The ringfence grew over time to increase specialist service capacity, and information systems and performance monitoring focussed on these services. Disability support increased initially with a focus on community care to reduce inpatient admissions. DHBs’ attention focussed increasingly on rising acute service demand through primary health, emergency departments and 111 calls. Limited influence on primary health, emergency responses and social determinants, and inadequate information collection, lowered their ability to get ahead of the demand. The main improvements in disability support up to 2018 have been in Ministry of Social Development-led employment and housing support.
Older people. For older people, DHBs have had end-to-end responsibility for a large, clearly defined and growing population with high and measurable needs across the health and disability continuum. They had good information to improve outcomes across the population of older people. Their focus was on early intervention to prevent deterioration and early support to maintain people in their homes and communities. Better integrating care and support with primary care has improved overall outcomes, dramatically reduced hospitalisation costs and reduced proportionate use of residential care. Planned and preventive health care has increased, including screening, surgical procedures, post-event rehabilitation and a wide range of community activities and green prescriptions. By showing the impacts of cold, damp homes on hospitalisation and other health care costs, the system has been able to attract broader Government investment in home insulation and heating. System results over this period have included improved outcomes for older people and substantially improved productivity for the system as a whole.
People under 65 years. The Ministry’s disability clients have been a small, diverse population with high but unmeasured health needs for whom benefits from better system performance were largely invisible. The Ministry focussed on maintaining the integrity of the needs assessment process and stability of support service provision, meeting growing demand on an assessed entitlements basis, and widening service options for people. Integration with health services, while important for individuals, was discouraged at system level with separate data collection and advisory services. This separation slowed system responsiveness to changes in need (such as when paediatric service capacity was challenged by increasing demand for childhood disability assessment). More recently, small demonstrations of new approaches that pool funding across agencies and use Enabling Good Lives (EGL) principles have started in Christchurch, Waikato and MidCentral. They support disabled people to plan towards ordinary life goals, access natural and universally available supports and exercise choice and control over disability supports. EGL approaches emphasise living well and building community inclusion. We heard strong support for the potential benefits of this approach.
Early indications from the MidCentral Mana Whaikaha prototype are of people choosing a variety of different support packages from continuing with traditional supports, more short term ‘joined up’ interventions designed to make mainstream opportunities for training, work, housing or recreation effective for them, through to full individualised funding. We also heard there is concern about the affordability of this approach if it continues in its current form.
ACC. ACC operates to minimise injuries, minimise the impacts of injuries on work and other life functioning, and to compensate people for remaining impacts and loss of earnings273 274. The compensation element adds strong incentives to prevent, intervene early and gain maximum rehabilitation outcomes for injured people. ACC’s information is used to examine intervention approaches for best overall value for money, allowing it to minimise and stabilise levies while ensuring injured people receive entitlements. Prevention and industry incentives have been major focus areas. Collaboration across the system has prevented falls and surgical site infections. Timeliness is another major focus, with easy-access assessment, early intervention and rehabilitation services, and case management to optimise progress in recovery and reduce long-term costs. ACC has kept levies and claims relatively stable over time despite population and coverage increases.
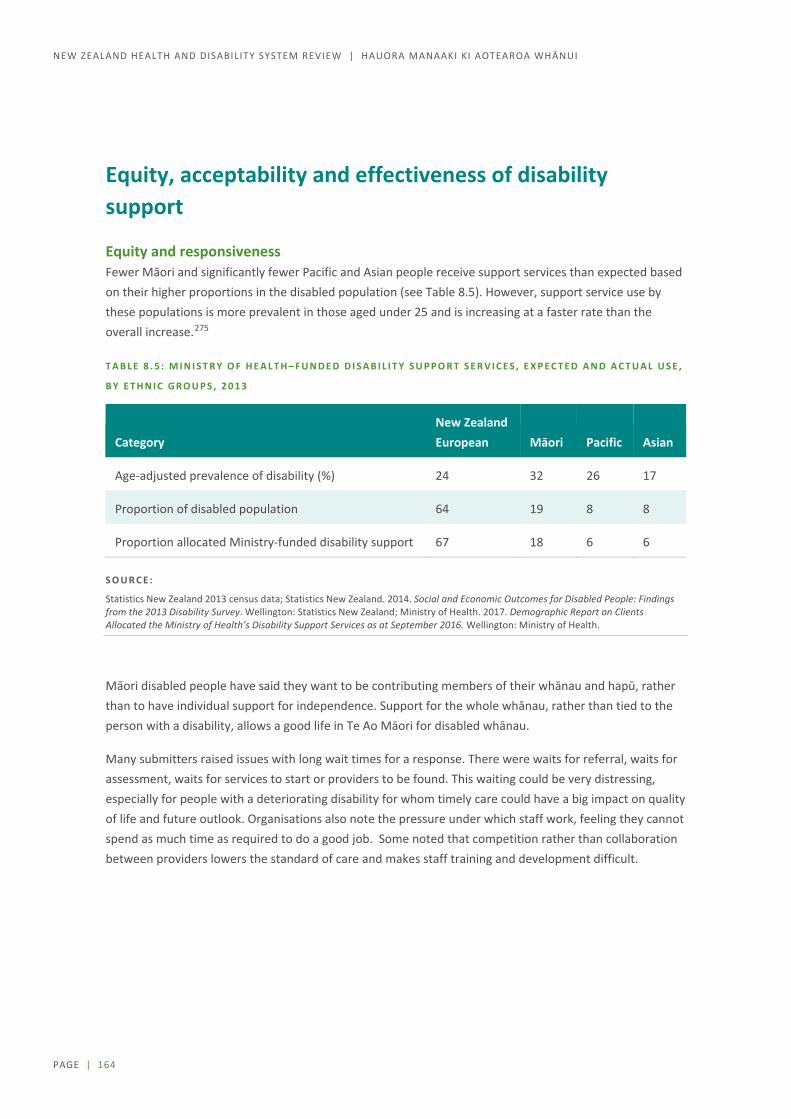
PAGE | 164
NEW ZEALAND HEALTH AND DISABILITY SYSTEM REVIEW | HAUORA MANAAKI KI AOTEAROA WHĀNUI
Equity, acceptability and effectiveness of disability support
Equity and responsiveness Fewer Māori and significantly fewer Pacific and Asian people receive support services than expected based on their higher proportions in the disabled population (see Table 8.5). However, support service use by these populations is more prevalent in those aged under 25 and is increasing at a faster rate than the overall increase.275
T A B L E 8 . 5 : M I N I S T R Y O F H E A L T H – F U N D E D D I S A B I L I T Y S U P P O R T S E R V I C E S , E X P E C T E D A N D A C T U A L U S E ,
B Y E T H N I C G R O U P S , 2 0 1 3
Category New Zealand European Māori Pacific Asian
Age-adjusted prevalence of disability (%) 24 32 26 17
Proportion of disabled population 64 19 8 8
Proportion allocated Ministry-funded disability support 67 18 6 6
S O U R C E :
Statistics New Zealand 2013 census data; Statistics New Zealand. 2014. Social and Economic Outcomes for Disabled People: Findings from the 2013 Disability Survey. Wellington: Statistics New Zealand; Ministry of Health. 2017. Demographic Report on Clients Allocated the Ministry of Health’s Disability Support Services as at September 2016. Wellington: Ministry of Health.
Māori disabled people have said they want to be contributing members of their whānau and hapū, rather than to have individual support for independence. Support for the whole whānau, rather than tied to the person with a disability, allows a good life in Te Ao Māori for disabled whānau.
Many submitters raised issues with long wait times for a response. There were waits for referral, waits for assessment, waits for services to start or providers to be found. This waiting could be very distressing, especially for people with a deteriorating disability for whom timely care could have a big impact on quality of life and future outlook. Organisations also note the pressure under which staff work, feeling they cannot spend as much time as required to do a good job. Some noted that competition rather than collaboration between providers lowers the standard of care and makes staff training and development difficult.

PAGE | 165
INTERIM REPORT | PŪRONGO MŌ TĒNEI WĀ
H O L I S T I C S E R V I C E S I N P A C I F I C C O M M U N I T I E S
Vaka Tautua provides services to Pacific people and families with complex, long term and ongoing needs. This not-for-profit organisation holds contracts with different agencies and delivers these in integrated ways. They promote self-reliance and independence while providing flexible and responsive support at times of need.
Accessing and managing carers, getting equipment and modification of homes and other services often require navigating complicated bureaucratic processes. This is time consuming for families, particularly for people with English as a second language. Vaka Tautua staff inform families about services and allowances they are eligible for, and advocate with services on behalf of families. They communicate with families in their preferred language and maintain contact to ensure that referrals to other services are followed through and the outcomes that matter to families are achieved. The wellbeing and empowerment of families is as important as any services provided.
[Vaka Tautua staff] are like a second family.
Vaka Tautua model Pacific community values in the organisation and service delivery. They are staffed by Pacific people with passion for and strong networks in their communities. They include service users and others with lived experience of disability and mental health challenges. They pay a living wage to staff, enable community access to finance, support community infrastructure and demonstrate a wellbeing approach for Pacific peoples.
Newer approaches to improve service responsiveness In New Zealand and internationally, three approaches to disability support improvement are gaining traction. Individualised funding, person-centred services and Whānau Ora all offer more responsive and adaptive approaches to fit with the lives of people and whānau.
Individualised funding approaches are being used in many parts of the world for disability support across age groups and disability types. Some international evidence indicates that individualised funding is preferred by many disabled people, and is as affordable and effective as other approaches.276 In New Zealand, the Productivity Commission looked at the Enabling Good Lives (EGL)277 model and recommended the approach for those who have complex needs and capacity to coordinate the services they need, for a wide range of disability supports including home-based support for older people, respite services and addiction services.278
Both the Waikato Enabling Good Lives demonstration279 and the MidCentral Mana Whaikaha system transformation prototype have found 15 to 25% of people engaging had not previously received services.280
Person centred services integrate across agency boundaries so that
all people have equal access to quality health services that are co-produced in a way that meets their life course needs, are coordinated across the continuum of care, and are comprehensive, safe, effective, timely, efficient and acceptable; and all carers are motivated, skilled and operate in a supportive environment.281
PAGE | 166
NEW ZEALAND HEALTH AND DISABILITY SYSTEM REVIEW | HAUORA MANAAKI KI AOTEAROA WHĀNUI
This approach, led by the World Health Organisation in response to population aging, has both improved outcomes and reduced costs of services for older people with multiple health conditions in Finland.282 It is being adopted to integrate health and social care in England and Scotland, including in collaboration with carers and communities, for people with multiple social stressors and mental health concerns.283 In New Zealand, it is being trialled in small intensive developments, such as to integrate and intensify cross-sector support for teenage pregnant mothers, and their children and whānau, in Māngere.284 The Productivity Commission recommended this approach for people with complex needs and without the ability to navigate the system to coordinate services. 285 ACC’s case management approach for serious injuries has many features in common with this approach.
Whānau ora is a collective approach that seeks for whānau to be self-managing; living healthy lifestyles; participating fully in society; participating confidently in Te Ao Māori and Pacific communities; economically secure and successfully involved in wealth creation; and cohesive, resilient and nurturing. In seeking whānau wellbeing, it builds on whānau strengths and aspirations in a holistic way. It includes health, social and support delivery in a way that is led by whānau and is more than whānau centred services.286
… while Pākehā fight for emancipation from the clutches of institutions and in some cases over-protective families, Māori disabled struggle to gain access to Te Ao Māori and play active roles as part of whānau, hapū and iwi. (Organisation submission)
While the approach is yet to gain sufficient scale to assess its results287, it shows promise not only for Māori and Pacific whānau but more broadly across New Zealand communities.
Other current developments Moves to modernise and personalise disability support provision are underway, albeit slowly, and providers have been responding to changing demands. Recent advances include MyCare, an online system to support people choosing a support worker established in 2013, and this year, Choices NZ, a new, flexible service arm of the IHC group that offers support with planning and life coaching.
New support worker wages and conditions provide the foundation for a better trained, longer retained and more diverse workforce to increase personalised and capability-building support, and offer collective, whānau approaches. To realise these aims will require a more collaborative approach to support quality and training across providers, greater attention to Māori and Pacific provider development and cultural capacity more broadly, and positive discrimination to include more disabled people in the workforce. It will also require more funding.
Criticism remains about the slow rate of improvement, with personalised and culturally responsive approaches available to only a small minority of service users.288 There is also high criticism of the needs assessment and service co-ordination (NASC) process, including from NASC personnel. People feel they have to “fight” for help and that the needs assessment process is disempowering and inflexible even with the “workarounds” that are commonplace.289

PAGE | 167
INTERIM REPORT | PŪRONGO MŌ TĒNEI WĀ
Differences across disabilities and causes of disability People and organisations have commented on the inequities in level of support received by people with different disabilities. Some people receive no support because their disability is excluded from a list of what is covered. They seek a system that is
inclusive [and] fair to all. People with chronic illness would be included such as ME/CFS [myalgic encephalomyelitis/chronic fatigue syndrome] sufferers. (Individual submission)
Other people receive little support because they have multiple conditions or disabilities and different needs assessors or funders disagree on where responsibility lies. Organisations are concerned about people “falling through gaps” and about inflexible processes and boundaries between different funders, needs assessors and providers.
The existing disability support system is fragmented, siloed between departments and agencies with little clarity or transparency. It is often difficult to identify a lead agency within the system. Significant and wide-ranging reform is needed in the disability system. (Organisation submission)
Many submitters raised the inequities they see between support for those people whose disability results from injury, and support for those people whose disability arises from another cause, such as through illness, or is a congenital disability. ACC-provided support is intended to compensate for injury as well as to optimise recovery or living with disability. However, people who raise the differences think it is unfair that a child with cerebral palsy that occurred before birth should have a lower standard and level of support than a child with cerebral palsy that occurred during birth. Or that a person whose limb was amputated to remove a tumour should have a lower standard of prosthetic limb and rehabilitation than one whose limb was amputated after an accident. They see the ACC level of care and support as a standard that should be affordable and available to anyone of a similar age group and needs category, even if income and other compensation is higher through ACC.
Hope in new approaches Among people and whānau living with disability, we saw and heard both hope and desperation. The hope is centred on changes to disability support that would make this much more flexible and useful to people and give them more control of their lives. It is also seen in communities who are making changes for themselves, such as those involved in care of people with dementia.
Across the community, people involved in making changes and improvements express positive experiences and support from the wider community. In particular, those involved in new models of disability support funding, like Enabling Good Lives (EGL) and the Mana Whaikaha MidCentral prototype, are enthusiastic about the life improvements people can make with a more flexible, capability building approach to set and achieve ordinary life goals. Disabled people, their whānau, and providers share the enthusiasm and hope, although they note that change is a slow process and some areas, such as building community inclusiveness, need more resources.

PAGE | 168
NEW ZEALAND HEALTH AND DISABILITY SYSTEM REVIEW | HAUORA MANAAKI KI AOTEAROA WHĀNUI
Many people said that the traditional disability support system has too much say in how they can live their lives, that what supports are available, and how they are tied up with accommodation or providers, is very restricting. Many people want EGL and system transformation to be accelerated. They see controls on funding as preventing this acceleration, and want these controls to be relaxed.
I have a disability myself and I am achieving my goals because if I don’t my disability would take over. (Individual submission)
Other people say that EGL approaches, individual budget holding, and employing carers are irrelevant to them, that their disabilities make these things impossible. They seek higher quality care, high quality communication and behavioural support, and more support for family and whānau providing care.
Organisations would like to see an overhaul of the current disability support system. They support bringing in EGL principles. They also seek a move away from the current system which they see as tightly regimented with too high a threshold to receive support and a presumption that, once approved, support will continue for life.
Invest in people and supports early, taking a life time cost approach …
… There needs to be clear and transparent communication about priority spend of budget and what is realistic, not making value-based promises that can’t be fiscally met. (Organisation submission)
Support for family, whānau and carers Family and whānau often want to care for their disabled family members and extend the time they can live in their own or family home. In many cases, though, they feel overwhelmingly unsupported in doing this. There is a very strong call for more and higher quality respite options so that family members can take time out from their caring role, and ideally have a weekend or holiday themselves from time to time.
Feelings of fear, loneliness, anxiety and grief are typical for carers, and taking a break from caring can be key to a carer’s ongoing wellbeing. However, finding suitable respite care, especially for younger stroke survivors, can be difficult. This is concerning as in some communities the number of people experiencing stroke under the age of 65 is increasing, eg, Pasifika. For far too many, their only option for respite care is placement in an aged care facility and this can be an undignifying experience. (Organisation submission)
Nearly a fifth of New Zealanders support disabled whānau in some way. Many people devote much of their time to caring for family members, and their own wellbeing may be neglected. Submitters would like to see a system that is more responsive to carers as well as people receiving care. As well as respite or time-out care, they are seeking better information and advice, connections with others with similar cultures and circumstances, and opportunities for learning, upskilling and gaining recognition of their abilities.

PAGE | 169
INTERIM REPORT | PŪRONGO MŌ TĒNEI WĀ
A wellbeing approach to support Early support can increase independence and prevent longer term impacts of disability. In all age groups and across disabilities, early support that builds abilities of disabled persons, whānau and supporters can lead to better wellbeing, independence and community and economic participation.290
More investment in early childhood. More intensive treatments/ physio/ speech language etc when young to minimise the need for services as they get older. Invest in tamariki. (Individual submission)
Simply providing quality information, which is up-to-date, easily accessible, culturally appropriate, consistent and regularly reviewed helps people understand dementia and learn how to live with it. Small things can make a big difference. Providing for 12 months’ post-diagnosis support to equip people with dementia, their families and care partners with tools, connections, resources and plans to allow them to live as well as possible with dementia could also be beneficial. (Organisation submission)
Life-long support is and will be required for many disabled people. The nature of that support, and how self-directed it is, can be influenced by an early and enabling approach.
Parents and family and whānau of children with development delays and disabilities expressed intense frustration at their helplessness in trying to deal with a lack of information and confusing, disjointed, and inconsistent advice. They complain that little help exists for them to provide a good start in their children’s early years, especially for children with rarer conditions. A nationally consistent and easily accessible system of information to support parents, families and whānau, and health, education, and social service workers, would reassure carers that they were providing the basics correctly and knew when and how to access expert help.
For all age groups, a change towards earlier, simpler assessment and provision of supports, including supports that are mainly provided through families and whānau and communities, is likely to improve outcomes. It is also likely to improve the reach of support, and system productivity overall, even with constrained government funding and resources.
PAGE | 170
NEW ZEALAND HEALTH AND DISABILITY SYSTEM REVIEW | HAUORA MANAAKI KI AOTEAROA WHĀNUI
Beyond disability support, wider health and disability system roles While disability support services receive sharp focus, disabled people interact with all parts of the health and disability system. Like anyone else, people living with disability want to live well, be included and contribute, be in good health, and receive high quality health care when they need it. The health and disability system can contribute in many ways to people living with disability and to a non-disabling society.291
Health of people with disability
People with disabilities have the same health needs as non-disabled people – for immunization, cancer screening etc. They also may experience a narrower margin of health, both because of poverty and social exclusion, and also because they may be vulnerable to secondary conditions, such as pressure sores or urinary tract infections. Evidence suggests that people with disabilities face barriers in accessing the health and rehabilitation services they need in many settings.292
Disabled people report poorer health than non-disabled people.293 Disabled people also report unmet need to access a health professional (20% of disabled Māori, 14% of disabled non-Māori) and unmet need for special equipment (19% Māori, 11% non-Māori). Pacific people with disability also have higher levels of unmet need for health care.294
Several disabled groups are known to have poor health status and outcomes.295 People with intellectual disabilities and people with a serious mental illness or addiction have significantly worse health than other population groups.296 297 298 299 Both groups experience poor health across most long term condition areas, and have life spans around 20 years shorter than their non-disabled peers. Considering both groups and the crossover between them, this is the experience of roughly 1 in every 50 to 80 New Zealanders.
Disabled people’s organisations are particularly concerned about the considerable inequities in health for disabled people, specifically for people with intellectual disabilities and mental health and addiction-related disabilities. They express dismay at the system’s failure to make progress on these significant population inequities which have been known about for many years. They consider this failure as evidence that disabled people’s lives are not valued on a par with others’.
Improving health and wellbeing of people with disability Organisations from across the system have emphasised the social and economic determinants of health that keep disabled people from enjoying the sort of ordinary and satisfying life that most New Zealanders take for granted. They point to the disparities in income, housing, employment and accessibility that limit health and participation of disabled people.
More resources directed towards enabling people to live healthier lives, targeted on issues of particular areas of relevance to people with disabilities such as healthy homes and healthy transport. (Organisation submission)

PAGE | 171
INTERIM REPORT | PŪRONGO MŌ TĒNEI WĀ
Improving health and wellbeing outcomes for all people, including disabled people, requires a broad response from the whole system. This response includes prevention, health promotion and protection, timely and quality healthcare, and support to live well at all stages of life, with or without illness or disability. It also includes leadership in the wider community to promote health and wellbeing, and influence to change the social, physical, economic and relational environment to support wellbeing. While all people can benefit from this leadership and influence, those who are worse off at present (including people living with disability) stand to gain more.
Reducing discrimination and stigma, making communities more accessible and creating employment are examples of strategies that will improve the wellbeing of people with disabilities. Removing barriers that impede disabled people’s access; improving the competence of the workforce to assess, treat and care for people with disabilities and supporting services and treatments that are individually and culturally appropriate for people and their whānau will all contribute to greater health equity for people with disabilities. (Organisation submission)
Employment has a large impact on wellbeing Overwhelmingly, submitters said that employment would make the biggest difference to disabled people’s lives.
Employ a person with a disability (Individual submission)
Many disabled people want to work, and a range of approaches that support disabled people into work have demonstrated success.300 301 Good work has many benefits – income, social connections, achievement and purpose all enhance wellbeing and lead to better health outcomes.
Improving the employment focus of both the health and welfare systems so that people can either join or return to the labour market as soon as possible. At the moment there are policy, practice and funding barriers that serve to impede progress in this area. (Organisation submission)
The health and disability system, collectively, is one of the largest employment sectors, and a DHB may be the largest single employer in its district. As well as having substantial employment power, the system has much to gain from the greater employment of disabled people. Disabled people have many skills, some enhanced by living with disability and having to navigate through complex systems. Some roles are performed better by people with different abilities. Increasing employment of disabled people across the system is likely to have significant benefits for their health and wellbeing, for the system’s responsiveness to disabled people, and for disabled people’s outcomes generally.302
PAGE | 172
NEW ZEALAND HEALTH AND DISABILITY SYSTEM REVIEW | HAUORA MANAAKI KI AOTEAROA WHĀNUI
Improving health care for people with disability On a personal level, a number of people have raised the difficulties they face in accessing usual health care because health practitioners are surprised by their disability and/or unable to accommodate, communicate or provide the disabled person’s usual level of personal care.
There is also a gap in PHOs partnering with the disability sector. While many PHOs have developed close relationships with mental health services, this is often not the case with disability services. (Organisation submission)
A number of disabled people consider it should be a baseline part of health care that disability should show up on health records, preferably a health record they can carry with them on a card or phone app, and that health workers should be trained in how to make adjustments, communicate with and care for disabled people.
At a system level, disability is largely invisible. Little data is collected, and very little analysed, to show how services are accessed or used by disabled people, with what outcomes. Some DHBs are adding a “disability passport” to inform and improve their care for disabled people, since national health information collections have no field or flag for disability.
In order to attain an equitable health system, there is a need for a human rights and privacy compliant data infrastructure disaggregated for gender, ethnicity, age and disability, that allows both understanding of health status and effective monitoring of intervention effectiveness and outcomes. (Organisation submission)
Early intervention and timeliness For children, the education system has increased support for learning needs of all children and especially those with particular learning support needs. These needs are often missed earlier in life and picked up in education settings or at B4 School Checks. One organisation noted:
while children’s needs may be identified through the education sector, by having inadequate responses in terms of the availability of mental health, behavioural or disability services, children’s needs are unmet, often preventing them from being able to attend school and unable to receive their right to an education that develops them fully. It would benefit children if the public health system were to be held responsible for children being able to attend school and learn. (Organisation submission)
Long waits for assessment are a particular issue for children, and have been highlighted especially for children with “invisible” disabilities such as attention deficit hyperactivity disorder (ADHD), autistic spectrum disorder (ASD) and foetal alcohol spectrum disorder (FASD). These long waits have been particularly felt by Māori and Pacific whānau of children with these disabilities. Children at highest risk of poor outcomes are least likely to be identified through the maternal and child health or early education systems.303

PAGE | 173
INTERIM REPORT | PŪRONGO MŌ TĒNEI WĀ
Long waits for assessment across disabilities and age groups have also featured prominently in submissions to this Review. People who have had strokes, people with degenerative conditions like Motor Neurone Disease and many others have expressed their helplessness to get timely assessment of their support needs and noted that this can mean the difference between being at home or having to be cared for in a hospital or residential care facility.
Participation and inclusion in the system Information is scant on inclusivity of governance, leadership, workforce and advisory roles across the system. Leadership in the system includes a number of commissioner and senior academic and advisory positions held by people with personal experience of disability. In general, though, participation in governance, leadership and workforce roles appears considerably lower than would be expected given that 1 in 5 people of working age identify as disabled.
It’s the voice that is heard but not listened to (Individual submission)
Disabled people want to be included and taken seriously by the health system. Some disabled people and organisations consider their issues are treated as a low priority, or an afterthought, by the system. They want more say in how services can be accessible and accommodating for people with a range of disabilities. They are willing to work with people to improve things.
Increasing wellbeing through population approaches The health and disability system has considerable capability in gathering and assessing evidence, both quantitative and experiential, and modelling impacts of changes in interventions. Programmes to prevent disability (such as through immunisation), to intervene early to reduce impacts (such as through newborn heelprick screening) or to reduce inequities (such as through responses to high Māori amputation rates304) use this capability.
Potential exists to use this capability, with disability researchers and providers, to inform population approaches to living well for people with disabilities. As an example, submitters have suggested that better data collection and use of registers, together with a prevention and early intervention approach, would support both more consistent, higher quality care across the country and more equitable outcomes for Māori infants with cerebral palsy. Other examples include proactive podiatry for vascular disease, tailored nutrition and activity or cognitive behavioural learning programmes for people with various disabilities, or prevention of foetal alcohol spectrum disorder.
Improvements for disabled people tend to have long-lasting impacts and to bring broader participation and productivity benefits to individuals and the wider community. Improvements that increase people’s agency – what they can do for themselves, their whānau, their communities – are most likely to lead to step changes in overall whānau and community wellbeing.

PAGE | 174
NEW ZEALAND HEALTH AND DISABILITY SYSTEM REVIEW | HAUORA MANAAKI KI AOTEAROA WHĀNUI
What the future looks like
Increasing numbers Disability is increasing globally, as people die later in life and live longer with the impacts of illness and injury. New Zealand is tracking similarly to comparator countries, with a steady increase in disability impact of around 3% per decade over the last quarter century.305
The rate of childhood disability is stable, although disability is increasingly recognised.
Disability in working age adults is rising with the effects of long-term conditions (such as diabetes and arthritis). This effect is the most significant contributor to the increase in disability.306
In later life, disability is higher with multiple long-term conditions. Proportionately, the impacts of disability are declining in older age, but are still higher than in younger people, and numbers in older age groups are growing.
As disability increases in the population, it will be increasingly important to empower all people to look after their health and wellbeing and that of their family and whānau. This empowerment includes promoting the ability of disabled people and their families and whānau to improve and direct their own wellbeing and support.
Improving technology Communication and geospatial technologies have already enabled independence gains, with wearables and monitoring systems increasing safety and accessibility. A range of phone apps, in-home devices and robots will increasingly make life more easily navigable for people with and without disability, especially as they become generally available and affordable. More sophisticated apps are helping people track their own health data and link with peer support networks, life coaching and interventions. Large scale hub and research centre projects are underway, adapting insulin delivery for individuals with type 1 diabetes and tracking Parkinson’s disease variables.307
A range of advanced sensory and communications technologies are in development, some of which will offer huge benefits to people with certain disabilities. Kara Technologies in Auckland, for example, are developing a New Zealand Sign Language avatar. Other major development areas include mobility technology and genomics, where significant advances are likely. Submitters to the Review have commented on the scarcity of orthotics craftspeople. Their expertise and advice will continue to be essential even as advanced scanning and 3D printing techniques produce customised orthotic equipment.
Research and development A number of submitters have noted that disability services and supports, rehabilitation and vocational support are under-researched areas of health. They consider that an unfair allocation of resource goes to issues with high population numbers that are seen as “mainstream”, and as a result, services for these “majority” health conditions keep improving over time. In contrast, “non-mainstream” areas, especially those with very low population numbers, do not see research or development resource and innovations are not seen as “proven”.

PAGE | 175
INTERIM REPORT | PŪRONGO MŌ TĒNEI WĀ
Enabling disabled people to benefit from new technologies in advance of mainstream use, through research and development involvement and through promoting public good availability of research advances, calls for inclusive leadership.
Focus on child and youth wellbeing The Child and Youth Wellbeing Strategy has brought expression to the views of many New Zealanders that children are the country’s future. Submitters to this Review emphasised the importance of a good start for all children, especially those in communities with high family stress, low income and low communal resource. They have asked for greater priority to be given to early help for families with a child with a disability or development delay, and for “front-loaded” assessment and advice on what families can do to give their differently abled children a good start.
Inclusive communities People in many parts of New Zealand have a renewing sense of what makes a community, with people doing things that enhance the collective sense of togetherness, celebrate diversity and enjoy their environment. Solidarity around groups in the community who may have been isolated, not understood or excluded is part of this. Volunteering and giving is increasing in all age groups. An enhanced sense of community is a powerful base to build wellbeing and inclusion for people living with disability among other groups.
There needs to be a radical change in attitude from one of tolerance to one of welcome. (Individual submission)
A number of people and community organisations pointed to the rise in volunteering and interest in local community connections across New Zealand. They would like to see this energy promoted to increase inclusion and participation of disabled people in a range of community activities. They note that inclusion through workplaces is one important area, that recreation opportunities are another, and that community groups can achieve a lot with few resources.
As well, social entrepreneurship is raising improvements that have relevance for a non-disabling community. These include the Be. Accessible movement to promote inclusion and “turn disability into possibility”308, design school students developing apps to promote accessibility, and matching programmes that introduce volunteers to people needing the sort of companionship or help they can give.
Disabled people told us they have the capability in their community to contribute much more to New Zealand. The whole country stands to gain if more disabled people are living well, working and contributing to their communities. A health and disability system that promotes living well for all people is a core part of this achievement.

PAGE | 176
NEW ZEALAND HEALTH AND DISABILITY SYSTEM REVIEW | HAUORA MANAAKI KI AOTEAROA WHĀNUI
Directions for change: Disability Better health, inclusion, and participation of people with disabilities must be a priority for action across the whole health and disability system. Increasing numbers of people are living with disability, and more disabilities are being recognised. The system needs to gear its ability to respond to disability becoming more of a norm.
L I V I N G W E L L A N D P R E V E N T I O N
A focus on living well and preventing the exacerbation of disability should be a priority. This will require more integration both within the system and across other parts of government. Promoting living well for everyone, with and without disability, and preventing different abilities and health conditions from becoming disabling, need to be the focus.
M O R E V I S I B I L I T Y
All people with disabilities have health conditions and/or health care requirements at some time. The Panel believes disability needs to be much more visible at a system level, so the health outcomes of disabled people are properly focused on.
Better data collection and information use, greater inclusion and participation of disabled people through all levels and parts of the system, and better service and workforce development are fundamental.
S Y S T E M L E A D I N G B Y E X A M P L E
The Panel’s view is that, as the largest employer in many regions, the system should lead in employing people with disabilities. Boosting employment of disabled people overall may be the single biggest contributor to improving wellbeing of disabled people. Bringing their skills to the workforce in health will also make the sector more responsive, adaptive, inclusive, and reflective of the community.
W H Ā N A U A N D C A R E R S U P P O R T
Disabled people are members of families, whānau, and communities. Addressing whānau and carer needs should be an integral part of all aspects of disability service assessment and provision.
M O R E J O I N E D - U P I N F O R M A T I O N , A D V I C E , A N D S E R V I C E S
The Panel believes that delivering a transformed disability support service using Enabling Good Lives principles may improve the future for many disabled people, but this will require focused leadership and change.
There will continue to be a large number of people with disabilities for whom other parts of the health or wider government system are the main point of contact. Interface issues across the system and historical boundaries that no longer seem relevant need to be addressed and greater flexibility introduced.

PAGE | 177
INTERIM REPORT | PŪRONGO MŌ TĒNEI WĀ
9 Tier 2 / Taumata 2
Tier 2 covers all hospital and specialist services in both the public and private sectors. While models of care are supporting the delivery of more care in community settings, hospitals will always be needed to treat people when they become acutely unwell or when their treatment is complex. Under any realistic projection of future demand, our hospitals will be unsustainable without significant investment and significant changes in the way services are delivered. Hospital and specialist services will need to work as a much more integrated network and more seamlessly with Tier 1 if real progress is to be made.
This section looks at the pressures on the current system, the variation that exists in timelines of access and health outcomes and the variation that is sometimes referred to as the “post code lottery”. The need for longer term health service planning, more evidenced based prioritisation and standards is discussed, alongside the potential future role of the hospital.
Introduction Tier 2 encompasses hospital (excluding aged residential care) and specialist services in both the public and private sectors. These services are generally accessed by self-referral to an emergency department or following a referral from a Tier 1 or another Tier 2 provider. There is also direct access to a number of specialist services in the private sector.
Hospital and specialist services play a significant role in health and disability service delivery and are a major part of health spending. Against international measures that are commonly used to assess health system performance, the HQSC states that:309

PAGE | 178
NEW ZEALAND HEALTH AND DISABILITY SYSTEM REVIEW | HAUORA MANAAKI KI AOTEAROA WHĀNUI
New Zealand’s health system achieves remarkable things every day. Ultimate outcomes supported by health care – reduced death and disability – are continuing to improve at a rate comparable to similar countries, even though New Zealand has been spending increasingly less than many other countries on health care.
Our hospitals continue to perform well against key indicators, but during our discussions several people said they are working under enormous pressure. Common themes we heard during Phase One included the following.
The workforce is committed to providing high quality patient-centred care, but there are staff shortages and many hospital staff feel stressed or burnt out. In rural areas, in particular, hospitals feel under pressure to provide necessary staff and often rely on international workforces.
Concern that hospitals have dominated the system and that strong demand and cost growth in hospital services is putting the health system under financial pressure. This, in turn, is precluding investment in prevention and early intervention, which are needed to slow demand for hospital services.
Current system settings encourage DHBs to operate as individual organisations rather than as part of a regional or national system. In the absence of a long-term plan that signals expectations of what services should be provided where and for what populations, most DHBs aim to be as self-sufficient as possible and provide most services.
Changing disease patterns, increasing consumer expectations, and technological advances are driving demand for current and new services, with tension running between national and local views of priorities and no consistent frameworks in place to help make evidence-based and transparent decisions.
Unwarranted variation in access to services and health outcomes exists across multiple dimensions, including ethnicity, socioeconomic deprivation, and locality.
Māori experience of hospital services includes poorer access, poorer treatment, poorer outcomes, and institutional racism.
New ways of working need to be accelerated in the planning, design, and delivery of care that better meets the needs of those experiencing the least equitable outcomes.
Many hospital facilities are not fit for purpose. A persistent underinvestment in facilities and IT is inhibiting the delivery of high quality and cost-effective care and is precluding the adoption of new models of care.
These themes are discussed further in this chapter and additional information is in Appendix H (online).
Overview of current hospital and specialist services Most hospital services in New Zealand are provided by the public hospital sector through DHBs. New Zealand has 82 certified public hospital facilities.310 Some of these facilities are located on the same campus and are often considered as one ‘hospital’, for example, a separately certified mental health facility within the grounds of a general hospital. While all DHBs are operating at least one acute hospital, several are operating multiple hospitals. Considerable variation exists in the size of hospitals and in the complexity and range of services delivered.

PAGE | 179
INTERIM REPORT | PŪRONGO MŌ TĒNEI WĀ
Size of hospitals: Large urban hospitals have from 650 beds to more than 1,000 (Auckland City Hospital), mid-sized provincial hospitals have 200 to 400 beds, and smaller community hospitals have less than 100 beds.
Complexity of services delivered: A role delineation model developed in 2010 categorises services along a six-level continuum from community services (Level 1) to supra-complex services (Level 6). Acute and elective hospital services are Level 3. Complex services at Level 4 and above are generally grouped together because of the complex infrastructure needed to support them. Based on 2010 ratings there are five hospitals qualified to provide Level 5 and 6 hospital services with other hospitals able to provide one or two complex services.
Service range: Some hospitals provide a full range of services while others provide only one service; for example, maternity services, mental health services, elective services, or ambulatory services only.
There are over a million hospital discharges from public hospitals each year. Much of this activity is in the Northern Region. Nearly 37% of all patients are admitted to a hospital in the Northern Region. Each of the other three regions admit around 20% of the total admissions.
Demand growth is driven by ageing and patients with increasingly comorbid and complex needs Table 9.1 shows the number of discharges by major service grouping. Medicine accounts for almost half of discharges, surgery for just over one-third, and maternity for around 12%. Every night in 2017/18, an average 8,800 people were in a publicly funded hospital bed.
T A B L E 9 . 1 : P U B L I C L Y F U N D E D H O S P I T A L D I S C H A R G E S B Y S E R V I C E G R O U P I N G , 2 0 1 3 / 1 4 T O 2 0 1 7 / 1 8
Service 2013/14 2014/15 2015/16 2016/17 2017/18 Growth
Medicine 498,345 513,401 527,228 543,800 561,390 13%
Surgery 391,326 405,514 415,666 419,654 414,343 6%
Maternity 140,362 140,327 141,435 144,546 140,833 0%
HOP and DSS 22,891 22,683 23,562 23,058 22,746 -1%
Mental health 17,272 18,025 18,513 19,650 19,588 13%
Paediatrics 15,046 15,083 14,177 14,720 14,292 -5%
Neonatal 9,981 9,899 9,697 9,406 9,331 -7%
Total 1,095,223 1,124,932 1,150,278 1,174,834 1,182,523 8%
Note: DSS = disability support services; HOP = Health of Older People services.
S O U R C E : M I N I S T R Y O F H E A L T H , N A T I O N A L M I N I M U M D A T A S E T .
Between 2013/14 to 2017/18, the largest growth in discharges was from medicine and mental health (13% or an average of 3% per year). Population growth over the same period was estimated at around 8%.311
Population ageing has a significant impact across all services, including hospital services. People are living longer than previous generations, and they are living longer in poor health. Ageing is associated with an increase in long-term health conditions and multi-morbidities. This is particularly so for Māori, Pacific peoples, refugees, disabled people, and people living with a mental illness. As the proportion of the
PAGE | 180
NEW ZEALAND HEALTH AND DISABILITY SYSTEM REVIEW | HAUORA MANAAKI KI AOTEAROA WHĀNUI
population ages, so too will the demands on the health and social system. Ministry of Health data shows that people aged 65 and older are more likely than younger people to be diagnosed with cancer or have a stroke, diabetes, heart disease, chronic pain, or arthritis.
The growth in demand for hospital and specialist services over the next 25 years as the population ages is dramatic. People aged over 65 are more likely to be admitted to a hospital, and to stay longer in hospital, than the total adult population. In 2018, people aged over 65 accounted for 15.8% of the total population, 34.5% of all acute hospital admissions, and 53.0% of acute bed days. Most DHBs are planning for future service delivery within hospitals to be oriented to the frail elderly.
Clinical service planning by DHBs shows that demand associated with ageing is material and needs to be recognised now. The Hawke’s Bay Clinical Services Plan estimates increases in discharges of around 25% and increases in demand for beds of 35% by 2031.312 The impact of ageing is seen even more graphically in Southern DHB, particularly in Dunedin Hospital. The Indicative Business Case for the Dunedin Hospital build notes:313
The increase in discharges is substantial at over 20 percent, but is outweighed by the increases in caseweights and bed days. These reflect the current age distribution of the more complex, higher caseweight inpatient events, and their length of stay, and the impact that the ageing population will have upon the need for services if current models of care continue. The clear message is that the average complexity of a case will increase across the hospital, and that there will be substantial pressure upon bed capacity, under existing models.
DHB service demand forecasts also show that, under current models of care, outpatient events will increase at a faster pace than inpatient events. As DHBs move services from inpatient to outpatient settings, there will be redoubled pressure on outpatient capacity.
Ageing will affect services differently. The largest growth will be in general medicine, orthopaedics, cardiology, and clearly age-related services such as assessment, treatment, and rehabilitation services, ophthalmology, and psychogeriatric services. Aged care, general medicine, and orthopaedic services will need to be able to deal with greatly increased numbers of patients. Hutt Valley DHB estimates that, with no other changes, by 2031 it will have growth of 38% in general medicine, 46% in cardiology, 49% in ophthalmology, 60% in assessment, treatment, and rehabilitation, and 71% in psychogeriatric services.314
The Northern Region Long Term Investment Plan provides a view over 20 years of possible bed demand forecasts ranging from a low growth increase of an additional 1,191 beds to a possible 2,055 beds based on current levels of hospital activity (see Figure 9.1).315 Analysis demonstrates that it is unlikely that demand can be slowed significantly in the near term, so, on balance, a mid-range scenario should be planned for.

PAGE | 181
INTERIM REPORT | PŪRONGO MŌ TĒNEI WĀ
F I G U R E 9 . 1 : B E D D E M A N D F O R E C A S T S I N N O R T H E R N R E G I O N
S O U R C E : R E P R O D U C E D F R O M N O R T H E R N R E G I O N A L A L L I A N C E . 2 0 1 8 . N O R T H E R N R E G I O N L O N G T E R M I N V E S T M E N T P L A N , F I G U R E 1 4 , P 7 1 .
Over the 20-year period, the Northern Region population will grow by around 562,000, which is greater than the population of most of the 20 DHBs. This scale of growth could not be accommodated without some increase in capacity, even before any additional growth through population ageing.
Occupancy pressures International benchmarks suggest that for most services, an average bed occupancy of 85% should support patient flow, quality care, and cost-effective service delivery. A Danish study of medical admissions found that high bed occupancy rates were associated with a 9% increase in rates of in-hospital mortality and 30-day mortality compared with low bed occupancy rates.316
Many acute hospitals in New Zealand are running well above 85% occupancy. The impact of this is felt most in the winter months when a larger proportion of the population is admitted to hospital. The ‘ripple effect’ of a high occupancy rate is felt throughout the hospital:317
489
999
1,507
At Current Activity2,055
838
1,265
Mid-High1,733
1,078
Mid1,583
651
Mid-Low1,502
574
882
Low1,191
0
500
1,000
1,500
2,000
2,500
Current 5 years 10 years 15 years 20 years
Addi
tiona
l Bed
s Pro
ject
ion
(not
Bed
Def
icit)

PAGE | 182
NEW ZEALAND HEALTH AND DISABILITY SYSTEM REVIEW | HAUORA MANAAKI KI AOTEAROA WHĀNUI
Regularly, and particularly during winter, our hospitals become overcrowded and dysfunctional as demand exceeds capacity. Consequently, acute patients ‘overflow’ to less appropriate hospital wards—acute medical patients are admitted to surgical wards, filling these and resulting in cancelling elective surgery. Ward rounds are prolonged as clinical teams visit patients throughout the hospital (“safari ward rounds”), decision making is delayed, patients access the next phase of care later, and hospital length of stay is prolonged. Prolonged length of stay further reduces access for new acute patients to hospital beds, making the demand and capacity mismatch worse. Exacerbating this are systems which might not facilitate early definitive decision making, timely access of acute patients to diagnostics, (eg, CT scanning), timely access to other necessary interventions such as acute surgery, nor efficient discharge of the patient when hospital care is no longer needed. Because acute patients continue to present to the ED, but access to care beyond the ED has become increasingly overwhelmed, a significant—although not the only—manifestation of this demand and capacity mismatch is worsening overcrowding in the ED (patients keep coming in but they can’t get out).
The underinvestment in hospital facilities has contributed to the occupancy pressures many hospitals are experiencing. This, in turn, puts pressure on community-based services with delays in admissions and earlier discharges than is usually desirable.
Condition of hospital assets Many of the hospitals are poorly designed with deferred and delayed maintenance, with workarounds, and are near their end of life. Even relatively new hospitals report issues with ward design and with adjunct theatre space, both reducing different aspects of hospital efficiency. DHBs reported the following issues with their existing facilities, constraining their ability to deliver contemporary, high-quality models of care in the most efficient manner:318, 319, 320, 321, 322
Buildings have a range of critical infrastructural issues, including not meeting seismic building standards, having asbestos, and having weather-tightness issues.
Patient flow through the hospital is difficult to access and navigate and critical services are not collocated (for example ED and imaging)
A shortage of capacity (such as outpatient spaces, wards, and theatres) and fragmented capacity are reducing efficiency and making multi-disciplinary assessment and care difficult.
There are not enough power points around beds, not enough space for medical equipment, not enough points for medical gases, and Insufficient/inappropriate space for infection control
Lack of privacy for patients The environment is not friendly for children and families and whānau. Security and safety are issues for staff and patients There are not enough bathrooms.

PAGE | 183
INTERIM REPORT | PŪRONGO MŌ TĒNEI WĀ
Inter-district flows Inter-district flows (IDFs) occur when a patient residing in one DHB is admitted to a hospital in another DHB. IDFs may arise because of planned clinical care arrangements (for example, a regional service is provided in one hospital) or people become acutely unwell when they are outside their ‘home’ DHB and require admission to hospital. Figure 9.2 takes a ‘DHB of service’ view and considers ‘inflows’. It asks, ‘of the inpatient events delivered by hospitals in each DHB, what is the proportion that is for patients from other DHBs?’
F I G U R E 9 . 2 : D H B O F S E R V I C E – % O F D I S C H A R G E S T H A T A R E P A T I E N T S F R O M O T H E R D H B S , 2 0 1 7 / 1 8
Note: Case-mix funded discharges only (most of medicine, surgery, paediatrics, neonatal; and maternity events in secondary birthing units).
S O U R C E : M I N I S T R Y O F H E A L T H , N A T I O N A L M I N I M U M D A T A S E T .
0% 10% 20% 30% 40% 50%
Taranaki
Hawke's Bay
Tairāwhiti
Northland
Southern
South Canterbury
Nelson Marlborough
Bay of Plenty
West Coast
Waitematā
Wairarapa
Whanganui
Mid Central
Lakes
Canterbury
Counties Manukau
Hutt Valley
Waikato
Capital & Coast
Auckland
% inflow caseweights % inflow discharges

PAGE | 184
NEW ZEALAND HEALTH AND DISABILITY SYSTEM REVIEW | HAUORA MANAAKI KI AOTEAROA WHĀNUI
The pattern of patient flows varies between hospitals.
The higher IDF proportion of case-weighted discharges reflects the inflow to more complex tertiary services that are provided to regional populations.
Auckland DHB has the largest IDF inflow—over one-third of discharges and almost half of case-weighted discharges are for patients from other DHBs.
Capital & Coast has the second largest inflow—around one-fifth of discharges and over one-third of case-weighted discharges are for patients from other DHBs.
Hutt Valley DHB also has a relatively high inflow of patients from other DHBs, reflecting its regional Plastics and Burns service.
Interestingly, other regional providers of tertiary services (Waikato and Canterbury) have a much lower IDF inflow compared to Auckland and Capital & Coast. This is likely to be due to the close geographical proximity of DHBs in the Auckland metro and greater Wellington areas, which leads to sub-regional service arrangements as well as movement of people across DHB boundaries as they go about their everyday lives.
Inter-district flow payments are made between DHBs to compensate for the services they provide to people who reside in other DHB areas. To determine the level of payment between DHBs, data is needed on service volumes and service prices.
Most IDFs are based on historical service volumes forecast forward.
The IDF price of a service is based on the average national cost of that service, with an efficiency adjustment and a tertiary adjustor where appropriate. These are calculated from data provided by DHBs. However, there is a lag in data collection and the level of detail provided varies across DHBs.
We heard a variety of concerns about IDFs. Some DHBs believed IDF payments did not compensate them for the full cost of treating patients. Others believed that IDFs do not provide an incentive for providers to improve the cost-effectiveness of their services. Concern also exists that IDFs can be ‘gamed’, by DHBs.
While IDF payments as currently configured may not be working as effectively as they could, any future system arrangements will need to include a mechanism to allow funding to follow patients between organisations. Ideally this mechanism would incentivise organisations to collaborate to meet local, regional and national needs. As discussed in the governance section in chapter 4, the system needs to work as a unified system, not as independent organisations with diverging interests.
PAGE | 185
INTERIM REPORT | PŪRONGO MŌ TĒNEI WĀ
Variation in Tier 2 delivery There is evidence from a number of sources that unwarranted variation exists across several dimensions, including ethnicity, socioeconomic deprivation, and locality. Understanding why such variations exist is complex:323
If all variation was bad, solutions would be easy. The difficulty is in reducing the bad variation, which reflect the limits of professional knowledge and failures in its application, while preserving the good variation which makes care patient centred. When we fail, we provide services to patients who don’t need or wouldn’t choose them while we withhold the same services from people who do or would, generally making for more costly errors of overuse than underuse.
Hospitals and inequity Māori and Pacific peoples suffer disproportionately poorer health than other New Zealand populations and are more likely to be admitted to hospital for acute conditions. Once in hospital, Māori receive a poorer quality of service than non-Māori.324
Māori are more likely than non-Māori to wait more than three months for their specialist appointments. Between 2011 and 2016, 17.1% of Māori referred for a specialist appointment, waited longer than three months to see their specialist compared with 12.6% of non-Māori.325 Sixteen percent of adult Māori did not attend their specialist appointment between 2011 and 2014 compared with just 6% of non-Māori. This inequity has far-reaching negative impacts on diagnosis and treatment for Māori.326
Stage of diagnosis is significant in explaining poor cancer outcomes for Māori. Researchers found “more than half of the excess relative risk of mortality in Māori and Pacific women is explained by differences in stage at diagnosis and comorbid conditions”.327 These researchers assessed screening history and stage at diagnosis, considered comorbidities, and standardised for travel time to the nearest GP and cancer centre.
The effect of differing levels of access is difficult to assess. In some areas, such as screening for breast cancer, early detection is critical, particularly when ethnicity is considered: “Breast cancers detected through screening are diagnosed at an earlier stage and have a greater proportion of subtypes, with better outcome”.328
As discussed earlier, ambulatory sensitive hospitalisation rates are a proxy for what hospital admissions might be avoided if other parts of the health system were servicing populations well. As Figure 9.3 shows, these rates are significantly worse for Māori and Pacific peoples and are trending unfavourably.
A mixed pattern is observable in hospital statistics once Māori are in hospital. Acute readmission rates are similar across ethnic groups.329 On the other hand, acute bed days are materially higher for Pacific peoples and Māori. Māori and Pacific peoples experience inequity compared with the ‘other’ group across all deprivation categories (see Figure 9.4).330
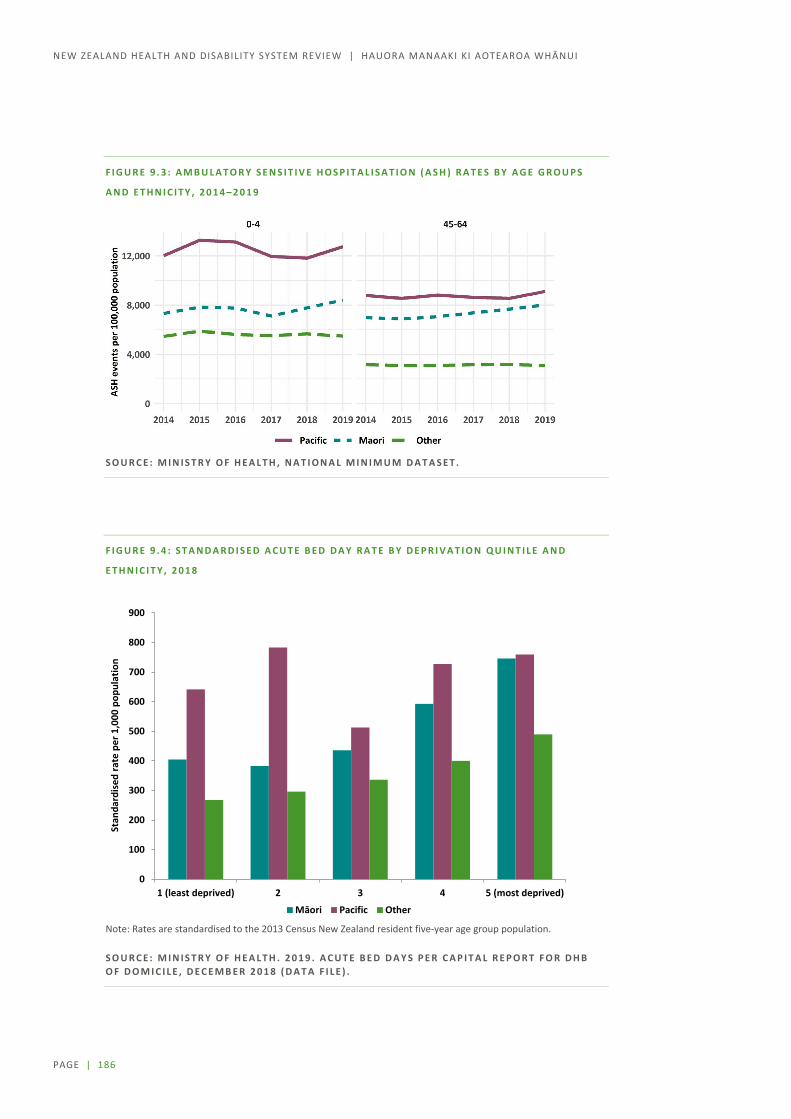
PAGE | 186
NEW ZEALAND HEALTH AND DISABILITY SYSTEM REVIEW | HAUORA MANAAKI KI AOTEAROA WHĀNUI
F I G U R E 9 . 3 : A M B U L A T O R Y S E N S I T I V E H O S P I T A L I S A T I O N ( A S H ) R A T E S B Y A G E G R O U P S
A N D E T H N I C I T Y , 2 0 1 4 – 2 0 1 9
S O U R C E : M I N I S T R Y O F H E A L T H , N A T I O N A L M I N I M U M D A T A S E T .
F I G U R E 9 . 4 : S T A N D A R D I S E D A C U T E B E D D A Y R A T E B Y D E P R I V A T I O N Q U I N T I L E A N D
E T H N I C I T Y , 2 0 1 8
Note: Rates are standardised to the 2013 Census New Zealand resident five-year age group population.
S O U R C E : M I N I S T R Y O F H E A L T H . 2 0 1 9 . A C U T E B E D D A Y S P E R C A P I T A L R E P O R T F O R D H B O F D O M I C I L E , D E C E M B E R 2 0 1 8 ( D A T A F I L E ) .
0
100
200
300
400
500
600
700
800
900
1 (least deprived) 2 3 4 5 (most deprived)
Stan
dard
ised
rate
per
1,0
00 p
opul
atio
n
Māori Pacific Other
PAGE | 187
INTERIM REPORT | PŪRONGO MŌ TĒNEI WĀ
Several commentators called out the health sector for institutional racism: “Institutional racism … turns on the structures, policies and practices of that system and the ways in which they reflect and maintain cultural dominance”.331
There is some evidence that shows some hospitals approach Māori and Pacific patients differently and offer a different level of care and possibility of different outcomes.332 Other evidence suggests that clinical decision making is the same and presenting aspects of the patient explain any variance in clinical interventions.333
Rates of seclusion for Māori are higher than for non-Māori, and more research is required to understand the role the service provider plays in this difference. In 2017, the Director of Mental Health and Addiction Services reported that Māori were 4.5 times more likely to be secluded in adult inpatient services than people from other ethnic groups. Of those secluded in adult inpatient services, 41% were Māori.334
On the other hand, there are also good examples of DHBs adopting mātauranga Māori approaches as illustrated in the case study of the Mason Clinic below.
M A S O N C L I N I C – A P P L I C A T I O N O F M Ā T A U R A N G A M Ā O R I I N A C O N T E M P O R A R Y C L I N I C A L S E T T I N G
A successful example of mātauranga Māori applied in a clinical health setting occurs at Waitematā DHB’s Regional Forensic Psychiatric Services Division – the Mason Clinic.335 This clinic is a secure unit in Point Chevalier, Auckland. The Mason Clinic takes tāngata whaiora (literally, people in pursuit of wellbeing) from the Northern Region and further afield to Taupō for people with intellectual disabilities. The clinic consists of seven forensic mental health inpatient units and an intellectual disability unit that assess, treat, and assist in the recovery of tāngata whaiora and people with intellectual disability who have committed a criminal offence.
These units offer Māori patients, tāngata whaiora, an immersive Māori cultural experience within a recovery-oriented environment where tikanga (traditional Māori customs) and kawa (protocols) such as pōwhiri (welcome), karakia (prayer), and whakawhanaungatanga (relationship building) are observed. This approach builds stronger relationships between tāngata whaiora and clinical and cultural staff of the Mason Clinic and enhances cultural engagement.
On entry to the Mason Clinic, Māori tāngata whaiora are supported to develop personal goals that support their recovery and eventual return to their whānau and community. A personalised package of care comprising both clinical support and cultural enhancement is provided.
The kaupapa Māori units have a proven record of successfully integrating Māori admitted to them back into their whānau and community without subsequent re-admission to the clinic. In 2018, 26 tāngata whaiora were successfully supported through the units and none was re-admitted that year. In comparison, the other units supported 45 Māori individuals over the same period, with only three re-admissions.
This case study demonstrates how mātauranga Māori can maintain distinction and avoid unnecessary fragmentation within a contemporary clinical setting led by a large health provider. But like all facets of the provision of health services for Māori, it requires a team approach that comprises a broad range of expertise, experiences, and cultural capacity.
Several DHBs and researchers are investigating why the Tier 2 system is not consistently delivering equitable outcomes for Māori with a view to identifying how the system needs to change. This will be considered further in Phase Two.

PAGE | 188
NEW ZEALAND HEALTH AND DISABILITY SYSTEM REVIEW | HAUORA MANAAKI KI AOTEAROA WHĀNUI
Rural service delivery Rural disparities are observed in international health data but have not been clearly demonstrated in New Zealand health data.336 New Zealand’s definitions of rurality have been analysed to determine whether the apparent lack of disparity lies, at least in part, with the definition rather than that there is no rural disparity.
Around 40% of people who access rural health services are classified as ‘urban’ and 20% of people classified as ‘rural’ receive urban health care.337 (The classifications are shown in Figure 9.5.) The extent of this mismatch masks any inequality in health care access or outcomes that may exist and hampers research. Rural versus urban disparities in both access to health services and health outcomes are well recognised in other similar countries. It is quite likely these same disparities exist in New Zealand but we don’t have the tools to uncover and describe them.
F I G U R E 9 . 5 : N E W Z E A L A N D U R B A N / R U R A L P R O F I L E ( E X P E R I M E N T A L ) C L A S S I F I C A T I O N C A T E G O R I E S
S O U R C E : S T A T S N Z .
Formal evaluation of rural hospitals is limited. A survey undertaken in 1999 is one of the few pieces of published research. The report of the survey notes: “The diversity of results suggests that New Zealand rural hospital[s] do not fit a homogenous concept”.338
Clearly, the health system needs to have a better understanding of the form, structure, and function of diverse rural hospitals and their contribution to health service delivery and have a strategy for their development.
Difficulties in attracting and retaining the rural health workforce have been highlighted repeatedly.339 While evidence may be limited, discussions and submissions identify that people living in rural areas are concerned about health care access, quality, and workforce.

PAGE | 189
INTERIM REPORT | PŪRONGO MŌ TĒNEI WĀ
With technology, travel and access shouldn’t be a barrier for people to have access to specialist visits more telehealth networking between the primary, secondary and tertiary interface has to occur. It is ludicrous that patient’s travel 5 hours round trip to be seen for a 15 minute apt in a tertiary setting when this could happen with telehealth. (Individual submission)
A submission suggested that success in 2030 would be:
those that live in rural areas of New Zealand do not have to travel hundreds of kilometres and countless hours to receive appropriate healthcare. And when they do that they will not be told when they arrive – “oh sorry your appointment has been cancelled”. Any appointments will also be co-ordinated by the healthcare provider so you are not having to do this very lengthy trip four or five times to see four or five different people. (Individual submission)
Several rural areas are leading the development of new ways of working to better meet the needs of their populations.
Approaches West Coast DHB has developed to resolve issues it faces are summarised in Table 9.2.
The needs of Māori in rural communities is another issue of major interest. Resolving health inequities between Māori and non-Māori in rural areas is a priority. Caution must be exercised in relation to strategies that focus solely on rural needs without considering equity and impacts on Māori. As has been pointed out in an editorial in 2018:
The 2012 Ministry of Health Report Mātātuhi Tuawhenua: Health of Rural Māori provides a comprehensive analysis of the inequities that exist between the health of Māori and non-Māori who live rurally. Not only do a higher proportion of Māori live in rural areas, rural Māori are more likely to live with financial and material hardship than rural non-Māori. Across age groups and health conditions, rural Māori have higher mortality and morbidity and lower life expectancy. The gap between life expectancy of rural Māori and rural non-Māori is greater than the gap between urban Māori and non-Māori life expectancy.
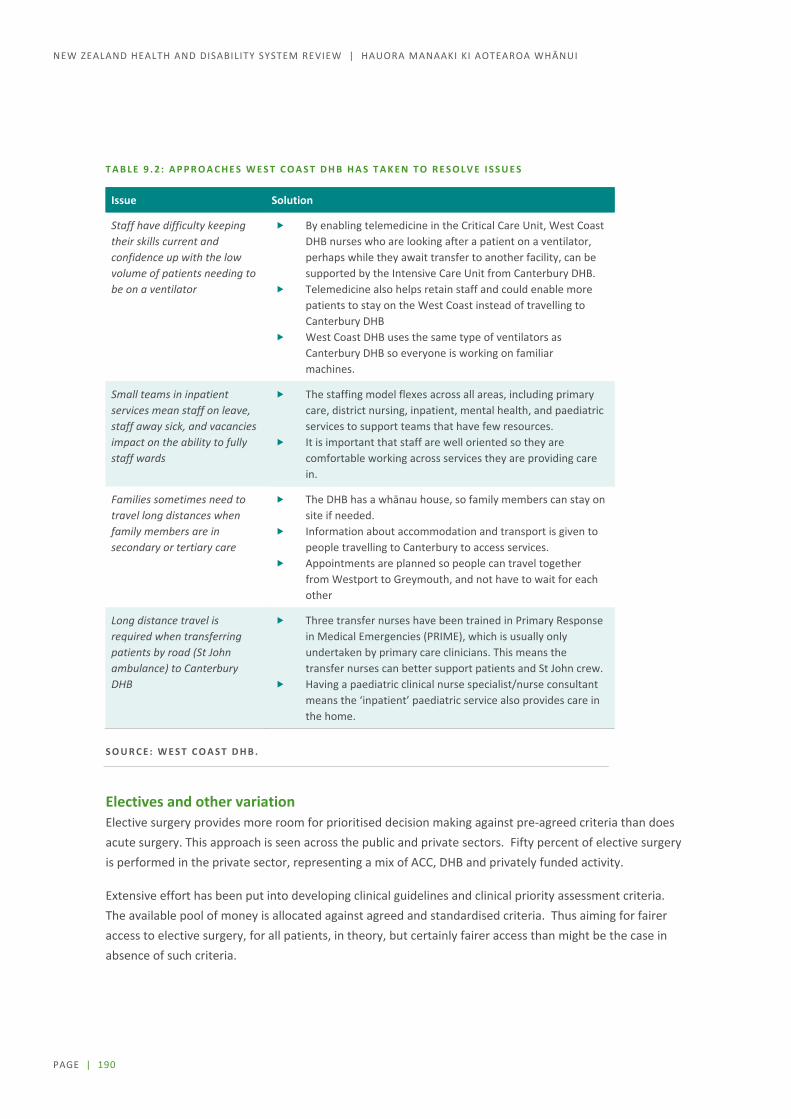
PAGE | 190
NEW ZEALAND HEALTH AND DISABILITY SYSTEM REVIEW | HAUORA MANAAKI KI AOTEAROA WHĀNUI
T A B L E 9 . 2 : A P P R O A C H E S W E S T C O A S T D H B H A S T A K E N T O R E S O L V E I S S U E S
Issue Solution
Staff have difficulty keeping their skills current and confidence up with the low volume of patients needing to be on a ventilator
By enabling telemedicine in the Critical Care Unit, West Coast DHB nurses who are looking after a patient on a ventilator, perhaps while they await transfer to another facility, can be supported by the Intensive Care Unit from Canterbury DHB.
Telemedicine also helps retain staff and could enable more patients to stay on the West Coast instead of travelling to Canterbury DHB
West Coast DHB uses the same type of ventilators as Canterbury DHB so everyone is working on familiar machines.
Small teams in inpatient services mean staff on leave, staff away sick, and vacancies impact on the ability to fully staff wards
The staffing model flexes across all areas, including primary care, district nursing, inpatient, mental health, and paediatric services to support teams that have few resources.
It is important that staff are well oriented so they are comfortable working across services they are providing care in.
Families sometimes need to travel long distances when family members are in secondary or tertiary care
The DHB has a whānau house, so family members can stay on site if needed.
Information about accommodation and transport is given to people travelling to Canterbury to access services.
Appointments are planned so people can travel together from Westport to Greymouth, and not have to wait for each other
Long distance travel is required when transferring patients by road (St John ambulance) to Canterbury DHB
Three transfer nurses have been trained in Primary Response in Medical Emergencies (PRIME), which is usually only undertaken by primary care clinicians. This means the transfer nurses can better support patients and St John crew.
Having a paediatric clinical nurse specialist/nurse consultant means the ‘inpatient’ paediatric service also provides care in the home.
S O U R C E : W E S T C O A S T D H B .
Electives and other variation Elective surgery provides more room for prioritised decision making against pre-agreed criteria than does acute surgery. This approach is seen across the public and private sectors. Fifty percent of elective surgery is performed in the private sector, representing a mix of ACC, DHB and privately funded activity.
Extensive effort has been put into developing clinical guidelines and clinical priority assessment criteria. The available pool of money is allocated against agreed and standardised criteria. Thus aiming for fairer access to elective surgery, for all patients, in theory, but certainly fairer access than might be the case in absence of such criteria.

PAGE | 191
INTERIM REPORT | PŪRONGO MŌ TĒNEI WĀ
Scoring also gives visibility to levels of access to elective surgery. Thus, surgeons and service managers can view the point at which they are operating and then can work through service barriers to further access, which might be access to workforce, finance, or theatres. Moreover, other oversight agencies can investigate the performance of the health sector via this lens.340 The Auditor General, in his annual review, identified from the National Booking System who had received what treatment, at which DHB, with what score, for a variety of conditions including cardiac, gynaecological, and orthopaedic.341
While there is consistency in scoring, the thresholds DHBs use to prioritise surgery, and therefore the degree to which people with the same scoring receive surgery, varies by DHB.
The large number of DHBs in the country and the lack of truly national standards means that access to many services depends on where you live. DHBs will likely dispute this assertion with ‘big picture ‘ snapshots. But it has been the experience of many that they have had difficulty getting on to a public waiting list for hip or knee replacement surgery while their relative or friend with similar (and many times less severe) problems living in another DHB has been swiftly assessed and operated on. This postcode selection should not happen. (Individual submission)
Concerns also exist that the impact of not getting surgery when it is needed can be significant:342
More than half of the 280,000 who require elective surgery but haven’t had it say their quality of life is worse than it was five years ago. A quarter state their quality of life is a lot worse, driven by a lack of mobility and higher levels of pain. … Almost a third of those who require elective surgery have had to make significant lifestyle changes. … Overall waiting times for surgery have increased since 2013. Among those waiting for surgery, waiting times are up by 80 days to 304 days.
There is potential unmet need in the elective surgery domain, potentially contributing to the variation in performance seen across a national picture.
Variation is tracked through several channels, including the HQSC’s New Zealand’s atlas of variation, but no entity is formally accountable for addressing unwarranted variation. Many care passionately about variation and work hard at a service or organisational level to address issues. National initiatives exist around safety concerns such as falls, hand hygiene, and opioid use. Despite this, the HQSC stated:343
New Zealand has a health system that is functioning reasonably well in comparison with other developed countries, but with some areas where improvement is still required. However, as this report has consistently identified since 2015, New Zealand faces issues of inequity and unwarranted variation in the provision of health care. Our health system’s inability to address these issues matters. We cannot continue with current approaches and ignore the lack of progress in these important areas. We need to look for solutions, and although not all are to be found within health services, some are.
PAGE | 192
NEW ZEALAND HEALTH AND DISABILITY SYSTEM REVIEW | HAUORA MANAAKI KI AOTEAROA WHĀNUI
These concerns were echoed in discussions during Phase One, and suggestions were made that further consideration should amongst other things be given to:
the development and use of clinical pathways, guidelines, and standards and accreditation of providers
enhanced data collection to better inform both operational performance and policy decisions. To be useful, data needs to be available in a more timely manner than it is at present
greater sharing and transparency of comparative performance.
Determining priorities and setting standards Consistent with previous reviews, this Review has identified the need for the system to make better informed decisions about what specialist services should be publicly available. There is considerable interest in how to prioritise health spending with constrained budgets, and in face of the increase in new health technologies coupled with some high-profile cases of individuals being denied health services.344
Almost all decisions made in the health sector are, to some extent, prioritisation decisions. We live in an environment of limited resources; not only money, but also time, space, and available staff all constrain the ability of both the system to provide, and people to access, health care services and health promotion programs. Consequently, these resources need to be allocated in some fashion, and unless we allocate them completely randomly - and arguably even then - we are engaging in prioritisation.
As new technologies become available, both in the health sector and other markets, community expectations for the range and level of services are also increasing. Pressure from and expectations of consumers will increase with personalised medicine approaches, which are already being used in other countries for cancer treatment (for example, immunotherapy and theranostics). Technological advances and ongoing research into these techniques is likely to support increased use and adoption of these treatment approaches in the future. A small number of private New Zealand providers offer these treatments to specific cohorts of patients who can afford to pay or who qualify for a research trial (for example, Lu-177 therapy for men with advanced prostate cancer).
While the opportunity for these types of approaches to have an impact on outcomes for patients is significant, early planning is needed on assessment, prioritisation, and innovative funding methods so these approaches support equitable outcomes for the New Zealand population.
Personalised medicine approaches also present an opportunity to enhance a prevention and wellbeing approach by providing tools to identify high-risk populations or individuals (for example, genomic mapping and pharmaco-genomics). This is also likely to support increased early intervention to minimise the impact of disease or disability. Mechanisms to learn from international examples and apply approaches within the local context will also become increasingly important to ensure New Zealanders have access to these advances in therapeutic approaches.

PAGE | 193
INTERIM REPORT | PŪRONGO MŌ TĒNEI WĀ
We heard from DHBs that they face increasing pressure to deliver to these expectations, which is unsustainable now and into the future. DHBs signalled more open discussion is needed with the New Zealand public about the variety and level of services that are clinically and financially sustainable. New Zealand is not new to this debate. The approaches taken so far include the following.
The Core Services Committee, established under the Health and Disability Services Act 1993, set out to establish an explicit list of services that should be publicly funded and the relative priorities of those services.
In the 1990s, the Health Funding Authority took up the mantle of prioritisation of health funding with a think piece setting out a set of weighted decision criteria.345 The authority began developing a process to establish the cost utility of different health activities, although this was not implemented during the authority’s life (1998 to 2000).
Further attempts followed decentralisation of decision making to DHBs in 2000. One initiative was The Best Use of Available Resources, which was trialled over several projects in several DHBs.346 Another was the Service Planning and New Health Intervention Assessment (SPNIA) framework for collaborative decision making established by the National Health Capital Committee, sector clinicians and the National Health Committee. In 2009, the Ministerial Review Group found:347
despite the best efforts of those involved, [the SPNIA] approach has struggled to address the issues raised by the NHC. Shortcomings arise in part because of the way the framework is governed and supported and in part because of the lack of influence over the funding decisions taken in response to its recommendations. For example, an individual DHB is still able to offer a new intervention, with the unavoidable risk of flow on to other DHBs, even if everyone else involved in the process considers that intervention too experimental and not clearly cost-effective.
In 2016, the National Health Committee drafted guidance for economic analysis, but it was not implemented.348 The document set out an approach largely equivalent to PHARMAC’s approach to economic analysis, with a view to looking at services rather than pharmaceuticals, medical devices, or vaccines. The guidance also aligns with the Treasury’s approach to cost–benefit analysis.349
Currently, the system is operating without an overall or common prioritisation framework or a forum for national decision making, except in areas such as pharmaceuticals and national screening initiatives. General guidance on priorities is given to DHBs through the Service Coverage Schedule, which is part of the Crown Funding Agreement. This schedule sets out what services DHBs must provide, at a population level. Strategies such as the New Zealand Health Strategy and He Korowai Oranga – Māori Health Strategy and direction from the centre (for example, the Minister of Health’s annual letter of expectation) also help guide decisions.
Many DHBs have hospital-based health technology assessment processes to guide the introduction of expensive hospital technologies. The committee sitting behind this assessment process scores the evidence for costs and outcomes and the highest scoring proposals are placed on a pathway to funding.

PAGE | 194
NEW ZEALAND HEALTH AND DISABILITY SYSTEM REVIEW | HAUORA MANAAKI KI AOTEAROA WHĀNUI
The Chair has led, for a number of years, the committee that conducts assessments for the four northern DHBs. In 2014, he wrote:350
Here in New Zealand, as elsewhere, that coalface is often the tertiary hospital where caring and eager clinicians are enthusiastic protagonists of novel cutting-edge technology. Where those innovations can potentially improve outcomes whilst reducing costs, they are greeted with open arms. Sadly, a much more common scenario is one where the innovation is an improvement over current therapies but whilst the improvements might be measurable and real (with reduced morbidity and/or mortality rates), the costs are often eye watering when compared with the quantum of improvement. The metric for this, in health technology terms, is the incremental cost-effectiveness ratio (ICER) and it is not uncommon for new technologies to be presented with tentative ICERs of tens of thousands of dollars for every added quality-adjusted life-year.
Internationally – a long history of rationing, guidelines, and health technology assessments Internationally, there are well-known institutions and mechanisms for developing guidelines and approaches to assist with prioritisation and decision making.
The National Institute for Health and Care Excellence (NICE) has high international standing and its cost-effectiveness results are developed under published guidelines and are made available for all to use.351 NICE was established 20 years ago and evolved from initiatives to reduce clinical variation and increase cost-effectiveness of health services. It is now established as a non-departmental public body, to provide advice and guidance on publicly funded health services and interventions for NHS England. It also undertakes some functions for Wales and Scotland and other jurisdictions.
NICE has three key roles.
Pharmaceutical and Technology Assessments - NHS England is legally obliged to fund and resource medicines and treatments recommended by NICE's technology appraisals. The NHS Constitution states that patients have the right to drugs and treatments that have been recommended by NICE for use in the NHS, if their doctor believes they are clinically appropriate.
Medical devices and diagnostics guidance - this guidance evaluates new, innovative medical devices and diagnostics. The guidance helps people in the NHS make efficient, cost-effective and consistent decisions about adopting new medical technologies. It supports innovation, transformation and improves healthcare
Guideline development – NICE guidelines are evidence-based recommendations for health and care in England that set out the care and services suitable for most people with a specific condition or need, and people in particular circumstances or settings. Guidelines have been developed in the following areas; clinical, social care, public health, medicines practice, cancer services and antimicrobial prescribing. In 2018, it published its 500th guidance note.352 NICE’s work programme is expected to shift over the next few years from developing new guidelines to updating those already developed. It may also extend its role to assisting other jurisdictions to contextualise guidelines for local use.

PAGE | 195
INTERIM REPORT | PŪRONGO MŌ TĒNEI WĀ
Other organisations have adopted systematic approaches to the development of guidelines or health technology assessment including:
The Scottish Intercollegiate Guidelines Network (SIGN) was formed in 1993. Its objective is to improve the quality of health care for patients in Scotland by reducing variation in practice and outcome, through the development and dissemination of national clinical guidelines containing recommendations for effective practice based on current evidence.353 SIGN50 is a development tool for practitioners reissued on a regular basis setting out an approach to guidelines.354 SIGN50 includes information about systematic literature review, assessing the quality of evidence, and consultation and peer review. Also, importantly, SIGN50 sets out processes for involving patients and their representatives.
Canada established CADTH, a pan-Canadian Health Technology Assessment not-for profit organisation, in 1997. The scope of CADTH is pharmaceuticals and medical devices, and it provides review, comment, and conclusions rather than recommendations. Economic assessment is a well-accepted component of CADTH’s approach.355
Health technology assessment agencies are used extensively in other parts of the world and garner particular attention from pharmaceutical companies. They tend to have a range of practices that are common (for example, evidenced-based review and an economic component), but differ on some key parameters such as discount rates and the scope of inclusion of health or other social costs.356
While nobody is proposing developing an explicit list of funded services, it is clear that more objective frameworks and transparency in decision making are required to achieve consistency and fairness in the system. During Phase Two, we will consider approaches in international jursidictions for their applicability in the New Zealand context. It is unrealistic to expect a small country like New Zealand to have the capacity to do all this work alone, although it is equally clear that some work would be more effectively undertaken nationally.
Longer-term, comprehensive planning Stakeholders during Phase One signalled support for a long-term health services plan for New Zealand. This included having a long-term plan that guides future decision making about what services should be delivered from where and the need for greater transparency and more informed engagement in discussions about prioritising what services will be publicly funded.
The last major attempt to develop clinical services within a national planning framework was the Long-Term Systems Framework (LTSF) during 2007–2009. The LTSF emerged following the Health Reforms 2001 Research Evaluation and the 2006 Review of the Ministry of Health.357 These reviews identified that system-wide long-term planning was required to meet the immediate and longer-term challenges the health system faces.
Through the process of developing the LTSF, several issues were identified including scope to improve regional collaboration and governance. Collaboration and cooperation were regarded as major enablers for lifting and sustaining system performance.358 Extensive stakeholder engagement was undertaken through 2008 with nine ‘visioning’ workshops involving 260 people from across the sector. Participants at these

PAGE | 196
NEW ZEALAND HEALTH AND DISABILITY SYSTEM REVIEW | HAUORA MANAAKI KI AOTEAROA WHĀNUI
workshops called for “stronger leadership, a shift in focus to the ‘big picture’, a clearer sense of the longer-term direction and a more joined-up system”.359
A significant body of work was undertaken to develop the LTSF, including:
a conceptual framework for the LTSF a horizon scan identifying immediate and future challenges a review of the Service Planning and New Health Intervention Assessment (SPNIA) process and
options to improve it an assessment of service planning and service planning tools and a review of clinical networks.
This thinking was invested in extensively but did not lead to change of any significance. Since that time, clinical networks have become more established, and some regional service planning work is under way. The sector is increasingly calling for a long-term plan to support base service design and business case work for major investments. Currently decisions on major facilities investments are often delayed while work is undertaken on regional and national views of service requirements and questions are answered about what roles different providers should be playing.
Future role of hospitals It is clear that any ongoing work on the development of a long-term plan for Tier 2 services will need to take into account the future role of the hospital, which is likely to be heavily influenced by technological advances in artificial intelligence and robotics and increasing levels of digitisation. The Economist notes that “Many of the physical and mental tasks that doctors perform today will be automated via hardware, software and combinations of both”.360
However, existing hospital facilities are highly complex buildings that, in most cases, have not changed much in the last 50 years. As a result, overlays of technology complicate the situation and reduce the ability to adapt to new ways of doing things.
Other commentators argue that changes in the scope, role, and practice of settings outside the hospital will reduce its role:361
Large hospitals, some of which count as both incumbents and traditional innovators, will also be affected. The rise of telemedicine, predictive analytics and earlier diagnoses of illnesses are expected to reduce admissions ….. The sickest patients can be targeted by specialist services, such as Evolution Health, a firm in Texas that cares for 2m of the most-ill patients across 15 states. It claims to be able to reduce the use of emergency rooms by a fifth, and inpatient stays in hospitals by two-fifths.

PAGE | 197
INTERIM REPORT | PŪRONGO MŌ TĒNEI WĀ
The King’s Fund points to innovations of today as pointers for the future. For instance, the Fund points to a 24-hour telemedicine site that supports patients in rest homes, private homes, and prisons:362
Head north west out of Leeds to the edge of the Yorkshire Dales and you reach Airedale Hospital and the pioneering Telehealth Hub at Airedale NHS Foundation Trust. Specialist nurse and consultant teams at the hospital site run a 24-hour video consultation service for patients and carers in more than 150 nursing and residential homes across the county, in prisons, and with some patients in their own homes.
Through a secure, encrypted video link, staff can see the patient to diagnose, review and assess their conditions, intervene to prevent deterioration, judge future care needs and provide routine follow-up and outpatient services.
This remote delivery of services resulted in a 35% reduction in admissions and a 53% reduction in attendances at Accident and Emergency.363
This connectivity is growing as productivity gains become clearer.
[Joseph Kvedar, MD, vice president of connected health at Partners HealthCare in Massachusetts] again points to the e-ICU as an example of sourcing labor in a centralized location for multiple geographical endpoints. “When you start to think of it that way, it might be a rural or underserved play. It might be an urban play, but it might be a delivery system where it’s just more efficient to put one group of ICU docs in the center and use them that way …. Given the anticipated shortage of intensivists, the e-ICU makes sense. But it’s not limited to physicians. He points to home-health nurses. Making in-person visits, they may see five patients in a day. “But if you put them in a call center and monitor those patients in the home, they can cover 80 to 100 people.”364
Digitisation and robotics will incrementally change the way hospitals operate.365 The effects will be on delivery of care, digital and artificial intelligence to answer patient’s questions, simplified processes such as discharge, automation such as robotics for care and ancillary services (for example, delivering linen and administering pharmaceuticals), and digital way-finder kiosks.366
Decision support for doctors will likely change. Artificial intelligence has already shown itself able to outperform physicians.367, 368 For example, one study found that a deep learning-based algorithm outperformed physicians, including thoracic radiologists, at identifying abnormal results from chest radiographs with major thoracic diseases369. The AI also improved the physician performance when used as a secondary reader.

PAGE | 198
NEW ZEALAND HEALTH AND DISABILITY SYSTEM REVIEW | HAUORA MANAAKI KI AOTEAROA WHĀNUI
There is a note of caution though that before rolling out algorithms robust clinical validation is required.
The risk of faulty algorithms is exponentially higher than that of a single doctor–patient interaction, yet the reward for reducing errors, inefficiencies, and cost is substantial. Accordingly, there cannot be exceptionalism for AI in medicine—it requires rigorous studies, publication of the results in peer-reviewed journals, and clinical validation in a real-world environment, before roll-out and implementation in patient care.
Robotics are used in surgery currently but in very limited situations. In the next 25 years, it is envisioned that robotic surgery will become more clinically relevant, but only if cost-effectiveness and tangible clinical benefits are demonstrated. On this basis, surgical robots for tumour resection may be disrupted by targeted therapies and early intervention.370
Three-dimensional (3D) printing and AI planning approaches are being adopted now to improve surgical outcomes. Current use includes production of 3D models to aid pre-operative planning and preparation and the development of instrument guiding artefacts that enable greater accuracy in prosthetic placement. As the cost of this technology decreases, it is likely to offer more personalised approaches for certain surgical procedures and may overlap with the use of robotic systems for placement of prosthesis in the future.
The King’s Fund goes on to argue that the institutional role of the hospital will change and will become much more collaborative:371
In the health care system of the future, hospitals will still play a major role but are likely to work more collaboratively rather than being standalone institutions. There will be a drive towards working more closely with community, social and primary care services in locally integrated systems to ensure that people are only cared for in hospital when appropriate.
The Future Hospital Commission in the United Kingdom wrote a detailed report in 2013 that is still highly relevant.372 The report draws attention to the need for hospitals to orient themselves around the needs of patients particularly those patients with urgent needs. The report makes several suggestions, recommending a new model of care based around a Medical Division operating across the wider health system, an acute care hub focusing on patients likely to stay less than 48 hours, and a clinical coordination centre backed up by a single electronic health record. The report goes on to recommend seven-day care wherever the patient needs it, including outside the walls of the hospital.
The NHS Chief Medical Officer noted the value of traditional assets such as hospitals will be undermined by other assets such as new institutional arrangements and different technologies. She notes the importance in the future of artificial intelligence, data, and devices.373

PAGE | 199
INTERIM REPORT | PŪRONGO MŌ TĒNEI WĀ
Collaborative and new ways of working Those working in Tier 2 and many submissions acknowledged the need for more collaborative and new ways of working to be adopted. Some are already working differently.
Networked service delivery Work undertaken as part of the Long Term Service Framework included commencing work to develop a Long-Term Health Systems Plan (LTHSP) with a focus on designing clinically and economically sustainable service configuration options for metropolitan, provincial and rural settings. The plan explored the relationships between service configuration, population size, demographic and geographic distribution, topography, access and health outcomes, and macro-service configurations across New Zealand. The plan was premised on the following changes in service settings that have been emerging internationally and in New Zealand:
increased health care at home ‘community health centres’ to provide one-stop-shops, including specialist outpatient services and
diagnostic support ‘local hospitals’ for emergency medicine and non-complex services ‘major acute hospitals’ for complex emergency medicine and complex inpatient care.
The LTHSP recognised that hospitals are not stand alone entities and need to be seen within a larger network. In other jurisdictions, networking of hospitals is more common than here, with some highly specialised services being consolidated in centres of excellence to ensure a critical mass of patient numbers.
A hub and spoke model is an approach being adopted to configuring services across tertiary, secondary and community settings, increasingly supported by telemedicine. An example of this is the Intermountain hospital network, which includes a virtual hospital.

PAGE | 200
NEW ZEALAND HEALTH AND DISABILITY SYSTEM REVIEW | HAUORA MANAAKI KI AOTEAROA WHĀNUI
I N T E R M O U N T A I N H O S P I T A L N E T W O R K
Intermountain Healthcare provides community and hospital services for around 870,000 members across six states in the United States. It runs a network of 24 hospitals, including:
Intermountain Medical Centre, which delivers specialist services for all member and general services for those living in Salt Lake City
other specialist hospitals, including Primary Children’s Hospital and Orthopedic Specialty Hospital community hospitals that support local delivery Connect Pro, which is a virtual hospital that supports services delivered in all hospitals life flight air ambulance and road ambulance services (all calls and retrievals are coordinated
through Connect Pro) Intermountain Simulation Center and 10 laboratories spread throughout Utah that support training
for thousands of hospital, homecare, and clinic professionals every year.
All facilities use a common information system and care models, and most equipment and supplies are consistent across the network. Connect Pro plays a key role in supporting the delivery of local services, including support for after-hours services.
An indication of the range of services provided by Connect Pro is set out below along with the some of the outcomes achieved.
Some initiatives enable patients to be treated in their local hospital rather than requiring transfer.
Hospitalist Team: Internal medicine physicians provide virtual support to rural hospitals particularly on night shifts. They work closely with nurse practitioners and hospital assistants who are working to a high-quality inpatient plan that is handed to the local team in the morning. This approach is reported to have helped with rostering and burnout issues.
Critical Care Team: This team is linked to around 300 beds, enabling some high acuity patients to receive high quality care without being transferred. Transfers have been avoided and mortality rates have reduced. More patients are staying closer to home and improved reduced mortality by 33%.
The service delivery model is underpinned by a core of dedicated staff who work solely at the virtual hospital. Specialists and staff from Intermountain Medical Center are rostered to the virtual hospital. Connect Pro also provides an interpreter service for Intermountain Medical Center and other locations and has a close working relationship with primary care help line services.

PAGE | 201
INTERIM REPORT | PŪRONGO MŌ TĒNEI WĀ
Concerns were raised that approaches like that of the Intermountain Hospital Network may not work as well in a sparsely populated country and may result in long travel distances for some populations or poorer access to services. However, child cancer services are an area successfully using a networked model to deliver services.
C H I L D C A N C E R S E R V I C E S
In child cancer evidence shows that New Zealand’s national model for cancer care is delivering equitable and high-quality care. New Zealand’s three-year survival rate is comparable with Australia’s over a similar period (2004–2014). Further, no statistically significant differences in survival exist by ethnicity, urban/rural location, and socioeconomic status .(see Figure 9.6).
F I G U R E 9 . 6 : T H R E E - Y E A R C H I L D C A N C E R S U R V I V A L R A T E S B Y D E M O G R A P H I C I N D I C A T O R S
( S E X , E T H N I C I T Y , S O C I O E C O N O M I C S T A T U S , D O M I C I L E )
Note: The figure relates to 764 children diagnosed with cancer from 2010 to 2014 (with follow-up to 31 December 2017). All 95% confidence intervals overlap.
Source: S Macfarlane. 2019. Shared care is fair care: Our national model for child cancer services delivers equitable and high quality care. Cancer at a Crossroads conference, Ministry of Health and University of Otago, 31 January to 1 February 2019, Wellington. https://www.otago.ac.nz/cancer-care/otago706575.html
The success of the national model has been attributed to: having a national child cancer plan and a national child cancer network effective governance established and specific working groups clinical and non-government organisation collaboration data being captured effectively, cross-referenced with the New Zealand Cancer Register, regularly
reported, and available to support research activity nationally consistent protocols and guidelines trials-driven care a shared care model between specialist cancer centres and shared care centres, which is
monitored on a three-year cycle as a part of service agreements.
85.5%
84.9%
86.1%
82.3%
82.7%
87.0%
83.2%
88.6%
83.9%
86.4%
84.6%
0.0% 20.0% 40.0% 60.0% 80.0% 100.0%
All children
Male
Female
Māori
Pacific
Non-Māori /Non-Pacific
Most deprived
Average deprivation
Least deprived
Akl/Chch domicile
Outside Akl/Chch domicile
relative survival

PAGE | 202
NEW ZEALAND HEALTH AND DISABILITY SYSTEM REVIEW | HAUORA MANAAKI KI AOTEAROA WHĀNUI
Tier 1 and Tier 2 integration DHBs are thinking beyond hospitals to health systems. Canterbury Health has focused on integrating its health system, particularly in the context of the earthquake and the subsequent impetus to change. The King’s Fund makes the following observations on its website.374
The stimulus for change in Canterbury was a health system that was under pressure and beginning to look unsustainable.
Canterbury adds to the small stock of examples of organisations and systems that have made the transition from fragmented care towards integrated care with a degree of measurable success.
Creating a new system takes time – Canterbury has been working to create ‘one system, one budget' for at least six years and the journey is far from complete.
It takes many people to transform a system. A small number of leaders were at the heart of Canterbury's transformation, but this leadership rapidly became collective, shared, and distributed.
The Hawke’s Bay DHB’s clinical services plan emphasises a different way of working, particularly in the community and in areas of particular need.375 The DHB makes a commitment to co-design, to focus on localised health planning (for instance in Wairoa) and, subtly, to distinguish provision of management of medical conditions from place of provision. This distinction supports teams to think laterally across secondary, primary, and community care. The DHB emphasises the need for inter-professional working.
Many hospital and specialist services are also actively engaging with Tier 1 providers to better manage the care of chronic and complex patients, particularly around transitions of care. An example of this, the Fanau Ola model of care, is overviewed.
F A N A U O L A M O D E L O F C A R E A T C O U N T I E S M A N U K A U A N D C A P I T A L & C O A S T D H B S
The Fanau Ola model of care is a nurse-led model that supports and re-engages Pacific patients with their primary healthcare team. The model provides assessment within hospital and home settings, liaison with primary healthcare teams, and working partnerships with the patient in managing their health conditions and psychosocial issues. This service is effective because it uses a Pacific nurse and Pacific social worker case management model and takes a family approach that can be delivered in Pacific languages.
An example in a community setting is the parish community nurse model of care. This is a team approach with a registered nurse and a community support worker. The model ensures the registered nurse and community support worker can speak the language of the churches they work for cultural alignment and language proficiency. This model provides health promotion, self-management, navigation, screening, assessment, and some health services. The team connects parishioners with primary and secondary healthcare services and advocates their health needs with healthcare providers. This model of care establishes health committees within churches and designs the delivery of health services based on what the church identifies as its priorities.
PAGE | 203
INTERIM REPORT | PŪRONGO MŌ TĒNEI WĀ
DHBs are working hard to counter demand growth through several means Bed days have not grown as fast as discharges – only a 1% increase from 3.17 million bed days in 2013/14 to 3.21 million in 2017/18 – reflecting more recent efforts to reduce the length of time patients stay in hospital. Hospitals are seeking to improve patient flow within their walls as well as to provide better and quicker access to community rehabilitation options and to implement surgical productivity initiatives and programmes to enhance recovery after theatre.
Overall, it would seem this reduction in bed days has not been at the expense of quality of care, although performance varies across DHBs. Readmission rates are a balancing quality measure for reduced length of stay. Readmission rates have remained static over the last three years (12.1% in the year to September 2016, 12.2% in the year to September 2017, and 12.1% in the year to September 2018).376 This static rate compared with the decreasing average hospital stay indicates the DHBs’ models of care are, overall, on the right track.
Many initiatives at national and local levels aim to improve the operation of hospitals. DHB-based initiatives include hospital efficiency programmes and programmes extending into primary and community care. Two examples of efficiency programmes that have been run under the banner of patient flow are as follows:
Releasing Time to Care aimed to make workflows more efficient, thus releasing nurse time to care for patients. A New Zealand review noted that productivity gains of up to 20% were being achieved, although there was a great deal of variation in implementation.377
The Productive Operating Theatre aimed to improve use of and outcomes from surgical theatres. It identifies core processes such as booking systems through to pre- and post-theatre processes. It uses standard measures such as ‘wheels in and wheels out’ (of theatre), so theatres can be compared. This programme is complicated to implement and has more varied outcomes.
These productivity programmes and programmes such as ‘red to green’ to identify wasted patient time are standard hospital management practice.378
DHBs have also been outsourcing to private hospitals to keep up with elective service demand, which in turn provides a buffer for growth in acute services. These operations are generally for patients with lower acuity and for operations that can be planned, rather than acute presentations.
Reporting on private hospital activity is limited, but analysis of DHB-supplied data shows that the DHBs have been outsourcing around 5% to 7% of elective and arranged surgical discharges, with this accounting for around 16,000 discharges in 2017/18. In volume terms, there was a 50% increase in the number of outsourced surgeries from around 10,600 in 2013/14 to around 16,500 in 2017/18. There was a 20% increase in each of the last two years across a mix of day case and inpatient discharges.
DHBs have tended to use private hospitals as a mechanism to manage short- or medium-term capacity issues. Outsourcing has been used when DHBs have been under pressure to meet elective surgical or screening targets. Where DHBs have taken a more considered medium-term approach, this has been shown to have a positive impact on elective performance. However, there is limited evidence of any long-term strategic relationships or engagement in capacity planning for workforce or facilities across the private and public sector.

PAGE | 204
NEW ZEALAND HEALTH AND DISABILITY SYSTEM REVIEW | HAUORA MANAAKI KI AOTEAROA WHĀNUI
Workforce
Specialism compared with generalism A growing challenge for the health system is balancing specialism with generalism. There is a renewed acknowledgement that as the population ages and more people present with undifferentiated illness and multiple chronic disease, most hospitals will require strong generalist medicine. The term ‘generalist’ can be interpreted widely and may include general practitioners, general medicine specialists, and general disciplines such as geriatrics. For the purposes of this discussion, the term generalist includes vocationally registered doctors in secondary care who work with the undifferentiated patient within their discipline.379
The Royal Australasian College of Physician’s Māori Health Committee noted that, for Māori, generalism is often a preferred patient pathway. Subspecialism entails multiple patient interactions with health professionals, limiting the opportunity to establish rapport. The committee noted that “Experience with Māori patients has shown that referring [them] on to sub specialist care may result in Māori not presenting at the clinic and consequently not receiving ongoing care”.380
In contrast, the number of subspecialties over the past 60 or more years has substantially increased. The Royal Australasian College of Physicians now has 24 recognised subspecialties, and the Royal College of Surgeons lists nine surgical subspecialties. Anaesthesia has separated into anaesthetics and intensive care medicine colleges. Emergency medicine has developed as its own college.
Clearly, a need exists for the highly focused knowledge, expertise, and skill that subspecialists offer. As the Council of Medical Colleges noted, certain patients benefit from seeing a subspecialist as early as possible. However, the Council goes on to note:381
for the undifferentiated condition early referral or presentation to a sub specialist is likely to waste resources; and may risk premature closure on diagnosis and treatment that will disadvantage the patient. Also, as the population ages and more people present multiple system disease, highly skilled sub specialists may lack the currency to accurately diagnose and manage important co-morbidities..
Clinical workforces are expensive, and medical workforces are even more expensive. Senior medical officers spend relatively less time with patients as, over the years, employment conditions have changed with longer annual leave periods (five weeks), time for study (including a substantial training and travel budget), and assigned non-clinical time. Analysis of the accounts of a typical DHB suggests hospital costs have grown 20% over a five-year period, against funding growth of around 10%. Medical staff costs are by far the largest category of cost increase at just over 45%. Spending on information technology and non-clinical supplies increased by only 5%.
Other employment conditions are changing with increased and indirect costs on DHBs. For instance, in the last round of negotiations with resident medical officers, the required changes to rostering arrangements increased the number of staff needed to provide a roster as well as placing pressure on other members of the clinical team, in particular senior medical officers, while increasing patient handovers and the work needed to maintain continuity of care.382

PAGE | 205
INTERIM REPORT | PŪRONGO MŌ TĒNEI WĀ
“We have received data from five DHBs which indicates that to achieve full implementation they will require over 200 new RMOs [resident medical officers], at a cost of over 25 million dollars,” the report [by Sapere Research Group] said. It adds when other hospitals offering highly specialised services were taken into account, “it is likely that the national impact will be approximately 300 full-time equivalent RMOs, at a cost of more than 35 million dollars.”383
Other workforce challenges Other Tier 2 workforce challenges were raised included:
Training models have changed little over the last 20 years, and it is now proving challenging to find enough placements and supervisors for the growing number of undergraduate and postgraduate clinical placements required to grow the workforce of the future. Registration requirements have generally been increasing, which means training periods are extending for several workforce groups.
Shortages are being felt acutely in some professional groups and in some locations. Several submissions called for better workforce planning to address shortages and to enable the workforce to achieve a better work–life balance.
Challenges associated with growing new workforces was also raised, with many hurdles faced in working with regulatory bodies and tertiary institutions on this
There is some competition for workforce between the public and private sectors. In some instance it is argued that the private sector offers more favourable employment conditions (for example private physiotherapists and surgeons) and in other instances it is argued that the more favourable conditions are in the public sector (for example nurses and care assistants). Either way this potentially creates competition and tension, particularly when there are workforce shortages.
There is increasing pressure for a greater range of services to be delivered for extended hours and during weekends. This will require additional workforce rather than expecting the current workforce to simply work more hours. DHBs report the current mix of employment agreements and the specificity of terms included in them makes it challenging to make even small changes in working arrangements (for example, extending theatres by one hour per day requires discussion with multiple unions). A more strategic way of engaging with unions will be required to effect the changes likely to be required.
These issues are discussed further in Chapter 11: Workforce.

PAGE | 206
NEW ZEALAND HEALTH AND DISABILITY SYSTEM REVIEW | HAUORA MANAAKI KI AOTEAROA WHĀNUI
Directions for change: Tier 2 The need for high-performing Tier 2 services will continue to grow for the foreseeable future, as the burden of chronic disease grows and the number of people living longer with multiple comorbidities increases. This will include the need for both hospital-based services and specialist services delivered in outpatient, community, and virtual care settings.
B E T T E R P L A N N I N G
The Panel is strongly of the view that a nationwide long-term health service plan needs to be developed and refreshed regularly. This plan would address which services should be provided nationally, regionally and locally.
Further analysis is needed to determine the level of specificity this plan should include, but it needs to be able to inform and guide investment and disinvestment decisions across workforce, digital technologies, facilities, and other infrastructure.
Q U A L I T Y I M P R O V E M E N T
The Panel believes that continuous quality improvement needs to become a much more prominent driver of service design and delivery. Achieving this will require more transparency and sharing of information about variation in performance, quality, and outcomes with providers and consumers. Clinical leadership, in both design and implementation, will be essential, as will be the need to respect and incorporate cultural values and consumer input.
The system will need to become more transparent and evidence-based, leveraging international thinking where appropriate, to improve decision making regarding what and where new investment and disinvestment should occur.
A N E T W O R K E D S Y S T E M
It will be essential, in the future, that all hospitals and specialist services operate as a cohesive network on behalf of the patient and the system, with clearly differentiated responsibilities as appropriate.
For the system to become more responsive to consumer expectations, hospitals and specialist services will increasingly need to function on a 24/7 or extended hours basis for a wider range of services.
Rural Tier 2 service delivery models will need to be supported by enhanced remote access to specialist services, enabling a wider variety of planned services to be accessed locally. The system also needs to be designed to reduce the need for patients to travel to outpatient clinic appointments and to better support generalist-led models of care for rural communities.

PAGE | 207
INTERIM REPORT | PŪRONGO MŌ TĒNEI WĀ
Section D: Enablers / Ngā rawa e tika ai te pūnaha
NEW ZEALAND HEALTH AND DISABILITY SYSTEM REVIEW | HAUORA MANAAKI KI AOTEAROA WHĀNU I
PAGE | 208 PAGE | 208
10 System enablers overview / Tirohanga whānui ki ngā rawa e tika ai te pūnaha
Society and business models are changing Over the past 15 years the way people interact, work, socialise, and go about their day-to-day business has been dramatically affected by changes in the digital landscape.
The internet has transformed the way people engage with services – instead of physical building-based services, such as banking and retail, the smartphone has become the medium of choice for connecting, finding information, doing business, and engaging with online content and entertainment. Customers now have high expectations of accessing what they want, when they want – with convenience, reliability, and security – and healthcare and disability support is no exception.
New Zealand consumers have generally been fast adopters of technology with relatively high internet use and uptake of mobile devices (Figure 10.1).
One of the constraints on uptake in New Zealand has been network coverage. The continued expansion of the rural broadband initiative in New Zealand is projecting that 99.8% of the population (including 271 marae) will have access to enhanced broadband by 2023 and mobile coverage across the country will be improved.

PAGE | 209
INTERIM REPORT | PŪRONGO MŌ TĒNEI WĀ
F I G U R E 1 0 . 1 : T E C H N O L O G Y A D O P T I O N A S A T 2 0 1 9
S O U R C E : D A T A F R O M K E P I O S , W E A R E S O C I A L A N D H O O T S U I T E 2 0 1 9 .
Consumers and business worldwide are increasing their use of digital technologies. While technology has supported the development of disruptive business models such as online hospitality service brokerage companies (such as Airbnb) and peer-to-peer ridesharing (such as Uber), it has also supported the growth and transformation of a wide variety of existing businesses. Technology is playing an increasingly important role in many service industries, allowing routine tasks to be automated and big datasets to be created and analysed. Such datasets are increasingly supported by artificial intelligence, providing insights into customer preferences, requirements, and trends that inform business performance and planning.
What technology changes mean for health Numerous commentators have discussed the transformative role that digital technologies will play in the health sector. Some see these technologies as simply a natural business-as-usual progression for a sector that is clinically driven with a high use of diagnostic and clinical systems already. Others are concerned about the disruption and the ethical and governance challenges that may result. Many are optimistic:384
If any industry has more to gain and less to fear from robotics, cognitive augmentation, digital disruption, and artificial intelligence, it is healthcare. The powerful combination of data and analytics is fuelling precision and personalized medicine and pushing genomics to new scientific frontiers.

NEW ZEALAND HEALTH AND DISABILITY SYSTEM REVIEW | HAUORA MANAAKI KI AOTEAROA WHĀNUI
PAGE | 210
An extensive review completed for the NHS in the United Kingdom projected that:385
genomics, digital medicine and artificial intelligence will have a major impact on patient care … … and … have the potential … to empower individuals to be more informed about their care, and to allow them to work together with healthcare staff to make treatment decisions.
Technology will continue to transform the health and disability workplace as it has done in other sectors by disrupting traditional jobs through innovative business design, making obsolete old technologies and their workforces and creating jobs that did not exist 15 years ago (such as mobile app developer, social media manager, data scientist, and user experience designer).
As noted throughout this report, this transformation requires not only more information sharing but the efficient, timely, and effective use of data to improve service delivery and patient outcomes.
Research shows that the future of health will likely include (and, in some cases, is already starting to include):
a growth in virtual healthcare to better enable clinical care, particularly for people in remote or rural locations and people with limited mobility or a lack of transport (for example, virtual fracture clinics that provide access to orthopaedic specialists)
a greater reliance on artificial intelligence and machine learning in diagnostics (for example, breast cancer screening), disease prevention, drug discovery, and patient care – some predictions estimate artificial intelligence in the medical imaging space alone will be a $1 billion global market by 2022
a significant investment and uptake in digital health technologies, including telehealth, personal and wearable devices, and mobile health technologies (for example, remote heart monitoring) that will massively increase the volume and types of data being captured as well as raising new privacy and ethical challenges
greater use of augmented reality and robotics for surgery (for example, robotic arm-driven colonoscopies)
a decrease in the cost of genomics and targeted treatments and an increase in their use (for example, the use of polygenic risk scores for long-term chronic diseases)
an increase in digitisation of health records, requiring interoperable systems across multiple providers and organisations to build a single, longitudinal, whole-of-life view of the patient that can be accessed from a variety of locations
the growth in value-based health, where outcomes are measured in terms of health and wellbeing as well as GDP
While the speed and potential impact of the variety of digital technology advances are uncertain, many of the technologies are starting to be used in New Zealand already. Planning for workforce, digital and data, and facilities and equipment needs to consider these advances.

PAGE | 211
INTERIM REPORT | PŪRONGO MŌ TĒNEI WĀ
Workforce Many of the projected digital changes have the potential to free up staff to spend more time caring for patients and to more effectively utilise their skills and training. Most jobs will require digital skills, and people will need enhanced digital literacy at all levels in organisations. Digital healthcare will be critical to the delivery of the service changes discussed in chapters 5–9, supporting service providers and consumers and their whānau and carers to engage with the system in different ways than they do today.
While digital solutions are a key means by which time can be released for caring, it is equally clear that on their own they cannot address the workforce challenges New Zealand and global healthcare markets are facing.
New Zealand has a dedicated and highly capable workforce, but current workforce and training models are not sustainable. Workforce pressures are significant and need to be addressed urgently. Better planning for future supply, recognising the changing nature of work, is essential. This requires more deliberate thinking about how the current workforce is used and the new roles required, so all New Zealanders can receive excellent care and be engaged in decisions about their own health. A number of stakeholders also identified the need to review workforce training and development and to clarify the accountabilities of the many parties engaged in workforce planning and training.
As one of the largest employers in the country, the health and disability system could do more to improve the wellbeing of those working in the sector, to employ a workforce that reflects the country’s diverse communities, and to ensure Māori, Pacific, and disabled people are employed in different roles and at different levels in the system. Discussions also highlighted that success was often because of the commitment and leadership of key individuals. Strengthened leadership and management are critical to enhancing the system’s overall performance.
The people working in the system are committed and loyal to the organisation they work for and their profession or discipline. There have been suggestions though that there is a need for culture change and more collaborative working if the system is to deliver more equitable health outcomes and improved wellbeing for all New Zealanders.
Workforce issues are discussed further in chapter 11.
Digital and data Underpinning many of the digital technology trends is the generation, transmission, and storage (often distributed) of machine-readable data. Real-time access to standardised datasets that can be linked virtually will give clinicians access to more complete patient information more quickly from any location, enabling them to, for example, work more efficiently and effectively, track and monitor performance, plan the future workforce more robustly, and build evidence of what works. Enhanced digital literacy, data stewardship, cyber-security, and ethical frameworks will also be needed to guide the use of these datasets, for example, in genomics and artificial intelligence.

NEW ZEALAND HEALTH AND DISABILITY SYSTEM REVIEW | HAUORA MANAAKI KI AOTEAROA WHĀNUI
PAGE | 212
Health systems worldwide are assessing their readiness for a digital future. New Zealand is lagging behind other countries with limited interoperability of systems and a lack of national data standards. Much of the data the system generates is treated as a by-product of clinical processes and is not used to its full potential.
The vendor landscape is fragmented, with too many customised legacy systems that do not meet global interoperability or cyber standards. Investment in information technologies has been low, and core foundation work will be required before the health and disability system can generate the potential gains from operating a more digitally enabled system.
In planning for a more digitally enabled health system, consideration will also need to be given to:
how such a system will support more equitable health outcomes data privacy and stewardship including data sovereignty procurement and investment decision-making processes workforce and capability.
Digital and data issues are discussed further in chapter 12.
Facilities and equipment The third key enabler for the health and disability system is facilities and equipment. Demographic pressures, technology advances and model of care changes mean that facilities design will need to change and additional capacity will also likely be required. It is also expected that the trend for access to enhanced clinical equipment to support service delivery will continue. Advances in technology are making some equipment more mobile and are supporting virtual service delivery and remote monitoring in a wider range of settings.
Significant capital investment will be required over the next ten years to support these changes and address issues associated with assets that have not been adequately maintained and/or are not fit for purpose. Capital investment decisions can shape how services are delivered for many years and should be aligned with a long-term health services plan. These plans should be considered more routinely alongside local government, education, and transport planning.
The scale and nature of capital programmes that have been signalled in capital intentions for the next 10 years plus, suggests that the system will need:
a prioritised, robust pipeline that will deliver the medium and longer term service requirements. more robust processes than are currently in place to make investment decisions, manage capital
projects and maintain assets.
Facilities and equipment issues are discussed further in chapter 13.

PAGE | 213
INTERIM REPORT | PŪRONGO MŌ TĒNEI WĀ
11 Workforce / Te tira kaimahi
The people who make up the health and disability workforce are the backbone of the health system. For the most part, they are a passionate, hard-working, kind, and caring group who go above and beyond to improve the health and wellbeing of New Zealanders. This was apparent in Phase One discussions and was reinforced through submissions. Many feel the ‘system’ does not support them to work to their potential, and stress levels are high.
This section looks at the make-up of the current workforce, recognising that the health and disability sector employs more people than any other. It considers the difficulties involved in workforce planning and the changes which will be necessary if skills shortages now and in the future are to be addressed. If the workforce of the future is to be more representative of the community it is serving, changes will be needed in training, regulation and recruitment. New ways of working will be necessary and working arrangements which combine increased flexibility with better work/life balance will be a challenge.
Overview of the workforce
The health and disability sector is a large employer The health and disability sector employs about 220,000 people or about 8.5% of New Zealand’s total workforce – it is the single largest sector employer in the country.386 About 34% are employed by DHBs and 66% work in non-DHB roles, such as for private hospitals, residential homes for people with disabilities and rest homes (Figure 11.1). In many places, the DHB is among the largest employers in the region. In addition, volunteers and unpaid family and whānau carers play an important role in the health and disability system.
Clinical staff (staff engaged directly in the care of people) make up 66% of the health and disability workforce. Personal carers and assistants (23% of the workforce) and nurses and midwives (21%) are the largest groups and the medical group is the smallest (6%).

NEW ZEALAND HEALTH AND DISABILITY SYSTEM REVIEW | HAUORA MANAAKI KI AOTEAROA WHĀNUI
PAGE | 214
F I G U R E 1 1 . 1 : P E O P L E I N T H E N E W Z E A L A N D H E A L T H A N D D I S A B I L I T Y W O R K F O R C E
S O U R C E : C E N S U S 2 0 1 3 ; S T A T S N Z Q U A R T E R L Y E M P L O Y M E N T S U R V E Y M A R C H 2 0 1 9 ; T A S D H B E M P L O Y E D W O R K F O R C E Q U A R T E R L Y R E P O R T T O M A R C H 2 0 1 9 ; 2 0 1 9 A N N U A L R E P O R T S O N R E G I S T E R E D H E A L T H P R A C T I T I O N E R S .
The mix of workforce groups employed varies between the segments of the health and disability system, for example nurses and midwives make up 40% of hospital staff, but only 13% of Tier 1 staff. Personal carers and assistants make up just over half of aged care staff.
Analysis of data that is available for regulated health workforces show that approximately 40% are working in private settings, most of which are likely to be receiving some public funding from either Health or through ACC. Some staff work in dual practices (public and private). This has potential benefits for the system in terms of additional capacity, more choice for patients (particularly those with private health insurance), and increases the attractiveness of working in New Zealand. However, there are potential challenges around conflicts of interest, staff availability to train junior staff, pay equity, geographical coverage, and compounding skill shortages. Some professions such as dentistry and optometry are largely paid for directly by consumers and are a mixture of owner–operators and employees.

INTERIM REPORT | PŪRONGO MŌ TĒNEI WĀ
PAGE | 215
There are few restrictions on where people can work, and the terms and conditions of employment can differ markedly between employers.
F I G U R E 1 1 . 2 : P R I V A T E – P U B L I C S P L I T O F T H E R E G U L A T E D H E A L T H W O R K F O R C E
S O U R C E : M I N I S T R Y O F H E A L T H ( R E S P O N S I B L E A U T H O R I T I E S W O R K F O R C E S U R V E Y S ) A N D C E N T R A L R E G I O N T E C H N I C A L A D V I S O R Y S E R V I C E S ( H E A L T H W O R K F O R C E I N F O R M A T I O N P R O G R A M M E ) .
Workforce shortages exist Persistent workforce shortages exist in several areas (for example, in midwifery, sonography, and clinical psychology and in rural areas) and other areas have more recent workforce shortages (such as data science). In addition, a significant number of extra people will be required to address high turnover rates and potentially high retirement rates in some workforces (for example, general practice).

NEW ZEALAND HEALTH AND DISABILITY SYSTEM REVIEW | HAUORA MANAAKI KI AOTEAROA WHĀNUI
PAGE | 216
We cannot recruit enough clinical staff, putting all staff in the practice under pressure. (Individual submission)
…the current estimated workforce shortage of approximately 1000 specialists is projected to continue and indications are that for most specialties the gap between the specialist workforce capacity and health service need will widen by 2028. This ‘service gap’ may include longer waiting times for specialist assessments, longer waits for treatment, higher thresholds for accessing services, continuing high levels of burnout among specialists, increased pressures to displace critical non-clinical work such as training and continuing education, and missed opportunities to apply specialists’ experience and expertise to develop more innovative and efficient models of care. (Organisation submission)
In some places, these shortages are already impacting on wait times and the quality of patient care. Also, some staff are shouldering additional workloads and may be working longer hours or rosters than are safe and may not be able to take the leave that they request.
Workforce projections suggest the current model is unsustainable Projecting health workforce demand is challenging, particularly as current roles change and new roles emerge. New Zealand’s ageing population with more complex needs is increasing the demand for health services. This will put pressure on the system as demand for service grows at a time when proportionally fewer people are expected to be in the workforce.
F I G U R E 1 1 . 3 : P E R C E N T A G E C H A N G E S I N T H E T O T A L A N D H E A L T H A N D D I S A B I L I T Y W O R K F O R C E S
A N N U A L L Y , 2 0 0 1 – 2 0 1 7
S O U R C E : S T A T S N Z ( L I N K E D E M P L O Y E R - E M P L O Y E E D A T A ) .
The considerable debate over workforce forecasting methodologies will need to be addressed in Phase Two of the Review. However, for the purposes of this initial analysis, a simplistic approach has been used of projecting future workforce based on historical growth rates in the total health and disability workforce and the total New Zealand workforce.
-10%
-5%
0%
5%
10%
15%
20%
2001 2003 2005 2007 2009 2011 2013 2015 2017
Health & disability workforce Total workforce

INTERIM REPORT | PŪRONGO MŌ TĒNEI WĀ
PAGE | 217
For the past 20 years, the health and disability workforce has consistently grown, usually by 2% to 4% annually, and, in most years, has exceeded overall workforce growth. Projecting forward based on historical growth rates suggests an additional 76,000 health workers will be required between 2020 and 2030, around 6,500 to 8,600 additional workers annually. Based on these projections, the health and disability system would employ around 22% of the ‘new’ workforce and would account for 10% of the total workforce by 2030. This is in addition to hires to replace existing staff who retire or leave the system each year. An attrition rate of around 4% (which is a low estimate) would require a doubling of workforce hires.
Historically, New Zealand has been a net importer of workforce. OECD data shows that New Zealand’s reliance on international or overseas-qualified doctors and nurses is high: 42% of doctors in New Zealand are overseas trained (the second highest in the OECD) and 26% of nurses (the highest in the OECD).387 While this has been the case for many years, a global workforce shortage of around 15 million (18% of the total global health workforce) is forecast by 2030. This may make it challenging to maintain this workforce supply source and may make it more attractive for our New Zealand–trained workforce to work internationally.
While the analysis above is simplistic, it is likely that it understates, rather than overstates, the workforce supply challenge. A 2019 United Kingdom based analysis concluded that “Workforce challenges are currently the biggest threat facing the health service and are already having significant consequences for both patients and staff”.388 The issue is clearly also significant for New Zealand, indicating that current workforce and training models are not sustainable.
Current system arrangements
Legislation Employees in the health and disability workforce are governed by the same legislation as other New Zealand employees; for example, by the Employment Relations Act 2000, the Holidays Act 2003, the Minimum Wage Act 1983, the Parental Leave and Employment Protection Act 1987, the Health and Safety at Work Act 2015, the Human Rights Act 1993, and the Privacy Act 1993.
In addition there are a number of acts and regulations specific to the health and disability workforce. For example:
The Health Practitioners Competence Assurance Act 2003 sets out the mechanisms that require that health practitioners are competent and fit to practice.
The Code of Health and Disability Services Consumers’ Rights requires regulated and non-regulated workforces to provide services at an appropriate standard and establishes the role of the Health and Disability Commissioner in promoting and protecting those rights and resolving complaints.389
The New Zealand Public Health and Disability Act 2000 sets out the roles of the main players, such as the Minister of Health.
The Health Act 1956 sets out the roles and responsibilities of individuals to safeguard public health, including those of the Minister of Health, the Director of Public Health, and designated officers for public health.

NEW ZEALAND HEALTH AND DISABILITY SYSTEM REVIEW | HAUORA MANAAKI KI AOTEAROA WHĀNUI
PAGE | 218
The Mental Health (Compulsory Assessment and Treatment) Act 1992 defines when the Director of Area Mental Health Services, medical practitioners, and nurses can require people to undergo compulsory psychiatric assessment and treatment and protects their rights.
Oversight Oversight responsibilities are spread across multiple entities. Health Workforce New Zealand (HWNZ) is an independent committee established under Section 11 of the New Zealand Public Health and Disability Act 2000 reporting directly to the Minister. The Committee was established in 2009 to provide strategic leadership for a sector-wide response to New Zealand’s workforce challenges. HWNZ also became the primary funder of post entry clinical training and was supported by the HWNZ business unit within the Ministry. In September 2018 there was agreement that the Ministry would establish a stronger workforce function and that the HWNZ would take on a more strategic role. An updated terms of reference is currently under consideration.
The Ministry of Health provides oversight nationally of the health and disability workforce and policies related to it:
The Director-General of Health, Director of Public Health, Director of Mental Health, and Director of Addiction Services perform statutory functions (for example, the Director of Public Health has a broad clinical leadership role that includes professional oversight of and support to medical officers of health).
A chief medical officer, chief nursing officer, and chief allied health professions officer provide clinical and technical leadership and advice.
The Health Workforce Directorate is responsible for national coordination and leadership on workforce issues. It advises on workforce development and regulation; gathers workforce data and intelligence; and invests in health workforce training “to ensure the health system has the right people, in the right place with the right skills to provide the safest care and best outcomes for our population”. 390 The directorate also runs the Voluntary Bonding Scheme.
Profession specific taskforces for the allied health, kaiāwhina, midwifery, nursing and the medical workforce are organised by the Health Workforce Directorate for planning, to provide oversight and expert advice and facilitate links with local, regional and national networks.
Other parts of the Ministry of Health, such as the Health System Improvement and Innovation Directorates, also play oversight roles.
Many other organisations also play key roles such as:
The Health and Disability Commissioner is an independent watchdog which promotes and protects consumer rights, resolves complaints, and holds providers to account for improving their practices at individual and system-wide levels.
Regional shared services organisations support DHBs in each region with the Ministry of Health providing funding for a regional director of workforce training.
Central Region Technical Advisory Services (TAS) provides some national services such as DHB workforce information analysis and the Employment Relations Programme.
District alliances are expected to encourage collaborative working.

INTERIM REPORT | PŪRONGO MŌ TĒNEI WĀ
PAGE | 219
The Ministry of Business, Innovation and Employment (MBIE) and Statistics New Zealand provide labour market information. MBIE also develops the Tertiary Education Strategy with the Ministry of Education.
The Tertiary Education Commission leads the Government’s relationship with the tertiary education sector, funds tertiary education organisations, and monitors their performance. The commission has several focuses that relate to workforce, such as boosting achievement of Māori and Pacific students and delivering skills for industry.
The New Zealand Qualifications Authority runs the qualifications framework and registers some health training providers.
The main organisations and the roles they play in training are discussed below.
Workforce training and supply
Oversight of the workforce pipeline, training, and accreditation Universities, polytechnics, and other training providers provide initial training to large parts of the health and disability workforce, largely determining student numbers and curriculums, sometimes in conjunction with the Ministry of Health, the Health Workforce Directorate, DHBs, industry, the Tertiary Education Commission, and professional and regulatory bodies. DHBs offer undergraduate and post-entry training placements in hospital and community settings and ongoing professional development for the large workforce they employ.
The Health Workforce Directorate invests in training and development of the health and disability workforce to:
support new graduate nurses, midwives, pharmacists, and doctors to transition into the workforce in their first year of practice
subsidise the costs of vocational (specialist) training for doctors, including general practice trainees support the postgraduate training of nurses, midwives, and a variety of allied health and scientific
workers such as anaesthetic technicians, sonographers, and medical physicists391 support the non-regulated Māori workforce to develop formal competencies in their current roles
and develop their potential to move into other health sector roles.392
Responsible authorities such as the Dietitians Board, Medical Council and the Medical Radiation Technologists Board define scopes of practice for their professions (these set the boundaries within which a practitioner can practise), prescribe necessary qualifications, register practitioners, and issue annual practising certificates under The Health Practitioners Competence Assurance Act 2003. They also set standards of competence. Responsible authorities, via professional conduct committees, can investigate individual practitioners’ competence and conduct. Authorities are funded through professional levies.

NEW ZEALAND HEALTH AND DISABILITY SYSTEM REVIEW | HAUORA MANAAKI KI AOTEAROA WHĀNUI
PAGE | 220
Fifteen medical colleges are the professional and membership organisations for specialists. A focus of these colleges is training and ongoing professional development to support medical practitioners working in different specialties. Many of these colleges are Australasian. The relevant college must approve internationally trained specialists and senior medical officers before they can work in their profession in New Zealand. The Council of Medical Colleges acts as the collective voice for the medical colleges in New Zealand. It supports the colleges to discuss issues of common interest, share knowledge, and coordinate college objectives and policies, predominantly relating to a well-trained and safe medical workforce. The council is also the organisation that supports the work of Choosing Wisely in New Zealand.393
The large number of bodies leads to a lack of clarity about where responsibility sits and who is accountable for making sure the workforce pipeline is proactively managed over the short and long term. The boundaries between national, regional, and local planning are blurry, as are the responsibilities of the Ministry of Health, the Health Workforce New Zealand Committee, the Health Workforce Directorate, regional workforce development hubs, DHBs, universities, polytechnics, colleges, and employers.
More integrated workforce forecasting and planning that is informed by robust data and considers unmet need, new models of care and ways of working, and future roles and workforce mixes is desired. We also heard that the system wants more visibility of the pipeline and strong leadership to act on that planning and deliver people with the right skills at the right time to prevent future shortages.
A common observation about medical workforce planning internationally is the lack of it. So often it appears the challenges that are involved – not least the need to plan two decades ahead to account for the length of time needed to train specialists – leads to a policy stasis with workforce planning ending up in the ‘too hard’ basket. This in turn falls to depending essentially on introducing incremental changes in staffing on a year-to-year basis and making short-term adjustments to services and staffing in response to emerging health demand. (Organisation submission)
Kaiāwhina workforce A wide and varied group of non-regulated workers are referred to as kaiāwhina and fulfil an important function in the health and disability system. Kaiāwhina include people working:
in health-related corporate and administrative positions in alcohol and other drug addiction support roles as support workers for older, disabled, or injured people living in residential facilities or in their own
homes.
Kaiāwhina are monitored and regulated through industry standards, health and safety legislation, and employment agreements.
Careerforce is the industry training organisation for the health, mental health, aged care, disability, and social services workforce. Qualifications such as the New Zealand Certificate in Health and Wellbeing can be gained at relatively low cost, without university study. These qualifications can form the basis for certification in many healthcare, disability support, aged care, home and community support, and social services positions.

INTERIM REPORT | PŪRONGO MŌ TĒNEI WĀ
PAGE | 221
Undergraduate health-related courses In 2018, around 21,000 people were studying for health-related bachelor degrees – nearly 17% of all students studying bachelor degree courses. The number of health students has been fairly consistent, at a time when the national number of domestic bachelor students has continued to decline.394
The universities largely determine which courses will be offered and the numbers of students who will be enrolled. The exception is medical training, where the government sets the number of places that will be funded each year and provides a commitment to placing all New Zealand residents in house officer roles on graduation. From 2007 to 2015, the number of new medical training places increased from 342 to 539.
The majority of health professional courses include clinical placements predominantly in DHBs. Access to suitable placements has been cited by some as a constraint that limits the number of places offered in undergraduate degrees.
Postgraduate training Postgraduate training for clinical staff is principally delivered in the publicly funded health system. The Ministry of Health funds around $185 million of postgraduate training annually, which partially covers training costs for some workforces. In 2016/17, 63% of this funding was used for post-entry medical (including general practice) training, 12% for nursing, 12% for mental health and addictions, and the remainder spread across the Voluntary Bonding Scheme, midwifery, disability support, allied health, and Māori and Pacific support.395
A typical training path (of at least 11 years) for the medical workforce is shown in Table 11.1.
T A B L E 1 1 . 1 : T Y P I C A L T R A I N I N G A N D C A R E E R P A T H W A Y O F M E D I C A L W O R K F O R C E I N N E W Z E A L A N D
Y E A R S 1 – 6 :
Complete a one-year health sciences course and five-year Bachelor of Medicine degree and Bachelor of Surgery degree or complete an undergraduate degree then the five-year degree
Y E A R S 7 – 8 :
Work as a house officer (supervised junior doctor) in a hospital and in the community for two years.
Y E A R S 9 – 1 1 , 1 2 , O R 1 3
Become a registrar (trainee) in a specialist training programme. Complete three to five years of specialist training and exams to become a specialist (such as a Fellow of the Royal New Zealand College of General Practitioners) or seek general registration and continue as a senior house officer or locum.
S U B S E Q U E N T Y E A R S :
Work as a general practitioner, consultant, senior medical officer, specialist, or Fellow.

NEW ZEALAND HEALTH AND DISABILITY SYSTEM REVIEW | HAUORA MANAAKI KI AOTEAROA WHĀNUI
PAGE | 222
The Medical Council of New Zealand is the registering body and sets the curriculum for house officers in their early post graduate years (2 years). This includes generalist in-hospital experience and a minimum of 3 months in a community based setting.
Specialist medical training for registrars in New Zealand is managed by the New Zealand and Australasian medical colleges, most of which are Australia-based. The colleges set the curriculum for post graduate training (3-6 years), accredit training providers and have a high level of oversight for training positions. In some instances the colleges and the amount of funding available limit the trainee numbers which has the potential to contribute to health workforce shortages.
Specialist training is predominantly undertaken in an apprenticeship model with approximately 70% of experience gained working with senior staff, 20% from structured on-site training and 10% from activities away from the workplace. For hospital-based specialities the training is rotational by nature with trainees undertaking rotations nationally and across Australasia to gain the required experience. Placements for some specialty trainees mandated directly by the colleges. A number of trainees also complete a fellowship at an overseas hospital often in the UK or the United States.
Different training models are used in other countries. For example, in Canada the Royal College of Physicians and Surgeons of Canada and the College of Family Physicians of Canada do not provide specialist training, as occurs in New Zealand. Instead university medical schools provide this training and the Colleges provide standards and accredit training providers and certify that candidates have met the appropriate standards.
F IGURE 11.4: REGISTRATIONS FOR INTERNATIONAL MEDICAL GRADUATES (OVERSEAS-TRAINED DOCTORS) AND
INTERNATIONALLY QUALIFIED NURSES COMPARED WITH NEW ZEALAND GRADUATES, 2011–2017
S O U R C E : D A T A O N D O C T O R R E G I S T R A T I O N S F R O M 2 0 1 1 - 2 0 1 7 M E D I C A L C O U N C I L O F N E W Z E A L A N D A N N U A L R E P O R T S . D A T A O N N U R S E R E G I S T R A T I O N S F R O M 2 0 1 1 - 2 0 1 7 N E W Z E A L A N D N U R S I N G C O U N C I L A N N U A L R E P O R T S .
0
500
1000
1500
2000
2500
2011 2012 2013 2014 2015 2016 2017
Nurses
Internationally Qualified Nurses NZ Trained Nurses
0
200
400
600
800
1000
1200
1400
2011 2012 2013 2014 2015 2016 2017
Doctors
International Medical Graduates NZ Trained Doctors
INTERIM REPORT | PŪRONGO MŌ TĒNEI WĀ
PAGE | 223
Overseas-trained workforce Doctors and nurses who come from overseas to work in New Zealand need to register here. Overseas-trained doctors must apply to the Medical Council of New Zealand to verify their qualifications and may have to sit an English language test and a registration exam. Australian-trained nurses can automatically register in New Zealand and others are assessed by the Nursing Council of New Zealand against the requirements of the Health Practitioners Competence Assurance Act 2003. The number of new registrations for these professions each year since 2011 is shown in Figure 11.4.
People trained overseas in other regulated health professions also need to register with their relevant responsible body, such as the Pharmacy Council or the Medical Sciences Council of New Zealand.
Training and developing the workforce of the future The health and disability workforce of the future will need to work in new ways and use new digital technologies and better data. The system will need to develop new ways to train, retrain, develop, and support the health and disability workforce. For example, where this is not already happening, the system will need to support them to:
adapt to new technology and build both digital skills and the skills to interact effectively with consumers, such as the ability to hone judgement, understand, interpret, and question results to improve patient safety and to communicate with consumers effectively and empathetically
understand data sovereignty and medical ethics become work ready, for example, by making it simpler to update curricula based on professional
and industry requirements learn and implement new ways of working, including team-based working, for example, through
joint courses for health professionals from different disciplines learn new skills as old skills and roles become redundant build cultural competency and responsiveness apply generalist skills and call on specialist skills as needed work with patients and their family and whānau, carers, and the general public as partners in their
own care and support and empower them to use new technologies.
Continuing professional development and new ways to retrain will also become increasingly important. For example, different approaches to stair-casing entry and qualification points, training models, and development programmes and academies. More flexible credentialing could allow staff to learn new skills and move into new roles as roles become redundant, in a way that provides assurance they have met the right standards.396
Currently, taking time away from paid work or having caring responsibilities is a barrier to many people taking up health education, particularly for people in low-income households. Opportunities exist for more ‘earn as you learn’ or apprenticeship-type models to be used. Greater investment will also be required in the kaiāwhina workforce to address inequities in the system.

NEW ZEALAND HEALTH AND DISABILITY SYSTEM REVIEW | HAUORA MANAAKI KI AOTEAROA WHĀNUI
PAGE | 224
Employment models and relations Some aspects of employment are organised nationally, some regionally, and some locally. For example, nationally, the Nursing Advanced Choice of Employment system matches new nursing graduates with DHB jobs and near-national multi-employer collective agreements cover many DHB employees. Regionally, regional workforce development hubs are trying to join up workforce development within regions and avoid internal regional competition for staff. Locally, individual practices and DHBs directly employ staff.
In 2017, 13 national or near-national multi-employer collective agreements covered about 65% of all DHB employees, while seven regional multi-employer collective agreements covered a further 20%. Local collectives or individual employment agreements covered the balance of employees. In addition, there were three collective agreements with the New Zealand Blood Service. DHB chief executives have the authority to enter into collective or individual employment agreements covering DHB employees.
Union density (that is, membership as a proportion of the workforce) in 2017, was very high in DHBs at around 70%. The unions representing DHB employees are a mix of health sector–specific (typically occupational) unions and general unions. There is some overlapping coverage where two or more unions separately represent the same occupational group.
Under the New Zealand Public Health and Disability Act 2000, DHB chief executives must consult with the Director-General of Health before finalising the terms and conditions of a collective agreement. These obligations are explained further by specific Ministry of Health guidelines, the Operational Policy Framework,397 and the Government Expectations for Pay and Employment Conditions in the State Sector.398 The Ministry’s key roles in health sector employment relations activity are to:
monitor local, regional and national bargaining liaise with and provide information, advice and feedback to the Minister of Health and the Minister
of State Services, other government agencies and DHBs advise and report to Cabinet, if required.
There are challenges for all with current union and employer relationships.
Unions are concerned that their members are remunerated fairly, well supported to complete training and professional development, and work in safe environments. Key issues raised in discussions included workplace stress, bullying, fatigue, safe rosters, and future workforce roles and numbers. A lack of trust in employers has resulted in additional clauses being built into the multi-employer collective agreements so employers can be held to account for delivering on commitments made during bargaining.
Employers, in particular DHBs, are concerned that so much specificity in agreements makes it challenging to meet their service delivery commitments, particularly in areas with workforce shortages. Discussions signalled that such specificity is also affecting decisions about hours of work, as the additional costs associated with weekend work, in particular, are high. This, coupled with the constraints that regulatory bodies place on scopes of practice and internationally accepted roles, is slowing the pace at which new roles are being adopted in New Zealand.
INTERIM REPORT | PŪRONGO MŌ TĒNEI WĀ
PAGE | 225
During Phase One engagement, concerns were also raised about:
inconsistencies in interpretations of the multi-employer collective agreements between employers differing terms between agreements for workforces that are working together differing terms between public sector and non-government organisation (NGO) employers –
particularly for nursing staff in Māori provider organisations.
The negotiation process was described as “an inefficient, drawn out process that concludes with a compromise deal that generally applies for only a short period before negotiations commence again”. Recent processes have involved more strike action than has been the case over the preceding decade, which adds further tension to the process and has been challenging for the workforces involved.
Unions and employers will need to work differently if the workforce challenges are to be addressed. A tripartite Health Sector Relationship Agreement between the Government, DHBs, and the New Zealand Council of Trade Unions and its major health affiliates (the New Zealand Nurses Organisation, the Association of Salaried Medical Specialists, Public Service Association, and the Service & Food Workers Union (now E tū)) was signed in 2008. This agreement reflects a commitment to constructive engagement and provides a framework and work programme that aims to assist in improving productivity, efficiency, and effectiveness in health and disability service delivery, while acknowledging resource constraints. Although this agreement has been in place for a decade, there is little evidence of constructive strategic approaches to workforce issues being the norm. Improving engagement through forums such as this will be essential for the future.
Health could do more for the wellbeing of its workforce
Workforce is stretched and stressed The health and disability workforce is committed, but is stretched and stressed. Some members of the health workforce are burnt out. Discussions with DHB executives suggested that sick leave is notably higher than in the past and annual leave balances are increasing for some workforces – both signs of a stretched workforce. Recent negotiations with unions focused on roster changes and additional staff to support safer work practices.
Some professions reported high levels of burnout, which aligns with results in several recent workforce surveys as illustrated in Table 11.2.
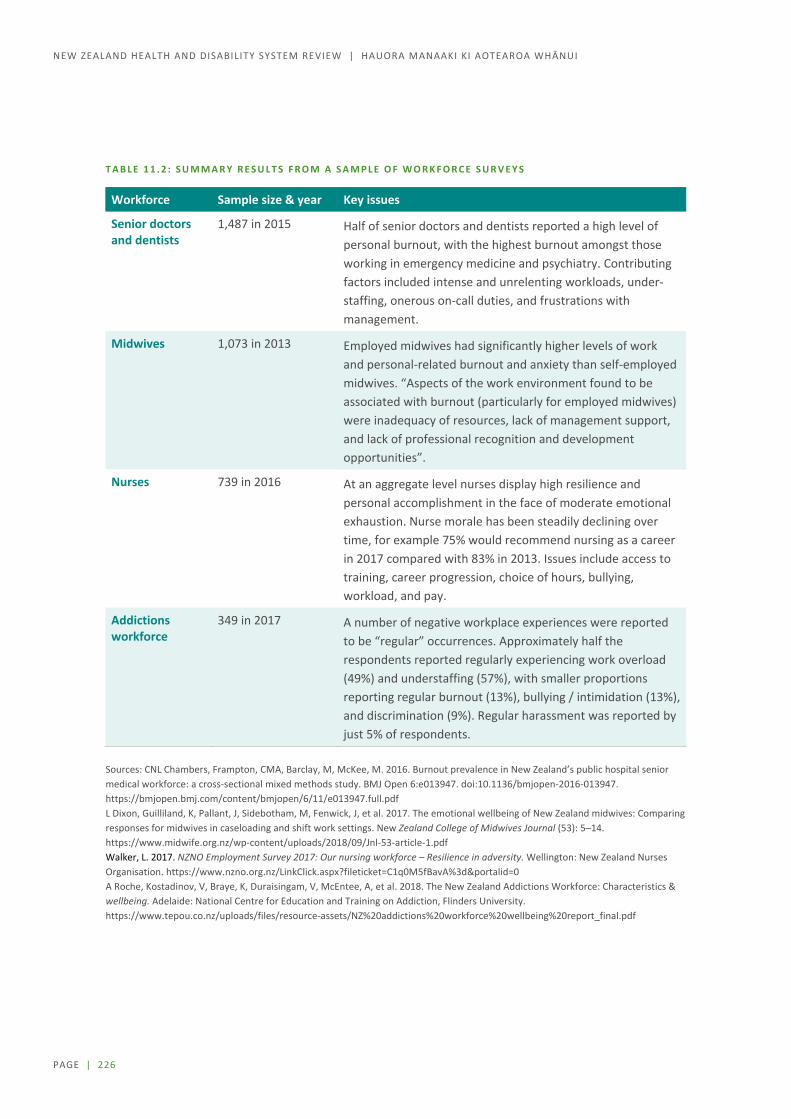
NEW ZEALAND HEALTH AND DISABILITY SYSTEM REVIEW | HAUORA MANAAKI KI AOTEAROA WHĀNUI
PAGE | 226
T A B L E 1 1 . 2 : S U M M A R Y R E S U L T S F R O M A S A M P L E O F W O R K F O R C E S U R V E Y S
Workforce Sample size & year Key issues
Senior doctors and dentists
1,487 in 2015 Half of senior doctors and dentists reported a high level of personal burnout, with the highest burnout amongst those working in emergency medicine and psychiatry. Contributing factors included intense and unrelenting workloads, under-staffing, onerous on-call duties, and frustrations with management.
Midwives 1,073 in 2013 Employed midwives had significantly higher levels of work and personal-related burnout and anxiety than self-employed midwives. “Aspects of the work environment found to be associated with burnout (particularly for employed midwives) were inadequacy of resources, lack of management support, and lack of professional recognition and development opportunities”.
Nurses 739 in 2016 At an aggregate level nurses display high resilience and personal accomplishment in the face of moderate emotional exhaustion. Nurse morale has been steadily declining over time, for example 75% would recommend nursing as a career in 2017 compared with 83% in 2013. Issues include access to training, career progression, choice of hours, bullying, workload, and pay.
Addictions workforce
349 in 2017 A number of negative workplace experiences were reported to be “regular” occurrences. Approximately half the respondents reported regularly experiencing work overload (49%) and understaffing (57%), with smaller proportions reporting regular burnout (13%), bullying / intimidation (13%), and discrimination (9%). Regular harassment was reported by just 5% of respondents.
Sources: CNL Chambers, Frampton, CMA, Barclay, M, McKee, M. 2016. Burnout prevalence in New Zealand’s public hospital senior medical workforce: a cross-sectional mixed methods study. BMJ Open 6:e013947. doi:10.1136/bmjopen-2016-013947. https://bmjopen.bmj.com/content/bmjopen/6/11/e013947.full.pdf L Dixon, Guilliland, K, Pallant, J, Sidebotham, M, Fenwick, J, et al. 2017. The emotional wellbeing of New Zealand midwives: Comparing responses for midwives in caseloading and shift work settings. New Zealand College of Midwives Journal (53): 5–14. https://www.midwife.org.nz/wp-content/uploads/2018/09/Jnl-53-article-1.pdf Walker, L. 2017. NZNO Employment Survey 2017: Our nursing workforce – Resilience in adversity. Wellington: New Zealand Nurses Organisation. https://www.nzno.org.nz/LinkClick.aspx?fileticket=C1q0M5fBavA%3d&portalid=0 A Roche, Kostadinov, V, Braye, K, Duraisingam, V, McEntee, A, et al. 2018. The New Zealand Addictions Workforce: Characteristics & wellbeing. Adelaide: National Centre for Education and Training on Addiction, Flinders University. https://www.tepou.co.nz/uploads/files/resource-assets/NZ%20addictions%20workforce%20wellbeing%20report_final.pdf

INTERIM REPORT | PŪRONGO MŌ TĒNEI WĀ
PAGE | 227
Concerns are not limited to the professional workforces.
Workers are increasingly rung and asked to fit more clients in while driving or working with clients, during their breaks and even holidays. Most have begun ignoring these calls. Often, they are asked to squeeze an extra client into an already over-filled roster. On such occasions a whole string of clients may be kept wondering when, or if, their support worker will arrive. The most compassionate workers tend to yield more often to these pressures out of concern for their clients, and frequently suffer burnout and excessive sickness breaks. Others, with more concern for self-care, resign and exacerbate the staff shortage. (Organisation submission)
Table 11.3 summarises some of the key issues submissions tell us staff report at different stages of the life course.
T A B L E 1 1 . 3 : K E Y I S S U E S F A C I N G W O R K F O R C E A T D I F F E R E N T S T A G E S O F T H E L I F E C O U R S E

NEW ZEALAND HEALTH AND DISABILITY SYSTEM REVIEW | HAUORA MANAAKI KI AOTEAROA WHĀNUI
PAGE | 228
Health profession attrition has serious impacts on the sustainability and productivity of the health workforce and can have a negative impact on continuity of care for patients. Submissions raised concerns about the ageing workforce with large numbers expected to retire in the next decade. In 2015, about 40% of doctors were aged 50 or over, up from 35% in 2009. Similarly, the average age of nurses in 2015 was 46.3 up from 45.9 in 2009. There are also risks to specialised professions.
Leveraging health’s large employer status As a large employer, the health system can influence the health and wellbeing of a large number of New Zealanders and their families and whānau, with flow on benefits to the rest of the economy. This is not just about pay and conditions, but also about building trust and confidence in the system, enhancing health literacy, and listening to the workforce about what really matters to them.
Research suggests that people with poor health literacy are less likely to use prevention services (such as screening); have less knowledge of their illness, treatment and medicines; are less likely to manage their long-term/chronic condition; are more likely to be hospitalised due to a chronic condition; are more likely to use emergency services; and are more vulnerable to workplace injury because they do not understand safety precaution messages.399
Improving the health literacy of non-clinical staff could also have spill over benefits for the consumers they serve and for their families and whānau. This could assist families and whānau to make informed decisions about their health and help them navigate the health and disability system.
T O T H R I V E P R O G R A M M E , A U C K L A N D D H B
This programme has been implemented to improve lower-income employees’ prospects through access to job specific training, financial capability education, and career pathways within the DHB. It also focuses on wellbeing through access to free health checks and improved work conditions.
The DHB ran focus groups with cleaners, orderlies and waste orderlies (three workforce groups that make up 75% of the workforce paid less than $20 per hour before penal rates in the DHB). The focus groups identified key issues, work and life aspirations and priorities. Management then worked with the focus groups and external partners to develop a sustainable programme of initiatives that were trialled before being rolled out.
The initiatives include a mix of:
Health and wellbeing initiatives such as free eye exams, annual health checks and a free gym membership
Training in job related skills, computer skills workshops and access to computers, literacy and numeracy training, financial capability seminars, supporting Level 2 and Level 3 qualifications, and linked salary increases
Benefits such as life insurance, shoe vouchers and laundry allowances.
Trainee positions have been established and To Thrive participants have been supported to gain an NZQA qualification with some transitioning to other roles in the DHB. Recent employment engagement survey results for this group were positive with 82% feeling supported to grow and develop and 81% feeling a sense of commitment to the DHB.

INTERIM REPORT | PŪRONGO MŌ TĒNEI WĀ
PAGE | 229
Growing a workforce that reflects New Zealand’s many communities
Growing and developing the Māori and Pacific workforces Too few Māori and Pacific peoples are in the health and disability workforce to reflect the size of their populations and their needs (as illustrated in Figure 11.5).
Māori make up 15% of the New Zealand population and 13% of the working age population (15–65 years), but only 12% of the workforce and 8% of the DHB workforce.400
Pacific peoples make up about 8% of the New Zealand population and 7% of the working age population, but only just over 4% of the DHB workforce.401
F I G U R E 1 1 . 5 : M Ā O R I A N D P A C I F I C W O R K F O R C E P O P U L A T I O N S
S O U R C E S : C E N S U S 2 0 1 3 , S T A T S N Z P O P U L A T I O N P R O J E C T I O N S ( 2 0 1 7 ) , T A S : D H B E M P L O Y E D W O R K F O R C E Q U A R T E R L Y R E P O R T T O M A R C H 2 0 1 9 .
The lower numbers of Māori and Pacific staff is a missed opportunity for staff to provide care that is responsive to the needs of and reflects the cultural views, language, history, values, challenges, and beliefs of consumers who share similar backgrounds and who are some of the least well served by the system.
Increasing the number of Māori and Pacific staff is an integral part of a strategy to improve equity of outcomes for these groups, along with improving the cultural intelligence and responsiveness of the entire workforce. For example, ’Ala Mo’ui: Pathways to Pacific Health and Wellbeing states:

NEW ZEALAND HEALTH AND DISABILITY SYSTEM REVIEW | HAUORA MANAAKI KI AOTEAROA WHĀNUI
PAGE | 230
If we are to improve and gain equitable health outcomes for all Pacific peoples in New Zealand, it is essential to not only build the capacity and capability of the Pacific health and disability workforce but to also increase the responsiveness of the non-Pacific health workforce to Pacific health needs.402
Ethnic and linguistic diversity is associated with improved access and quality of care, because:
[Pacific workers] bring connections with Pacific communities, personal understanding of Pacific issues, and Pacific cultural and language skills.403
The Māori and Pacific populations are expected to continue to grow, but at slower rates than the Asian population in New Zealand.404 As the Māori and Pacific populations are relatively younger cohorts (with median ages of 23.9 and 22.1, respectively, compared with 41 for New Zealand Europeans), the available workforce pool in future will include a larger proportion of these groups.405 Table 11.4 shows the potential workforce over the next two decades.
T A B L E 1 1 . 4 : N E W Z E A L A N D E R S A G E D 1 5 – 6 5 B Y E T H N I C I T Y , 2 0 1 3 A N D 2 0 3 8 P R O J E C T I O N
Number Percentage of total (%) 2013 2038 2013 2038
Total 2,907,340 3,481,500
Māori 423,000 635,300 15 18
Pacific 206,500 361,600 7 10
S O U R C E : S T A T I S T I C S N Z P O P U L A T I O N P R O J E C T I O N S .
There are a number of initiatives already underway to grow the Māori and Pacific workforces which are starting to pay off, and potential students and staff are being exposed to more Māori and Pacific health workers, who are also encouraging them to work in health. The first objective is to encourage students to achieve success in the right subjects at school, giving career advice, offering bridging programmes where necessary, influencing admission policies/quotas and institutional commitments to achieving equity, and pastoral interventions to support completion of study in a culturally safe environment.406
One initiative, in Taranaki, WhyOra, works with all secondary schools in the region to highlight health as a career, encourage students to take science, support students to apply for health study and help Māori into health cadetships and jobs, providing pastoral support from year 9 into employment. Most students return to work in Taranaki and are motivated to improve whānau wellbeing.407
Another initiative is DHB led. Auckland and Waitematā DHBs reviewed their recruitment and retention policies and processes from end to end to determine whether barriers had been inadvertently created for Māori.
INTERIM REPORT | PŪRONGO MŌ TĒNEI WĀ
PAGE | 231
Now the DHBs automatically short-list for interview all Māori applicants who meet the core criteria for any role and include Māori representatives in all nurse entry to practice interviews to engage Māori applicants, make them feel comfortable and culturally safe, and draw out cultural and community knowledge that they could bring to the role.
Other areas have been identified where there may be room to do more to:
involve families and communities in initiatives, as recommended in Taeao o Tautai: Pacific Public Health Workforce Development Implementation Plan, to guide the workforce “who are the tautai or navigators of a new day dawning” to improve community wellbeing using the Pasifika way408
increase Māori control and involve iwi and whānau, in line with the Whakapuāwaitia Ngāi Māori Thriving As Māori 2030 Māori Health Workforce Priorities and the National Māori Health Strategy He Korowai Oranga. 409
grow Māori leadership in the health and disability system, for example supporting initiatives such as Ngā Manukura o Āpōpō (or Tomorrow’s Clinical Leaders – a clinical leadership and professional development programme for Māori nurses and midwives focussed on leadership in action and leadership as Māori)410, and involving kaumātua (elders) in the system.
Building the cultural competence of the entire workforce and reducing institutional racism Lack of cultural competency and institutional racism are barriers to meeting needs and improving outcomes for groups such as Māori, migrants, and refugees. The Health Services and Outcomes Kaupapa Inquiry (Wai 2575) raises institutional racism as a significant issue for Māori health – both for staff and for people accessing services.411
Submissions proposed compulsory training in cultural competence for the entire workforce:
Cultural competence and cultural safety training are core requirements for all health and disability workers. (Organisation submission)
Diversity is not just cultural, but also includes among others, gender, sexual orientation, and age. Another submission stated:
The workforce must be fit for purpose; the training received must prepare staff for the realities of the diverse population that they will work with. (Organisation submission)
Building cultural competency also requires leaders who support it.
There must be a strong emphasis on affirming culture and cultural responsiveness for health professionals. Cultural competency must be at the heart of every interaction between our health workforce and the diverse population it is working with. Strong, courageous leadership that has a true understanding of health disparity and health equity is therefore required to reflect and deliver this truth. In addition, this leadership must have a mandate to action the change required to implement this vision. (Organisation submission)

NEW ZEALAND HEALTH AND DISABILITY SYSTEM REVIEW | HAUORA MANAAKI KI AOTEAROA WHĀNUI
PAGE | 232
Employing more disabled people in the health and disability system Disabled people are three times less likely to be in paid work than non-disabled people and are an underutilised group who are more likely to earn a much lower income. Disabled people also generally experience worse health outcomes.
The New Zealand Disability Strategy for 2016 to 2026 aims to increase employment of disabled people and build the confidence of employers in employing people, with the public sector taking a lead, for example, by developing a toolkit for employing disabled people, paid internships, better data, and awards.412 The health and disability system could use its role as a large employer to progress these goals.413
Research on the employment of disabled people in disability support services in New Zealand found that supply-side approaches to increase the employment of disabled people had not been successful, but that demand-side approaches, which focused on making employers “disability confident” were more effective in pulling disabled people into the workforce.414
A workforce with more disabled people may be able to work in a more understanding way with disabled consumers and influence the practice of their peers. This would also provide a way to increase the career and earning potential of the individuals and improve the wellbeing of their families and whānau.
Staffing rural and hard to fill areas Geographic distribution of the workforce is a major challenge, particularly for primary care and rural and provincial hospitals, which can struggle to recruit and retain the workforce they need, despite a number of initiatives to meet this challenge. In general, job applicants and trainees tend to favour large cities, particularly Auckland, although the Voluntary Bonding Scheme is helping.415 More areas will experience population decline over the next two decades, with Statistics New Zealand projecting 87% growth in urban areas by 2038.416 At a recent sector workshop on priorities for health and disability workforce staffing, rural areas were generally viewed as a high priority.
Working differently Ways of working are also changing. The health and disability system is starting to use the current workforce differently and to embrace new roles, which needs to be supported by strong leadership and management. Collaborative and team-based approaches are widely recognised as being critical to the delivery of new models of care. New Zealand is beginning to recognise the massive contribution that patients and their families and whānau can make to the health and disability system and to recognise the untapped potential of volunteers. There are growing consumer expectations that some services should be accessible online and accessible for extended hours outside standard ‘business hours’. This will require significant changes in current work practices.
Adopting team-based approaches Discussions highlighted that the workforce largely wants to work better as a team to make the best use of everyone’s skills and to make it easier for patients and their families and whānau to access the services they need in a way that suits them. Many people in the workforce are also keen to learn from each other
INTERIM REPORT | PŪRONGO MŌ TĒNEI WĀ
PAGE | 233
and work in a more collaborative, supportive environment and culture that makes the best use of different team members’ skills, improves patient safety, and reduces burnout. Local examples of team-based initiatives include:
the South Island Alliance implementing the Calderdale Framework for delegation and professional skill-sharing with the allied health workforce417
increasing use of multidisciplinary meetings that can result in better and more holistic treatment planning, improved communication, a wider range of therapeutic options, less duplication, more efficient use of time and resources, and improved equality of outcomes418
11 Youth One Stop Shops operate from Whangarei to Invercargill, providing a wide variety of services in one place and aiming to improve the mental health of rangatahi (young people).
The regulatory approach, to scopes of practice for instance, may be a barrier to team-based working, as is New Zealand’s relatively siloed approach to training.
Using the current workforce differently To meet growing demand, New Zealand will need to use the health and disability workforce differently. One area where this has already occurred is in the West Coast where a more generalist workforce model, supported by technology and specialist support, has been adopted to support a small and remote population.
West Coast District Health Board, the smallest in the country, may well be the way of the future in regards to striking the right balance between generalism and subspecialisation. Its ‘one service, two sites’ approach to specialist services, provided through a close partnership with Canterbury District Health Board, enables patients to receive safe, high-quality hospital care, as close to home as possible. Core acute 24/7 services at the small Grey Base Hospital are provided by West Coast Rural Hospital doctors with generalist skills across specialties, working with West Coast – and Christchurch-based specialists and subspecialists. This approach has evidently helped with recruitment of specialists to Grey Hospital. Being part of a larger group of colleagues with the ability to spend regular time at the tertiary hospital working in their field of special interest makes surgeons’ roles at Grey Hospital more attractive. (Organisation submission)
As technology changes the health and disability system will embrace new roles, such as genomics and robotics experts and data scientists, although the system may have to compete with other sectors for people.
Other new roles will emerge and change service delivery approaches. For example, physician associates, health coaches, and social prescribers are increasing, with further new roles such as culturally endorsed behaviour change specialists starting to emerge. There is also a view that much can be gained from rongoā Māori healers (traditional Māori health experts) working more closely with mainstream providers to complement medical approaches.
As the health and disability system is put under increasing pressure staff productivity will become more important.419 The World Health Organization identified the following barriers to health worker performance and productivity:420
NEW ZEALAND HEALTH AND DISABILITY SYSTEM REVIEW | HAUORA MANAAKI KI AOTEAROA WHĀNUI
PAGE | 234
unclear roles and expectations, vague guidelines, poor processes of work, inappropriate skills mix within the work setting, competency gaps, lack of feedback, difficult work environments and unsuitable incentives mean that even where there are no critical workforce shortages, health workers may still fail to provide quality care.
We heard that administrative burdens are weighing down staff. The scales have sometimes tipped in favour of more time spent on administration than with the patient (for example, 15 minutes with a patient or client and one hour writing up the engagement and connecting to social agencies, according to one submission).421 Technology solutions that enable clinical staff to spend more time with patients and less on paperwork may assist.
Disruptive leadership and management One common theme that emerged in discussions about why an initiative or an organisation stood out as a success was quality leadership and management. Frequently, this involved a small number of highly committed people who had a vision that resonated with others and around which new ways of working were identified and introduced in a staged manner.
Concerns were raised about whether, given the relatively small size of the New Zealand population, there was sufficient leadership and management capability and capacity for the number of existing roles and organisations.
It was also noted that change management had not been a focus or a skill that was widely applied.
Shifting the focus onto prevention, early intervention, and integrated care takes time and resources. Frontline staff and clinicians are busy with their day jobs and have little time to focus on leading changes. Moreover, they do not necessarily have the expertise needed to drive and manage a change process. People with project management and change management skills and experience are needed to help implement the changes required. Clinical champions are also needed to drive new models of care or initiatives. However, DHBs have to weigh up bringing in more staff to help drive changes with other more immediate priorities, such as addressing the growing demand on hospital services and managing clinical risks. (Group submission)
In other jurisdictions, investment has been greater at a system level in training schemes focused on growing leadership and management skills. For example, the NHS has had a management training scheme for over 20 years and recently launched a digital academy. In the United States, the Institute for Healthcare Improvement is well recognised for its delivery of improvement science training and governance training.
Discussions suggested that if the system is to implement the sorts of change that have been discussed for decades, a more coordinated and deliberate approach to leadership development will be needed. This will need to occur at multiple levels and will require investment.
INTERIM REPORT | PŪRONGO MŌ TĒNEI WĀ
PAGE | 235
Empowering patients, their families and whānau, and volunteers Family and whānau carers and volunteers are an important part of the unpaid workforce. They contribute hugely to the success of health interventions and disability support. Many submissions noted the benefits that could be gained by better supporting family and whānau carers, who are under pressure.
Opportunities exist to build the health literacy of patients, carers, and volunteers and offer them encouragement, training, and self-management and prevention tools. The New Zealand Health Strategy states:422
Beyond the formal workforce, it will be important to support families, whānau and individuals in communities in their roles as carers of people close to them. This support could involve providing health literacy education, as well as information and training specially tailored for volunteers.
For example, the Nuka System of Care provides health services to and empowers Alaska Native and American Indian peoples. Nuka invests purposefully in engaging and building relationships with their customers to hear, listen, and learn about what they need to become well and build a multidisciplinary team and culture focused on meeting its customers’ stated needs. This also flows through into who Nuka hires, looking for fit first, and technical skillset second, and supporting and developing young people as future staff and leaders. This hiring policy also helps with retention as it draws in people who want to deliver in a customer-centric system. 423
Volunteers make up an important part of the health and disability workforce. For example St John Ambulance has over 9,000 volunteers who work in roles such as ambulance officers and event medics, teaching first aid, running health shuttles to get people to health appointments, and as hospital friends.424 In the United Kingdom, over 11,000 volunteers are working as community first responders, attending life-threatening emergencies in their local areas before ambulance services arrive. They are a significant part of the workforce, adding to the approximately 20,000 paid staff. Training, good volunteer management, and governance for safety, as well as sharing learning between providers, were identified as key opportunities to support this type of initiative.425
Positioning health for the future The system does not have adequate systems to gather information about and manage its workforce. In comparison to other large employers, its workforce systems are very basic. It is unlikely that other industries are managing the complexities of rosters or the large number of staff with such basic and standalone systems. Investment and change will be required.
It will be important also that those working in the system work more collaboratively and cooperatively towards a common purpose and have a shared set of values. It should not be assumed that those working in the system, or governing the system, will all join with this knowledge or sense of purpose. Induction processes should be strengthened, and organisations should consider on a regular basis how they are demonstrating these values and contributing to the overall system as well as to their own profession or organisation.

NEW ZEALAND HEALTH AND DISABILITY SYSTEM REVIEW | HAUORA MANAAKI KI AOTEAROA WHĀNUI
PAGE | 236
Directions for change: Workforce Workforce pressures are significant and need to be urgently addressed by ensuring both better planning for future supply and more flexibility in training to prepare for different roles. Workforce practices will need to provide better work / life balance in the future.
C H A N G I N G S K I L L M I X
The types of work and the balance of demand for different skills is changing rapidly, yet our training methodology is very rigid. The Panel believes the sector needs to be both more open minded about how services might be provided and more flexible about the range of qualifications needed to perform various tasks.
We need to improve communication between tertiary education providers, professional bodies, the Ministry and DHBs in order to undertake more effective workforce planning and supply management. This will need to be centrally driven.
Growing the workforce is not just a tertiary education issue. We should be actively influencing secondary school students to attract them into the health workforce and support them to be successful. Taking a strategic approach to growing our kaiāwhina workforce over the next 5 years will be a key to achieving a step change in the ways in which we are able to deliver services.
Our digital and data capability needs to be invested in significantly, both in terms of building the skills of our current workforce and also creating new roles to support changed ways of working.
B E I N G A G O O D E M P L O Y E R
The system could have a significant impact on the health and wellbeing of our entire population both by being a good employer and by ensuring the system workforce properly reflects the population it is serving.
Leveraging the system’s ability to create employment opportunities for those who have traditionally found it hard to find employment (particularly those with mental health conditions and disabled people), and growing the Māori and Pacific workforce is a must.
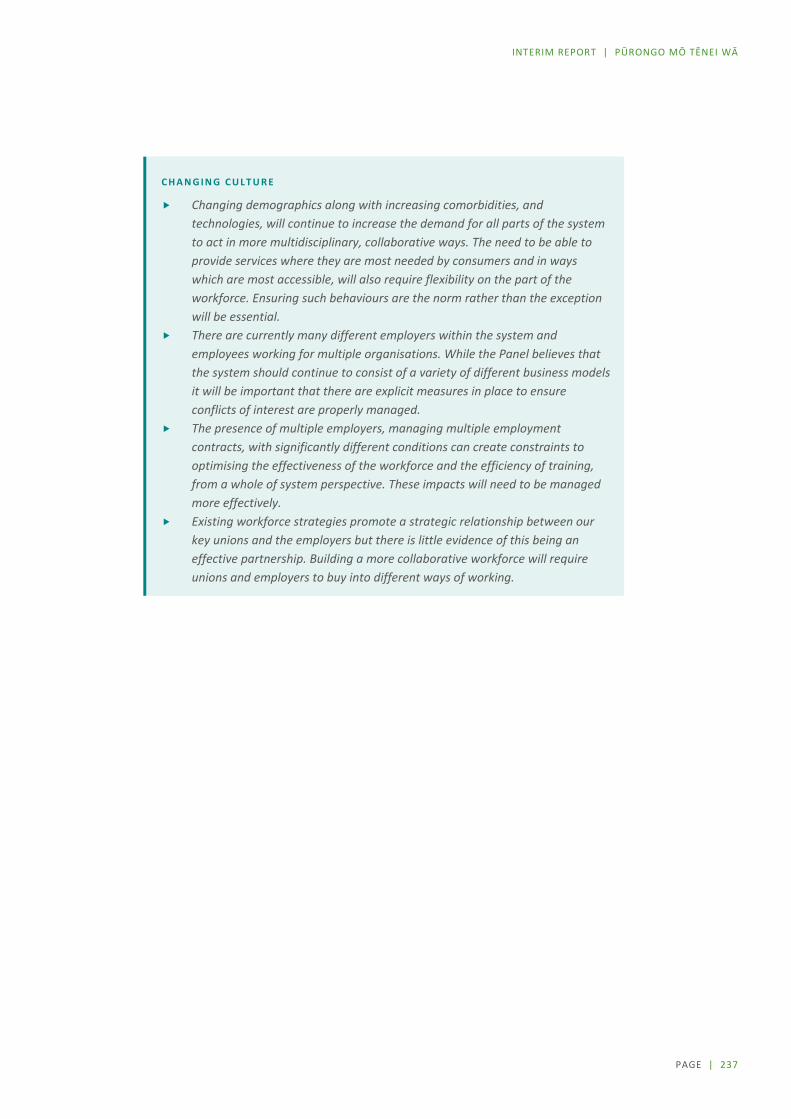
INTERIM REPORT | PŪRONGO MŌ TĒNEI WĀ
PAGE | 237
C H A N G I N G C U L T U R E
Changing demographics along with increasing comorbidities, and technologies, will continue to increase the demand for all parts of the system to act in more multidisciplinary, collaborative ways. The need to be able to provide services where they are most needed by consumers and in ways which are most accessible, will also require flexibility on the part of the workforce. Ensuring such behaviours are the norm rather than the exception will be essential.
There are currently many different employers within the system and employees working for multiple organisations. While the Panel believes that the system should continue to consist of a variety of different business models it will be important that there are explicit measures in place to ensure conflicts of interest are properly managed.
The presence of multiple employers, managing multiple employment contracts, with significantly different conditions can create constraints to optimising the effectiveness of the workforce and the efficiency of training, from a whole of system perspective. These impacts will need to be managed more effectively.
Existing workforce strategies promote a strategic relationship between our key unions and the employers but there is little evidence of this being an effective partnership. Building a more collaborative workforce will require unions and employers to buy into different ways of working.

PAGE | 238
NEW ZEALAND HEALTH AND DISABILITY SYSTEM REVIEW | HAUORA MANAAKI KI AOTEAROA WHĀNUI
12 Digital and data / Te matihiko me ngā raraunga
Advances in digital technologies have huge potential to better support population and whānau-focused health and wellbeing. A prerequisite for the New Zealand system being able to take full advantage of these opportunities, however is to develop robust data standards, identity management protocols and interoperable systems to ensure quality data can be shared and managed appropriately.
This section examines some of the current difficulties with data in the system, from lack of ability to share effectively, through issues with national collections to data sovereignty. The section also considers the system landscape and how that should be developed to enable a more integrated, networked nationwide system which can not only measure and evaluate results, but which could facilitate services being delivered in ways which more effectively meet consumers’ needs so that inequity is reduced.
Importance of data Throughout our Phase One engagement, a theme raised in virtually every discussion and in many submissions was data. It was acknowledged that quality data is critical for:
consumer empowerment, supporting consumers to actively manage their own health with access to their own health records to gain information and to contribute to them, and to support targeted wellbeing and education advice, research information, and choice
better patient safety, care, and outcomes that enable clinicians to see complete, up-to-date patient data across the continuum of care
new models of care that require multiple clinicians across different settings to have access to real-time patient data to support multidisciplinary care
decision-making and research that require timely access and analytical capacity to extract meaning from large datasets.

INTERIM REPORT | PŪRONGO MŌ TĒNEI WĀ
PAGE | 239
Access to much improved, up-to-date, reliable data is fundamental in a system that aims to deliver more equitable outcomes, improved health and wellbeing, and a better consumer journey through the system. This requires system-level thinking in relation to architecture and design, data standards, systems interoperability, and efficient use of resources as NZHIT set out in its report:
Using digital technology to “put health and wellness in the customer’s hands” is an area where New Zealand must develop a strategic and tactical approach to empower New Zealander’s to have full equity and access to the healthcare services they need in a more proactive manner.
Data journey for consumers, providers, and other organisations We heard during Phase One that consumers generally assume their information is shared between providers (for example, between an emergency department and their GP). This is often not the case. Lack of integration between providers and consumers having to repeatedly give the same information is frustrating, burdensome, and, in some cases, increases risk and results in poorer health outcomes for consumers.
[we want] ease of sharing information so that people do not have to yet again share their story before they can get the help they need. (Individual submission)
Consumers noted that they:
want to know that the health system uses up-to-date data wisely to inform decisions want data to be used in a way that benefits them assume information is shared across providers and are frustrated when it is not want full access to their own information and the ability to update their own details are unclear about consent and are frustrated that consent is fragmented and ad hoc
across the system were concerned about sharing sensitive information and security or privacy breaches were concerned with accountability and monitoring of their health records and those of whānau.
Providers noted that being able to access complete patient data and share this across multidisciplinary teams in a timely manner was critical to care, crisis responses and for changing the lives of consumers with high needs. Planners and decision makers require good information to deliver smarter policy, planning, and funding decisions.
However, four consistent challenges are:
much patient information is not in machine-readable formats, so is difficult to access and share. For example, reports are stored as PDF documents that are difficult to access and use in clinical settings and are of limited utility for population-level reporting or research.

NEW ZEALAND HEALTH AND DISABILITY SYSTEM REVIEW | HAUORA MANAAKI KI AOTEAROA WHĀNUI
PAGE | 240
privacy is cited, often incorrectly, for withholding patient information and other data that would help inform performance improvement, policy funding and investment decisions.
many contracts do not clearly set out data requirements. Organisations generally understand their responsibilities in regard to clinical use of data, but do not see it as a requirement to routinely share data with other providers or the Ministry of Health.
some compliance requirements are costly and burdensome. For example, minimum requirements for some datasets that DHBs must deliver to the Ministry can change annually, sometimes requiring system upgrades and lost productivity.
These issues are discussed further below.
Effective data collection and sharing Improved access to and sharing of data will becoming increasingly important. A variety of barriers in the system will need to be addressed.
New Zealand collects rich and a growing range of healthcare and health-related data, a valuable national asset. These data are often distributed, disconnected and inconsistently captured, utilised and governed – leading to inequities and missed opportunities. No organisation is empowered to share so that the value of these data is maximised to the benefit of New Zealand and New Zealanders. (Group submission)
One strength of New Zealand’s health and disability system is the National Health Index that assigns patients a unique number on their first contact with the health system. This index allows data to be connected across multiple datasets, but the ways in which data is currently collected limits the system’s ability to do this easily.
We have powerful national assets [like the National Health Index] but no funding or resourcing for them to be effectively managed, modernised or even used. (Paraphrased stakeholder conversation)
Poor data standards and fragmented system architecture are barriers to integration For data to be used most effectively, it must be easily shared within and across different systems. The ability to share data requires use of consistent data standards. In New Zealand, data standards are poorly implemented and interoperability is low. These limitations silo clinical information in multiple, disparate systems across different settings, increasing clinical workload and risk, undermining the consumer experience, and impeding valuable research and insight.
INTERIM REPORT | PŪRONGO MŌ TĒNEI WĀ
PAGE | 241
In general, systems and data are organised within organisations and around clinical specialties, subspecialties, or services, so no readily accessible, complete ‘point in time’ or longitudinal ‘life journey’ view of the consumer is available. There is also disagreement as to the respective roles and responsibilities of different organisations regarding data use and sharing within the system.
Several organisations have tried to establish standards but were hampered by a lack of resources, national buy-in, sector engagement, and independence. For example, the Health Information Standards Organisation was established in 2003 to lead the development and adoption of health information standards in New Zealand. To date, it has lacked the resources (having only two full-time equivalent staff), independence, and broad sector engagement to adequately fulfil its mission. However, we heard a strong appetite exists for national data standards and for New Zealand to be able to use data to its full capacity across the system.
Identity management is a critical enabler In health, identity management for consumers and providers is complex, and the system lacks any kind of centralised identity management solution for either consumers or providers.
Good identity management includes being able to:
irrefutably identify and authenticate who wants to access data (whether a consumer, whānau, caregiver, clinician, or organisation)
check the identified person/organisation is permitted to access the data they are seeking to access maintain an audit trail of who has accessed what data and when.
The growing importance placed on digital identity is not limited to health care in New Zealand. The Department of Internal Affairs has overall cross-government accountability for consumer identity and is updating its RealMe identifier to assist across government services.
Challenges remain, however. The way systems connect is not standardised, and the way data is captured is inconsistent. For example, the types and coding of demographic data varies depending on the provider and the system they use. This means that even though a consumer may have a single, unique NHI number, most consumers have multiple identities across different provider systems. This makes joining up consumer data to get a single view of a consumer challenging. It also makes accessing information and keeping it up to date challenging and frustrating.
The benefit of centralising identity management also extends to clinicians who spend a significant amount of time accessing multiple systems, requiring separate credentials for each.
Contractual gaps prevent data sharing System-wide contractual frameworks have gaps whereby some organisations are not contractually obligated to share data across providers, with DHBs, or with the Ministry of Health, despite receiving public funding streams. For example, discussions and submissions stated that some PHOs view patient data from GPs as PHO data and do not routinely share it with DHBs or the Ministry because they are not contractually obliged to do so.

NEW ZEALAND HEALTH AND DISABILITY SYSTEM REVIEW | HAUORA MANAAKI KI AOTEAROA WHĀNUI
PAGE | 242
A consequence is that it is not always easy to gather the required information to inform policy decisions or to evaluate implementation approaches. Lack of or delayed data sharing results in a long lag between a policy change and published research. On occasions, a further policy change may occur in the interim.
The onus is on the state to define contractual data requirements. These requirements should include data to inform clinical care, research, policy setting, and broader decision making. We will pursue this issue further in Phase Two.
National collections sometimes viewed as an overhead rather than as an enabler The Ministry of Health uses national collections of clinical data to measure system performance and inform policy and funding decisions. More widely, DHBs and other stakeholders working in the system also use these collections to inform clinical service planning, business case development, and performance analysis. In some areas, collections are comparatively robust; in others, collections are less well specified or complied with.
In all instances, the system-wide collection of data for secondary use is time-consuming and resource intensive. Considerable manual intervention is required to codify, aggregate, and format clinical data to meet Ministry of Health requirements. The Ministry’s national reporting framework is illustrated in Figure 12.1.
F I G U R E 1 2 . 1 : N A T I O N A L R E P O R T I N G F R A M E W O R K

INTERIM REPORT | PŪRONGO MŌ TĒNEI WĀ
PAGE | 243
However, the reality is far more complex and resource intensive than Figure 12.1 conveys. For example, data-recording activities involve 180 full-time equivalent clinical coders across the system reviewing and interpreting clinical notes and manually coding them to the applicable standards. The flows of data from DHB, GP, and PHO clinical systems is represented by simple arrows, but in reality it involves complex, resource-intensive work. Providers have to manually extract and manipulate much of their data before they can export in the Ministry-prescribed format for import into national collections databases. This creates a significant overhead and, because the processes are manual, carries a high risk of human error.
The national collections are criticised in three main areas.
Proactively defined and standardised health datasets are lacking. As noted, this means the required data and formats can change year by year, imposing significant demands on DHBs.
Data flows in only one direction. To address this issue, the Ministry is working to expose its collections data and report back to the sector through its QlikView platform. However, this platform is of limited use to DHBs and other providers that are developing their own reporting, business intelligence, and analytics platforms. Implementing standards and exposing national collections data to the sector using an application programming interface (API) enabled data ecosystem is an approach that has been adopted internationally (for example, by the United Kingdom’s NHS).
Data collection is not timely. Manual processing is a significant factor in the delays. Some data goes through several updates and revisions due to variations in coding standards across different providers and systems. The current Ministry approach is to wait until the data is complete before publishing it, rather than publishing with an explicitly defined margin of error or ‘unknown’ subset of data. The consequence is a sometimes significant data lag that negatively impacts on the quality of decision making. For example, the most recent mortality data available is for 2013. A look across the Health Quality and Safety Commission’s Atlas of Variation highlights how dated data is by the time it is published.
Looking to the future, the adoption of common data and interoperability standards should more readily enable the collation of key data elements without the need to manually code and consolidate data into national collections based on the outdated paradigm of aggregating data into large databases solely for the purpose of reporting. Access to distributed virtual datasets, supported by enhanced data science and artificial intelligence will remove the overhead of manually coding, processing, and staging data into a prescribed format for import into a collections database. At the same time, virtual datasets will open up the data for meaningful reporting and analytics across the entire system, which should support more ‘information effort’ going into analysis and use of data, rather than into data capture (as illustrated in Figure 12.2).

NEW ZEALAND HEALTH AND DISABILITY SYSTEM REVIEW | HAUORA MANAAKI KI AOTEAROA WHĀNUI
PAGE | 244
F I G U R E 1 2 . 2 : C H A N G I N G T H E B A L A N C E O F I N F O R M A T I O N E F F O R T
S O U R C E : M I N I S T R Y O F H E A L T H P R E S E N T A T I O N T O T H E P A N E L .
Privacy and data sovereignty
Privacy legislation is misunderstood Sharing data is critical to enabling an integrated consumer journey, and this must be done in a way that appropriately uses and protects data. In workshops and interviews during Phase One, privacy was cited as the main reason for providers not sharing data with other providers. Many organisations said they refused to share data because they believed the privacy legislation prevents it.
The Health Information Privacy Code 1994 sets out 12 rules for how health data is to be collected, used, held, and disclosed.426 During Phase One, two expert health lawyers noted that the code, in particular rule 11, sets out the rules for disclosure.427 For example, a health agency may disclose information if it reasonably believes:
that disclosure is one of the purposes for which the agency got the information it is necessary to uphold or enforce the law it is necessary for court proceedings the person concerned authorised the disclosure the information is going to be used in a form that does not identify the person concerned.
Disclosure is also permitted under a failsafe clause whereby data may be disclosed “to prevent or lessen a serious threat to … public health or public safety; or … the life or health of the individual concerned or another individual”.428
INTERIM REPORT | PŪRONGO MŌ TĒNEI WĀ
PAGE | 245
The experts agreed that the privacy barrier is more perceived than real and generally due to a lack of understanding about how the applicable legislation works. Non-identifying data can clearly be shared and used openly. Identifying data can be shared either with consent or under appropriate circumstances (such as when the data is needed to inform healthcare decisions).
Significant sensitivities exist around sharing potentially prejudicial information on stigmatising subjects such as mental health, addiction, and sexual health, even across healthcare settings. The code does not go down to that level of detail, so, in the absence of a framework that codifies what information may appropriately be disclosed under what circumstances, lawyers are frequently engaged to broker data-sharing agreements between agencies.
The experts emphasised the importance of consent. They agreed a robust consent and data governance and sovereignty framework is needed, as is the ability for consumers to access and, where appropriate, maintain their own data – all of which are currently lacking. One expert went further and suggested legislative recalibration is needed as is a role for the Health Quality and Safety Commission, or a similar independent agency, to provide guidance and stewardship over health information sharing.
Sharing a consumer’s data with their whānau is a frequent issue. The system appropriately defaults to not disclosing an individual’s data, but where an individual is happy to share data with their whānau or caregivers, there is no systematised process for enabling this.
Data sovereignty While data collection and technology are providing new platforms for delivering health services, issues exist around how data information and technology should be used. Issues and concerns also exist about data quality, including inconsistent collection of ethnicity data across the health system,429 and about data sovereignty and governance.430
The United Nations Permanent Forum on Indigenous Issues identified concerns about the collection, representation, and use of data about indigenous people – otherwise described as ‘data sovereignty’. These concerns are wide ranging but relate to issues such as the social and political contexts in and for which data is collected, the variable quality of how ethnicity and indigeneity are described and captured, and the failure of data to describe the unique cultural, social, environmental, and economic characteristics of indigenous groups.
The United Nations Declaration on the Rights of Indigenous Peoples provides a framework for considering indigenous rights and is considered a broad expression of the right to self-determination, including indigenous rights to access and control of their own data.431
Te Mana Raraunga / the Māori Data Sovereignty Network contends that Māori data is data that describes Māori and the environments with which they have a relationship and is a taonga, so is subject to the rights defined in te Tiriti o Waitangi / the Treaty of Waitangi and in the Declaration on the Rights of Indigenous Peoples. Māori data held by the Crown is seen as part of a spectrum between Crown obligations and Māori rights and interests, so has been the subject of a wide range of claims to the Waitangi Tribunal.

NEW ZEALAND HEALTH AND DISABILITY SYSTEM REVIEW | HAUORA MANAAKI KI AOTEAROA WHĀNUI
PAGE | 246
There are concerns about the secondary use of Māori data and, in particular, the failure to appropriately recognise the original purpose for which the data collection was consented and the context in which its use was intended. Māori rights and interests in data about Māori that has been linked, shared, and aggregated include:
Māori having access to and use of Māori data to improve and transform Māori lives data being collected and utilised that is relevant and responsive to Māori needs and aspirations building trust and value for Māori with data that recognises Māori contexts, realises potential
benefits for Māori, builds trust in the system that governs that data, and manages risks associated with the inappropriate use of Māori data.432
Te Mana Raraunga has developed a set of principles for Māori data sovereignty in Aotearoa New Zealand. These principles advocate for the realisation of Māori rights and interests in data and for the ethical use of data to enhance the wellbeing of Māori people, language, and culture. These principles are:
rangatiratanga / authority whakapapa / relationships whanaungatanga / obligations kotahitanga / collective benefit manaakitanga / reciprocity kaitiakitanga / guardianship.433
Concerns expressed by Māori are echoed by others.
However, it is also recognised that inclusion of Māori data is essential to delivering improved health outcomes for Māori. The health system needs to take accountability for improving the collection of ethnicity data and for ensuring that interpretation and use of data is consistent with data sovereignty principles. A whole-of-government approach will be required to address wider data sovereignty issues.
This will be particularly important as we encourage the use of more evidence-based clinical pathways etc. If Māori data is not fully incorporated into the evidence base the proposed processes or AI-enabled procedures will not properly account for Māori specific issues. It is most unlikely equity of outcomes will be improved without better Māori data being included in all analysis.

INTERIM REPORT | PŪRONGO MŌ TĒNEI WĀ
PAGE | 247
Vendors, systems, and interoperability During Phase One, New Zealand Health IT Cluster Inc (NZHIT) was commissioned to overview the current state of information technology (IT) systems and vendors across the sector and comment on the sector’s digital capability, including key issues and opportunities. This was in addition to direct engagement with IT and business stakeholders across the sector to gain further understanding of system-wide technology landscape and challenges. NZHIT noted in its report:434
Health has not yet moved through the maturity curve to recognise the benefits of the modern ‘digital business models’. This requires a public–private partnership approach (not only in a monetary sense) and the environment is absolutely ready for this as the industry sector wants to partner with the public sector to deliver the solutions that both consumers, patients and the providers of healthcare services require, now and into the future.
Vendor landscape Research shows that the New Zealand vendor ecosystem is competitive, at times adversarial, and financially constrained. Vendor-led adoption of standards and vendor-led innovation are limited. This situation has created a market exposed to disruption by a local or – more likely – international newcomer.
Health economics don’t support vendors to innovate. (Paraphrased stakeholder conversation)
The vendor ecosystem is dispersed, with about 150 active vendors providing IT solutions and services across the sector. Some vendors are in marginally viable businesses. As an example, the New Zealand–wide market for patient management systems (patient software that the 1,000 general practices across New Zealand use) is estimated as only being about $15 million per year. Five main vendors service this market, with the market leader having an 80% share and some of the smaller vendors each relying on a single developer, which leaves them and the system exposed to risk.
Systems landscape
Multiple customised applications
The 20 DHBs all deploy multiple applications.435 In many cases, multiple instances of the same application support different clinical functions, often down to specialty or subspecialty.
Many aged or legacy versions of systems are in use across the sector. This limits the functionality available to users and places an expensive legacy support burden on both vendors and providers. Many systems are heavily customised, which makes system maintenance and upgrades challenging and expensive. The difficulty and cost of change slows or prevents the adoption of new models of care for example, the roll out of the HPV primary screening programme is dependent on a complete application change. 436
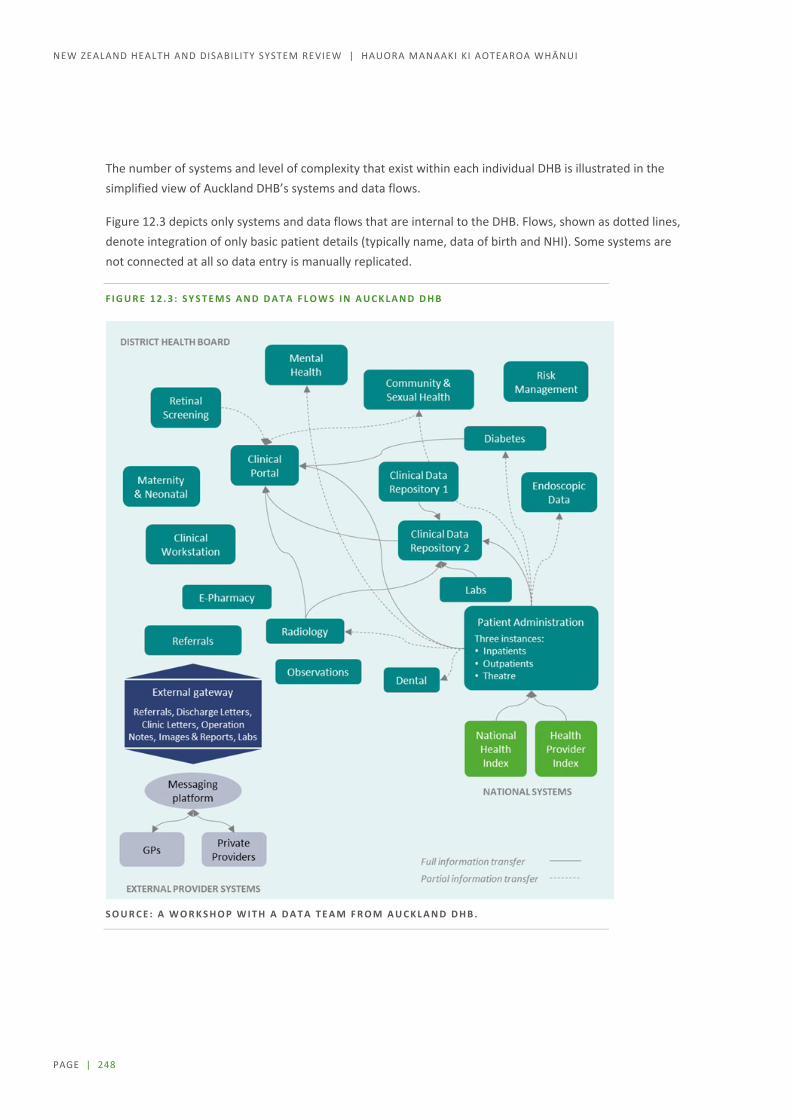
NEW ZEALAND HEALTH AND DISABILITY SYSTEM REVIEW | HAUORA MANAAKI KI AOTEAROA WHĀNUI
PAGE | 248
The number of systems and level of complexity that exist within each individual DHB is illustrated in the simplified view of Auckland DHB’s systems and data flows.
Figure 12.3 depicts only systems and data flows that are internal to the DHB. Flows, shown as dotted lines, denote integration of only basic patient details (typically name, data of birth and NHI). Some systems are not connected at all so data entry is manually replicated.
F I G U R E 1 2 . 3 : S Y S T E M S A N D D A T A F L O W S I N A U C K L A N D D H B
S O U R C E : A W O R K S H O P W I T H A D A T A T E A M F R O M A U C K L A N D D H B .

INTERIM REPORT | PŪRONGO MŌ TĒNEI WĀ
PAGE | 249
Even where applications are common across different DHBs, versions and implementations are typically different, which means datasets and functionality differ and cannot be readily shared. However, there are examples where some DHBs are working together to align, their systems. For example:
Health Connect South is a collaboration of the five South Island DHBs. It has leveraged Concerto across all of the South Island, connecting 20,000 users in hospitals and the community to share data collected by primary, community, and secondary providers.437 Data is collected from, and shared with, primary and community providers using the HealthOne system,438 which is integrated with Concerto and was developed following the Christchurch earthquakes by an alliance of Canterbury DHB, Orion Health (a software company), and Pegasus Health (a PHO). Access is read-only but it does provide clinicians with a more complete view of their consumers.
The Northern Region where the four DHBs have developed a regional information system strategic plan that maps out an applications system framework with core, common, and unique systems. Work is now progressing on foundation activity such as identity management and common interoperability and design standards. There is now a shared regional instance of Concerto which is currently used by Counties Manukau and Waitmata DHBs with Auckland and Northland DHBs joining over the next year. As with the shared South Island instance, data access through Concerto is read-only.
NZHIT also described use of IT for business operations and service delivery by many primary and community providers as “highly fragmented and unsophisticated” with extensive use of paper-based processes. Where data is captured in systems, it is “compartmentalised away from other health providers’ systems (not integrated or interoperable)”.439
Some Tier 1 areas have a very high level of digital uptake and a small number of vendors. However, many smaller NGOs use paper-based recording methods and care-planning processes that are transcribed into an electronic system ‘back at the office’. The implications of this are that there are gaps in consumer information, and it is challenging to share information between providers.
Application hosting – on-premise, cloud and hybrid
Application hosting and data storage is a mix of on-premise, cloud (public and private), and hybrid approaches.
DHB IT leaders generally describe their on-premise infrastructure as “fragile”, partially due to age and partially due to a lack of resilience because of a critical reliance on single pieces of hardware hosted in substandard facilities in hospitals.
The sector-wide (and global) trend is towards public cloud hosting of applications and infrastructure. However, migration to cloud hosting has been slow. The cost and difficulty of migrating legacy services and the limited availability of appropriately skilled resources are described as the major barriers. Meanwhile, the sector carries additional technical and consequential business and clinical risk due to fragile infrastructure sitting in substandard facilities.
NEW ZEALAND HEALTH AND DISABILITY SYSTEM REVIEW | HAUORA MANAAKI KI AOTEAROA WHĀNUI
PAGE | 250
Shadow IT
‘Shadow IT’ is common in DHBs where clinicians who perceive the organisation’s IT to be too slow or creating a roadblock develop their own solutions using whatever tools they have at their disposal. This approach typically introduces additional business and clinical risk due to the technology used and lack of structured IT management and support.
One example of shadow IT is a system a clinician developed in 2001 to support admission and discharge of patients from a DHB’s intensive care unit. By 2018, the system contained records of more than 26,000 admissions and had become a core part of the unit’s operation. The system created an ‘island’ of information, separate from the DHB’s other systems. Although it was useful for its intended purpose, it used technology not suited to supporting multiple concurrent users, was heavily reliant on key individual staff, and was open to backup failure.
IT leaders across the system are concerned that hundreds, if not thousands, of similar clinician-developed solutions exist across the health sector. Such solutions are well intentioned and may have been acceptable once. However, as the health and disability system becomes increasingly reliant on digital technologies, those technologies need to be reliable, secure, and fit for purpose, so a different approach is needed for safe and beneficial clinician-led innovation.
Historically, shadow IT used commonly available desktop applications like Microsoft Excel and Access but now mobile and cloud-based applications and platforms are most commonly used. This is positive because it mitigates some of the risks around solutions being technically reliable and scalable, plus it makes interoperability easier, but it is unclear whether data sovereignty and security are appropriately considered.
This challenge is not unique to health, and organisations in other sectors are responding by putting in place protocols and standards for the adoption and use of cloud-based applications. In some cases, they are providing pre-evaluated, pre-integrated apps, and data available in approved cloud platforms that provide a flexible environment for innovators to build in.
Systems integration and interoperability is poor Even within large and (comparatively) well-resourced DHBs, the extent of systems integration and interoperability is generally low and restricted to replicating very basic patient details (such as name, date of birth, and NHI number) across a few core systems. New Zealand’s health and disability system doesn’t use mandated open, standards-based APIs and lacks mandated supporting data standards.
Current system integrations have evolved using old architecture and methods that are complex and expensive to maintain and change. The typical DHB response to this evolution has been to implement a clinical portal to mitigate clinical risk by providing hospital clinicians with a view of patient data across multiple systems. However, clinical portals are generally read-only, so clinicians typically have to log into multiple underlying systems separately to add or update source data. Several commentators referred to the burden of data entry across multiple disparate systems as a significant contributor to clinician burnout. One DHB Clinical Reference and Applications Group cited some of the DHB’s nurses having to use 14 different applications in their day-to-day work with the same data being entered into multiple systems.

INTERIM REPORT | PŪRONGO MŌ TĒNEI WĀ
PAGE | 251
The issue is not limited to DHBs. NZHIT describes primary care as “highly connected” with the typical New Zealand GP communicating electronically with 84 “trading partners” each month. However, this connectivity is often achieved using outdated methods – sending data in non-machine-readable formats such as PDF files via expensive third-party messaging platforms or even by fax.
OUTDATED TECHNOLOGY STILL COMMONLY IN USE
For example, it is common for all the patient information that a DHB shares with GPs to be extracted out of the DHB’s systems, and turned into PDF documents, then sent via a bespoke messaging gateway, and then over the HealthLink messaging platform. The information the GPs end up with in their systems is not machine-readable, – being sent as PDF documents files that are difficult to access and utilise use in clinical settings, – and the communications mechanism is expensive and outdated. The technology industry as a whole has moved away from messaging-based models towards open application programming interface (API) based integration and interoperability to share data and functionality across systems.
To address the lack of integration and interoperability, the Ministry has proposed a national health information platform (nHIP) that will create a virtual electronic health record (virtual EHR) that is a complete view of a patient across existing systems and data. This approach is similar to that airlines and banks use to hide the complexity of legacy systems and expose their data and functionality through open, standards-based APIs.
The nHIP would provide a powerful platform for data integration and systems interoperability across the sector. However, large integration platforms can add complexity of their own, so, while they may provide massive benefit in the short to medium term, experience shows they can become bottlenecks and barriers to future change. There is no question that the sector needs nHIP now, but it will not be sufficient on its own. The nHIP will need to be complemented by data and interoperability standards so that, as legacy systems are replaced or new systems are added, the sector moves towards an open, API-based ecosystem supporting interoperability without total reliance on the nHIP. Standards are being developed and implemented in other jurisdictions that New Zealand could consider adopting – many vendors are operating internationally, so are used to complying with these standards.
Interoperability is critical to the delivery of an integrated digital platform Some argue that the data sharing and interoperability challenge could be solved with a wholesale move to a ‘monolithic’ system – an all-in-one healthcare system – as this would force standardisation and require less integration. This does, however, come at the cost of flexibility and user experience.440 Monolithic systems also tend to be expensive and risky to implement. The market leaders are large international players so changes and features wanted by New Zealand users would be unlikely to be prioritised over those of larger international customers. Some countries have experienced significant disruption with ‘one size fits all’ implementations,441 downstream usability and productivity impacts on providers,442 and, sometimes, worse outcomes for consumers.443
NEW ZEALAND HEALTH AND DISABILITY SYSTEM REVIEW | HAUORA MANAAKI KI AOTEAROA WHĀNUI
PAGE | 252
INTERNATIONAL EXPERIENCE
International data and interoperability standards are being designed and implemented to enable data sharing.
In the United States, Centers for Medicare and Medicaid Services (CMS) is driving its MyHealthEData initiative to improve patient access and advance electronic data exchange and care coordination throughout the healthcare system. The Interoperability and Patient Access Proposed Rule outlines opportunities to make patient data more useful and transferable through open, secure, standardised, and machine-readable formats while reducing restrictive burdens on healthcare providers.444
In the United Kingdom in late 2018, the NHS, in response to reviews and reports calling out fragmented and duplicated data, set out a draft framework for technology and data standards to which all future IT systems and digital services in the service must comply.445 This framework has been picked up by the newly formed NHSX, which has, among its responsibilities, been tasked with: 446
setting national policy and developing best practice for NHS technology, digital and data – including data-sharing and transparency
setting standards – developing, agreeing and mandating clear standards for the use of technology in the NHS
ensuring that NHS systems can talk to each other across the health and care system.
NHSX announced in April that from July 2019 it will mandate the use of internationally-recognised technology and data standards across the NHS.447
Observations from the United Kingdom, Scandinavia, Canada, and the United States indicate that while most ‘digital leaders’ have successfully implemented monolithic systems within individual organisations, this approach has not been as successful when tried at a system level.
New Zealand’s current state is very much ‘best of breed’. Forcing a transition to monolithic systems, whether at DHB, regional, or national level, would involve large-scale change. Experience has shown that, for a variety of reasons, health, and the public sector in general, does not do large-scale IT projects well.
Another consideration is the impact on the local vendor ecosystem. Arguably, the systems could stand some rationalisation but a large-scale change to international vendor–supplied monolithic solutions could have a significant impact on New Zealand’s current health vendor ecosystem, potentially leaving the country exposed to large-scale international vendors.

INTERIM REPORT | PŪRONGO MŌ TĒNEI WĀ
PAGE | 253
A lower risk alternative is mandating data and interoperability standards to ensure joined-up systems and data, then working with vendors to implement them. This could be done in smaller increments and used as a lever to modernise legacy and aged systems. Such an approach allows for decoupling of systems domains, separating (stable) systems of record from (agile) systems of engagement, which enables rapid changes and improvements to models of care and user experience.
Cybersecurity National Computer Emergency Response Team (CERT NZ) quarterly reports show a trend of quarter-by-quarter increases in the number of cybersecurity issues and incidents affecting New Zealand organisations and individuals.448 As the health sector becomes more reliant on digital technologies, it is becoming increasingly attractive for cybercriminals to target.
The threat now extends well beyond the theft of confidential consumer data. With the system becoming reliant on internet-attached devices for everything from managing consumer data and laboratory results, to radiology scanners, and even building services such as lifts, lights, and air-conditioning, a serious cybersecurity incident could paralyse the system and put consumer lives at risk.
The May 2017 WannaCry ransomware attack infected vulnerable Windows-based systems all over the world, encrypting data and holding computers to ransom. In the United Kingdom, the NHS was hit particularly hard and was forced to cancel 20,000 hospital appointments. WannaCry affected more than PCs as the prevalence of embedded Windows operating systems in radiology and laboratory equipment means they, too, are vulnerable. The NHS did not specify the equipment affected but did acknowledge that devices such as MRI scanners and blood test analysis devices were affected. A 2018 Health Advisory Committee report showed that similar vulnerabilities exist in New Zealand.449
Cybersecurity good practice is well defined– on top of the published government standards, up-to-date advice and guidance is available through CERT NZ and other agencies. Most cybersecurity issues can be mitigated through relatively simple ‘IT hygiene’ controls such as patching software and changing default usernames and passwords. The impacts of incidents can be minimised by implementing and testing back-ups and workarounds for critical systems and business processes. Unfortunately, IT industry experience shows that when IT organisations are under stress, due to a scarcity of funding, or, other resources and their focus is on ‘keeping the lights on’ day to day, basic hygiene practices can fall to the wayside. Further risk is added when IT architecture, applications and infrastructure are dated, as is the case in New Zealand. It is critical, therefore, that there is cross-sector leadership and sufficient resourcing to implement and maintain government standards and good practice on cybersecurity and business continuity.

NEW ZEALAND HEALTH AND DISABILITY SYSTEM REVIEW | HAUORA MANAAKI KI AOTEAROA WHĀNUI
PAGE | 254
Equity During Phase One, equity and the role of digital delivery models and ways of working came up in several stakeholder meetings. Some programmes running across the sector are developing websites and mobile apps to better engage, serve, and inform Māori, young, and rural consumers.
Research shows clear opportunities exist for digital delivery models to improve equity and enhance democratisation of health care, but also barriers and risks, including that of the digital divide potentially exacerbating inequities.450
A local project that demonstrates the opportunities associated with taking a data-driven approach is The People’s Project.451 It works across government and in the community to rehouse people who are homeless using comprehensive team support and care.
Other local and international examples of opportunities and challenges are summarised in Table 12.1 and Table 12.2, respectively.
A University of Otago study documents how The People’s Project took a cohort of clients and linked them across the Statistic New Zealand’s Integrated Data Infrastructure (IDI).1 The IDI contains administrative data on most services the Government provides to citizens. Linkage rates in all datasets were above 90%.
The study found that, in the preceding five years, the 390 people in the cohort had had 200,000 interactions with various government departments. The findings are significant, as they demonstrate how a cohort that is supposedly ‘hard to reach’ is highly traceable across a variety of government records and are more likely ‘victims of inadequate systems’.
The project was highly successful in demonstrating data sets could be linked across agencies to inform decision-making that improved on the outcomes for people. Key lessons included the need for enhanced data stewardship, pro-active consent processes and ongoing consumer engagement.

INTERIM REPORT | PŪRONGO MŌ TĒNEI WĀ
PAGE | 255
T A B L E 1 2 . 1 : O P P O R T U N I T I E S F O R D I G I T A L D E L I V E R Y M O D E L S T O I M P R O V E E Q U I T Y
Opportunity Description
Telehealth Consultations via video conference can provide more equitable access to services, for example:
improved access to nurse practitioners, GPs, and other services in rural areas where attracting health professionals is challenging
improved access for vulnerable or marginalised urban consumers who can’t attend clinic-based appointments due to work or childcare commitments or transport costs
mitigating the ‘postcode lottery’ by improving access to specialists in urban centres without the consumer or clinician needing to travel.
Remote monitoring Remote monitoring of vulnerable consumers can reduce hospital admissions. An NHS study monitored vulnerable residential and nursing home patients for early signs of urinary tract infections over 2½ years and demonstrated a 6 : 1 return on investment by avoiding 57 admissions from a cohort of 100 patients.1
Technology-enabled care services evidence database2
For example, an NHS database that catalogues a wide variety of trials and implementations of various telemonitoring, telehealth, and telemedicine use cases.
Personalised and culturally adapted health and wellness information and services
Peer communities and chat groups via websites and mobile apps to better engage young people and other groups who prefer to self-serve and seek connectedness online. For example:
Te Tihi o Ruahine Whānau Ora Alliance’s Te Mauri Moemoeā rangatahi wellness web app3
Whānau Tahi connected care platforms4 an NHS programme to encourage medical professionals to prescribe apps
for their patients with chronic conditions (for example, chronic obstructive pulmonary disease and gestational diabetes) reduced the number of patient visits by 25% over a two-year trial run by the Royal Berkshire Trust.
Shared care plans Plans made collaboratively between health professionals, other support services, and whānau that are managed in real time using mobile apps.
Genomics and precision medicine
Treatments that are tailored and specific to the individual, not based on general population data, which is usually skewed against marginalised populations.
1 NHS England. No date. TECS Case Study 003: Telehealth monitoring for early signs of urinary tract infection in vulnerable people.
https://www.england.nhs.uk/wp-content/uploads/2014/12/tecs-kernow.pdf 2 NHS England. No date. Strategic planning resources for commissioners (web page). https://www.england.nhs.uk/tecs/strategic-
planning/ 3 Te Tihi. No date. Gamification (webpage). https://tetihi.org.nz/what-s-on/item/1-gamification 4 Whānau Tahi. No date. Empowering whānau centric, self-directed change and care (web page). http://www.whanautahi.com
NEW ZEALAND HEALTH AND DISABILITY SYSTEM REVIEW | HAUORA MANAAKI KI AOTEAROA WHĀNUI
PAGE | 256
T A B L E 1 2 . 2 : C H A L L E N G E S F O R D I G I T A L D E L I V E R Y M O D E L S T O I M P R O V E E Q U I T Y
Challenge Description
Variability of broadband and mobile infrastructure and digital skill levels
Although broadband and mobile coverage is expanding, infrastructure availability, access to infrastructure, and digital skill levels continue to be variable across New Zealand.1
Affordability of mobile data for some populations
The Ministry is piloting with three mobile providers ways to zero-rate (to the consumer) data consumed by some health-related services.
Data collection gaps Data collection gaps may exacerbate inequitable outcomes. Examples are seen across populations including Māori, Pacific peoples, disabled people, and rural populations. For example, if Māori data is not adequately represented in datasets used in the research and development of treatments, and artificial intelligence algorithms are used for diagnosis or to drive expert systems, worse health outcomes could result for Māori.
Lack of standardised data related to race, ethnicity, and disability
The lack of standardised data related to race, ethnicity, disability, and so on prevents high-quality disaggregation. For example, Māori and Pacific peoples are often aggregated into a single ethnic group, as are all Asian peoples.
1 Digital Divide NZ. www.digitaldivide.nz
Ways of working inhibit the potential of technology Some current ways of working in New Zealand inhibit the full potential of technology across the health and disability system.
Lack of execution of information and digital strategies Recommendations to improve data sharing, and implement data standards and electronic health records go back as far as the 2001 WAVE report.452 The key outcome of which was the establishment of the Health Information Standards Organisation, which has developed standards but been relatively ineffective at implementing them. The WAVE report was superseded by the Health Information Strategy for NZ in 2005, 453 the National Health IT Plan in 2010, 454 and Digital Health 2020455 (which, 18 years after electronic health records were first recommended, led to the current nHIP business case).
We have digital strategy with no evidence of execution. (Paraphrased stakeholder conversation)

INTERIM REPORT | PŪRONGO MŌ TĒNEI WĀ
PAGE | 257
The causes underlying the lack of execution are many and complex, including:
frequent leadership changes complex siloed and layered structure of the system lack of leadership, mandate, and accountability unclear roles and responsibilities between national, regional, and local organisations private sector–style competition between publicly funded organisations lack of system-wide thinking and collaboration national projects driven top-down and not well received (not considered fit for purpose, sometimes
with minimal user representation) training and change management are typically poorly delivered, being either the first lines cut from
projects when budgets come under pressure or poorly planned and not allowed for in the first place.
When the factors occur, poorly implemented change results and can drive workforce change fatigue and cynicism. Participation in – and adoption of – future change becomes even more challenging.
A further challenge to executing strategy is the burden of fragile legacy systems and infrastructure. Generally, most available funding is required to support business-as-usual activity, leaving minimal funding and resources for transformation. The response to this across other industries has been to move to ‘bimodal’ IT delivery models whereby business-as-usual and transformational resources and funding are separated and ring-fenced.
Lack of ability to scale innovation During Phase One, we saw good localised pockets of digital innovation within DHBs, PHOs, NGOs, and other organisations. The main concern raised in these instances was that there seems to be little ability to accelerate and scale successful work to the regional or national level.
[The Ministry of Health] can enable scaling of local innovations. As the system steward, [the Ministry] can play a key role in promoting innovative practices across the system, especially by providing opportunities to scale local innovative practice to become nationally available. (Organisation submission)
… the existing public health system may not be the best deliverer of disruptive technology that would bring positive benefit. (Organisation submission)
A clear need exists for some kind of national, sector-wide coordination and sharing of ideas, skills, and how-to knowledge, for the evaluation of innovation work, and for funding to support useful innovation being scaled and utilised across the system.

NEW ZEALAND HEALTH AND DISABILITY SYSTEM REVIEW | HAUORA MANAAKI KI AOTEAROA WHĀNUI
PAGE | 258
Regulation lacks protections and avenues for innovation New technology, disruptive business models, and smart use of technology can lead to significant change in traditional industries, but often regulation surrounding new technologies lacks certain protections and avenues for innovation. Oft-used examples are electric vehicles, Uber and AirBnB. Digital transformation of health care also carries risk –genomics and artificial intelligence are examples that provide significant opportunities but also potential for negative consumer outcomes if not well managed.
An early lesson from other countries is that regulatory approaches developed for pharmaceuticals and medical devices are unlikely to be sufficient for AI and genomics:
In 2017, the Food and Drug Administration in the United States created a new unit dedicated to digital health. The unit includes engineers, software developers, artificial intelligence, and cloud computing experts to prepare the agency for regulating modern digital technologies.
In the United Kingdom, an independent all-of-government data and ethics organisation, the Centre for Data Ethics and Innovation, has been established to facilitate safe, ethical, and equitable decisions about new and innovative technologies.
The [Centre for Data Ethics and Innovation] will make sure our society can keep pace with these dramatic changes and maximise the benefits they bring. From helping us deal with the novel ethical issues raised by rapidly-developing technologies such as artificial intelligence, agreeing best practice around data use to identifying potential new regulations, the Centre will set out the measures needed to build trust and enable innovation in data-driven technologies. 456
New Zealand is a small economy with limited expertise to stay abreast of all relevant new technology. Leveraging work from other jurisdictions will be important if the system is to maximise the gains that can be made from new technology without exposing New Zealanders to unnecessary risk.
ARTIFICIAL INTELLIGENCE
Artificial intelligence (AI) will eventually impact on all aspects of medicine, but for now radiology is a very useful practical application with AI algorithms providing screening and diagnostic services for an increasing array of conditions.
The Royal Australian and New Zealand College of Radiologists is embracing the use of AI, but is also concerned by the lack of standards and regulation. The college’s response to this lack has been to draft a code of ethics to inform standards and regulation for the development and use of AI. Funders, regulators, and other yet to be affected clinical specialties have had limited interest in the code.
The Royal Australasian College of Medical Administrators is also leading work in this area. It is developing an approach to enhance clinical leaders’ competencies in digital health, including understanding and use of AI and machine learning.

INTERIM REPORT | PŪRONGO MŌ TĒNEI WĀ
PAGE | 259
Shared services can be a barrier to digital transformation The need to work more closely together on digital and data issues is not new to the sector. In each of the four regions, some form of shared service agency or function is in place for digital and data. Their size and scope varies. The largest, healthAlliance (owned by and serving the four Northern Region DHBs), is now one of the largest IT providers in the country. It provides software, IT infrastructure, payroll services, and project and programme services.
DHB chief information officers report that shared service agencies do a good job with their core business of running commodity IT infrastructure at a good price point. However, they are concerned that shared service agencies can be a barrier to digital transformation and, at times, exceed their mandate. The nub of that issue is that the mandate of shared service agencies – and, for that matter, the respective mandates of DHBs, PHOs, NGOs, and the Ministry – is unclear and has become increasingly unclear as the role and scope of digital technologies and IT in health care have grown.
The perception that shared services agencies may be a barrier to digital transformation shows that their respective roles and responsibilities are unclear or wrong, or, that the DHBs are not managing the agencies well.
Roles and responsibilities and ways of working across the sector will need to be redefined in the context of what work is required to digitise health care. Some digital foundations should be established once rather than in each of the 20 DHBs, 30 PHOs, and countless NGOs.
Investment, procurement, and decision making Sector-wide spending on IT in New Zealand is low relative to spending in other sectors and in the health sector internationally. NZHIT estimated, based on DHB reporting, that 2.3% of the total health spend goes into IT. The accepted global health industry average is 4.6%457 and Deloitte cites 3.5%.458 The relatively low level of IT spending in New Zealand is not limited to DHBs. In general, the primary sector is also a very low spender.
A prevailing myth – not just in health – is that by moving services into the cloud IT can reduce costs. The reality is that transformation does not happen without investment.
Competition with other spending areas, from property to healthcare delivery, is also cited as an issue.
We need to separate funding for healthcare policy and funding for digital transformation. (Paraphrased stakeholder conversation)
Achieving digitisation and transformation will require increased spend for a period of time as the shift is made to modern platforms and old, fragile systems and infrastructure are decommissioned. This will require a review of digital procurement approaches. Current procurement processes are slow and do not always support digital ways of working that are agile, iterative, and more co-design–led.
NEW ZEALAND HEALTH AND DISABILITY SYSTEM REVIEW | HAUORA MANAAKI KI AOTEAROA WHĀNUI
PAGE | 260
[The Ministry of Health and Ministry of Business, Innovation and Employment] need to be an enabler to share/spread good innovation but national procurement requirements are a barrier. (paraphrased stakeholder conversation)
In planning for a digital future, it will be important that decision-making processes and decision rights are clear, that agility is supported, and that the environment supports the momentum needed to drive innovation and successfully deliver new services.
Workforce capability, capacity, and readiness must be developed Although there are pockets of excellence, the health workforce on the whole – clinical, administrative, and IT – appears to lack the capability, capacity, and readiness for digital transformation. We observed the following.
Across the breadth and depth of the sector, the level of understanding of what ‘digital’ means and its likely impacts is low.
Digital leadership is often diffuse. Leaders lack either digital literacy or the authority or ability (that is, funding and other resources) to execute any digital strategy. This was a consistent theme across our Phase One engagement. A variety of clinical and business leaders across PHOs and DHBs commented on the limited number of digitally savvy executive leaders and business decision makers, which resulted in lower priorities and investment for digital and other IT projects and services.
The workforce is generally cynical about change, partially due to change fatigue and partially because technology change has been poorly delivered with user training and organisational change management the first lines cut from projects when the budget comes under pressure.
Increasing digital literacy among staff is sometimes resisted by those who have been in health for many years and rely on old skill sets.
Increasing digital literacy and skills across the existing health and disability workforce is essential and requires investment. For example the NHS has established a digital academy. The academy takes clinical and business leaders through a postgraduate diploma in digital health leadership with a view to developing “a new generation of excellent digital leaders who can drive the information and technology transformation of the NHS”.459
Health will also need to compete with other sectors for new workforce roles, such as experience designers, Agile coaches, and data scientists, and will need to realign itself to become and remain attractive in a globally competitive environment for talent.
INTERIM REPORT | PŪRONGO MŌ TĒNEI WĀ
PAGE | 261
The impact of change tends to be underestimated. For digital transformation to be successful, workforce development and organisational change management will more routinely need to be included in all digital initiatives. As W Edwards Deming said:460
Nobody goes to work to do a bad job … Put a good person in a bad system and the bad system wins, no contest.
The New Zealand health system is full of passionate and caring ‘good people’ who are doing the best work they can within the constraints and challenges the system presents to them daily. The right foundations must be put in place:
data standards and interoperability so data can flow openly across the system and enable new models of care
clear roles and responsibilities of the different entities in the system new ways of working to enable collaborative execution of a digital strategy and future innovation.
Getting those foundations in place will enable New Zealand to fully and effectively leverage digital technologies to unlock and unleash the capabilities of all those good people to improve the health and wellbeing of all New Zealanders.

NEW ZEALAND HEALTH AND DISABILITY SYSTEM REVIEW | HAUORA MANAAKI KI AOTEAROA WHĀNUI
PAGE | 262
Directions for change: Digital and data Advances in digital technologies have huge potential to enable an information-rich, data-driven, people-powered approach to health care and to support the health sector in achieving better outcomes. New technologies such as genomics, artificial intelligence, and digital medicine are already transforming healthcare services, and other digital technologies, such as mobile, social media, cloud services, and analytics are changing the way healthcare services are delivered and consumed.
Good data needs to be one of the foundations of the health and wellbeing system. It enables consumers and providers to access and share information, plan, and make decisions about appropriate care. It can also help consumers to take control of their own health and wellbeing. For organisations and government, good data supports better decision making and planning, drives research and innovation, and enables monitoring and measurement of outcomes.
R O B U S T A N D A C C E S S I B L E D A T A
The system is becoming increasingly dependent on data and digital solutions. The Panel believes that the system needs to be better informed at every level by robust and timely data that is readily accessible to all who work in the system and all who use the system. Better data and more use of digital solutions is not only a necessity but it also provides an opportunity to free up clinician time to focus on more caring and to support those people who wish to use technology to help take greater control of managing their own health and wellbeing.
S T R O N G L E A D E R S H I P T O D R I V E D A T A S T A N D A R D S A N D O T H E R M A N D A T E S
The Panel believes that implementation of data standards, data stewardship, identity management, and interoperability must be accelerated. This will require strong national leadership, but will be essential for improving effectiveness and supporting collaborative and team-based working.
D I G I T A L L I T E R A C Y A N D N E W W A Y S O F W O R K I N G
The Panel supports digital development at every level of the system. Training in new skills and ways of working will need to be embedded in an overall workforce strategy and development plan. New roles, such as for data analysts, will be required, and the system will need to make these roles attractive, as demand will be significant across the economy.

INTERIM REPORT | PŪRONGO MŌ TĒNEI WĀ
PAGE | 263
13 Facilities and equipment / Ngā rauhanga me ngā taputapu
Facilities and equipment are essential to the provision of services and investment capital is needed to ensure facilities and equipment are fit for purpose. Unfortunately the current state of DHB assets is not good and there is little in the way of long term planning which can give any confidence that the problem is under control.
The process for justifying, designing, developing and commissioning major health facilities is complex and specialised. The section notes the scarcity of expertise in New Zealand, and questions whether these activities should continue to happen in multiple sites or whether some consolidation is preferable.
The section also looks at the way prioritisation and funding decisions are currently made and considers how better long term planning and more predictable funding might improve the performance of the system.
Overview Recent high-profile examples of facilities failure show how functions like asset management can have a direct impact on patients and the services they need. Similar to other sectors, there are ongoing pressures on the availability of capital funding. It is inevitable that some form of prioritisation will need to continue.
Many public hospitals are running at very high levels of filled capacity, particularly during the winter. This makes it harder to deliver services, leads to delays, disrupts patient flow, and, ultimately, can harm patient outcomes. Modifications or repairs to existing facilities can also be disruptive to service delivery, particularly when spare capacity is low or non-existent. Pushing to make maximum use of capacity can reduce the effectiveness of service delivery.

NEW ZEALAND HEALTH AND DISABILITY SYSTEM REVIEW | HAUORA MANAAKI KI AOTEAROA WHĀNUI
PAGE | 264
Capital investment decisions shape how services are delivered long into the future. Investment decisions taken today can significantly affect, and arguably pre-determine the service models of tomorrow. New Zealand, like many other international jurisdictions must recognise that fact.
Large facility development is often a once in a generation investment, and substantial changes can be expensive. Well-designed facilities are flexible enough to support and enable new ways of providing services in the future. Poorly designed facilities can lock-in existing service models, preventing service delivery from evolving to better meet the needs of patients. Therefore, taking a long-term view is essential to inform good capital investment decisions.
Current state of DHB assets poor DHBs collectively hold around $7 billion of non-current assets on their balance sheets, with around $6 billion of this being land and non-residential buildings. Other significant assets include clinical and other equipment ($480 million), IT and software ($160 million). The health portfolio is the fourth largest government asset portfolio after housing, school property, and state highways.
T A B L E 1 3 . 1 : N O N - C U R R E N T A S S E T S B Y D H B R E G I O N , A S A T 3 0 J U N E 2 0 1 8
($ millions) Northern Midlands Central Southern Total
Land 806 84 95 207 1,192
Buildings, improvements & plant 1,578 1,178 1,027 839 4,622
Clinical equipment 161 90 76 102 429
Other equipment 19 9 7 16 50
Information technology & software 5 48 58 52 163
Other 365 72 118 98 653
Total 2,934 1,482 1,380 1,314 7,109
Note: Land and buildings are measured at fair value less accumulated depreciation. All other assets are measured at cost, less accumulated depreciation and impairment losses.
S O U R C E : M I N I S T R Y O F H E A L T H , D H B F I N A N C I A L A C C O U N T S .
DHBs project that $14 billion of new capital investment will be needed over the next 10 years. This is over a third of projected capital investment across government. This is double the $7 billion projected just three years earlier and compares with only $4.6 billion invested from 2009/10 to 2016/17.
DHBs have assessed that around 19% of their assets are in poor or very poor condition, and some facilities are many decades old. The Ministry of Health is developing a national asset management plan, which will give an updated view on the condition of DHB assets
INTERIM REPORT | PŪRONGO MŌ TĒNEI WĀ
PAGE | 265
A significant number of facilities are not fit for current models of care. For example, the Northern Region estimates that a fifth of clinical services are provided in facilities that are not fit for purpose, including Whangarei Hospital and some Middlemore Hospital facilities. Many facilities also have resilience issues, such as vulnerable power supply infrastructure, earthquake strengthening needs, and leaky building problems.
Capital investment often requires ministerial approval A variety of rules govern how DHB investment decisions are made and funded.
For capital investments under $10 million, individual DHBs and their boards can fund and approve investments. A lower threshold of $3 million applies to information and communications technology (ICT) enabled investments.
For capital investments over $10 million (or any capital investment that seeks additional funding from the government), DHBs must seek approval from the Ministers of Health and Finance. This includes investments that are entirely self-funded by the DHB. If approved, government funding for these projects comes from the health capital envelope – a specific appropriation for health capital projects.
Capital investments outside the health capital envelope must be approved directly by Cabinet.
To support ministers in making their decisions, DHBs must develop business cases and submit them to the Capital Investment Committee (CIC). This is a ministerial committee established under the New Zealand Public Health and Disability Act 2000.461 It reviews DHB business cases, prioritises capital investment, and provides independent advice to the Ministers of Health and Finance.
If approved by ministers, a capital project is then managed and governed by individual DHBs or through a partnership group. Under the latter approach, the Ministry of Health holds contracts and legal accountability for the delivery of the project. The ministers appoint a partnership group to oversee the project. Partnership groups are in place in Canterbury, West Coast, and Southern DHBs. Once the asset is completed, its ownership transfers to the DHB.
Managing to a system plan
Capital investment must be consistent with a long-term service plan The system has long recognised that capital investment decisions should be based on a long-term service plan. This view was reflected in the report of the 2009 Ministerial Review Group, which noted that “[h]ealth service planning needs to drive investment planning or we risk locking ourselves into replicating the current locally-driven and hospital-centric capacity”.462 It was also reflected in the role and scope of the CIC, which would “develop a National Asset Management Plan (NAMP) for the health system based on agreed service plans”.463
NEW ZEALAND HEALTH AND DISABILITY SYSTEM REVIEW | HAUORA MANAAKI KI AOTEAROA WHĀNUI
PAGE | 266
However, a long-term services plan has not been developed. The Ministry of Health is due to develop the National Asset Management Plan by the end of 2019. This is positive, but needs to be tied to a long-term services plan so new facilities are fit for future models of care and are distributed in a way that will best meet population requirements.
Prioritisation based on long-term planning In the past, few business cases were approved due to fiscal constraints and the need to prioritise Canterbury DHB projects following the Canterbury earthquake. Business cases were assessed on an individual basis, rather than prioritised against other proposals. In 2018 the committee with the Ministry of Health, and Treasury developed an initial methodology for prioritising projects.
New government funding for health capital investments has been available on an annual basis through the health capital envelope. Approved funding for capital investments cannot exceed this limit in any particular year, and the full cost of the project is counted against the capital envelope in the year it is approved.
Most projects include multi-year expenditure so will not use the full amount of approved funding in that year. This means a project can ‘use up’ approved funding in the capital envelope even though it does not actually draw down that funding that year. The consequence of this has been a tendency to require large projects to be broken into smaller ones and/or priority being given to those projects where expenditure is planned to occur sooner.
This may not be consistent with long term service and capital needs.
In Budget 2019, the government introduced a multi-year funding approach to the health capital envelope, which allows funding to be shifted over two financial years (2019/20 and 2020/21). This improves the allocation process slightly but more consideration needs to be given to how government accounting rules and sector planning can work more effectively.
Effective prioritisation requires visibility of the pipeline of future investment needs across the system. The National Asset Management Plan should provide some of this information. However, the Ministerial Review Group recommended producing such a plan a decade ago, and it has been a role of the Capital Investment Committee since 2011. In addition, DHBs’ 10-year capital intentions have doubled to $14 billion in just three years. It is clear the system has not done a good job of measuring and accurately reporting its infrastructure needs. During Phase Two, the Review will look further at options for making infrastructure planning more transparent and better integrated with inter system growth.
Links with local government, education, and transport planning need better coordination Discussion with capital planners also suggested that the health and disability system could better coordinate its planning with other sectors, such as local government, education, and transport. Hospital facilities are important community amenities, need fast and convenient transport access, and are significant employers. As the system makes greater use of community-based facilities, it will be important to place these facilities near transport links, schools, and closer to high-need communities. Locating facilities near marae, churches, and other community centres can help make services more convenient and welcoming.

INTERIM REPORT | PŪRONGO MŌ TĒNEI WĀ
PAGE | 267
Delivery of major capital projects
Process for new projects is resource-intensive The $10 million threshold for ministerial approval was set in 2000. An additional lower threshold of $3 million applies to ICT-enabled investments. These thresholds are lower than those applied to other social sector agencies and are the same for all DHBs –from West Coast DHB that has $31 million of non-current assets to Auckland DHB that has $1.1 billion of non-current assets. These thresholds are also in capital expenditure terms, not whole-of-life costs. This means the downstream costs of a proposal are not considered, which is not consistent with practice used across government.
Limited capability and capacity Major facility investments are complex and require specific capability and expertise.
Developing the business case involves developing the strategic clinical and operational case for change, evaluating options, completing design work to a sufficient level of detail to support the proposed case for change, and undertaking detailed financial, risk and benefits appraisals. This work is brought together using the Treasury’s Better Business Case approach and needs to be managed by DHBs and the evaluation and prioritisation process of the Capital Investment Committee.
Managing the procurement process involves completing all required documentation and running a process that is fully compliant with the government rules of sourcing, manages sector risk, and delivers a value-for-money development agreement. Major construction or capital works projects in other industries draw on legal, architectural, commercial, and procurement advisors that specialise in capital works. The pool of health sector expertise is limited.
Managing the delivery of capital works requires specialist expertise. Health projects are often complex because the building, equipment, and digital requirements are comparatively highly specified. Supplies often have long lead times and can require specialist contractors to undertake specific elements of the project. The planning of projects must include minimising the impact on business-as-usual services, which is challenging when many facilities run 24/7 and there is limited capacity on site for project management activities and traffic flows.
Commissioning the asset includes workforce recruitment and training to function in the new facility, ensuring that all operational requirements (including migration activities) have been met and are embedded into business continuity plans, and that ‘old processes’ are turned off where appropriate.
Discussions during Phase One signalled that, as major projects happen infrequently within a DHB, individual DHBs generally do not maintain the capability to manage and deliver such projects. As a result, most DHBs are highly dependent on consultants and external contractors at all stages in the major capital project life cycle. Managing these external contracts also requires specific expertise, which is variable across the sector.

NEW ZEALAND HEALTH AND DISABILITY SYSTEM REVIEW | HAUORA MANAAKI KI AOTEAROA WHĀNUI
PAGE | 268
Other concerns raised during Phase One include:
The time and cost taken to develop and get approval for investments can be extensive. Specific issues raised included the extent of architectural design and costing work required as part of the business case process and the requirement on the DHB to cover these potentially substantive capital costs before approval of the case.
Professional fees for construction, programme management, and architectural services can cost about 14% of the total project cost.464 These costs may be necessary, but these services are usually outsourced, which limits the ability to retain and share learnings. In addition, the pool of available expertise in New Zealand is small, limiting competition between providers.
The partnership group model has been a response to the lack of capacity at the delivery stage of major capital projects. In theory, these groups can make more effective use of capability available nationally. However, we have heard that this model is not scalable or sustainable. Partnership groups are formed and disbanded for individual major projects, preventing lessons from being incorporated into future projects. Funding for business case development is on a project-by-project basis, preventing the system from developing permanent in-house capability.
We have heard that the CIC process ensures there is a rigorous processes around major capital investment decisions, and gives greater visibility and control to the Ministry, CIC and Ministers. For large-scale capital investment, this rigour and oversight is valuable. However, that same process may not be fit for purpose for smaller investments and may merely delay small but necessary capital works.
There are potential benefits from more centralised design and delivery of capital projects. For example, standardised design of facilities could streamline construction, and the system could take a more strategic approach to purchasing scarce construction market resources. Some other countries take a more centralised approach to capital investment. Further consideration of this direction will be given in Phase Two.
More effective management of existing assets needed In 2016, the Office of the Auditor-General reviewed the asset management practices of DHBs.465 It found that “DHBs’ asset management was not as mature as we expect from organisations of their size and with their level of reliance on their assets”. Key issues included limited monitoring and reporting on the condition of assets, and weak reporting on asset performance. The Office of the Auditor-General has noted improvements in asset management since 2016, such as some DHBs preparing clinical services plans and the Northern Region long term investment plan.466
The Treasury has also raised concerns about DHB asset management practices. It found that, on average, actual expenditure on capital investment, repairs, and maintenance is significantly lower than planned expenditure. Based on this analysis, the Treasury concluded that “[s]ome DHBs look to be sweating their assets and underfunding repairs and maintenance to help balance their books”.467 Unfortunately, deferring maintenance or necessary investments can lead to higher costs in the future.

INTERIM REPORT | PŪRONGO MŌ TĒNEI WĀ
PAGE | 269
Clearly, asset management processes should be strengthened so current infrastructure is appropriately maintained. However, it is less clear how this can be best achieved. Current poor management may be a response to short-term financial constraints. For example, the Office of the Auditor General noted that the “sector strongly focused on delivering short-term results within a challenging operating environment and financial constraints”.468 We have also heard that these problems may reflect a lack of consequences for poor performance.
Capital charge DHBs are required to pay an annual charge to the Crown based on their Crown equity (assets minus liabilities). Government departments and some Crown entities also pay this capital charge. The charge is intended to improve capital management by incentivising DHBs to reduce their use of capital and return any surplus capital to the Crown. It also signals that capital is not costless and should be managed effectively. DHBs paid a total of $325 million in capital charges in 2017/18.
Before July 2019, the capital charge was applied differently to DHBs than to government departments. When a department received equity funding for investment in assets, it also received an increase in revenue to match the higher capital charge it would have to pay. This was not the case for DHBs. This resulted in DHBs facing higher capital charges after investment in new facilities, which needed to be funded by reducing expenditure elsewhere.
The capital charge regime was changed in July 2019. Any DHBs that receive government funding for capital investments from 1 January 2019 will also receive an increase in funding to match the increased capital charge. When calculating the increase in funding, a DHB’s financial deficit will be subtracted from the increase in equity. This will reduce the increase in funding for DHBs running deficits and provides a financial incentive to not run deficits.
While we have heard that the capital charge regime has an impact on some DHBs it is not the primary cause of the asset management problems in the system. Likewise, changing the capital charge will not solve these problems. The Panel believes other issues, such as the lack of a long-term plan for services or assets, need to be addressed first. The Panel’s initial focus will be on these other issues.
NEW ZEALAND HEALTH AND DISABILITY SYSTEM REVIEW | HAUORA MANAAKI KI AOTEAROA WHĀNUI
PAGE | 270
Directions for change: Facilities and equipment A significant volume of health capital investment will be required over the next 10 years to address issues associated with assets that have not been adequately maintained and/or are not fit for purpose. Investment will also be required to support new models of care and to accommodate demographic pressures including a reorientation toward Tier 1.
The Panel heard considerable frustration with current processes, including concerns about convoluted decision-making processes, the impact of the capital charge regime, and a lack of capacity and capability in the sector to manage and deliver major health capital investment projects.
M A N A G I N G T O A S Y S T E M P L A N The Panel is of the view that future major capital investments decisions should
demonstrate consistency with the long-term health service plan and follow a consistent decision-making process for facilities, major equipment, and digital technology.
Capital planning should not be based on a one-year budget bid process. A longer-term rolling plan should be developed that is based on a prioritised, robust pipeline that will deliver the medium-term and longer-term service requirements.
Links between system planning and local and district planning should be strengthened, and health infrastructure planning should be considered more routinely alongside local government, education, and transport planning.
A S S E T M A N A G E M E N T
The Panel believes that asset management planning processes must be strengthened to ensure that sufficient investment is made to maintain current infrastructure and replace major equipment, while also future proofing for new models of care and capacity growth.
D E L I V E R Y O F M A J O R C A P I T A L P R O J E C T S The Panel is of the view that processes for developing and approving business cases
need to be streamlined so decisions are made in a way that minimises the time and expense incurred in progressing proposals that are unlikely to be accepted.
The current distributed model for the design and delivery of capital projects is ad hoc, is expensive, and may not be sufficient or appropriate to meet the scale of investment required.
Other jurisdictions have centralised these functions, and work is under way in New Zealand to explore such an option. The Panel believes there are potential gains to be made in this area and supports more work being done.

PAGE | 271
INTERIM REPORT | PŪRONGO MŌ TĒNEI WĀ
Section E: Moving forward / Te haerenga whakamua
NEW ZEALAND HEALTH AND DISABILITY SYSTEM REVIEW | HAUORA MANAAKI KI AOTEAROA WHĀNUI
PAGE | 272
14 Next steps / Ka whai ake nei
This Interim Report does not provide final recommendations of the actions needed to improve the performance of the system or the equity of outcomes from the system.
The purpose of the Interim Report is twofold. To reflect back to the community and the sector what the Panel read, heard, and observed about the main issues affecting sector performance and the things that are working well that we can learn from. Second to indicate the directions of change the Panel believes are necessary.
This report should contain few surprises. We observed a high degree of consensus on the issues preventing the system being as effective as it could be.
There is much less consensus on the best way forward.
The reality is that the world is rapidly changing. Changing demographics alone will increase demands on the system making it unsustainable unless it operates very differently in the future.
Consumer expectations are changing. New technologies, climate change, increasing comorbidities, and growth in antimicrobial resistance etc are happening whether the system changes or not. But their impact on system performance for the least well off will be hugely different, depending on what actions are taken now.
Phase Two of the review will, therefore, focus on developing recommendations for the key changes that can best move the system towards more sustainable and fairer performance. We have indicated throughout this report the direction the Panel believes those changes should take, and these are set out below.
Developing our final recommendations will require us to answer specific questions in each of our focus areas. These questions include, but are in no way limited to, those set out in the next sections.

INTERIM REPORT | PŪRONGO MŌ TĒNEI WĀ
PAGE | 273
Settings The Panel is clear that a more integrated health and disability system is needed that operates within an agreed set of values and principles, with clear decision frameworks, national long-term planning, and explicit accountabilities. The Panel is also clear that the mana of Māori as Tiriti / Treaty partner with the Crown must be reflected in the way the system is governed and in how and what services are provided.
Issues which need further analysis and discussion however include:
In taking a Tiriti / Treaty based approach in health, what are the implications for the role of Māori and iwi in leadership, governance, and decision making at national or local levels and how should these roles be provided for?
What is an appropriate set of values and principles to guide the operation of publicly funded health and disability services in New Zealand?
How does New Zealand build leadership in the system and enforce real accountability for performance at all levels?
Where should responsibility for developing and implementing the system-wide long-term plan lie?
What should be the balance between national decision making to guide the entire system and local autonomy to ensure services are designed to meet the needs of all communities?
How can local communities have a meaningful say in how their services are planned and provided?
Is continuing with governance by majority-elected boards, the most effective way to improve accountability or foster real community engagement?
Is the best way to achieve more efficiency and more equitable outcomes within available resources to have fewer DHBs, DHBs with different functions and/or more sharing of resources at regional or national level?
Should development of the health and disability system into a cohesive, integrated system with greater clarity of mandate, be driven centrally by the Ministry of Health or by a different agency?
How should funding regimes change to provide more predictability to providers, more accessibility to consumers, and more accountability to government?
How do we ensure that the mix of public and private business models engaged in the sector operate more effectively together, better manage conflicts of interests, and result in a mix of service provision that improves equity of outcomes?
What accountability mechanisms should be applied to ensure both improved health outcomes and financial balance are achieved over time?
NEW ZEALAND HEALTH AND DISABILITY SYSTEM REVIEW | HAUORA MANAAKI KI AOTEAROA WHĀNUI
PAGE | 274
Services For many years, various health strategies have promised more emphasis on population health and early intervention to shift the focus from treatment to health and wellbeing. However, despite many good examples of local initiatives changing how services are designed and provided for small groups, there is no evidence of a large scale or sustained movement away from a treatment focus towards a prevention focus. Nor is there evidence of the wellbeing of individuals and communities being recognised as the main factor that should be driving the design of service provision.
The Panel is clear that progress for those individuals and communities who are currently missing out in the system, hinges crucially on two things happening. First, services need to be funded and provided in a way that enables them to be designed around the wellbeing of the individual and their whānau, rather than primarily the interests of providers. Second, services need to be available to all on a fair basis, so that where you live, your degree of disability, or your ethnicity is not a determining factor in the quality of care you receive.
Issues which need further analysis and discussion in these areas include:
If population health is to be more central to all planning and delivery in the system, should this change be driven by the local DHB or at a regional or national level?
How do we ensure that what the consumers value is accorded highest priority?
How do we ensure that Māori communities have access to appropriate kaupapa Māori services?
How do we ensure that mātauranga Māori is properly reflected in service provision?
How should the co-payment regimes and eligibility criteria for access to various Tier 1 services be rationalised?
Given the desire for more reliance on integrated community health hubs, how should these be funded?
Do PHOs in their current configuration add value to the provision of services?
Given the increasing numbers of people living with some disability, how can further fragmentation of the systems designed to provide support be avoided?
How do we increase the visibility of the needs of people with disability to ensure the system properly addresses their health needs as well as needs for disability support?
How can better use be made of technology and local resources to ensure that rural communities have access to a full range of services?
How can continuous improvement be embedded firmly into hospital systems with clinicians actively involved and accountable for building a networked system so the public has confidence that best practice will be applied throughout the country?
Who should be accountable for decision making about new technologies, new services, and the development of guidelines and pathways and for setting thresholds for treatments? How can international work be incorporated and localised?
How does New Zealand ensure its system of hospitals operates effectively as a network that delivers a fair distribution of complex services and better support to the provision of local services in smaller hospital and community settings?

PAGE | 275
INTERIM REPORT | PŪRONGO MŌ TĒNEI WĀ
Enablers The health and disability system workforce is the foundation on which the system is built. But the workforce is under considerable stress because of a shortage of supply and the prospect of ever-increasing demand for health and disability services. While technology offers an opportunity for positive change in the way services are provided, it will never remove the need for good interaction between health workers, consumers and their families and whānau.
For the workforce to be effective in the future, various enablers need to be strengthened. Principal among these is for the system to produce and use much better data. The future of the system, as with all other sectors, is largely digital, but the ability to apply that technology effectively depends on data systems being up to scratch. Our report suggests this is not the case at the moment, so priority needs to be given to improving data collection, analysis, and stewardship and to making technology systems properly interoperable.
The health and disability system is always going to need a significant amount of capital investment to provide the population with access to modern, safe, and appropriate facilities. The recent history of capital and infrastructure management in the system is not impressive, and there is little confidence in the transparency or credibility of the decision-making mechanisms. The Panel is clear a national asset management plan and a long-term investment strategy are needed as part of the long term service plan.
Many issues need further analysis and discussion. These include:
How can the strategic partnership between unions and sector employers be strengthened so the system can operate in ways that best suit the needs of consumers while at the same time protecting the rights and wellbeing of workers?
How can training and regulatory regimes be developed so the workforce can gain and use the skills needed to adapt to the changing demand for services?
How can the workforce of the future become more representative of the communities it is serving?
What needs to change to make multidisciplinary teamwork the norm rather than the exception?
How can data stewardship regimes be put in place to give all communities the confidence that their data will be protected and used appropriately and according to their permissions, while at the same time allowing appropriate sharing of information throughout the system?
How can work done in other jurisdictions in regard to data standards, identity management, interoperability, and the like be best used?
Would a centralised model for infrastructure projects be more effective?

NEW ZEALAND HEALTH AND DISABILITY SYSTEM REVIEW | HAUORA MANAAKI KI AOTEAROA WHĀNUI
PAGE | 276
What happens next? The questions above are illustrative, not exhaustive, and the questions cannot be answered by the Panel alone. The process from here will involve the Panel calling on people in the sector to work with it on various working groups to come up with more detailed options.
Many groups have already submitted quite detailed proposals, particularly relating to possible configuration of Tier 1 services, and the Panel intends to use these as a base to develop further.
As options are developed, further opportunities will be provided for interested parties to comment before the next report is finalised in March 2020.

INTERIM REPORT | PŪRONGO MŌ TĒNEI WĀ
PAGE | 277
Section F: Notes / Kupu āpiti

NEW ZEALAND HEALTH AND DISABILITY SYSTEM REVIEW | HAUORA MANAAKI KI AOTEAROA WHĀNUI
PAGE | 278
Notes
1 Durie, M. 1999. Te Pae Mahutonga: a model for Māori health promotion. Health Promotion Forum of New Zealand Newsletter 49, 2–5 December
2 With thanks to work provided by Pacific Perspectives Ltd: D Ryan, Grey, C, and Mischewski, B. 2019. Tofa Saili: A review of evidence about health equity for Pacific Peoples in New Zealand. Wellington: Pacific Perspectives; Pasifika Futures. 2017. Pasifika People in New Zealand. How are we doing? Auckland: Pasifika FutureS
3 T Inoguchi and Newman, E. 1997. Introduction: Asian values and democracy. Asia: ‘Asian values’ and Democracy in Asia 27: 862–891
4 Ministry of Health. 2006. Asian Health Chart Book 2006. Wellington: Ministry of Health. https://www.health.govt.nz/publication/asian-health-chart-book-2006
5 Royal Society of New Zealand / Te Apārangi. 2017. Human Health Impacts of Climate Change for New Zealand: Evidence summary. Wellington: Royal Society of New Zealand / Te Apārangi, p 4 https://royalsociety.org.nz/what-we-do/our-expert-advice/all-expert-advice-papers/climate-change-and-health/
6 Ministry of Health. 2019. New Zealand Health Survey: Annual data explorer. https://minhealthnz.shinyapps.io/nz-health-survey-2017-18-annual-data-explorer/_w_0811ceee/_w_d8426da3/#!/explore-indicators
7 Ministry of Health. 2016. Health Loss in New Zealand 1990–2013: A report from the New Zealand Burden of Disease, Injuries and Risk Factors study. Wellington: Ministry of Health https://www.health.govt.nz/publication/health-loss-new-zealand-1990-2013
8 Government Inquiry into Mental Health and Addiction. 2018. He Ara Oranga: Report of the Government Inquiry into Mental Health and Addiction. Wellington: The Inquiry https://mentalhealth.inquiry.govt.nz/inquiry-report/he-ara-oranga/
9 S Gibb and Cunningham, R. 2018. Mental Health and Addiction in Aotearoa New Zealand: Recent trends in service use, unmet need, and information gaps. Wellington: Government Inquiry into Mental Health and Addiction, pp 25–27. https://www.mentalhealth.inquiry.govt.nz/assets/Summary-reports/Otago-mental-health.pdf
10 LGBTIQA+ is an umbrella term for people who are lesbian, gay, bisexual, trans, intersex, queer, asexual, and other diverse sexual orientations and gender identities
11 World Health Organization definition of the social determinants of health
12 WHO. 2014. The Case for Investing in Public Health: A public health summary report for EPHO 8. Copenhagen: Regional Office for Europe, World Health Organization. http://www.euro.who.int/__data/assets/pdf_file/0009/278073/Case-Investing-Public-Health.pdf?ua=1
13 Statistics New Zealand. 2014. Social and Economic Outcomes for Disabled People: Findings from the 2013 Disability Survey. Wellington: Statistics New Zealand http://archive.stats.govt.nz/browse_for_stats/health/disabilities/social-economic-outcomes-13.aspx
14 NACHD. 1998. The Social, Cultural and Economic Determinants of Health in New Zealand: Action to improve health. Wellington: National Advisory Committee on Health and Disability https://www.health.govt.nz/publication/social-cultural-and-economic-determinants-health-new-zealand
15 Ministry of Health. 2019. New Zealand Health Survey: Annual data explorer. https://minhealthnz.shinyapps.io/nz-health-survey-2017-18-annual-data-explorer/_w_0811ceee/_w_d8426da3/#!/explore-indicators
16 S Gibb and Cunningham, R. 2018. Mental Health and Addiction in Aotearoa New Zealand: Recent trends in service use, unmet need, and information gaps. Wellington: Government Inquiry into Mental Health and Addiction, p 15. https://www.mentalhealth.inquiry.govt.nz/assets/Summary-reports/Otago-mental-health.pdf
17 Health Quality & Safety Commission New Zealand. 2018. Health service access (web page) https://www.hqsc.govt.nz/our-programmes/health-quality-evaluation/projects/atlas-of-healthcare-variation/health-service-access/

INTERIM REPORT | PŪRONGO MŌ TĒNEI WĀ
PAGE | 279
18 The New Zealand Health Survey defines ‘unmet need’ for primary health care as adults (aged 15 and over) having experienced one or more of the following types of unmet need for primary health care in the past 12 months: unmet need for a general practitioner (GP) due to cost, unmet need for an after-hours medical centre due to cost, unmet need for a GP due to lack of transport, unmet need for an after-hours medical centre due to lack of transport, or an inability to get an appointment at their usual medical centre within 24 hours.
19 HQSC (Health Quality & Safety Commission New Zealand). 2019. He Matapihi ki te Kounga O Ngā Manaakitanga Ā-Hauora O Aotearoa 2019: A window on the quality of Aotearoa New Zealand’s health care 2019: A view on Māori health equity. https://www.hqsc.govt.nz/assets/Health-Quality-Evaluation/PR/Window_2019_web_final.pdf
20 ibid
21 D Ryan, Grey, C, and Mischewski, B. 2019. Tofa Saili: A review of evidence about health equity for Pacific peoples in New Zealand. Wellington: Pacific Perspectives
22 Ministry of Health. 2012. Tupu Ola Moui: Pacific Health Chart Book 2012. Wellington: Ministry of Health. https://www.health.govt.nz/publication/tupu-ola-moui-pacific-health-chart-book-2012
23 Ministry of Health and Ministry of Pacific Island Affairs. 2004. Tupu Ola Moui: Pacific Health Chart Book 2004. Wellington: Ministry of Health. https://www.health.govt.nz/publication/tupu-ola-moui-pacific-health-chart-book-2004
24 M Walsh and Grey, C. 2019. The contribution of avoidable mortality to the life expectancy gap in Māori and Pacific populations in New Zealand: A decomposition analysis. New Zealand Medical Journal 132(1,492): 46–60
25 AM Teng, Atkinson, J, Disney, G, Wilson, N, Sarfati, D, et al. 2016. Ethnic inequalities in cancer incidence and mortality: census-linked cohort studies with 87 million years of person-time follow-up. BMC Cancer 16(1): 755
26 Immunisation Advisory Centre. 2018. National Immunisation Coverage for New Zealand. Auckland: University of Auckland https://www.immune.org.nz/sites/default/files/publications/Immunisation%20coverage%20to%20June%202018.pdf
27 Ministry of Health. 2019. Achieving Equity. Wellington: Ministry of Health. https://www.health.govt.nz/about-ministry/what-we-do/work-programme-2018/achieving-equity
28 Ministry of Health. 2018. Health and Independence Report 2017. The Director-General of Health’s Annual Report on the State of Public Health. Wellington: Ministry of Health https://www.health.govt.nz/publication/health-and-independence-report-2017
28 OECD. 2017. Diabetes prevalence. In: Health at a Glance 2017: OECD indicators (pp 66–67). Paris: OECD Publishing. DOI: https://doi.org/10.1787/health_glance-2017-15-en
29 L Barnes, Moss-Morris, R, and Kaufusi, M. 2004. Illness beliefs and adherence in diabetes mellitus: A comparison between Tongan and European patients. New Zealand Medical Journal 117(1,188). http://www.nzma.org.nz/journal/117-1188/743/ and D Ryan, Southwick, M, Teevale, T, and Kenealy, T. 2011. Primary Care for Pacific People: A Pacific and health systems view. Wellington: Pacific Perspectives. https://researchspace.auckland.ac.nz/handle/2292/20841
30 D Ryan, Grey, C, and Mischewski, B. 2019. Tofa Saili: A review of evidence about health equity for Pacific peoples in New Zealand. Wellington: Pacific Perspectives
31 New Zealand General Social Survey self-rated general health status, 2016
32 Ministry of Health 2011. Health Indicators for New Zealanders with Intellectual Disability. Wellington: Ministry of Health
33 Ministry of Health. 2012. Mātātuhi Tuawhenua / Health of Rural Māori. Wellington. Ministry of Health. https://www.health.govt.nz/publication/matatuhi-tuawhenua-health-rural-maori-2012
34 D Fearnley, Lawrenson, R, and Nixon, G. 2016. ‘Poorly defined’: Unknown unknowns in New Zealand rural health. New Zealand Medical Journal 129(1,439). https://www.nzma.org.nz/journal/read-the-journal/all-issues/2010-2019/2016/vol-129-no-1439-5-august-2016/6964
35 NHC. 2010. Rural Health: Challenges of distance, opportunities for innovation. Wellington: National Health Committee
NEW ZEALAND HEALTH AND DISABILITY SYSTEM REVIEW | HAUORA MANAAKI KI AOTEAROA WHĀNUI
PAGE | 280
36 Fearnley D, Lawrenson R, Nixon, G. 2016. 'Poorly defined': unknown unknowns in New Zealand rural health. New Zealand Medical Journal 129 (1439) 77-81 . ZMJ. 2016 https://www.nzma.org.nz/journal/read-the-journal/all-issues/2010-2019/2016/vol-129-no-1439-5-august-2016/6964
37 Harris R, Cormack D, Stanley J, Rameka R: Investigating the relationship between ethnic consciousness, racial discrimination and self-rated health in New Zealand. PLoS ONE 2015, 10(2):e0117343
38 Society for Adolescent Health and Medicine. 2018. Racism and its harmful effects on non-dominant racial-ethnic youth and youth-serving providers: A call to action for organizational change. Journal of Adolescent Health 63(2): 257–261. doi: 10.1016/j.jadohealth.2018.06.003
39 C Jones. 2000. Levels of racism: A theoretic framework and a gardener’s tale. American Journal of Public Health 90(8): 1,212–1,215
40 R Harris, Cormack, D, and Stanley, J. 2019. Experience of racism and associations with unmet health need and health care satisfaction: The 2011/12 adult New Zealand Health Survey. Australia New Zealand Journal of Public Health 43(1): 75–80
41 Crengle S, Robinson E, Ameratunga S, Clark T, Raphael D: Ethnic discrimination prevalence and associations with health outcomes: data from a nationally representative cross-sectional survey of secondary school students in New Zealand. BMC Public Health 2012, 12:45
42 Harris R, Cormack D, Tobias M, Yeh LC, Talamaivao N, Minster J, Timutimu R: Self-reported experience of racial discrimination and health care use in New Zealand: results from the 2006/07 New Zealand Health Survey. Am J Public Health 2012, 102(5):1012-101
43 Harris R, Cormack D, Tobias M, Yeh LC, Talamaivao N, Minster J, Timutimu R: The pervasive effects of racism: experiences of racial discrimination in New Zealand over time and associations with multiple health domains. Soc Sci Med 2012, 74(3):408-415
44 Harris R, Tobias M, Jeffreys M, Waldegrave K, Karlsen S, Nazroo J: Racism and health: the relationship between experience of racial discrimination and health in New Zealand. Soc Sci Med 2006, 63(6):1428-1441
45 S-J Paine, Harris, R, Stanley, J, and Cormack, D. 2018. Caregiver experiences of racism and child healthcare utilisation: Cross-sectional analysis from New Zealand. BMJ/Royal College of Paediatrics and Child Health 103: 873–879
46 Harris R, Tobias M, Jeffreys M, Waldegrave K, Karlsen S, Nazroo J: Racism and health: the relationship between experience of racial discrimination and health in New Zealand. Soc Sci Med 2006, 63(6):1428-1441
47 S-J Paine, Harris, R, Stanley. J, and Cormack. D. 2018. Caregiver experiences of racism and child healthcare utilisation: Cross-sectional analysis from New Zealand. BMJ/Royal College of Paediatrics and Child Health 103: 873–879
48 Statistics New Zealand. 2013. Te Kupenga: Key facts http://archive.stats.govt.nz/browse_for_stats/people_and_communities/maori/TeKupenga_MR13.aspx
49 Durie. M. 2017. Pūmau Tonu te Mauri, Living as Māori, now and in the Future
50 JP Mika. 2018. Strong sense of cultural identity drives boom in Māori business. The Conversation 26 February. http://theconversation.com/strong-sense-of-cultural-identity-drives-boom-in-maori-business-87500
51 JP Mika. 2018. Strong sense of cultural identity drives boom in Māori business. The Conversation 26 February. http://theconversation.com/strong-sense-of-cultural-identity-drives-boom-in-maori-business-87500
52 Durie. M.K. 2019. Mātauranga Māori: Achieving Māori Health Gains. [Unpublished Paper prepared on behalf the Māori Expert Advisory Group for the Health and Disability System Review]
53 L Russell. 2018. Te Oranga Hinengaro: Report on Māori Mental Wellbeing – Results from the New Zealand Mental Health Monitor & Health and Lifestyles Survey. Wellington: Health Promotion Agency / Te Hiringa Hauora. https://www.hpa.org.nz/news/te-oranga-hinengaro-m%C4%81ori-mental-wellbeing
54 Ministry of Health. 2002. He Korowai Oranga: Māori Health Strategy. Wellington: Ministry of Health. https://www.health.govt.nz/publication/he-korowai-oranga-maori-health-strategy

INTERIM REPORT | PŪRONGO MŌ TĒNEI WĀ
PAGE | 281
55 Statistics New Zealand. 2015. Ngā Tohu o te Ora: The determinants of life satisfaction for Māori 2013. Wellington: Statistics New Zealand. http://archive.stats.govt.nz/browse_for_stats/people_and_communities/maori/te-kupenga/determinants-life-satisfaction-maori.aspx
56 Statistics New Zealand. 2013. Te Kupenga: Key facts. https://www.stats.govt.nz/information-releases/te-kupenga-2013-english?gclid=CjwKCAjw98rpBRAuEiwALmo-yke9GT6o744WBJYHwPTEsghiGgPtKmylOlanE8U-XunrpUvnn0_rmhoCCwQQAvD_BwE
57 AD Williams, Clark, TC, and Lewycka, S. 2018. The associations between cultural identity and mental health outcomes for indigenous Māori youth in New Zealand. Frontiers in Public Health 6: 319. doi: 10.3389/fpubh.2018.00319
58 L Russell. 2018. Te Oranga Hinengaro: Report on Māori Mental Wellbeing – Results from the New Zealand Mental Health Monitor & Health and Lifestyles Survey. Wellington: Health Promotion Agency / Te Hiringa Hauora. https://www.hpa.org.nz/news/te-oranga-hinengaro-m%C4%81ori-mental-wellbeing
59 Durie. M.K. 2019. Mātauranga Māori: Achieving Māori Health Gains. [Unpublished Paper prepared on behalf the Māori Expert Advisory Group for the Health and Disability System Review]
60 Durie. M.K. 2019. Mātauranga Māori: Achieving Māori Health Gains. [Unpublished Paper prepared on behalf the Māori Expert Advisory Group for the Health and Disability System Review]
61 Principles of Kaupapa Māori. No date. Kaupapa Māori and Rangahau (website) http://www.rangahau.co.nz/research-idea/27/
62 Durie. M.K. 2019. Mātauranga Māori: Achieving Māori Health Gains. [Unpublished Paper prepared on behalf the Māori Expert Advisory Group for the Health and Disability System Review]
63 D Tipene-Leach, Abel, S, Hiha, AA, and Matthews, KM. 2019. Rangahaua Te Kūwatawata! The Te Kūwatawata Evaluation: Final report. Hawke’s Bay: Eastern Institute of Technology. https://www.hauoratairawhiti.org.nz/news-and-events/news/rangahaua-te-kuwatawata-the-te-kuwatawata-evaluation/
64 D Tipene-Leach, Abel, S, Hiha, AA, and Matthews, KM. 2019. Rangahaua Te Kūwatawata! The Te Kūwatawata Evaluation: Final report. Hawke’s Bay: Eastern Institute of Technology. https://www.hauoratairawhiti.org.nz/news-and-events/news/rangahaua-te-kuwatawata-the-te-kuwatawata-evaluation/
65 Waitematā DHB. 2003. Māori values and concepts (tikanga). In: Corporate Patient Care / Clinical Support Manual. Auckland: Waitematā District Health Board.
66 Ministry of Health. 2018. National Kaitiaki Group (web page). https://www.health.govt.nz/our-work/populations/maori-health/national-kaitiaki-group
67 Te Mana Raraunga / Māori Data Sovereignty Network. 2018. Principles of Māori Data Sovereignty (Brief 1). https://www.temanararaunga.maori.nz/new-page-2
68 Waitangi Tribunal. 2011. Ko Ao te Aro Atēnei: A Report into Claims Concerning New Zealand Law and Policy Affecting Māori Culture and Identity. Te taumata tuatahi (Wai 262). Wellington: Legislation Direct. https://www.waitangitribunal.govt.nz/news/ko-aotearoa-tenei-report-on-the-wai-262-claim-released/
69 Durie. M.K. 2019. Mātauranga Māori: Achieving Māori Health Gains. [Unpublished Paper prepared on behalf the Māori Expert Advisory Group for the Health and Disability System Review]Durie MK
70 SA Baddock, Tipene-Leach, D, Williams, SM, Tangiora, A, Jones, R, et al. 2017. Wahakura versus bassinet for safe infant sleep: A randomized trial. Pediatrics 139(2): e20160162
71 S Abel, and Tipene-Leach, D. 2013. SUDI prevention: A review of Māori safe sleep innovations for infants. New Zealand Medical Journal 126(1,379). https://www.nzma.org.nz/journal/read-the-journal/all-issues/2010-2019/2013/vol-126-no-1379/view-abel
72 Durie. M.K. 2019. Mātauranga Māori: Achieving Māori Health Gains. [Unpublished Paper prepared on behalf the Māori Expert Advisory Group for the Health and Disability System Review]

NEW ZEALAND HEALTH AND DISABILITY SYSTEM REVIEW | HAUORA MANAAKI KI AOTEAROA WHĀNUI
PAGE | 282
73 M Karauria. 2019. Weavers to teach whānau to weave wahakura baby pods at weekend wānanga. Manawatu Guardian 9 May. https://www.nzherald.co.nz/manawatu-guardian/news/article.cfm?c_id=1503567&objectid=12229417
74 Durie. M.K. 2019. Mātauranga Māori: Achieving Māori Health Gains. [Unpublished Paper prepared on behalf the Māori Expert Advisory Group for the Health and Disability System Review]
75 Bias is an inclination or prejudice for or against one person or group, especially in a way considered to be unfair. Bias in design relates to designing with a particular set of worldviews or preferences in mind that either advantage or disadvantage one group over another.
76 HQSC (Health Quality & Safety Commission New Zealand). 2019. Submission to the Health and Disability Review
77 HQSC (Health Quality & Safety Commission New Zealand). 2019. He Matapihi ki te Kounga O Ngā Manaakitanga Ā-Hauora O Aotearoa 2019: A window on the quality of Aotearoa New Zealand’s health care 2019: A view on Māori health equity. https://www.hqsc.govt.nz/assets/Health-Quality-Evaluation/PR/Window_2019_web_final.pdf
78 United Nations Declaration on the Rights of Indigenous Peoples (2008)
79 United Nations Convention on the Rights of the Child (1989)
80 MM Marmot, Friel, S, Bell, R, Houweling, TAJ, Taylor, S, et al on behalf of the Commission on Social Determinants of Health. 2008. Closing the gap in a generation: Health equity through action on the social determinants of health. Lancet 372: 1,661–1,669
81 Ministry of Health. 2019. Achieving equity in health outcomes: Discovery phase summary. Unpublished draft.
82 J Reid, Taylor-Moore, K, and Varona, G. 2014. Towards a social-structural model for understanding current disparities in Māori health and wellbeing. Journal of Loss and Trauma International Perspectives on Stress & Coping 19(6): 514–536. DOI: 10.1080/15325024.2013.809295
83 L Pihama, Reynolds, P, Smith, C, Reid, J, Smith, LT, et al. 2014. Positioning Historical trauma theory within Aotearoa New Zealand. AlterNative: An International Journal of Indigenous Peoples 10(3): 248–262. https://doi.org/10.1177/117718011401000304
84 P Reid, and Robson, B. 2006. Understanding health inequities: The state of Māori health. In: M Mulholland (ed). State of the Māori Nation: Twenty-first century issues in Aotearoa. Auckland: Reed
85 HQSC (Health Quality & Safety Commission New Zealand). 2019. He Matapihi ki te Kounga O Ngā Manaakitanga Ā-Hauora O Aotearoa 2019: A window on the quality of Aotearoa New Zealand’s health care 2019: A view on Māori health equity. https://www.hqsc.govt.nz/assets/Health-Quality-Evaluation/PR/Window_2019_web_final.pdf
86 TC Clark, Le Grice, J, Moselen, E, Fleming, T, Crengle, S, et al. 2018. Health and wellbeing of Māori secondary students in New Zealand: Trends between 2001, 2007, and 2012. Australian and New Zealand Journal of Public Health 42(6): 553–561. doi: 10.1111/1753-6405.12839
87 HQSC. 2018. Perinatal and Maternal Mortality Review Committee: 12th Annual Report. Wellington: Health Quality & Safety Commission New Zealand. https://www.hqsc.govt.nz/our-programmes/mrc/pmmrc/publications-and-resources/publication/3391/
88 HQSC (Health Quality & Safety Commission New Zealand). 2019. He Matapihi ki te Kounga O Ngā Manaakitanga Ā-Hauora O Aotearoa 2019: A window on the quality of Aotearoa New Zealand’s health care 2019: A view on Māori health equity. https://www.hqsc.govt.nz/assets/Health-Quality-Evaluation/PR/Window_2019_web_final.pdf
89 Perinatal and Maternal Mortality Review Committee. 2018. Twelfth Annual Report of the Perinatal and Maternal Mortality Review Committee: Reporting Mortality and Morbidity 2016. Wellington: Health Quality & Safety Commission New Zealand
90 HQSC (Health Quality & Safety Commission New Zealand). 2019. He Matapihi ki te Kounga O Ngā Manaakitanga Ā-Hauora O Aotearoa 2019: A window on the quality of Aotearoa New Zealand’s health care 2019: A view on Māori health equity. https://www.hqsc.govt.nz/assets/Health-Quality-Evaluation/PR/Window_2019_web_final.pdf
INTERIM REPORT | PŪRONGO MŌ TĒNEI WĀ
PAGE | 283
91 TC Clark, Le Grice, J, Moselen, E, Fleming, T, Crengle, S, et al. 2018. Health and wellbeing of Māori secondary students in New Zealand: Trends between 2001, 2007, and 2012. Australian and New Zealand Journal of Public Health 42(6): 553–561. doi: 10.1111/1753-6405.12839
92 ibid
93 ibid
94 ibid
95 ibid
96 Ministry of Health. 2016. New Zealand Health Strategy. Wellington: Ministry of Health.
97 PHARMAC. 2019. Achieving Medicine Access Equity in Aotearoa New Zealand: Towards a theory of change Wellington: Pharmaceutical Management Agency. https://www.pharmac.govt.nz/medicines/equity/medicine-access/
98 Crengle, S., Clark, T. C., Robinson, E., Bullen, P., Dyson, B., Denny, S., Fleming, T., Fortune, S., Peiris-John, R., Utter, J., Rossen, F., Sheridan, J., Teevale, T., & The Adolescent Health Research Group (2013). The health and wellbeing of Māori New Zealand secondary school students in 2012. Te Ara Whakapiki Taitamariki: Youth’12. Auckland, New Zealand: The University of Auckland
99 HQSC (Health Quality & Safety Commission New Zealand). 2019. He Matapihi ki te Kounga O Ngā Manaakitanga Ā-Hauora O Aotearoa 2019: A window on the quality of Aotearoa New Zealand’s health care 2019: A view on Māori health equity. https://www.hqsc.govt.nz/assets/Health-Quality-Evaluation/PR/Window_2019_web_final.pdf
100 Government Inquiry into Mental Health and Addiction. 2019. Oranga Tāngata, Oranga Whānau: A Kaupapa Māori analysis of consultation with Māori for the Government Inquiry into Mental Health and Addiction. Wellington: Department of Internal Affairs. https://mentalhealth.inquiry.govt.nz/
101 HQSC (Health Quality & Safety Commission New Zealand). 2019. He Matapihi ki te Kounga O Ngā Manaakitanga Ā-Hauora O Aotearoa 2019: A window on the quality of Aotearoa New Zealand’s health care 2019: A view on Māori health equity. https://www.hqsc.govt.nz/assets/Health-Quality-Evaluation/PR/Window_2019_web_final.pdf
102 ibid
103 L Russell. 2018. Te Oranga Hinengaro: Report on Māori Mental Wellbeing – Results from the New Zealand Mental Health Monitor & Health and Lifestyles Survey. Wellington: Health Promotion Agency / Te Hiringa Hauora. https://www.hpa.org.nz/news/te-oranga-hinengaro-m%C4%81ori-mental-wellbeing
104 R Harris, Tobias, M, Jeffreys, M, Waldegrave, K, Karlson, S, et al. 2006. Effects of self-reported racial discrimination and deprivation on Māori health and inequalities in New Zealand: cross-sectional study. The Lancet 367(9527): 2,005–2,009. DOI:https://doi.org/10.1016/S0140-6736(06)68890-9
105 S Crengle, Robinson, E, Ameratunga, S, Clarke, T, and Raphael, D, 2012. Ethnic discrimination prevalence and associations with health outcomes: Data from a nationally representative cross-sectional survey of secondary school students in New Zealand. BMC Public Health 12, article 45. https://doi.org/10.1186/1471-2458-12-45
106 Waitangi Tribunal / Te Rōpū Whakamana i te Tiriti o Waitangi. 2019. Hauora: Report on Stage One of the Health Services and Outcomes Kaupapa Inquiry (pre-publication version – Wai 2575). Wellington: Waitangi Tribunal, p 152. https://www.waitangitribunal.govt.nz/inquiries/kaupapa-inquiries/health-services-and-outcomes-inquiry/
107 H Came, Cornes, R, and McCreanor, T. 2018. Treaty of Waitangi in New Zealand public health policy 2006–2016. New Zealand Medical Journal 131(1,469). https://www.nzma.org.nz/journal/read-the-journal/all-issues/2010-2019/2018/vol-131-no-1469-2-february-2018/7478
108 H Gifford, Batten, L, Bouton, A, Cragg, M, and Cvitanovi, L. 2018. Delivering on outcomes: The experience of Māori health service providers. Policy Quarterly 14(2): 58–64
109 CBG Health Research Limited. 2009. Evaluation of the Māori Provider Development Scheme. Unpublished report produced for the Ministry of Health
NEW ZEALAND HEALTH AND DISABILITY SYSTEM REVIEW | HAUORA MANAAKI KI AOTEAROA WHĀNUI
PAGE | 284
110 N Wehipeihana, Were, L, Goodwin, D, and Pipi, K. 2018. Addressing the Challenges of Young Māori Women Who Smoke: A developmental evaluation of the phase two demonstration project – evaluation report. Wellington: Ministry of Health. https://www.health.govt.nz/publication/addressing-challenges-young-maori-women-who-smoke-developmental-evaluation-phase-two-demonstration
111 Tumu Whakarae. 2018. Tumu Whakarae Submission to the Government Inquiry into Mental Health and Addiction, p 34. https://www.bopdhb.govt.nz/media/61843/final-submission_tumu-whakarae_govt-inquiry-mha_august-2018-3-.pdf
112 Waiti. J. Kingi. TK. 2014. Whakaoranga Whānau. MAI Journal. Vol 3, Issue 2
113 Minister of Health. 2002. He Korowai Oranga: Māori Health Strategy. Wellington: Ministry of Health. https://www.health.govt.nz/publication/he-korowai-oranga-maori-health-strategy
114 Superu. 2016. The Whānau Rangatiratanga Frameworks: Approaching whānau wellbeing from within Te Ao Māori. Wellington: Social Policy Research and Evaluation Unit. https://thehub.sia.govt.nz/resources/the-whānau-rangatiratanga-frameworks-research-report-2016/
115 K McClintock, Tauroa, R, and Mellsop, G. 2016. An examination of child and adolescent mental health services for Māori rangatahi (youth). International Journal of Adolescence and Youth 21(1): 56–63
116 Office of the Auditor-General. 2015. Whānau Ora: The first four years. Wellington: Office of the Auditor-General. https://www.oag.govt.nz/2015/whānau-ora
117 Waitangi Tribunal / Te Rōpū Whakamana i te Tiriti o Waitangi. 2019. Hauora: Report on Stage One of the Health Services and Outcomes Kaupapa Inquiry (pre-publication version – Wai 2575). Wellington: Waitangi Tribunal. https://www.waitangitribunal.govt.nz/inquiries/kaupapa-inquiries/health-services-and-outcomes-inquiry/
118 L McCann and McHardy, K. 2016. Intrinsically flawed health systems by design. Internal Medicine Journal 46(1): 14–16
119 J Appleby, Ham, C, Barker, K, Oliver, C, Cumberlege, et al. 2015. Health Policy Priorities for a New Parliament. London: The Kings Fund. www.kingsfund.org.uk
120 RC Swanson, Bongiovanni, A, Bradley, E, Murugan, V, Sundewall, J, et al. 2010. Toward a consensus on guiding principles for health systems strengthening. PLoS Med 7(12): e1000385. https://doi.org/10.1371/journal.pmed.1000385
121 A Best and Holmes, B. 2010. Systems thinking, knowledge and action: Towards better models and methods. Evidence & Policy: A. Journal of Research, Debate and Practice 6: 145–159
122 Minister of Health. 2016. New Zealand Health Strategy: Future direction. Wellington: Ministry of Health. https://www.health.govt.nz/publication/new-zealand-health-strategy-2016
123 Ministry of Health. 2009. Regulatory Impact Statement: Health Ministerial Review Group. Wellington: PUBLISHER, p 2. https://treasury.govt.nz/publications/risa/regulatory-impact-statement-health-ministerial-review-group
124 S Suckling, Connolly, A Mueller, J, and Russell, D. 2015. The New Zealand Health System: Independent Capability and Capacity Review., p 14. https://www.health.govt.nz/about-ministry/what-we-do/new-zealand-health-strategy-update/capability-and-capacity-review
125 New Zealand Productivity Commission / Te Kōmihana Whai Hua o Aotearoa. 2015. More Effective Social Services. https://www.productivity.govt.nz/sites/default/files/social-services-final-report-main.pdf (accessed 16 April 2019)
126 Ministry of Health. 2017. Briefing to the Incoming Minister of Health, 2017: The New Zealand health and disability system. Wellington: Ministry of Health. https://www.health.govt.nz/publication/briefing-incoming-minister-health-2017-new-zealand-health-and-disability-system
127 T Tenbensel, Cumming, J, Ashton, T, and Barnett, P. 2008. Where there’s a will, is there a way? Is New Zealand’s publicly funded health sector able to steer towards population health? Social Science & Medicine 67(7): 1,143–1,152
128 Ministry of Health. 2009. Regulatory Impact Statement: Health Ministerial Review Group. Wellington, p 2. https://treasury.govt.nz/publications/risa/regulatory-impact-statement-health-ministerial-review-group

INTERIM REPORT | PŪRONGO MŌ TĒNEI WĀ
PAGE | 285
129 K Eagar, Garrett, P, and Lin, V. 2001. Health Planning: Australian perspectives. A&U Academic
130 World Health Organization and Public Health Agency of Canada. 2008. Health Equity through Intersectoral Action: An analysis of 18 country case studies. Ottawa: Public Health Agency of Canada. https://www.who.int/social_determinants/resources/health_equity_isa_2008_en.pdf?ua=1
131 AE Hall, Bryant, J, Sanson-Fisher, RW, Fradgley, EA, Proietto, AM, et al. 2018. Consumer input into health care: Time for a new active and comprehensive model of consumer involvement. Health Expectations 21(4):707–713. doi:10.1111/hex.12665
132 VA Entwistle, Renfrew, MJ, Yearley, S, Forrester, J, and Lamont T. 1998. Lay perspectives: Advantages for health research. BMJ 316: 463–466
133 D Horey and Hill, S (eds). 2005. Engaging Consumers in Health Policy. Australian Institute of Health Policy Studies Third Health Policy Roundtable. Canberra, ACT: Australian Institute of Health Policy Studies
134 EA Stewart, Greer, SL, Wilson, I, and Donnelly, PD. 2016. Power to the people? An international review of the democratizing effects of direct elections to healthcare organizations. International Journal of Health Planning and Management 31(2): e69-e85.
135 E Barnett and Clayden, C. 2007. Governance in District Health Boards (Report No 2, Health Reforms 2001 Research Project). Wellington: Health Services Research Centre. https://www.victoria.ac.nz/health/centres/health-services-research-centre/docs/reports/downloads/Report-No.-2-Governance.pdf
136 R Gauld. 2010. Are elected health boards an effective mechanism for public participation in health service governance? Health Expectations 13(4): 369–378
137 Statistics New Zealand. 2013 census ethnic group profiles (webpage) http://archive.stats.govt.nz/Census/2013-census/profile-and-summary-reports/ethnic-profile
138 Waitangi Tribunal. 2019. Health Services and Outcomes Kaupapa Inquiry – Wai 2575. (web page). https://www.waitangitribunal.govt.nz/inquiries/kaupapa-inquiries/health-services-and-outcomes-inquiry/
139 I Joumard, Hoeller, P, André, C, and Nicq, C. 2010. Health Care Systems: Efficiency and institutions (OECD Economics Department Working Papers 769)
140 King A, (2001) The Primary Health Care Strategy. Wellington: Ministry of Health
141 Cumming J, Raymont A, Gribben B, et al. 2005. Evaluation of the Implementation and Intermediate Outcomes of the Primary Care Strategy. First Report. Wellington: Health Services Research Centre, Victoria University of Wellington.
142 Ibid, p26.
143 World Health Organization. 2014. The case for investing in public health: A public health summary report for EPHO 8. Copenhagen: WHO Regional Office for Europe. Available at: http://www.euro.who.int/__data/assets/pdf_file/0009/278073/Case-Investing-Public-Health.pdf?ua=1
144 Masters R, Anwar E, Collins B, Cookson R, Capewell S. Return on investment of public health interventions: a systematic review. J Epidemiol Community Health. 2017; 71:827-34.
145 Return on Investment (ROI) and cost-benefit ratio (CBR) are two forms of economic evaluation that value the financial return, or benefits, of an intervention against the total costs of its delivery. The CBR is the benefit divided by the cost, and the ROI is the benefit minus the cost expressed as a proportion of the cost, that is, the CBR – 1.
146 World Health Organization. 2014. The case for investing in public health: A public health summary report for EPHO 8. Copenhagen: WHO Regional Office for Europe. Available at: http://www.euro.who.int/__data/assets/pdf_file/0009/278073/Case-Investing-Public-Health.pdf?ua=1
147 ibid
NEW ZEALAND HEALTH AND DISABILITY SYSTEM REVIEW | HAUORA MANAAKI KI AOTEAROA WHĀNUI
PAGE | 286
148 Orton LC, Lloyd-Williams F, Taylor-Robinson DC, Moonan M, O’Flaherty M, Capewell S (2011). Prioritising public health: a qualitative study of decision making to reduce health inequalities. BMC Public Health.11:821.
149 World Health Organization, 2018. Building the economic case for primary health care: a scoping review. (Available at: https://www.who.int/docs/default-source/primary-health-care-conference/phc---economic-case.pdf?sfvrsn=8d0105b8_2)
150 D Williams, Garbut, B, and Peters, J. 2015. Core public health functions for New Zealand. New Zealand Medical Journal 128(1418): 16–26. https://www.nzma.org.nz/journal/read-the-journal/all-issues/2010-2019/2015/vo-128-no-1418-24-july-2015/6592
151 Ministry of Health. 2018. 2018/19 Annual Plan Guidance for Public Health Units. https://nsfl.health.govt.nz/dhb-planning-package/previous-planning-packages/201819-planning-package
152 In 2017/18, PHOs were provided with $11.1 million to deliver health promotion activities.
153 Ministry of Health. 2016. Health Loss in New Zealand 1990–2013: A report from the New Zealand Burden of Diseases, Injuries and Risk Factors Study. Wellington: Ministry of Health. https://www.health.govt.nz/publication/health-loss-new-zealand-1990-2013
154 WHO. 2017. Tackling NCDs: ‘Best buys’ and other recommended interventions for the prevention and control of noncommunicable diseases. Geneva: World Health Organization. https://apps.who.int/iris/bitstream/handle/10665/259232/WHO-NMH-NVI-17.9-eng.pdf;jsessionid=8798A718D44266E10C5B58682258B84C?sequence=1
155 University of Otago. 2019. BODE3 Health Intervention League Table (Version 2.0) 2019 [Available from: https://www.otago.ac.nz/wellington/departments/publichealth/research/bode3/otago693006.html]
156 Masters, R., Anwar, E., Collins, B., Cookson, R., & Capewell, S. 2017. Return on investment of public health interventions: a systematic review. Journal of Epidemiology and Community Health, 71(8), 827-834.
157 Ernst and Young. 2018. Evaluation of the tobacco excise increases – Final Report – 27 November 2018 Wellington: Ministry of Health 2018.
158 WHO. 2014. The Case for Investing in Public Health: A public health summary report for EPHO 8. Copenhagen: Regional Office for Europe, World Health Organization. http://www.euro.who.int/__data/assets/pdf_file/0009/278073/Case-Investing-Public-Health.pdf?ua=1
159 Commission on Social Determinants of Health. 2008. Closing the gap in a generation: health equity through action on the social determinants of health. Final Report of the Commission on Social Determinants of Health. Geneva: World Health Organisation.
160 The Treasury’s Living Standards Framework helps assess likely effects of government policy choices on living standards and wellbeing over time. The framework looks across the human, social, natural, and financial/physical aspects of those things that affect our wellbeing – the ‘four capitals’. It emphasises the diversity of outcomes meaningful for New Zealanders and helps Treasury to analyse, measure, and compare those outcomes through a wide and evolving set of indicators.
161 Section 3(d) of the Local Government Act 2002, as amended by the Local Government (Community Well-being) Amendment Act 2019.
162 World Health Organization. 2014. Health in all Policies. Helsinki Statement. Framework for country action. Geneva, World Health organization.
163 Canterbury DHB. 2019. Public Health Service Configurations: A brief literature review (2019 update) Christchurch: Canterbury District Health Board. https://www.cph.co.nz/wp-content/uploads/PublicHealthConfigLitReview.pdf
164 Community and Public Health. 2019. Public Health Service Configurations: A brief literature review (2019 update) Christchurch: Canterbury District Health Board, p 21. https://www.cph.co.nz/wp-content/uploads/PublicHealthConfigLitReview.pdf
165 D Williams, Garbut, B, and Peters, J. 2015. Core public health functions for New Zealand. New Zealand Medical Journal 128(1418): 16–26. https://www.nzma.org.nz/journal/read-the-journal/all-issues/2010-2019/2015/vo-128-no-1418-24-july-2015/6592
INTERIM REPORT | PŪRONGO MŌ TĒNEI WĀ
PAGE | 287
166 D Skegg. 2019. The Health of the People. Wellington: Bridget Williams Books Ltd, pp 99-100.
167 Ibid.
168 Mental Health Foundation. https://www.mentalhealth.org.nz/home/our-work/category/35/farmstrong (accessed 8 Aug 2019)
169 Ibid.
170 Mapu Maia: https://www.mapumaia.nz/ (accessed 14/08/2019)
171 Ministry of Pacific Peoples. (2018) Pacific Aotearoa: Lalanga Fou. Wellington: MPP)
172 H Gifford, Batten, L, Bouton, A, Cragg, M, and Cvitanovi, L. 2018. Delivering on outcomes: The experience of Māori health service providers. Policy Quarterly 14(2): 58–64. https://www.victoria.ac.nz/__data/assets/pdf_file/0006/1500864/Gifford_Batten_et_al.pdf
173 Boulton, A. Tamehana, J. Brannelly, T. 2013. Whānau-centred health and social service delivery in New Zealand: The challenges to, and opportunities for, innovation. MAI Journal Volume 2, Issue 1.
174 K McClintock, Tauroa, R, and Mellsop, G. 2016. An examination of Child and Adolescent Mental Health Services for Māori rangatahi (youth). International Journal of Adolescence and Youth 21(1): 56–63. doi: 10.1080/02673843.2012.692658
175 Te Puni Kōkiri. 2015. Understanding Whānau-centred approaches: Analysis of Phase one Whānau Ora research and monitoring results. Wellington: TPK
176 SUPERU 2017. Subjective whānau wellbeing in Te Kupenga. Wellington: SUPERU
177 H Elder, Te Waka Kuaka, and Te Waka Oranga. 2017. Working with whānau to improve outcomes. Australian and New Zealand Journal of Family Therapy 38: 27–42. doi: 10.1002/anzf.1206
178 Communio. 2017. Waka Ora on Wheels (WOW) Programme Evaluation: Te Kaha o Te Rangatahi Trust. Report for the Ministry of Health.
179 Māori health expert Mason Durie developed Te Whare Tapa Whā model of health in 1982. The model has four dimensions: taha wairua (spiritual health), taha hinengaro (mental health), taha tinana (physical health), and taha whānau (family health).
180 Te Oranganui serves the Te Atihaunui a Paparangi, Ngā Rauru and Ngāti Apa iwi. https://www.teoranganui.co.nz/
181 Waitangi Tribunal. 2019. Hauora: Report on stage one of the Health Services and Outcomes Kaupapa Inquiry (Pre-Publication Version). Wellington: Waitangi Tribunal
182 Waitangi Tribunal. 2019. Hauora: Report on stage one of the Health Services and Outcomes Kaupapa Inquiry (Pre-Publication Version). Wellington: Waitangi Tribunal
183 Auckland Uniservices Ltd. Variation in Medicines use by ethnicity: a comparison between 2006/7 and 2012/13. Auckland. Auckland University. Cited in: PHARMAC. 2019. Achieving Medicine Access Equity in Aotearoa New Zealand. Towards a Theory of Change. Wellington: PHARMAC.
184 Ministry of Health, 2019. Health Survey Annual Data Explorer 2017/18. Ministry of Health: New Zealand. Available at: https://www.health.govt.nz/publication/annual-update-key-results-2017-18-new-zealand-health-survey
185 PHARMAC. 2019. Achieving Medicine Access Equity in Aotearoa New Zealand. Towards a Theory of Change. Wellington: PHARMAC.
186 Barber N, Parsons J, Clifford S, Darracott R, Horne R. Patients’ problems with new medication for chronic conditions. Qual Saf Health Care 2004; 13:172-175. Cited in PHARMAC. 2019. Achieving Medicine Access Equity in Aotearoa New Zealand. Towards a Theory of Change. Wellington: PHARMAC.
187 Cadham Pharmacy website: Available at: https://www.cadhampharmacy.com/
188 Ministry of Health. Implementing Medicines New Zealand 2015 to 2020. Wellington: Ministry of Health; 2015 Jun. Available from: http://www.health.govt.nz/publication/implementing-medicines-new-zealand-2015-2020

NEW ZEALAND HEALTH AND DISABILITY SYSTEM REVIEW | HAUORA MANAAKI KI AOTEAROA WHĀNUI
PAGE | 288
189 Ministry of Health. Implementing Medicines New Zealand 2015 to 2020. Wellington: Ministry of Health; 2015 Jun. Available from: http://www.health.govt.nz/publication/implementing-medicines-new-zealand-2015-2020
190 Pharmaceutical Society of New Zealand Inc. 2014. New Zealand National Pharmacist Services Framework 2014. Wellington: Pharmaceutical Society of New Zealand Inc. Available at: https://www.psnz.org.nz/Folder?Action=View%20File&Folder_id=86&File=PSNZPharmacistServicesFramework2014FINAL.pdf
191 Pharmaceutical Society of New Zealand and New Zealand Medical Association. An Integrated Framework for Pharmacists and Doctors. Wellington, New Zealand. April 2017. Available at: www.psnz.org.nz and www.nzma.org.nz
192 Haua R, Harrison J, and Aspden T, 2019. Pharmacist integration into general practice in New Zealand. Journal of Primary Health Care 2019; 11(2): 159-169. Available at: https://www.publish.csiro.au/HC/pdf/HC18103
193 Campbell C , Braund R , Morris C . Beyond the four walls: an exploratory survey of location, employment and roles of pharmacists in primary health care. J Prim Health Care. 2017; 9 (4) 297 – 310 . doi: 10.1071/HC17022> Cited in Haua R, Harrison J, and Aspden T, 2019. Pharmacist integration into general practice in New Zealand. Journal of Primary Health Care 2019; 11(2): 159-169. Available at: https://www.publish.csiro.au/HC/pdf/HC18103
194 World Health Organization (2019) Oral health - Key facts. Available at: https://www.who.int/news-room/fact-sheets/detail/oral-health
195 Submission to Health and Disability System Review by Dental Public Health Specialists, Robin Whyman et al, 13 April 2019
196 Mejia G , Elan H, Harper S, Thomson W M, Ju X, Kawachi I, Kaufman J, Jamieson L, 2018, Socioeconomic status, oral health and dental disease in Australia, Canada, New Zealand and the United States, in BMC Oral Health201818:176. Available at: https://bmcoralhealth.biomedcentral.com/articles/10.1186/s12903-018-0630-3
197 Ministry of Health. 2018. Age 5 and Year 8 oral health data from the Community Oral Health Service. URL: www.health.govt.nz/nz-health-statistics/health-statistics-and-data-sets/oral-health-data-and-stats/age-5-and-year-8-oral-health-data-community-oral-health-service (accessed 25 April 2019).
198 Māori Health Improvement Group website. Available at: https://www.maorioralhealth.org.nz/mohproviders Improvement Group
199 Clark, E. Foster Page, LE. Larkin,K. et al. 2019. Caries-preventive efficacy of a supervised school toothbrushing programme in Northland, New Zealand. Community Dent Health. Feb 25;36(1):9-16. doi: 10.1922/CDH_4337Clark08
200 Sapere Research Group. 2015. Review of the Benefits and Costs of Water Fluoridation in New Zealand. Wellington: Ministry of Health.
201 Ministry of Health. 2019. Report on Maternity 2017.Wellington: Ministry of Health.
202 ibid
203 Moore, T.G., Arefadib, N., Deery, A., Keyes, M. & West, S. (2017). The First Thousand Days: An Evidence Paper – Summary. Parkville, Victoria: Centre for Community Child Health, Murdoch Children’s Research Institute.
204 Ministry of Health. 2013. Well Child / Tamariki Ora National Schedule 2013. Wellington: Ministry of Health. https://www.health.govt.nz/system/files/documents/publications/well-child-tamariki-ora-national-schedule-oct13-v2.pdf
205 Well Child Tamariki Ora Tier Level Two Service Specification. 2014. https://nsfl.health.govt.nz/service-specifications/current-service-specifications/child-and-youth-health-service-specifications
206 B4 School Check Service Tier Level Two Service Specification. 2014. https://nsfl.health.govt.nz/service-specifications/current-service-specifications/child-and-youth-health-service-specifications
207 Litmus Limited. 2013. The Well Child / Tamariki Ora Programme Quality Reviews. Wellington: Ministry of Health.
208 Ministry of Health 2010. Changes to the Well Child/Tamariki Ora Framework. Wellington: Ministry of Health
209 Ministry of Health website: Well Child Tamariki Ora Review announcement: 12 November 2018. https://www.health.govt.nz/our-work/life-stages/child-health/well-child-tamariki-ora-services/well-child-tamariki-ora-review/well-child-tamariki-ora-review-announcement-12-november-2018

INTERIM REPORT | PŪRONGO MŌ TĒNEI WĀ
PAGE | 289
210 Ministry of Health (2016). Older people’s health: DHB spending on services for older people. https://www.health.govt.nz/nz-health-statistics/health-statistics-and-data-sets/older-peoples-health-data-and-stats/dhb-spending-services-older-people
211 New Zealand Aged Care Industry Association (2018). Aged Care Industry Profile 2017-18. Wellington: NZACA
212 New Zealand Government (2019). About residential care. https://www.govt.nz/browse/health/residential-care/about-residential-care/
213 TAS Kahui tuitui tangata (2019). interRAI New Zealand https://www.interrai.co.nz/about/
214 New Zealand Government (2019). About residential care. https://www.govt.nz/browse/health/residential-care/about-residential-care/
215 New Zealand Government (2019). About residential care. https://www.govt.nz/browse/health/residential-care/about-residential-care/
216 TAS Kahui tuitui tangata (2019). Aged Residential Care funding model review. https://tas.health.nz/dhb-programmes-and-contracts/health-of-older-people-programme/aged-residential-care-funding-model-review/
217 New Zealand Aged Care Industry Association (2018). Aged Care Industry Profile 2017-18. Wellington: NZACA
218 New Zealand Aged Care Industry Association (2018). Aged Care Industry Profile 2017-18. Wellington: NZACA
219 New Zealand Aged Care Industry Association (2019). Find a rest home: paying for care. https://findaresthome.co.nz/questions/QAPayingforCare.htm
220 New Zealand Aged Care Industry Association (2018). Aged Care Industry Profile 2017-18. Wellington: NZACA
221 New Zealand Aged Care Industry Association (2018). Aged Care Industry Profile 2017-18. Wellington: NZACA
222 Minister of Health. 2001. Primary Health Care Strategy. Wellington: Ministry of Health. https://www.health.govt.nz/publication/primary-health-care-strategy
223 Ministry of Health. 2019. Access to Primary Care as at July 2019. Accessed August 2019: https://www.health.govt.nz/our-work/primary-health-care/about-primary-health-organisations/enrolment-primary-health-organisation Note: The estimated percentage of those who are enrolled in a PHO may exceed 100% as data is sourced from two different places (Ministry of Health & Stats NZ).
224 L Middleton, Dunn, P, O’Loughlin, C, and Cumming, J. 2018. Taking Stock: Primary care Innovation. Report for the New Zealand Productivity Commission. Victoria University of Wellington. https://www.productivity.govt.nz/sites/default/files/Taking%20Stock%20Primary%20Care%20Innovation_Victoria%20University%20Wellington.pdf
225 Ministry of Health. 2018. Health and Independence Report 2017: The Director-General of Health’s Annual Report on the State of Public Health. Wellington: Ministry of Health, p 53. https://www.health.govt.nz/publication/health-and-independence-report-2017
226 Waitangi Tribunal. 2019. Hauora: Report on Stage One of the Health Services and Outcomes Kaupapa Inquiry (WAI 2575). Wellington: Waitangi Tribunal. https://forms.justice.govt.nz/search/Documents/WT/wt_DOC_150429818/Hauora%20Pre-PubW.pdf
227 Health Quality and Safety Commission. 2018. Atlas of Healthcare Variation: Health service use – Key findings. https://www.hqsc.govt.nz/assets/Health-Quality-Evaluation/Atlas/Health-service-access/PR/Atlas_healthcare_service_use_infographic_web.pdf
228 Ministry of Health. 2019. New Zealand Health Survey (web page). https://www.health.govt.nz/nz-health-statistics/national-collections-and-surveys/surveys/new-zealand-health-survey
229 Health Quality & Safety Commission New Zealand. 2018. Primary care patient experience (web page). https://www.hqsc.govt.nz/our-programmes/health-quality-evaluation/projects/patient-experience/primary-care-patient-experience/
NEW ZEALAND HEALTH AND DISABILITY SYSTEM REVIEW | HAUORA MANAAKI KI AOTEAROA WHĀNUI
PAGE | 290
230 Came et al 2018 Māori and mainstream public health providers
231 Government Inquiry into Mental Health and Addiction. 2018. He Ara Oranga: Report of the Government Inquiry into Mental Health and Addiction. Wellington: The Inquiry. https://mentalhealth.inquiry.govt.nz/
232 New Zealand Productivity Commission. 2015. More Effective Social Services. Wellington: Productivity Commission. https://www.productivity.govt.nz/inquiry-content/2032?stage=4
233 PHO Services Agreement (version 6), 1 December 2018. https://tas.health.nz/assets/Primary-psaap-u14/PHO-Services-Agreement-Version-6.0-1-December-2018-58445514-PDF.pdf
234 Midlands Regional Health Network Charitable Trust, excerpt from annual financial statements. Accessed August 2019: https://www.pinnacle.co.nz/uploads/pinnacle-report-a3-19-04-1465-lowres.pdf
235 Annual Return Summary of Midlands Regional Health Network Charitable Trust, year ending 30 June 2018. Accessed August 2019: https://www.register.charities.govt.nz/CharitiesRegister/ViewCharity?accountId=4596f287-88a9-df11-871d-00155d741101
236 Midlands Regional Health Network Charitable Trust, annual report 2017. Accessed August 2019: https://www.pinnacle.co.nz/uploads/1803070-pinnacle-trust-report-2017-final.pdf
237 Constitution of Pinnacle Incorporated. Accessed August 2019: https://www.register.charities.govt.nz/CharitiesRegister/ViewCharity?accountId=eba1c372-f289-dc11-98a0-0015c5f3da29
238 Western Bay of Plenty Primary Health Organisation website. Accessed August 2019: https://www.wboppho.org.nz/about-us/
239 Constitution of Western Bay of Plenty Primary Health Organisation Limited. Accessed August 2019: https://www.register.charities.govt.nz/CharitiesRegister/ViewCharity?accountId=d3e29839-662c-dd11-8f7f-0015c5f3da29
240 Cordery, C., & Howell, B. (2011). From Providers to PHOs: an institutional analysis of nonprofit primary health care governance in New Zealand.
241 Information collected from annual report of Procare Health Limited, and annual returns available in the charities register for Pegasus Health (Charitable) Limited, Midlands Regional Health Network Charitable Trust, Tū Ora Compass Health, WellSouth Primary Health Network, Comprehensive Care PHO Limited, and Western Bay of Plenty PHO Limited.
242 Cumming, J., Dunn, P., Middleton, L. and O’Loughlin, C. (2018), "The health care home in New Zealand: rolling out a new model of primary health care", Journal of Integrated Care, Vol. 26 No. 3, pp. 242-252. https://doi.org/10.1108/JICA-04-2018-0031https://www.rnzcgp.org.nz/RNZCGP/Publications/The_GP_workforce/RNZCGP/Publications/GP workforce.aspx?hkey=a7341975-3f92-4d84-98ec-8c72f7c8e151
243 Royal College of General Practitioners. 2019. 2018 General Practice Workforce Survey Part 1. Wellington: Royal College of General Practitioners. https://www.rnzcgp.org.nz/RNZCGP/Publications/The_GP_workforce/RNZCGP/Publications/GP%20workforce.aspx?hkey=a7341975-3f92-4d84-98ec-8c72f7c8e151
244 Royal College of General Practitioners. 2019. 2018 General Practice Workforce Survey Part 1. Wellington: Royal College of General Practitioners. https://www.rnzcgp.org.nz/RNZCGP/Publications/The_GP_workforce/RNZCGP/Publications/GP%20workforce.aspx?hkey=a7341975-3f92-4d84-98ec-8c72f7c8e151
245 T Love, Ehrenberg, N, and Esplin, J. Alliance Contracting: Background and relevance for ACC funded services. Prepared for the Accident Compensation Corporation. Wellington: Sapere Research Group. http://www.srgexpert.com/publications/alliance-contracting-background-and-relevance-for-acc-funded-services/
246 S Graham. 2018. DHB–PHO alliances – making them work. Presentation at Shifting Care Closer to Home: How Do We Transform conference, Te Papa Conference Centre, Wellington, 27–28 February.
247 United Nations Convention on the Rights of Persons with Disabilities, 2006. https://www.un.org/development/desa/disabilities/convention-on-the-rights-of-persons-with-disabilities.html

INTERIM REPORT | PŪRONGO MŌ TĒNEI WĀ
PAGE | 291
248 World Health Organization and the World Bank (2011). World Report on Disability. World Health Organization https://www.who.int/disabilities/world_report/2011/report/en/
249 United Nations. 2018. Promoting Inclusion through Social Protection: Report on the World Social Situation 2018. New York: United Nations, p 76. http://bit.ly/UN-RWSS2018
250 Institute for Health Metrics and Evaluation (2019). Global Burden of Disease 2007 and 2017. GBD compare https://vizhub.healthdata.org/gbd-compare/
251 Statistics New Zealand. 2014. New Zealand Disability Survey: 2013. Wellington: Statistics New Zealand. https://www.stats.govt.nz/topics/disability
252 N Higgins, Phillips, H, and Cowan, C. 2013. Eighty years of growing up kāpo (blind) Māori: What can we learn about inclusive education in New Zealand? International Journal of Inclusive Education 17(8): 812–826, p 813. https://doi.org/10.1080/13603116.2011.602519
253 Statistics New Zealand. 2014. New Zealand Disability Survey: 2013. Wellington: Statistics New Zealand. https://www.stats.govt.nz/topics/disability
254 King PT (2019). Māori with lived experience of disability. Part 1. Report commissioned by the Waitangi Tribunal for Stage Two of the Wai 2575 He4alth Services and Outcomes Kaupapa Inquiry. Wellington: Ministry of Justice
255 Minister for Disability Issues. 2016. New Zealand Disability Strategy 2016–2026. Wellington: Ministry of Social Development, p 6. https://www.odi.govt.nz/nz-disability-strategy/about-the-strategy/new-zealand-disability-strategy-2016-2026/
256 Statistics New Zealand. 2014. Social and Economic Outcomes for Disabled People: Findings from the 2013 Disability Survey. Wellington: Statistics New Zealand.
257 Statistics New Zealand. 2018. Household Labour Force Survey: Labour market measures for disabled people, 2017–2018.
258 S Murray. 2018. Breaking the link between disability and child and whanau poverty. Policy Quarterly 14(4): 68–77. https://doi.org/10.26686/pq.v14i4.5151
259 New Zealand Public Health and Disability Act 2000, section 3(1).
260 Statistics New Zealand. 2017. Supporting disabled people: 2013 (web page). https://www.stats.govt.nz/reports/supporting-disabled-people-2013
261 Ministry of Health. 2017. Demographic Report on Clients Allocated the Ministry of Health’s Disability Support Services as at September 2016. Wellington: Ministry of Health. https://www.health.govt.nz/publication/demographic-report-clients-allocated-ministry-healths-disability-support-services-september-2016
262 Ministry of Health. 2017. Demographic Report on Clients Allocated the Ministry of Health’s Disability Support Services as at September 2016. Wellington: Ministry of Health. https://www.health.govt.nz/publication/demographic-report-clients-allocated-ministry-healths-disability-support-services-september-2016
263 S Murray. 2018. Breaking the link between disability and child and whanau poverty. Policy Quarterly 14(4): 68–77. https://doi.org/10.26686/pq.v14i4.5151
264 J Esplin, Moore, D, Blick, G, Rook, H, and Poynton, M. 2016. Disability Information and Advisory Services and Needs Assessment and Service Coordination Review: A proposed design and framework. Wellington: Sapere Research Group. https://www.health.govt.nz/publication/disability-information-and-advisory-services-and-needs-assessment-and-service-coordination-review
265 Ministry of Health. 2017. Demographic Report on Clients Allocated the Ministry of Health’s Disability Support Services as at September 2016. Wellington: Ministry of Health. https://www.health.govt.nz/publication/demographic-report-clients-allocated-ministry-healths-disability-support-services-september-2016
266 Ministry of Health. 2016. Scope: Improving outcomes for people whose behaviour presents challenges to community residential services 2017–2022. https://www.health.govt.nz/ouwork/disability-services/disability-projects/service-strategy-development
NEW ZEALAND HEALTH AND DISABILITY SYSTEM REVIEW | HAUORA MANAAKI KI AOTEAROA WHĀNUI
PAGE | 292
267 Te Pou o te Whakaaro Nui and New Zealand Disability Support Network. 2016. The New Zealand Disability Support Workforce: 2015 survey of NZDSN member organisations – A summary report. Auckland: Te Pou o te Whakaaro Nui..
268 Te Pou o te Whakaaro Nui & NZDSN (New Zealand Disability Support Network). (2016). The New Zealand disability support workforce: 2015 survey of NZDSN member organisations – A summary report. Auckland: Te Pou o te Whakaaro Nui.
269 Grimond D (2014). The economic value and impacts of informal care in New Zealand. Infometrics https://cdn.auckland.ac.nz/assets/auckland/about-us/equity-at-the-university/equity-information-staff/information-for-carers/The%20economic%20value%20of%20informal%20care%20in%20New%20Zealand%20Final%20copy.pdf
270 Ministry of Health, unpublished information, 2019.
271 Ministry of Health, unpublished information, 2019..
272 Ministry of Health, unpublished information, 2019..
273 Accident Compensation Corporation. 2018. What we do (web page). https://www.acc.co.nz/about-us/who-we-are/what-we-do/?smooth-scroll=content-after-navs
274 Accident Compensation Act 2001.
275 Ministry of Health. 2017. Demographic Report on Clients Allocated the Ministry of Health’s Disability Support Services as at September 2016. Wellington: Ministry of Health. https://www.health.govt.nz/publication/demographic-report-clients-allocated-ministry-healths-disability-support-services-september-2016 https://www.health.govt.nz/publication/demographic-report-clients-allocated-ministry-healths-disability-support-services-september-2016
276 Fleming P, McGilloway S, Hernon M et al (2019). Individualised funding interventions to improve health and social care outcomes for people with a disability: a mixed-methods systematic review. Campbell Systematic Reviews: Campbell Collaboration https://campbellcollaboration.org/library/personal-budgeting-outcomes-people-with-disability.html
277 http://www.enablinggoodlives.co.nz/about-egl/enabling-good-lives-context/1-how-enabling-good-lives-started-the-august-2011-report/
278 Productivity Commission (2015). More effective social services. Wellington: New Zealand Productivity Commission https://www.productivity.govt.nz/sites/default/files/social-services-final-report-main.pdf ISBN: 978-0-478-44021-8 (print) ISBN: 978-0-478-44022-5 (online)
279 Were L, Crocket A (2019). Enabling Good Lives Waikato Demonstration: Phase three evaluation report. http://www.enablinggoodlives.co.nz/current-demonstrations/enabling-good-lives-waikato/waikato-evaluations/
280 Personal communication
281 World Health Organization (2016). Framework on integrated, people-centred health services. Report by the Secretariat. World Health Organization https://www.who.int/disabilities/world_report/2011/report.pdf?ua=1
282 World Health Organization. (2015). People-centred and integrated health services: an overview of the evidence: interim report. World Health Organization. https://apps.who.int/iris/handle/10665/155004
283 Healthcare Improvement Scotland. People-Led Care. https://ihub.scot/improvement-programmes/people-led-care/
284 South Auckland Social Investment Board (2018). Start Well Māngere. In Director’s Report to Counties Manukau District Health Board. https://www.countiesmanukau.health.nz/assets/About-CMH/Board-and-committees/CMDHB/Agenda-Combined-Papers-Public-27.6.18.pdf
285 Productivity Commission (2015). More effective social services. Wellington: New Zealand Productivity Commission https://www.productivity.govt.nz/sites/default/files/social-services-final-report-main.pdf ISBN: 978-0-478-44021-8 (print) ISBN: 978-0-478-44022-5 (online)

INTERIM REPORT | PŪRONGO MŌ TĒNEI WĀ
PAGE | 293
286 Productivity Commission (2015). More effective social services. Wellington: New Zealand Productivity Commission https://www.productivity.govt.nz/sites/default/files/social-services-final-report-main.pdf ISBN: 978-0-478-44021-8 (print) ISBN: 978-0-478-44022-5 (online)
287 Rangi C et al (2018). Whānau Ora Review Tipu Matoro kit e Ao. Wellington: Te Puni Kōkiri
288 H Barnett. 2015. Report to the Special Rapporteur on the Rights of Persons with Disabilities United Nations Geneva. Wellington: Disabled Persons Assembly (NZ). http://www.dpa.org.nz/page/71/AllSubmissions.html
289 J Esplin, Moore, D, Blick, G, Rook, H, and Poynton, M. 2016. Disability Information and Advisory Services and Needs Assessment and Service Coordination Review: A proposed design and framework. Wellington: Sapere Research Group. https://www.health.govt.nz/publication/disability-information-and-advisory-services-and-needs-assessment-and-service-coordination-review
290 OECD. 2018. Care Needed: Improving the lives of people with dementia. Paris: OECD. https://doi.org/10.1787/9789264085107-en
291 Office for Disability Issues (2016). New Zealand Disability Strategy 2016-2026. Wellington: Ministry of Social Development
292 WHO. 2016. Framework on Integrated, People-centred Health Services: Report by the Secretariat. Geneva: World Health Organization. https://www.who.int/disabilities/world_report/2011/report.pdf?ua=
293 Statistics New Zealand. 2014. Social and Economic Outcomes for Disabled People: Findings from the 2013 Disability Survey. Wellington: Statistics New Zealand. http://archive.stats.govt.nz/browse_for_stats/health/disabilities/social-economic-outcomes-13.aspx
294 Ministry of Health. 2008. Pacific Peoples’ Experience of Disability: A paper for the Pacific Health and Disability Action Plan Review. Wellington: Ministry of Health. https://www.health.govt.nz/publication/pacific-peoples-experience-disability-paper-pacific-health-and-disability-action-plan-review
295 B Mirfin-Veitch and Paris, A. 2013. Primary Health and Disability: A review of the literature. Auckland: Te Pou o Te Whakaaro Nui. https://www.tepou.co.nz/uploads/files/resource-assets/primary-health-and-disability-a-review-of-the-literature.pdf
296 Te Pou o te Whakaaro Nui. 2014. The Physical Health of People with a Serious Mental illness and/or Addiction: An evidence review. Auckland: Te Pou o te Whakaaro Nui. https://www.tepou.co.nz/resources/the-physical-health-of-people-with-a-serious-mental-illness-andor-addiction-an-evidence-review/515
297 Te Pou o te Whakaaro Nui. 2017. The Physical Health of People with a Serious Mental illness and/or Addiction: Evidence update. Auckland: Te Pou o te Whakaaro Nui. https://www.tepou.co.nz/resources/the-physical-health-of-people-with-mental-health-conditions-andor-addiction-evidence-update-december-2017/854
298 Ministry of Health. 2011. Health Indicators for New Zealanders with Intellectual Disability. Wellington: Ministry of Health. https://www.health.govt.nz/publication/health-indicators-new-zealanders-intellectual-disability
299 S Banks. 2016. Chronic Illness and People with Intellectual Disability: Prevalence, prevention and management. Australia: National Disability Services. https://www.nds.org.au/images/LearnNDevelop/Chronic-Illness-and-People-with-Intellectual-Disability.PDF
300 P Milner, Mirfin-Veitch, B, and Brown, S. 2017. Getting the Life I Want: Integrative literature review. Dunedin: Donald Beasley Institute. https://www.ccsdisabilityaction.org.nz/assets/resource-files/Getting-the-Life-I-Want-Integrated-Literature-Review.pdf
301 S Lindsay, Cagliostro, E, Albarico, M, Mortaji, N, and Karon, L. 2018. A systematic review of the benefits of hiring people with disabilities. Journal of Occupational Rehabilitation 28: 634. https://doi.org/10.1007/s10926-018-9756-z
302 OECD. 2010. Sickness, Disability and Work: Breaking the barriers – A synthesis of findings across OECD countries. Paris: OECD. https://doi.org/10.1787/9789264088856-en
303 Elliott, L, Coleman, K, Suebwongpat, A, Norris, S. (2008). Foetal alcohol spectrum disorders: Systematic reviews of prevention, diagnosis and management. Wellington: Health Services Assessment Collaboration

NEW ZEALAND HEALTH AND DISABILITY SYSTEM REVIEW | HAUORA MANAAKI KI AOTEAROA WHĀNUI
PAGE | 294
304 Gurney JK et al (2017). Risk of lower limb amputation in a national prevalent cohort of patients with diabetes. Diabetologia 61(3):626-635
305 Institute for Health Metrics and Evaluation (ed). 2019. Disability impact 1990 to 2017 in selected countries. In: Global Burden of Disease Compare.
306 The King’s Fund (2019). Social Care 360. London: The Kings Fund. https://www.kingsfund.org.uk/publications/social-care-360
307 C Gretton and Honeyman, M.https://www.kingsfund.org.uk/about-us/whos-who/cosima-gretton 2016. The digital revolution: Eight technologies that will change health and care. The Kings Fund. https://www.kingsfund.org.uk/publications/eight-technologies-will-change-health-and-care
308 http://www.beaccessible.org.nz/the-movement/about-be-accessible
309 HQSC. 2018. A Window on the Quality of Aotearoa New Zealand’s Health Care 2018. Wellington: Health Quality & Safety Commission New Zealand, p 5. https://www.hqsc.govt.nz/our-programmes/health-quality-evaluation/publications-and-resources/publication/3364/
310 Ministry of Health. 2019. Public hospitals (web page). https://www.health.govt.nz/your-health/certified-providers/public-hospital
311 Projections produced by Statistics New Zealand according to assumptions specified by the Ministry of Health.
312 Sapere Research Group. 2018. Transforming our Health Services: Clinical services plan – the next ten years. Prepared for the Hawke’s Bay District Health Board. http://www.ourhealthhb.nz/news-and-events/clinical-services-plan-transforming-our-health-services/ (accessed 5 June 2019).
313 Sapere Research Group. 2017. Indicative Business Case for Dunedin Hospital Rebuild (redacted version). Commissioned by the Ministry of Health for the Southern Partnership Group, p 19. https://www.health.govt.nz/system/files/documents/pages/2017-06-29_final_ibc_redacted.pdf (accessed 5 June 2019).
314 Hutt Valley DHB. Clinical Services Plan: Developing our health services for the next ten years 2018–2028. Lower Hutt: Hutt Valley District Health Board. http://www.huttvalleydhb.org.nz/about-us/reports-and-publications/clinical-service-plan-2018-2028/
315 Northern Regional Alliance. 2018. Northern Region Long Term Investment Plan. http://www.nra.health.nz/our-services/regional-planning-and-service-delivery/
316 F Madsen, Ladelund, S, and Allan Linneberg, A. 2014. High levels of bed occupancy associated with increased inpatient and thirty-day hospital mortality in Denmark. Health Affairs 33(7): 55–64, pp 55–56. https://doi.org/10.1377/hlthaff.2013.1303
317 M Ardagh. 2015. A comprehensive approach to improving patient flow in our hospitals: The ‘left to right, over and under’ concept. New Zealand Medical Journal 128(1420). https://www.nzma.org.nz/journal/read-the-journal/all-issues/2010-2019/2015/vol-128-no-1420-21-august-2015/6625
318 Sapere Research Group. 2018. Transforming our Health Services: Clinical services plan – the next ten years. Prepared for Hawke’s Bay DHB. http://ourhealthhb.nz/news-and-events/clinical-services-plan-transforming-our-health-services/
319 Hutt Valley DHB. 2018. Clinical Services Plan: Developing our health services for the next ten years 2018–2028. http://www.huttvalleydhb.org.nz/about-us/reports-and-publications/clinical-service-plan-2018-2028/hvdhb-clinical-services-plan-20190213-v15-web.pdf
320 https://www.bopdhb.govt.nz/media/60567/bop-strategic-health-services-plan.pdf
321 Northern Region. 2018. Northern Region Long Term Investment Plan: Executive summary – January 2018. http://www.nra.health.nz/assets/Documents/LRLTIP-Executive-Summary/NRLTIP_ExecSummarywCover_Final.pdf
322 Sapere Research Group. 2017. Indicative Business Case for Dunedin Hospital Rebuild (redacted version). Commissioned by the Ministry of Health for the Southern Partnership Group. https://www.health.govt.nz/system/files/documents/pages/2017-06-29_final_ibc_redacted.pdf
INTERIM REPORT | PŪRONGO MŌ TĒNEI WĀ
PAGE | 295
323 AJ Mulley. 2010. Improving productivity in the NHS. The BMJ 341(7,766): c3965.
324 HQSC. 2019. A Window on the Quality of Aotearoa New Zealand’s Health Care 2019: A view on Māori health equity. Wellington: Health Quality & Safety Commission New Zealand. https://www.hqsc.govt.nz/our-programmes/health-quality-evaluation/publications-and-resources/publication/3721
325 HQSC. 2019. A Window on the Quality of Aotearoa New Zealand’s Health Care 2019: A view on Māori health equity. Wellington: Health Quality & Safety Commission New Zealand. https://www.hqsc.govt.nz/our-programmes/health-quality-evaluation/publications-and-resources/publication/3721
326 HQSC. 2019. A Window on the Quality of Aotearoa New Zealand’s Health Care 2019: A view on Māori health equity. Wellington: Health Quality & Safety Commission New Zealand. https://www.hqsc.govt.nz/our-programmes/health-quality-evaluation/publications-and-resources/publication/3721
327 N Brewer, Zugna, D, Daniel, R, Borman, B, Pearce, N, et al. 2012. Which factors account for the ethnic inequalities in stage at diagnosis and cervical cancer survival in New Zealand? Cancer Epidemiology 36(4): e251-7. doi: 10.1016/j.canep.2012.03.005
328 R Lawrenson, Lao, C, Jacobson, G, Seneviratne, S, Scott, N, et al. 2019. Outcomes in different ethnic groups of New Zealand patients with screen-detected vs. non-screen-detected breast cancer. Journal of Medical Screening. https://doi.org/10.1177/0969141319844801
329 J Rumball-Smith, Sarfati, D, Hider, P, and Blakely, T. 2013. Ethnic disparities in the quality of hospital care in New Zealand, as measured by 30-day rate of unplanned readmission/death. International Journal for Quality in Health Care 25(3): 248–254. https://doi.org/10.1093/intqhc/mzt012
330 Ministry of Health. 2019. Acute bed days per capital report for DHB of domicile, December 2018 (Data file).
331 H Came, McCreanor, T, Manson, L, and Nuku, K. 2019. Upholding Te Tiriti, ending institutional racism and Crown inaction on health equity. New Zealand Medical Journal 132(1,492): 61–66, p 62. https://openrepository.aut.ac.nz/bitstream/handle/10292/12402/Inaction%20NZMJ.pdf?sequence=2&isAllowed=y
332 J Rumball-Smith. 2009. Not in my hospital? Ethnic disparities in quality of hospital care in New Zealand: A narrative of the evidence. New Zealand Medical Journal 122(1,297): 68–83.
333 E Cloete, Sadler, L, Bloomfield, FH, Crengle, S, Percival, T, et al. 2019. Congenital left heart obstruction: Ethnic variation in incidence and infant survival. Archives of Disease in Childhood doi: 10.1136/archdischild-2018-315887
334 Ministry of Health. 2019. Office of the Director of Mental Health and Addiction Services: Annual Report 2017. Wellington: Ministry of Health. https://www.health.govt.nz/publication/office-director-mental-health-and-addiction-services-annual-report-2017
335 Wijohn. S. and Snowden, K. Personal communication, 17 June 2019.
336 D Fearnley, Lawrenson, R, and Nixon, G. 2016. ‘Poorly defined’: Unknown unknowns in New Zealand rural health. New Zealand Medical Journal 129(1,439): 77–81 https://www.nzma.org.nz/journal/read-the-journal/all-issues/2010-2019/2016/vol-129-no-1439-5-august-2016/6964
337 D Fearnley, Lawrenson, R, and Nixon, G. 2016. ‘Poorly defined’: Unknown unknowns in New Zealand rural health. New Zealand Medical Journal 129(1,439): 77–81. https://www.nzma.org.nz/journal/read-the-journal/all-issues/2010-2019/2016/vol-129-no-1439-5-august-2016/6964
338 M Williamson, Gormley, A, Dovey, S, and Farry, P. 2010. Rural hospitals in New Zealand: Results from a survey New Zealand Medical Journal 123(1315): 20–29, p 28. https://www.nzma.org.nz/journal/read-the-journal/all-issues/2010-2019/2010/vol-123-no-1315/article-williamson
339 GH Nixon, Kerse, NM, Bagg, W, Skinner, MA, Larmer, PJ, et al. 2018. Proposal for a National Interprofessional School of Rural Health. New Zealand Medical Journal 131(1,485): 67–75. https://www.nzma.org.nz/__data/assets/pdf_file/0017/86012/Nixon-FINAL.pdf

NEW ZEALAND HEALTH AND DISABILITY SYSTEM REVIEW | HAUORA MANAAKI KI AOTEAROA WHĀNUI
PAGE | 296
340 Office of the Auditor General. 2011. Progress in Delivering Publicly Funded Health Services. Wellington: Office of the Auditor General. https://www.oag.govt.nz/2011/scheduled-services
341 Office of the Auditor General. 2011. Progress in Delivering Publicly Funded Health Services. Wellington: Office of the Auditor General. https://www.oag.govt.nz/2011/scheduled-services/docs/scheduled-services.pdf
342 New Zealand Private Surgical Hospitals Association. 2018. Private surgical hospitals propose plan to cut surgery waits (media release). New Zealand Doctor (8 February). https://www.nzdoctor.co.nz/article/undoctored/private-surgical-hospitals-propose-plan-cut-surgery-waits
343 HQSC. 2018. A Window on the Quality of Aotearoa New Zealand’s Health Care 2018. Wellington: Health Quality & Safety Commission New Zealand, p 37. https://www.hqsc.govt.nz/our-programmes/health-quality-evaluation/publications-and-resources/publication/3364/
344 National Health Committee. 2004. Prioritising Health Services: A background paper to the National Health Committee. National Health Committee page http://www.moh.govt.nz/notebook/nbbooks.nsf/0/386E76C777C9733CCC2579E3006D761F/$file/prioritisation-backgroundpapers.pdf
345 Health Funding Authority. 2000. Overview of the Health Funding Authority’s Prioritisation Decision Making Framework. Wellington: Health Funding Authority. http://www.moh.govt.nz/notebook/nbbooks.nsf/0/46afe3c10a64b6cfcc2574b2007e0a3f/$FILE/Prioritisation_Overview31_81.pdf
346 Joint DHB and Ministry of Health Working Group on Prioritisation . 2005. The Best Use of Available Resources: An approach to prioritisation. Wellington: Ministry of Health. http://www.moh.govt.nz/notebook/nbbooks.nsf/0/CE36EB1B2AB5C259CC2571450074A8E8/$file/best-use-of-available-resources.pdf
347 Ministerial Review Group. 2009. Meeting the Challenge: Enhancing sustainability and the patient and consumer experience within the current legislative framework for health and disability services in New Zealand. Wellington: Ministry of Health, page 29. http://www.moh.govt.nz/NoteBook/nbbooks.nsf/0/A1CE38F0314DFC63CC25762D000DC6B1/$file/MRG%20Report%20Meeting%20the%20Challenge.pdf
348 National Health Committee. 2016. Guidance for Economic Analysis: Work in progress – All guidance subject to change – not currently in use.
349 The Treasury. 2015. Guide to Societal Cost Benefit Analysis. Wellington: The Treasury. https://treasury.govt.nz/publications/guide/guide-social-cost-benefit-analysis
350 SR Munn. 2014. Hospital-based health technology assessment: Insights from New Zealand. PharmacoEconomics 32(9): 815–817, p 815. https://doi.org/10.1007/s40273-014-0202-6
351 NICE. 2014. Developing NICE guidelines: The manual (online, updated 2018). National Institute for Clinical Excellence. https://www.nice.org.uk/process/pmg20/chapter/introduction-and-overview
352 National Institute for Clinical Excellence. No date. History of NICE (web page). https://www.nice.org.uk/about/who-we-are/history-of-nice
353 Scottish Intercollegiate Guidelines Network (SIGN). SIGN 50: a guideline developer’s handbook. Edinburgh: SIGN; 2015. (SIGN publication no. 50). [November 2015]. Available from URL: http://www.sign.ac.uk
354 ibid
355 Canadian Agency for Drugs and Technologies in Health. 2017. Guidelines for the Economic Evaluation of Health Technologies: Canada (4th edition). https://www.cadth.ca/about-cadth/how-we-do-it/methods-and-guidelines/guidelines-for-the-economic-evaluation-of-health-technologies-canada

INTERIM REPORT | PŪRONGO MŌ TĒNEI WĀ
PAGE | 297
356 JF O’Mahony. 2019. Beneluxa: What are the prospects for collective bargaining on pharmaceutical prices given diverse health technology assessment processes? PharmacoEconomics 37(5): 627–630. https://link.springer.com/article/10.1007/s40273-019-00781-w
357 Discussion with Ministry officials
358 Ministry of Health. 2008. Long-term system framework. Visioning workshops: Summary report (draft working paper).
359 Ministry of Health. 2008. Long term system framework (internal Executive Leadership Team paper).
360 The future of healthcare. The Economist. https://thefutureishere.economist.com/healthcare/
361 A digital revolution in health care is speeding up. 2017. The Economist (2 January). https://www.economist.com/business/2017/03/02/a-digital-revolution-in-health-care-is-speeding-up
362 The King’s Fund. 2015. The Future is Now: The Innovations of today that point to better health care tomorrow. London: The King’s Fund. https://www.kingsfund.org.uk/reports/thefutureisnow/
363 The King’s Fund. 2015. The Future is Now: The Innovations of today that point to better health care tomorrow. London: The King’s Fund. https://www.kingsfund.org.uk/reports/thefutureisnow/
364 R Guilford-Blake, 2019. Are virtual hospitals the healthcare centers of the future? Practice Management (7 January).
365 Deloitte Development LLC. 2017. The Hospital of the Future: How digital technologies can change hospitals globally. Deloitte Development LLC. https://www2.deloitte.com/content/dam/Deloitte/global/Documents/Life-Sciences-Health-Care/us-lshc-hospital-of-the-future.pdf
366 Deloitte Development LLC. 2017. The Hospital of the Future: How digital technologies can change hospitals globally. Deloitte Development LLC. https://www2.deloitte.com/content/dam/Deloitte/global/Documents/Life-Sciences-Health-Care/us-lshc-hospital-of-the-future.pdf
367 P Rajpurkar, Irvin, J, Zhu K, Yang, B, Mehta, H et al. CheXNet: Radiologist-level pneumonia detection on chest x-rays with deep learning. ArXiv Preprint https://arxiv.org/abs/1711.05225
368 A Esteva, Kuprel, B, Novoa, RA, Ko, J, Swetter, SM, et al. 2017. Dermatologist-level classification of skin cancer with deep neural networks. Nature 542:115–118. https://www.nature.com/articles/nature21056
369 Hwang, E. J., Park, S., Jin, K. N., Im Kim, J., Choi, S. Y., Lee, J. H., ... & Ferretti, G. R. (2019). Development and Validation of a Deep Learning–Based Automated Detection Algorithm for Major Thoracic Diseases on Chest Radiographs. JAMA network open, 2(3), e191095-e191095.
370 UK-RAS Network. 2016. Surgical Robotics: The next 25 years – successes, challenges, and the road ahead (UK-RAS white papers). https://www.ukras.org/wp-content/uploads/2018/10/UK_RAS_WP_SR25yr_web.pdf
371 The Future is Now: The Innovations of today that point to better health care tomorrow. The Kings Fund. Undated. https://www.kingsfund.org.uk/reports/thefutureisnow/
372 Future Hospital Commission. 2013. Future Hospital: Caring for medical patients. London: Future Hospital Commission.
373 SC Davies. 2018. Annual Report of the Chief Medical Officer 2018. Health 2040 – Better Health Within Reach. Department of Health and Social Care. https://assets.publishing.service.gov.uk/government/uploads/system/uploads/attachment_data/file/767549/Annual_report_of_the_Chief_Medical_Officer_2018_-_health_2040_-_better_health_within_reach.pdf
374 N Timmins and Ham, C. 2013. The Quest for Integrated Health and Social Care: A case study in Canterbury, New Zealand. London: The King’s Fund. https://www.cdhb.health.nz/about-us/key-projects-and-initiatives/international-report-encourages-health-systems-to-learn-from-canterbury-dhb/
NEW ZEALAND HEALTH AND DISABILITY SYSTEM REVIEW | HAUORA MANAAKI KI AOTEAROA WHĀNUI
PAGE | 298
375 Sapere Research Group. 2018. Transforming our Health Services: Clinical services plan – the next ten years. Prepared for the Hawke’s Bay District Health Board. http://www.ourhealthhb.nz/news-and-events/clinical-services-plan-transforming-our-health-services/ (accessed 5 June 2019).
376 Ministry of Health Acute Readmission Report for DHBs to September 2018.
377 D Moore, Blick, G, with Leggott, J, and Bloodworth, K. 2013. Assessment of the implementation of the Productive Ward and Productive Operating Theatre programmes in New Zealand. Report to the Health Quality & Safety Commission and the Ministry of Health.
378 NHS. No date. Rapid Improvement Guide to: Red and green bed days. https://www.england.nhs.uk/south/wp-content/uploads/sites/6/2016/12/rig-red-green-bed-days.pdf
379 Council of Medical Colleges in New Zealand. 2013. Medical Generalist/Specialist Roles and Postgraduate Training for New Zealand: Does New Zealand need more generalists? https://cmc.org.nz/media/36817/2013_03_05_generalist_specialist_full_paper.pdf
380 Council of Medical Colleges in New Zealand. 2013. Medical Generalist/Specialist Roles and Postgraduate Training for New Zealand: Does New Zealand need more generalists? https://cmc.org.nz/media/36817/2013_03_05_generalist_specialist_full_paper.pdf
381 Council of Medical Colleges in New Zealand. 2013. Medical Generalist/Specialist Roles and Postgraduate Training for New Zealand: Does New Zealand need more generalists? Sapere Research Group http://srgexpert.com/wp-content/uploads/2018/02/Assessment-of-the-Productive-Ward-and-Productive-Operating-Theatre-programmes-26-Feb.pdf Council of Medical Colleges in New Zealand, p 7. https://cmc.org.nz/media/36817/2013_03_05_generalist_specialist_full_paper.pdf
382 T Love, Rippon, R, and Davies, P. 2018. Emerging Impacts of the 2017 Resident Doctors’ Multi-Employer Collective Agreement. Report prepared for Auckland, Canterbury, Capital & Coast, Counties Manukau, Waikato and Waitemata District Health Boards. Wellington: Sapere Research Group. https://assets.documentcloud.org/documents/4814982/RMO-MECA-Impact-Final-Report.pdf
383 K Brown. 2018. 300 more junior doctors likely needed due to new hospital rosters. Radio New Zealand (3 September). https://www.rnz.co.nz/news/national/365521/300-more-junior-doctors-likely-needed-due-to-new-hospital-rosters
384 M Britnell. 2019. Human: Solving the global workforce crisis in healthcare. Oxford University Press, p 165.
385 Topol Review. 2019. Preparing the Health Care Workforce to Deliver the Digital Future: An independent report on behalf of the Secretary of State for Health and Social Care. Health Education England, p 10. https://topol.hee.nhs.uk/
386 One composite industry covering professional, scientific, technical, administrative, and support services is larger. Data is based on the 2013 census ‘health care and social assistance’ industry, less 6% to account for the part of the industry that is not health related, such as early childhood carers.
387 OECD. 2018. OECD.Stat: Health workforce migration. https://stats.oecd.org/Index.aspx?DataSetCode=HEALTH_WFMI
388 J Beech, Bottery, S, Charlesworth, A, Evans, H, Gershlick, B, et al. 2019. Closing the Gap: Key areas for action on the health and care workforce. London: The Health Foundation, Nuffield Trust, and The King's Fund, p 2. https://www.nuffieldtrust.org.uk/research/closing-the-gap-key-areas-for-action-on-the-health-and-care-workforce
389 The Code of Health and Disability Services Consumers’ Rights is set out in the Health and Disability Commissioner (Code of Health and Disability Services Consumers’ Rights) Regulations 1996, which are regulations made under the Health and Disability Commissioner Act 1994.
390 Ministry of Health. 2018. About Health Workforce (web page). https://www.health.govt.nz/our-work/health-workforce/about-health-workforce
391 Ministry of Health. 2018. About Health Workforce (web page). https://www.health.govt.nz/our-work/health-workforce/about-health-workforce
INTERIM REPORT | PŪRONGO MŌ TĒNEI WĀ
PAGE | 299
392 Ministry of Health. 2018. Education and training (web page). https://www.health.govt.nz/our-work/health-workforce/education-and-training
393 Choosing Wisely New Zealand is “health professional led, patient focussed, and here to promote quality care, through better decisions. It is multi professional – engaging doctors, nurses, pharmacists, midwives and other health professional groups – as part of an international community of Choosing Wisely initiatives taking place around the world”: Choose Wisely website: https://choosingwisely.org.nz/
394 Ministry of Health and Education Counts website: https;//educationcounts.govt.nz
395 Ministry of Health. 2017. Post-entry funding model: Submissions and updates (web page). https://www.health.govt.nz/our-work/health-workforce/investment-and-purchasing/investing-new-zealands-future-health-workforce/post-entry-funding-model-submissions-and-updates#
396 M Britnell. 2019. Human: Solving the global workforce crisis in healthcare. Oxford University Press, p 80.
397 Nationwide Service Framework Library. 2019. Operational Policy Framework (web page). https://nsfl.health.govt.nz/accountability/operational-policy-framework-0
398 State Services Commission. 2018. Government Expectations for Pay and Employment Conditions in the State Sector. Wellington: State Services Commission. http://www.ssc.govt.nz/govt-expectations-pay-employment
399 Ministry of Health. Kōrero Mārama: Health Literacy and Māori – Results from the 2006 Adult Literacy and Life Skills Survey. Wellington: Ministry of Health. https://www.health.govt.nz/system/files/documents/publications/korero-marama.pdf
400 TAS. 2019. District Health Board Employed Workforce Quarterly Report: 1 January to 31 March 2019. Central Region’s Technical Advisory Services. https://tas.health.nz/assets/Workforce/DHB-Employed-Workforce-Quarterly-Report-March-2019.pdf
401 TAS. 2019. District Health Board Employed Workforce Quarterly Report: 1 January to 31 March 2019. Central Region’s Technical Advisory Services. https://tas.health.nz/assets/Workforce/DHB-Employed-Workforce-Quarterly-Report-March-2019.pdf
402 Ministry of Health. 2014. ’Ala Mo’ui: Pathways to Pacific Health and Wellbeing 2014–2018. Wellington: Ministry of Health, p 8. https://www.health.govt.nz/system/files/documents/publications/ala-moui-pathways-to-pacific-health-and-wellbeing-2014-2018-jun14-v2.pdf
403 Ministry of Health. 2014. ’Ala Mo’ui: Pathways to Pacific Health and Wellbeing 2014–2018. Wellington: Ministry of Health, p 9. https://www.health.govt.nz/system/files/documents/publications/ala-moui-pathways-to-pacific-health-and-wellbeing-2014-2018-jun14-v2.pdf
404 Statistics New Zealand. 2017. Ethnic populations projected to grow across New Zealand (web page). https://www.stats.govt.nz/news/ethnic-populations-projected-to-grow-across-new-zealand
405 Statistics New Zealand. 2015. Major ethnic groups in New Zealand (web page). https://www.stats.govt.nz/infographics/major-ethnic-groups-in-new-zealand
406 E Curtis, Wikaire, E, Stokes, K, and Reid, P. Addressing indigenous health workforce inequities: A literature review exploring ‘best’ practice for recruitment into tertiary health programmes. International Journal for Equity in Health 11, article number: 13. https://equityhealthj.biomedcentral.com/articles/10.1186/1475-9276-11-13
407 See the WhyOra website: http://www.whyora.co.nz/
408 Ministry of Health and Le Va. 2013. Taeao o Tautai: Pacific Public Health Workforce Development Implementation Plan 2012–2017. Auckland: Le Va, p 5. https://www.health.govt.nz/publication/taeao-o-tautai-pacific-public-health-workforce-development-implementation-plan-2012-2017
409 Ministry of Health. 2019. He Korowai Oranga: National Māori Health Strategy. https://www.health.govt.nz/our-work/populations/maori-health/he-korowai-oranga
410 See https://ngamanukura.nz/

NEW ZEALAND HEALTH AND DISABILITY SYSTEM REVIEW | HAUORA MANAAKI KI AOTEAROA WHĀNUI
PAGE | 300
411 Waitangi Tribunal. 2019. Health Services and Outcomes Kaupapa Inquiry – Wai 2575. (web page). https://www.waitangitribunal.govt.nz/inquiries/kaupapa-inquiries/health-services-and-outcomes-inquiry/
412 Minister for Disability Issues. 2016. New Zealand Disability Strategy 2016–2026. Wellington: Ministry of Social Development. https://www.odi.govt.nz/nz-disability-strategy/
413 Office for Disability Issues. 2016. Outcome 2: Employment and economic security (web page). https://www.odi.govt.nz/nz-disability-strategy/employment-and-economic-security/#accordion-153-heading
414 Te Pou. 2013. The Employment of Disabled People in Disability Support Services: Research report. Auckland: Te Pou o Te Whakaaro Nui / the National Centre of Mental Health Research, Information and Workforce Development. https://www.tepou.co.nz/uploads/files/resource-assets/the-employment-of-disabled-people-in-disability-support-services.pdf
415 Health Workforce New Zealand. 2015. Health of the Health Workforce 2015. Wellington: Ministry of Health.
416 Statistics New Zealand. (2017). Subnational Population Projections: 2013(base)–2043 update. Wellington. Statistics New Zealand. Retrieved from: http://archive.stats.govt.nz/browse_for_stats/population/estimates_and_projections/SubnationalPopulationProjections_HOTP2013base-2043/Commentary.aspx
417 South Island Alliance. 2017. Shaping our South Island Allied Health workforce: The Calderdale Framework in Action (one-pager). https://www.sialliance.health.nz/UserFiles/SouthIslandAlliance/File/PDFs/SIRTH/Shaping%20our%20South%20Island%20Allied%20Health%20workforce-Calderdale%20Framework-final-Oct-2017-white.pdf
418 Ministry of Health. 2012. Guidance for Implementing High-Quality Multidisciplinary Meetings: Achieving best practice cancer care. Wellington: Ministry of Health. https://www.health.govt.nz/publication/guidance-implementing-high-quality-multidisciplinary-meetings
419 M Britnell. 2019. Human: Solving the global workforce crisis in healthcare. Oxford University Press, chapter 2.
420 WHO. 2015. Health Workforce 2030: Towards a global strategy on human resources for health. Geneva: World Health Organization, p 14. https://www.who.int/hrh/documents/15-295Strategy_Report-04_24_2015.pdf
421 Organisation submission.
422 Minister of Health. 2016. New Zealand Health Strategy: Future direction. Wellington: Ministry of Health. Wellington: Ministry of Health, p 30. https://www.health.govt.nz/publication/new-zealand-health-strategy-2016
423 Nuka is an Alaska Native word meaning strong, giant structures and living things. Case study information from visit to Nuka.
424 St John. No date. Volunteering (web page). https://join.stjohn.org.nz/volunteer-jobs
425 H Gilburt. 2019. Volunteering in Ambulance Services: Developing and diversifying opportunities. London: The King’s Fund. https://www.kingsfund.org.uk/sites/default/files/2019-05/volunteering-ambulance-services-may2019.pdf
426 The Privacy Commissioner issued the Health Information Privacy Code 1994 under section 46 of the Privacy Act 1993. The code is available from the Privacy Commissioner’s website: https://www.privacy.org.nz/the-privacy-act-and-codes/codes-of-practice/health-information-privacy-code-1994/
427 Advice from privacy legal advisors at Claro Law and Vida Law
428 Health Information Privacy Code 1994, rule 11(2)(d).
429 D Cormack and McLeod, M. 2010. Improving and Maintaining Quality in Ethnicity Data Collections in the Health and Disability Sector. Wellington: Te Rōpū Rangahau Hauora a Eru Pōmare. https://www.health.govt.nz/publication/improving-and-maintaining-quality-ethnicity-data-collections-health-and-disability-sector
430 Te Mana Raraunga / Māori Data Sovereignty Network. 2018. Principles of Māori Data Sovereignty (Brief 1). https://www.temanararaunga.maori.nz/new-page-2

INTERIM REPORT | PŪRONGO MŌ TĒNEI WĀ
PAGE | 301
431 M Davis. 2016. Data and the United Nations Declaration on the Rights of Indigenous Peoples. In: T Kukutai and J Taylor (eds). Indigenous Data Sovereignty: Toward an agenda (chapter 2). Canberra: ANU Press.
432 M Hudson. 2019. Māori data sovereignty: Implications for democracy and social justice. Presentation at Ethics in Research: Governance, democracy and social justice, Wellington School of Medicine, 15 February. https://www.otago.ac.nz/wellington/otago706724.pdf
433 Te Mana Raraunga / Māori Data Sovereignty Network. 2018. Principles of Māori Data Sovereignty (Brief 1). https://www.temanararaunga.maori.nz/new-page-2
434 NZHIT. April 2019. Overview of the software applications landscape across New Zealand’s health system prepared for the NZ Health & Disability Sector Review Panel. Report commissioned by the New Zealand Health and Disability System Review, p 4.
435 Ministry of Health. 2018. DHB core digital services as at 1 October 2018. https://www.health.govt.nz/system/files/documents/pages/dhb-core-digital-services-oct2018.pdf
436 https://www.nsu.govt.nz/health-professionals/national-cervical-screening-programme/hpv-primary-screening
437 See the South Island Alliance web site: https://www.sialliance.health.nz/our-priorities/information-services/health-connect-south-/
438 See the HealthOne website: https://healthone.org.nz/home/about-healthone
439 NZHIT. April 2019. Overview of the software applications landscape across New Zealand’s health system prepared for the NZ Health & Disability Sector Review Panel. Report commissioned by the New Zealand Health and Disability System Review, p 15.
440 J Kaipio, Lääveri, T, Hyppönen, H, Vainiomäki, S, Reponen, J, et al. 2017. Usability problems do not heal by themselves: National survey on physicians’ experiences with EHRs in Finland (2017). International Journal of Infomatics 97: 266–281. https://www.sciencedirect.com/science/article/pii/S1386505616302258
441 A Allen. 2019. Lost in translation: Epic goes to Denmark. Politico (6 June). https://www.politico.com/story/2019/06/06/epic-denmark-health-1510223
442 A Gawande. 2018. Why doctors hate their computers. New Yorker (12 November). https://www.newyorker.com/magazine/2018/11/12/why-doctors-hate-their-computers
443 E Fry and Schulte, F. 2019. Death by a thousand clicks: Where electronic health records went wrong. Fortune (18 March). https://fortune.com/longform/medical-records/
444 Office of the National Coordinator for Health Information Technology (website). No date. Notice of Proposed Rulemaking to Improve the Interoperability of Health Information. https://www.healthit.gov/topic/laws-regulation-and-policy/notice-proposed-rulemaking-improve-interoperability-health
445 NHS England (website). No date. HNS Digital, data and technology standards. https://digital.nhs.uk/about-nhs-digital/our-work/nhs-digital-data-and-technology-standards
446 UK Government (website). NHSX: new joint organisation for digital, data and technology. 19 February 2019. https://www.gov.uk/government/news/nhsx-new-joint-organisation-for-digital-data-and-technology
447 Health Tech Newspaper (website). HNSX to mandate health tech standards. 4 April, 2019. http://www.thehtn.co.uk/2019/04/04/nhsx-to-mandate-health-tech-standards/
448 CERT NZ. Quarterly reports (web page). https://www.cert.govt.nz/about/quarterly-report/
449 C Dreaver. 2018. WannaCry ransomware attack on UK hospitals reveal security gaps in NZ. Radio New Zealand (20 July). https://www.rnz.co.nz/news/national/362206/wannacry-ransomware-attack-on-uk-hospitals-reveal-security-gaps-in-nz
450 L Kish. 2015. 8 takeaways from Topol’s latest: ‘The patient Will see you now: The future of medicine is in your hands’. Health Standards (28 January). https://healthstandards.com/blog/2015/01/28/future-of-medicine-is-in-your-hands/

NEW ZEALAND HEALTH AND DISABILITY SYSTEM REVIEW | HAUORA MANAAKI KI AOTEAROA WHĀNUI
PAGE | 302
451 See The People’s Project web site: https://www.thepeoplesproject.org.nz/
452 WAVE Advisory Board. 2001. From Strategy to Reality: The WAVE Project – Health Information Management and Technology Plan. Report to the Director-General of Health. Wellington: Working to Add Value through E-information Advisory Board.
453 Health Information Strategy Steering Committee. 2005. Health Information Strategy for New Zealand 2005. Wellington: Ministry of Health. https://www.health.govt.nz/publication/health-information-strategy-new-zealand-2005
454 National Health IT Board. 2010. National Health IT Plan. Wellington: Ministry of Health. https://www.health.govt.nz/publication/national-health-it-plan
455 Ministry of Health. 2017. Digital Health 2020 (web page). https://www.health.govt.nz/our-work/digital-health/digital-health-2020
456 Secretary of State for Healthcare (M Hancock) UK. 2018. Ministerial foreword. In: Department for Digital, Culture, Media & Sport. Consultation Outcome: Centre for Data Ethics and Innovation consultation. https://www.gov.uk/government/consultations/consultation-on-the-centre-for-data-ethics-and-innovation/centre-for-data-ethics-and-innovation-consultation
457 NZHIT. April 2019. Overview of the software applications landscape across New Zealand’s health system prepared for the NZ Health & Disability Sector Review Panel. Report commissioned by the New Zealand Health and Disability System Review, p 8.
458 Khalid Kark, Anjali Shaikh, Caroline Brown. Deloitte Insights (website). No date. Technology budgets: From value preservation to value creation. https://www2.deloitte.com/insights/us/en/focus/cio-insider-business-insights/technology-investments-value-creation.html
459 NHS England. No date. NHS Digital Academy (web page). https://www.england.nhs.uk/digitaltechnology/nhs-digital-academy/
460 W Edwards Demin. The Deming Institute (website). https://quotes.deming.org/
461 New Zealand Public Health and Disability Act 2000, section 11.
462 Ministerial Review Group. 2009. Annex 3: Terms of Reference: Infrastructure capacity and planning. In: Meeting the Challenge: Enhancing sustainability and the patient and consumer experience within the current legislative framework for health and disability services in New Zealand. Wellington: Ministerial Review Group, p 4. https://www.beehive.govt.nz/release/ministerial-review-group-report-released
463 Capital Investment Committee. 2011. Capital Assessment Guidelines. Wellington: Ministry of Health, p 5. https://www.health.govt.nz/new-zealand-health-system/key-health-sector-organisations-and-people/capital-investment-committee
464 Discussion with Ministry of Health officials
465 Office of the Auditor General. 2016. District Health Boards’ Response to Asset Management Requirements since 2009. Wellington: Office of the Auditor General. https://www.oag.govt.nz/2016/dhbs-assets/docs/dhbs-assets.pdf
466 Office of the Auditor General. 2018. Health Sector: Results of the 2016/17 audits. Wellington: Office of the Auditor General. https://www.oag.govt.nz/2018/health-sector-audits/docs/health-sector-audits.pdf
467 The Treasury. 2017. District Health Board Financial Performance to 2016 and 2017 Plans. Wellington: The Treasury, p 5. https://treasury.govt.nz/sites/default/files/2017-05/dhb-performance-feb17.pdf
468 Office of the Auditor General. 2016. District Health Boards’ Response to Asset Management Requirements since 2009. Wellington: Office of the Auditor General, p 4. https://www.oag.govt.nz/2016/dhbs-assets/docs/dhbs-assets.pdf