Embed Size (px)
Citation preview

��������������� �����������������
���������������� �������������� ��������������
��������������������������������������������������������������������������������������������������������������������
DOT HS 808 977 July 1999
An Experimental Examination of Selected Maneuvers That May Induce On-Road Untripped, Light Vehicle Rollover -Phase II of NHTSA’s 1997-1998 Vehicle Rollover Research Program
������������������������������������������������������������������������������������������������������������������������ ����������������������������������������������������������������������������������������������������������������������

Technical Report Documentation Page 1. eport No.
DOT HS 808 977 2. Government Accession No. 3. Recipients’s Catalog No.
4. Title and Subtitle
An Experimental Examination of Selected Maneuvers That May Induce On-Road Untripped, Light Vehicle Rollover -Phase II of NHTSA’s 1997-1998 Vehicle Rollover Research Program
5. eport Date
July 1999
6. rforming Organization Code
NHTSA/NRD-22
7. uthor(s)
W. Riley Garrott, J. Gavin Howe, and Garrick Forkenbrock 8. rforming Organization Report No.
9. rforming Organization Name and Address
National Highway Traffic Safety Administration Vehicle Research and Test Center P.O. Box 37 East Liberty, OH
10. rk Unit No. (TRAIS)n code
11. ontract of Grant No.
12. nsoring Agency Name and Address
National Highway Traffic Safety Administration 400 Seventh Street, S.W. Washington, DC 20590
13. ype of Report and Period Covered
Final -June, 1998 -January, 1999
14. nsoring Agency Code
NHTSA/NRD-22
15. ementary Notes
R
R
Pe
A Pe
Pe
43319
Wo
C
Spo T
Spo
Suppl
16. bstract
This report documents the results of testing potential maneuvers to measure on-road, untripped, rollover propensity. elve test vehicles, covering a wide range of vehicle types and classes were used. Three vehicles from each of the following categories were tested: senger cars, light trucks, vans, and sport utility vehicles.
The vehicles were tested with candidate vehicle characterization and untripped rollover propensity maneuvers. The vehicle characterization maneuvers were designed to determine fundamental vehicle handling properties while the untripped rollover propensity maneuvers were designed to produce two-wheel lift for vehicles with relatively higher rollover propensity potential. ehicle characterization maneuvers were Pulse Steer, Sinusoidal Sweep, Slowly Increasing Steer, and Slowly Increasing Speed. ver propensity maneuvers were J-Turn, J-Turn with Pulse Braking, Fishhook #1 and onant Steer.
The degree of lift produced for each vehicle/maneuver/steer direction combination was given a score based on whether the lift was minor, moderate, or major. o lift was given a zero score. The individual vehicle/maneuver/steer direction scores were combined to produce two ratings: teering Maneuver Score and Pulse Braking Score. teering Maneuver Score was based on J-Turn, Fishhook #1, and Fishhook #2 results and the Pulse Braking Score was based on J-Turn with Pulse Braking results.
The Steering Maneuver Scores were found to be related to the vehicle static and dynamic rollover stability metrics. ulse Braking Score was related more to whether or not the vehicle had 4-wheel anti-lock brakes (4WAL) or not. or those vehicles that did not have 4WAL, the Pulse Braking score did relate to static and dynamic rollover stability metrics.
The Lateral Acceleration at Rollover was also determined for each vehicle and was not found to be related to either the static or dynamic rollover stability metrics.
17. ey Words
On-Road, Untripped Rollover Propensity Static Stability Factor, Tilt Table Ratio, Critical Sliding Velocity, and Lateral Acceleration at Rollover
18. stribution Statement
Document is available to the public through the National Technical Information Service, Springfield, VA
19. Security Classif. (of this report)
Unclassified 20. Security Classif. (of this page)
Unclassified 21. of Pages
130 22. ce
A
Tw
pas
The vThe rollo
#2, and Res
NS The S
The PF
K Di
22161
No Pri
Form DOT F1700.7 (8-72) Reproduction of completed page authorized
i
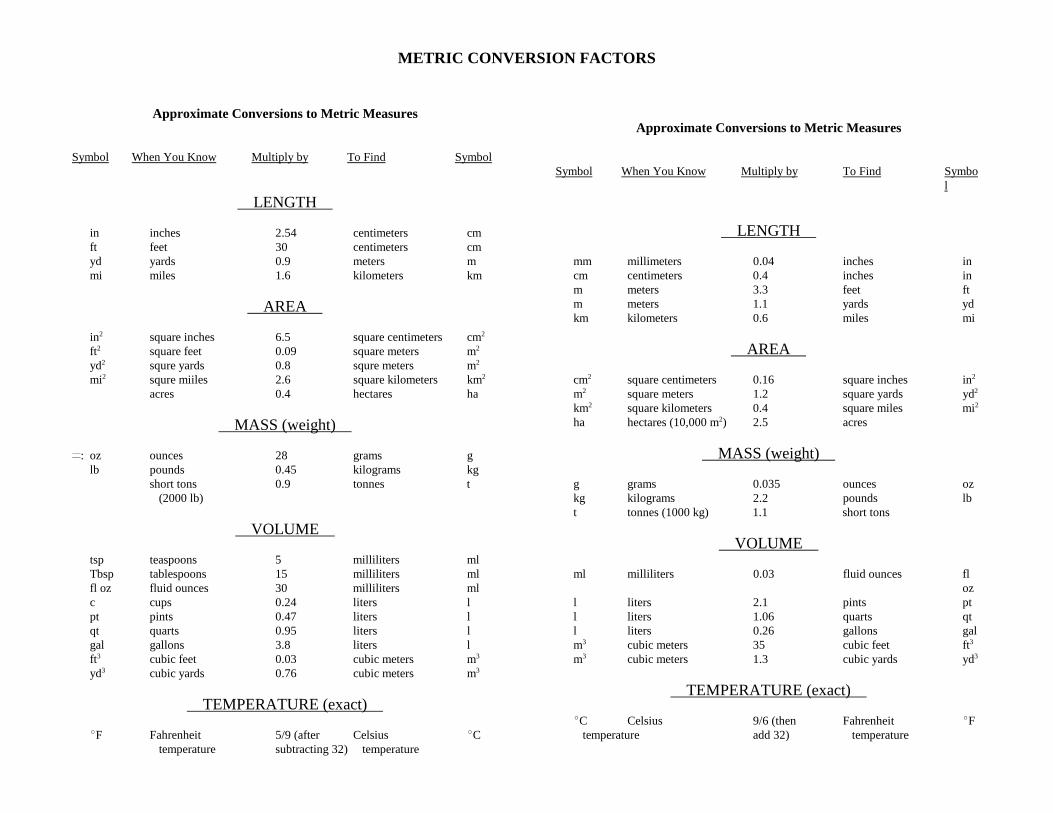
METRIC CONVERSION FACTORS
Approximate Conversions to Metric Measures
Symbol When You Know Multiply by To Find Symbol
LENGTH
in inches 2.54 centimeters cm ft feet 30 centimeters cm yd yards 0.9 meters m mi miles 1.6 kilometers km
AREA
in2 square inches 6.5 square centimeters cm2
ft2 square feet 0.09 square meters m2
yd2 squre yards 0.8 squre meters m2
mi2 squre miiles 2.6 square kilometers km2
acres 0.4 hectares ha
MASS (weight)
Þ: oz ounces 28 grams g lb pounds 0.45 kilograms kg
short tons 0.9 tonnes t (2000 lb)
VOLUME
tsp teaspoons 5 milliliters ml Tbsp tablespoons 15 milliliters ml fl oz fluid ounces 30 milliliters ml
cups 0.24 liters l pt pints 0.47 liters l qt quarts 0.95 liters l gal gallons 3.8 liters l ft3 cubic feet 0.03 cubic meters m3
yd3 cubic yards 0.76 cubic meters m3
TEMPERATURE (exact)
EF Fahrenheit 5/9 (after Celsius EC temperature subtracting 32) temperature
Approximate Conversions to Metric Measures
Symbol When You Know Multiply by To Find Symbo l
LENGTH
mm millimeters 0.04 inches in cm centimeters 0.4 inches in m meters 3.3 feet ft m meters 1.1 yards yd km kilometers 0.6 miles mi
AREA
cm2 square centimeters 0.16 square inches in2
m2 square meters 1.2 square yards yd2
km2 square kilometers 0.4 square miles mi2
ha hectares (10,000 m2) 2.5 acres
MASS (weight)
g grams 0.035 ounces oz kg kilograms 2.2 pounds lb t tonnes (1000 kg) 1.1 short tons
VOLUME
ml milliliters 0.03 fluid ounces fl oz
l liters 2.1 pints pt l liters 1.06 quarts qt l liters 0.26 gallons gal m3 cubic meters 35 cubic feet ft3
m3 cubic meters 1.3 cubic yards yd3
TEMPERATURE (exact)
EC Celsius 9/6 (then Fahrenheit EF temperature add 32) temperature
c
DISCLAIMER
This document has been prepared under the sponsorship of the United States Department of Transportation, National Highway Traffic Safety Administration. The opinions, findings, and conclusions expressed in this publication are those of the authors and not necessarily those of the Department of Transportation or the National Highway Traffic Safety Administration. The United States Government assumes no liability for its contents or use thereof. When trade or manufacturers’ names or products are mentioned, it is only because they are considered essential to the object of the document and should not be construed as an endorsement. The United States Government does not endorse products or manufacturers.
����
TABLE OF CONTENTS
TECHNICAL REPORT DOCUMENTATION PAGE . . . . . . . . . . . . . . . . . . . . . . . . . . . . i
METRIC CONVERSION FACTORS . . . . . . . . . . . . . . . . . . . . . . . . . . . . . . . . . . . . . . . ii
DISCLAIMER . . . . . . . . . . . . . . . . . . . . . . . . . . . . . . . . . . . . . . . . . . . . . . . . . . . . . . . . iii
TABLE OF CONTENTS . . . . . . . . . . . . . . . . . . . . . . . . . . . . . . . . . . . . . . . . . . . . . . . . iv
LIST OF FIGURES . . . . . . . . . . . . . . . . . . . . . . . . . . . . . . . . . . . . . . . . . . . . . . . . . . . . vi
LIST OF TABLES . . . . . . . . . . . . . . . . . . . . . . . . . . . . . . . . . . . . . . . . . . . . . . . . . . . . . ix
ACKNOWLEDGMENTS . . . . . . . . . . . . . . . . . . . . . . . . . . . . . . . . . . . . . . . . . . . . . . . . x
TECHNICAL SUMMARY . . . . . . . . . . . . . . . . . . . . . . . . . . . . . . . . . . . . . . . . . . . . . . . xi
1.0 INTRODUCTION . . . . . . . . . . . . . . . . . . . . . . . . . . . . . . . . . . . . . . . . . . . . . . . 1 1.1 Relationship to Previous Phases of Research . . . . . . . . . . . . . . . . . . . . 1 1.2 Focus of This Study . . . . . . . . . . . . . . . . . . . . . . . . . . . . . . . . . . . . . . . . . 1 1.3 Overview of This report . . . . . . . . . . . . . . . . . . . . . . . . . . . . . . . . . . . . . 2
2.0 STUDY OBJECTIVES . . . . . . . . . . . . . . . . . . . . . . . . . . . . . . . . . . . . . . . . . 3 3.0 TEST VEHICLES . . . . . . . . . . . . . . . . . . . . . . . . . . . . . . . . . . . . . . . . . . . . . . . . 5
3.1 Vehicles Selected . . . . . . . . . . . . . . . . . . . . . . . . . . . . . . . . . . . . . . . . . . . 5 3.2 Static and Dynamic Rollover Metric Values . . . . . . . . . . . . . . . . . . . . . . 7
4.0 VEHICLE INSTRUMENTATION . . . . . . . . . . . . . . . . . . . . . . . . . . . . . . . . . . . 10
4.1 Sensors and Locations . . . . . . . . . . . . . . . . . . . . . . . . . . . . . . . . . . . . . . 10 4.2 Programmable Steering Machine . . . . . . . . . . . . . . . . . . . . . . . . . . . . . 12 4.3 Data Acquisition and Auxiliary Equipment . . . . . . . . . . . . . . . . . . . . . . 12
5.0 TEST MANEUVERS . . . . . . . . . . . . . . . . . . . . . . . . . . . . . . . . . . . . . . . . . . . . 14 5.1 Phase II Test Matrix . . . . . . . . . . . . . . . . . . . . . . . . . . . . . . . . . . . . . . . . . 14 5.2 Test Procedures for the Vehicle Characterization Maneuvers . . . . . 15 5.3 Results from the Vehicle Characterization Tests . . . . . . . . . . . . . . . . . 19 5.4 Test Procedures for Untripped Rollover Propensity
Determination . . . . . . . . . . . . . . . . . . . . . . . . . . . . . . . . . . . . . . . . . . . . . 20 5.5 Test Termination Conditions . . . . . . . . . . . . . . . . . . . . . . . . . . . . . . . . . 29
6.0 REPEATABILITY OF THE TESTING . . . . . . . . . . . . . . . . . . . . . . . . . . . . . . . 30
6.1 Repeatability of Test Inputs . . . . . . . . . . . . . . . . . . . . . . . . . . . . . . . . . 30
iv

6.2 Repeatability of Test Outputs . . . . . . . . . . . . . . . . . . . . . . . . . . . . . . 36
7.0 RESULTS FROM THE UNTRIPPED ROLLOVER PROPENSITY DETERMINATION MANEUVERS . . . . . . . . . . . . . . . . . . . . . . . . . . . . . . . . . 39 7.1 Categories of Two-Wheel Lift . . . . . . . . . . . . . . . . . . . . . . . . . . . . . . . 39 7.2 Summary of Untripped Rollover Propensity Testing Results . . . . 40 7.3 Summary of Lateral Acceleration at Rollover Results . . . . . . . . . . 49
8.0 MULTI-MANEUVER SUMMARIES AND ANALYSIS . . . . . . . . . . . . . . . . . . 51 8.1 Multi-Maneuver summary Results for Each Test Vehicle . . . . . . . 51 8.2 Multi-Vehicle Results for Maneuvers vs. Steering Direction . . . . . 79
9.0 DISCUSSION OF RESULTS . . . . . . . . . . . . . . . . . . . . . . . . . . . . . . . . . . . . 100
9.1 Relationship Between the Static, Dynamic, and On-Road, Untripped M easures of a Vehicle’s R ollov er Propensit y . . . . . . . 100�
9.2 Maneuv er Assessment . . . . . . . . . . . . . . . . . . . . . . . . . . . . . . . . . . . 109�9.2.1 J-Turn . . . . . . . . . . . . . . . . . . . . . . . . . . . . . . . . . . . . . . . . . . . 109�9.2.2 J-Turn with Pulse Braking . . . . . . . . . . . . . . . . . . . . . . . . . . . 109�9.2.3 Fishhook #1 . . . . . . . . . . . . . . . . . . . . . . . . . . . . . . . . . . . . . . 110�9.2.4 Fishhook #2 . . . . . . . . . . . . . . . . . . . . . . . . . . . . . . . . . . . . . . 112�9.2.5 Resonant Steer . . . . . . . . . . . . . . . . . . . . . . . . . . . . . . . . . . . . 114�
10.0 CONCLUSIONS . . . . . . . . . . . . . . . . . . . . . . . . . . . . . . . . . . . . . . . . . . . . . . 115�
REFERENCES . . . . . . . . . . . . . . . . . . . . . . . . . . . . . . . . . . . . . . . . . . . . . . . . . . . . . 117�
v
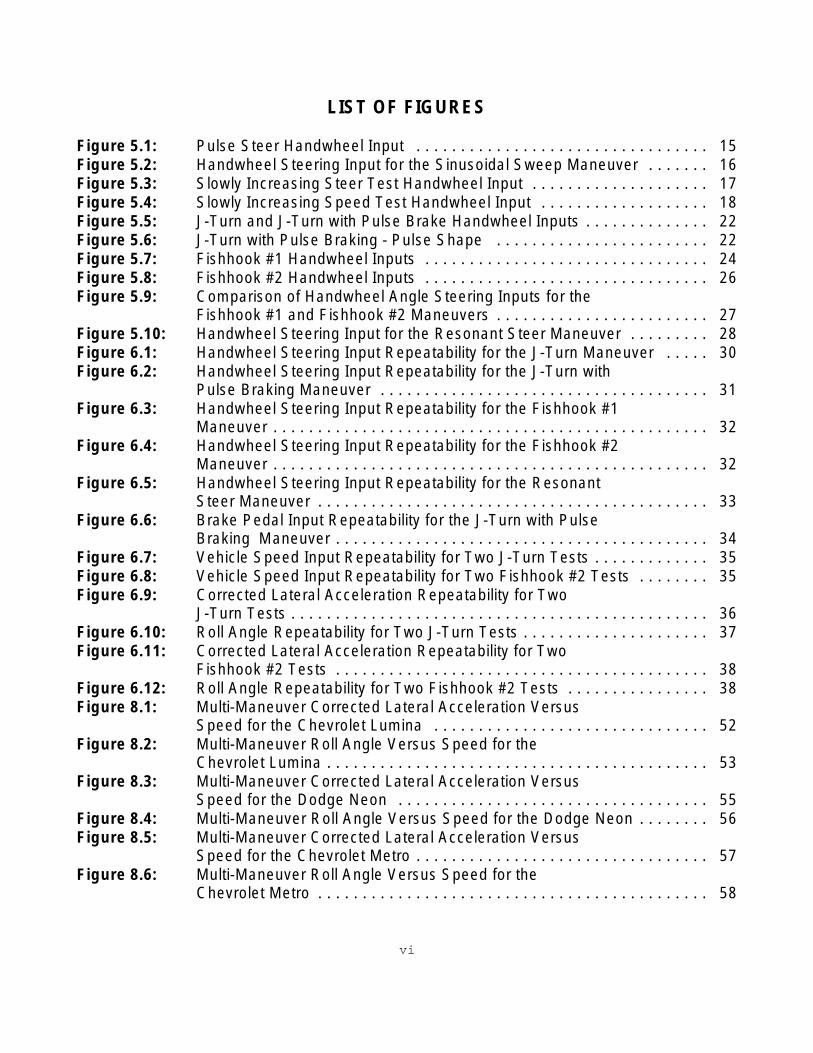
LIST OF FIGURES
Figure 5.1: Pulse Steer Handwheel Input . . . . . . . . . . . . . . . . . . . . . . . . . . . . . . . . . 15Figure 5.2: Handwheel Steering Input for the Sinusoidal Sweep Maneuver . . . . . . . 16Figure 5.3: Slowly Increasing Steer Test Handwheel Input . . . . . . . . . . . . . . . . . . . . 17Figure 5.4: Slowly Increasing Speed Test Handwheel Input . . . . . . . . . . . . . . . . . . . 18Figure 5.5: J-Turn and J-Turn with Pulse Brake Handwheel Inputs . . . . . . . . . . . . . . 22Figure 5.6: J-Turn with Pulse Braking - Pulse Shape . . . . . . . . . . . . . . . . . . . . . . . . 22Figure 5.7: Fishhook #1 Handwheel Inputs . . . . . . . . . . . . . . . . . . . . . . . . . . . . . . . . 24Figure 5.8: Fishhook #2 Handwheel Inputs . . . . . . . . . . . . . . . . . . . . . . . . . . . . . . . . 26Figure 5.9: Comparison of Handwheel Angle Steering Inputs for the
Fishhook #1 and Fishhook #2 Maneuvers . . . . . . . . . . . . . . . . . . . . . . . . 27Figure 5.10: Handwheel Steering Input for the Resonant Steer Maneuver . . . . . . . . . 28Figure 6.1: Handwheel Steering Input Repeatability for the J-Turn Maneuver . . . . . 30Figure 6.2: Handwheel Steering Input Repeatability for the J-Turn with
Pulse Braking Maneuver . . . . . . . . . . . . . . . . . . . . . . . . . . . . . . . . . . . . . 31Figure 6.3: Handwheel Steering Input Repeatability for the Fishhook #1
Maneuver . . . . . . . . . . . . . . . . . . . . . . . . . . . . . . . . . . . . . . . . . . . . . . . . . 32Figure 6.4: Handwheel Steering Input Repeatability for the Fishhook #2
Maneuver . . . . . . . . . . . . . . . . . . . . . . . . . . . . . . . . . . . . . . . . . . . . . . . . . 32Figure 6.5: Handwheel Steering Input Repeatability for the Resonant
Steer Maneuver . . . . . . . . . . . . . . . . . . . . . . . . . . . . . . . . . . . . . . . . . . . . 33Figure 6.6: Brake Pedal Input Repeatability for the J-Turn with Pulse
Braking Maneuver . . . . . . . . . . . . . . . . . . . . . . . . . . . . . . . . . . . . . . . . . . 34Figure 6.7: Vehicle Speed Input Repeatability for Two J-Turn Tests . . . . . . . . . . . . . 35Figure 6.8: Vehicle Speed Input Repeatability for Two Fishhook #2 Tests . . . . . . . . 35Figure 6.9: Corrected Lateral Acceleration Repeatability for Two
J-Turn Tests . . . . . . . . . . . . . . . . . . . . . . . . . . . . . . . . . . . . . . . . . . . . . . . 36Figure 6.10: Roll Angle Repeatability for Two J-Turn Tests . . . . . . . . . . . . . . . . . . . . . 37Figure 6.11: Corrected Lateral Acceleration Repeatability for Two
Fishhook #2 Tests . . . . . . . . . . . . . . . . . . . . . . . . . . . . . . . . . . . . . . . . . . 38Figure 6.12: Roll Angle Repeatability for Two Fishhook #2 Tests . . . . . . . . . . . . . . . . 38Figure 8.1: Multi-Maneuver Corrected Lateral Acceleration Versus
Speed for the Chevrolet Lumina . . . . . . . . . . . . . . . . . . . . . . . . . . . . . . . 52Figure 8.2: Multi-Maneuver Roll Angle Versus Speed for the
Chevrolet Lumina . . . . . . . . . . . . . . . . . . . . . . . . . . . . . . . . . . . . . . . . . . . 53Figure 8.3: Multi-Maneuver Corrected Lateral Acceleration Versus
Speed for the Dodge Neon . . . . . . . . . . . . . . . . . . . . . . . . . . . . . . . . . . . 55Figure 8.4: Multi-Maneuver Roll Angle Versus Speed for the Dodge Neon . . . . . . . . 56Figure 8.5: Multi-Maneuver Corrected Lateral Acceleration Versus
Speed for the Chevrolet Metro . . . . . . . . . . . . . . . . . . . . . . . . . . . . . . . . . 57Figure 8.6: Multi-Maneuver Roll Angle Versus Speed for the
Chevrolet Metro . . . . . . . . . . . . . . . . . . . . . . . . . . . . . . . . . . . . . . . . . . . . 58
vi

Figure 8.7: Multi-Maneuver Corrected Lateral Acceleration VersusSpeed for the Chevrolet C-1500 . . . . . . . . . . . . . . . . . . . . . . . . . . . . . . . 59
Figure 8.8: Multi-Maneuver Roll Angle Versus Speed for the ChevroletC-1500 . . . . . . . . . . . . . . . . . . . . . . . . . . . . . . . . . . . . . . . . . . . . . . . . . . . 60
Figure 8.9: Multi-Maneuver Corrected Lateral Acceleration VersusSpeed for the Chevrolet S-10 . . . . . . . . . . . . . . . . . . . . . . . . . . . . . . . . . 61
Figure 8.10: Multi-Maneuver Roll Angle Versus Speed for the ChevroletS-10 . . . . . . . . . . . . . . . . . . . . . . . . . . . . . . . . . . . . . . . . . . . . . . . . . . . . . 62
Figure 8.11: Multi-Maneuver Corrected Lateral Acceleration VersusSpeed for the Ford Ranger . . . . . . . . . . . . . . . . . . . . . . . . . . . . . . . . . . . 64
Figure 8.12: Multi-Maneuver Roll Angle Versus Speed for the Ford Ranger . . . . . . . . 65Figure 8.13: Multi-Maneuver Corrected Lateral Acceleration Versus
Speed for the Ford E-150 Club Wagon . . . . . . . . . . . . . . . . . . . . . . . . . . 66Figure 8.14: Multi-Maneuver Roll Angle Versus Speed for the Ford
E-150 Club Wagon . . . . . . . . . . . . . . . . . . . . . . . . . . . . . . . . . . . . . . . . . 67Figure 8.15: Multi-Maneuver Corrected Lateral Acceleration Versus
Speed for the Chevrolet Astro . . . . . . . . . . . . . . . . . . . . . . . . . . . . . . . . . 68Figure 8.16: Multi-Maneuver Roll Angle Versus Speed for the Chevrolet Astro . . . . . 69Figure 8.17: Multi-Maneuver Corrected Lateral Acceleration Versus
Speed for the Dodge Caravan . . . . . . . . . . . . . . . . . . . . . . . . . . . . . . . . . 70Figure 8.18: Multi-Maneuver Roll Angle Versus Speed for the Dodge Caravan . . . . . 71Figure 8.19: Multi-Maneuver Corrected Lateral Acceleration Versus
Speed for the Chevrolet Tahoe . . . . . . . . . . . . . . . . . . . . . . . . . . . . . . . . 72Figure 8.20: Multi-Maneuver Roll Angle Versus Speed for the Chevrolet Tahoe . . . . . 73Figure 8.21: Multi-Maneuver Corrected Lateral Acceleration Versus
Speed for the Ford Explorer . . . . . . . . . . . . . . . . . . . . . . . . . . . . . . . . . . 75Figure 8.22: Multi-Maneuver Roll Angle Versus Speed for the Ford Explorer . . . . . . . 76Figure 8.23: Multi-Maneuver Corrected Lateral Acceleration Versus
Speed for the Chevrolet Tracker . . . . . . . . . . . . . . . . . . . . . . . . . . . . . . . 77Figure 8.24: Multi-Maneuver Roll Angle Versus Speed for the Chevrolet Tracker . . . . 78Figure 8.25: Multi-Vehicle Corrected Lateral Acceleration Versus
Speed for the Left J-Turn Maneuver . . . . . . . . . . . . . . . . . . . . . . . . . . . . 80Figure 8.26: Multi-Vehicle Roll Angle Versus Speed for the Left J-Turn
Maneuver . . . . . . . . . . . . . . . . . . . . . . . . . . . . . . . . . . . . . . . . . . . . . . . . . 81Figure 8.27: Multi-Vehicle Corrected Lateral Acceleration Versus
Speed for the Right J-Turn Maneuver . . . . . . . . . . . . . . . . . . . . . . . . . . . 82Figure 8.28: Multi-Vehicle Roll Angle Versus Speed for the Right J-Turn
Maneuver . . . . . . . . . . . . . . . . . . . . . . . . . . . . . . . . . . . . . . . . . . . . . . . . . 83Figure 8.29: Multi-Vehicle Corrected Lateral Acceleration Versus Speed
for the Left J-Turn with Pulse Braking Maneuver . . . . . . . . . . . . . . . . . . . 85Figure 8.30: Multi-Vehicle Roll Angle Versus Speed for the Left J-Turn
with Pulse Braking Maneuver . . . . . . . . . . . . . . . . . . . . . . . . . . . . . . . . . 86Figure 8.31: Multi-Vehicle Corrected Lateral Acceleration Versus
Speed for the Right J-Turn with Pulse Braking Maneuver . . . . . . . . . . . . 87
vii
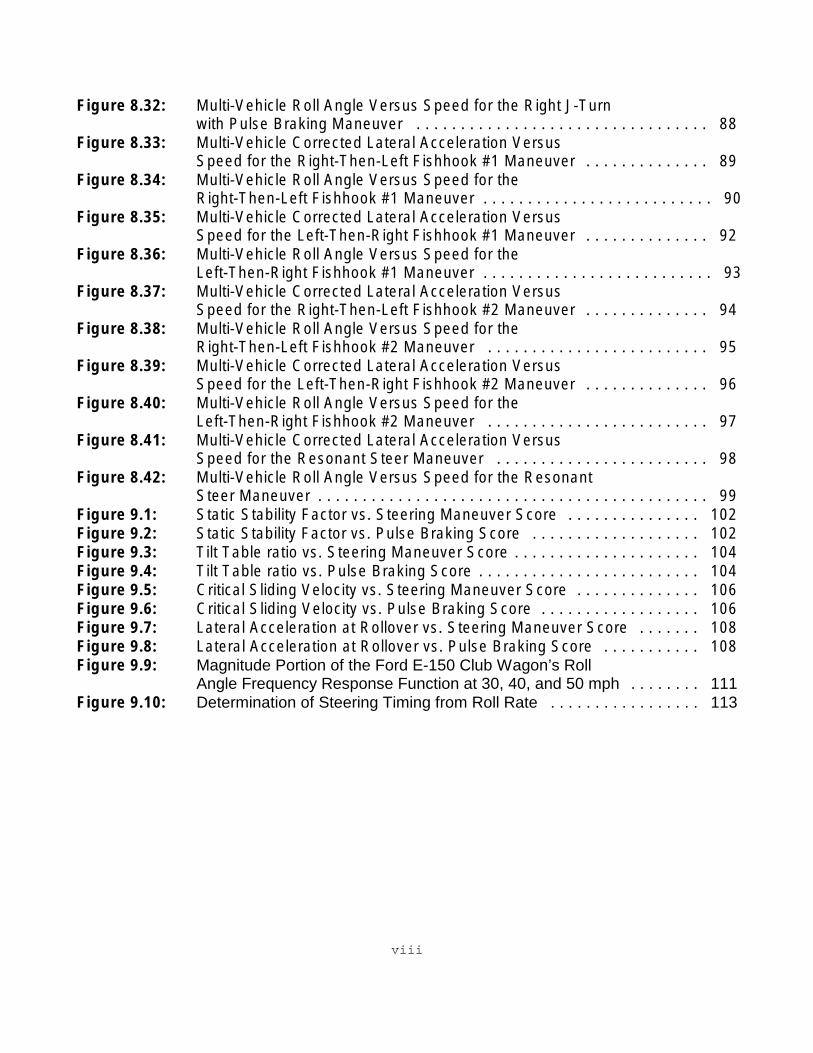
Figure 8.32: Multi-Vehicle Roll Angle Versus Speed for the Right J-Turnwith Pulse Braking Maneuver . . . . . . . . . . . . . . . . . . . . . . . . . . . . . . . . . 88
Figure 8.33: Multi-Vehicle Corrected Lateral Acceleration VersusSpeed for the Right-Then-Left Fishhook #1 Maneuver . . . . . . . . . . . . . . 89
Figure 8.34: Multi-Vehicle Roll Angle Versus Speed for theRight-Then-Left Fishhook #1 Maneuver . . . . . . . . . . . . . . . . . . . . . . . . . . 90
Figure 8.35: Multi-Vehicle Corrected Lateral Acceleration VersusSpeed for the Left-Then-Right Fishhook #1 Maneuver . . . . . . . . . . . . . . 92
Figure 8.36: Multi-Vehicle Roll Angle Versus Speed for theLeft-Then-Right Fishhook #1 Maneuver . . . . . . . . . . . . . . . . . . . . . . . . . . 93
Figure 8.37: Multi-Vehicle Corrected Lateral Acceleration VersusSpeed for the Right-Then-Left Fishhook #2 Maneuver . . . . . . . . . . . . . . 94
Figure 8.38: Multi-Vehicle Roll Angle Versus Speed for theRight-Then-Left Fishhook #2 Maneuver . . . . . . . . . . . . . . . . . . . . . . . . . 95
Figure 8.39: Multi-Vehicle Corrected Lateral Acceleration VersusSpeed for the Left-Then-Right Fishhook #2 Maneuver . . . . . . . . . . . . . . 96
Figure 8.40: Multi-Vehicle Roll Angle Versus Speed for theLeft-Then-Right Fishhook #2 Maneuver . . . . . . . . . . . . . . . . . . . . . . . . . 97
Figure 8.41: Multi-Vehicle Corrected Lateral Acceleration VersusSpeed for the Resonant Steer Maneuver . . . . . . . . . . . . . . . . . . . . . . . . 98
Figure 8.42: Multi-Vehicle Roll Angle Versus Speed for the ResonantSteer Maneuver . . . . . . . . . . . . . . . . . . . . . . . . . . . . . . . . . . . . . . . . . . . . 99
Figure 9.1: Static Stability Factor vs. Steering Maneuver Score . . . . . . . . . . . . . . . 102Figure 9.2: Static Stability Factor vs. Pulse Braking Score . . . . . . . . . . . . . . . . . . . 102Figure 9.3: Tilt Table ratio vs. Steering Maneuver Score . . . . . . . . . . . . . . . . . . . . . 104Figure 9.4: Tilt Table ratio vs. Pulse Braking Score . . . . . . . . . . . . . . . . . . . . . . . . . 104Figure 9.5: Critical Sliding Velocity vs. Steering Maneuver Score . . . . . . . . . . . . . . 106Figure 9.6: Critical Sliding Velocity vs. Pulse Braking Score . . . . . . . . . . . . . . . . . . 106Figure 9.7: Lateral Acceleration at Rollover vs. Steering Maneuver Score . . . . . . . 108Figure 9.8: Lateral Acceleration at Rollover vs. Pulse Braking Score . . . . . . . . . . . 108Figure 9.9: Magnitude Portion of the Ford E-150 Club Wagon’s Roll
Angle Frequency Response Function at 30, 40, and 50 mph . . . . . . . . 111Figure 9.10: Determination of Steering Timing from Roll Rate . . . . . . . . . . . . . . . . . 113
viii
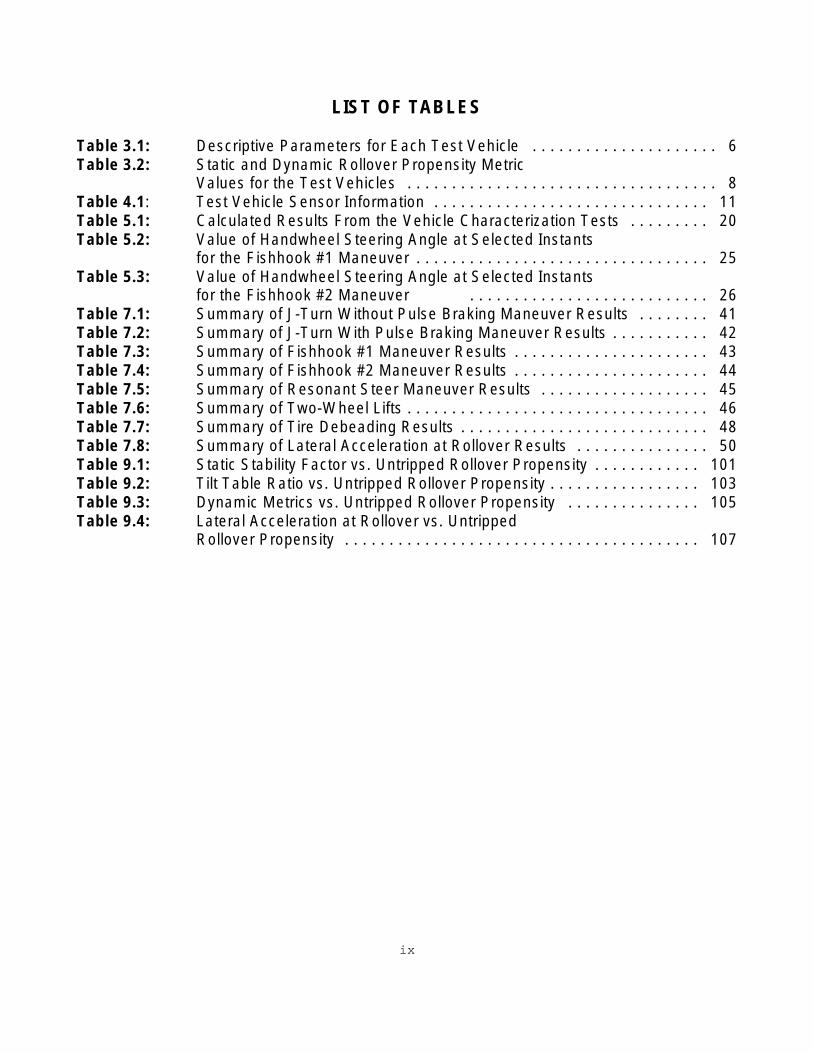
LIST OF TABLES
Table 3.1: Descriptive Parameters for Each Test Vehicle . . . . . . . . . . . . . . . . . . . . . 6Table 3.2: Static and Dynamic Rollover Propensity Metric
Values for the Test Vehicles . . . . . . . . . . . . . . . . . . . . . . . . . . . . . . . . . . . 8Table 4.1: Test Vehicle Sensor Information . . . . . . . . . . . . . . . . . . . . . . . . . . . . . . . 11Table 5.1: Calculated Results From the Vehicle Characterization Tests . . . . . . . . . 20Table 5.2: Value of Handwheel Steering Angle at Selected Instants
for the Fishhook #1 Maneuver . . . . . . . . . . . . . . . . . . . . . . . . . . . . . . . . . 25Table 5.3: Value of Handwheel Steering Angle at Selected Instants
for the Fishhook #2 Maneuver . . . . . . . . . . . . . . . . . . . . . . . . . . . 26Table 7.1: Summary of J-Turn Without Pulse Braking Maneuver Results . . . . . . . . 41Table 7.2: Summary of J-Turn With Pulse Braking Maneuver Results . . . . . . . . . . . 42Table 7.3: Summary of Fishhook #1 Maneuver Results . . . . . . . . . . . . . . . . . . . . . . 43Table 7.4: Summary of Fishhook #2 Maneuver Results . . . . . . . . . . . . . . . . . . . . . . 44Table 7.5: Summary of Resonant Steer Maneuver Results . . . . . . . . . . . . . . . . . . . 45Table 7.6: Summary of Two-Wheel Lifts . . . . . . . . . . . . . . . . . . . . . . . . . . . . . . . . . . 46Table 7.7: Summary of Tire Debeading Results . . . . . . . . . . . . . . . . . . . . . . . . . . . . 48Table 7.8: Summary of Lateral Acceleration at Rollover Results . . . . . . . . . . . . . . . 50Table 9.1: Static Stability Factor vs. Untripped Rollover Propensity . . . . . . . . . . . . 101Table 9.2: Tilt Table Ratio vs. Untripped Rollover Propensity . . . . . . . . . . . . . . . . . 103Table 9.3: Dynamic Metrics vs. Untripped Rollover Propensity . . . . . . . . . . . . . . . 105Table 9.4: Lateral Acceleration at Rollover vs. Untripped
Rollover Propensity . . . . . . . . . . . . . . . . . . . . . . . . . . . . . . . . . . . . . . . . 107
ix

ACKNOWLEDGMENTS
The testing program documented in this report was a coordinated effort by the National Highway Traffic Safety Administration (NHTSA) Vehicle Research and Test Center (VRTC) and the Transportation Research Center Inc. (TRC) to evaluate potential rollover propensity maneuvers. Twelve vehicles were tested.
The authors wish to recognize the outstanding support of our research colleagues. Larry Jolliff and Jeffrey Lloyd were instrumental in performing the testing. Larry Armstrong, Greg Stevens, Jim Preston, and Dave MacPherson prepared the vehicles for testing by providing instrumentation and outrigger installation. Dave Dashner and Leslie Portwood performed data analysis and provided tabulated and graphical data for the report.
John Hinch from NHTSA Research and Development and Mike Pyne, Gayle Dalrymple, Pat Boyd, and Gary Woodford from NHTSA Safety Performance Standards office contributed to the development of the test procedures used in this study.
W. Riley Garrott, Ph.D.J. Gavin HoweGarrick Forkenbrock
x

Department of Transportation National Highway Traffic Safety Administration
TECHNICAL SUMMARY
Report Title:An Experimental Examination of Selected Maneuvers That May Induce On-RoadUntripped, Light Vehicle Rollover - Phase II of NHTSA’s 1997-1998 Vehicle Rollover Research Program
Report Author(s):W. Riley Garrott, J. Gavin Howe, and Garrick Forkenbrock
Date: January 1999
This report documents the results of Phase II testing for NHTSA’s 1997-1998 Light Vehicle Research program. The objectives of this study were to:
1. Test a broad range of light vehicle classes using the test maneuvers and procedures developed during Phase I-A and I-B.
2. To use the results from this testing to characterize on-road, untripped rollover propensity for the selected vehicles.
3. To compare the on-road, untripped rollover propensity characteristics to static and dynamic rollover metrics.
4. To improve test maneuvers and procedures used to characterize on-road untripped rollover propensities.
A total of twelve vehicles were selected to cover a wide range of vehicle types and classes. Three vehicles from each of the following categories were evaluated: passenger cars, light trucks, vans, and sport utility vehicles. The following twelve vehicles were selected: Chevrolet Lumina, Dodge Neon, Chevrolet Metro, Chevrolet C-1500, Chevrolet S-10, Ford Ranger, Ford E-150 Club Wagon, Chevrolet Astro, Dodge Caravan, Chevrolet Tahoe, Ford Explorer, and Chevrolet Tracker. All of the vehicles were new 1998 model year vehicles except the Ford Ranger which was a new 1997. These vehicles were selected in-part because of their relatively high sales volume and because they did not have a major redesign in the past three years. The Ford Ranger did have a major redesign in 1998 so a 1997 model was selected.
The vehicles were tested using candidate vehicle characterization maneuvers and untripped rollover propensity maneuvers. The vehicle characterization maneuvers were designed to determine fundamental vehicle handling properties while the untripped rollover propensity maneuvers were designed to produce two-wheel lift for vehicles with relatively higher rollover propensity potential. The vehicle characterization maneuvers were Pulse
xi

Steer, Sinusoidal Sweep, Slowly Increasing Steer, and Slowly Increasing Speed. The rollover propensity maneuvers were J-Turn, J-Turn with Pulse Braking, Fishhook #1, Fishhook #2, and Resonant Steer. The J-Turn maneuver was a single steer test, while the J-Turn with Pulse Braking had a pulse brake application after the single steer input was achieved. The Fishhook #1 and Fishhook #2 were both single steering reversal maneuvers, but each had different steering reversal timings and steering rates. The Resonant Steer maneuver was a sinusoidal input based on the vehicle roll natural frequency as determined from the Pulse Steer and Sinusoidal Sweep tests.
The degree of lift produced for each vehicle/maneuver/steer direction combination was given a score based on whether the lift was minor, moderate, or major. No lift was given a zero score. The individual vehicle/maneuver/steer direction scores were combined to produce two ratings: Steering Maneuver Score and Pulse Braking Score. The Steering Maneuver Score was based on J-Turn, Fishhook #1, and Fishhook #2 results and the Pulse Braking Score was based on J-Turn with Pulse Braking results.
Steering Maneuver Scores were found to be related to the vehicle static and dynamic rollover stability metrics. The Pulse Braking Score was related more to whether or not the vehicle had 4-wheel anti-lock brakes (4WAL) or not. For those vehicles that did not have 4WAL, the Pulse Braking score did relate to static and dynamic stability metrics. For both scoring methods, static rollover metrics (Static Stability Factor and Tilt Table Ratio) related better than the dynamic rollover metric (Critical Sliding Velocity).
The Lateral Acceleration at Rollover was also determined for each vehicle and was not found to be related to either the static or dynamic rollover stability metrics.
The J-Turn maneuver produced two-wheel lift for just one vehicle. The J-Turn maneuver appears to be a very coarse metric for discriminating vehicles with high or low rollover propensity.
The J-Turn with Pulse Braking maneuver was found to discriminate between vehicles with 4WAL and those with RWAL (Rear Wheel Anti-Lock) or no ABS. This was especially true for those vehicles with lower SSF or TTR values.
The Fishhook #1 produced the highest number of two-wheel lifts for all the maneuvers (a total of five vehicles), but other maneuvers produced two-wheel lift for vehicles that did not have two-wheel lift for the Fishhook #1.
The Fishhook #2 maneuver produced two-wheel lift for four vehicles, one of which did not have two-wheel lift in the Fishhook #1 maneuver.
The Resonant Steer maneuver did not produce two-wheel lift for any of the twelve vehicles.
xii
1.0 INTRODUCTION
1.1 Relationship to Previous Phases of Research
The research described in this report is an outgrowth of the work that was performed for Phases I-A and I-B of the National Highway Traffic Safety Administration’s (NHTSA) 1997 -1998 Light Vehicle Rollover Research program. The Phase I-A research is described in detail in [1] while the Phase I-B research is fully documented in [2].
Reports [1] and [2] contain a substantial amount of information which is relevant to the current research. Among the significant information contained in these two reports is data about the magnitude of the rollover crash problem, the definition of on-road, untripped rollover that is being used during the current research, and a discussion of the development of the Phase II Test Matrix. For brevity, much of the information contained in reports [1] and [2] will not be repeated in the current document.
When originally planned, NHTSA’s 1997 - 1998 Light Vehicle Rollover Research program was to consist of the Phase I research (to be performed during the spring through fall of 1997) which was to develop a set of test maneuvers to be used, and the Phase II research (to be performed during the summer of 1998) which was to use the Phase I maneuver set to measure the on-road, untripped, maneuver induced rollover propensities of a broad range of vehicles. However, preliminary analysis of the Phase I-A results revealed a number of issues that had to be resolved before the Phase II testing could begin. Therefore, the spring through fall of 1997 testing was renamed the Phase I-A research and additional testing, called the Phase I-B research, was performed during the fall of 1997 and the winter and spring of 1998.
This report covers the work performed for Phase II of NHTSA’s 1997 - 1998 Light Vehicle Rollover Research program. This testing was performed from June through September of 1998. Data reduction and analysis were performed from September through December of the same year.
1.2 Focus of This Study
As was the case for the Phases I-A and I-B research of NHTSA’s 1997 - 1998 Light Vehicle Rollover Research program, the focus of this study is on-road, untripped rollovers. The reasons for focusing this research on only on-road, untripped rollovers are fully discussed in [1].
1
This study differs from that of Phase I-A and I-B in the degree of confidence for proposed maneuvers and the matrix of test vehicles. In the earlier phases, several maneuvers were eliminated because of more obvious lack of accuracy and/or repeatability. The maneuvers in Phase II are all considered serious candidates for use in vehicle characterization or rollover propensity measurement. Also, in previous phases, older vehicle models were used. In the current Phase II testing, the potential procedures were evaluated using the described variety of new vehicles.
1.3 Overview of This Report
This chapter of the report has tied Phase II of NHTSA’s 1997 - 1998 Light Vehicle Rollover Research program to the prior program phases (Phases I-A and I-B), and stated the focus of the report. Chapter 2.0 concludes the introductory portion of this report by presenting the objectives of this study.
The middle portion of this report describes the testing that was performed for this study. This portion begins with Chapter 3.0 which lists the vehicles selected for testing, discusses the reasons for selecting these vehicles, and presents selected vehicle parameters. Chapter 4.0 then describes the instrumentation used during this testing. The chapter lists the sensors used and shows their mounting locations, discusses the programmable steering controller, describes the data acquisition system, and explains the techniques that were developed to more accurately determine roll angles. Chapter 5.0 concludes the testing portion of the report by presenting the Phase II Test Matrix and explaining the procedure used for each of the test maneuvers included in this matrix.
The next portion of this report presents the results of this study. This portion of the report begins with Chapter 6.0 which examines the repeatability of this testing. Chapter 7.0 contains the results obtained for each test vehicle from each of the untripped rollover propensity determination maneuvers. Chapter 8.0 concludes this portion of the report by attempting to summarize the results from this testing by looking at the complete set of “Multi-Maneuver Summary” plots.
The last portion, of this report discusses the results and presents the conclusions that can be drawn from this research. Chapter 9.0 presents the relationship between the static, dynamic, and on-road, untripped, measures of a vehicle’s rollover propensity, and provides an assessment of the rollover propensity maneuvers that were used. Chapter 10.0 is a list of the conclusions that can be drawn from this research. The report concludes with a list of references.
2
2.0 STUDY OBJECTIVES
One goal of the National Highway Traffic Safety Administration (NHTSA) is to reduce the number of fatalities and injuries due to rollover crashes. To achieve this goal, the NHTSA is conducting research programs both to reduce the number of rollover crashes that occur and to mitigate the adverse consequences when rollover crashes do occur. The current study is part of the NHTSA’s research to reduce the number of rollover crashes.
To reduce the number of rollover crashes, the NHTSA is working to develop either an information program which will make consumer’s more aware of vehicle make/models with a high rollover propensity or a Federal Motor Vehicle Safety Standard (FMVSS) which would prevent the manufacture of vehicles that have too high a rollover propensity or both. One key step towards developing either a rollover propensity consumer information program or a rollover propensity FMVSS is the development of a methodology for determining a vehicle’s rollover propensity. This study focuses on the development of such a methodology.
There are two reasonable ways to proceed with the development of a methodology for determining a vehicle’s rollover propensity. One way will be referred to as the Actual Rollover Occurrence approach, the other the Rollover Propensity Metrics approach.
For the Actual Rollover Occurrence approach, a vehicle being tested is driven through a prescribed test procedure that may result in on-road, untripped rollover. This test procedure consists of a series of selected maneuvers. The maneuvers would be selected to: (1) require steering, braking and throttle inputs that are within the envelope of actual driver capabilities, (2) occur (probably infrequently) during actual driving, and (3) attempt to induce on-road, untripped rollover. Maneuvers may be performed at different severity levels, speeds, etc. A vehicle’s rollover propensity for either consumer information or a FMVSS would be determined by which, if any, maneuvers actually resulted in vehicle rollover (or would have resulted in rollover if not prevented by outriggers).
To proceed with the Actual Rollover Occurrence approach, the NHTSA needs to develop one or more candidate dynamic test procedures to identify vehicles with a high on-road, untripped rollover propensity. These dynamic test procedures should be composed of maneuvers that: (1) result in on-road untripped rollover for some, but not all, vehicles, (2) might be performed by actual drivers while driving (particularly in emergencies), and (3) can be performed objectively with, for the same vehicle, repeatable results. Once such test procedures have been developed, the next step would be to test them using many classes of vehicles.
For the Rollover Propensity Metrics approach, a vehicle is tested according to a prescribed procedure. The prescribed procedure may include dynamic driving tests, laboratory tests (such as measurement of Tilt Table Angle) or both. From analyses of data collected while performing this test procedure, metrics are calculated that are expected to quantify a vehicle’s rollover propensity. A vehicle’s rollover propensity for either consumer information or an FMVSS would be based upon one or more of these metrics.
3

A very difficult step of the Rollover Propensity metrics approach is to demonstrate that the metrics chosen do, in fact, quantify the rollover propensity of many vehicle make/models. Metrics are typically initially developed based on the physics of vehicle rollover. However, there then remains the task of demonstrating a correlation between metric values and real world rollover propensity. This is usually done by measuring metric values for a significant fraction of the vehicle fleet and then correlating these values with “real-world” rollover crash statistics. Unfortunately, due to the “noise” present in “real-world” rollover crash statistics, achieving good correlations is very difficult.
To proceed with the Rollover Propensity Metrics approach, the NHTSA needs to develop one or more candidate dynamic rollover propensity metrics and test procedures to measure them. These metric measurement test procedures do not necessarily need to be composed of maneuvers that can be performed by drivers in real world driving conditions. However, methods must be developed to perform these metric measurement test procedures objectively with, for the same vehicle, repeatable results. Once such metric measurement test procedures has been developed, the next step would be to use them to measure rollover propensity metrics for many make/models of vehicles.
The NHTSA has not yet decided whether to use the Actual Rollover Occurrence approach or the Rollover Propensity Metrics approach. Therefore, work is proceeding in parallel upon both approaches.
This report covers the work performed for Phase II of NHTSA’s 1997 - 1998 Light Vehicle Rollover Research program. This testing was performed from June through September of 1998. Data reduction and analysis were performed from September through December of the same year.
The objectives of Phase II Light Vehicle Rollover Research program were:
1. To test a broad range of light vehicle classes and, within classes, vehicle sizes using the test maneuvers and procedures developed during the Phase I-A and I-B Rollover Research.
2. To use the results from this testing to characterize the on-road, untripped rollover propensities of a broad range of light vehicles.
3. To compare the on-road, untripped rollover propensities of a broad range of light vehicles with their static and dynamic rollover metrics (Static Stability Factor, Tilt Table Ratio, and Critical Sliding Velocity).
4. To use the results from this testing to improve the test maneuvers and procedures used to characterize the on-road, untripped rollover propensities of light vehicles.
4
3.0 Test Vehicles
3.1 Vehicles Selected
Twelve vehicles were selected for the Phase II testing. Table 3.1 lists the vehicles selected and some of the significant descriptive parameters of each test vehicle. The leftmost column of the table lists each test vehicle. The next column shows whether the vehicle had four-wheel ABS (4WAL), rear-wheel only ABS (RWAL), or no ABS (None). The third column lists any vehicle options that might significantly influence the dynamics of the vehicle. Only optional items that are expected to significantly effect the vehicle’s center of gravity height and/or mass moments of inertia are listed in this column. For example, the presence of a rear-door mounted spare tire would be listed since this probably increases the vehicle’s center of gravity height and its pitch and yaw mass moments of inertia significantly. Other optional items, such as air conditioning, that do result in a minor increase in the vehicle’s weight but are expected to have only a minimal effect on its center of gravity height and mass moments of inertia, are not listed. The next column lists the OEM tires that were used on each vehicle during testing. The final three columns list each vehicle’s wheelbase, track width, and as tested weight both with and without outriggers. Note that each vehicle’s as tested weight is greater than its curb (no occupants, full fuel tank) weight due to the presence, during testing, of the driver, instrumentation, and outriggers.
The test vehicles used for the Phase II research were selected following consultation between personnel belonging to the National Highway Traffic Safety Administration’s (NHTSA) Safety Assurance, Safety Performance Standards, and Research and Development Offices based upon a variety of criteria. The selection criteria used were:
1. To test three vehicles from each of the following light vehicle classes: automobiles, pickup trucks, sport utility vehicles, and vans. For each of these classes a broad range of vehicle sizes and weights were to be tested.
2. To test popular (high sales volume) vehicles. This selection criteria was included to facilitate obtaining an adequate amount of crash data to make statistical comparisons between observed rollover crash frequencies and the measured on-road, untripped, rollover propensities.
3. To test vehicles that had not had a major redesign for at least three years. This selection criteria was also included to facilitate obtaining an adequate amount of crash data to make statistical comparisons. For one pickup truck, the Ford Ranger, a new 1997 model year vehicle was procured for testing because this vehicle had a major redesign between the 1997 and 1998 model years. All other vehicles were 1998 models.
5
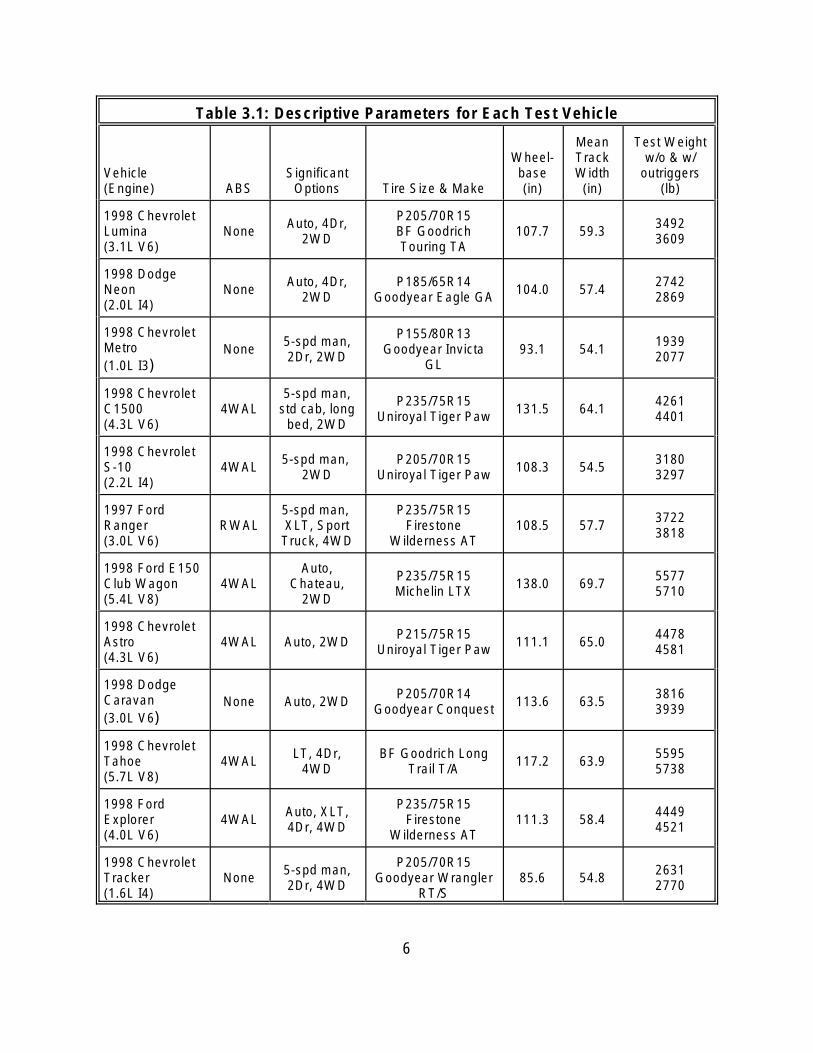
Table 3.1: Descriptive Parameters for Each Test Vehicle
Vehicle (Engine) ABS
Significant Options Tire Size & Make
Wheel-base (in)
Mean Track Width
(in)
Test Weight w/o & w/
outriggers (lb)
1998 Chevrolet Lumina (3.1L V6)
None Auto, 4Dr,
2WD
P205/70R15 BF Goodrich Touring TA
107.7 59.3 3492 3609
1998 Dodge Neon (2.0L I4)
None Auto, 4Dr,
2WD P185/65R14
Goodyear Eagle GA 104.0 57.4 2742 2869
1998 Chevrolet Metro (1.0L I3)
None 5-spd man, 2Dr, 2WD
P155/80R13 Goodyear Invicta
GL 93.1 54.1
1939 2077
1998 Chevrolet C1500 (4.3L V6)
4WAL 5-spd man,
std cab, long bed, 2WD
P235/75R15 Uniroyal Tiger Paw 131.5 64.1
4261 4401
1998 Chevrolet S-10 (2.2L I4)
4WAL 5-spd man,
2WD P205/70R15
Uniroyal Tiger Paw 108.3 54.5 3180 3297
1997 Ford Ranger (3.0L V6)
RWAL 5-spd man, XLT, Sport Truck, 4WD
P235/75R15 Firestone
Wilderness AT 108.5 57.7
3722 3818
1998 Ford E150 Club Wagon (5.4L V8)
4WAL Auto,
Chateau, 2WD
P235/75R15 Michelin LTX 138.0 69.7
5577 5710
1998 Chevrolet Astro (4.3L V6)
4WAL Auto, 2WD P215/75R15
Uniroyal Tiger Paw 111.1 65.0 4478 4581
1998 Dodge Caravan (3.0L V6)
None Auto, 2WD P205/70R14
Goodyear Conquest 113.6 63.5 3816 3939
1998 Chevrolet Tahoe (5.7L V8)
4WAL LT, 4Dr,
4WD BF Goodrich Long
Trail T/A 117.2 63.9 5595 5738
1998 Ford Explorer (4.0L V6)
4WAL Auto, XLT, 4Dr, 4WD
P235/75R15 Firestone
Wilderness AT 111.3 58.4
4449 4521
1998 Chevrolet Tracker (1.6L I4)
None 5-spd man, 2Dr, 4WD
P205/70R15 Goodyear Wrangler
RT/S 85.6 54.8
2631 2770
6

4. To test only new vehicles. This selection criteria was included because these are the type of vehicle that NHTSA regulates.
5. Vehicle availability. This was an issue for one vehicle, the Ford Ranger. If there had been problems obtaining a new 1997 model year vehicle, a different pickup truck would have been substituted for the Ford Ranger.
6. To minimize program costs. In several cases, the make/model tested had “sister” make models (e.g., the Dodge Caravan has two sister vehicles, the Chrysler Town and Country and the Plymouth Voyager). In this situation, the lowest cost vehicle was procured and tested.
All twelve test vehicles were equipped with outriggers during the Phase II testing. Different outrigger designs were used for different vehicles depending upon the vehicle’s size and weight. The effects of outriggers on a vehicle’s performance and on-road, untripped rollover propensity were studied in Phase I-B. This issue will be further studied in future NHTSA rollover research.
3.2 Static and Dynamic Rollover Metric Values for the Test Vehicles
Each of the twelve test vehicles was tested by S.E.A., Inc. on their Vehicle Inertial Measurement Facility (VIMF) and on their Tilt Table. All vehicles were tested both with and without outriggers on the VIMF and the Tilt Table.
All tests on the VIMF and theTilt Table were conducted with one sandbag occupant in the drivers seat, no other load in the vehicle, and a full fuel tank. The sandbag occupant was designed by S.E.A., Inc. The center of gravity location and inertial properties of the sandbag occupant are similar to those of a 165 pound, fiftieth-percentile, male.
Based on the results of this testing, two static rollover propensity metrics, Static Stability Factor and Tilt Table Ratio, and one dynamic rollover propensity metric, Critical Sliding Velocity, were calculated for each test vehicle. The precise definitions of each of these static and dynamic rollover propensity metrics are contained in [3]. The calculated values of each of these static and dynamic rollover propensity metrics for each vehicle, both with and without outriggers, are shown in Table 3.2.
As Table 3.2 shows, the addition of outriggers increased most of the vehicles’ static and dynamic rollover propensity metrics. The exceptions to this trend include the Chevrolet Metro, whose Static Stability Factor was reduced slightly (0.8%), and the Ford Explorer and Chevrolet Tracker, whose Tilt Table Ratios were reduced by 2.5% and 0.2%, respectively.
7
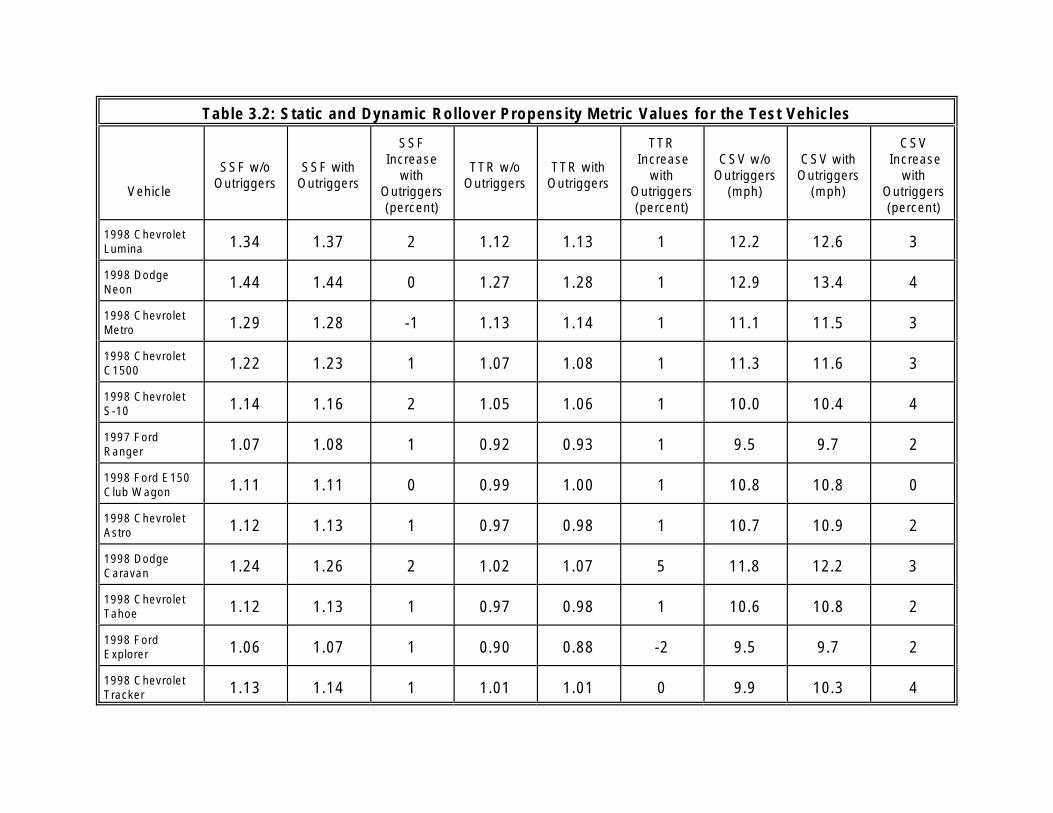
Table 3.2: Static and Dynamic Rollover Propensity Metric Values for the Test Vehicles
Vehicle
SSF w/o Outriggers
SSF with Outriggers
SSF Increase
with Outriggers (percent)
TTR w/o Outriggers
TTR with Outriggers
TTR Increase
with Outriggers (percent)
CSV w/o Outriggers
(mph)
CSV with Outriggers
(mph)
CSV Increase
with Outriggers (percent)
1998 Chevrolet Lumina 1.34 1.37 2 1.12 1.13 1 12.2 12.6 3
1998 Dodge Neon 1.44 1.44 0 1.27 1.28 1 12.9 13.4 4
1998 Chevrolet Metro 1.29 1.28 -1 1.13 1.14 1 11.1 11.5 3
1998 Chevrolet C1500 1.22 1.23 1 1.07 1.08 1 11.3 11.6 3
1998 Chevrolet S-10 1.14 1.16 2 1.05 1.06 1 10.0 10.4 4
1997 Ford Ranger 1.07 1.08 1 0.92 0.93 1 9.5 9.7 2
1998 Ford E150 Club Wagon 1.11 1.11 0 0.99 1.00 1 10.8 10.8 0
1998 Chevrolet Astro 1.12 1.13 1 0.97 0.98 1 10.7 10.9 2
1998 Dodge Caravan 1.24 1.26 2 1.02 1.07 5 11.8 12.2 3
1998 Chevrolet Tahoe 1.12 1.13 1 0.97 0.98 1 10.6 10.8 2
1998 Ford Explorer 1.06 1.07 1 0.90 0.88 -2 9.5 9.7 2
1998 Chevrolet Tracker 1.13 1.14 1 1.01 1.01 0 9.9 10.3 4

Overall, the increase in static rollover propensity metrics was quite small for both Static Stability Factor and Tilt Table Ratio (<2% and <5.0%, respectively). This indicates that one of the outrigger design goals, not changing a vehicle’s center of gravity height, was almost achieved. The increase due to outriggers for Critical Sliding Velocity (<4.0%) is primarily due to the effects of the outriggers on a vehicle’s roll moment of inertia. Although the designer tried to minimize the mass of the outriggers, they inevitably add mass well away from the vehicle’s centerline. As a result, outriggers always increase a vehicle’s roll moment of inertia significantly, from as little as 5% for the Ford E150 Club Wagon to as much as 38% for the Chevrolet Metro. The increase in Critical Sliding Velocity due to outriggers indicates that the vehicle configuration used for testing during the Phase II research should offer greater resistance to tripped rollover than does the nominal vehicle. However, as previously stated, the effects of outriggers on a vehicle’s on-road, untripped rollover propensity are still being studied.
The Tilt Table Ratio percentage change would be even lower if the Dodge Caravan results were excluded. All other vehicles were <2%. It is not clear why the Caravan had such a large change (5%). It is possible that the slight weight shift due to the addition of outriggers caused a difference in whether the front or rear tire lifted off the platform first. The data has been double checked and there does not appear to be any errors.
9
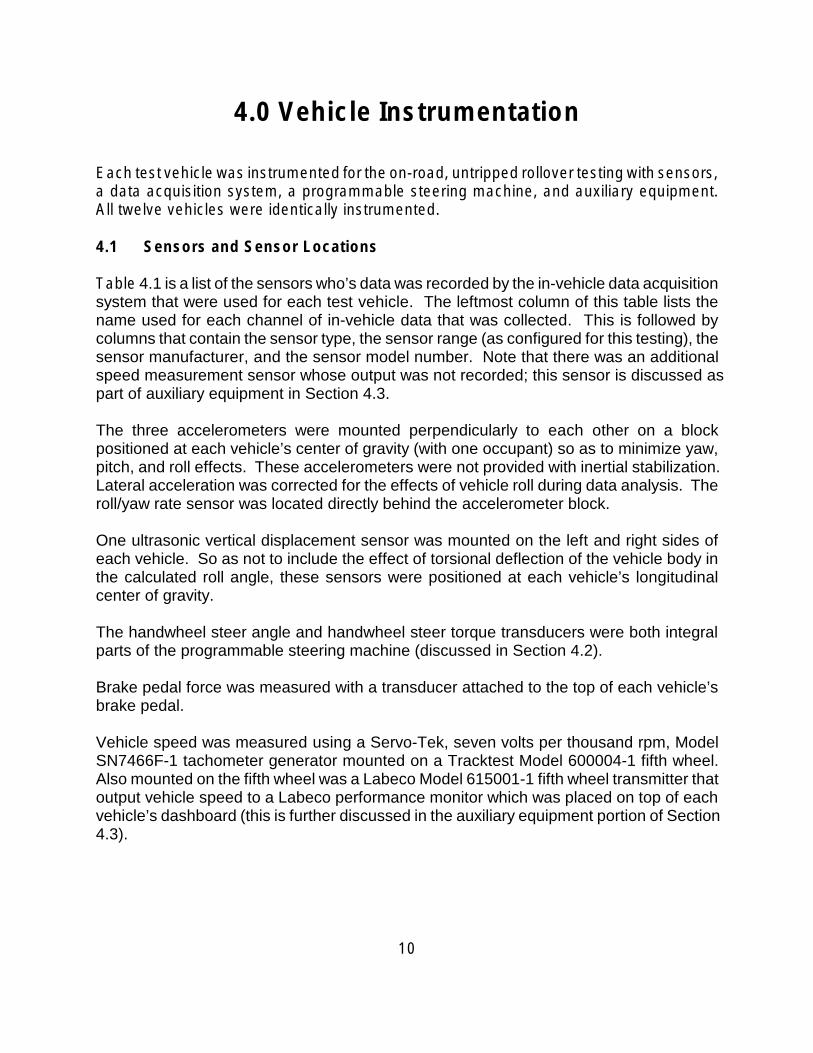
4.0 Vehicle Instrumentation
Each test vehicle was instrumented for the on-road, untripped rollover testing with sensors, a data acquisition system, a programmable steering machine, and auxiliary equipment. All twelve vehicles were identically instrumented.
4.1 Sensors and Sensor Locations
Table 4.1 is a list of the sensors who’s data was recorded by the in-vehicle data acquisition system that were used for each test vehicle. The leftmost column of this table lists the name used for each channel of in-vehicle data that was collected. This is followed by columns that contain the sensor type, the sensor range (as configured for this testing), the sensor manufacturer, and the sensor model number. Note that there was an additional speed measurement sensor whose output was not recorded; this sensor is discussed as part of auxiliary equipment in Section 4.3.
The three accelerometers were mounted perpendicularly to each other on a block positioned at each vehicle’s center of gravity (with one occupant) so as to minimize yaw, pitch, and roll effects. These accelerometers were not provided with inertial stabilization. Lateral acceleration was corrected for the effects of vehicle roll during data analysis. The roll/yaw rate sensor was located directly behind the accelerometer block.
One ultrasonic vertical displacement sensor was mounted on the left and right sides of each vehicle. So as not to include the effect of torsional deflection of the vehicle body in the calculated roll angle, these sensors were positioned at each vehicle’s longitudinal center of gravity.
The handwheel steer angle and handwheel steer torque transducers were both integral parts of the programmable steering machine (discussed in Section 4.2).
Brake pedal force was measured with a transducer attached to the top of each vehicle’s brake pedal.
Vehicle speed was measured using a Servo-Tek, seven volts per thousand rpm, Model SN7466F-1 tachometer generator mounted on a Tracktest Model 600004-1 fifth wheel. Also mounted on the fifth wheel was a Labeco Model 615001-1 fifth wheel transmitter that output vehicle speed to a Labeco performance monitor which was placed on top of each vehicle’s dashboard (this is further discussed in the auxiliary equipment portion of Section 4.3).
10

Table 4.1: Test Vehicle Sensor Information
Data Channel Sensor Type Sensor Range Sensor
Manufacturer
Sensor Model
Number
Longitudinal Acceleration Accelerometer ±2 g Setra 141-A
Lateral Acceleration Accelerometer ±2 g Setra 141-A
Vertical Acceleration Accelerometer ±2 g Setra 141-A
Roll Rate Angular Rate Sensor ±100E/s Watson* ARS-
C232-1A
Yaw Rate Angular Rate Sensor ±100E/s Watson* ARS-
C232-1A
Handwheel Torque Programmable
Steering Controller
Motor Current Is Monitored
Motor Encoder
Supplied by ATI
n/a
Handwheel Angle Programmable
Steering Controller
±360E
Angle Encoder
Supplied by ATI
n/a
Left-side Vehicle Height Ultrasonic Distance Sensor
5" - 24" Massa M-4000 410/150
Right-side Vehicle Height Ultrasonic Distance Sensor
5" - 24" Massa M-4000 410/150
Vehicle Speed Readout 5th Wheel with
Optical Encoder and Analog Tach Generator
100 mph Labeco 625
Vehicle Speed Channel 0-65 mph Servo Tek SN-7466F-1
Brake Pedal Force Load Cell 300 lbf GSE 4350-300CB
*Most test vehicles used the Watson rate sensor. Some were wired with a Humphrey rate transducer, #RT10-0127-1, with a range of ±50E/s.
11

4.2 Programmable Steering Machine
During testing, each vehicle was equipped with an Automotive Testing, Inc. (ATI) Programmable Steering Machine. This device was used to generate handwheel steering inputs throughout all of this testing. The capabilities of this machine are fully described in [4] and [5]. In brief, to quote from [5],
“The ATI Programmable Steering Machine is an easily-installed, battery-powered, “series servo second steering wheel”. The steering machine is designed to execute any 16384-step steering program with force and velocity capabilities significantly greater than those of the human driver. Its EPROM memory contains sixteen separate programs, which can be programmed to duplicate any steering input with fidelity and repeatability. During the execution of a program, the handwheel is mechanically “grounded” to eliminate driver interference with measurement of steering angles and torques. The program also outputs auxiliary signals that can be used to control vehicle throttle and brakes, data recorders, or other devices.”
The ATI Programmable Steering Machine can turn the steering handwheel through the entire lock-to-lock range. Feedback control is used to generate the precise steering input desired. Handwheel steer rates of up to 1800 degrees per second and handwheel steer torques of up to 50 Newton-meters, in either direction, can be generated. The ATI Programmable Steering Machine also includes integral handwheel steer angle and handwheel steer torque sensors. The handwheel steer angle transducer has a resolution of ±0.10 degrees while the handwheel steer torque sensor has an accuracy of 0.3 Newton-meters.
4.3 Data Acquisition and Auxiliary Equipment
During each test run, data was collected by a Cascade, semi-ruggedized, portable computer with a 100 MHz. Pentium microprocessor running the DACS data acquisition software developed by the National Highway Traffic Safety Administration’s (NHTSA) Vehicle Research and Test Center (VRTC). Signals from all of the transducers listed in Table 4.1 were conditioned using Analog Devices 3B signal conditioners and then digitized at a rate of 50 or 100 samples per second per channel using an RTI-815, 12 bit, analog-to-digital converter board. Longer duration tests used the 50 samples per second rate.
Data acquisition was started by the test driver. The data acquisition time duration was maneuver dependent.
12
The signal conditioning performed by the Analog Devices 3B signal conditioners consisted of amplification and filtering. The amplifier gains were selected to maximize the signal-to-noise ratio of the digitized data. Filtering was performed using a two-pole Butterworth filter with the nominal filter breakpoint frequencies (15 Hz.) selected to prevent aliasing. The calculated break point frequencies were 18 and 19 Hz for the first and second pole respectively. A higher cutoff frequency of nominal 1800 Hz (1800 Hz at pole 1 and 1900 Hz at pole 2) was used on the handwheel angle channel in some instances in an effort to minimize the spiking that occurred when the transducer “wrapped” past 360E during the Fishhook tests of some vehicles. A total of three data acquisition systems were used to test the twelve vehicles.
As was previously mentioned, a Labeco performance monitor was placed on top of each vehicle’s dashboard. During the approach to a test course, this performance monitor continuously displayed vehicle speed for the driver. This helped the driver perform each maneuver at a speed very close to the maneuver’s desired initial speed.
13
5.0 Test Maneuvers
5.1 Phase II Test Matrix
After a vehicle had been instrumented, the Phase II Test Matrix was performed for each of the twelve vehicles tested. For all but the second vehicle tested, the Ford Ranger, the Phase II Test Matrix consisted of nine maneuvers. One of the vehicle characterization maneuvers, the Sinusoidal Sweep maneuver, was performed as an “extra” test for the first vehicle tested, the Chevrolet S-10. This test was not performed for the second vehicle tested. After looking at preliminary results for these first two vehicles, a decision was made to perform the Sinusoidal Sweep maneuver for the remaining ten vehicles.
The first four maneuvers that were performed for each test vehicle will be referred to as the Vehicle Characterization Maneuvers. As this name implies, the purpose of these maneuvers was to characterize the vehicle dynamics of each test vehicle. It was thought that Two-Wheel Liftoffs (TWL) or rollover should not occur during the Vehicle Characterization Maneuvers (an none was seen during this research).
The Vehicle Characterization Maneuvers can be subdivided into two types. The first two maneuvers were used to determine each test vehicle’s frequency response function (a frequency response function is a non-linear system’s analog of a transfer function; since a vehicle is not a linear system, it theoretically does not have a transfer function), i.e., to characterize each vehicle’s transient dynamics. The final two were used to measure each test vehicle’s steady-state, lateral, dynamic properties.
Results from two of the Vehicle Characterization Maneuvers (the frequency response function determination maneuvers) were used to customize some of the five Untripped Rollover Propensity Maneuvers. Specifically, the roll angle natural frequency was used to determine the handwheel steering timing for two maneuvers, the Fishhook #1 and the Resonant Steer.
Each of the Vehicle Characterization Maneuvers will be described in detail in the following section of this chapter.
The final five maneuvers that were performed for each test vehicle will be referred to as the Untripped Rollover Propensity Maneuvers. As this name implies, the purpose of these maneuvers was to determine each test vehicle’s untripped rollover propensity.
Each of the Untripped Rollover Propensity Maneuvers will be described in detail in the final section of this chapter.
14

5.2 Test Procedures for the Vehicle Characterization Maneuvers
The first four maneuvers performed for each test vehicle were the Vehicle Characterization maneuvers. The four Vehicle Characterization Maneuvers are:
1. Pulse Steer maneuver. This maneuver collects data due to inputting a short, fairly large, handwheel steering pulse. Fast Fourier transform techniques are then applied to the data to calculate each vehicle’s frequency response function.
For this maneuver, the vehicle is initially driven in a straight line. Starting at time 0.0, the Programmable Steering Machine generates a handwheel steering pulse. For this pulse, the steering handwheel is turned in 0.1 seconds from 0 to either ±80 degrees. Over the next 0.1 seconds, the steering handwheel is then turned back to 0 degrees. The steering handwheel is then held at 0 degrees for the remainder of the test. Figure 5.1 shows the desired steering handwheel angle as a function of time for this maneuver.
80 deg
0.2 sec
TIME
FIGURE 5.1: Pulse Steer Handwheel Input
Note that the values given above are the commanded values that are input to the Programmable Steering Machine. Due to the very large handwheel steering accelerations and velocities (800 degrees per second for ramping up and down, with infinite acceleration required at the peak of the triangular pulse) required to match the desired steering input, the Programmable Steering Machine can not move the steering handwheel through precisely these values. However, Programmable Steering Machine does come fairly close to generating the desired inputs.
HA
ND
WH
EE
L A
NG
LE
15

16
FIGURE 5.2: Handwheel Steering Input for the SinusoidalSweep Maneuver
This maneuver is performed at an initial speed of 50 mph. test driver appliesthe throttle to try to hold the speed constant at 50 mph throughout the maneuver.
This maneuver is performed six times for each vehicle, three times with the initialsteer direction being in each of the left and right directions.
2. Sinusoidal Sweep maneuver. This maneuver collects data due to inputting a fixedamplitude, varying frequency handwheel steering sinusoid. ier transformtechniques are then applied to the data to calculate each vehicle’s frequencyresponse function.
For this maneuver, the vehicle is initially driven in a straight line. Starting at time0.0, the Programmable Steering Machine generates a +80 degree amplitudehandwheel steering sinusoid the frequency of which linearly increases over 9.05seconds from 0.1 to 1.5 Hertz. After 9.05 seconds, the frequency of the handwheelsteering sinusoid linearly decreases during the next 9.05 seconds back to 0.1 Hertz.The test then terminates. gure 5.2 shows the actual steering handwheel angle asa function of time for this maneuver.
This maneuver is performed at an initial speed of 50 mph. The test driver appliesthe throttle to try to hold the speed constant at 50 mph throughout the maneuver.
This maneuver is performed three times for each vehicle.
The
Fast Four
Fi
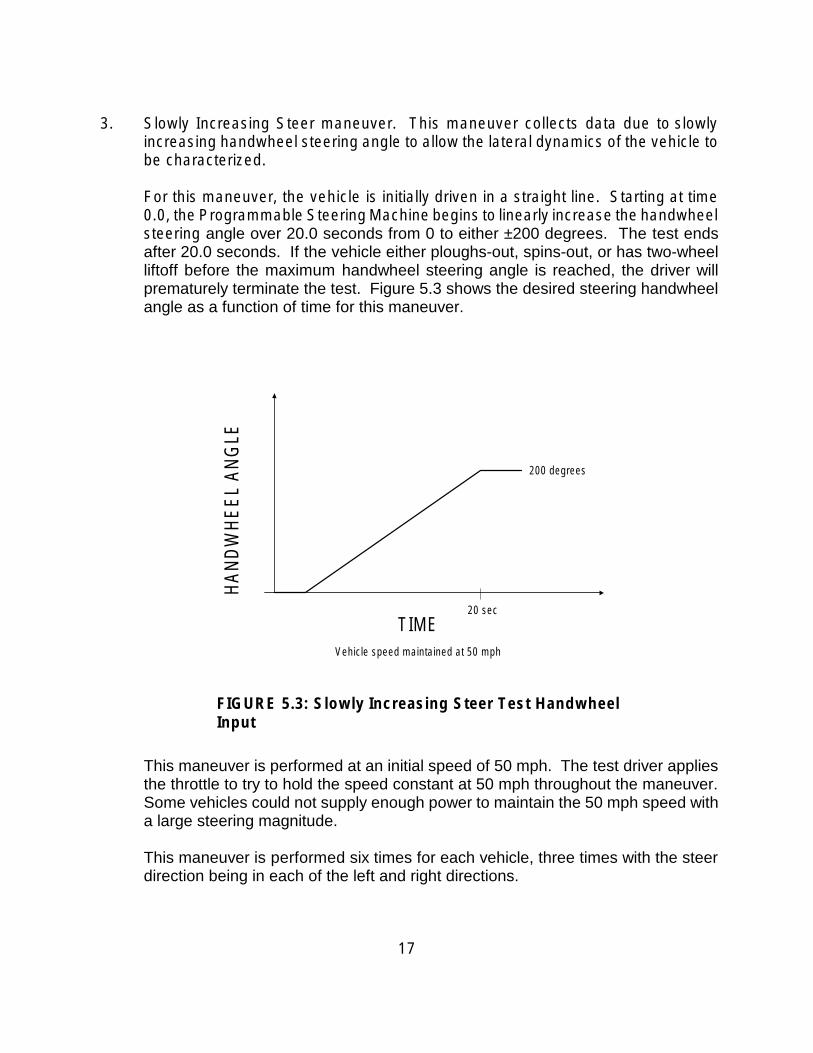
3. Slowly Increasing Steer maneuver. This maneuver collects data due to slowly increasing handwheel steering angle to allow the lateral dynamics of the vehicle to be characterized.
For this maneuver, the vehicle is initially driven in a straight line. Starting at time 0.0, the Programmable Steering Machine begins to linearly increase the handwheel steering angle over 20.0 seconds from 0 to either ±200 degrees. The test ends after 20.0 seconds. If the vehicle either ploughs-out, spins-out, or has two-wheel liftoff before the maximum handwheel steering angle is reached, the driver will prematurely terminate the test. Figure 5.3 shows the desired steering handwheel angle as a function of time for this maneuver.
200 degrees
20 sec
TIME Vehicle speed maintained at 50 mph
FIGURE 5.3: Slowly Increasing Steer Test Handwheel Input
This maneuver is performed at an initial speed of 50 mph. The test driver applies the throttle to try to hold the speed constant at 50 mph throughout the maneuver. Some vehicles could not supply enough power to maintain the 50 mph speed with a large steering magnitude.
This maneuver is performed six times for each vehicle, three times with the steer direction being in each of the left and right directions.
HA
ND
WH
EE
L A
NG
LE
17
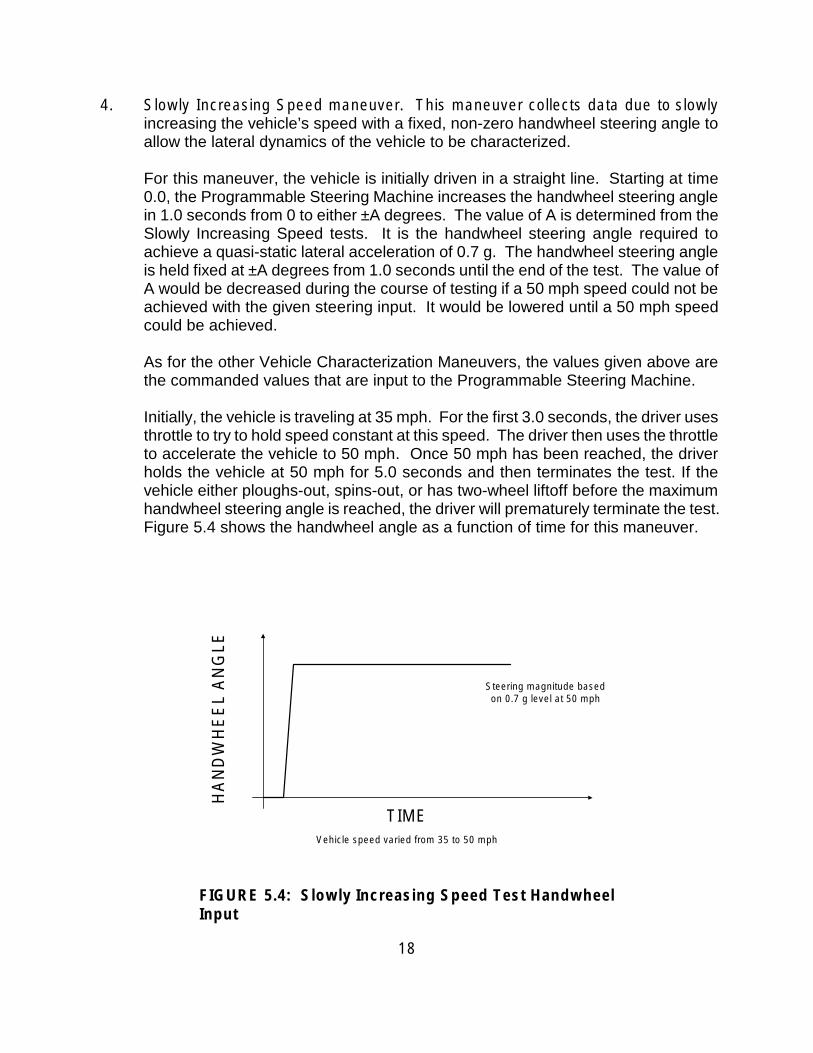
4. Slowly Increasing Speed maneuver. This maneuver collects data due to slowly increasing the vehicle’s speed with a fixed, non-zero handwheel steering angle to allow the lateral dynamics of the vehicle to be characterized.
For this maneuver, the vehicle is initially driven in a straight line. Starting at time 0.0, the Programmable Steering Machine increases the handwheel steering angle in 1.0 seconds from 0 to either ±A degrees. The value of A is determined from the Slowly Increasing Speed tests. It is the handwheel steering angle required to achieve a quasi-static lateral acceleration of 0.7 g. The handwheel steering angle is held fixed at ±A degrees from 1.0 seconds until the end of the test. The value of A would be decreased during the course of testing if a 50 mph speed could not be achieved with the given steering input. It would be lowered until a 50 mph speed could be achieved.
As for the other Vehicle Characterization Maneuvers, the values given above are the commanded values that are input to the Programmable Steering Machine.
Initially, the vehicle is traveling at 35 mph. For the first 3.0 seconds, the driver uses throttle to try to hold speed constant at this speed. The driver then uses the throttle to accelerate the vehicle to 50 mph. Once 50 mph has been reached, the driver holds the vehicle at 50 mph for 5.0 seconds and then terminates the test. If the vehicle either ploughs-out, spins-out, or has two-wheel liftoff before the maximum handwheel steering angle is reached, the driver will prematurely terminate the test. Figure 5.4 shows the handwheel angle as a function of time for this maneuver.
Steering magnitude based on 0.7 g level at 50 mph
TIME Vehicle speed varied from 35 to 50 mph
FIGURE 5.4: Slowly Increasing Speed Test Handwheel Input
HA
ND
WH
EE
L A
NG
LE
18
This maneuver is performed six times for each vehicle, three times with the steer direction being in each of the left and right directions.
5.3 Results From the Vehicle Characterization Tests
Table 5.1 summarizes the results obtained from the Vehicle Characterization Maneuver testing. The leftmost column of this table lists each of the twelve test vehicles.
The next column contains each vehicle’s Overall Steering Ratio. The Overall Steering Ratios were actually not determined from the Vehicle Characterization Maneuver testing. Instead, these values were measured during separate tests in which each vehicle’s front wheel were placed on low-friction, rotating plates (wheel alignment plates). The steering handwheel was then turned through specified amounts and the resulting roadwheel steer rotations recorded. Linear regression fits of this data were then used to determine the Overall Steering Ratio for each vehicle.
The third column of Table 5.1 contain each vehicle’s roll natural frequency as determined from the Pulse Steer Maneuver. For most vehicles the roll natural frequency was not discernable because of a relatively flat spectrum in the low frequency range (no definite resonance peak). These cases are labeled as flat. For those cases with a flat spectrum in the low frequency range, a value of 0.5 Hertz was used for subsequent testing. The 0.5 Hertz lower limit was set somewhat arbitrarily due to concerns about the validity of very low roll natural frequency values. The fourth column is the Roll Natural Frequency Used for Subsequent Testing. A discussion of frequency test results is provided in Chapter 9.0.
The fifth column of Table 5.1 contain each vehicle’s understeer as determined from the Slowly Increasing Steer test. Values for the understeer were calculated as specified in SAE J266 “Steady-State Directional Control Test Procedures For Passenger Cars and Light Trucks” [6] using the linear portion of the curve. The values in Table 5.1 are an average of the left and right steer direction tests. The Slowly Increasing Speed Test did not produce results in the linear range and therefore an understeer value could not be calculated for this maneuver.
The final column shows each vehicle’s Roll Angle to Lateral Acceleration Gain (deg/g). This value was calculated from the Slowly Increasing Steer results. A fifth order polynomial curve fit of the corrected lateral accelerations versus roll angle was calculated. The 0.5 g corrected lateral acceleration curve fit value was used to find the roll angle. This roll angle was then multiplied by 2 (since the 0.5 g level was selected) to determine the Roll Angle to Lateral Acceleration Gain. The values in Table 5.1 are an average of the left and right steer direction tests.
19

Table 5.1: Calculated Results from the Vehicle Characterization Tests
Vehicle Overall
Steering Ratio
Roll Natural Freq. from Pulse
Steer Test (Hz)
Roll Natural Freq. Used for Testing
(Hz)
Understeer from Steering Gain 1 Test
(deg/g)
Roll Angle to Lateral
Accel. Gain (deg/g)
1998 Chevrolet Lumina
15.8 Flat 0.5 5.49
1998 Dodge Neon
18.0 Flat 0.5 3.59
1998 Chevrolet Metro
20.7 Flat 0.5 3.30
1998 Chevrolet C1500
16.4 Flat 0.5 4.49
1998 Chevrolet S-10
17.3 Flat 0.5 4.60
1997 Ford Ranger
20.3 0.8 0.8 4.59
1998 Ford E150 Club Wagon
17.2 Flat 0.5 4.04
1998 Chevrolet Astro
15.4 Flat 0.5 6.13
1998 Dodge Caravan
17.0 Flat 0.5 4.51
1998 Chevrolet Tahoe
16.2 Flat 0.5 5.06
1998 Ford Explorer
18.6 Flat 0.5 2.89
1998 Chevrolet Tracker
20.2 Flat 0.5 3.52
5.98
6.31
7.15
5.36
6.16
4.27
5.75
8.18
5.38
6.74
5.15
7.2
5.4 Test Procedures for Untripped Rollover Propensity Determination Maneuvers
The final five maneuvers were the Untripped Rollover Propensity Maneuvers. The five Untripped Rollover Propensity Maneuvers are:
20

1. J-Turn (without pulse braking) maneuver. This maneuver determines vehicle rollover propensity by suddenly making a large turn. Following the sudden turn, the steering handwheel is held fixed for the remainder of the test. This maneuver models, in an extreme way, what might happen when a driver initiates a severe turn (such as onto a cloverleaf ramp). According to [7], the handwheel steering angles and rates used are, while extreme, within the capabilities of drivers.
For this maneuver, the vehicle is initially driven in a straight line. Starting at time 0.0, the Programmable Steering Machine turns the steering handwheel in 0.33 seconds from 0 to ±330 degrees. The steering handwheel is then held at 330 degrees for the remaining 4.67 seconds of the test. Figure 5.5 shows the desired steering handwheel angle as a function of time for this maneuver.
This maneuver is performed at initial speeds ranging from 36 to 60 mph. The test driver releases the throttle after the steering input has been applied (i.e., he does not attempt to hold the vehicle’s speed constant during the test).
Initial speed is used as a severity parameter for this maneuver. The initial speed is increased from run-to-run from 36 to 60 mph in approximately 2 mph increments (unless a termination condition occurs). Two series of tests are conducted one with the initial turn direction to the left and one with it to the right.
2. J-Turn With Pulse Braking maneuver. This maneuver determines vehicle rollover propensity by suddenly making a large turn which is followed by pulse braking. This maneuver models what might happen when a driver sharply brakes for a short period of time shortly after initiating a severe turn.
For this maneuver, the steering handwheel inputs are identical to those of the J-Turn (without pulse braking) maneuver. Figure 5.5 again shows the desired steering handwheel angle as a function of time for this maneuver.
The maneuver differs from the J-Turn in that approximately 1.0 seconds after the completion of handwheel steering motion, the brake pedal is sharply pulsed. The Vehicle Research and Test Center does not have a machine that can provide a consistent pulse to the brake pedal, therefore, this input is generated by the test driver. The driver’s instructions are to depress the brake pedal with approximately 200 pounds force a rapidly as possible and then immediately release the pedal. Figure 5.6 shows the desired brake pedal force as a function of time for this maneuver. The test driver practiced pulsing the brake pedal before testing any vehicles for this program. To assist the driver, a buzzer is set to sound at the time when pulse braking is to be initiated.
21

Bra
ke P
edal
For
ce
HA
ND
WH
EE
L A
NG
LE
330 degrees
1000 deg/sec
0.33 5
TIME (sec)
FIGURE 5.5: J-Turn and J-Turn with Pulse Brake Handwheel Input
Approximately 200 lbf
Applied 1 second after 330 degrees reached.
TIME
FIGURE 5.6: J-Turn with Pulse Braking - Pulse Shape
22

If a test vehicle had ABS brakes, they were kept operational for this maneuver. This differs from past practice in which ABS brakes were disabled for maneuvers involving pulse braking.
This maneuver is performed at initial speeds ranging from 36 to 60 mph. The test driver applies the throttle to try to hold the speed constant at desired initial speed until the pulse brake application at which point the throttle is released.
Initial speed is used as a severity parameter for this maneuver. The initial speed is increased from run-to-run from 36 to 60 mph in approximately 4 mph increments (unless a termination condition occurs). Two series of tests are conducted one with the initial turn direction to the left and one with it to the right.
3. Fishhook #1 maneuver. This maneuver attempts to induce two-wheel liftoff or rollover at a lower lateral acceleration than the J-Turn by suddenly making a large turn and then turning back even farther in the opposite direction. Following the second turn, the steering handwheel is held fixed for the remainder of the test. This maneuver models, in an extreme way, what might happen when a driver performs a double lane change or two-wheels off-road recovery maneuver. According to [7], the handwheel steering angles and rates used are, while extreme, within the capabilities of drivers.
The fishhook maneuver was originally developed by Toyota Motor Corporation. It is fully described in Toyota Engineering Standard TS-A1544 [8].
This maneuver, as performed by Toyota and by the Vehicle Research and Test Center during Phases I-A and I-B of the Light Vehicle Research Program, used driver generated handwheel steering inputs. However, the handwheel steering inputs for the current research were generated by the Programmable Steering Machine. The Programmable Steering machine does not comprehend instructions such as “Turn a quickly as possible to 270 degrees.” Therefore, the authors had to translate the handwheel steering input for the fishhook into a precisely defined handwheel steer angle as a function of time.
There are many possible ways to translate the handwheel steering input for the fishhook into a precisely defined handwheel steer angle as a function of time. The author’s goal when developing the handwheel steer angle as a function of time for the Fishhook #1 maneuver was to select a function that (1) approximately matched many of the steering handwheel angle versus time traces that were measured during the Phases I-A and I-B testing and that (2) would, in the judgement of the authors, result in two-wheel liftoff or rollover at the lowest possible speed.
23
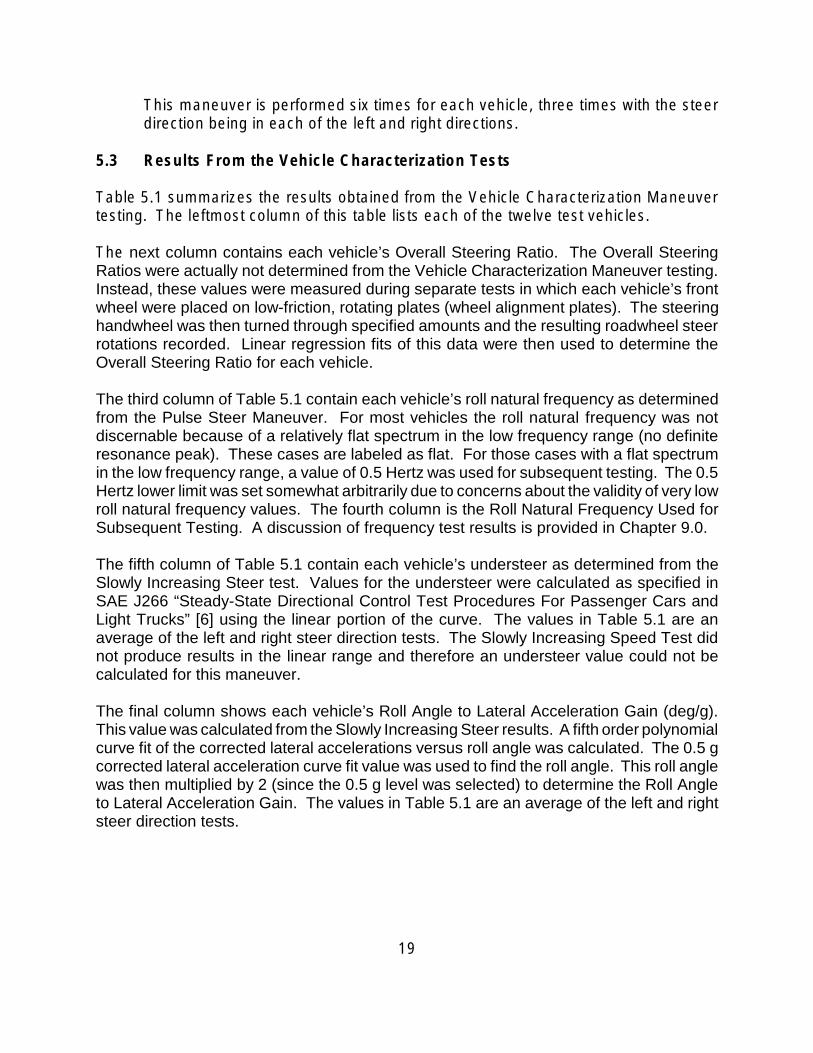
Figure 5.7 shows the desired steering handwheel angle as a function of time for the Fishhook #1 maneuver while Table 5.2 lists the desired steering handwheel angles at specified instants in time. Note that selected times used in this maneuver are chosen according to the roll natural frequency of the vehicle being tested.
HA
ND
WH
EE
L A
NG
LE
270 deg
600 deg
TIME
Steering Rates Based on Roll Natural Frequency
FIGURE 5.7: Fishhook #1 Handwheel Input
Table 5.2: Value of Handwheel Steering Angle at Selected Instants for the Fishhook #1 Maneuver
Time (sec) Handwheel Angle (deg)
0.000
B � 0.125
B � 0.125
2 � B
0.0
270.0
270.0
0.0
2 � B � 0.80 -600.0
5.000 (End of Test)
-600.0
24
Time B is one-fourth of the inverse of the vehicle’s roll angle natural frequency (in Hertz) that was determined during the frequency response measurement testing.
This maneuver is performed with entrance speeds ranging from 34 to 50 mph. The test driver releases the throttle at the beginning of the test (i.e., he does not attempt to hold the vehicle’s speed constant during the test).
Initial speed is used as a severity parameter for this maneuver. The initial speed is increased from run-to-run from 34 to 50 mph in approximately 2 mph increments (unless a termination condition occurs). Two series of tests are conducted: one with the initial turn direction to the left and one to the right.
4. Fishhook #2 maneuver. As with Fishhook #1, this maneuver attempts to induce two-wheel liftoff or rollover at a lower lateral acceleration than the J-Turn by suddenly making a large turn and then turning back even farther in the opposite direction. Following the second turn, the steering handwheel is held fixed for the remainder of the test. Although the motivation of the two fishhook maneuvers is identical, the steering movements of Fishhook #2 differ from those used in Fishhook #1 in several subtle ways.
Fishhook #2 is designed to approximate a driver’s steering response during a two-wheel off road recovery maneuver based on research conducted by the Texas Transportation Institute (TTI) [8]. Rather than using a fixed 270 degree initial steering input as specified Toyota Engineering Standard TS-A1544, Fishhook #2 utilizes an initial steering angle of 7.5 times the Overall Steering Ratio of a given vehicle. The timing of the steering reversal is also different from that used in the Fishhook #1 maneuver, as all handwheel rates for Fishhook #2 are 500 degrees per second.
Figure 5.8 shows the desired steering handwheel angle as a function of time for the Fishhook #2 maneuver while Table 5.3 lists the desired steering handwheel angles at specified instants in time.
25
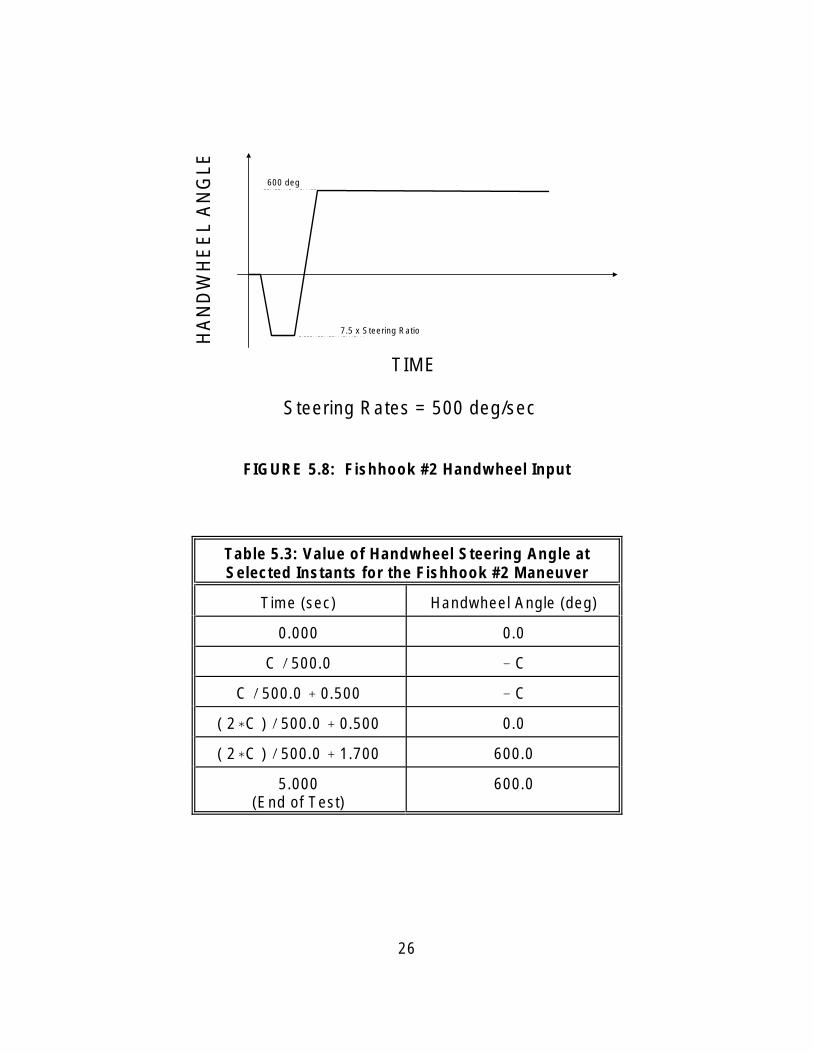
HA
ND
WH
EE
L A
NG
LE
7.5 x Steering Ratio
600 deg
TIME
Steering Rates = 500 deg/sec
FIGURE 5.8: Fishhook #2 Handwheel Input
Table 5.3: Value of Handwheel Steering Angle at Selected Instants for the Fishhook #2 Maneuver
Time (sec) Handwheel Angle (deg)
0.000
C � 500.0
C � 500.0 � 0.500
( 2�C ) � 500.0 � 0.500
( 2�C ) � 500.0 � 1.700
5.000 (End of Test)
0.0
� C
� C
0.0
600.0
600.0
26
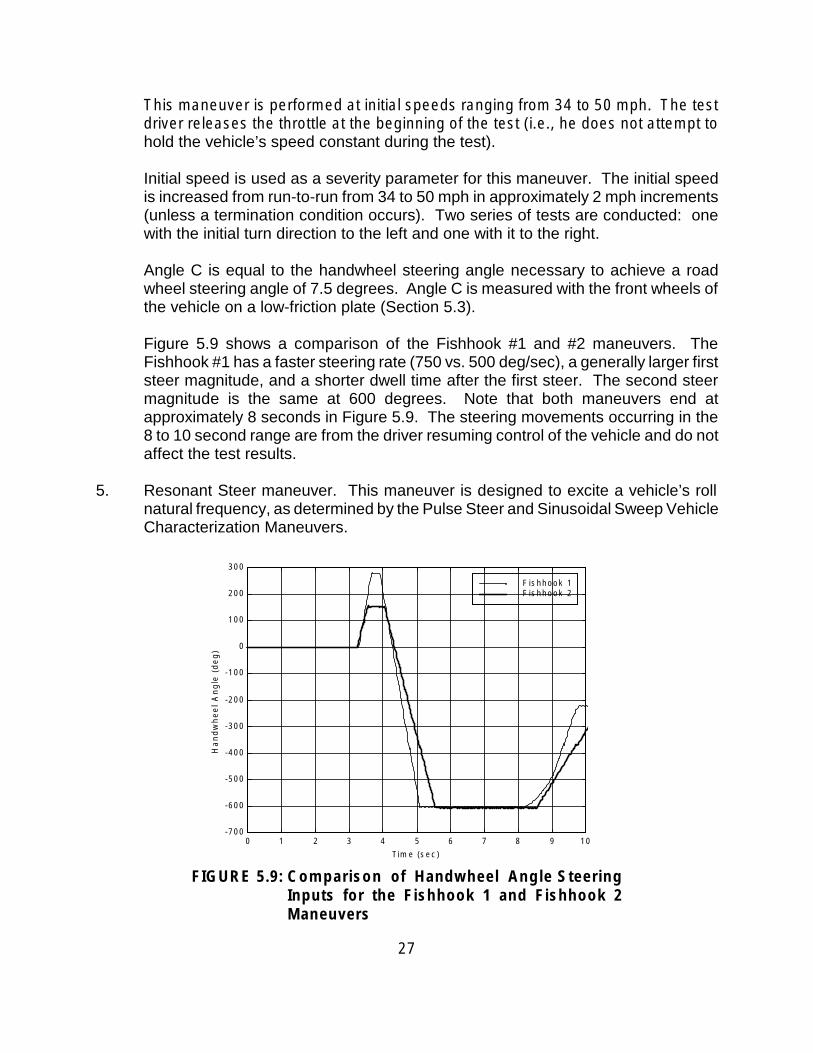
This maneuver is performed at initial speeds ranging from 34 to 50 mph. The test driver releases the throttle at the beginning of the test (i.e., he does not attempt to hold the vehicle’s speed constant during the test).
Initial speed is used as a severity parameter for this maneuver. The initial speed is increased from run-to-run from 34 to 50 mph in approximately 2 mph increments (unless a termination condition occurs). Two series of tests are conducted: one with the initial turn direction to the left and one with it to the right.
Angle C is equal to the handwheel steering angle necessary to achieve a road wheel steering angle of 7.5 degrees. Angle C is measured with the front wheels of the vehicle on a low-friction plate (Section 5.3).
Figure 5.9 shows a comparison of the Fishhook #1 and #2 maneuvers. The Fishhook #1 has a faster steering rate (750 vs. 500 deg/sec), a generally larger first steer magnitude, and a shorter dwell time after the first steer. The second steer magnitude is the same at 600 degrees. Note that both maneuvers end at approximately 8 seconds in Figure 5.9. The steering movements occurring in the 8 to 10 second range are from the driver resuming control of the vehicle and do not affect the test results.
5. Resonant Steer maneuver. This maneuver is designed to excite a vehicle’s roll natural frequency, as determined by the Pulse Steer and Sinusoidal Sweep Vehicle Characterization Maneuvers.
300
200
100
0
F is hho ok 1 F is hho ok 2
Ha
nd
wh
ee
l A
ng
le (
de
g)
-100
-200
-300
-400
-500
-600
-700 0 1 2 3 4 5 6 7 8 9 10
Tim e (sec )
FIGURE 5.9: Comparison of Handwheel Angle Steering Inputs for the Fishhook 1 and Fishhook 2 Maneuvers
27
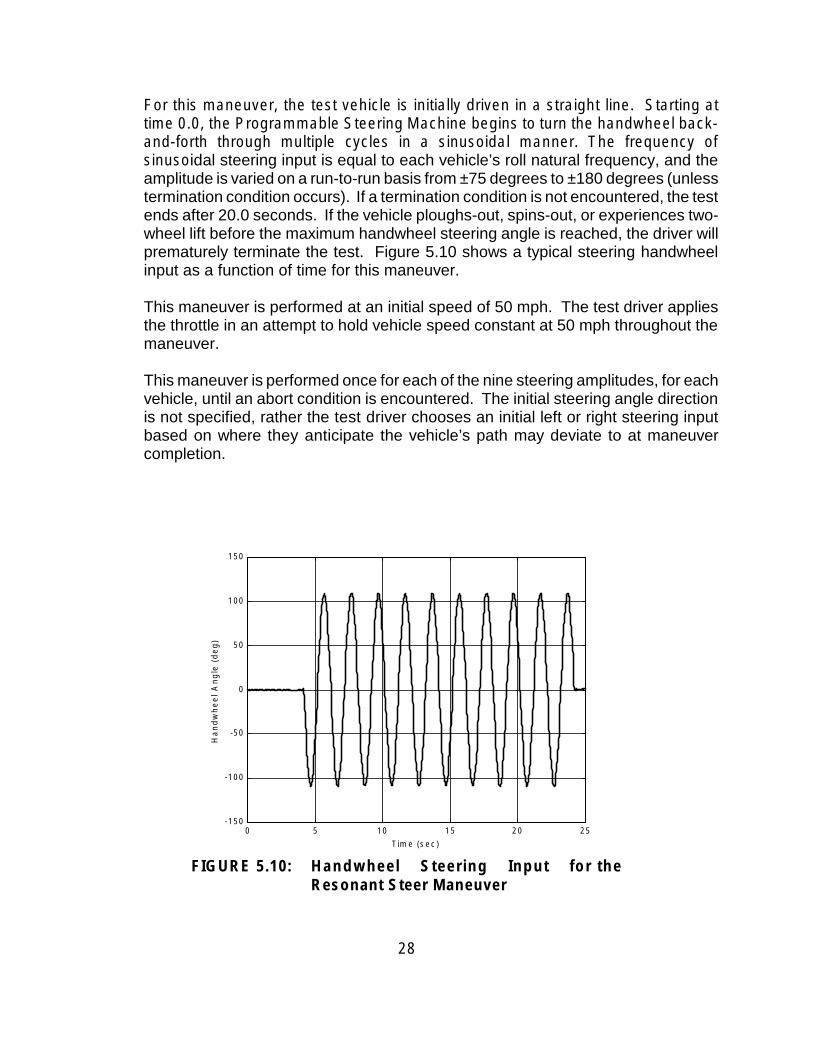
For this maneuver, the test vehicle is initially driven in a straight line. Starting at time 0.0, the Programmable Steering Machine begins to turn the handwheel back-and-forth through multiple cycles in a sinusoidal manner. The frequency of sinusoidal steering input is equal to each vehicle’s roll natural frequency, and the amplitude is varied on a run-to-run basis from ±75 degrees to ±180 degrees (unless termination condition occurs). If a termination condition is not encountered, the test ends after 20.0 seconds. If the vehicle ploughs-out, spins-out, or experiences two-wheel lift before the maximum handwheel steering angle is reached, the driver will prematurely terminate the test. Figure 5.10 shows a typical steering handwheel input as a function of time for this maneuver.
This maneuver is performed at an initial speed of 50 mph. The test driver applies the throttle in an attempt to hold vehicle speed constant at 50 mph throughout the maneuver.
This maneuver is performed once for each of the nine steering amplitudes, for each vehicle, until an abort condition is encountered. The initial steering angle direction is not specified, rather the test driver chooses an initial left or right steering input based on where they anticipate the vehicle’s path may deviate to at maneuver completion.
150
100
50
0
-50
-100
-150 0 5 10 15 20 25
Tim e (sec )
5.10: Handwheel Steering Input for FIGURE the Resonant Steer Maneuver
Ha
nd
wh
ee
l A
ng
le (
de
g)
28
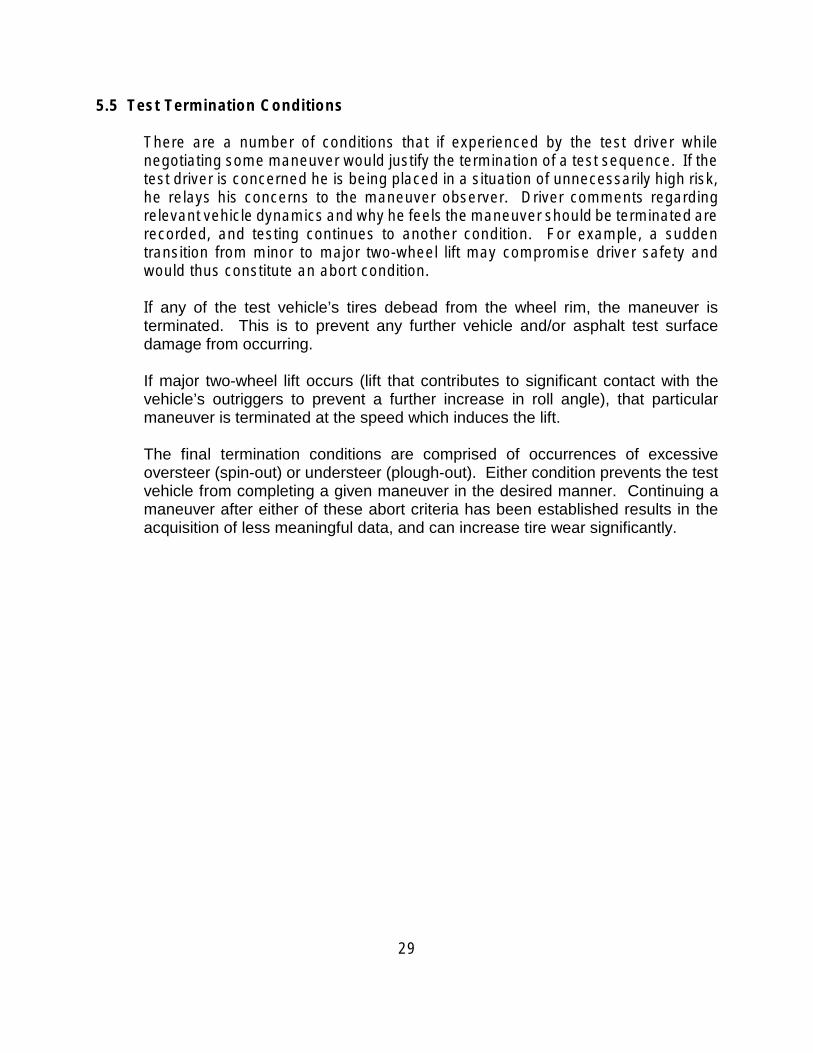
5.5 Test Termination Conditions
There are a number of conditions that if experienced by the test driver while negotiating some maneuver would justify the termination of a test sequence. If the test driver is concerned he is being placed in a situation of unnecessarily high risk, he relays his concerns to the maneuver observer. Driver comments regarding relevant vehicle dynamics and why he feels the maneuver should be terminated are recorded, and testing continues to another condition. For example, a sudden transition from minor to major two-wheel lift may compromise driver safety and would thus constitute an abort condition.
If any of the test vehicle’s tires debead from the wheel rim, the maneuver is terminated. This is to prevent any further vehicle and/or asphalt test surface damage from occurring.
If major two-wheel lift occurs (lift that contributes to significant contact with the vehicle’s outriggers to prevent a further increase in roll angle), that particular maneuver is terminated at the speed which induces the lift.
The final termination conditions are comprised of occurrences of excessive oversteer (spin-out) or understeer (plough-out). Either condition prevents the test vehicle from completing a given maneuver in the desired manner. Continuing a maneuver after either of these abort criteria has been established results in the acquisition of less meaningful data, and can increase tire wear significantly.
29
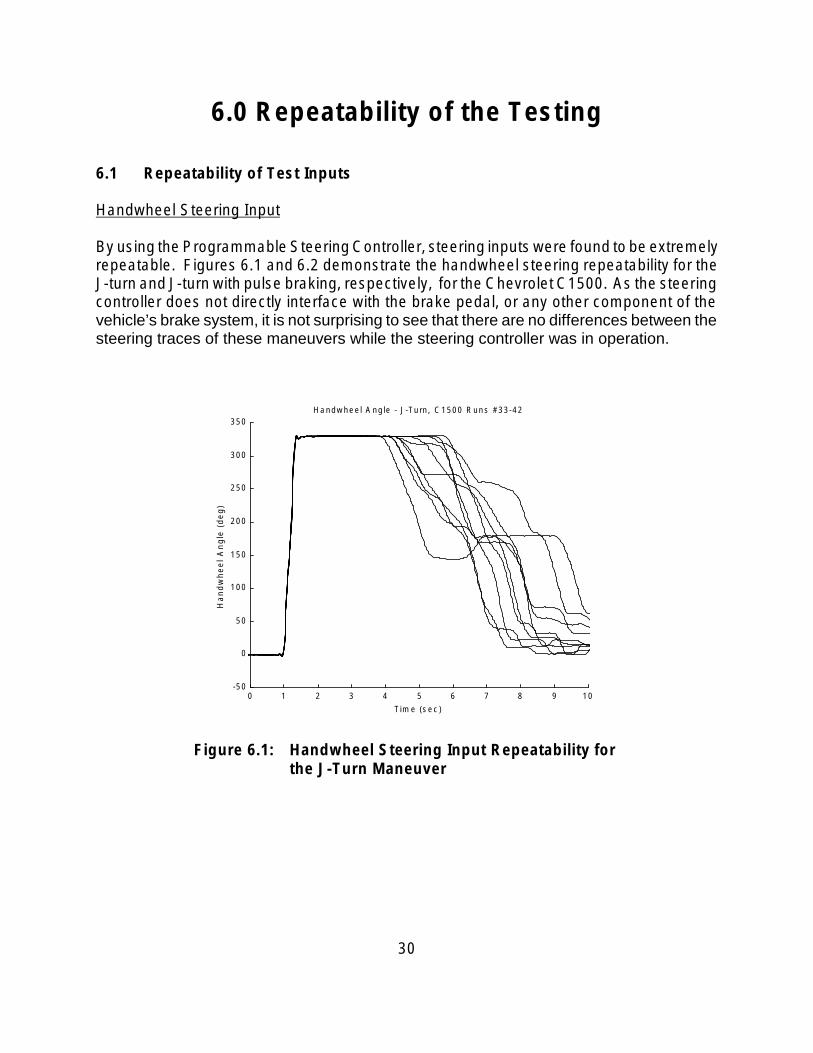
6.0 Repeatability of the Testing
6.1 Repeatability of Test Inputs
Handwheel Steering Input
By using the Programmable Steering Controller, steering inputs were found to be extremely repeatable. Figures 6.1 and 6.2 demonstrate the handwheel steering repeatability for the J-turn and J-turn with pulse braking, respectively, for the Chevrolet C1500. As the steering controller does not directly interface with the brake pedal, or any other component of the vehicle’s brake system, it is not surprising to see that there are no differences between the steering traces of these maneuvers while the steering controller was in operation.
Handwheel A ngle - J-Turn, C1500 Runs #33-42 350
300
250
200
150
100
50
0
-50 0 1 2 3 4 5 6 7 8 9 10
Tim e (sec )
Figure 6.1: Handwheel Steering Input Repeatability for the J-Turn Maneuver
Ha
nd
wh
ee
l A
ng
le (
de
g)
30

The steering controller was used for directional control of the vehicle from time zero until approximately 3.5 seconds in Figures 6.1 and 6.2. After this time, where steering variability increases dramatically, the maneuver had been completed and the driver had regained control of the vehicle’s steering. Also noteworthy are the small “bumps” just prior to the zero-to-330 degree transition, and just after the handwheel angle has reached 330 degrees. These bumps are the result of the 6 Hz filter used for data processing. They did not actually occur in the test maneuvers.
Figures 6.3 and 6.4, respectively, demonstrate the handwheel steering repeatability for Fishhook Maneuvers #1 and #2 for the Chevrolet Tracker. Although it is impossible to see in the figures, steering traces of six Fishhook #1s and nine Fishhook #2s are represented. This clearly shows how repeatable the handwheel inputs were for these maneuvers using the steering controller. Note that the actual maneuvers had ended prior to the beginning of the handwheel’s return to zero degrees. An additional command was added to the controller’s fishhook control algorithms to return the handwheel to zero as a convenience for the test driver, and should not be interpreted as an important component of the Fishhook #1 or #2 maneuver.
Ha
nd
wh
ee
l A
ng
le (
de
g)
350
300
250
200
150
100
50
0
-50
Handwheel A ngle - J-Turn w/ P ulse B rake, C1500 Runs #54-63
0 1 2 3 4 5 6 7 8 9 10
Tim e (sec )
Figure 6.2: Handwheel Steering Input Repeatability for the J-Turn with Pulse Braking Maneuver
31

Handwheel A ngle - F is hhook #1, Tracker Runs #27-32 700
600
500
400
300
200
100
0
-100
-200
-300 0 1 2 3 4 5 6 7 8 9 10
Tim e (sec )
Figure 6.3: Handwheel Steering Input Repeatability for the Fishhook #1 Maneuver
Handwheel A ngle - F is hhook #2, Tracker Runs #45-53 700
600
500
400
300
200
100
0
-100
-200 0 1 2 3 4 5 6 7 8 9 10
Tim e (sec )
Figure 6.4: Handwheel Steering Input Repeatability for the Fishhook #2 Maneuver
Ha
nd
wh
ee
l A
ng
le (
de
g)
Ha
nd
wh
ee
l A
ng
le (
de
g)
32

Figure 6.5 demonstrates the handwheel steering repeatability of the Resonant Steer Maneuver for the Dodge Caravan. The figure shows the eight steering magnitudes specified for use in the maneuver (ranging from 75 to 180 degrees), each conducted at the roll natural frequency of the vehicle (0.5 Hz). As with the J-Turn and Fishhook maneuvers, handwheel angles governed by the steering controller were very consistent.
Handwheel A ngle - Resonant S teer, Caravan Runs #49-56 250
200
150
100
50
0
-50
-100
-150
-200
-250 0 1 2 3 4 5 6 7 8 9 10
Tim e (sec )
Figure 6.5: Handwheel Steering Input Repeatability for the Resonant Steer Maneuver
Brake Pedal Force Application
Although the handwheel angle inputs were very repeatable due to the use of the steering controller, no such device was available for brake pedal force application. As a result, the test driver-controlled brake pedal inputs used in the J-Turn with pulse braking maneuver were much less consistent than the handwheel inputs. Figure 6.6 demonstrates the brake pedal input repeatability of ten applications for the J-Turn with pulse braking with the Dodge Caravan.
Ha
nd
wh
ee
l A
ng
le (
de
g)
33
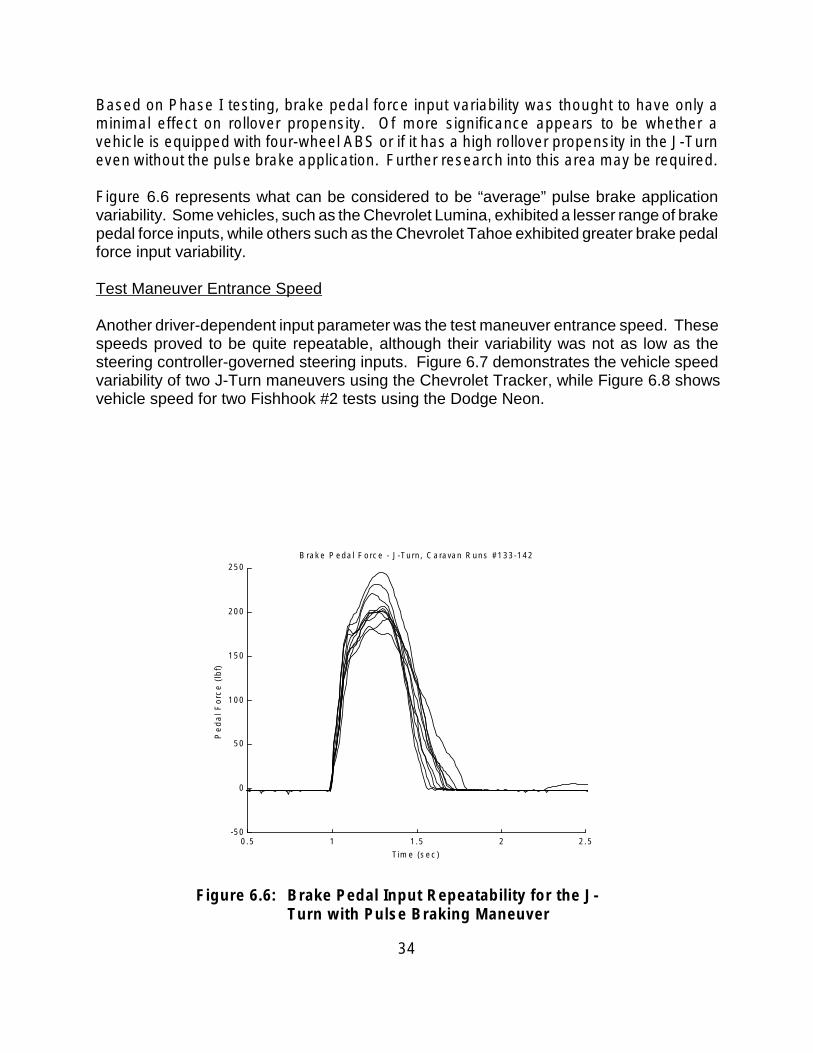
Based on Phase I testing, brake pedal force input variability was thought to have only a minimal effect on rollover propensity. Of more significance appears to be whether a vehicle is equipped with four-wheel ABS or if it has a high rollover propensity in the J-Turn even without the pulse brake application. Further research into this area may be required.
Figure 6.6 represents what can be considered to be “average” pulse brake application variability. Some vehicles, such as the Chevrolet Lumina, exhibited a lesser range of brake pedal force inputs, while others such as the Chevrolet Tahoe exhibited greater brake pedal force input variability.
Test Maneuver Entrance Speed
Another driver-dependent input parameter was the test maneuver entrance speed. These speeds proved to be quite repeatable, although their variability was not as low as the steering controller-governed steering inputs. Figure 6.7 demonstrates the vehicle speed variability of two J-Turn maneuvers using the Chevrolet Tracker, while Figure 6.8 shows vehicle speed for two Fishhook #2 tests using the Dodge Neon.
B rake P edal Force - J-Turn, Caravan Runs #133-142 250
200
150
100
50
0
-50 0.5 1 1.5 2 2.5
Tim e (sec )
Figure 6.6: Brake Pedal Input Repeatability for the J- Turn with Pulse Braking Maneuver
Pe
da
l F
orc
e (l
bf)
34

V ehic le S peed - J-Turn, Tracker Runs #109,114 60
50
40
30
20
10
0
-10 0 1 2 3 4 5 6 7 8 9 10
Tim e (sec )
Ve
hic
le S
pe
ed
(m
ph
) V
eh
icle
Sp
ee
d (
mp
h)
Figure 6.7: Vehicle Speed Repeatability for Two J-Turn
50
45
40
35
30
25
20
15
Tests
V ehic le S peed - F ishhook #2, Neon Runs #138,147
0 1 2 3 4 5 6 7 8 9 10
Tim e (sec )
Figure 6.8: Vehicle Speed Repeatability for TwoFishhook #2 Tests
35

Figures 6.7 and 6.8 only provide data from two tests each. It is important to recognize that Phase II testing was not designed to study the variability of input parameters such as maneuver entrance speed. Only a limited number of tests were repeated at the same speed, usually because the maneuver observers were not certain as to whether two-wheel lift had occurred during a particular run. For this reason a more detailed investigation into maneuver entrance speed is not possible.
6.2 Repeatability of Test Outputs
For the previously stated reasons, Phase II testing was not designed to investigate test variability. However, based on limited data, Phase II test outputs appear to be quite repeatable. Figure 6.9 provides the corrected lateral accelerations for two Ford Ranger J-Turn tests. Both tests were conducted at nearly the same initial speeds, and neither had front or rear wheel lift. The greatest difference between the two tests occurred between 6.0 and 6.5 seconds from time zero, however the actual maneuver had ended by this time, and the lateral acceleration variability was most likely the result of slightly different driver post test inputs.
0.4
0.2
0
-0.2
-0.4
-0.6
-0.8
-1
Co
rre
cte
d L
ate
ral
Ac
ce
lera
tio
n (
g)
Correc ted Lateral A ccelerat ion- J-Turn, Ranger Runs #164,165
0 1 2 3 4 5 6 7 8 9 10
Tim e (sec )
Figure 6.9: Corrected Lateral Acceleration Repeatabilityfor Two J-Turn Tests
36
Roll A ngle- J-Turn, Ranger Runs #164,165 6
5
4
3
2
1
0
-1 0 1 2 3 4 5 6 7 8 9 10
Tim e (sec )
Figure 6.10: Roll Angle Repeatability for Two J-Turn Tests
Figure 6.10 provides the roll angles for the same J-Turn tests presented in Figure 6.9. Once again, the outputs are very consistent, and differ significantly only after maneuver completion.
Figure 6.11 provides the corrected lateral accelerations for two Fishhook #2 tests using the Chevrolet Tracker. Both tests were conducted at the same initial speeds, and both had minor two wheel lift. As with the J-Turn tests described in Figure 6.9, the greatest difference between the lateral accelerations occurred after the completion of the actual maneuver, and this variability was most likely the result of slightly different driver post test inputs.
Figure 6.12 provides the roll angles for the same Fishhook #2 tests presented in Figure 6.11. Once again, the outputs are very consistent, even after maneuver completion.
The output figures presented in section 6.2 likely represent “best cases.” These tests were run one after another, conducted on the same pavement, at the same temperature, humidity, etc. This fact also effected the lack of significant tire wear between tests–the run-to-run tire wear for the presented cases was minimal. It should be recognized, however, that the outputs from the same vehicles and maneuvers, under different conditions, may yield somewhat different results. Some of these sensitivities were studied in Phase I testing, while others may require further study.
Ro
ll A
ng
le (
de
gre
es
)
37
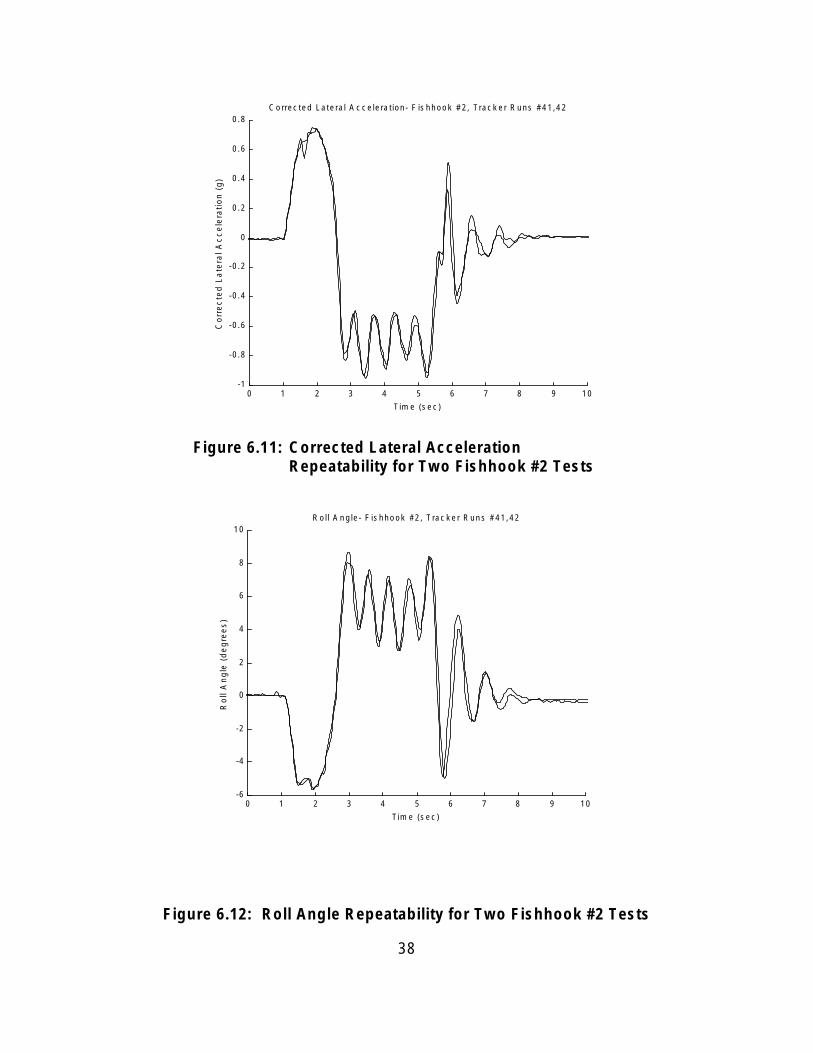
Correc ted Lateral A c celeration- F is hhook #2, Track er Runs #41,42 0.8
0.6
0.4
0.2
0
-0.2
-0.4
-0.6
-0.8
-1 0 1 2 3 4 5 6 7 8 9 10
Tim e (sec )
Figure 6.11: Corrected Lateral Acceleration Repeatability for Two Fishhook #2 Tests
Roll A ngle- Fishhook #2, Trac ker Runs #41,42 10
8
6
4
2
0
-2
-4
-6 0 1 2 3 4 5 6 7 8 9 10
Tim e (sec )
Ro
ll A
ng
le (
de
gre
es
) C
orr
ec
ted
La
tera
l A
cc
ele
rati
on
(g
)
Figure 6.12: Roll Angle Repeatability for Two Fishhook #2 Tests
38

7.0 Results From the UntrippedRollover Propensity
Determination Maneuvers
This section of the report summarizes results from the Phase II testing. No analyses of these results is contained in this section; the analyses of this data are contained in Chapters 8.0 and 9.0 of this report.
7.1 Categories of Two-Wheel Lift
Due to the outriggers, the test vehicles could not actually roll over during the Phase II testing. Therefore, simultaneous lift by both of the wheels on a side of a vehicle was used as an indicator of possible impending rollover.
The two-wheel lifts that were observed during this testing varied in their severity. For reporting and analysis purposes, the lifts that occurred were classified into three categories, Minor, Moderate, and Major two-wheel lift.
Minor two-wheel lift occurs when both wheels depart from the roadway for only short period of time (a fraction of a second) and the lower of the two wheels has a maximum lift of less than two inches off of the road. Theoretically, low two-wheel lift could occur for a relatively long period, however, due the oscillations of the vehicle that were seen during testing, this situation did not happen during this testing.
Frequently, Minor two-wheel lift cannot be detected by either the test driver or by test observers. Careful, frame-by-frame, analysis of videotapes of the testing may well be necessary to determine whether Minor two-wheel lift occurred.
Major two-wheel lift occurs when the wheels go so far off of the roadway that the vehicle is caught by the outriggers. If no outriggers were present, the vehicle might well have rolled over. Typically, the Phase II test vehicles first had two-wheel lift at approximately nine to ten degrees of roll angle. Although there were some exceptions due to vehicle geometry, the outriggers were set so as to hit the roadway at a vehicle roll angle of approximately twenty degrees. Major two-wheel lift can always be easily detected by the test driver and test observers.
Moderate two-wheel lift is defined as more than Minor but less than Major two-wheel lift. Moderate two-wheel lift can always be detected by the test driver and test observers.
39
Clearly, Major two-wheel lift is the only category that could, without outriggers or rapid driver counter steering, directly result in rollover. However, at least for some vehicles, Minor two-wheel lift is expected to progress to Moderate and then to Major as a maneuver severity parameter, such as initial speed, is increased.
7.2 Summary of Untripped Rollover Propensity Testing Results
Tables 7.1 through 7.5 summarize test results for the five maneuvers that are used to determine each vehicle’s untripped rollover propensity. One table summarizes the results for each maneuver with Table 7.1 containing results from the J-Turn (without pulse braking), Table 7.2 showing results from the J-Turn With Pulse Braking, Table 7.3 presenting results from Fishhook #1, Table 7.4 summarizing results from Fishhook #2, and Table 7.5 containing results from the Resonant Steer.
The leftmost column of each table lists each test vehicle. Table 7.2, the J-Turn With Pulse Braking table then has a column showing whether the vehicle had four-wheel ABS (4WAL), rear-wheel only ABS (RWAL), or no ABS (None). For all of the maneuvers except the Resonant Steer, two separate sets of columns then summarize maneuvers for which the steering handwheel was first turned to the right and to the left. Only one set of columns is present for the Resonant Steer maneuver. Each set of columns consists of one column that contains the maximum value of the maneuver severity parameter (for all maneuvers except the Resonant Steer this is the speed, for the Resonant Steer maneuver it is the amplitude of the sinusoidal steering) and one column that shows the limit result, i.e., what the vehicle did at the highest value of the maneuver severity parameter. The limit results are either the category of two-wheel lift if two-wheel lift was observed by the test observers for that vehicle/maneuver, Oversteer if control of the vehicle was lost due to excessive yaw or a spin-out, Understeer if control of the vehicle was lost due to excessive ploughing of the front wheels, Debeading if testing was stopped due to tire debeading, Tire Problems if testing was terminated due to tire damage other than debeading, or Driver Safety if testing was halted due to test safety concerns. If minor two-wheel lift occurred, but was not the main reason for stopping, then it is listed secondarily. Due to their short duration and small magnitude, some minor two-wheel lifts were not detected by the test observes when they actually occurred. As a result, a limit condition was not recognized, and testing continued until a more apparent two-wheel lift (or some other limit result) occurred.
Table 7.6 summarizes the two-wheel lifts that occurred with the four maneuvers that produced two-wheel lift (Resonant Steer did not produce any two-wheel lifts). The leftmost column of this table lists each test vehicle. The next column shows whether the vehicle had 4WAL, RWAL, or no ABS. The final eight columns list the most severe category of two-wheel lift that occurred for each vehicle/maneuver/direction combination as determined by frame-by-frame videotape analysis.
40
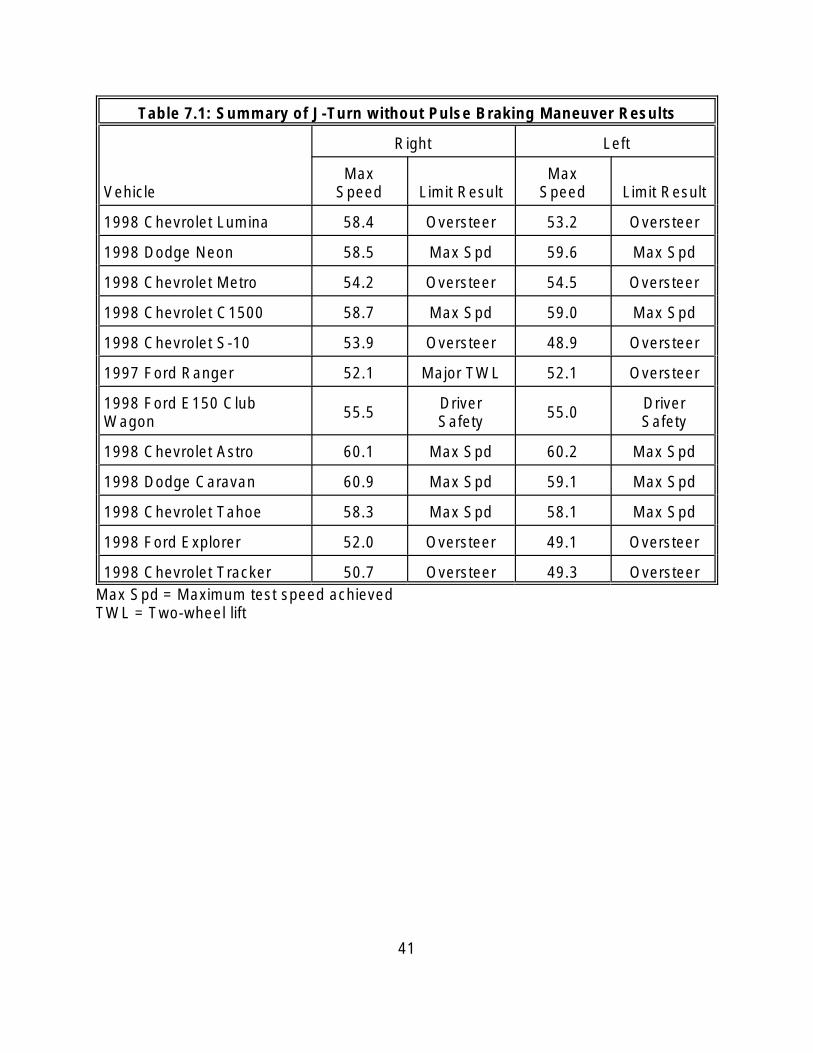
Table 7.1: Summary of J-Turn without Pulse Braking Maneuver Results
Vehicle
Right Left
Max Speed Limit Result
Max Speed Limit Result
1998 Chevrolet Lumina
1998 Dodge Neon
1998 Chevrolet Metro
1998 Chevrolet C1500
1998 Chevrolet S-10
1997 Ford Ranger
1998 Ford E150 Club Wagon
1998 Chevrolet Astro
1998 Dodge Caravan
1998 Chevrolet Tahoe
1998 Ford Explorer
1998 Chevrolet Tracker
58.4
58.5
54.2
58.7
53.9
52.1
55.5
60.1
60.9
58.3
52.0
50.7
Oversteer
Max Spd
Oversteer
Max Spd
Oversteer
Major TWL
Driver Safety
Max Spd
Max Spd
Max Spd
Oversteer
Oversteer
53.2 Oversteer
59.6 Max Spd
54.5 Oversteer
59.0 Max Spd
48.9 Oversteer
52.1 Oversteer
55.0 Driver Safety
60.2 Max Spd
59.1 Max Spd
58.1 Max Spd
49.1 Oversteer
49.3 Oversteer Max Spd = Maximum test speed achieved TWL = Two-wheel lift
41
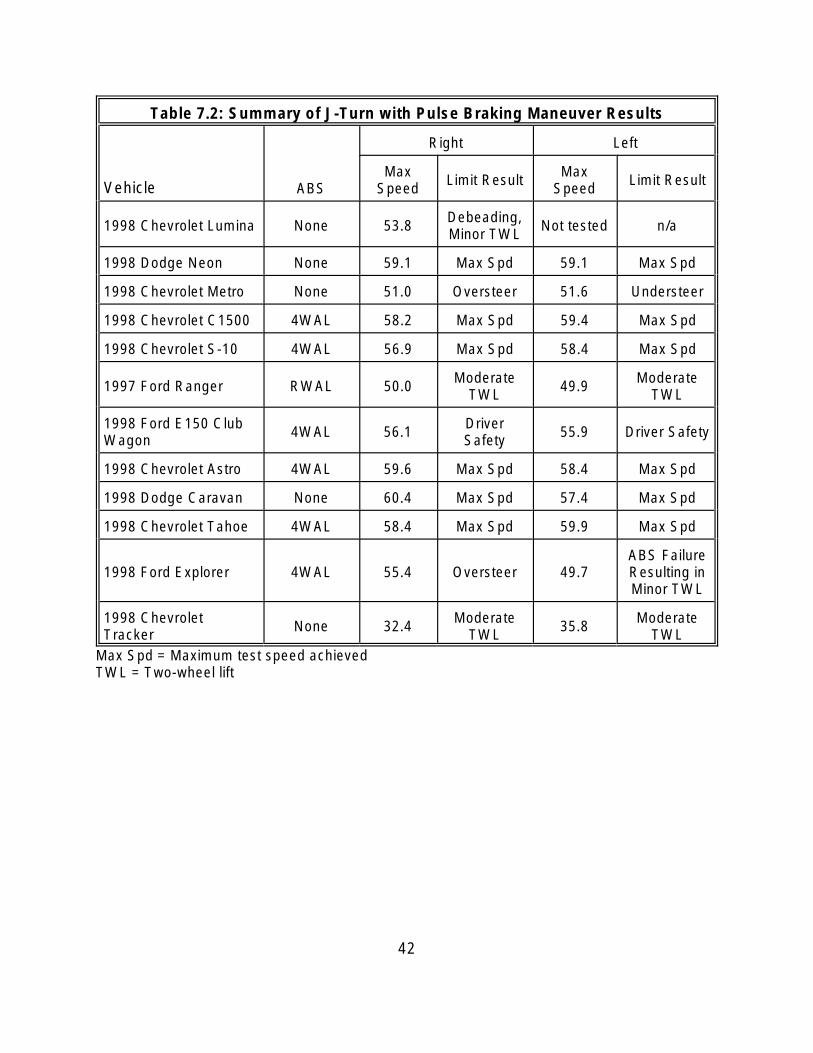
Table 7.2: Summary of J-Turn with Pulse Braking Maneuver Results
Vehicle ABS
Right Left
Max Speed Limit Result Max
Speed Limit Result
1998 Chevrolet Lumina None 53.8 Debeading, Minor TWL Not tested n/a
1998 Dodge Neon None 59.1 Max Spd 59.1 Max Spd
1998 Chevrolet Metro None 51.0 Oversteer 51.6 Understeer
1998 Chevrolet C1500 4WAL 58.2 Max Spd 59.4 Max Spd
1998 Chevrolet S-10 4WAL 56.9 Max Spd 58.4 Max Spd
1997 Ford Ranger RWAL 50.0 Moderate TWL 49.9 Moderate
TWL
1998 Ford E150 Club Wagon 4WAL 56.1 Driver
Safety 55.9 Driver Safety
1998 Chevrolet Astro 4WAL 59.6 Max Spd 58.4 Max Spd
1998 Dodge Caravan None 60.4 Max Spd 57.4 Max Spd
1998 Chevrolet Tahoe 4WAL 58.4 Max Spd 59.9 Max Spd
1998 Ford Explorer 4WAL 55.4 Oversteer 49.7 ABS Failure Resulting in Minor TWL
1998 Chevrolet Tracker None 32.4 Moderate
TWL 35.8 Moderate TWL
Max Spd = Maximum test speed achieved TWL = Two-wheel lift
42

Table 7.3: Summary of Fishhook #1 Maneuver Results
Vehicle
Right-Left Left-Right
Max Speed Limit Result Max Speed Limit Result
1998 Chevrolet Lumina 44.4 Understeer 44.5 Understeer
1998 Dodge Neon 49.2 Max Spd 50.2 Max Spd
1998 Chevrolet Metro 46.5 Oversteer 46.1 Oversteer
1998 Chevrolet C1500 49.7 Max Spd 48.1 Max Spd
1998 Chevrolet S-10 48.6 Max Spd 48.4 Max Spd
1997 Ford Ranger 43.9 Debeading & Moderate TWL 41.0 Minor TWL
1998 Ford E150 Club Wagon 49.7 Max Spd, Minor TWL 50.0 Max Spd,
Minor TWL
1998 Chevrolet Astro 50.3 Max Spd, Minor TWL 50.2 Max Spd
1998 Dodge Caravan 50.3 Max Spd 50.4 Max Spd
1998 Chevrolet Tahoe 48.3 Max Spd 48.2 Max Spd
1998 Ford Explorer 48.7 Max Spd 43.3 Debeading, Minor TWL
1998 Chevrolet Tracker 49.3 Max Spd, Minor TWL 47.9 Max Spd,
Minor TWL Max Spd = Maximum test speed achieved TWL = Two-wheel lift
43

Table 7.4: Summary of Fishhook #2 Maneuver Results
Vehicle
Right-Left Left-Right
Max Speed Limit Result Max Speed Limit Result
1998 Chevrolet Lumina
1998 Dodge Neon
1998 Chevrolet Metro
1998 Chevrolet C1500
1998 Chevrolet S-10
1997 Ford Ranger
50.8 Max Spd
49.0 Max Spd
48.0 Oversteer
46.4 Max Spd
49.1 Max Spd
49.5 Max Spd
50.4
50.3 Max Spd
50.5 Max Spd
45.8 Oversteer
47.8 Max Spd
49.8 Max Spd
48.1 Major TWL
49.4 Max Spd
50.9 Max Spd
50.4 Max Spd
50.3 Max Spd, Minor TWL
50.1 Max Spd
49.6 Max Spd, Minor TWL
1998 Ford E150 Club Wagon Max Spd
1998 Chevrolet Astro 49.7 Max Spd, Minor TWL
1998 Dodge Caravan 51.3 Max Spd
1998 Chevrolet Tahoe 50.2 Max Spd, Minor TWL
1998 Ford Explorer 49.9 Max Spd
1998 Chevrolet Tracker 48.2 Max Spd, Minor TWL
Max Spd = Maximum test speed achieved TWL = Two-wheel lift
44

Table 7.5: Summary of Resonant Steer Maneuver Results
Vehicle Steer
Frequency (Hz) Max Steering Amplitude
(degrees ±) Limit Result
1998 Chevrolet Lumina
1998 Dodge Neon
1998 Chevrolet Metro
1998 Chevrolet C1500
1998 Chevrolet S-10
1997 Ford Ranger
1998 Ford E150 Club Wagon
1998 Chevrolet Astro
1998 Dodge Caravan
1998 Chevrolet Tahoe
1998 Ford Explorer
1998 Chevrolet Tracker
0.5
0.5
0.5
0.5
0.5
0.8
0.5
0.5
0.5
0.5
0.5
0.5
150
180
150
180
135
180
180
180
180
150
150
135
Oversteer
Max Amp
Oversteer
Max Amp
Oversteer
Max Amp
Max Amp
Max Amp
Max Amp
Oversteer
Oversteer (Spin-out)
Oversteer Max Amp = Maximum test amplitude achieved
45
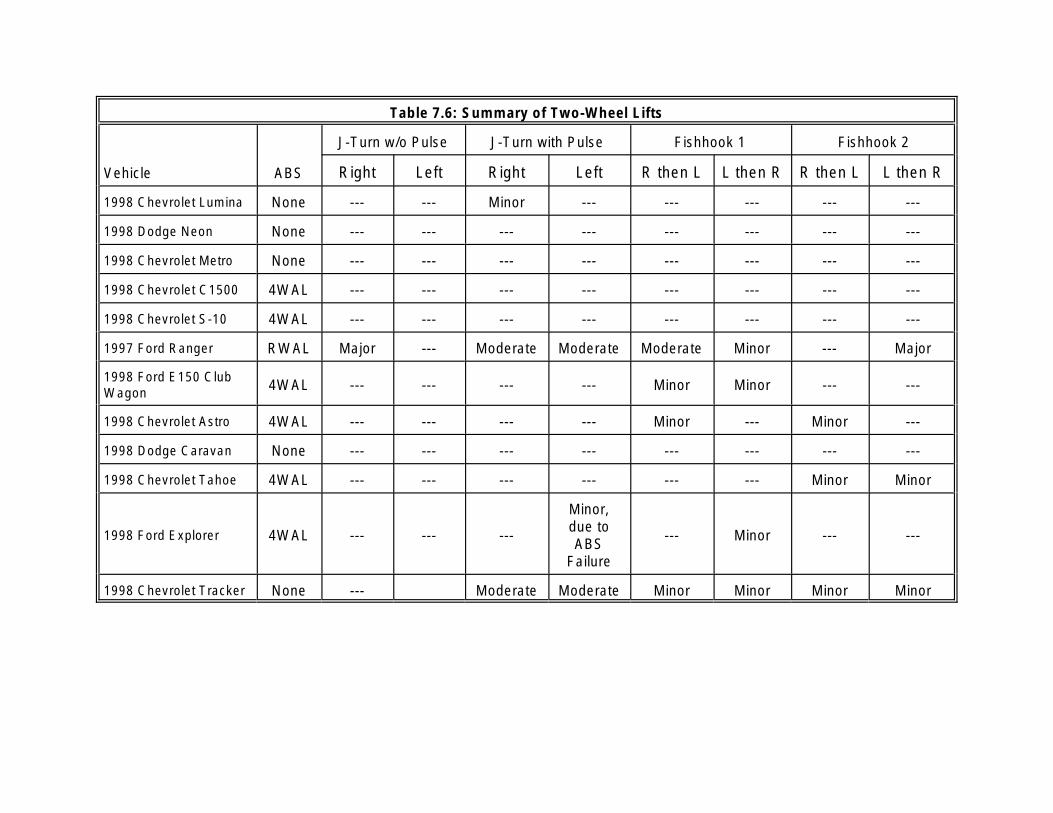
--- --- --- --- --- --- ---
--- --- --- --- --- --- --- ---
--- --- --- --- --- --- --- ---
--- --- --- --- --- --- --- ---
--- --- --- --- --- --- --- ---
--- ---
--- --- --- --- --- ---
--- --- --- --- --- ---
--- --- --- --- --- --- --- ---
--- --- --- --- --- ---
--- --- --- --- --- ---
---
Table 7.6: Summary of Two-Wheel Lifts
Vehicle ABS
J-Turn w/o Pulse J-Turn with Pulse Fishhook 1 Fishhook 2
Right Left Right Left R then L L then R R then L L then R
1998 Chevrolet Lumina None Minor
1998 Dodge Neon None
1998 Chevrolet Metro None
1998 Chevrolet C1500 4WAL
1998 Chevrolet S-10 4WAL
RWAL Major Moderate Moderate Moderate Minor Major1997 Ford Ranger
1998 Ford E150 Club Wagon 4WAL Minor Minor
1998 Chevrolet Astro 4WAL Minor Minor
1998 Dodge Caravan None
1998 Chevrolet Tahoe 4WAL Minor Minor
1998 Ford Explorer 4WAL
Minor, due to ABS
Failure
Minor
1998 Chevrolet Tracker None Moderate Moderate Minor Minor Minor Minor
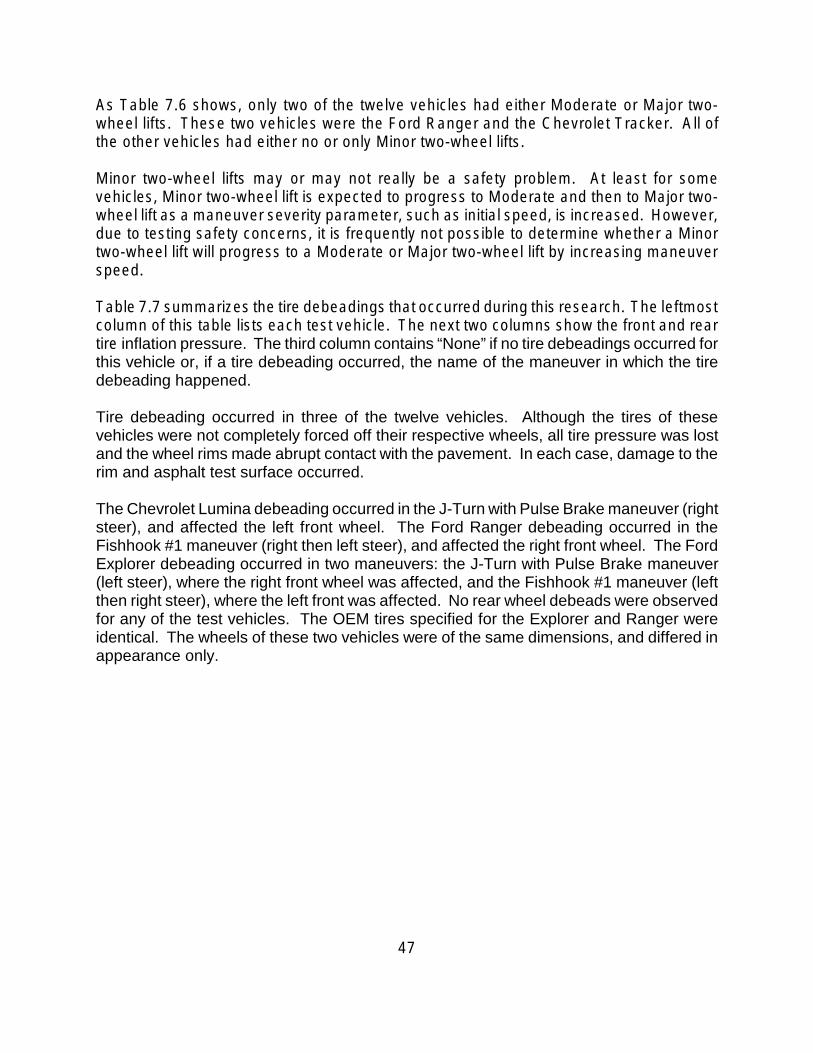
As Table 7.6 shows, only two of the twelve vehicles had either Moderate or Major two-wheel lifts. These two vehicles were the Ford Ranger and the Chevrolet Tracker. All of the other vehicles had either no or only Minor two-wheel lifts.
Minor two-wheel lifts may or may not really be a safety problem. At least for some vehicles, Minor two-wheel lift is expected to progress to Moderate and then to Major two-wheel lift as a maneuver severity parameter, such as initial speed, is increased. However, due to testing safety concerns, it is frequently not possible to determine whether a Minor two-wheel lift will progress to a Moderate or Major two-wheel lift by increasing maneuver speed.
Table 7.7 summarizes the tire debeadings that occurred during this research. The leftmost column of this table lists each test vehicle. The next two columns show the front and rear tire inflation pressure. The third column contains “None” if no tire debeadings occurred for this vehicle or, if a tire debeading occurred, the name of the maneuver in which the tire debeading happened.
Tire debeading occurred in three of the twelve vehicles. Although the tires of these vehicles were not completely forced off their respective wheels, all tire pressure was lost and the wheel rims made abrupt contact with the pavement. In each case, damage to the rim and asphalt test surface occurred.
The Chevrolet Lumina debeading occurred in the J-Turn with Pulse Brake maneuver (right steer), and affected the left front wheel. The Ford Ranger debeading occurred in the Fishhook #1 maneuver (right then left steer), and affected the right front wheel. The Ford Explorer debeading occurred in two maneuvers: the J-Turn with Pulse Brake maneuver (left steer), where the right front wheel was affected, and the Fishhook #1 maneuver (left then right steer), where the left front was affected. No rear wheel debeads were observed for any of the test vehicles. The OEM tires specified for the Explorer and Ranger were identical. The wheels of these two vehicles were of the same dimensions, and differed in appearance only.
47
---
---
---
---
---
---
---
---
---
Table 7.7: Summary of Tire Debeading Results
Vehicle
Front Tire Pressure
(psi)
Rear Tire Pressure
(psi)
Maneuver in Which Debeading Occurred
Wheel Involved
1998 Chevrolet Lumina 30 30 J-Turn with Pulse Brake
LF
1998 Dodge Neon 32 32 None
1998 Chevrolet Metro 32 32 None
1998 Chevrolet C1500 32 35 None
1998 Chevrolet S-10 35 35 None
1997 Ford Ranger 30 35 Fishhook #1 RF
1998 Ford E150 Club Wagon 41 41 None
1998 Chevrolet Astro 35 35 None
1998 Dodge Caravan 35 35 None
1998 Chevrolet Tahoe 35 35 None
1998 Ford Explorer 26 26
Fishhook #1 LF
J-Turn with Pulse Brake
RF
1998 Chevrolet Tracker 23 23 None
All three vehicles in which a tire debead was observed had manufacturer-recommended tire inflation pressures, for the tires that debeaded, of less than or equal to 30 psi. Interestingly, the Chevrolet Tracker’s recommended inflation pressure was 23 psi for the front and rear tires. None of the test maneuvers, even those which induced moderate two-wheel lift, produced a debead condition for the Tracker.
48
7.3 Summary of Lateral Acceleration at Rollover Results
Table 7.8 summarizes the Lateral Acceleration at Rollover values for each vehicle that were determined during this research. Lateral Acceleration at Rollover is a metric which is calculated from data collected during the Fishhook #1 and #2 maneuvers that attempts to quantify a vehicle’s on-road, untripped rollover propensity. Toyota Engineering Standard TS-A1544 explains how to determine Lateral Acceleration at Rollover values from the test data.
The determination of a Lateral Acceleration at Rollover value for a particular vehicle/fishhook maneuver requires that for some individual runs made for that maneuver the vehicle had some amount of two-wheel lift while for other runs two-wheel lift did not occur. However, half of the vehicles tested for this research did not have any two-wheel lifts for either fishhook. Therefore, a Lateral Acceleration at Rollover value cannot really be determined for these vehicles. What is shown in Table 7.8 is that the Lateral Acceleration at Rollover value for that vehicle/fishhook maneuver combination is greater than the peak lateral acceleration (corrected for roll angle effects) that was observed during any individual run of that vehicle for that particular fishhook.
Separate values of Lateral Acceleration at Rollover were generated for each fishhook maneuver for the left-then-right and the right-then-left tests. These two values were combined to produce two Lateral Acceleration at Rollover values (one for each fishhook maneuver) as follows:
1. If both the left-then-right and the right-then-left tests produced two-wheel lift then the lower of the two Lateral Acceleration at Rollover values was chosen, i.e., the minimum value of Lateral Acceleration at Rollover.
2. If only one of the left-then-right or the right-then-left tests, but not both, produced two-wheel lift then the Lateral Acceleration at Rollover value associated with the initial turn direction that produced two-wheel lift was selected.
3. If neither the left-then-right nor the right-then-left tests produced two-wheel lift then the higher of the two Lateral Acceleration at Rollover values was selected, i.e. the maximum (corrected for roll angle) lateral acceleration achieved during testing. In this situation a > symbol will precede the Lateral Acceleration at Rollover value in the appropriate column of Table 7.8.
The leftmost column of Table 7.8 lists each test vehicle. The next two columns show the Lateral Acceleration at Rollover values for each vehicle as determined from Fishhook #1 and #2, respectively. The final column contains a combined Lateral Acceleration at Rollover value derived from both types of fishhook tests.
49
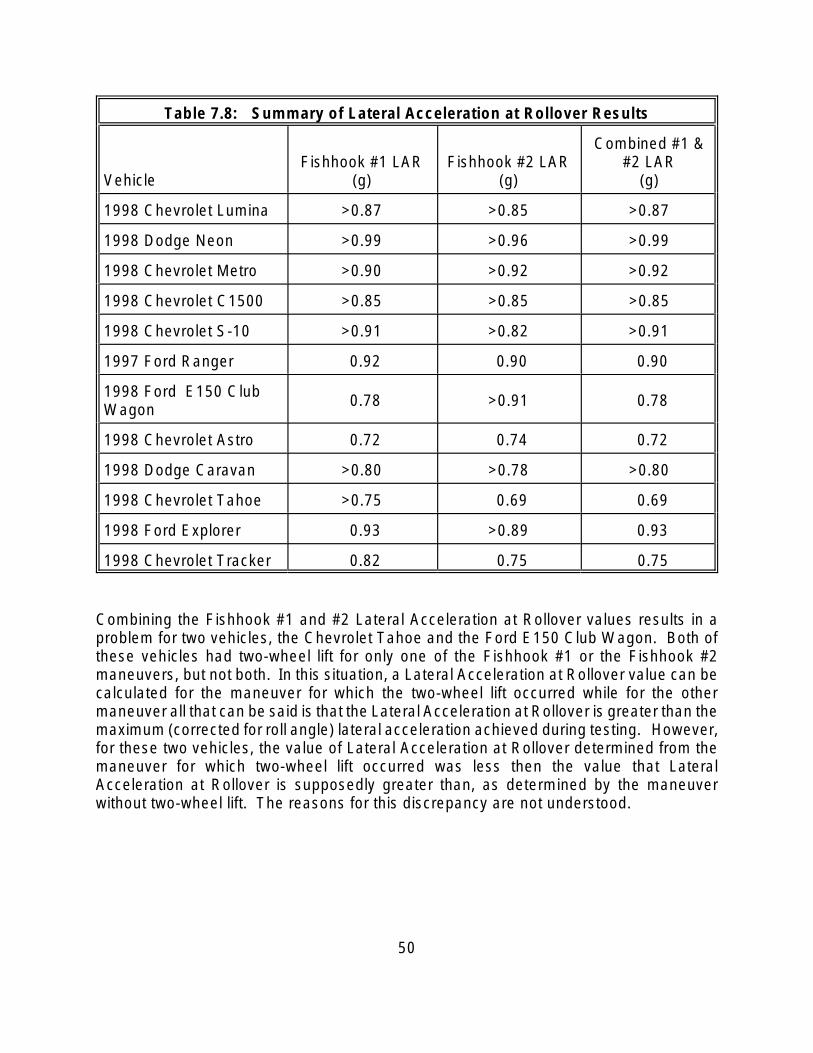
Table 7.8: of Lateral Acceleration at Rollover Results
Vehicle Fishhook #1 LAR
(g) Fishhook #2 LAR
(g)
Combined #1 & #2 LAR
(g)
Summary
1998 Chevrolet Lumina
1998 Dodge Neon
1998 Chevrolet Metro
1998 Chevrolet C1500
1998 Chevrolet S-10
1997 Ford Ranger
1998 Ford E150 Club Wagon
1998 Chevrolet Astro
1998 Dodge Caravan
1998 Chevrolet Tahoe
1998 Ford Explorer
1998 Chevrolet Tracker
>0.87
>0.99
>0.90
>0.85
>0.91
0.92
0.78
0.72
>0.80
>0.75
0.93
>0.85
>0.96
>0.92
>0.85
>0.82
0.90
>0.91
0.74
>0.78
0.69
>0.89
>0.87
>0.99
>0.92
>0.85
>0.91
0.90
0.78
0.72
>0.80
0.69
0.93
0.82 0.75 0.75
Combining the Fishhook #1 and #2 Lateral Acceleration at Rollover values results in a problem for two vehicles, the Chevrolet Tahoe and the Ford E150 Club Wagon. Both of these vehicles had two-wheel lift for only one of the Fishhook #1 or the Fishhook #2 maneuvers, but not both. In this situation, a Lateral Acceleration at Rollover value can be calculated for the maneuver for which the two-wheel lift occurred while for the other maneuver all that can be said is that the Lateral Acceleration at Rollover is greater than the maximum (corrected for roll angle) lateral acceleration achieved during testing. However, for these two vehicles, the value of Lateral Acceleration at Rollover determined from the maneuver for which two-wheel lift occurred was less then the value that Lateral Acceleration at Rollover is supposedly greater than, as determined by the maneuver without two-wheel lift. The reasons for this discrepancy are not understood.
50
8.0 MULTI-MANEUVER SUMMARIESAND ANALYSIS
8.1 Multi-Maneuver Summary Results for Each Test Vehicle
In Figures 8.1-8.24, the peak corrected lateral accelerations and roll angles are plotted as a function of speed for each vehicle, with the odd numbered figures containing acceleration data and the even containing roll angle data. The J-Turn, J-Turn with Pulse Braking, Fishhook 1, and Fishhook 2 data are plotted separately for each vehicle. The steering direction is distinguished by symbol type. The corrected lateral acceleration plots have two lines that represent the individual vehicle Tilt Table Ratio (TTR) and Static Stability Factor (SSF). The degree of Two-Wheel Lift (TWL) is represented by different fill patterns for the symbols. No TWL is represented by an open symbol, minor TWL by diagonal lines sloping down left-to-right, moderate TWL by diagonal lines sloping up left-to right, and major TWL by solid symbols. The TWL categories are described in Section 7.1. The vehicle speed used to chart the data is taken at the start of the initial steering input for the maneuver.
Figures 8.1 and 8.2 contain data for the 1998 Chevrolet Lumina. The J-Turn with Pulse Braking maneuver produced minor TWL for this vehicle. None of the other maneuvers produced any degree of TWL. This vehicle did not have ABS. It can be noted in the J-Turn with Pulse Braking plot that only the right steer direction was tested and only up to approximately 54 mph. This was due to the tire de-beading and digging into the asphalt surface. This was considered to be a stopping point for testing on any particular maneuver. The maximum speed for testing in the J-Turn and J-Turn with Pulse Braking testing was 60 mph, while the maximum speed for the Fishhook 1 and 2 maneuvers was 50 mph. The Lumina had a tendency to oversteer in the J-Turn maneuver and had major understeer in the Fishhook 1 test which is why testing was suspended prior to the maximum test speeds for these maneuvers. The maximum lateral accelerations are very similar for all four maneuvers, but only the J-Turn with Pulse Braking produced any type of TWL, suggesting that peak lateral acceleration is not the only determinant for TWL. The peak lateral accelerations are all well below the TTR and SSF line for this vehicle, even for the tests that produced minor TWL. The peak roll angles for the tests that produced minor TWL are the highest roll angles, although one of the peak roll angles for the Fishhook 1 test is very close to these angles, but in the opposite direction. This may suggest a right vs. left difference for this vehicle. The two tests with minor TWL have very different vehicle speeds and tests that have speeds in between or greater than these speeds did not produce TWL. This may be due to the braking magnitude, braking pulse duration, or the precise timing of the braking pulse relative to the steering input.
51
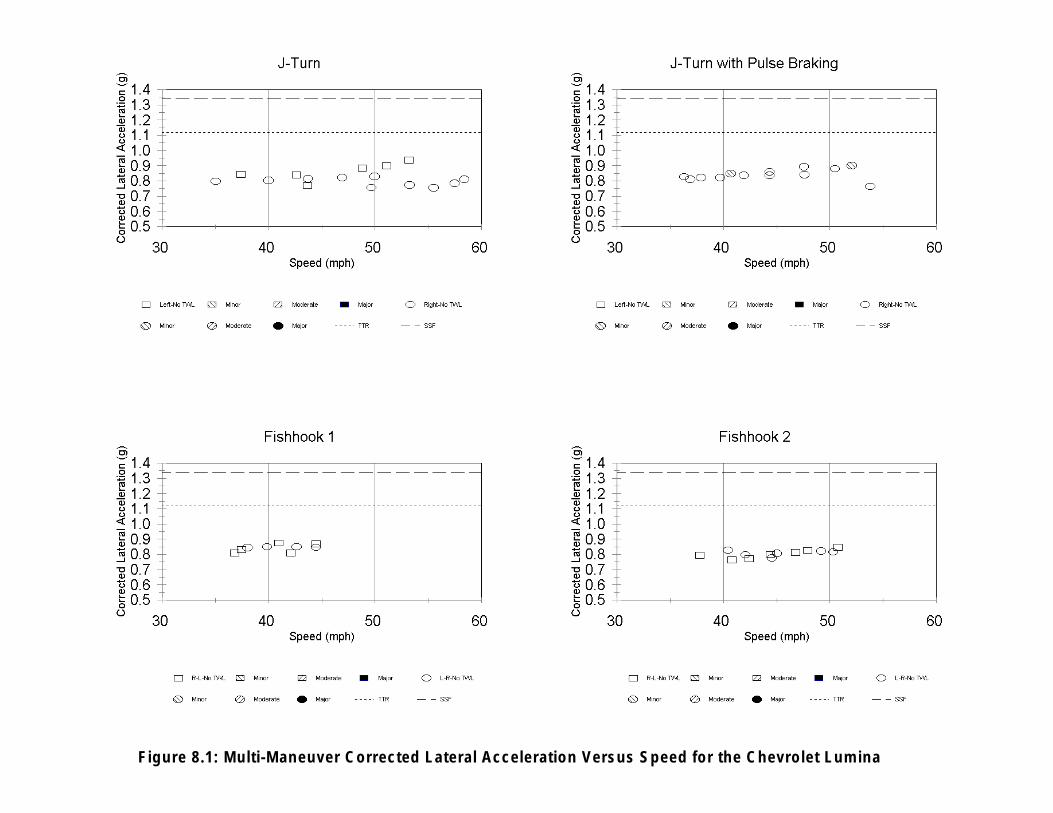
Figure 8.1: Multi-Maneuver Corrected Lateral Acceleration Versus Speed for the Chevrolet Lumina
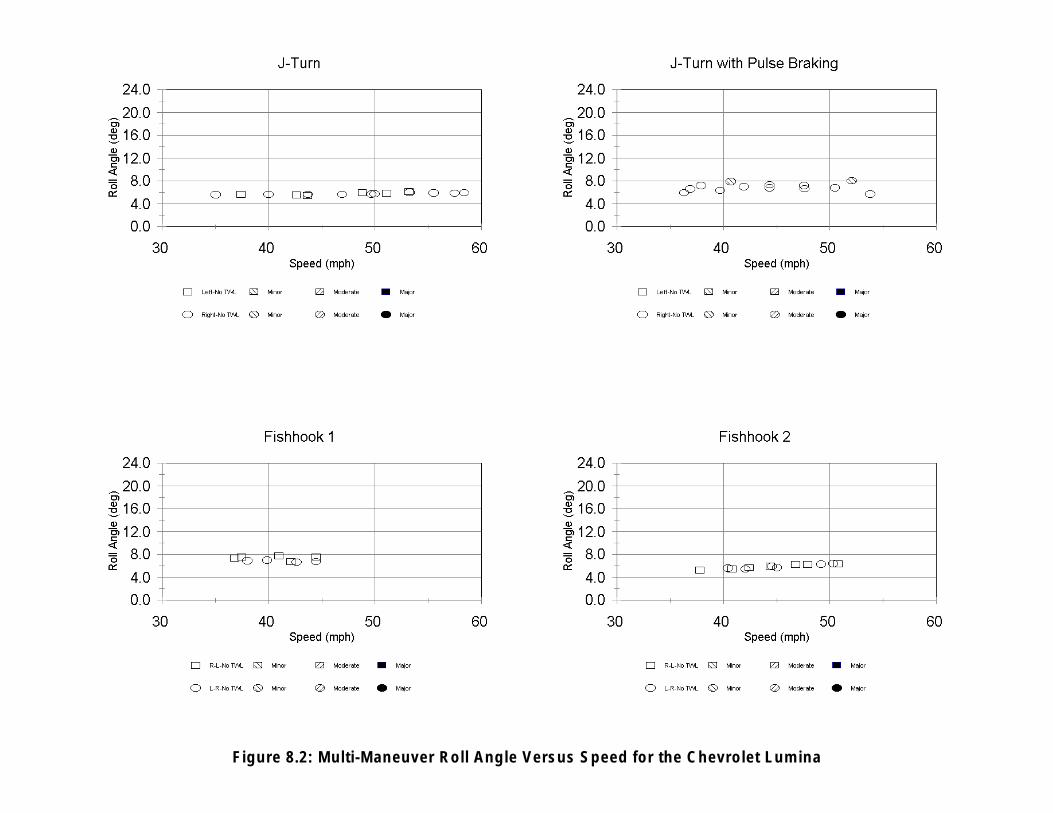
Figure 8.2: Multi-Maneuver Roll Angle Versus Speed for the Chevrolet Lumina
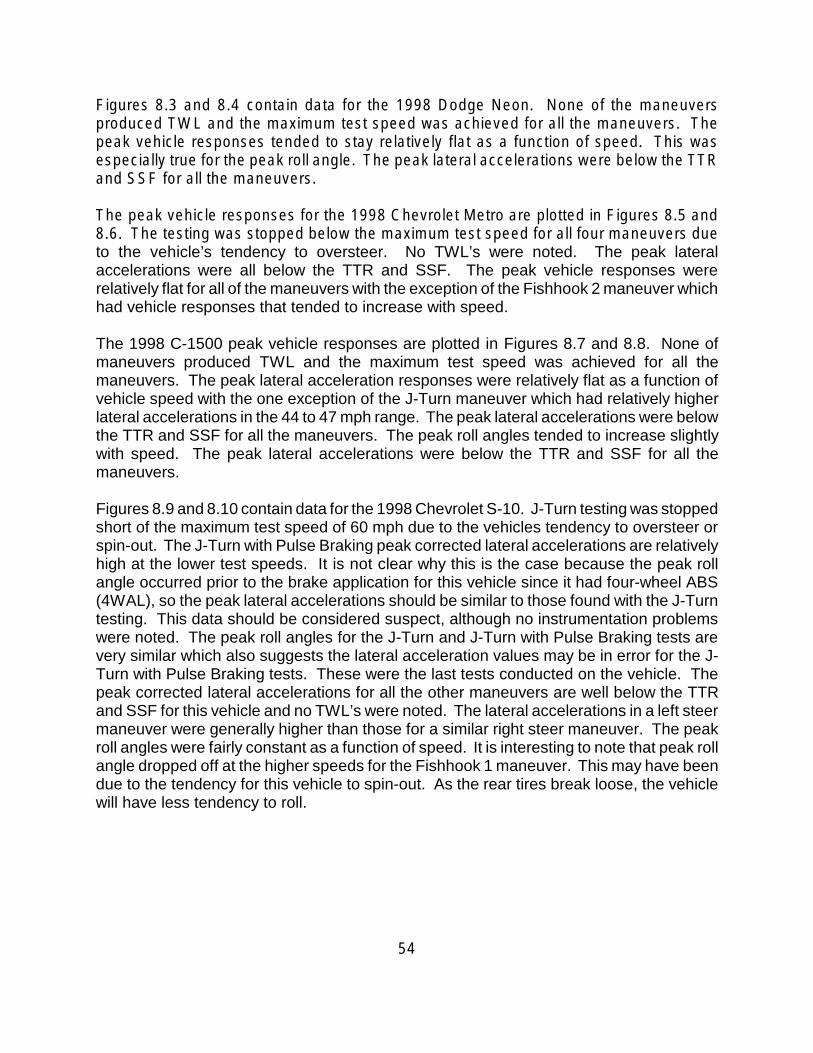
Figures 8.3 and 8.4 contain data for the 1998 Dodge Neon. None of the maneuvers produced TWL and the maximum test speed was achieved for all the maneuvers. The peak vehicle responses tended to stay relatively flat as a function of speed. This was especially true for the peak roll angle. The peak lateral accelerations were below the TTR and SSF for all the maneuvers.
The peak vehicle responses for the 1998 Chevrolet Metro are plotted in Figures 8.5 and 8.6. The testing was stopped below the maximum test speed for all four maneuvers due to the vehicle’s tendency to oversteer. No TWL’s were noted. The peak lateral accelerations were all below the TTR and SSF. The peak vehicle responses were relatively flat for all of the maneuvers with the exception of the Fishhook 2 maneuver which had vehicle responses that tended to increase with speed.
The 1998 C-1500 peak vehicle responses are plotted in Figures 8.7 and 8.8. None of maneuvers produced TWL and the maximum test speed was achieved for all the maneuvers. The peak lateral acceleration responses were relatively flat as a function of vehicle speed with the one exception of the J-Turn maneuver which had relatively higher lateral accelerations in the 44 to 47 mph range. The peak lateral accelerations were below the TTR and SSF for all the maneuvers. The peak roll angles tended to increase slightly with speed. The peak lateral accelerations were below the TTR and SSF for all the maneuvers.
Figures 8.9 and 8.10 contain data for the 1998 Chevrolet S-10. J-Turn testing was stopped short of the maximum test speed of 60 mph due to the vehicles tendency to oversteer or spin-out. The J-Turn with Pulse Braking peak corrected lateral accelerations are relatively high at the lower test speeds. It is not clear why this is the case because the peak roll angle occurred prior to the brake application for this vehicle since it had four-wheel ABS (4WAL), so the peak lateral accelerations should be similar to those found with the J-Turn testing. This data should be considered suspect, although no instrumentation problems were noted. The peak roll angles for the J-Turn and J-Turn with Pulse Braking tests are very similar which also suggests the lateral acceleration values may be in error for the J-Turn with Pulse Braking tests. These were the last tests conducted on the vehicle. The peak corrected lateral accelerations for all the other maneuvers are well below the TTR and SSF for this vehicle and no TWL’s were noted. The lateral accelerations in a left steer maneuver were generally higher than those for a similar right steer maneuver. The peak roll angles were fairly constant as a function of speed. It is interesting to note that peak roll angle dropped off at the higher speeds for the Fishhook 1 maneuver. This may have been due to the tendency for this vehicle to spin-out. As the rear tires break loose, the vehicle will have less tendency to roll.
54

Figure 8.3: Multi-Maneuver Corrected Lateral Acceleration Versus Speed for the Dodge Neon
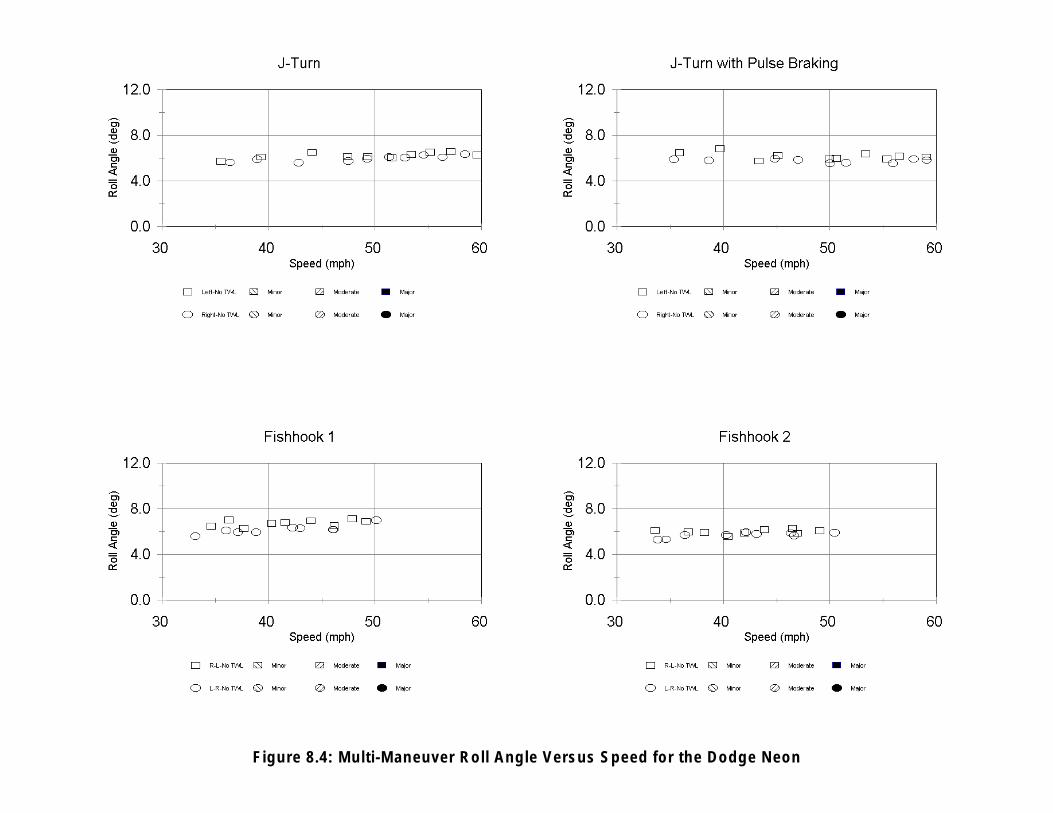
Figure 8.4: Multi-Maneuver Roll Angle Versus Speed for the Dodge Neon
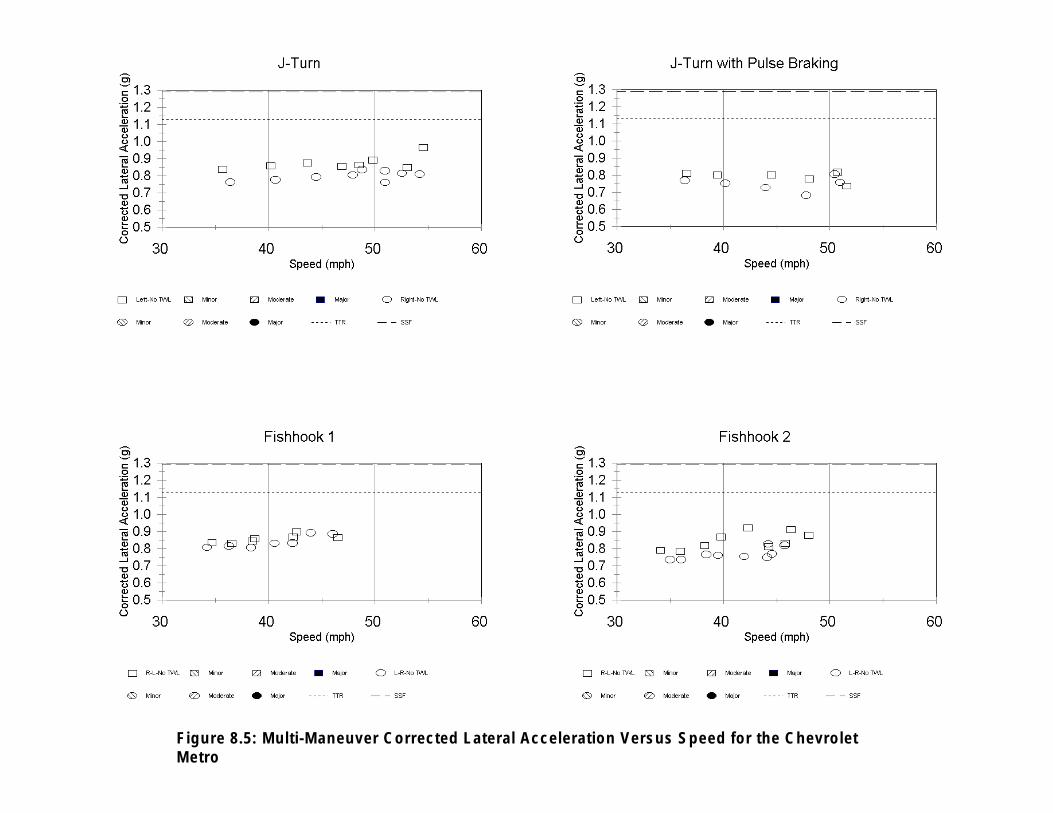
Figure 8.5: Multi-Maneuver Corrected Lateral Acceleration Versus Speed for the Chevrolet Metro
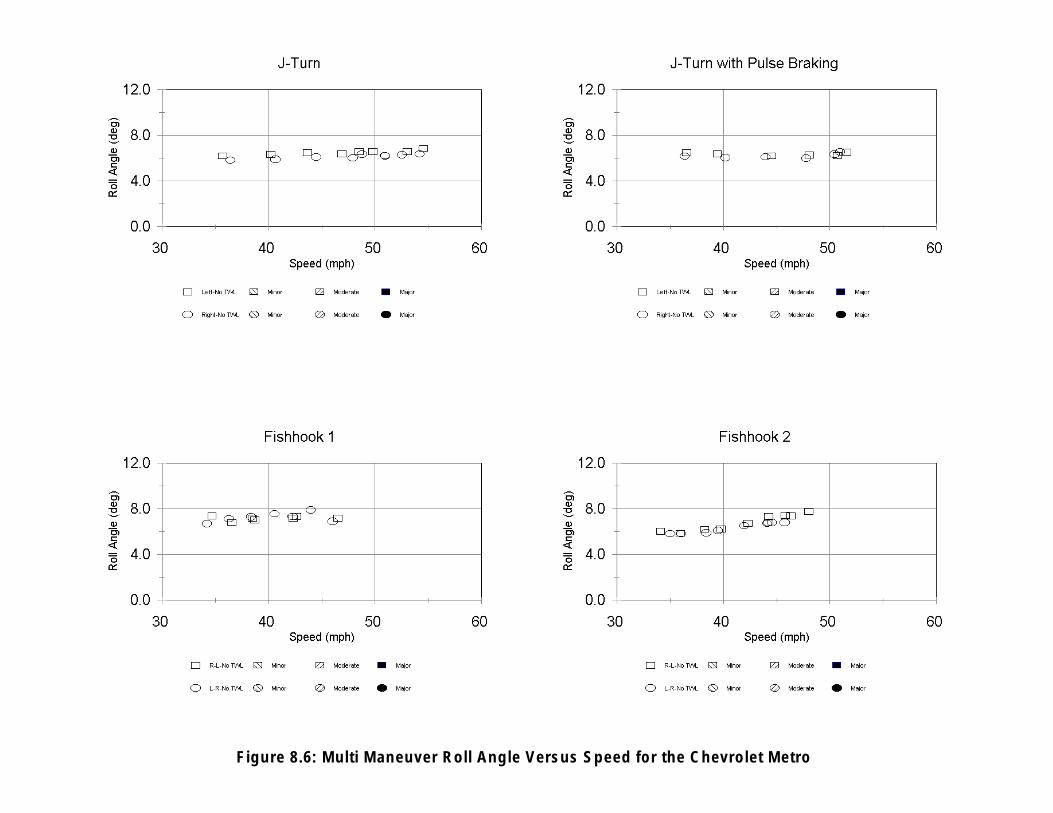
Figure 8.6: Multi Maneuver Roll Angle Versus Speed for the Chevrolet Metro
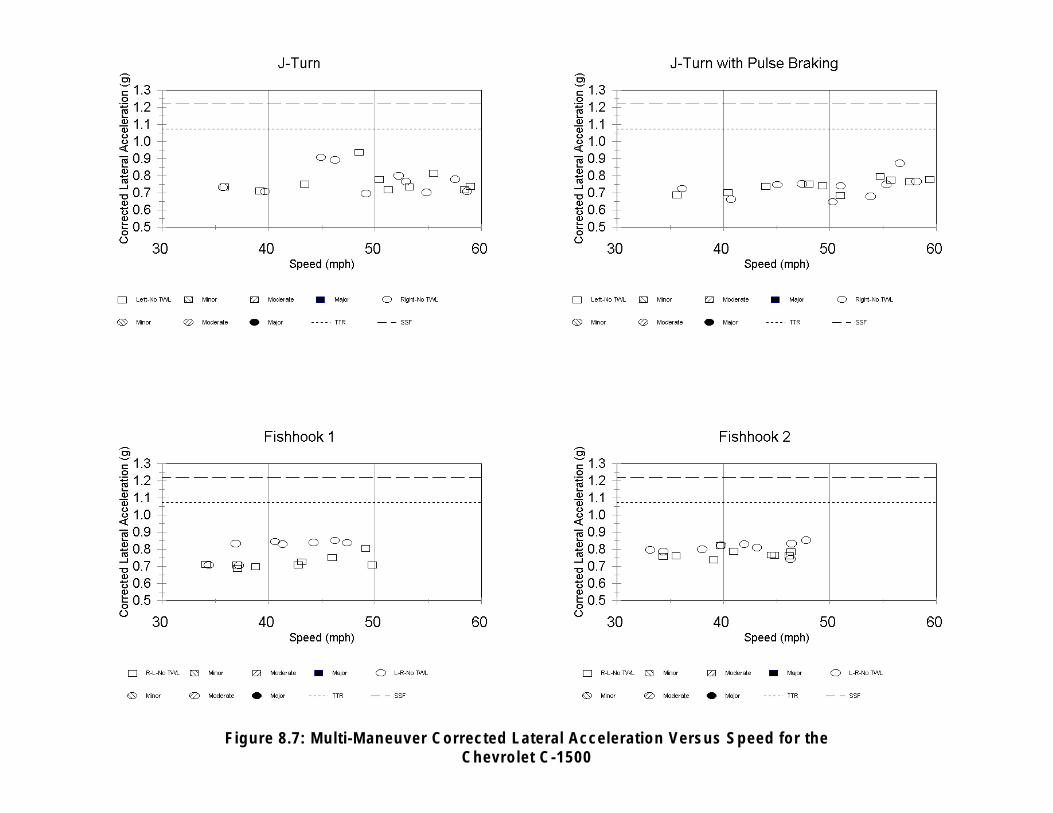
Figure 8.7: Multi-Maneuver Corrected Lateral Acceleration Versus Speed for the Chevrolet C-1500

Figure 8.8: Multi-Maneuver Roll Angle Versus Speed for the Chevrolet C-1500
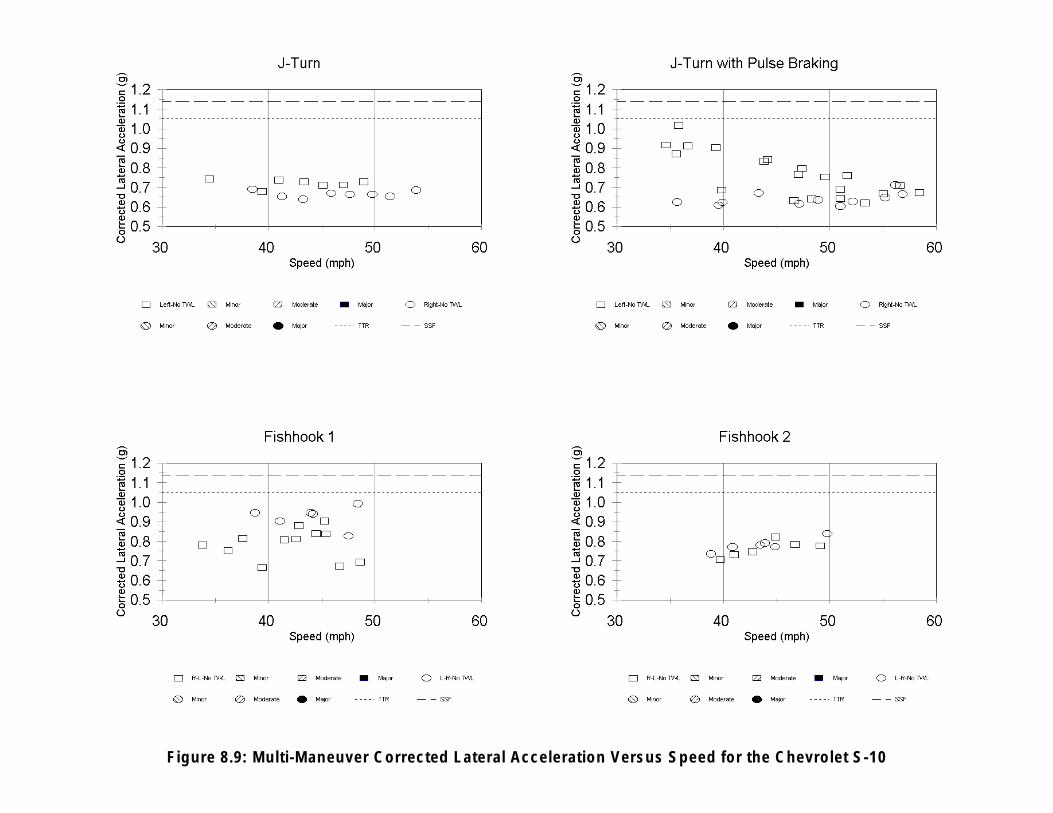
Figure 8.9: Multi-Maneuver Corrected Lateral Acceleration Versus Speed for the Chevrolet S-10
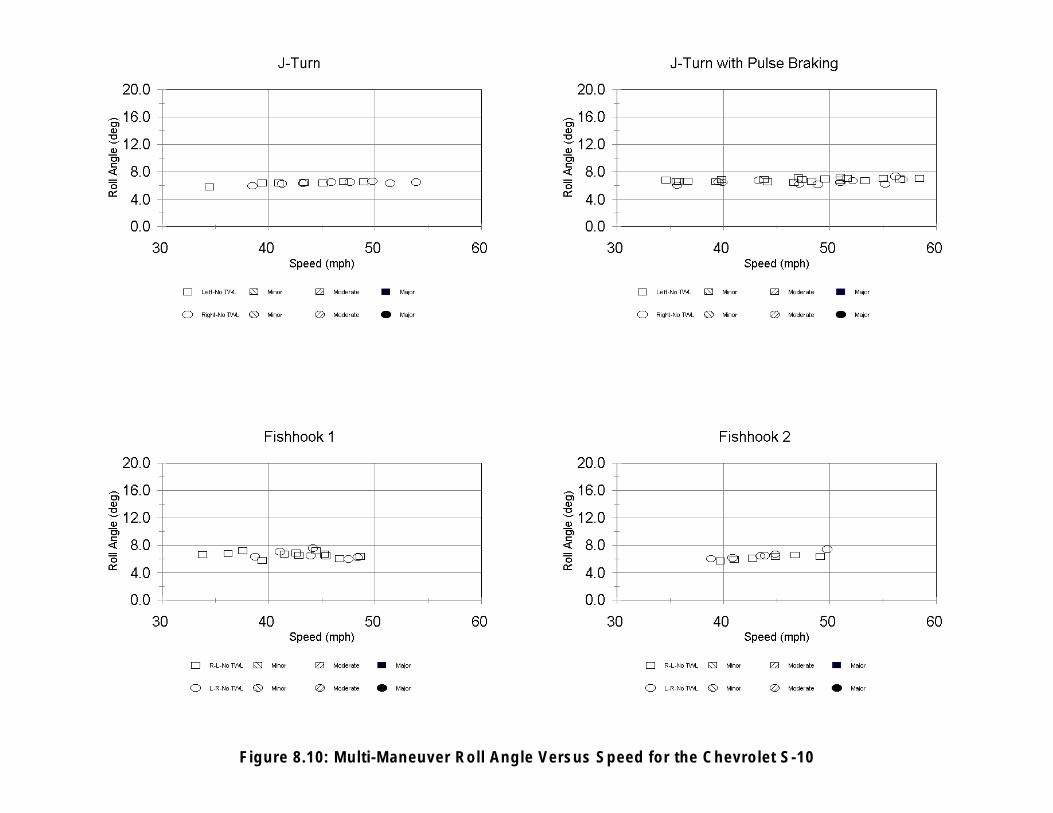
Figure 8.10: Multi-Maneuver Roll Angle Versus Speed for the Chevrolet S-10
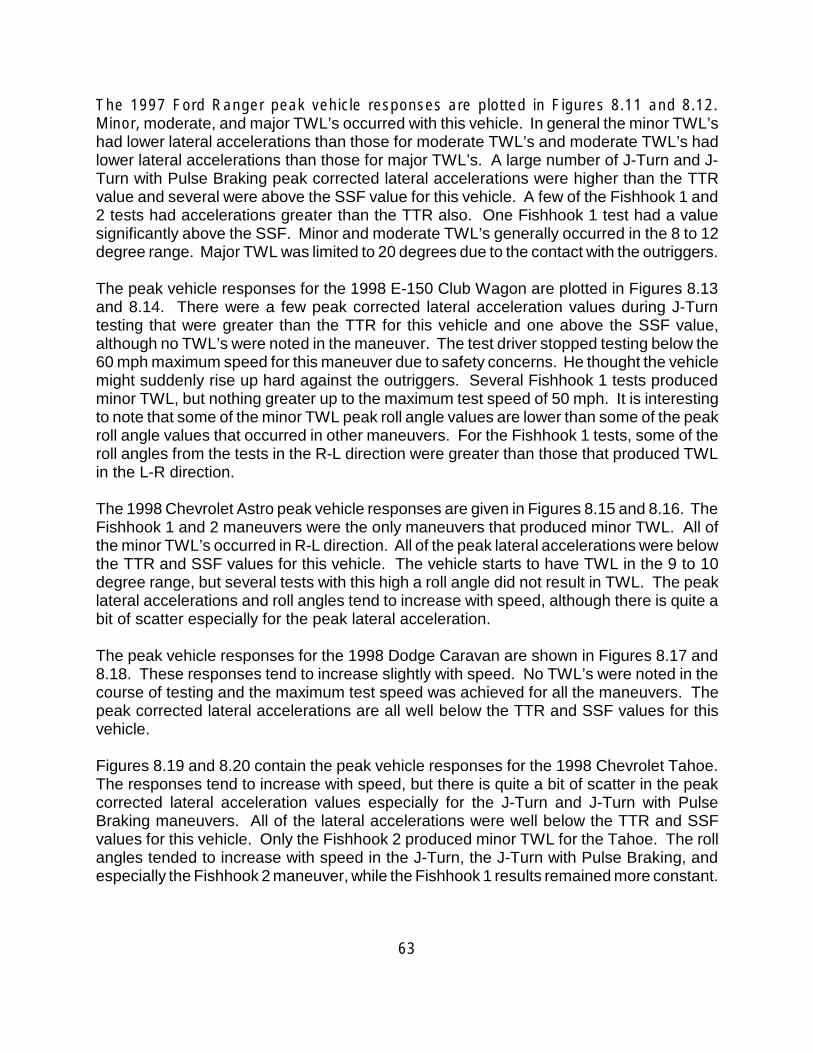
The 1997 Ford Ranger peak vehicle responses are plotted in Figures 8.11 and 8.12. Minor, moderate, and major TWL’s occurred with this vehicle. In general the minor TWL’s had lower lateral accelerations than those for moderate TWL’s and moderate TWL’s had lower lateral accelerations than those for major TWL’s. A large number of J-Turn and J-Turn with Pulse Braking peak corrected lateral accelerations were higher than the TTR value and several were above the SSF value for this vehicle. A few of the Fishhook 1 and 2 tests had accelerations greater than the TTR also. One Fishhook 1 test had a value significantly above the SSF. Minor and moderate TWL’s generally occurred in the 8 to 12 degree range. Major TWL was limited to 20 degrees due to the contact with the outriggers.
The peak vehicle responses for the 1998 E-150 Club Wagon are plotted in Figures 8.13 and 8.14. There were a few peak corrected lateral acceleration values during J-Turn testing that were greater than the TTR for this vehicle and one above the SSF value, although no TWL’s were noted in the maneuver. The test driver stopped testing below the 60 mph maximum speed for this maneuver due to safety concerns. He thought the vehicle might suddenly rise up hard against the outriggers. Several Fishhook 1 tests produced minor TWL, but nothing greater up to the maximum test speed of 50 mph. It is interesting to note that some of the minor TWL peak roll angle values are lower than some of the peak roll angle values that occurred in other maneuvers. For the Fishhook 1 tests, some of the roll angles from the tests in the R-L direction were greater than those that produced TWL in the L-R direction.
The 1998 Chevrolet Astro peak vehicle responses are given in Figures 8.15 and 8.16. The Fishhook 1 and 2 maneuvers were the only maneuvers that produced minor TWL. All of the minor TWL’s occurred in R-L direction. All of the peak lateral accelerations were below the TTR and SSF values for this vehicle. The vehicle starts to have TWL in the 9 to 10 degree range, but several tests with this high a roll angle did not result in TWL. The peak lateral accelerations and roll angles tend to increase with speed, although there is quite a bit of scatter especially for the peak lateral acceleration.
The peak vehicle responses for the 1998 Dodge Caravan are shown in Figures 8.17 and 8.18. These responses tend to increase slightly with speed. No TWL’s were noted in the course of testing and the maximum test speed was achieved for all the maneuvers. The peak corrected lateral accelerations are all well below the TTR and SSF values for this vehicle.
Figures 8.19 and 8.20 contain the peak vehicle responses for the 1998 Chevrolet Tahoe. The responses tend to increase with speed, but there is quite a bit of scatter in the peak corrected lateral acceleration values especially for the J-Turn and J-Turn with Pulse Braking maneuvers. All of the lateral accelerations were well below the TTR and SSF values for this vehicle. Only the Fishhook 2 produced minor TWL for the Tahoe. The roll angles tended to increase with speed in the J-Turn, the J-Turn with Pulse Braking, and especially the Fishhook 2 maneuver, while the Fishhook 1 results remained more constant.
63

FIGURE 8.11: Multi Maneuver Corrected Lateral Acceleration Versus Speed for the Ford Ranger

Figure 8.12: Multi-Maneuver Roll Angle Versus Speed for the Ford Ranger
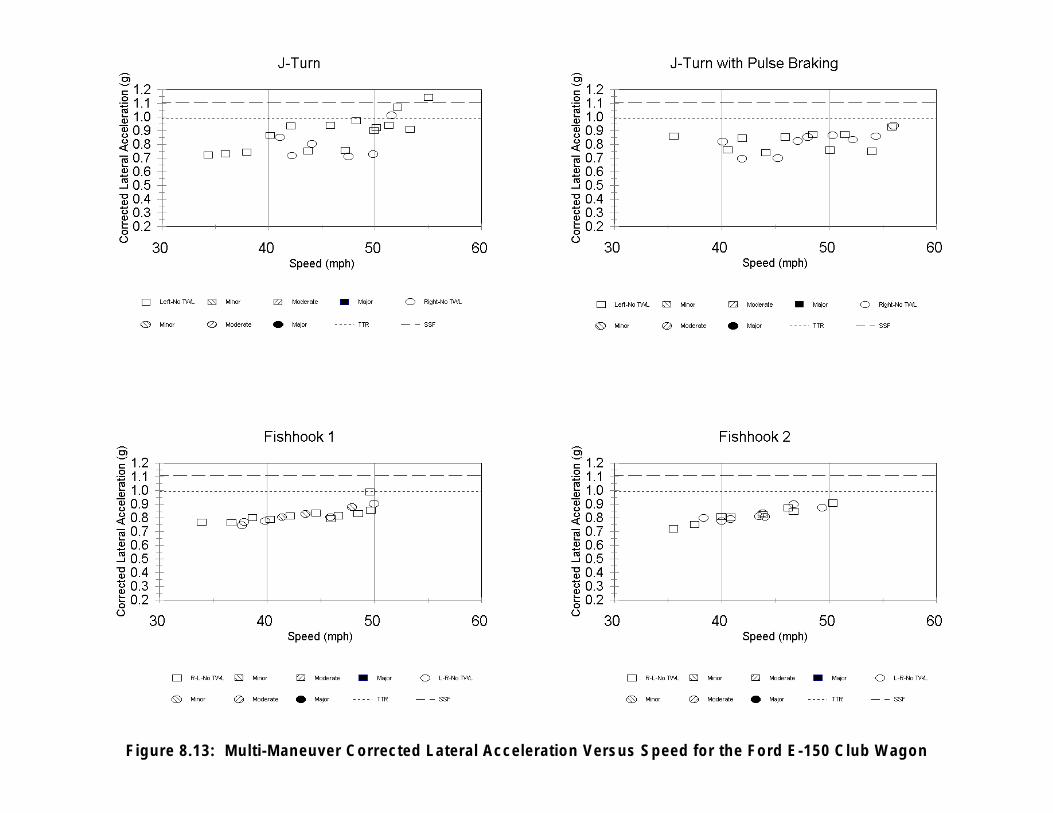
Figure 8.13: Multi-Maneuver Corrected Lateral Acceleration Versus Speed for the Ford E-150 Club Wagon
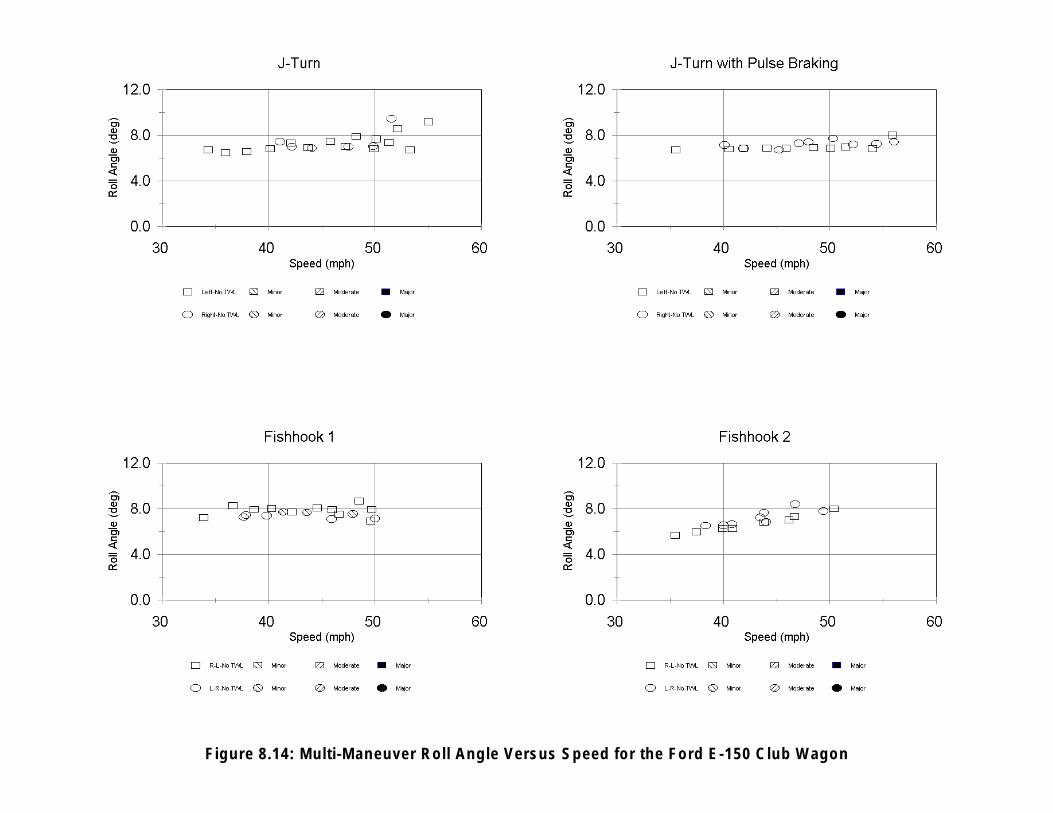
Figure 8.14: Multi-Maneuver Roll Angle Versus Speed for the Ford E-150 Club Wagon

Figure 8.15: Multi-Maneuver Corrected Lateral Acceleration Versus Speed for the Chevrolet Astro
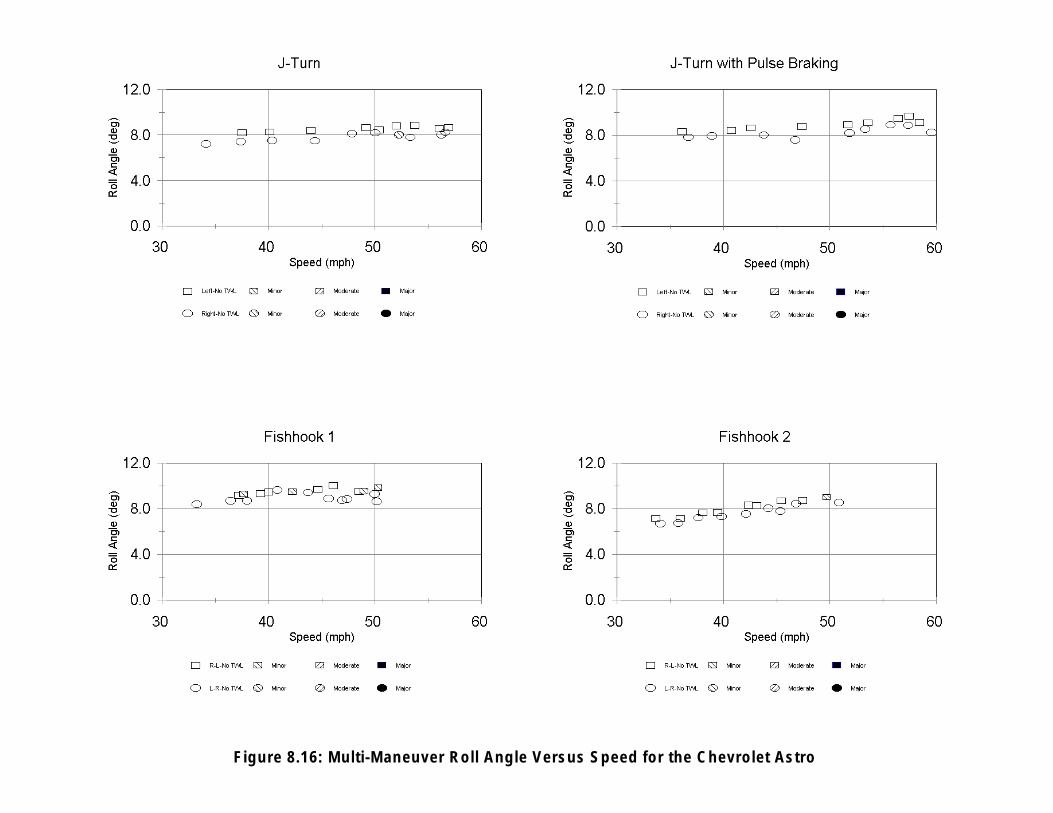
Figure 8.16: Multi-Maneuver Roll Angle Versus Speed for the Chevrolet Astro
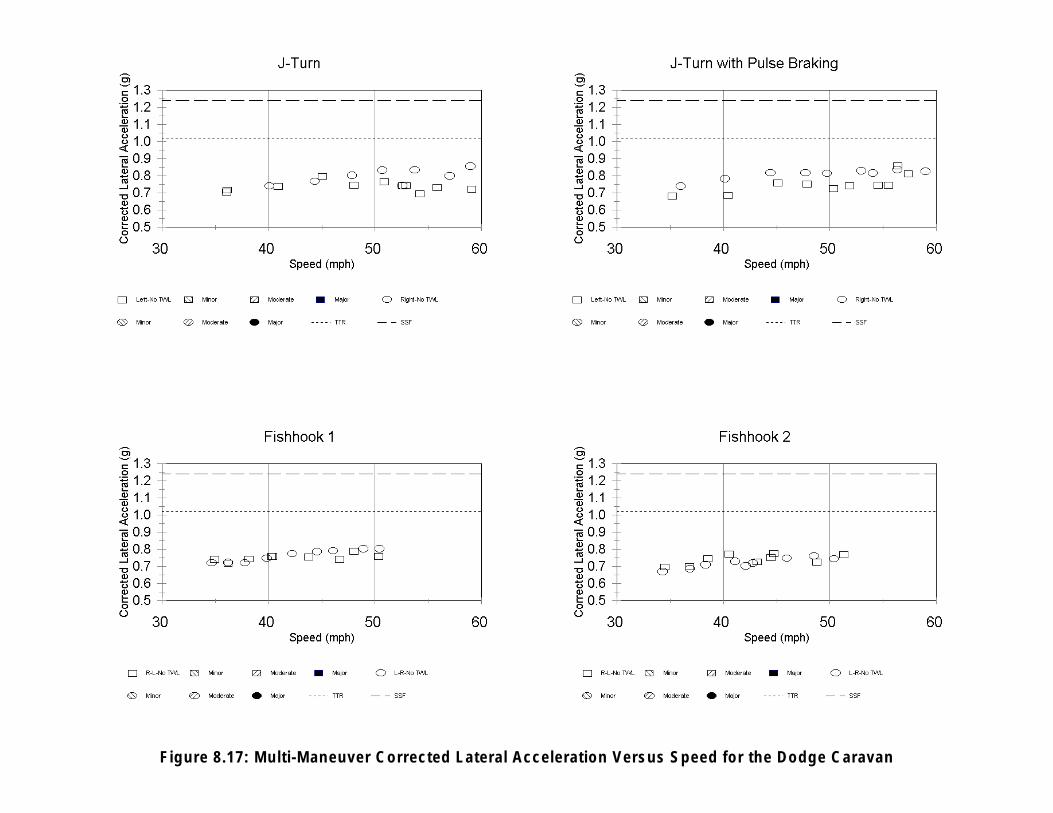
Figure 8.17: Multi-Maneuver Corrected Lateral Acceleration Versus Speed for the Dodge Caravan

Figure 8.18: Multi-Maneuver Roll Angle Versus Speed for the Dodge Caravan

Figure 8.19: Multi-Maneuver Corrected Lateral Acceleration Versus Speed for the Chevrolet Tahoe
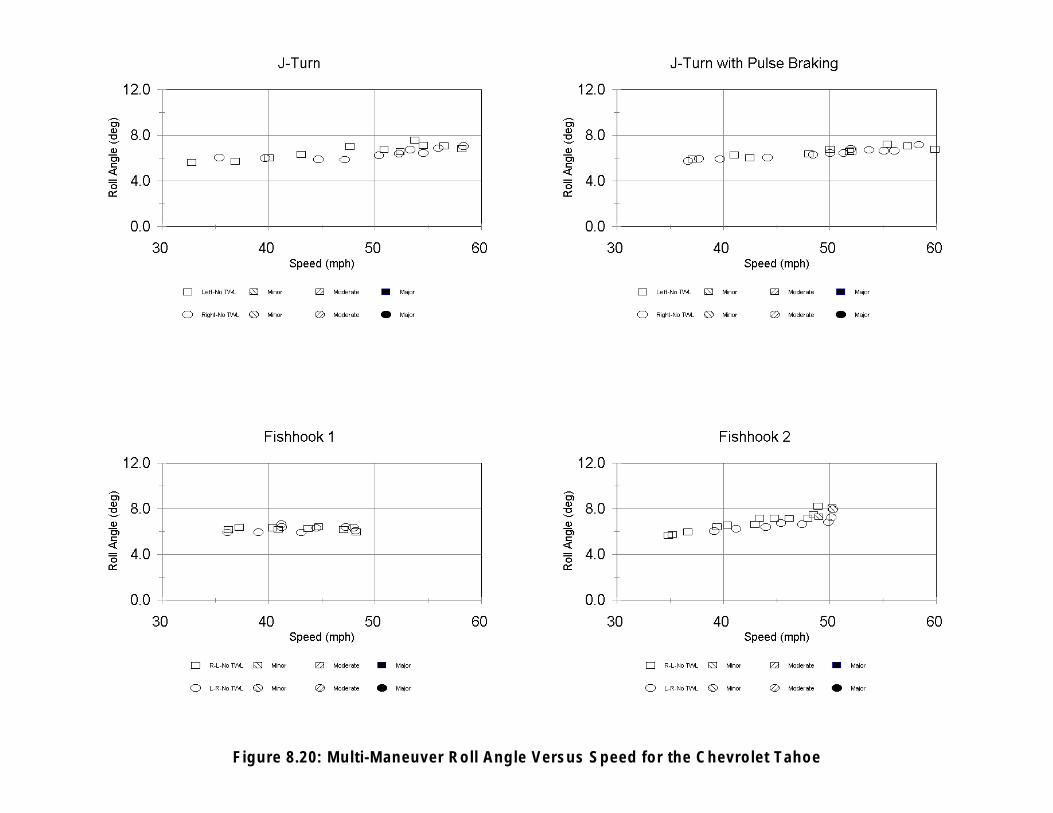
Figure 8.20: Multi-Maneuver Roll Angle Versus Speed for the Chevrolet Tahoe
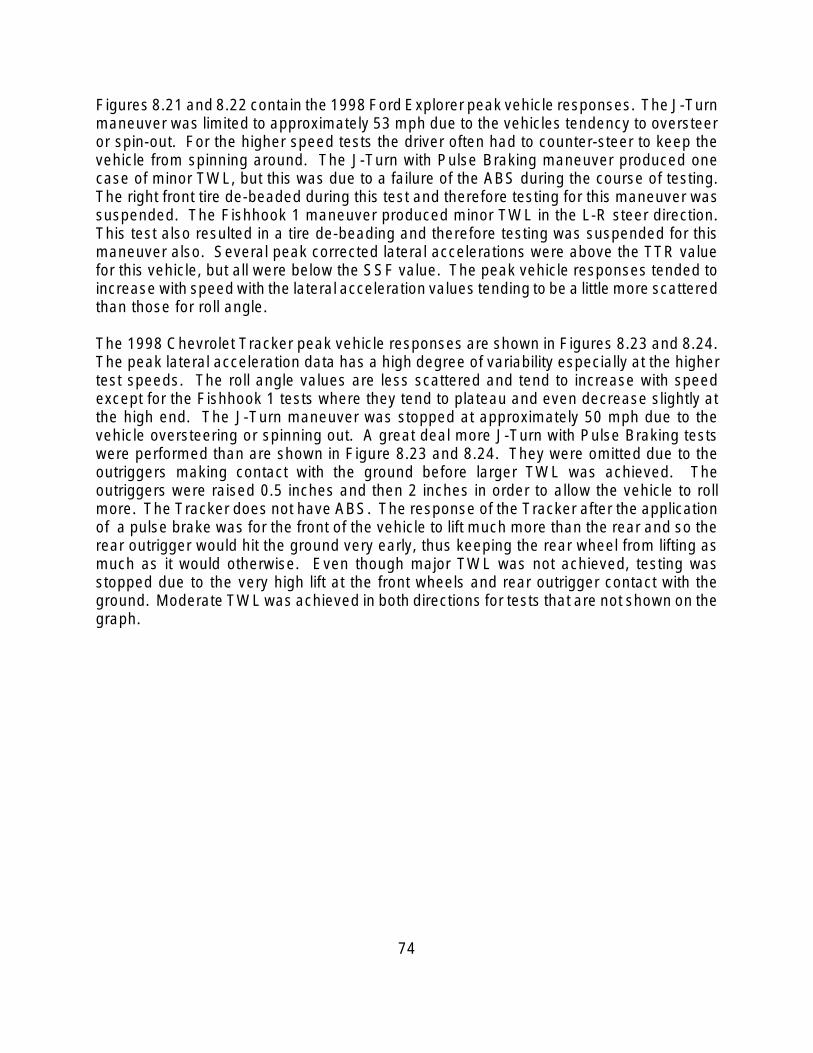
Figures 8.21 and 8.22 contain the 1998 Ford Explorer peak vehicle responses. The J-Turn maneuver was limited to approximately 53 mph due to the vehicles tendency to oversteer or spin-out. For the higher speed tests the driver often had to counter-steer to keep the vehicle from spinning around. The J-Turn with Pulse Braking maneuver produced one case of minor TWL, but this was due to a failure of the ABS during the course of testing. The right front tire de-beaded during this test and therefore testing for this maneuver was suspended. The Fishhook 1 maneuver produced minor TWL in the L-R steer direction. This test also resulted in a tire de-beading and therefore testing was suspended for this maneuver also. Several peak corrected lateral accelerations were above the TTR value for this vehicle, but all were below the SSF value. The peak vehicle responses tended to increase with speed with the lateral acceleration values tending to be a little more scattered than those for roll angle.
The 1998 Chevrolet Tracker peak vehicle responses are shown in Figures 8.23 and 8.24. The peak lateral acceleration data has a high degree of variability especially at the higher test speeds. The roll angle values are less scattered and tend to increase with speed except for the Fishhook 1 tests where they tend to plateau and even decrease slightly at the high end. The J-Turn maneuver was stopped at approximately 50 mph due to the vehicle oversteering or spinning out. A great deal more J-Turn with Pulse Braking tests were performed than are shown in Figure 8.23 and 8.24. They were omitted due to the outriggers making contact with the ground before larger TWL was achieved. The outriggers were raised 0.5 inches and then 2 inches in order to allow the vehicle to roll more. The Tracker does not have ABS. The response of the Tracker after the application of a pulse brake was for the front of the vehicle to lift much more than the rear and so the rear outrigger would hit the ground very early, thus keeping the rear wheel from lifting as much as it would otherwise. Even though major TWL was not achieved, testing was stopped due to the very high lift at the front wheels and rear outrigger contact with the ground. Moderate TWL was achieved in both directions for tests that are not shown on the graph.
74
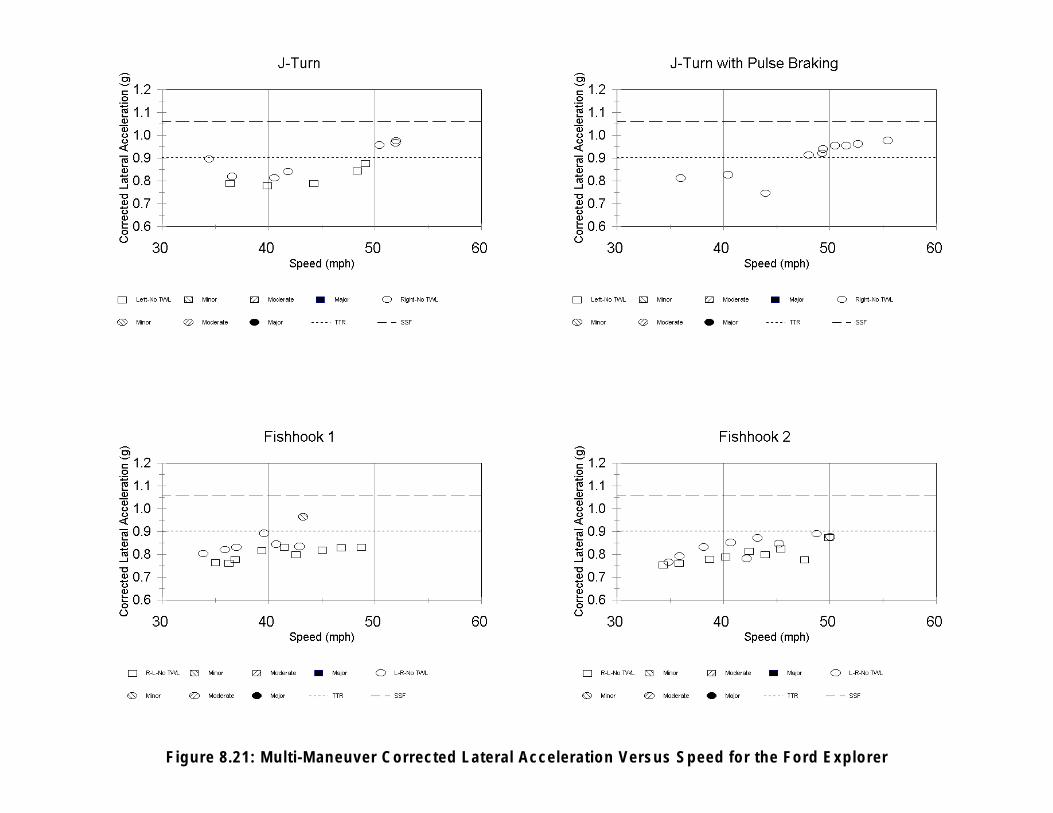
Figure 8.21: Multi-Maneuver Corrected Lateral Acceleration Versus Speed for the Ford Explorer

Figure 8.22:Multi-Maneuver Roll Angle Versus Speed for the Ford Explorer

Figure 8.23: Multi-Maneuver Corrected Lateral Acceleration Versus Speed for the Chevrolet Tracker
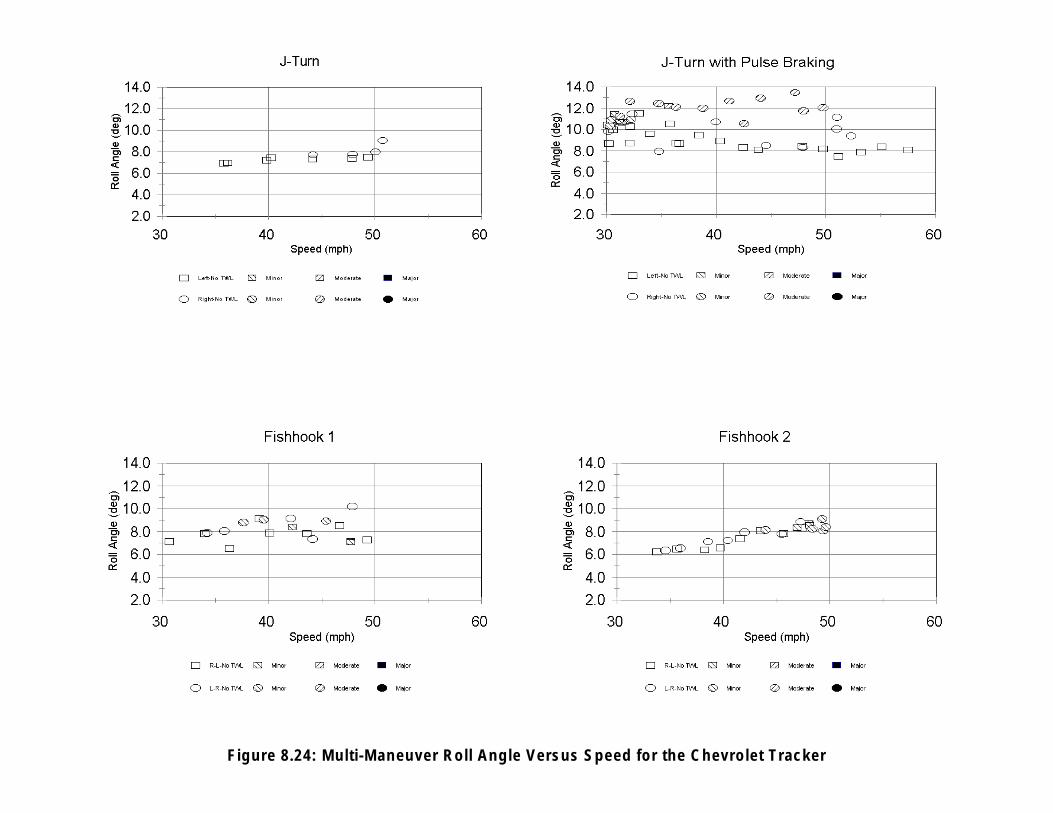
Figure 8.24: Multi-Maneuver Roll Angle Versus Speed for the Chevrolet Tracker

8.2 Multi-Vehicle Results for Each Maneuver and Steering Direction Combination
In Figures 8.25-8.42, the peak corrected lateral accelerations and roll angles are plotted as a function of speed for each maneuver and steering direction, with the odd numbered figures containing acceleration data and the even containing roll angle data. The passenger car, light truck, van, and sport utility data are plotted separately for each maneuver/steering direction combination. The individual vehicle is distinguished by symbol type. The degree of Two Wheel Lift (TWL) is represented by different fill patterns for the symbols as was the case with Figures 8.1-8.24.
The peak corrected lateral accelerations and roll angles for the J-Turn/Left maneuver are plotted in Figures 8.25 and 8.26 respectively. No TWL’s occurred for this maneuver/direction combination. All three passenger cars had very similar peak lateral accelerations and roll angles. For the light trucks, the Ranger had clearly higher peak lateral accelerations than the C1500 and S-10, but the roll angles were similar for all three. For the vans, the E-150 had higher lateral accelerations than the Astro or Caravan, and the E-150 and Astro had the largest roll angles especially at the higher speeds. For the sport utilities, the Explorer and Tracker had lateral accelerations that were higher than the Tahoe, while all three had similar roll angles.
The peak vehicle responses for the J-Turn/Right maneuver are plotted in Figures 8.27 and 8.28. The Neon had larger lateral accelerations than the other two passenger cars, but the peak roll angles are very similar for all three. The Ranger clearly produced the largest lateral accelerations of the light trucks, the C1500 was next, and the S-10 had the lowest. The Ranger was the only vehicle that produced TWL in this maneuver and therefore the peak roll angles are significantly higher than those for the other two light trucks. As was the case with J-Turn/Left, the E-150 had higher lateral accelerations than the Astro or Caravan, and the E-150 and Astro had the larger roll angles. The E-150 was not tested at higher speeds because of the concerns the driver had for safety. The Explorer and Tracker had lateral accelerations that were higher than the Tahoe, and the Tracker had roll angles that were higher than those for the Explorer and Tahoe.
79
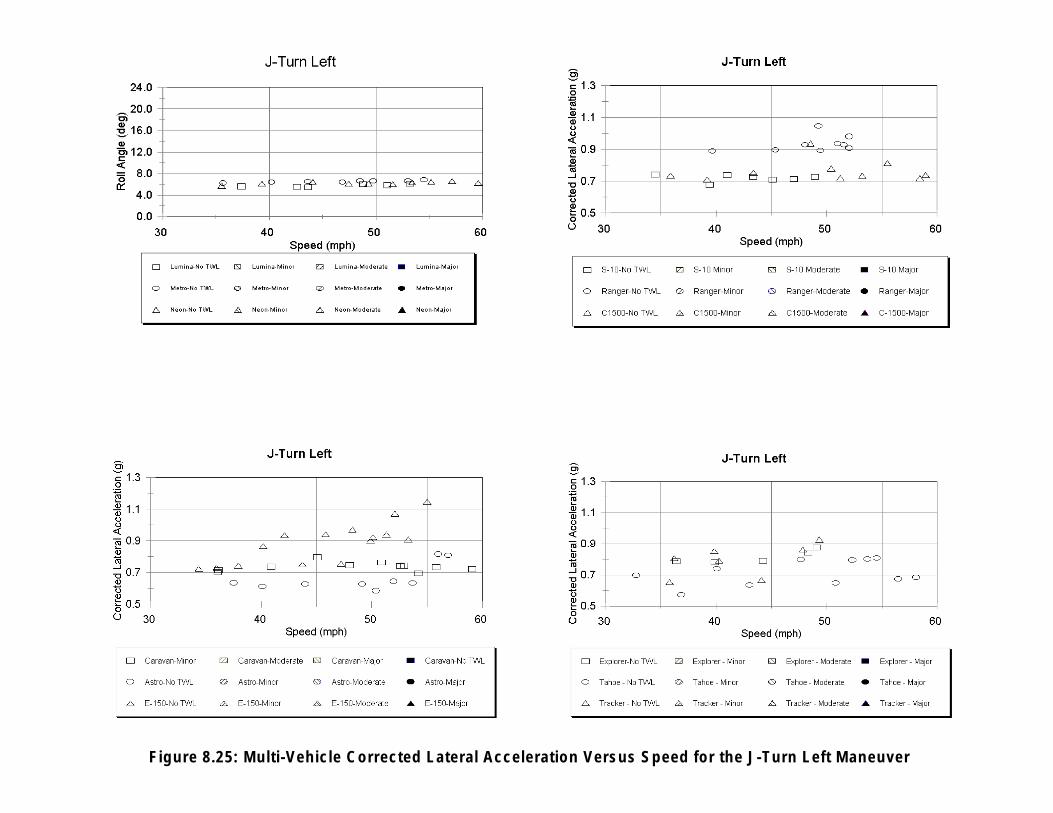
Figure 8.25: Multi-Vehicle Corrected Lateral Acceleration Versus Speed for the J-Turn Left Maneuver
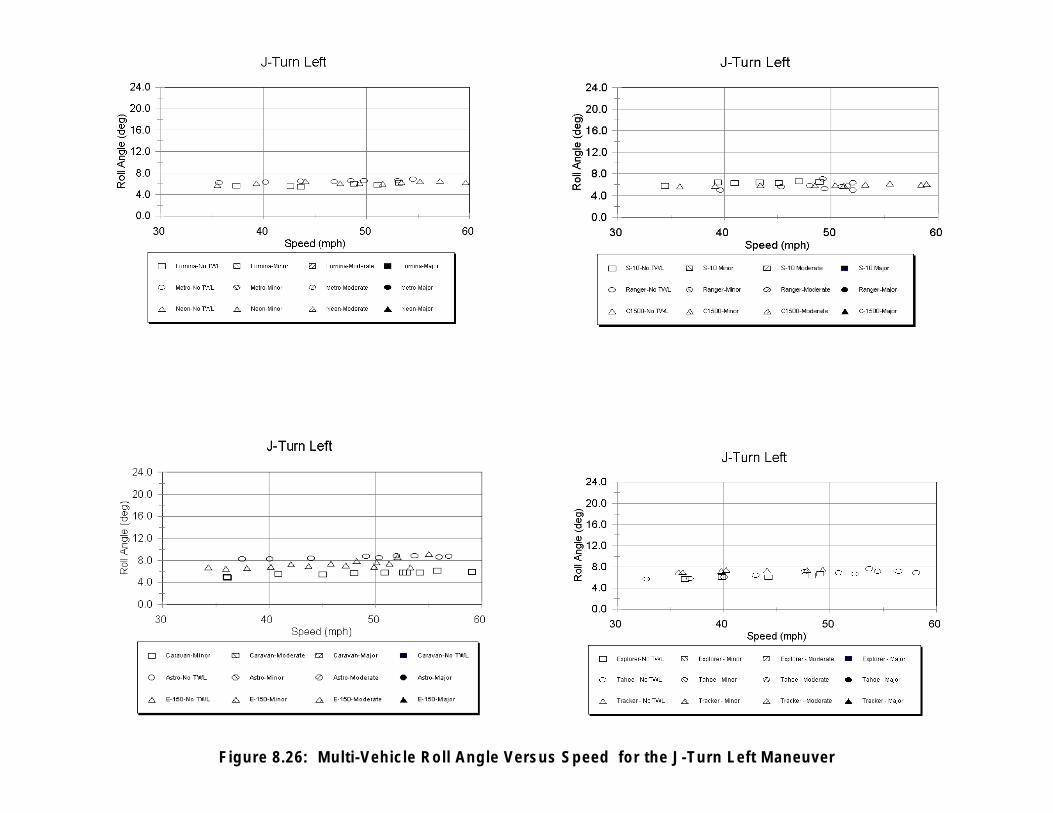
Figure 8.26: Multi-Vehicle Roll Angle Versus Speed for the J-Turn Left Maneuver
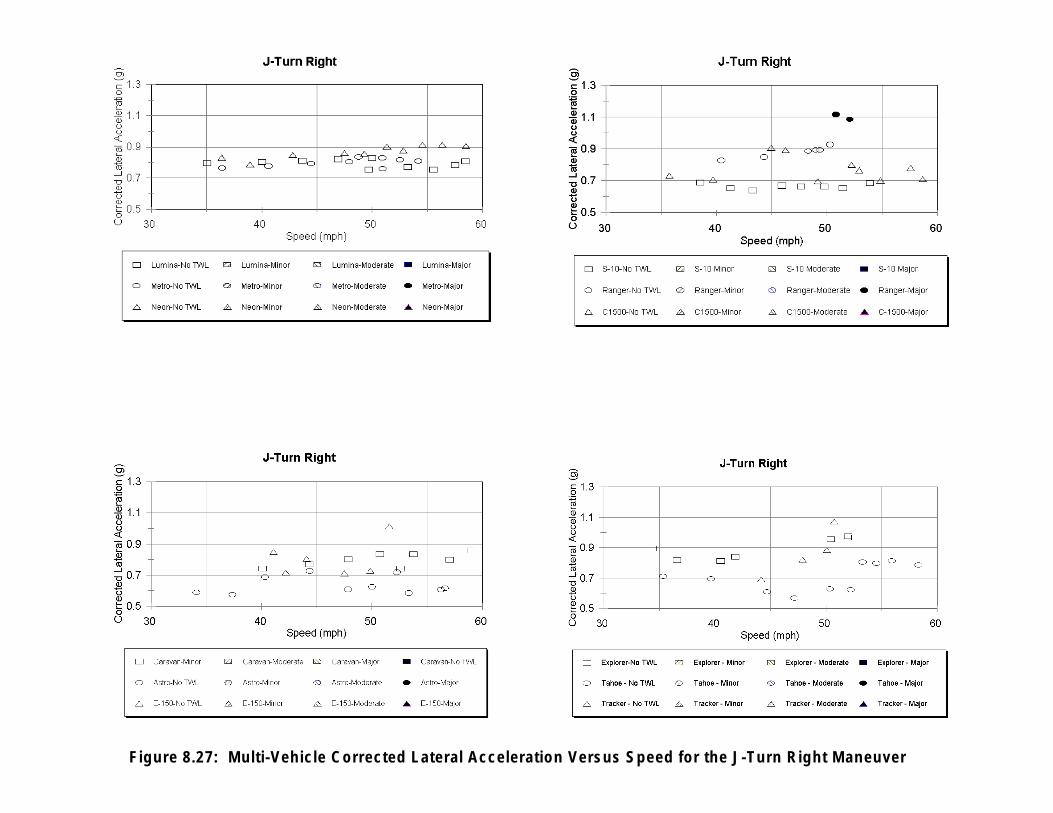
Figure 8.27: Multi-Vehicle Corrected Lateral Acceleration Versus Speed for the J-Turn Right Maneuver
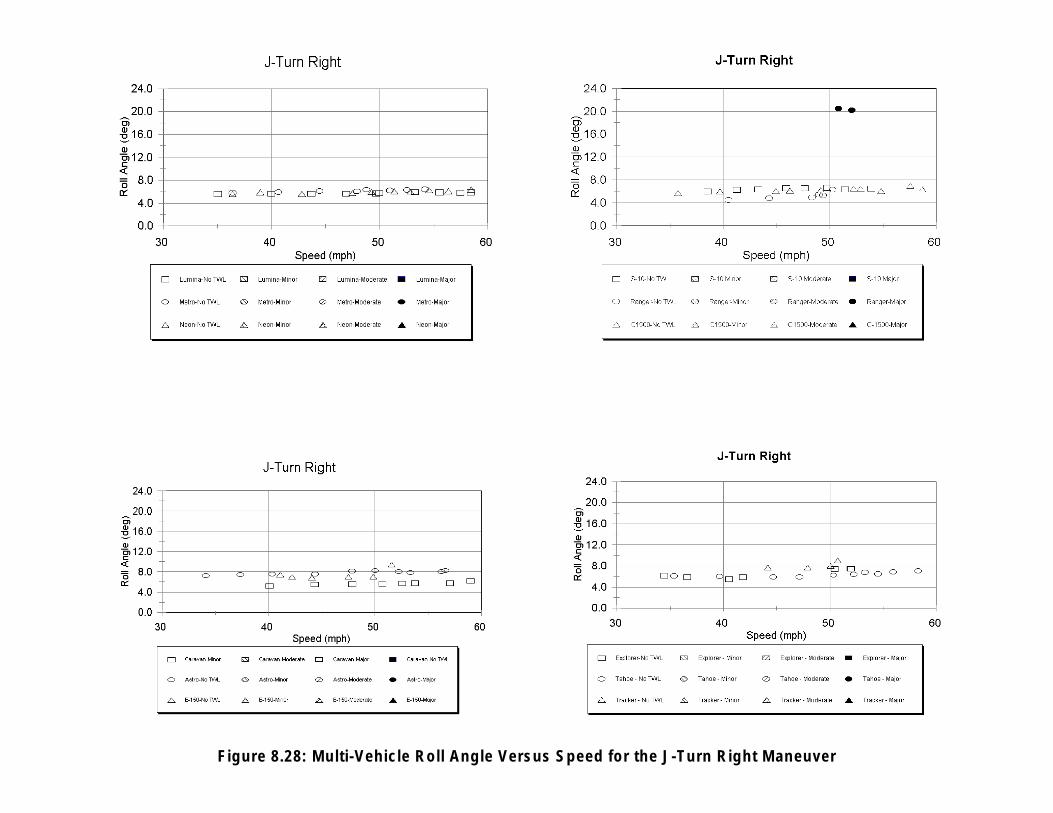
Figure 8.28: Multi-Vehicle Roll Angle Versus Speed for the J-Turn Right Maneuver
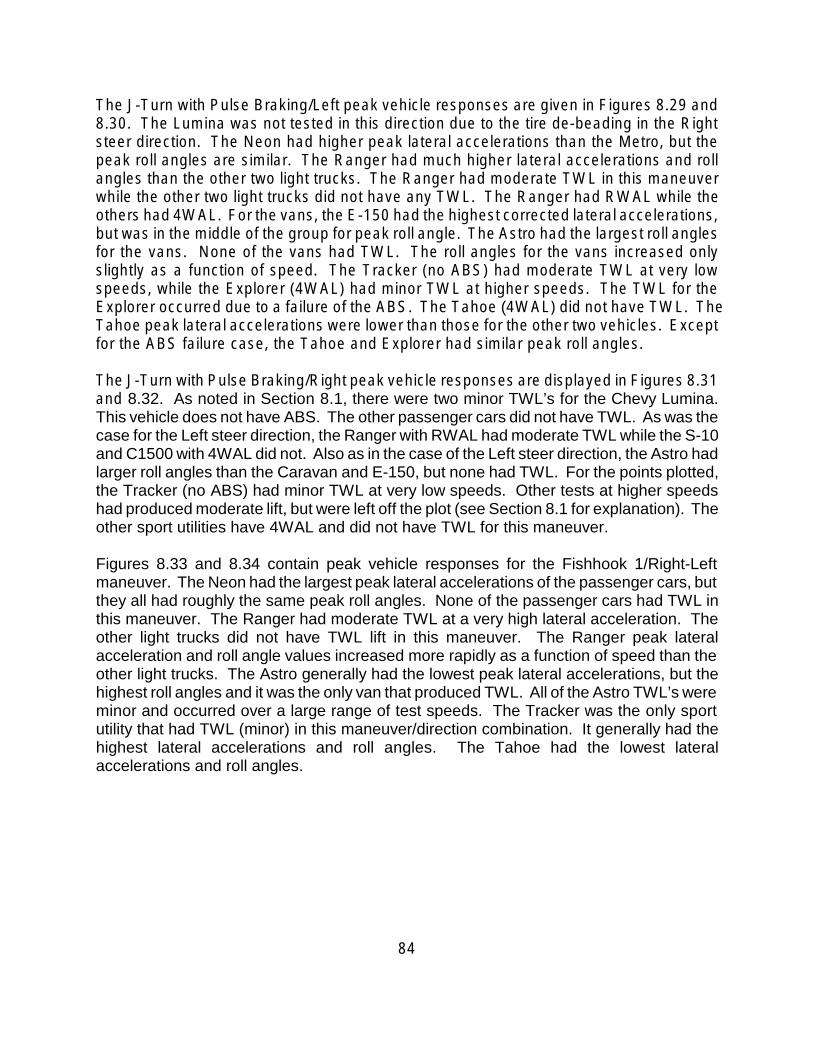
The J-Turn with Pulse Braking/Left peak vehicle responses are given in Figures 8.29 and 8.30. The Lumina was not tested in this direction due to the tire de-beading in the Right steer direction. The Neon had higher peak lateral accelerations than the Metro, but the peak roll angles are similar. The Ranger had much higher lateral accelerations and roll angles than the other two light trucks. The Ranger had moderate TWL in this maneuver while the other two light trucks did not have any TWL. The Ranger had RWAL while the others had 4WAL. For the vans, the E-150 had the highest corrected lateral accelerations, but was in the middle of the group for peak roll angle. The Astro had the largest roll angles for the vans. None of the vans had TWL. The roll angles for the vans increased only slightly as a function of speed. The Tracker (no ABS) had moderate TWL at very low speeds, while the Explorer (4WAL) had minor TWL at higher speeds. The TWL for the Explorer occurred due to a failure of the ABS. The Tahoe (4WAL) did not have TWL. The Tahoe peak lateral accelerations were lower than those for the other two vehicles. Except for the ABS failure case, the Tahoe and Explorer had similar peak roll angles.
The J-Turn with Pulse Braking/Right peak vehicle responses are displayed in Figures 8.31 and 8.32. As noted in Section 8.1, there were two minor TWL’s for the Chevy Lumina. This vehicle does not have ABS. The other passenger cars did not have TWL. As was the case for the Left steer direction, the Ranger with RWAL had moderate TWL while the S-10 and C1500 with 4WAL did not. Also as in the case of the Left steer direction, the Astro had larger roll angles than the Caravan and E-150, but none had TWL. For the points plotted, the Tracker (no ABS) had minor TWL at very low speeds. Other tests at higher speeds had produced moderate lift, but were left off the plot (see Section 8.1 for explanation). The other sport utilities have 4WAL and did not have TWL for this maneuver.
Figures 8.33 and 8.34 contain peak vehicle responses for the Fishhook 1/Right-Left maneuver. The Neon had the largest peak lateral accelerations of the passenger cars, but they all had roughly the same peak roll angles. None of the passenger cars had TWL in this maneuver. The Ranger had moderate TWL at a very high lateral acceleration. The other light trucks did not have TWL lift in this maneuver. The Ranger peak lateral acceleration and roll angle values increased more rapidly as a function of speed than the other light trucks. The Astro generally had the lowest peak lateral accelerations, but the highest roll angles and it was the only van that produced TWL. All of the Astro TWL’s were minor and occurred over a large range of test speeds. The Tracker was the only sport utility that had TWL (minor) in this maneuver/direction combination. It generally had the highest lateral accelerations and roll angles. The Tahoe had the lowest lateral accelerations and roll angles.
84

Figure 8.29: Multi-Vehicle Corrected Lateral Acceleration Versus Speed for the J-Turn with Pulse Braking - Left Maneuver
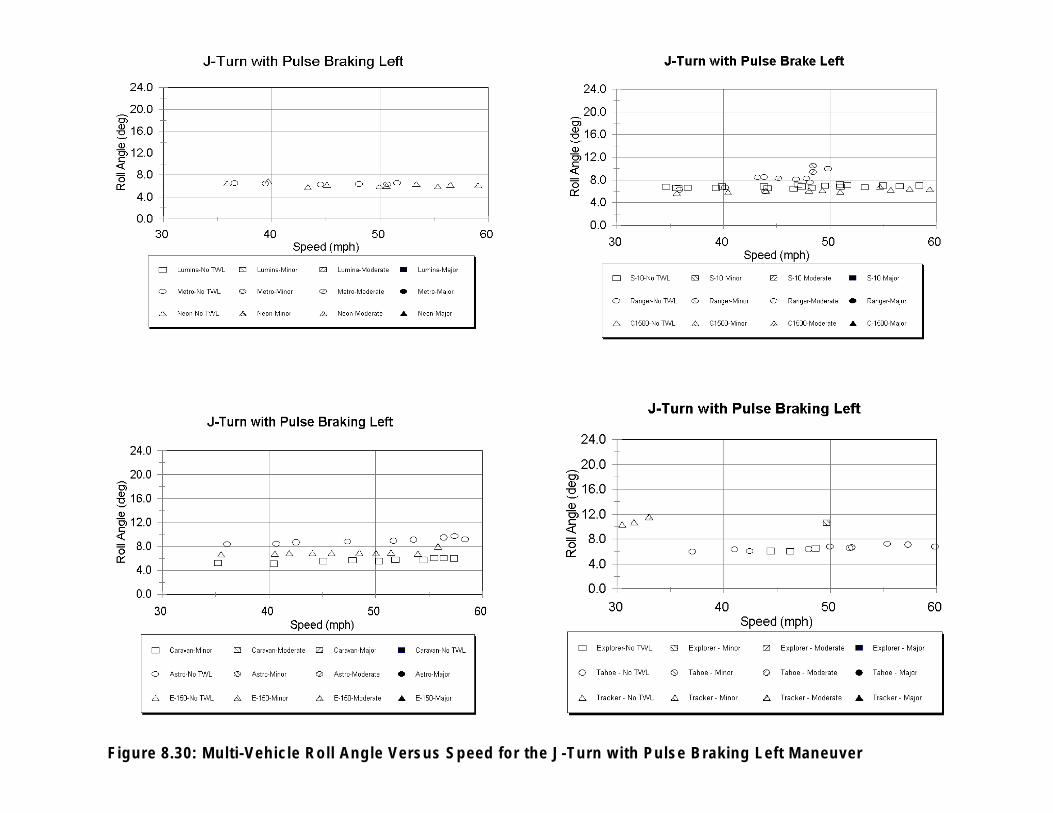
Figure 8.30: Multi-Vehicle Roll Angle Versus Speed for the J-Turn with Pulse Braking Left Maneuver
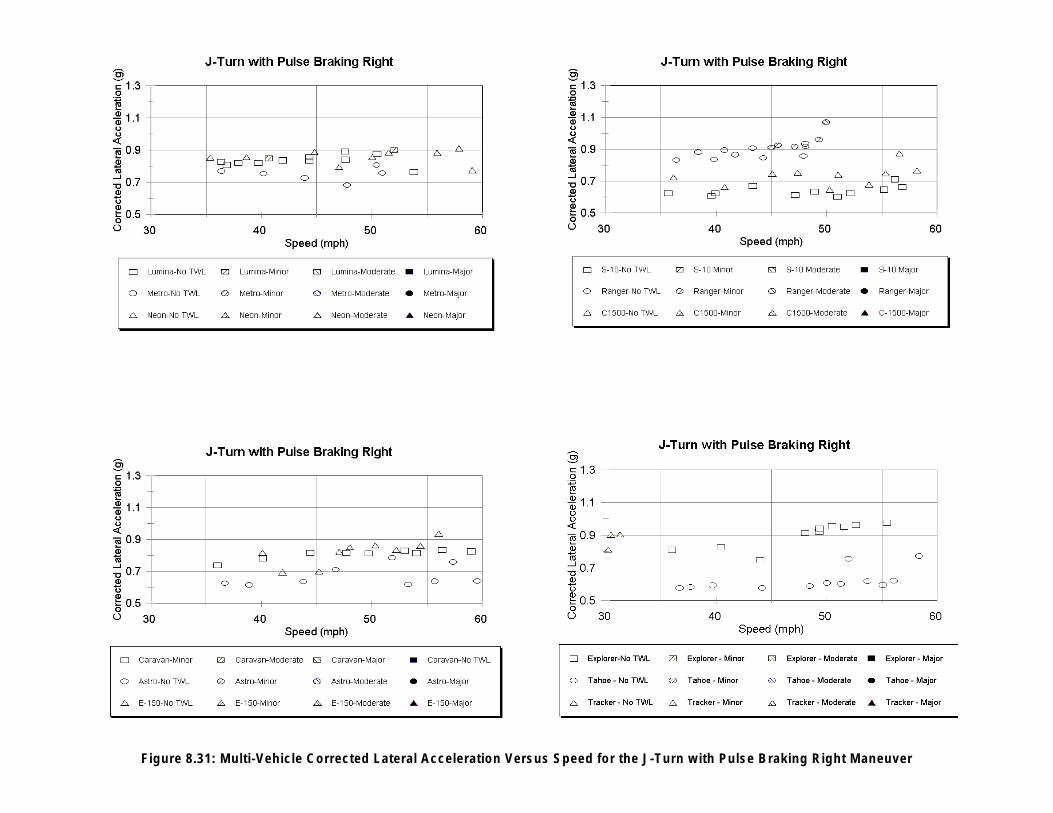
Figure 8.31: Multi-Vehicle Corrected Lateral Acceleration Versus Speed for the J-Turn with Pulse Braking Right Maneuver

Figure 8.32: Multi-Vehicle Roll Angle Versus Speed for the J-Turn with Pulse Braking Right Maneuver
Figure 8.33: Multi-Vehicle Corrected Lateral Acceleration Versus Speed for the Fishhook #1 Right to Left Maneuver

Figure 8.34: Multi-Vehicle Roll Angle Versus Speed for the Fishhook #1 Right to Left Maneuver

Figures 8.35 and 8.36 contain peak vehicle responses for the Fishhook 1/Left-Right maneuver. The Neon had slightly lower roll angles than the Lumina, while the Metro had slightly higher roll angles. The Ranger peak lateral acceleration and roll angle values have a much sharper rise in value as a function of speed compared to the other light trucks. It was also the only light truck that produced TWL in this maneuver (minor). As was the case in the opposite direction (Right-Left), the Astro had the lowest lateral accelerations, but the highest roll angles, although none of the tests resulted in TWL for this direction. The E-150 did have one case of minor TWL for this maneuver/direction combination. The Tracker and Explorer both had minor TWL for this maneuver/direction combination. They had higher lateral accelerations and roll angles than the Tahoe.
The Fishhook 2/Right-Left peak vehicle responses are given in Figures 8.37 and 8.38. None of the passenger cars had TWL in this maneuver. None of the light trucks had TWL for this maneuver/direction, but the Ranger had major TWL in the opposite direction (discussed further in the next paragraph). The Ranger did have the largest peak lateral accelerations and generally the higher peak roll angles. These lateral accelerations and roll angles increased as a function of speed more rapidly than the other light trucks. The Astro generally had the lowest lateral accelerations, but the highest roll angles. The one Astro test that did result in minor TWL had a much higher peak lateral acceleration than the other Astro tests. None of the other vans had TWL for this maneuver. Both the Tracker and the Tahoe had minor TWL for this maneuver/direction. Small increases in speed did not produce greater TWL.
The Fishhook 2/Left-Right peak vehicle responses are given in Figures 8.39 and 8.40. As stated in the previous paragraph, none of the passenger cars had TWL in this maneuver. The Ranger had major TWL for this maneuver/direction. The peak lateral acceleration and roll angle values increased as a function of speed at a faster rate than the other light trucks. The other light trucks did not have TWL. The Astro had the lowest accelerations for the van, but the highest roll angles. The E-150 had lateral acceleration values that increased relatively rapidly with speed, but this did not result in a rapid rise in roll angle nor did it result in TWL. Both the Tracker and the Tahoe had minor TWL for this maneuver/direction. The Explorer generally had higher lateral accelerations than the Tracker and Tahoe, but did not have TWL.
Peak vehicle responses for the Resonant Steer maneuver are given in Figures 8.41 and 8.42. For these tests, the speed was kept constant while the steering magnitude was increased. In general, the peak lateral acceleration and roll angle values increased with steering magnitude with some vehicles reaching a plateau at the higher steering magnitudes. This was most notable for the Chevrolet Astro and Chevrolet Tracker peak roll angles.
91

Figure 8.35: Multi-Vehicle Corrected Lateral Acceleration Versus Speed for the Fishhook #1 Left to Right Maneuver

Figure 8.36: Multi-Vehicle Roll Angle Versus Speed for the Fishhook #1 Left to Right Maneuver

Figure 8.37: Multi-Vehicle Corrected Lateral Acceleration Versus Speed for the Fishhook #2 Right to Left Maneuver
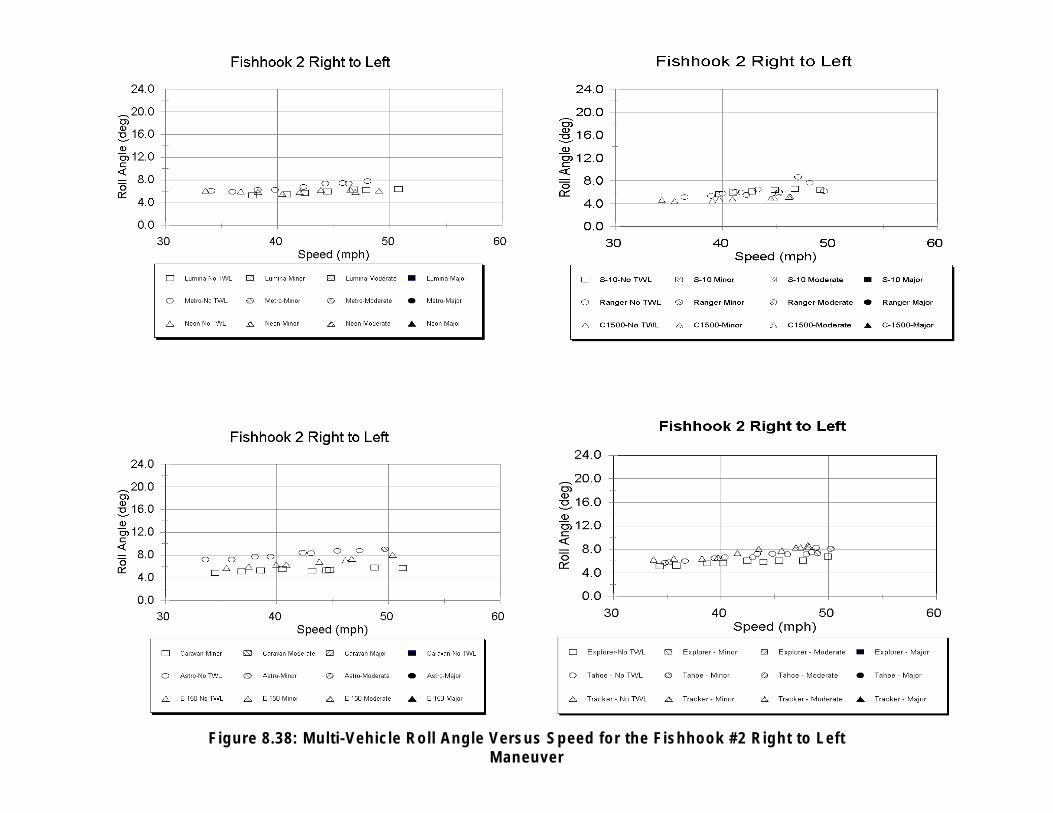
Figure 8.38: Multi-Vehicle Roll Angle Versus Speed for the Fishhook #2 Right to Left Maneuver

Figure 8.39: Multi-Vehicle Corrected Lateral Acceleration Versus Speed for the Fishhook #2 Left to Right Maneuver
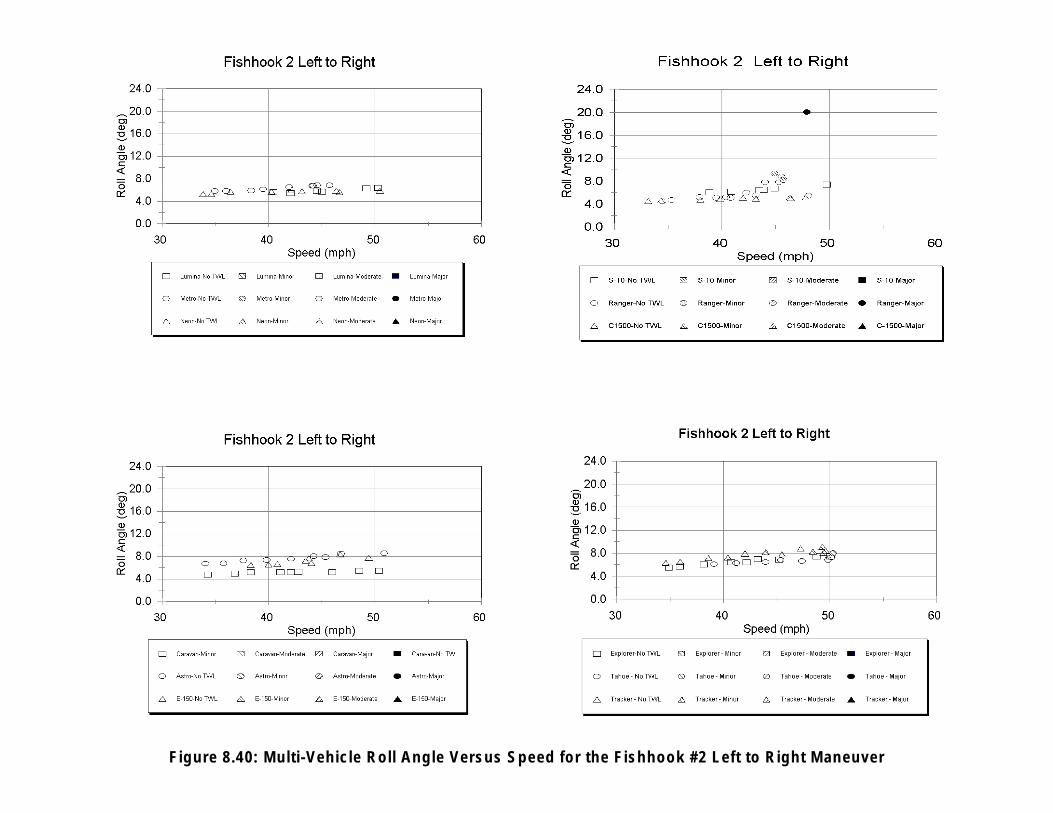
Figure 8.40: Multi-Vehicle Roll Angle Versus Speed for the Fishhook #2 Left to Right Maneuver
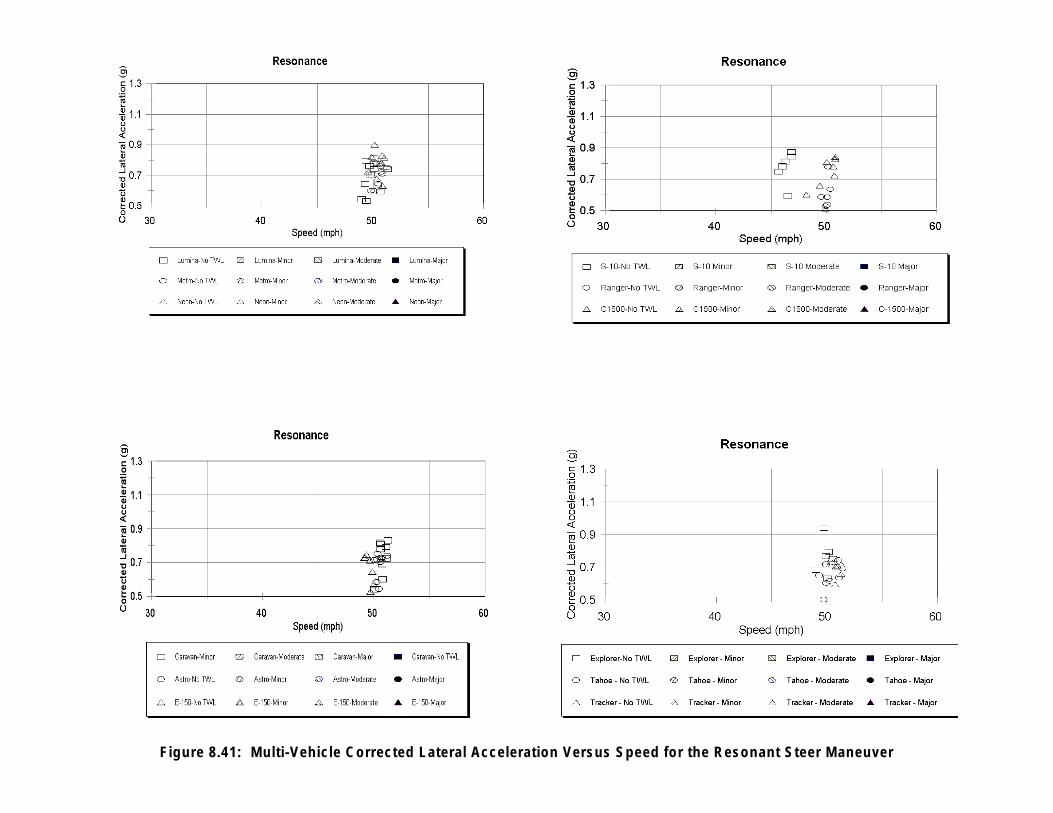
Figure 8.41: Multi-Vehicle Corrected Lateral Acceleration Versus Speed for the Resonant Steer Maneuver
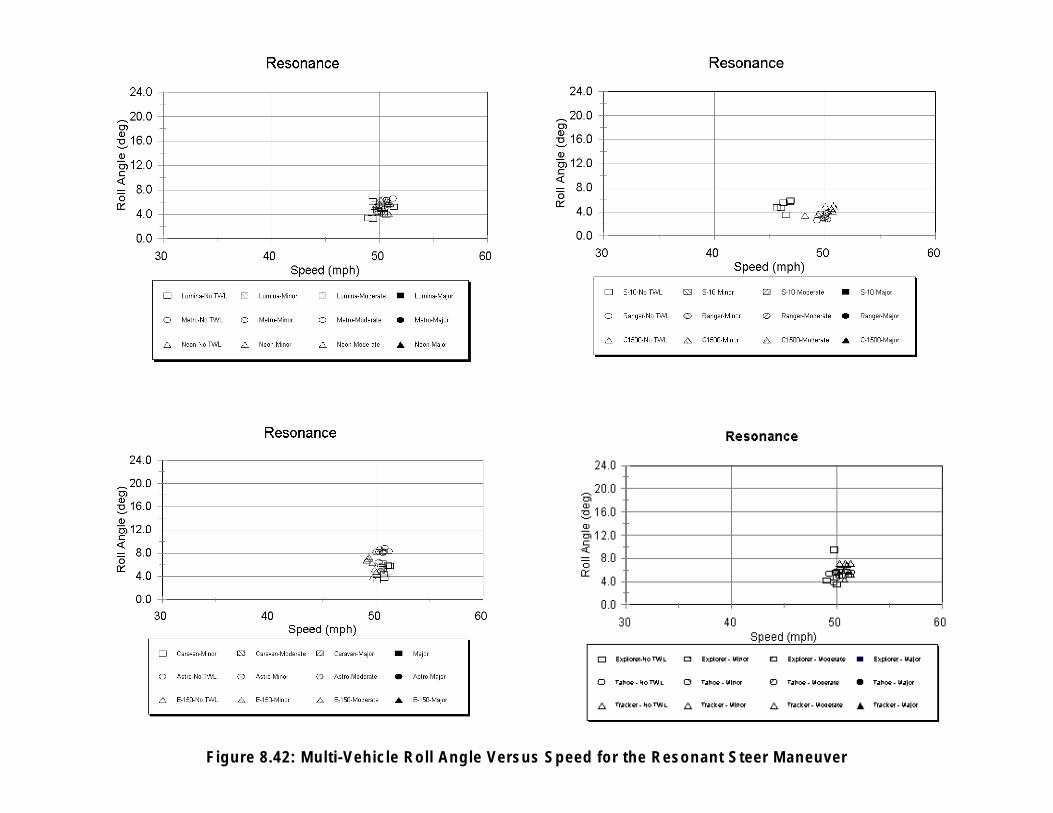
Figure 8.42: Multi-Vehicle Roll Angle Versus Speed for the Resonant Steer Maneuver
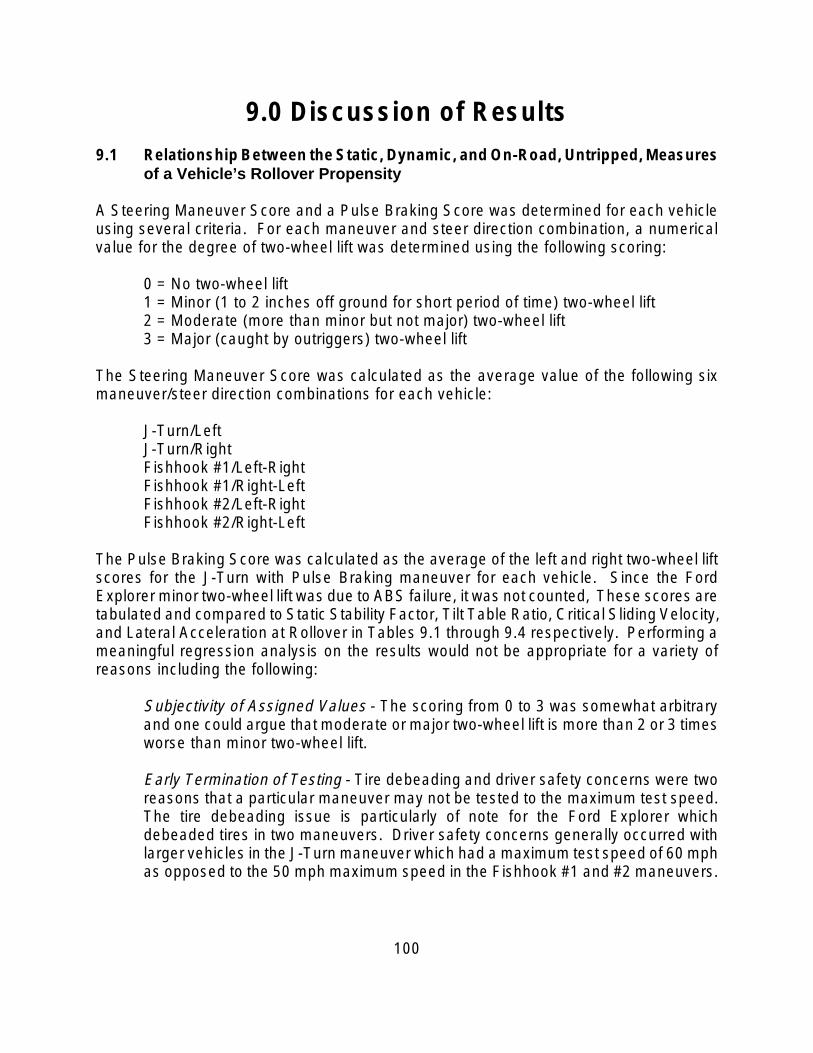
9.0 Discussion of Results 9.1 Relationship Between the Static, Dynamic, and On-Road, Untripped, Measures
of a Vehicle’s Rollov er Propensity
A Steering Maneuver Score and a Pulse Braking Score was determined for each vehicle using several criteria. For each maneuver and steer direction combination, a numerical value for the degree of two-wheel lift was determined using the following scoring:
0 = No two-wheel lift1 = Minor (1 to 2 inches off ground for short period of time) two-wheel lift2 = Moderate (more than minor but not major) two-wheel lift3 = Major (caught by outriggers) two-wheel lift
The Steering Maneuver Score was calculated as the average value of the following six maneuver/steer direction combinations for each vehicle:
J-Turn/LeftJ-Turn/RightFishhook #1/Left-RightFishhook #1/Right-LeftFishhook #2/Left-RightFishhook #2/Right-Left
The Pulse Braking Score was calculated as the average of the left and right two-wheel lift scores for the J-Turn with Pulse Braking maneuver for each vehicle. Since the Ford Explorer minor two-wheel lift was due to ABS failure, it was not counted, These scores are tabulated and compared to Static Stability Factor, Tilt Table Ratio, Critical Sliding Velocity, and Lateral Acceleration at Rollover in Tables 9.1 through 9.4 respectively. Performing a meaningful regression analysis on the results would not be appropriate for a variety of reasons including the following:
Subjectivity of Assigned Values - The scoring from 0 to 3 was somewhat arbitrary and one could argue that moderate or major two-wheel lift is more than 2 or 3 times worse than minor two-wheel lift.
Early Termination of Testing - Tire debeading and driver safety concerns were two reasons that a particular maneuver may not be tested to the maximum test speed. The tire debeading issue is particularly of note for the Ford Explorer which debeaded tires in two maneuvers. Driver safety concerns generally occurred with larger vehicles in the J-Turn maneuver which had a maximum test speed of 60 mph as opposed to the 50 mph maximum speed in the Fishhook #1 and #2 maneuvers.
100

As seen in Tables 9.1 through 9.3 and Figures 9.1 through 9.6, the static and dynamic metrics relate to the Steering Maneuver Scores. In Table 9.1 the six vehicles with the lowest Static Stability Factor are the only ones that produced any type of two-wheel lift in the maneuvers used to calculate the Steering Maneuver Score. The Ford Ranger had the highest Steering Maneuver Score (1.5) and the second lowest Static Stability Factor, but the Ford Explorer had the lowest Static Stability Factor and a relatively low Steering Maneuver Score (0.17). It should be noted again that the Explorer was not fully tested due to tire debeading concerns. The same sort of statements can be made for Tilt Table Ratio. The six vehicles with the lowest Tilt Table Ratio produced some sort of two-wheel lift, while the six vehicles with the highest Tilt Table Ratio did not. For Critical Sliding Velocity (Table 9.3) the Chevrolet S-10 has a relatively low Critical Sliding Value (4th lowest of the 12 vehicles tested), but it did not produce two-wheel lift. Except for the S-10, six of the seven vehicles with the lowest Critical Sliding Velocity did have some degree of two-wheel lift.
Table 9.1: Static Stability Factor vs. Untripped Rollover Propensity
Vehicle Static
Stability Factor
Steering Maneuver
Score ABS
Pulse Braking Score
1998 Ford Explorer 1.07 0.17 4WAL 0.00
1997 Ford Ranger 1.08 1.50 RWAL 2.00
1998 Ford E150 Club Wagon
1.11 0.17 4WAL 0.00
1998 Chevrolet Astro 1.13 0.33 4WAL 0.00
1998 Chevrolet Tahoe 1.13 0.33 4WAL 0.00
1998 Chevrolet Tracker 1.14 0.67 None 2.00
1998 Chevrolet S-10 1.16 0.00 4WAL 0.00
1998 Chevrolet C1500 1.23 0.00 4WAL 0.00
1998 Dodge Caravan 1.26 0.00 None 0.00
1998 Chevrolet Metro 1.28 0.00 None 0.00
1998 Chevrolet Lumina 1.37 0.00 None 0.50
1998 Dodge Neon 1.44 0.00 None 0.00
101
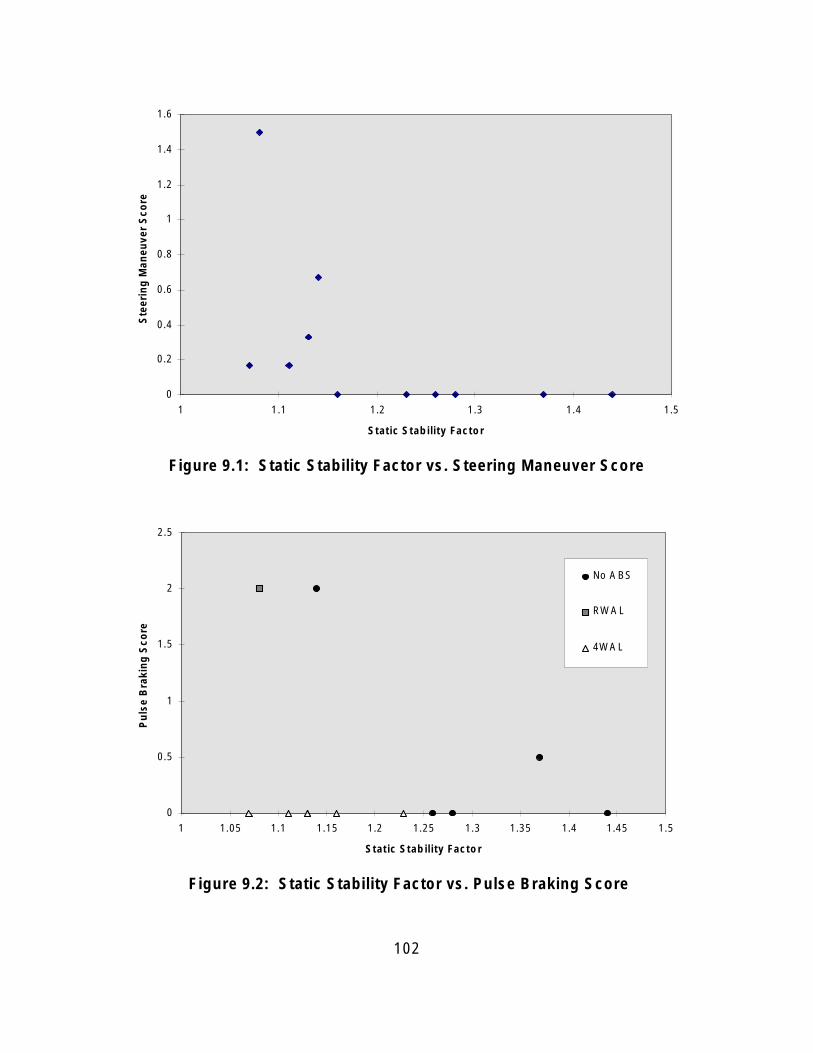
1.6
Pu
lse
Bra
kin
g S
core
S
teer
ing
Man
euve
r S
core
1.4
1.2
1
0.8
0.6
0.4
0.2
0
1 1.1 1.2 1.3 1.4 1.5
Static Stability Factor
Figure 9.1: Static Stability Factor vs. Steering Maneuver Score
2.5
2
1.5
1
0.5
0
1 1.05 1.1 1.15 1.2 1.25 1.3 1.35 1.4 1.45 1.5
No A BS
RWA L
4WA L
Static Stability Factor
Figure 9.2: Static Stability Factor vs. Pulse Braking Score
102

Table 9.2: Tilt Table Ratio vs. Untripped Rollover Propensity
Vehicle Tilt Table
Ratio
Steering Maneuver
Score ABS
Pulse Braking Score
1998 Ford Explorer 0.88 0.17 4WAL 0.00
1997 Ford Ranger 0.93 1.50 RWAL 2.00
1998 Chevrolet Astro 0.98 0.33 4WAL 0.00
1998 Chevrolet Tahoe 0.98 0.33 4WAL 0.00
1998 Ford E150 Club Wagon
1.00 0.17 4WAL 0.00
1998 Chevrolet Tracker 1.01 0.67 None 2.00
1998 Chevrolet S-10 1.06 0.00 4WAL 0.00
1998 Dodge Caravan 1.07 0.00 None 0.00
1998 Chevrolet C1500 1.08 0.00 4WAL 0.00
1998 Chevrolet Lumina 1.13 0.00 None 0.50
1998 Chevrolet Metro 1.14 0.00 None 0.00
1998 Dodge Neon 1.28 0.00 None 0.00
103

1.6
Pu
lse
Bra
kin
g S
core
S
teer
ing
Man
euve
r S
core
1.4
1.2
1
0.8
0.6
0.4
0.2
0
2.5
2
1.5
1
0.5
0
0.7 0.8 0.9 1 1.1 1.2
Tilt Table Ratio
Figure 9.3: Tilt Table Ratio vs. Steering Maneuver Score
No ABS
RW AL
4W AL
0.8 0.9 1 1.1 1.2 1.3
Tilt Table Ratio
Figure 9.4: Tilt Table Ratio vs. Pulse Braking Score
104
1.3
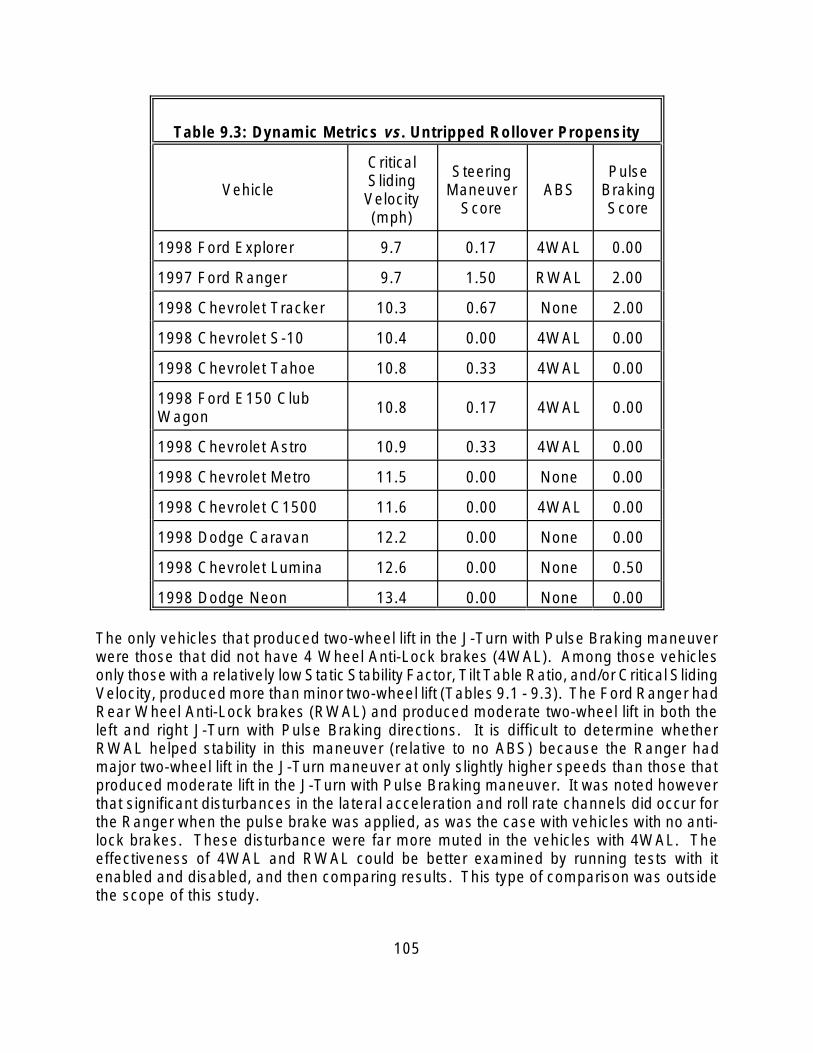
Table 9.3: Dynamic Metrics vs. Untripped Rollover Propensity
Vehicle
Critical Sliding Velocity (mph)
Steering Maneuver
Score ABS
Pulse Braking Score
1998 Ford Explorer
1997 Ford Ranger
1998 Chevrolet Tracker
1998 Chevrolet S-10
1998 Chevrolet Tahoe
1998 Ford E150 Club Wagon
1998 Chevrolet Astro
1998 Chevrolet Metro
1998 Chevrolet C1500
1998 Dodge Caravan
1998 Chevrolet Lumina
1998 Dodge Neon
9.7 0.17 4WAL 0.00
9.7 1.50 RWAL 2.00
10.3 0.67 None 2.00
10.4 0.00 4WAL 0.00
10.8 0.33 4WAL 0.00
10.8 0.17 4WAL 0.00
10.9 0.33 4WAL 0.00
11.5 0.00 None 0.00
11.6 0.00 4WAL 0.00
12.2 0.00 None 0.00
12.6 0.00 None 0.50
13.4 0.00 None 0.00
The only vehicles that produced two-wheel lift in the J-Turn with Pulse Braking maneuver were those that did not have 4 Wheel Anti-Lock brakes (4WAL). Among those vehicles only those with a relatively low Static Stability Factor, Tilt Table Ratio, and/or Critical Sliding Velocity, produced more than minor two-wheel lift (Tables 9.1 - 9.3). The Ford Ranger had Rear Wheel Anti-Lock brakes (RWAL) and produced moderate two-wheel lift in both the left and right J-Turn with Pulse Braking directions. It is difficult to determine whether RWAL helped stability in this maneuver (relative to no ABS) because the Ranger had major two-wheel lift in the J-Turn maneuver at only slightly higher speeds than those that produced moderate lift in the J-Turn with Pulse Braking maneuver. It was noted however that significant disturbances in the lateral acceleration and roll rate channels did occur for the Ranger when the pulse brake was applied, as was the case with vehicles with no anti-lock brakes. These disturbance were far more muted in the vehicles with 4WAL. The effectiveness of 4WAL and RWAL could be better examined by running tests with it enabled and disabled, and then comparing results. This type of comparison was outside the scope of this study.
105
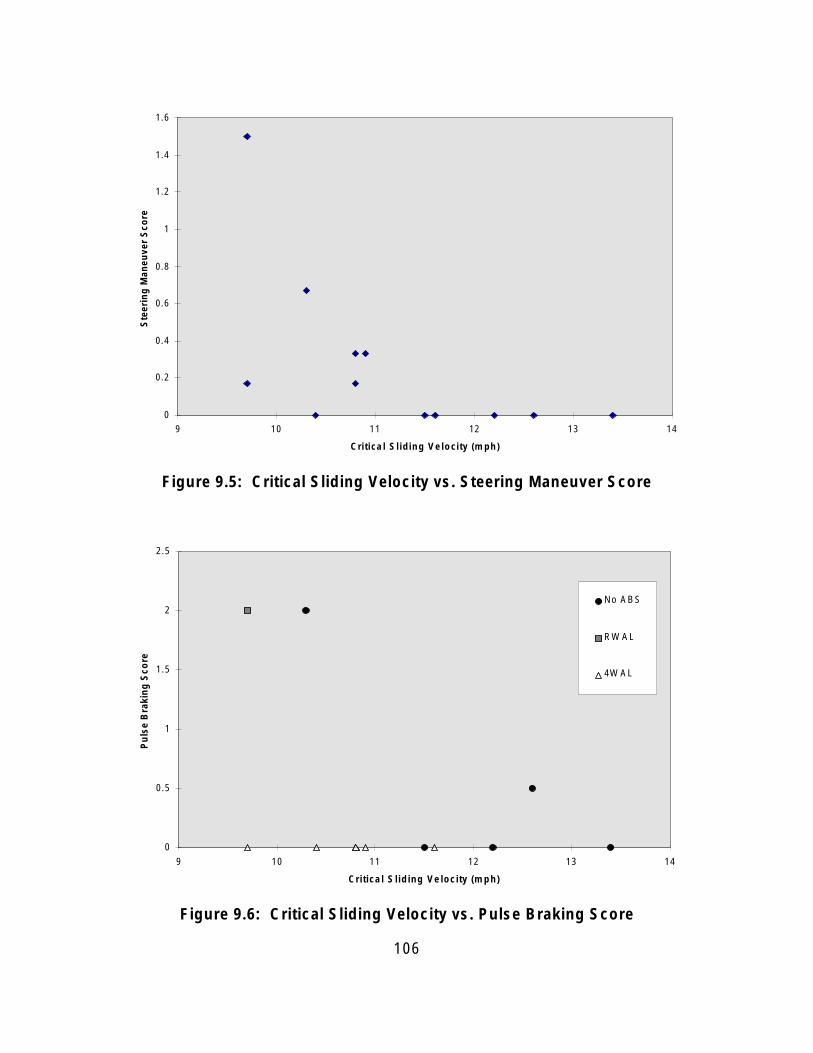
1.6
Pu
lse
Bra
kin
g S
core
S
teer
ing
Man
euve
r S
core
1.4
1.2
1
0.8
0.6
0.4
0.2
0
9 10 11 12 13 14
Critical Sliding Velocity (mph)
Figure 9.5: Critical Sliding Velocity vs. Steering Maneuver Score
2.5
2
1.5
1
0.5
0
9 10 11 12 13 14
No ABS
RW AL
4W AL
Critical Sliding Velocity (mph)
Figure 9.6: Critical Sliding Velocity vs. Pulse Braking Score
106

The Steering Maneuver and Pulse Braking Scores are tabulated in Table 9.4 (and in Figures 9.7 and 9.8) with the vehicles ranked from lowest to highest in terms of Lateral Acceleration at Rollover. Neither the Maneuver Score nor the Pulse Braking score relates as well with Lateral Acceleration at Rollover as it did for Static Stability Factor, Tilt Table Ratio, or Critical Sliding Velocity. The Ford Ranger was in the bottom half of the vehicles tested even though it had the highest Steering Maneuver Score. Three vehicles that did not have two-wheel lift in the maneuvers used to compute the Steering Maneuver Score had lower Lateral Acceleration at Rollover values than the Ranger, but it should be noted that the values for these vehicles have greater than symbols in front of them because the lateral acceleration required to produce two-wheel lift for these vehicles is not known.
Table 9.4: Lateral Acceleration at Rollover vs. Untripped Rollover Propensity
Vehicle
Lateral Acceleration at Rollover
Steering Maneuver
Score ABS
Pulse Braking Score
1998 Chevrolet Tahoe 0.69 0.33 4WAL 0.00 1998 Chevrolet Astro 0.72 0.33 4WAL 0.00 1998 Chevrolet Tracker 0.75 0.67 None 2.00 1998 Ford E150 Club Wagon
0.78 0.17 4WAL 0.00
1998 Dodge Caravan >0.80 0.00 None 0.00 1998 Chevrolet C1500 >0.85 0.00 4WAL 0.00 1998 Chevrolet Lumina >0.87 0.00 None 0.50 1997 Ford Ranger 0.90 1.50 RWAL 2.00 1998 Chevrolet S-10 >0.91 0.00 4WAL 0.00 1998 Chevrolet Metro >0.92 0.00 None 0.00 1998 Ford Explorer 0.93 0.17 4WAL 0.00 1998 Dodge Neon >0.99 0.00 None 0.00
Note: Lateral Acceleration at Rollover is the combined value of the Fishhook #1 and #2 Tests from Table 7.8.
107
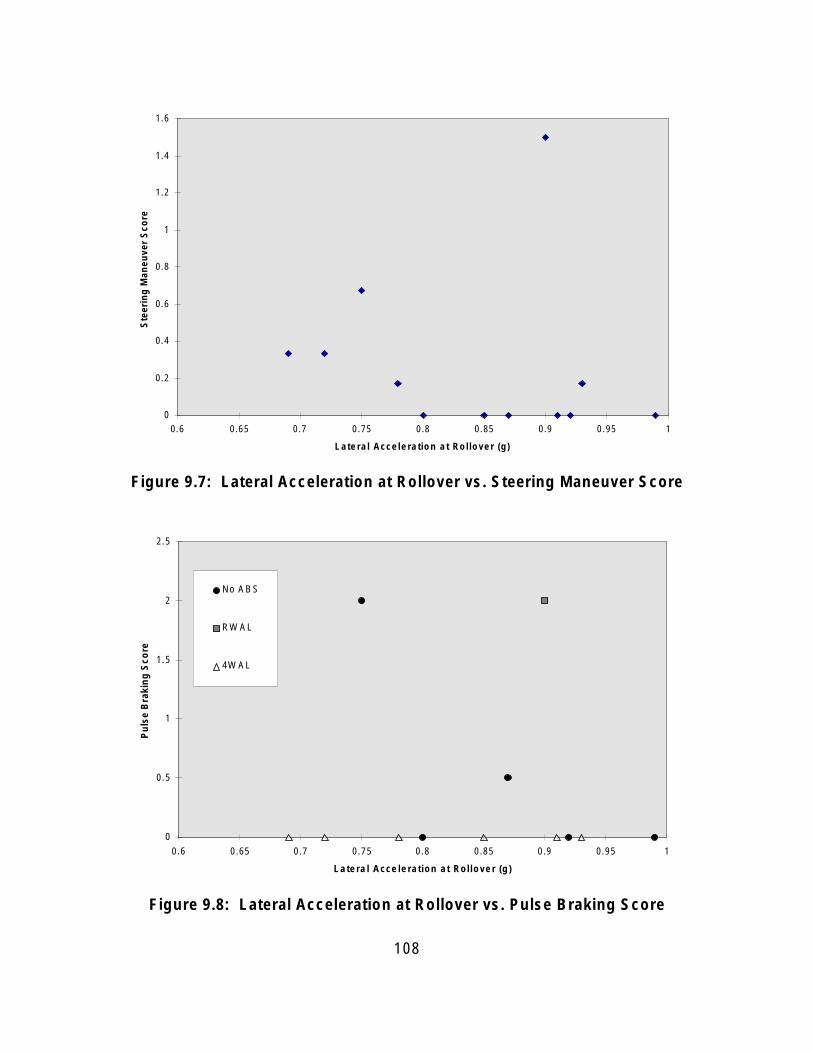
1.6
1.4
1.2
1
0.8
0.6
0.4
0.2
0
0.6 0.65 0.7 0.75 0.8 0.85 0.9 0.95 1
Lateral Acceleration at Rollover (g)
Figure 9.7: Lateral Acceleration at Rollover vs. Steering Maneuver Score
2.5
2
1.5
1
0.5
0
0.6 0.65 0.7 0.75 0.8 0.85 0.9 0.95 1
No ABS
RW AL
4W AL
Lateral Acceleration at Rollover (g)
Figure 9.8: Lateral Acceleration at Rollover vs. Pulse Braking Score
Pu
lse
Bra
kin
g S
core
S
teer
ing
Man
euve
r S
core
108
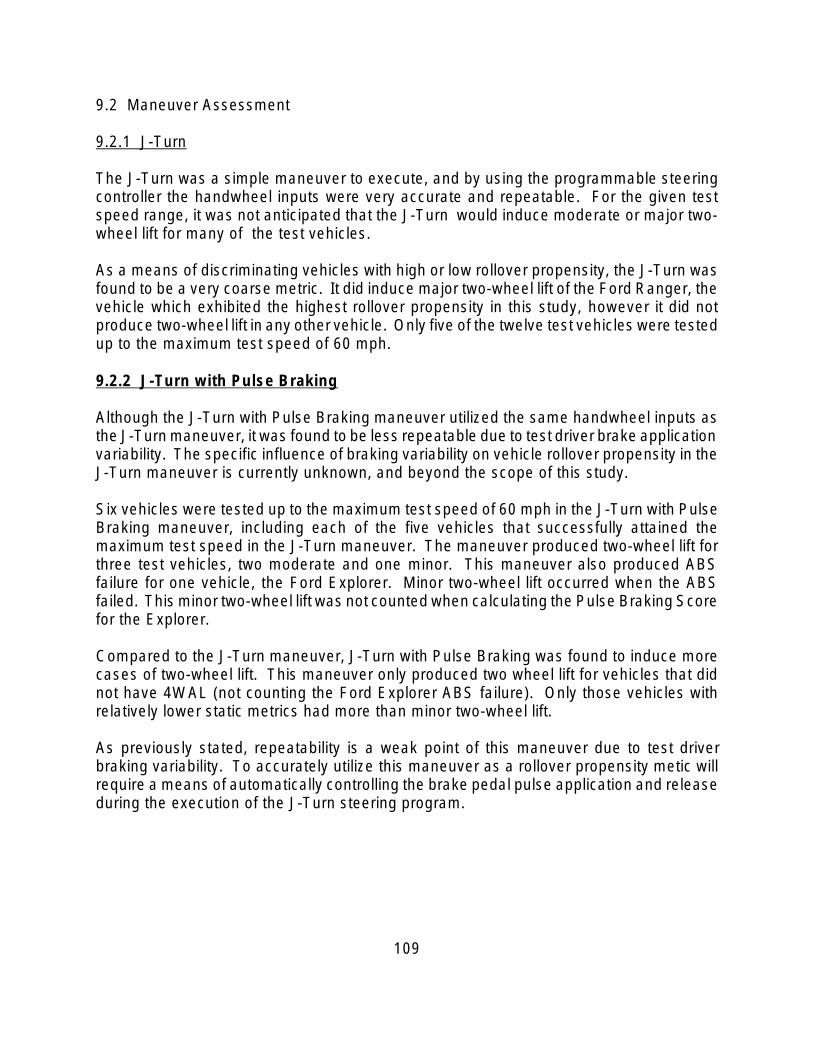
9.2 Maneuver Assessment
9.2.1 J-Turn
The J-Turn was a simple maneuver to execute, and by using the programmable steering controller the handwheel inputs were very accurate and repeatable. For the given test speed range, it was not anticipated that the J-Turn would induce moderate or major two-wheel lift for many of the test vehicles.
As a means of discriminating vehicles with high or low rollover propensity, the J-Turn was found to be a very coarse metric. It did induce major two-wheel lift of the Ford Ranger, the vehicle which exhibited the highest rollover propensity in this study, however it did not produce two-wheel lift in any other vehicle. Only five of the twelve test vehicles were tested up to the maximum test speed of 60 mph.
9.2.2 J-Turn with Pulse Braking
Although the J-Turn with Pulse Braking maneuver utilized the same handwheel inputs as the J-Turn maneuver, it was found to be less repeatable due to test driver brake application variability. The specific influence of braking variability on vehicle rollover propensity in the J-Turn maneuver is currently unknown, and beyond the scope of this study.
Six vehicles were tested up to the maximum test speed of 60 mph in the J-Turn with Pulse Braking maneuver, including each of the five vehicles that successfully attained the maximum test speed in the J-Turn maneuver. The maneuver produced two-wheel lift for three test vehicles, two moderate and one minor. This maneuver also produced ABS failure for one vehicle, the Ford Explorer. Minor two-wheel lift occurred when the ABS failed. This minor two-wheel lift was not counted when calculating the Pulse Braking Score for the Explorer.
Compared to the J-Turn maneuver, J-Turn with Pulse Braking was found to induce more cases of two-wheel lift. This maneuver only produced two wheel lift for vehicles that did not have 4WAL (not counting the Ford Explorer ABS failure). Only those vehicles with relatively lower static metrics had more than minor two-wheel lift.
As previously stated, repeatability is a weak point of this maneuver due to test driver braking variability. To accurately utilize this maneuver as a rollover propensity metic will require a means of automatically controlling the brake pedal pulse application and release during the execution of the J-Turn steering program.
109

9.2.3 Fishhook #1
Use of the Programmable Steering Machine made the execution of Fishhook #1 possible. The handwheel inputs were very accurate and, since there was no braking associated with Fishhook #1, the maneuver inputs were repeatable. Seven test vehicles completed Fishhook #1 at the maximum test speed of 50 mph.
It was anticipated that Fishhook #1 would be more severe (e.g. produce a greater number of two-wheel lifts) than Fishhook #2. Numerically speaking, this was the case. Fishhook #1 induced two-wheel lifts for five vehicles, while Fishhook #2 induced for four vehicles. Although the J-Turn with Pulse Braking produced minor two-wheel lift of the Chevrolet Lumina, no two-wheel lift occurred with this vehicle in Fishhook #1. Similarly, Fishhook #1 did not produce two-wheel lift of the Chevrolet Tahoe, but Fishhook #2 did (minor lift).
As a means of discriminating vehicles with high or low rollover propensity, Fishhook #1 was moderately successful. It did induce more two-wheel lifts than any other test, but failed to do so for two vehicles that exhibited such lift in other maneuvers.
When developing the Phase II test matrix, an attempt was made to make Fishhook #1 a “worst case” steering reversal on flat pavement scenario. It was hoped that if two-wheel liftoff was achieved that it would occur at the lowest possible speed and lateral acceleration. Very precise steering timing would be required to achieve this goal. It was thought that the steering reversal should start at the instant when the vehicle roll angle due to the initial steer had attained its maximum value. To achieve this goal the steering reversal timing was estimated based on the vehicle’s roll natural frequency value at 50 mph.
The testing conducted to determine the roll natural frequency at 50 mph produced unexpected results. The roll angle transfer functions measured for this program did not have a strong resonance peak. Additional testing was performed using the Ford E-150 Club Wagon over a range of 30 to 50 mph. The magnitude portion of the roll angle transfer functions for the 30, 40, and 50 mph tests are shown in Figure 9.9. The 30 mph graph has a very strong resonance peak, but the peak at 40 mph is almost completely diminished and there is no resonance peak at 50 mph. Most of the tested vehicles had roll angle transfer functions that looked similar to the 50 mph curve shown in Figure 9.9. When this was the case, a value of 0.5 Hertz was selected.
110
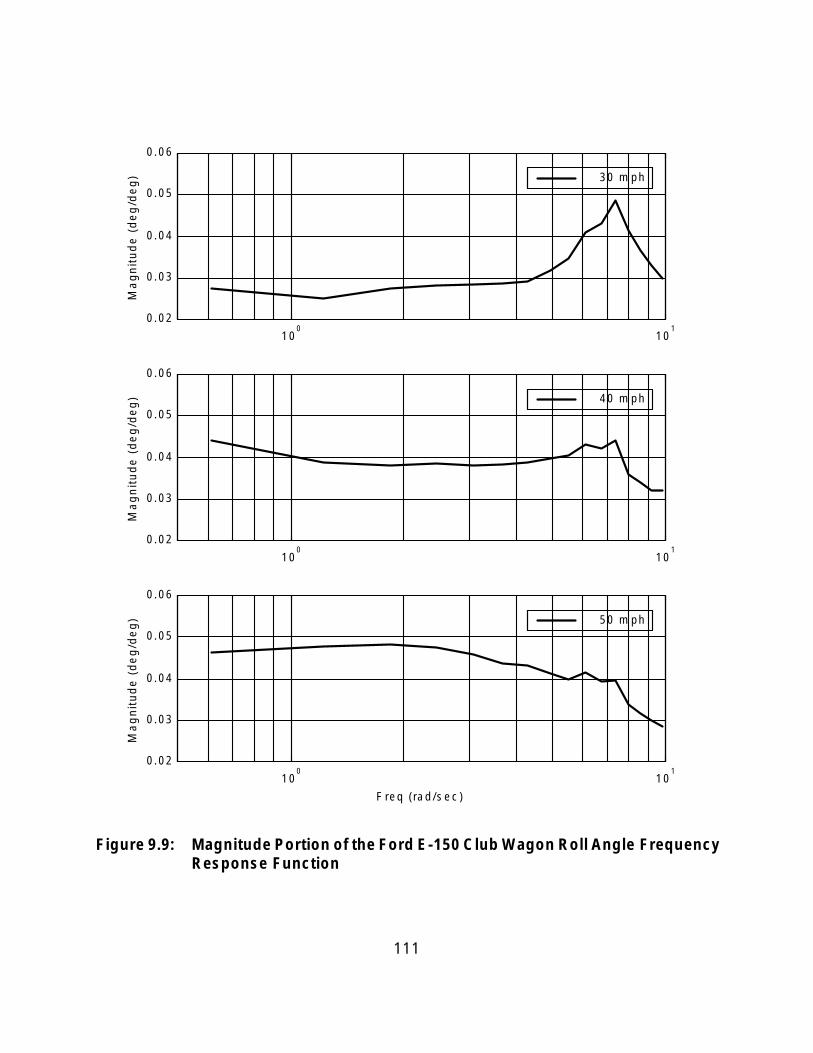
Ma
gn
itu
de
(d
eg
/de
g)
Ma
gn
itu
de
(d
eg
/de
g)
Ma
gn
itu
de
(d
eg
/de
g)
0.06
0.05
0.04
0.03
0.02 0
10
0.06
0.05
0.04
0.03
0.02 0
10
0.06
0.05
0.04
0.03
0.02 0
10
30 m ph
1 10
1 10
40 m ph
50 m ph
1 10
Freq (rad/sec )
Figure 9.9: Magnitude Portion of the Ford E-150 Club Wagon Roll Angle Frequency Response Function
111

It was found during the course of testing that the 0.5 hertz value did not generally produce a steering reversal timing that occurred at the peak roll angle, although the roll angle was still relatively large. During the course of Phase II testing, Ed Heitzman (co-developer of the Programmable Steering Controller used for Phase II testing) suggested an alternative method to produce a more desirable steering reversal timing. His idea was to monitor vehicle roll rate. The steering reversal should start the instant when the vehicle roll rate first goes to zero after the initial steer. Since roll rate is the derivative of roll angle, this should guarantee having a maximum roll angle at the onset of the steering reversal. This method is more clearly shown in Figure 9.10. The handwheel angle, roll rate, and roll angle are plotted as a function of time. After the initial steer, the roll rate has a peak at 0.5 seconds and then goes to zero at 1.0 seconds. As the roll rate goes to zero, the roll angle is at a peak value. The steering reversal is then initiated (handwheel plot at 1 second). Minor modifications to the Programmable Steering Controller will be required to implement this refined test procedure, but this has already been done on another Programmable Steering Controller and therefore should not be difficult to replicate.
9.2.4 Fishhook #2
As with Fishhook #1, use of the Programmable Steering Machine made the handwheel inputs used for Fishhook #2 very accurate and, since there was no braking associated with Fishhook #2, the maneuver was repeatable. Nine test vehicles completed Fishhook #2 at the maximum test speed of 50 mph.
Three of the four vehicles that experienced two-wheel lift in Fishhook #2 also exhibited such lift in Fishhook #1. As explained previously, the Chevrolet Tahoe had minor two-wheel lift in Fishhook #2, but not in Fishhook #1. Although the J-Turn with Pulse Braking produced minor two-wheel lift of the Chevrolet Lumina, no two-wheel lift resulting from execution of Fishhook #2 was observed with this vehicle. Although minor two-wheel lifts were observed for the Ford E150 Club Wagon and the Ford Explorer using Fishhook #1, Fishhook #2 did not produce any wheel lift for these vehicles. Fishhook #2 was one of only two maneuvers to result in a major two-wheel lift, and it occurred with the Ford Ranger.
Fishhook #2 was moderately successful in discriminating high or low rollover propensity. Although it induced two-wheel lift for one vehicle in which no other maneuver was able to, it failed to do so for three vehicles that exhibited such lift in other test maneuvers.
112

400 R
oll
An
gle
(d
eg
) R
oll
Ra
te (
de
g/s
ec
) H
an
dw
he
el
An
gle
(d
eg
)
200
0
-200
-400
-600
20
10
0
-10
-20
-30
10
5
0
-5
-10
0 1 2 3 4 5 6
0 1 2 3 4 5 6
0 1 2 3 4 5 6
Tim e
Figure 9.10: Determination of Steering Timing From Roll Rate
113
9.2.5 Resonant Steer
Use of the Programmable Steering Machine made the handwheel inputs used for Resonant Steer Maneuver very accurate and, since there was no braking associated with the maneuver, the inputs were repeatable. Six test vehicles completed the Resonant Steer Maneuver at the maximum steering amplitude limit result (180 degrees), four at 150 degrees, and two at 135 degrees.
Resonant Steer Maneuver was not successful in discriminating high or low rollover propensity. The maneuver failed to produce two-wheel lift for any test vehicle.
The goal of Resonant Steer maneuver was to try and “build up” roll angle over multiple steering cycles in vehicles that are under damped in roll response. This could potentially result in two-wheel lift/rollover at relatively low lateral acceleration. The steering frequency for this maneuver was selected from the roll response curve in the same fashion as that used for Fishhook #1. The roll resonance frequency was then used to create a sinusoidal input. As stated in Section 9.2, the roll angle transfer function at 50 mph did not produce a strong resonance peak. Since there was no strong resonance peak, it is quite possible that an inappropriate frequency was selected to produce the desired effect, i.e. a “build up” in the roll angle response over multiple steering cycles.
This maneuver may be better in discriminating between vehicles with high and low rollover propensity if the timing of the steering reversals are determined by roll rate feedback or if resonance is determined from the relation between roll angle and lateral acceleration instead of roll angle and handwheel angle (see discussion in Section 9.2.3).
114
10.0 Conclusions The Vehicle Research and Test Center conducted vehicle rollover propensity testing on twelve vehicles covering a wide range of vehicle classes: passenger cars, light trucks, vans, and sport utility vehicles. The following twelve vehicles were tested: Chevrolet Lumina, Dodge Neon, Chevrolet Metro, Chevrolet C1500, Chevrolet S-10, Ford Ranger, Ford E-150 Club Wagon, Chevrolet Astro, Dodge Caravan, Chevrolet Tahoe, Ford Explorer, and Chevrolet Tracker. All of the vehicles were 1998 model years except for the Ford Ranger which was a 1997. All of the vehicles were new.
The following conclusions summarize the results of the Rollover Propensity Phase II work conducted at the VRTC:
1. The repeatability of the steering controller handwheel inputs are very good for all of the maneuvers studied: Pulse Steer, Sinusoidal Sweep, Slowly Increasing Steer, Slowing Increasing Speed, J-Turn, J-Turn with Pulse Braking, Fishhook #1, Fishhook #2, and Resonant Steer.
2. The driver was required to provide the pulse brake application for the J-Turn with Pulse Braking maneuver and those inputs were much less repeatable than those found for the steering controller inputs. This lack of repeatability affected results, however, this study did not determine the magnitude of this effect.
3. Based on limited data, the repeatability of vehicle responses such as roll angle and lateral acceleration were quite repeatable for similar runs. This statement is based on data for runs repeated one after the other which is considered to be best case for the following reasons: conducted on the same pavement, under the same weather conditions, and a lack of significant tire wear between tests.
4. Tire debeading occurred in three of the twelve vehicles. Although the tires of these vehicles were not completely forced off their respective wheels, all tire pressure was lost and the wheel rims made abrupt contact with the pavement.
5. Three levels of two-wheel lift were observed during the course of testing: minor -both wheels off the ground for a short time with one or two wheels having less than 2 inches of lift, major - the vehicle is caught by the outriggers, thus preventing the vehicle from rolling over, and moderate - anything in between minor and major two-wheel lift.
6. Steering Maneuver and Pulse Braking Scores were calculated for each vehicle and compared to a variety of static and dynamic metrics. The Steering Maneuver score was based on the results of the J-Turn, Fishhook #1, and Fishhook #2 tests while the Pulse Braking Score was based on the J-Turn with Pulse Braking tests.
115

7. The Steering Maneuver scores related to Static Stability Factor (SSF) and Tilt Table Ratio (TTR) for the various vehicles, i.e. the vehicles with the lowest SSF and TTR values had at least some degree of two-wheel in lift in one or more maneuvers. This was also true, but to a lesser extent, for Critical Sliding Velocity (CSV).
8. The Pulse Braking Score was more a function of whether or not the vehicle had 4WAL or not. For those vehicles that did not have 4WAL, i.e. no ABS or RWAL, the Pulse Braking Score did relate to static or dynamic rollover propensity metrics with the static metrics relating better than the dynamic.
9. The Lateral Acceleration at Rollover (LAR) was determined for each vehicle and compared to the Steering Maneuver and Pulse Braking Scores. These values did not relate well with LAR.
10. The J-Turn maneuver was found to be a very coarse metric for discriminating vehicles with high or low rollover propensity. It induced two-wheel lift for just one vehicle (Ford Ranger - major, two-wheel lift).
11. The J-Turn with Pulse Braking maneuver was found to induce more cases of two-wheel lift than the J-Turn maneuver. It did a good job of discriminating between vehicles with 4WAL and those with RWAL or no ABS. This was especially true for those vehicles with lower SSF or TTR values.
12. The Fishhook #1 maneuver produced the highest number of two-wheel lifts of all the maneuvers (a total of 5), but other maneuvers produced two-wheel lift for some vehicles that did not have two-wheel lift in the Fishhook #1. The J-Turn with Pulse Braking maneuver produced two-wheel lift of the Chevrolet Lumina (minor) and the Fishhook #2 produced two-wheel lift of the Chevrolet Tahoe (minor). Neither had two-wheel lift in the Fishhook #1 maneuver.
13. The Fishhook #2 maneuver produced two-wheel lift of 4 vehicles. This maneuver was initially considered to be less severe than the Fishhook #1, but it did produce two-wheel lift for one vehicle that did not have two-wheel lift in Fishhook #1 (Chevrolet Tahoe - minor).
14. The Resonant Steer maneuver did not produce two-wheel lift. The goal of the Resonant Steer maneuver was to try and “build up” roll angle over multiple steering cycles. None of the vehicles tested produced this type of result. Different testing methods and/or data analysis techniques may be required to produce this type of result.
15. Several maneuvers appear to be able to discriminate between vehicles with low static and dynamic rollover propensity measures and those that do not. On-road, untripped two-wheel lifts were capable of being produced by four of the maneuvers, with the Fishhook #1 producing the most (5 of 12 vehicles).
116
REFERENCES
1. Howe, J. G., Garrott, W. R., Forkenbrock, G., Heydinger, G., Lloyd, J., “An Experimental Examination of Selected Maneuvers That May Induce On-Road, Untripped, Light Vehicle Rollover – Phase I-A of NHTSA’s 1997 - 1998 Light Vehicle Rollover Research Program,” NHTSA Technical Report, Number Not Yet Available, February 1999.
2. Howe, J. G., Garrott, W. R., Forkenbrock, G., “An Experimental Examination of Selected Maneuvers That May Induce On-Road, Untripped, Light Vehicle Rollover – Phase I-B of NHTSA’s 1997 - 1998 Light Vehicle Rollover Research Program,” NHTSA Technical Report, Number Not Yet Available, February 1999.
3. “Technical Assessment Paper: Relationship Between Rollover and Vehicle Factors,” National Highway Traffic Safety Administration, Rulemaking, Office of Vehicle Safety Standards, July 1991, available from Docket 91-68-N01.
4. Heitzman, E. J., and Heitzman, E. F., “A Programmable Steering Machine for Vehicle Handling Tests,” SAE Paper 971057, SAE SP-1228, February 1997.
5. Heitzman, E. J., and Heitzman, E. F., “The ATI Programmable Steering Machine,” Automotive Testing, Inc. Technical Report, March 1997.
6. SAE J266 - Surface Vehicle Recommended Practice, “Steady State Directional Control Test Procedures for Passenger Cars and Light Trucks,” 1996.
7. Mazzae, E., Forkenbrock, G., Baldwin, G. H. S., Barickman, F., “Driver Crash Avoidance Behavior with ABS in an Intersection Incursion Scenario on Dry versus Wet Pavement,” SAE Paper 1999-01-1288, March 1999.
8. Ivey, D. L., Sicking, D. L., “Influence of Pavement Edge and Shoulder Characteristics on Vehicle Handling and Stability,” Transportation Research Record 1084.
117