Embed Size (px)
Citation preview
1
Nitrate transboundary heavy pollution over East Asia in winter Syuichi Itahashi1, Itsushi Uno2, Kazuo Osada3, Yusuke Kamiguchi3#, Shigekazu Yamamoto4, Kei Tamura5, Zhu Wang2, Yasunori Kurosaki6, Yugo Kanaya7 1 Environmental Science Research Laboratory, Central Research Institute of Electric Power Industry, 1646 Abiko, Abiko, Chiba, 270-1194, Japan 5 2 Research Institute for Applied Mechanics, Kyushu University, 6-1 Kasuga Park, Kasuga, Fukuoka, 816-8580, Japan 3 Graduate School of Environmental Studies, Nagoya University, D2-1 (510) Furo-cho, Chikusa-ku, Nagoya, Aichi, 464-8601, Japan 4 Fukuoka Institute of Health and Environmental Sciences, 39 Mukaizano, Dazaifu, Fukuoka, 818-0135, Japan 5 Nagasaki Prefectural Environmental Affairs Department, 2-1306-11 Ikeda, Omura, Nagasaki, 856-0026, Japan 10 6 Arid Land Research Center, Tottori University, 1390 Hamasaka, Tottori, 680-0001, Japan 7 Japan Agency for Marine-Earth Science and Technology, 3173-25 Showa-machi, Kanazawa-ku, Yokohama, Kanagawa, 236-0001, Japan #Present address: JCB Co. Ltd., Tokai Regional Office, 2-16-26, Nishiki, Naka-ku, Nagoya, Aichi 460-0003, Japan 15
Correspondence to: Syuichi Itahashi ([email protected])
Abstract. High PM2.5 concentrations reaching around 100 µg/m3 were observed twice during an intensive observation
campaign in January 2015 at Fukuoka (33.52°N, 130.47°E) in western Japan. These events were analyzed comprehensively
by a regional chemical transport model and synergetic ground-based observations with state-of-the-art measurement systems,
which can capture the behavior of secondary inorganic aerosols (SO42-, NO3
-, and NH4+). The first episode was dominated by 20
NO3- (type N), whereas the second episode was dominated by SO4
2- (type S). The concentration of NH4+, which is the
counterion for SO42- and NO3
-, was high for both types. The sensitivity simulation of the chemical transport model showed
that the dominant contribution was from transboundary air pollution for both types. To investigate the differences between
these types of transboundary heavy pollution further, the chemical transport model results were examined in combination
with the backward trajectory analysis. The air mass originated from northeast China and reached Fukuoka for both types, but 25
the traveling time from the coastline of China to Fukuoka was 18 h for type N and 24 h for type S. The conversion ratio of
SO2 to SO42- (Fs) was less than 0.1 for type N, but reached 0.3 for type S as the air mass approached Fukuoka. The higher Fs
for type S was related to the higher relative humidity and concentration of HO2, which produces the most effective oxidant,
H2O2, for the aqueous-phase production of SO42-. Analyzing the gas ratio, which is an indicator of the sensitivity of NO3
- to
changes in SO42- and NH4
+, showed that the air mass over China was super NH3-rich for type N, but was almost NH3-neutral 30
for type S. Higher NO3- concentrations were maintained during transport owing to the lower SO4
2- for type N, whereas the
production of SO42- led to decomposition of NH4NO3 and more SO4
2- was transported for type S. The transboundary air
pollution dominated by SO42- in type S is a major acid transport process over East Asia. However, our study confirms the
importance of the transboundary air pollution dominated by NO3- (type N), which will help refine our understanding of the
transboundary heavy PM2.5 pollution in winter over East Asia. 35
Atmos. Chem. Phys. Discuss., doi:10.5194/acp-2016-879, 2016Manuscript under review for journal Atmos. Chem. Phys.Published: 14 November 2016c© Author(s) 2016. CC-BY 3.0 License.
2
1 Introduction
Particulate matter (PM) presents major environmental problems globally, especially in East Asia. A typical example is the
episode of severe air pollution that occurred in January 2013 above China (e.g., Wang et al., 2014; Uno et al., 2014). During
this episode, PM with aerodynamic diameters of less than 2.5 µm (PM2.5) reached record-breaking concentrations of 772
µg/m3 on January 12 (Pan et al., 2016). The transboundary air pollution in downwind regions resulting from the severe air 5
pollution in China is also an important environmental problem. For example, the possible long-range transport of PM2.5 was
based on the comparison of observations in metropolitan areas and remote islands in western Japan (Kaneyasu et al., 2014).
They highlighted the dominant effect of the transboundary transport for sulfate (SO42-) as a major PM2.5 component in
western Japan throughout most of the year. During spring, due to the prevailing westerly wind over East Asia, transboundary
air pollution of both aerosols and gases (e.g., carbon monoxide (CO) and ozone (O3)) have been discussed thoroughly 10
(Itahashi et al., 2010; 2013; 2015; Kanaya et al., 2016; Nagashima et al., 2010). In summer, the clean air mass from oceans is
moved over Japan by the southerly wind caused by the Pacific High; however, some studies have discussed the importance
of transboundary air pollution from China over western Japan (Itahashi et al., 2012a; Ikeda et al., 2014). Recently, one-year
source-receptor relationships for SO42- were evaluated, and China was identified as the main influence on downwind regions
throughout the year, with local sulfur dioxide (SO2) emissions making an important contribution during summer (Itahashi et 15
al., 2016). Compared with the analyses for spring and summer, transboundary air pollution events during winter are less well
understood.
In this study, we also focused on nitrate (NO3-), which is an important PM2.5 component. NO3
- is produced via the reaction of
gas-phase nitrate (nitric acid; HNO3) and ammonia (NH3), and this process is reversible. This reaction favors a shift toward
the aerosol phase at low temperatures and high humidity (Seinfeld and Pandis, 2006). The simulated spatial distribution over 20
East Asia showed the possible impact of the transboundary pollution of NO3- during winter over western Japan (Zhang et al.,
2007; Ying, 2014). However, a quantitative evaluation over downwind regions was not presented in their studies. This is
partly because model ability was not evaluated owing to the difficulty in measuring NO3-. Particulate NH4NO3 may be
volatilized after collection on the filter, by either an increase in the pressure drop across the particle-collecting medium or
changes in the gas-aerosol equilibrium during sampling (Sickles et al. 1999; Chang et al., 2000). This volatilization could 25
occur even in winter because the temperature in the instrument shelter can be increased by heat from the pump. Therefore,
the ground-based Acid Deposition Monitoring Network in East Asia uses the four-stage filter pack method: NH4NO3 is
collected on the first filter and gas-phase HNO3 and NH3 are detected on the subsequent filters. The artifacts might not be
significant; however, to avoid the possibility of volatilization, total nitrate (the sum of NO3- and HNO3) has been used to
evaluate the model ability in previous studies (e.g., Kajino et al., 2011). 30
To improve our understanding of the behavior of NO3-, accurate measurements and the evaluation of model ability are
needed. In this study, we used the state-of-the-art automated monitoring system for SO42- and NO3
-, Aerosol Chemical
Speciation Analyzer (ACSA). This system measures SO42- and NO3
- with high temporal resolution and 1 h intervals were
Atmos. Chem. Phys. Discuss., doi:10.5194/acp-2016-879, 2016Manuscript under review for journal Atmos. Chem. Phys.Published: 14 November 2016c© Author(s) 2016. CC-BY 3.0 License.
3
used in this study, minimizing the possibility of volatilization. In addition, the behavior of ammonium (NH4+), which is the
counterion for SO42- and NO3
-, was captured by the well-validated NHx monitoring system. Therefore, the secondary
inorganic aerosols (sulfate (SO42-)−nitrate (NO3
-)−ammonium (NH4+); SNA) were fully observed by our synergetic
monitoring system. The denuder-filter pack (D-F pack) method with 6 h cycles was also used during the intensive
observation period from January 7–17, 2015 to support and validate the ACSA and NHx monitoring system. Based on these 5
measurement systems, gas-phase HNO3 and NH3 can be measured by the D-F pack method and NHx monitor, respectively.
The related gas-phase behavior analysis is valuable for improving our understanding of the formation of NO3-. The
observations were conducted at the Chikushi Campus of Kyushu University, which is in the suburbs of Fukuoka City
(33.52°N, 130.47°E) in western Japan. The synergetic ground-based observation dataset was systematically interpreted by
using the regional chemical transport model, and we also examined the impact of the domestic and transboundary air 10
pollution during winter. The chemical transport model studies are one of a critical approach to analyze three-dimensional air
pollutants behavior and to estimate source impacts. The systematical comparison of model results with observations
including gas-phase precursors will promote our understanding for model ability in Asia. This will also contribute to the
Model Inter-Comparison Study for Asia (MICS-Asia) which focuses on a common understanding of model performances
and uncertainties and especially on long-range transport in Asia (Carmichael et al., 2002; 2008, Li et al., 2015). This paper is 15
constructed as follows. Section 2 documents the observation dataset and model simulation. Section 3 discusses the results
with respect to temporal variations at observation sites and the model results combined with the backward trajectory analysis.
Finally, a summary and conclusions are given in Section 4.
2 Observation and model simulation
2.1 Observation sites 20
The synergetic observations for capturing SNA behavior were conducted at Chikushi Campus of Kyushu University located
in the suburbs of Fukuoka City (33.52°N, 130.47°E). Fukuoka City is the largest center of commerce in Kyushu Island. The
population of Fukuoka City is 1.5 million and that of the Fukuoka metropolitan area is 2.5 million. This is the fourth largest
metropolitan area in Japan, after Tokyo (34.8 million), Osaka (12.2 million), and Nagoya (5.5 million). This site is an urban
site. In addition to the observation at Fukuoka, observations from the Goto Islands (32.68°N, 128.83°E) and Tsushima Island 25
(32.20°N, 129.28°E) were also used. The Goto Islands are located in the East China Sea, 190 km southwest of Fukuoka, and
they have a population of 70,000. Tsushima Island is located in the Tsushima straits, 140 km northwest of Fukuoka, and has
a population of 34,000. These two islands have negligible anthropogenic emissions sources and are regarded as remote sites.
In addition to these three sites over Kyushu island, to investigate the regions affected by transboundary air pollution,
observations from Tottori City (35.54°N, 134.21°E) in western Japan were also used. Tottori City has a population of 30
190,000, and this site is also regarded as a remote site in western Japan. The locations of these four observation sites over
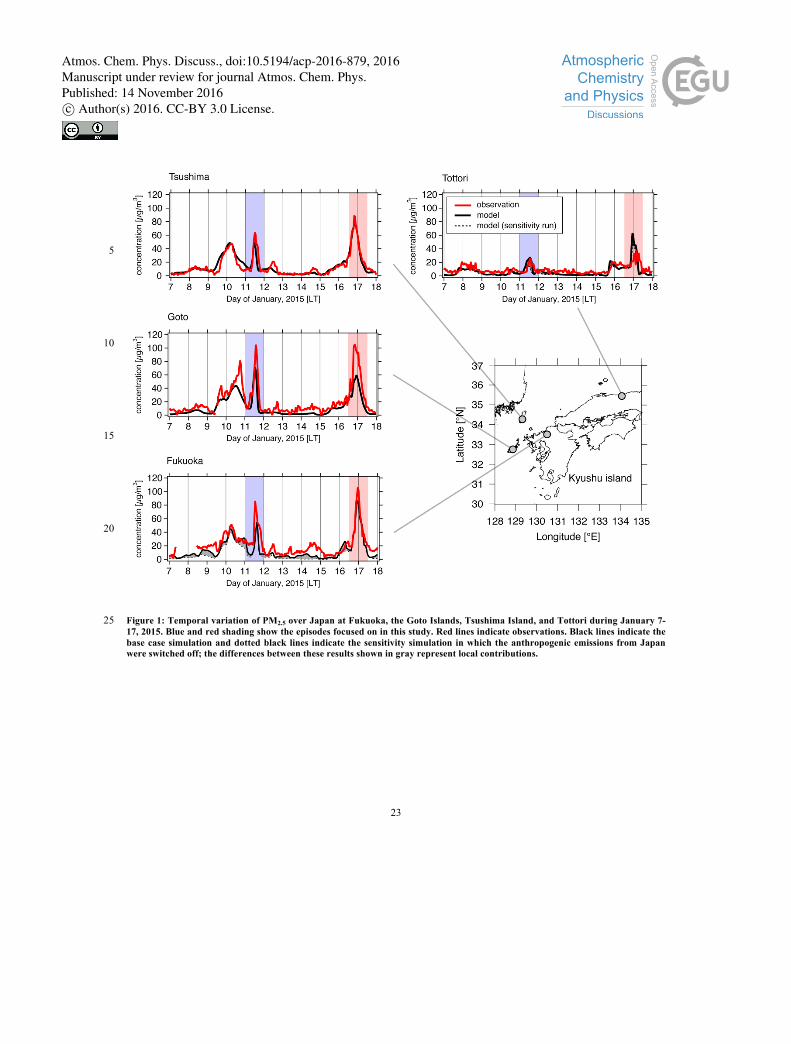
Japan are shown in Fig. 1. In addition to these observations over Japan, PM2.5 observations in China from the US Embassy in
Atmos. Chem. Phys. Discuss., doi:10.5194/acp-2016-879, 2016Manuscript under review for journal Atmos. Chem. Phys.Published: 14 November 2016c© Author(s) 2016. CC-BY 3.0 License.
4
Beijing and the US Consulates in the provincial capitals of Shanghai and Shenyang were used. The locations of these three
sites over China are shown in Fig. 2.
2.1.1 Aerosol chemical speciation analyzer
An ACSA-12 Monitor (Kimoto Electric Co., Ltd., Osaka, Japan), for PM10 and PM2.5, which were separated by a US
Environmental Protection Agency inlet and a virtual impactor, were measured with high temporal resolution (Kimoto et al., 5
2013). PM was collected on a tape filter made of Teflon (PTFE). Hourly observations were conducted for SO42- and NO3
- at
Fukuoka. The mass concentrations of PM were determined by using the beta-ray absorption method. The ACSA-12
measured NO3- using an ultraviolet spectrophotometric method, and SO4
2- by turbidimetry after addition of BaCl2 to form
BaSO4 and polyvinyl pyrrolidone as a stabilizer. The analytical period was within 2 h of sampling; therefore, the
volatilization of particulate NH4NO3 after collection was regarded as small compared with the traditional filter-pack 10
observation method. ACSA has been tested (Osada et al., 2016) and used to analyze the severe winter haze in Beijing (Zheng
et al., 2015; Li et al., 2016), and to identify the aerosol chemical compositions at Fukuoka (Pan et al., 2016)
2.1.2 NHx monitor
The behaviors of NH3 and NH4+ are also important because they are the counterions for SO4
2- and NO3-. The concentrations
of gaseous NH3 and aerosol NH4+ were measured with a semi-continuous microflow analytical system (Kimoto Electric Co. 15
Ltd., MF-NH3A, Osada et al., 2011) at Fukuoka. The atmospheric NHx was dissolved in ultrapure water with a continuous
air–water droplet sampler and quantified by fluorescence (excitation, 360 nm; emission, 420 nm) of the o-phtalaldehyde–
sulfite–NH3 reaction product (Genfa et al., 1989). Two inlet lines were used to differentiate the total amounts of NHx and
particulate NH4+ after gaseous NH3 was removed by a phosphoric acid-coated denuder from the sample air stream. The cut-
off diameter of the inlet impactor was about 2 µm. 20
2.1.3 Denuder-filter pack method
During the intensive observation period from January 7–17, 2015, D-F pack measurements were conducted at Fukuoka to
validate the ACSA and NHx monitoring measurement systems. An annular denuder–multi-stage filter sampling system was
used for HNO3 and size-segregated aerosol sampling. The sampling interval was 6–8 h. At the inlet, coarse-mode aerosols
were removed by Nuclepore membrane filters (111114, Nomura Micro Science Co., Ltd., Atsugi, Japan, pore size: 8 µm), 25
and then gas-phase HNO3 was collected with the annular denuder (2000-30x242-3CSS, URG Co.) coated with NaCl (Perrino
et al., 1990). Fine-mode aerosols were collected with a PTFE filter (J100A047A, ADVANTEC, Tokyo, Japan, pore size: 1
µm), and a nylon filter (66509, Pall Co.) captured volatized nitrate from the PTFE filter (Appel et al., 1981; Vecchi et al.,
2009). The sample air flow rate was 16.7 L/min (1 atm, 25 °C). Under these conditions, the aerodynamic diameter of 50%
cut-off for the Nuclepore filter was about 1.9 µm (John et al., 1983). The samples were analyzed by ion chromatography (IC). 30
Comparing the size-segregated SO42- and NO3
- data based on the D-F pack method with ACSA showed systematic
Atmos. Chem. Phys. Discuss., doi:10.5194/acp-2016-879, 2016Manuscript under review for journal Atmos. Chem. Phys.Published: 14 November 2016c© Author(s) 2016. CC-BY 3.0 License.
5
differences. Fine-mode aerosols were underestimated by the D-F pack compared with the ACSA PM2.5 measurements, and
coarse-mode aerosols were overestimated by the D-F pack compared with the ACSA PMc measurements, because of
difference in the cut-off diameter for the D-F pack method (Osada et al., 2016). Details of the comparison and validation of
the ACSA data are reported in Osada et al. (2016).
2.1.4 PM-712 5
Hourly PM10 and PM2.5 concentrations were measured by a PM monitor (PM-712, Kimoto Electric Co., Ltd.) at the Goto
Islands, Tsushima Island, and Tottori. The ionic constituents of the species on the PTFE tape filters were also analyzed by IC
to compare the aerosol behaviour at Fukuoka and the other sites. At all sites, sample spots collected on the tape filter were
covered with polyester tape to avoid contamination and crosstalk interference during storage. The sampling duration for the
PM-712 tape filters was 1 h, except for Tottori where it was 3 h. For chemical analysis, four consecutive 1 h tape samples 10
were combined into one sample for the Goto Islands and Tsushima Island. For Tottori, tape samples for 1 or 0.5 days were
combined. Because of a temperature change during PM sample storage, some NO3- may have escaped via volatilization of
HNO3 from the sample. Therefore, NO3- data from the Goto Islands, Tsushima Island, and Tottori were not used. Hereafter,
we call these datasets from the PM tape samples ‘tape filter’.
2.1.5 Beta attenuation monitors 15
Hourly PM2.5 concentrations in China were measured by beta attenuation monitors (BAMs) (1020, MetOne Instruments, Inc.,
Grants Pass, OR, USA) at the U.S. Embassy in Beijing from April 8, 2008, at the U.S. Consulates in Shanghai from
December 21, 2011, and at the U.S. Consulates in Shenyang from April 22, 2013 (MOE, 2016). In the BAM technique, PM
is collected on a quartz filter tape over a given time interval and the attenuation of beta rays through the sample is measured
and correlated directly with the PM mass. The details and the statistical analysis results of the BAM observation at the U.S. 20
Embassy and Consulates are found in the work of San Martini et al. (2015).
2.1.5 Multi-angle absorption photometer
Observations of black carbon (BC), a primary aerosol that directly reflects local emissions contributions, from Fukuoka and
the Goto Islands were also used to distinguish domestic and transboundary air pollution. BC is observed by using a multi-
angle absorption photometer (MAAP; MAAP5012, Thermo Fisher Scientific, Waltham, MA, USA) (Petzold et al., 2005). In 25
this method, the absorbance of the particles deposited on the filter is distinguished from scattering by reflectance
measurements at multiple angles and by transmittance. This is to minimize the effects of coexisting aerosol particles other
than BC on filter-based absorption photometers. The comparison measurements of BC from the Goto Islands were
previously performed by Kanaya et al. (2013), and they reported that the BC MAAP measurements were strongly correlated
with measurements by other techniques but had a positive bias. From the results reported by Kanaya et al. (2013), the MAAP 30
Atmos. Chem. Phys. Discuss., doi:10.5194/acp-2016-879, 2016Manuscript under review for journal Atmos. Chem. Phys.Published: 14 November 2016c© Author(s) 2016. CC-BY 3.0 License.
6
absorption cross section of 6.6 m2/g was systematically increased to 10.3 m2/g at 639 nm. There were no MAAP BC
measurements from the Goto Islands before January 11, 2015 during the intensive observation period.
2.2 Chemical transport model
The chemical transport model simulation was performed by using the Community Multi-scale Air Quality (CMAQ)
modeling system version 4.7.1 (Byun and Schere, 2006) with nesting over East Asia. The meteorological fields of CMAQ 5
were prepared with the Weather Research and Forecasting model version 3.3.1 (Skamarock et al., 2008) with analysis
nudging applied to the National Centers for Environmental Prediction final operational global analysis data. The model
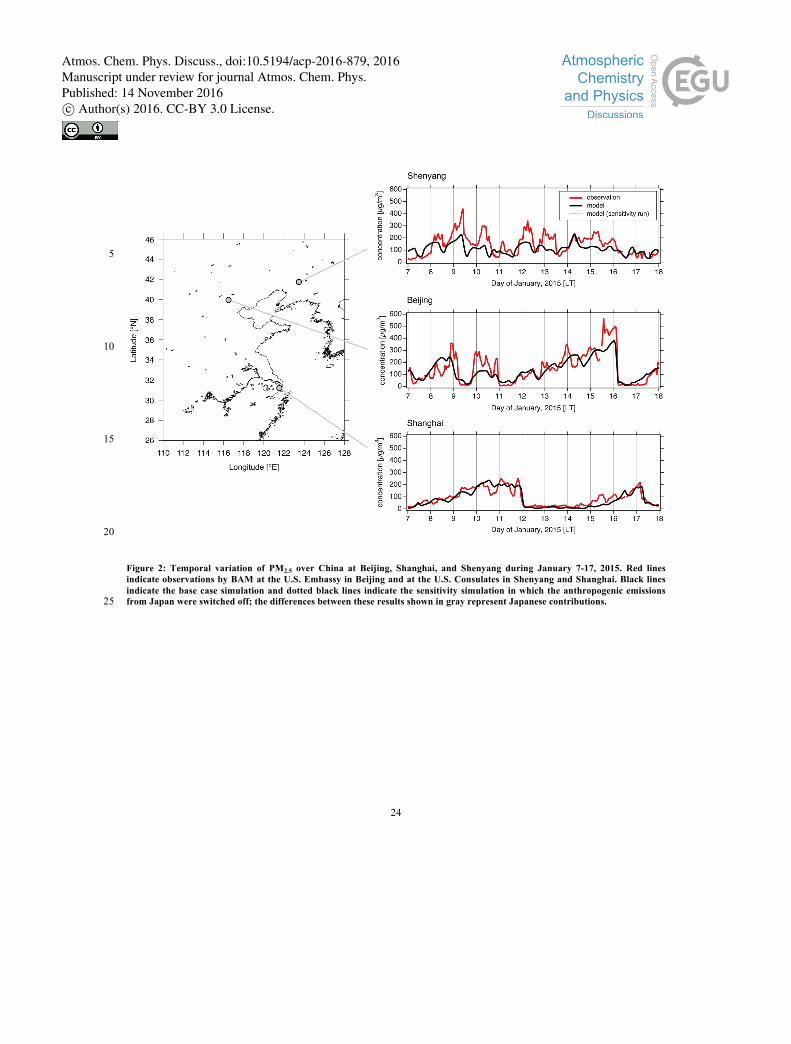
domain covers the whole of East Asia with an 81 km horizontal grid resolution, with a 95 × 75 grid centered at 30°N and
115°E on a Lambert conformal projection. The nested domain covers eastern China and the whole of Japan with a 27 km
horizontal grid resolution and a 145 × 145 grid. The vertical grid for sigma-pressure coordinates extends to 50 hPa with 37 10
layers with nonuniform spacing. Lateral boundary condition was prepared by global chemical transport model of Geos-Chem
(Uno et al., 2014). The simulation period was from January 1–17, 2015, and the first 6 days were discarded as model spin-up
time. The dry deposition velocity of HNO3 over land was increased by a factor of five based on the model intercomparison
results (Shimadera et al., 2014; Morino et al., 2015).
Emissions were set as follows. Anthropogenic emissions and natural sources of NOx from soil were obtained from the latest 15
Regional Emission inventory in ASia (REAS) version 2.1 (Kurokawa et al., 2013), which covers 2000 to 2008. Therefore,
the emissions for January 2008 were used in this study. This assumption is based on the following reasons. Satellite
observation of the NO2 column showed a decreasing trend in NOx emissions from China of -6%/year after 2011, and the
levels for 2015 are similar to those for 2009 (Irie et al., 2016). In contrast, the NO2 column over Japan decreased until 2013,
and then began to increase from 2013 owing to the change in power plant use after the Fukushima Daiichi nuclear disaster 20
(Morino et al., 2011). The level of the NO2 column over Japan in 2015 was close to that in 2008 (Irie et al., 2016). The
installation of flue-gas desulfurization systems in power plants in China decreased SO2 emissions in China from 2005 to
2006; after this turning point, the variation in SO2 emissions is complicated (Xia et al., 2016). In Japan, SO2 emissions are
increasing for the same reasons as for NOx; however, there are no reliable references for the current status of SO2 emissions.
Considering these factors in the variation of NOx and SO2 emissions over China and Japan, it was assumed that the 2008 25
emissions would be within the range of uncertainty of the bottom-up emission inventories. Because REAS does not consider
the monthly variation in NH3, we used the monthly variation estimated by Huang et al. (2013). Biogenic emissions were
prepared from MEGAN (Model of Emissions of Gases and Aerosols from Nature) (Guenther et al., 2012). Biomass burning
emissions were used from the climatological database of RETRO (REanalysis of the TROpospheric chemical composition)
(Schulrz et al., 2008). Volcanic activity data were taken from ACESS (Ace-Asia and TRACE-P Modeling and Emission 30
Support System) (Streets et al., 2003) and were modified by the volcanic activity observation data from the Japan
Meteorological Agency (JMA) for available volcanoes (JMA, 2016). Fourteen main active volcanoes in Japan and Mt.
Mayon and Mt. Bulsan on Luzon Island in the Philippines were considered. The model simulation using the above dataset is
Atmos. Chem. Phys. Discuss., doi:10.5194/acp-2016-879, 2016Manuscript under review for journal Atmos. Chem. Phys.Published: 14 November 2016c© Author(s) 2016. CC-BY 3.0 License.
7
referred to as the base case simulation. The modeling system domain with overlaid anthropogenic NOx emissions is shown
in Fig. 3.
To investigate whether the effect of domestic or transboundary air pollution is dominant, we also conducted a sensitivity
simulation, in which the anthropogenic emissions in Japan are switched off. Shipping emissions were not treated in the
sensitivity simulation. Because the amount of emissions from China is larger than that from Japan, to avoid large 5
nonlinearities in the atmospheric concentration response to emissions variation (e.g., Itahashi et al., 2015), the sensitivity
simulation was designed to switch off the anthropogenic emissions in Japan. Based on the differences between the base case
simulation and this sensitivity simulation, the domestic contribution from Japan was estimated.
3 Results and Discussion
3.1 Meteorological conditions 10
Meteorological conditions during the intensive observation campaign from January 7–17, 2015 are shown in Fig. 2 with
observations and model results. Meteorological observation stations of the JMA in the corresponding nested model grid of
Fukuoka were used. Temperatures (Fig. 2a) were around 5 °C at night and 10 °C during the day in January 2015. On January
9, the temperature was nearly 0 °C at Fukuoka. For the wind field, because of the dominance of the northwesterly wind
system from the Asian continent during winter, the wind direction was generally 270°–360° (west to north) and the wind 15
speed was around 5 m/s, with the exception of January 9 and 12–15. On January 9, when the coldest temperature during the
intensive observation campaign was observed, the wind speed was less than 1 m/s and wind direction was from the south. On
January 13–15, the wind speed was also low, at 2–3 m/s, and the wind direction was easterly, caused by a warm front
passing over the south of Kyushu Island on January 14. After the warm front had passed, the relative humidity was close to
100% on January 15–16, with a maximum of 10 mm/h rain on January 15. Comparing the observations with the model 20
results shows that our modeling system generally captures the observed meteorological variations during this episode.
3.2 Temporal variation of particulate matter
(a) PM2.5
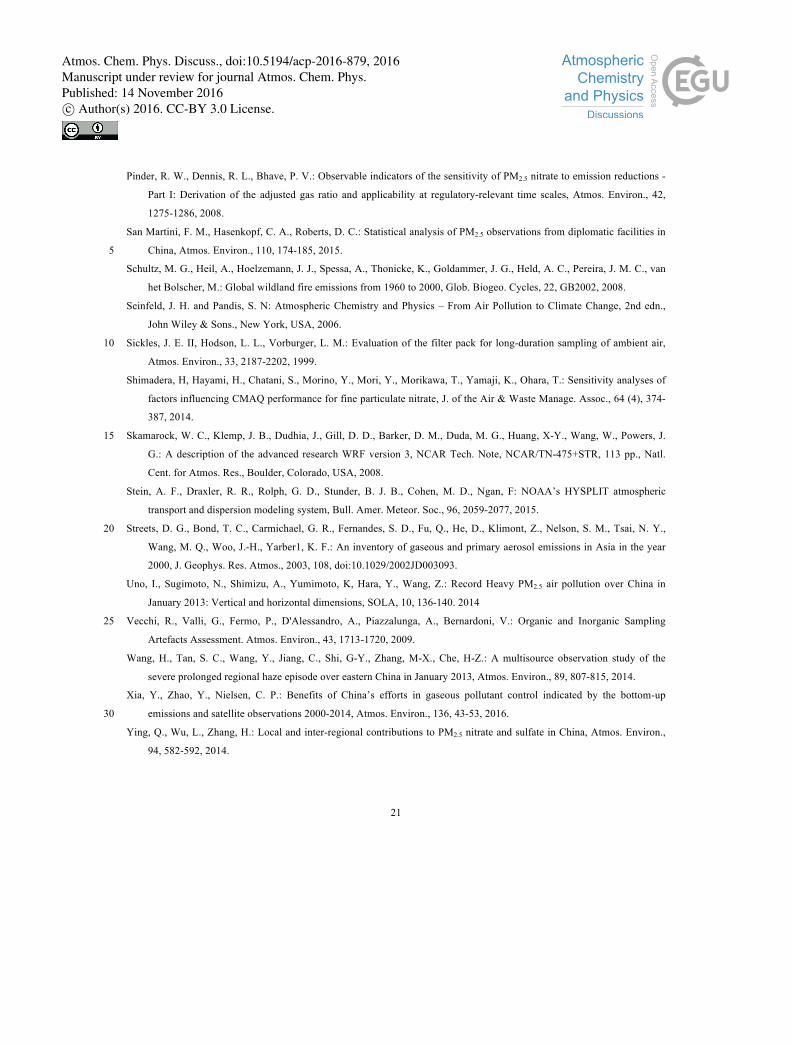
The temporal variation of PM2.5 over Japan at Fukuoka, Tsushima Island, the Goto Islands, and Tottori are presented in Fig.
1. PM2.5 observation data are taken from ACSA at Fukuoka, and are taken from PM-712 at other sites. Temporal resolutions 25
are 1 h for all observations. During the analyzed period of January 7–17, 2015, episodic PM2.5 peaks reached around 100
µg/m3 at Fukuoka twice. The first peak, observed at 12:00 LT on January 11 (shown in blue in Fig. 1) reached a maximum
concentration of 86.4 µg/m3 at Fukuoka and 105.1 µg/m3 at the Goto Islands. During this first peak, the concentration at
Tsushima Island was 63.9 µg/m3, which was lower than at the other remote island site in the Goto Islands, and there was no
distinctive peak at Tottori. The second peak observed at 00:00 LT on January 17 (shown in red in Fig. 1) reached a 30
maximum concentration at Fukuoka of 106.2 µg/m3. During this second peak, the remote sites of the Goto Islands and
Atmos. Chem. Phys. Discuss., doi:10.5194/acp-2016-879, 2016Manuscript under review for journal Atmos. Chem. Phys.Published: 14 November 2016c© Author(s) 2016. CC-BY 3.0 License.
8
Tsushima Island also recorded high PM2.5 concentrations of 104.8 and 89.1 µg/m3, respectively, and the PM2.5 concentration
reached 37.6 µg/m3 at Tottori. In Fig. 1, we show the model results as black lines. Generally, the model captured the
observed temporal PM2.5 behavior, although it underestimated the first peaks at Fukuoka and the Goto Islands, and the
second peak at the Goto Islands. The timing of the high PM2.5 concentration was reproduced well by the modeling system.
Statistical analysis of the model reproducibility demonstrated that all paired datasets for PM2.5 showed good correlations 5
between the observations and the model at the four sites in Japan, with a correlation coefficient (R) of 0.86. Mean fractional
bias (MFB) and mean fractional error (MFE) were -42.6% and 67.4%, respectively, and these results satisfied the model
performance criteria (MFB ≤ ±60% and MFE ≤ +75%) proposed by Boylan and Russell (2006). Figure 1 also shows the
model results of a sensitivity simulation performed by switching off the Japanese anthropogenic emissions. The sensitivity
simulations results are shown as dotted black lines and the difference between the base case and the sensitivity simulation is 10
shown in gray, which indicates the domestic contribution of Japan. Except for Fukuoka, there were little domestic
contributions for PM2.5; therefore, the transboundary air pollution was dominant during January 2015. At Fukuoka, although
domestic contributions for PM2.5 were found in some cases on January 8–10 and 14, the concentration of PM2.5 was lower
compared with the two peaks. During the two episodes when PM2.5 concentration reached around 100 µg/m3 over Japan, the
model simulation suggested that the effect of transboundary air pollution was dominant, even at Fukuoka. 15
The temporal variations of PM2.5 over China at Beijing, Shanghai, and Shenyang are shown in Fig. 2. PM2.5 observation data
are taken from BAM-1020 and the temporal resolution is 1 h. At Beijing, there were high concentrations of PM2.5 which
correspond to the high concentration of PM2.5 found over Japan. One high concentration was approximately 300 µg/m3 on
January 10–11, and other was around 600 µg/m3 on January 16. These peak times were almost one day before the high
concentration was observed over Japan. At Shanghai, there were two clear peaks with a PM2.5 concentration of 200 µg/m3 on 20
January 11 and 17. The time corresponded well with the peak time over Japan. At Shenyang, where the local emissions from
domestic sources was dominant in winter, the temporal variation was complex compared with Beijing and Shanghai. PM2.5
showed sharp peaks several times with concentrations of around 300 µg/m3, whereas the model only showed gentle peaks.
Analysis of the model reproducibility showed that all PM2.5 paired datasets for the observations and model at three sites over
China showed that R was 0.73, and MFB and MFE were -9.8% and 46.8%, respectively; satisfying the model goal criteria 25
(MFB ≤ ±30% and MFE ≤ ±50%) proposed by Boylan and Russell (2006). The evaluation of model performance over China
supports the discussion of downwind regions.
(b) SNA
The temporal variations of SNA are shown in Figs. 5 and 6. In Fig. 5, SO42- and NH4
+ are shown for four sites in Japan. At 30
Fukuoka, ACSA and D-F pack observations are shown for SO42-, and NHx monitor and D-F pack results are shown for NH4
+.
The temporal resolutions of ACSA and the NHx monitor were 1 h, and those of the D-F packs were 6–8 h depending on the
samples. For the Goto Islands, Tsushima Island, and Tottori, the PM-712 tape filter data were used. The temporal resolution
was 4 h at the Goto Islands and Tsushima Island, and 1 or 0.5 day at Tottori. In Fig. 6, NO3-, HNO3, NH3, and total ammonia
Atmos. Chem. Phys. Discuss., doi:10.5194/acp-2016-879, 2016Manuscript under review for journal Atmos. Chem. Phys.Published: 14 November 2016c© Author(s) 2016. CC-BY 3.0 License.
9
(sum of NH4+ and NH3) are shown for Fukuoka. ACSA and D-F pack observations for NO3
- are shown, D-F pack
observations are shown for HNO3, and NHx monitor observations are shown for NH3 and total ammonia. Because of a
temperature change during PM-712 sample storage, NO3- concentrations could have been affected by volatilization; hence,
only NO3- analysis at the Fukuoka site was used. At Fukuoka, the SNA concentration contributed 52% and 46% of the PM2.5
concentration in the first and second episodes, respectively. For SO42- (Fig. 5 (left)), the concentration during the second 5
episode was larger than during the first episode at Fukuoka, the Goto Islands, and Tsushima Island. At Tottori, there was no
peak for the first episode for SO42-. In contrast to SO4
2-, a higher NO3- concentration was observed during the first episode
instead of the second episode (Fig. 6). NH4+ showed high concentrations during both episodes because it is the counterion for
SO42- and NO3
- (Fig. 5 (right)). Based on the analysis of the PM2.5 (Fig. 3) and SNA (Figs. 5 and 6) observations, the PM2.5
concentrations were similar during the episodes on January 11 and 17; however, the main component of SNA was NO3- 10
during the first episode and SO42- during the second episode. Therefore, the first episode (shown in blue in Figs. 3, 5, and 6)
is referred to as ‘type N’, and the second episode (shown in red in Figs. 3, 5, and 6) is referred to as ‘type S’ hereafter.
The model results for the base case and sensitivity simulations are overlaid with the same temporal resolution as the
observations in Figs. 5 and 6. The model tended to underestimate the SO42- concentration (Fig. 5 (left)); however, the model
reproduced the features of types N and S, and sensitivity simulation indicated the dominance of transboundary air pollution 15
for SO42- during the intensive observation campaign in January 2015, even at Fukuoka. For NO3
- (Fig. 6), the model
reproduced the features of the type N and S peaks well, although the model overestimated the dip in NO3- concentration
found from the evening of January 10 to before the type N episode. The D-F pack observations generally underestimated
NO3- compared with the ACSA observations, because of the difference in cut-off diameter between these measurement
systems. Except for the type N and S episodes, domestic contributions were seen for NO3- on January 8–10 and 14. However, 20
the sensitivity simulation confirmed that the transboundary NO3- air pollution was dominant for types N and S. Because
NH4+ is the counterion for both SO4
2- and NO3-, small domestic contributions for NH4
+ were observed at Fukuoka (Fig. 5
(right)). This result corresponded to the domestic contribution for NO3-. For the other three remote sites, there were no
domestic contributions for NH4+.
The behavior of SNA, gas-phase HNO3, and NH3 were analyzed comprehensively based on the NHx monitor and D-F pack 25
observations (Fig. 6) to support our understanding of NO3- behavior. There are few synergetic analyses including gas-phase
behavior over the downwind region of Asian continent. Peaks for gas-phase HNO3 were found for types N and S, whereas
the concentration of gas-phase NH3 was nearly zero (less than 1µg/m3 for 24 h average) for types N and S, and on January 8,
10, 12, and 15 (green arrows in Fig. 6). The concentration of total ammonia showed distinct peaks for types N and S;
therefore, the nearly zero concentration of NH3 suggested the full conversion of NH3 to produce NH4+ as a counterion for 30
SO42- and NO3
-. The sensitivity simulation, in which Japanese anthropogenic emissions were switched off, clarified the
different features of related gas-phase species. The base case simulation and sensitivity simulation were similar for HNO3,
suggesting it originated from transboundary air pollution. A slight increase in HNO3 in the sensitivity simulation was found
on January 8–10 and 12 (red arrows in Fig. 6). These were the complex cases connected to overseas and domestic emissions.
Atmos. Chem. Phys. Discuss., doi:10.5194/acp-2016-879, 2016Manuscript under review for journal Atmos. Chem. Phys.Published: 14 November 2016c© Author(s) 2016. CC-BY 3.0 License.
10
If there are no Japanese NH3 emissions, the transported HNO3 cannot produce NO3- in Japan, and so it remains as gas-phase
HNO3. The synergetic analysis for gas-phase HNO3 and NH3 indicated that abundant HNO3 was transported from abroad
and reacted with domestic NH3, producing NO3- on January 8–10. Compared with these cases, domestic HNO3 and NH3
produced NO3- on January 14 (orange arrows in Fig. 6). The concentrations were lower than for type N and S, which were
dominated by the transboundary air pollution. 5
(c) Coarse mode aerosols
Coarse-mode aerosols were also partly analyzed in this study. Because of the effect of transboundary air pollution on HNO3
(Fig. 6), we focused on coarse-mode NO3-. Coarse-mode NO3
- is produced by reactions of HNO3 with mineral dust or sea-
salt particles. In general, mineral dust mainly has an effect in spring over East Asia, whereas sea-salt particles play an 10
important role throughout the year. Recently, we reported the importance of coarse-mode NO3- as an atmospheric input in
East Asian ocean regions (Itahashi et al., 2016). Figure 7 shows the modeled and observed coarse-mode NO3-, Na+, and Cl-.
ACSA and D-F pack observations are shown for coarse-mode NO3-, and D-F pack observations are shown for coarse-mode
Na+ and Cl-. During the intensive observation period in January, coarse-mode NO3- also showed high concentrations for
types N and S of around 10 µg/m3, and on January 9–10 of around 5 µg/m3. Based on the model results, because the 15
domestic contribution for HNO3 was observed on January 14 (Fig. 6), the domestic contribution for coarse-mode NO3- was
observed only on January 14, but the concentration was below 1 µg/m3. Na+ and Cl- from sea-salt particles also had peaks for
types N and S. Sea-salt particles are mechanically produced by high winds; therefore, these peaks generally corresponded to
high wind speeds (Fig. 2). High winds were observed on January 15, and Na+ and Cl- peaks occurred, but the coarse-mode
NO3- concentration was close to zero. This was because there was no HNO3 to react with NaCl from January 12–15, and wet 20
deposition of coarse-mode NO3- with precipitation from noon on January 14 to the evening of January 15. For coarse-mode
NO3-, transboundary air pollution was the dominant factor. This means that a large amount of HNO3 was transported from
abroad (Fig. 5) and reacted with sea-salt particles over the ocean, and reached Fukuoka in the air mass.
(d) BC 25
To support the discussion of the domestic and the transboundary contributions to SNA, the behavior of BC at Fukuoka and
the Goto Islands are shown in Fig. 8. The sensitivity simulation would suffer from a nonlinear chemistry response if complex
atmospheric chemistry were involved; hence, we focused on BC, which is a primary aerosol. The temporal variation of BC
also showed distinctive peaks for types N and S at Fukuoka and the Goto Islands. The model results reproduced these peaks
well, and the sensitivity simulation also suggested the dominance of transboundary air pollution for both peaks N and S. The 30
temporal variation at the Goto Islands showed only two peaks of types N and S, although many short-term peaks were seen
at Fukuoka. The sensitivity simulation confirmed that domestic air pollution contributed to these short-term peaks at
Fukuoka; however, the model could not fully capture the peaks observed on January 7, 13, and 14. To improve the
performance of the model to capture these short-term peaks, a higher-resolution model simulation and a revision of the
Atmos. Chem. Phys. Discuss., doi:10.5194/acp-2016-879, 2016Manuscript under review for journal Atmos. Chem. Phys.Published: 14 November 2016c© Author(s) 2016. CC-BY 3.0 License.
11
emission inventory are needed. Analysis of the primary aerosol confirmed that the transboundary air pollution was dominant
for types N and S in January 2015.
Consequently, the well-validated model simulation indicated that two high PM2.5 episodes with concentrations of around 100
µg/m3 that occurred over western Japan during January were dominated by NO3- for the first peak (type N) and by SO4
2- for
the second peak (type S), and that NH4+ concentration was high for both types. The model sensitivity simulation clarified 5
that these high SNA concentrations in the type N and S episodes were dominated by the transboundary air pollution. In
addition to the transport of SNA, abundant gas-phase HNO3 and coarse-mode NO3- reacted with sea-salt particles over the
ocean and were also transported to western Japan. NH3, which mainly came from domestic emissions, showed
concentrations around zero during type N and S events, suggesting that NH3 was depleted to neutralize SO42- and NO3
-.
3.2 Trajectory analysis 10
Analyzing the synergetic observations at Fukuoka and the other three remote sites in Japan with the regional chemical
transport model demonstrated that the two PM2.5 episodic peaks were dominated by transboundary heavy pollution, even at
Fukuoka. The two peaks had different SNA compositions. The first episode on January 11 showed a high NO3- (type N)
concentration and the second episode on January 17 was dominated by SO42- (type S). The differences in these episodes were
investigated further by a model simulation combined with backward trajectory analysis. The spatial distributions of SO42- 15
and NO3- during type N and S patterns are shown in Figs. 9 and 10, respectively.
In type N (Fig. 9 (right)), the model results showed that a low SO42- concentration of less than 5 µg/m3 and a high NO3
-
concentration of more than 10 µg/m3 covered Fukuoka. The spatial distribution patterns indicated the outflow of SO42- and
NO3- from continental Asia to western Japan. The dominance of the transboundary air pollution suggested by these spatial
distributions was consistent with the model sensitivity simulation results (Figs. 5 and 6). High-concentration regions of SO42- 20
and NO3- stretched from the eastern coastline of China to the East China Sea and western Japan. The spatial distribution
implied the direct transport from continental Asia to the downwind regions. In addition, the high-concentration region
stretched from eastern China to western Japan, consistent with the corresponding PM2.5 peak on January 11 at Shanghai and
over Japan. To investigate the air mass origin for type N, the HYSPLIT backward trajectory (Stein et al., 2015) starting from
Fukuoka over 72 h was analyzed (TN in Fig. 9 (right)). The backward trajectory during type N transport suggested that the air 25
mass originated from Shaanxi province and passed over Shanxi province, southern Hebei province, Shandong province, and
then reached Fukuoka. The traveling time from the coast of China to Fukuoka was about 18 h. The distance from the
coastline of China to Fukuoka is approximately 1000 km, so the air mass speed for type N was 55.6 km/h. Fig. 9 (left) shows
the spatial distribution for when the air mass was located over China. A high concentration of NO3- of more than 60 µg/m3
occurred over the east coast of China before the air mass arrived in Fukuoka, whereas the SO42- concentration was as high as 30
10 µg/m3 above the East China Sea.
In type S (Fig. 10 (right)), the model calculated that a high SO42- concentration of more than 20 µg/m3 and a low NO3
-
concentration of around 5 µg/m3 covered Fukuoka. The HYSPLIT backward trajectory is shown as TS in Fig. 10. The air
Atmos. Chem. Phys. Discuss., doi:10.5194/acp-2016-879, 2016Manuscript under review for journal Atmos. Chem. Phys.Published: 14 November 2016c© Author(s) 2016. CC-BY 3.0 License.
12
mass during type S transport originated from Shanxi province and slowly moved over northern Henan province, Shandong
province, and reached Fukuoka within about 24 h. The high-concentration regions stretched from eastern China to western
Japan, consistent with the simultaneous PM2.5 peak at Shanghai and over Japan. The air mass was stagnant over China
compared with type N transport. The spatial distribution when the air mass was located over China is shown in Fig. 10 (left).
For SO42-, the concentration was higher when the air mass arrived at Fukuoka compared with that in China, suggesting the 5
fast production of SO42- during the transport process. A high concentration of SO4
2- of 20 µg/m3 spread over the East China
Sea and western Japan. A high NO3- concentration of more than 60 µg/m3 occurred over China, similar to type N; however,
the NO3- concentration was immediately reduced during the transport. The high NO3
- concentration of more than 10 µg/m3
did not reach Fukuoka in this type S transport. Comparing the spatial distribution of the air mass over Fukuoka (Fig. 10
(right)) and China (Fig. 10 (left)) showed a 1 day delay in the high concentration peaks over Japan compared with the peak 10
for Beijing (Figs. 3 and 4).
The backward trajectories for types N and S both showed similar transport patterns from China and Fukuoka. However, the
spatial distribution patterns demonstrated clear differences between SO42- and NO3
- distributions for type N and S patterns.
To discuss the different mechanisms for type N and S further, the model results were analyzed along the backward
trajectories of TN and TS. The path analyses are shown in Figs. 11 and 12, along with additional indexes. The conversion 15
ratio of SNA from the gas- to aerosol-phases is an important indicator. For SO42-, considering the concentration of their gas-
phase species of SO2, the conversion ratio of Fs is defined as follows and calculated based on molar concentrations, shown in
square brackets (Khoder, 2002).
Fs=[SO4
2-]
[SO2] + [SO42-]
[mol/mol]. (1)
A ratio of 0 indicates that SO42- was not produced, and a ratio of 1 indicates that SO2 was converted completely to SO4
2-. To 20
confirm the Fs analysis, the concentration of the highly reactive hydroperoxy radical (HO2) was also analyzed. Self-reaction
of HO2 produces hydrogen peroxide (H2O2), and this is the most effective oxidant of aqueous-phase SO2 (Pandis and
Seinfeld, 1989). Because the analyzed period was during winter, aqueous-phase reactions would be the main pathway for
producing SO42-.
For NO3-, the conversion ratios of Fn are defined by considering the concentration of NO2 as a precursor and calculated 25
based on molar concentrations (Khoder, 2002).
Fn=[!"#!] + [NO3
- ]
[NO2] + [!"#!] + [NO3- ]
[mol/mol]. (2)
To investigate the ratio of NO3- to gas- and aerosol-phase components, analogous to the calculation for SO4
2-, the conversion
ratio of Fn’ is introduced.
F!! =[NO3
- ]
[!"#!] + [NO3- ]
[mol/mol]. (3) 30
Atmos. Chem. Phys. Discuss., doi:10.5194/acp-2016-879, 2016Manuscript under review for journal Atmos. Chem. Phys.Published: 14 November 2016c© Author(s) 2016. CC-BY 3.0 License.
13
The behavior of SNA is determined by introducing candidate indicators according to the work of Ansari and Pandis (1998)
and Pinder et al. (2008). The gas ratio (GR) is an indicator of the sensitivity of NO3- to changes in SO4
2- and NH4+
concentration. The GR is defined as the ratio of free ammonia to total nitrate as
GR = !"!!!"!! !![!"!!!][!"#!! !"!!]
[mol/mol], (4)
where it is assumed that SO42- is fully neutralized, as indicated by the coefficient of 2 for [SO4
2-]. The GR value implies the 5
following condition for NO3- production.
GR > 1: NH! − rich
0 < GR < 1:NH! − neutral GR < 0: NH! − poor
, (5)
Here, NH3-rich means that there is sufficient NH3 to neutralize both SO42- and NO3
-, NH3-neutral means that there is
sufficient NH3 to neutralize SO42-, and NH3-poor means that there is insufficient NH3 to neutralize SO4
2- or NO3-. Free
ammonia, which can form NH4NO3 in the equilibrium process, is quantified more accurately by adjusting [SO42-] with the 10
degree of sulfate neutralization (DSN). The DSN is defined as
DSN = !"!! ![!"!!][!"!!!]
[mol/mol], (6)
where DSN is equal to or greater than 2 if there is sufficient NH4+. By substituting the coefficient of 2 before [SO4
2-] in Eq.
(2) with Eq. (4), the adjusted GR (adjGR) can be defined as
adjGR = !"!!!"!! !!"#×[!"!!!][!"#!! !"!!]
= !"! ![!"!!]!"#! ![!"!!]
[mol/mol], (7) 15
by using the indexes, and the path analysis of backward trajectories for the model results are shown in Figs. 11 and 12, and
are summarized in Table 1. The analyses are shown for (a) the meteorological components of temperature and relative
humidity, (b) SO42- and SO2 with an enlarged view for SO4
2-, (c) HO2 concentration, (d) NO3-, HNO3, NO, NO2, other NOy
consisting of NO3, HNO2, N2O5, and peroxyacyl nitrates (PANs), and coarse-mode NO3-, (e) NH4
+ and NH3, and (f) adjGR,
Fs, and Fn’. The concentrations of the air pollutants were reduced by chemical reactions, dispersion, and deposition during 20
the transport; therefore, as an index of dispersion and deposition processes, BC and CO concentrations normalized to their
maximum concentrations during the transport were used in the variation of the total concentration in (b), (d), and (e). Table 1
shows the meteorological components and the air pollutant concentrations of each component and total sulfate, total nitrate,
and total ammonia. The indexes were averaged over China, the transport time above the ocean, and Fukuoka. The SNA
concentration was balanced between SO42- with NO3
- and NH4+ during both types N and S. 25
During the type N pattern (Fig. 11), the concentration of air pollutants increased after the air mass moved into Hebei
province (-30 h). The relative humidity was lower than 40% when the air mass traveled over Shanxi and Hebei provinces
(Fig. 11a). The SO42- concentration was around 1 µg-S/m3 during transport (Fig. 11b and Table 1), and SO2 was dominant in
Atmos. Chem. Phys. Discuss., doi:10.5194/acp-2016-879, 2016Manuscript under review for journal Atmos. Chem. Phys.Published: 14 November 2016c© Author(s) 2016. CC-BY 3.0 License.
14
the total sulfate concentration. In this type N pattern, the concentration of the most effective oxidant of HO2 for the SO2
aqueous-phase reaction was smaller due to the lower relative humidity (Fig. 11c), and the conversion ratio was less than 0.1
(Fig. 11f and Table 1). Compared with the SO42- variation, as the trajectory passed from Shanxi province (-36 h) to
Shandong province (-18 h), and over the ocean (-12 h), NO3- and NH4
+ concentration increased. The concentration of NO3-
and NH4+ decreased as the air mass traveled to Japan (Figs. 11d and 11e). Over China (-30 to -18 h), gas-phase NH3 was 5
abundant and HNO3 was fully consumed to produce NH4NO3 (Figs. 11d and 11e). The excess HNO3 over the ocean
contributed to producing coarse-mode NO3- by reacting with sea-salt particles as the air mass traveled over the ocean (Fig.
11d). The adjGR was super NH3-rich over China (Fig. 11f). After the air mass left Shandong, HNO3 increased and NH3 was
close to zero (Figs. 11d and 11e), so adjGR shifted to NH3-neutral status (Fig. 11f). Consequently, the proportion of NO3-,
indicated by Fn’, remained around 80% during transport from China to Japan (Fig. 11f). The rate of the decrease of total 10
sulfate, total nitrate, and total ammonia were generally consistent with the rate of decrease of normalized BC and CO,
suggesting that the budget was almost satisfied during transport (Table 1). The decrease of BC was larger than that of CO
because of wet deposition (e.g., Pan et al., 2011, Kanaya et al., 2016).
During the type S pattern (Fig. 12), SNA concentrations were higher compared with the type N pattern (Fig. 11), partly due
to the slower motion of the air mass compared with type N. SO42- concentration was around 2 µg-S/m3 over Shanxi to Henan 15
provinces (-72 to -36 h), it increased slightly to 3 µg-S/m3 over Henan to Shandong provinces (-36 to -24 h), and
subsequently increased to 3 µg-S/m3 over the ocean (Fig. 12b and Table 1). The aqueous-phase reaction contributed to the
production, as suggested by the variation in HO2 concentration. Over oceans, the relative humidity was around 80%, 20%
larger than in the case of the type N pattern (Fig. 12a and Table 1). The Fs conversion ratio was 0.3 when the air mass
reached Fukuoka (Fig. 12f). The increase in SO42- over Fukuoka compared with over China was +67.2% (Table 1). The 20
behaviors of gas-phase HNO3 and NH3 were similar in type N patterns (Figs. 12d and 12e); the NH3 concentration was high
over China, and HNO3 gradually increased after the air mass approached the ocean, partly because coarse-mode NO3- was
produced. However, the NH3 concentration was smaller compared with type N patterns and remained near zero when the air
mass passed over Henan province (Fig. 12e). adjGR showed slight NH3-rich status over China (-54 to -36 h), and shifted to
NH3-neutral status before the air mass left China (-36 h), and at the same time, the ratio of NO3- indicated by Fn’ decreased 25
to 0.45 (Fig. 12f and Table 1). Similar to type N, the rates of decrease of total sulfate, total nitrate, and total ammonia were
generally consistent with the rates of decrease of normalized BC and CO.
To summarize the key points for type N and S patterns, the behavior of SO42-, NO3
-, and HNO3 concentrations during
transport from China to Japan are shown in Fig. 13. The relative percentages of the concentration of each species to the total
concentration of SO42-, NO3
-, and HNO3 are shown. Types N and S both showed the dominance of NH4NO3 (over 70%) 30
when the air mass was over China (-48 h). For the air mass close to Fukuoka, because there was no NH3, NH4NO3
decomposed into gas-phase NH3 and HNO3. Therefore, HNO3 concentration increased as the air mass reached Fukuoka for
types N and S. At this time, the SO42- concentration was important in determining the NO3
- concentration. SO42- production
(Figs. 11b and 12b) through an aqueous-phase reaction was indicated by the HO2 concentration (Figs. 11c and 12c), and Fs
Atmos. Chem. Phys. Discuss., doi:10.5194/acp-2016-879, 2016Manuscript under review for journal Atmos. Chem. Phys.Published: 14 November 2016c© Author(s) 2016. CC-BY 3.0 License.
15
showed a large difference between types N (lower than 0.1 during transport; Figs. 11f) and S (around 0.3 at Fukuoka; Figs.
12f). Once H2SO4 was produced via an aqueous-phase reaction, it reacted with gas-phase NH3 to produce (NH4)2SO4,
leading to further decomposition of NH4NO3. The ratio of NO3- (Fn’) showed different behavior for types N (around 0.8
during transport; Figs. 11f) and S (lower than 0.5 at Fukuoka; Figs. 12f). The transport pattern under similar conditions over
China was determined by the low SO42- concentration maintaining a higher NO3
- concentration at Fukuoka (type N), or by 5
SO42- production under a higher relative humidity resulting in the dominance of SO4
2- with further NH4NO3 decomposition
(type S).
Finally, the outflow of SO42- and NO3
- from China to western Japan during the intensive observation campaign is
summarized in Fig. 14. In this figure, the modeled SO42- and NO3
- concentrations were averaged at 32–36°N to cover the
four sites in Japan (Fig. 3) and are shown as a time-longitude cross section. The longitude of Shanghai, the Goto Islands, 10
Tsushima Island, Fukuoka, and Tottori are indicated at the bottom of the figure. This outflow analysis can help to identify
the areas affected by transboundary heavy pollution. The main outflow from China to western Japan occurred twice (types N
and S). The outflow concentration of SO42- was lower on January 11 for type N and larger on January 17 for type S; a high
concentration of more than 15 µg/m3 reached 130°N (Fukuoka) and a concentration of around 10 µg/m3 reached 134°N
(Tottori) for type S (Fig. 14a). The outflow of NO3- was observed over the Goto Islands, Tsushima Island, and Fukuoka on 15
January 11 for type N, whereas the high concentration of over 10 µg/m3 was limited to the East China Sea regions on
January 17 for type S. A concentration of NO3- of more than 5 µg/m3 did not reach 134°N (Tottori) for type N (Fig. 14b).
The outflow analysis suggested that SO42- can be transported longer distances, whereas transboundary air pollution of NO3
- is
limited to western Japan, especially over Kyushu.
4 Conclusion 20
Based on the state-of-the-art observation systems for capturing SNA behavior and the chemical transport model, two
episodes of high PM2.5 concentrations of around 100 µg/m3 occurred during winter over western Japan were analyzed. The
first episode on January 11 was dominated by NO3- (type N) and the second episode on January 17 was dominated by SO4
2-
(type S). The chemical transport model captured the behavior of SNA and the related gas-phase species of HNO3 and NH3,
and coarse-mode NO3- observed over Japan. The model also reproduced PM2.5 variation over China. To evaluate the 25
domestic contributions, sensitivity analysis was performed, in which the anthropogenic emissions from Japan were switched
off in the chemical transport model. The results showed that there were sometimes domestic contributions for NO3-, although
the type N and S patterns were dominated by the transboundary air pollution, even at Fukuoka. The effect of transboundary
air pollution on type N and S patterns were also confirmed by analyzing the behavior of BC at Fukuoka and the remote Goto
Islands. The importance of the transboundary air pollution for coarse-mode NO3-, produced by abundant HNO3 and sea-salt 30
particles, was also revealed. To investigate the characteristic differences between type N and S patterns, the chemical
transport model results were analyzed by the backward trajectory analysis from Fukuoka to continental Asia. We also
Atmos. Chem. Phys. Discuss., doi:10.5194/acp-2016-879, 2016Manuscript under review for journal Atmos. Chem. Phys.Published: 14 November 2016c© Author(s) 2016. CC-BY 3.0 License.
16
evaluated the adjusted gas ratio (adjGR), which indicates the sensitivity of NO3- to changes in SO4
2- and NH4+, and Fs, which
is the conversion ratio of SO2 to SO42-. For the SO2 aqueous-phase reaction, H2O2 is the most effective oxidant. Thus, HO2,
which produces H2O2 through self-reaction, was also analyzed. The features of type N and S patterns are summarized as
follows.
l In the type N transport pattern, NO3- was mainly the NH4
+ counterion during transport from China to Japan. A high 5
NO3- concentration of more than 10 µg/m3 was observed at Fukuoka. NH3 was abundant and HNO3 was completely
consumed to produce NO3- over China; hence adjGR indicated super NH3-rich status, which meant full neutralization
of both SO42- and NO3
-, over China. After the air mass left China, HNO3 increased and NH3 was close to zero; so
adjGR shifted to NH3-neutral status. The SO42- concentration was always lower than the NO3
- concentration. This was
because the HO2 concentration was less than 3 pptv during transport from China to Fukuoka, and Fs suggested a slow 10
conversion ratio for SO42- of less 0.1. SO4
2- production via an aqueous-phase reaction was also inhibited. This also
explained why the air mass maintained a higher NO3- concentration during transport.
l In the type S transport pattern, the ion balance between NH4+ and NO3
- with SO42- showed that the counterion of NH4
+
was mainly NO3- over China, and then became SO4
2- as the air mass left China and approached Fukuoka. A high
concentration of SO42- of more than 20 µg/m3 was observed at Fukuoka. The change in Fs from 0.1 to 0.3 when the air 15
mass reached Fukuoka was consistent with this observation. Higher Fs values were related to higher relative humidity
and HO2 concentration, indicating the high production of SO42- via an aqueous-phase reaction (H2SO4). The production
of H2SO4 promoted the reaction with NH3 to produce (NH4)2SO4 and further decomposition of NH4NO3 during the
transport process from China to Fukuoka. The temporal behaviors of gas-phase HNO3 and NH3 were similar for type
N; however, the NH3 concentration was lower. adjGR showed almost NH3-neutral conditions during type S. The 20
production of SO42- and the insufficient supply of NH3 contributed to the rapid decomposition of NH4NO3 in this case.
In this study, we clarified the two types transport pattern for SNA. The spatial distribution pattern of the outflow over East
Asia during January 2015 showed that the outflow of SO42- stretched over the whole of western Japan, whereas the
transboundary air pollution of NO3- played an important role over Kyushu Island, western Japan. Generally, the
transboundary air pollution dominated by SO42- (type S) has been recognized over East Asia, but we have elucidated the 25
effect of the transboundary heavy pollution dominated by NO3- (type N). Our findings will promote the importance of NO3
-
long-range transport.
The study period was limited to January 2015, so the analyzed period should be extended to investigate the type S and N
transport patterns further. The variation of the gas ratio for emissions (GRe), which considers the balance between SO2, NOx,
and NH3 (analogous to Eq. 4) may be useful for future analysis. The emission reductions achieved by the 12th Chinese Five 30
Year Plan during 2011–2015 (Asia Society, 2016), resulted in a GRe increase, which caused an NH3-rich status compared
with the current status. Moreover, the target for the 13th Chinese Five Year Plan during 2016–2020, suggests there will be
further increases in GRe. The effects of different reduction rates for SNA precursor gases on transboundary air pollution of
NO3-, especially over western Japan, should be modeled.
Atmos. Chem. Phys. Discuss., doi:10.5194/acp-2016-879, 2016Manuscript under review for journal Atmos. Chem. Phys.Published: 14 November 2016c© Author(s) 2016. CC-BY 3.0 License.
17
Author contributions
I. Uno designed the synergetic observations at Chikushi Campus of Kyushu University and other remote sites in western
Japan. S. Yamamoto and K. Osada respectively carried out the ground-based ACSA and NHx-monitor observations at
Fukuoka. Y. Kamiguchi and K. Osadaconducted air sampling and chemical analysis for D-F pack samples during the
intensive observation period at Fukuoka. K. Osada and Y. Kurosaki measured PM2.5 and analyzed samples at Tottori. K. 5
Tamura analyzed the observations from the remote sites of Tsushima Island and the Goto Islands. Y. Kanaya conducted the
BC observations at Fukuoka and the Goto Islands. S. Itahashi developed the modeling system, performed the model
simulations and analysis, and prepared the manuscript with contributions from all co-authors.
Acknowledgements
This work was partly supported by Japan Society for the Promotion of Science (JSPS) KAKENHI Grant Numbers 10
JP25220101, JP23310004, JP15H02803. This work was also partly supported by the Environment Research and Technology
Development Fund of the Ministry of the Environment, Japan (No. S-7, 2-1403, 5-1505). This work was partly funded by the
Joint Research Program of Arid Land Research Center, Tottori University (No. 28C2011) and by the Collaborative Research
Program of Research Institute for Applied Mechanics, Kyushu University (No. 26AO-2, 27AO-6, 28AO-2). We thank Dr.
Sayako Ueda at Nagoya University for analyzing tape filters at Tottori University. 15
Atmos. Chem. Phys. Discuss., doi:10.5194/acp-2016-879, 2016Manuscript under review for journal Atmos. Chem. Phys.Published: 14 November 2016c© Author(s) 2016. CC-BY 3.0 License.
18
References
Ansari, A. S., Pandis, S. N.: response of inorganic PM to precursor conventrations, Environ. Sci. Technol, 32, 2706-2714,
1998.
Asia Society: https://www.chinafile.com/reporting-opinion/environment/how-chinas-13th-five-year-plan-addresses-energy-5
and-environment. last access: 1 September 2016
Appel, B. R., Tokiwa, Y., Haik, M.: Sampling of Nitrates in Ambient Air. Atmos. Environ., 15, 283-289, 1981.
Boylan, J. W., Russell, A. G.: PM and light extinction model performance metrics, goals, and criteria for three-dimensional
air quality models, Atmos. Environ., 40, 4946-4959, 2006.
Chang, M. C., Sioutas, C., Kim, S., Gong, H. Jr, Linh, W. S.: Reduction of nitrate losses from filter and impactor samplers 10
by means of concentration enrichment, Atmos. Environ., 34, 85-98, 2000.
Carmichael, G. R., Calori, G., Hayami, H., Uno, I., Cho, S. Y., Engardt, M., Kim, S.-B., Ichikawa, Y., Ikeda, Y., Woo, J.-H.,
Ueda, H., Amann, M.: The MICS-Asia study: model intercomparison of long-range transport and sulfur deposition in
East Asia, Atmos. Environ., 36, 175-199, 2002.
Carmichael, G. R., Sakurai, T., Streets, D., Hozumi, Y., Ueda, H., Park, S. U., Fung, C., Han, Z., Kajino, M., Engardt, M., 15
Bennet, C., Hayami, H., Sartelet, K., Holloway, T., Wang, Z., Kannari, A., Fu, J., Matsuda, K., Thongboonchoo, N.,
Amann, M: MICS-Asia II: The model intercomparison study for Asia Phase II methodology and overview of findings,
Atmos. Environ., 42, 3468-3490, 2008.
Genfa, Z., Dasgupta, P.K., Dong, S.: Measurement of Atmospheric Ammonia. Environ. Sci. Technol., 23, 1467–1474, 1989. Guenther, A. B., Jiang, X., Heald, C. L., Sakulyanontvittaya, T., Duhl, T., Emmons, L. K., Wang, X: The Model of 20
Emissions of Gases and Aerosols from Nature version 2.1 (MEGAN2.1): an extended and updated framework for
modeling biogenic emissions, Geosci. Model Dev., 5, 1471–1492, 2012.
Japan Meteorological Agency: http://www.data.jma.go.jp/svd/vois/data/tokyo/volcano.html. [in Japanese] last access: 14
January 2016
John,W., Hering, S., Reischl, G., Sasaki, G., Goren, S.: Characteristics of Nuclepore Filters with Large pore size-II. 25
Filtration Properties, Atmos. Environ., 17, 373-382, 1983.
Ikeda, K., Yamaji, K., Kanaya, Y., Taketani, F., Pan, X., Komazaki, Y. Kurokawa, J., Ohara, T.: Sensitivity analysis of
source regions to PM2.5 concentration at Fukue island, Japan, J. of the Air & Waste Management Assoc., 64, 445-452,
2014.
Itahashi, S., Yumimoto, K., Uno, I., Eguchi, K., Takemura, T., Hara, Y., Shimizu, A., Sugimoto, N., Liu, Z.: Structure of 30
dust and air pollutant outflow over East Asia in the spring, Geosphys. Res. Lett., 37, L20806,
doi:10.1029/2010GL044776, 2010.
Atmos. Chem. Phys. Discuss., doi:10.5194/acp-2016-879, 2016Manuscript under review for journal Atmos. Chem. Phys.Published: 14 November 2016c© Author(s) 2016. CC-BY 3.0 License.
19
Itahashi, S., Uno, I., Kim, S-T.: Source contributions of sulfate aerosol over East Asia estimated by CMAQ-DDM, Environ.
Sci. Technol, 46, 6733-6741, 2012.
Itahashi, S., Uno, I., Kim, S-T.: Seasonal source contributions of tropospheric ozone over East Asia based on CMAQ-
HDDM, Atmos. Environ., 70, 204-217, 2013.
Itahashi, S., Hayami, H., Uno, I.: Comprehensive study of emission source contributions for tropospheric ozone formation 5
over East Asia, J. of Geophys. Res, 120, 331-358, 2015.
Itahashi, S., Hayami, H., Uno, I., Pan, X., Uematsu, M.: Importance of coarse-mode nitrate produced via sea-salt as
atmospheric input to East Asian oceans, Geophys. Res, Lett., 43, 5483-5491, 2016.
Itahashi, S., Hayami, H., Yumimoto, K., Uno, I.: Chinese province-scale source apportionments for sulfate aerosol evaluated
by the tagged tracer method in 2005, Environmental Pollution, in press, 2016. 10
Irie, H., Muto, T., Itahashi, S., Kurokawa, J., Uno, I.: Turnaround of tropospheric nitrogen dioxide pollution trends in China,
Japan, and South Korea, SOLA, 12, 170-174, 2016
Kajino, M., Sato, K., Inomata, Y., Ueda, H.: Source-receptor relationships of nitrate in Northeast Asia and influence of sea
salt on the long-range transport of nitrate, Atmos. Environ., 70, 67-78, 2013.
Kanaya, Y., Taketani, F., Komazaki, Y., Liu, X., Kondo, Y., Sahu, L. K., Irie, H., Takashima, H.: Comparison of black 15
carbon mass concentrations observed by multi-angle absorption photometer (MAAP) and continuous soot-monitoring
system (COSMOS) on Fukue island and in Tokyo, Japan, Aerosol Science and Technology, 47, 1-10, 2013.
Kanaya, Y., Pan, X. L., Miyakawa, T., Komazaki, Y., Taketani, F., Uno, I., Kondo, Y.: Long-term observations of black
carbon mass concentrations at Fukue Island, western Japan, during 2009-2015: Constraining wet removal rates and
emission strengths from East Asia, Atmos. Chem. Phys., 16, 10689-10705, 2016. 20
Kaneyasu, N., Yamamoto, S., Sato, K., Takami, A., Hayashi, M., Hara, K., Kawamoto, K., Okuda, T., Hatakeyama, S.:
Impact of long-range transport of aerosols on the PM2.5 composition at a major metropolitan area in the northern
Kyushu area of Japan, Atmos. Environ., 97, 416-425, 2014.
Kimoto, H., Ueda, A., Tsujimoto, K., Mitani, Y., Toyazaki, Y., and Kimoto, T.: Development of a Continuous Dichotomous
Aerosol Chemical Speciation Analyzer, Clean Technology, 23, 49–52, 2013 (in Japanese). 25
Khoder, M. I.: Atmospheric conversion of sulfur dioxide to particulate sulfate and nitrogen dioxide to particulate and
gaseous nitric acid in an urban area, Chemopshere., 49, 675-684, 2002.
Kurokawa, J., Ohara, T., Morikawa, T., Hanayama, S., Greet, J-M., Fukui, T., Kawashima, K., Akimoto, H.: Emissions of
air pollutants and greenhouse gases over Asian regions during 2000-2008: Regional Emission inventory in ASia
(REAS) version 2, Atmos. Chem. Phys, 13, 11019-11058, 2013. 30
Li, H., Duan, F., He, K., Ma, Y., Kimoto, T., Huang, T.: Size-dependent characterization of atmospheric particles during
winter in Beijing, Atmosphere, 7, 36, 2016.
Atmos. Chem. Phys. Discuss., doi:10.5194/acp-2016-879, 2016Manuscript under review for journal Atmos. Chem. Phys.Published: 14 November 2016c© Author(s) 2016. CC-BY 3.0 License.
20
Li, M., Zhang, Q., Kurokawa, J., Woo, J.-H., He, K. B., Lu, Z., Ohara, T., Song, Y., Streets, D. G., Carmichael, G. R., Cheng,
Y. F., Hong, C. P., Huo, H., Jiang, X. J., Kang, S. C., Liu, F., Su, H., Zheng, B.: MIX: a mosaic Asian anthropogenic
emission inventory for the MICS-Asia and the HTAP projects, Atmos. Chem. Phys. Discuss., 15, 34813-34869, 2015.
Ministry of Environment: http://www2.env.go.jp/pm25monitoring/index.html. [in Japanese] last access: 8 November 2016
Morino, Y., Ohara, T., Nishizawa, M.: Atmospheric behavior, deposition, and budget of radioactive materials from the 5
Fukushima Daiichi nuclear power plant in March 2011, Geophys. Res. Lett., 38, L00G11, 2011.
Morino, Y., Nagashima, T., Sugata, S., Sato, K., Tanabe, K., Noguchi, T., Takami, A., Tanimoto, H., Ohara, T.: Verification
of chemical transport model for PM2.5 chemical composition using simultaneous measurement data over Japan, Aerosol
and Air Quality Research, 15, 2009-2023, 2015.
Nagashima, T., Ohara, T., Sudo, K., Akimoto, H.: The relative importance of various source regions on East Asian surface 10
ozone, Atmos. Chem. Phys., 10, 11305-11322, 2010.
Osada, K., Ueda, S., Egashira, T., Takami, A., Kaneyasu, N.: Measurement of gaseous NH3 and particulate NH4+ in the
atmosphere by fluorescent detection after continuous air-water droplet sampling, Aerosol and Air Quality Research, 11,
170-178, 2011.
Osada, K., Kamiguchi, Y., Yamamoto, S., Kuwahara, S., Pan, X., Hara, Y., Uno, I.: Comparison of ionic concentrations on 15
size-segregated atmospheric aerosol particles based on a denuder-filter method and a continuous dichotomous Aerosol
Chemical Speciation Analyzer (ACSA-12), Earozoru Kenkyu, 31, 205–211, doi: 10.11203/jar.31.205, 2016. (in
Japanese with English abstract)
Pan, X. L., Kanaya, Y., Wang, Z. F., Liu, Y., Pochanart, P., Akimoto, H., Sun, Y. L., Dong, H. B., Li, J., Irie, H., Takigawa,
M.: Correlation of black carbon aerosol and carbon monoxide in the high-altitude environment of My. Huang in Eastern 20
China, Atmos. Chem. Phys., 11, 9735-9747, 2011.
Pan, X. L., Uno, I., Hara, Y., Osada, K., Yamamoto, K., Wang, Z., Sugimoto, N., Kobayashi, H., Wang, Z. F.: Polarization
properties of aerosol particles over western Japan: classification, seasonal variation, and implications for air quality,
Atmos. Chem. Phys., 16, 9863-9873, 2016.
Pan, Y., Tian, S., Liu, D., Fang, Y., Zhu, X., Zhang, Q., Zheng, B., Michalski, G., Wang, Y.: Fossil fuel combustion-related 25
emissions dominate atmospheric ammonia sources during severe haze episodes: Evidence from 15N-stable isotope in
size-resolved aerosol ammonium, Environ. Sci. Tech., 50, 8049-8056, 2016.
Pandis, S. N., Seinfeld, J. H.: Sensitivity analysis of a chemical mechanism for aqueous-phase atmospheric chemistry, J. of
Geophys. Res., 94, D1, 1105-1126, 1989.
Perrino, C., Santis, F. D., Febo, A.: Criteria for the Choice of a Denuder Sampling Technique Devoted to the Measurement 30
of Atmospheric Nitrous and Nitric Acids, Atmos. Environ., 24, 617-626, 1990.
Petzold, A., Schloesser, H., Sheridan, P. J., Arnott, W. P., Ogren, J. A., Virkkula, A: Evaluation of multiangle absorption
photometry for measuring aerosol light absorption, Atmos. Sci. Technol., 39, 40-51., 2005.
Atmos. Chem. Phys. Discuss., doi:10.5194/acp-2016-879, 2016Manuscript under review for journal Atmos. Chem. Phys.Published: 14 November 2016c© Author(s) 2016. CC-BY 3.0 License.
21
Pinder, R. W., Dennis, R. L., Bhave, P. V.: Observable indicators of the sensitivity of PM2.5 nitrate to emission reductions -
Part I: Derivation of the adjusted gas ratio and applicability at regulatory-relevant time scales, Atmos. Environ., 42,
1275-1286, 2008.
San Martini, F. M., Hasenkopf, C. A., Roberts, D. C.: Statistical analysis of PM2.5 observations from diplomatic facilities in
China, Atmos. Environ., 110, 174-185, 2015. 5
Schultz, M. G., Heil, A., Hoelzemann, J. J., Spessa, A., Thonicke, K., Goldammer, J. G., Held, A. C., Pereira, J. M. C., van
het Bolscher, M.: Global wildland fire emissions from 1960 to 2000, Glob. Biogeo. Cycles, 22, GB2002, 2008.
Seinfeld, J. H. and Pandis, S. N: Atmospheric Chemistry and Physics – From Air Pollution to Climate Change, 2nd edn.,
John Wiley & Sons., New York, USA, 2006.
Sickles, J. E. II, Hodson, L. L., Vorburger, L. M.: Evaluation of the filter pack for long-duration sampling of ambient air, 10
Atmos. Environ., 33, 2187-2202, 1999.
Shimadera, H, Hayami, H., Chatani, S., Morino, Y., Mori, Y., Morikawa, T., Yamaji, K., Ohara, T.: Sensitivity analyses of
factors influencing CMAQ performance for fine particulate nitrate, J. of the Air & Waste Manage. Assoc., 64 (4), 374-
387, 2014.
Skamarock, W. C., Klemp, J. B., Dudhia, J., Gill, D. D., Barker, D. M., Duda, M. G., Huang, X-Y., Wang, W., Powers, J. 15
G.: A description of the advanced research WRF version 3, NCAR Tech. Note, NCAR/TN-475+STR, 113 pp., Natl.
Cent. for Atmos. Res., Boulder, Colorado, USA, 2008.
Stein, A. F., Draxler, R. R., Rolph, G. D., Stunder, B. J. B., Cohen, M. D., Ngan, F: NOAA’s HYSPLIT atmospheric
transport and dispersion modeling system, Bull. Amer. Meteor. Soc., 96, 2059-2077, 2015.
Streets, D. G., Bond, T. C., Carmichael, G. R., Fernandes, S. D., Fu, Q., He, D., Klimont, Z., Nelson, S. M., Tsai, N. Y., 20
Wang, M. Q., Woo, J.-H., Yarber1, K. F.: An inventory of gaseous and primary aerosol emissions in Asia in the year
2000, J. Geophys. Res. Atmos., 2003, 108, doi:10.1029/2002JD003093.
Uno, I., Sugimoto, N., Shimizu, A., Yumimoto, K, Hara, Y., Wang, Z.: Record Heavy PM2.5 air pollution over China in
January 2013: Vertical and horizontal dimensions, SOLA, 10, 136-140. 2014
Vecchi, R., Valli, G., Fermo, P., D'Alessandro, A., Piazzalunga, A., Bernardoni, V.: Organic and Inorganic Sampling 25
Artefacts Assessment. Atmos. Environ., 43, 1713-1720, 2009.
Wang, H., Tan, S. C., Wang, Y., Jiang, C., Shi, G-Y., Zhang, M-X., Che, H-Z.: A multisource observation study of the
severe prolonged regional haze episode over eastern China in January 2013, Atmos. Environ., 89, 807-815, 2014.
Xia, Y., Zhao, Y., Nielsen, C. P.: Benefits of China’s efforts in gaseous pollutant control indicated by the bottom-up
emissions and satellite observations 2000-2014, Atmos. Environ., 136, 43-53, 2016. 30
Ying, Q., Wu, L., Zhang, H.: Local and inter-regional contributions to PM2.5 nitrate and sulfate in China, Atmos. Environ.,
94, 582-592, 2014.
Atmos. Chem. Phys. Discuss., doi:10.5194/acp-2016-879, 2016Manuscript under review for journal Atmos. Chem. Phys.Published: 14 November 2016c© Author(s) 2016. CC-BY 3.0 License.

22
Zheng, G. J., Duan, F. K., Su, H., Ma, Y. L., Cheng, Y., Zheng, B., Zhang, Q., Huang, T., Kimoto, T., Chang, D., Poschl, U.,
Cheng, Y. F., He, K. B.: Exploring the severe winter haze in Beijing: the impact of synoptic weather, regional transport
and heterogeneous reactions, Atmos. Chem. Phys., 15, 2669-2983, 2015.
Zhang, M., Gao, L., Ge, C., Xu, Y.: Simulation of nitrate aerosol concentrations over East Asia with the model system
RAMS-CMAQ, Tellus, 59B, 372-380, 2007. 5
Atmos. Chem. Phys. Discuss., doi:10.5194/acp-2016-879, 2016Manuscript under review for journal Atmos. Chem. Phys.Published: 14 November 2016c© Author(s) 2016. CC-BY 3.0 License.
23
5
10
15
20
Figure 1: Temporal variation of PM2.5 over Japan at Fukuoka, the Goto Islands, Tsushima Island, and Tottori during January 7-25 17, 2015. Blue and red shading show the episodes focused on in this study. Red lines indicate observations. Black lines indicate the base case simulation and dotted black lines indicate the sensitivity simulation in which the anthropogenic emissions from Japan were switched off; the differences between these results shown in gray represent local contributions.
Atmos. Chem. Phys. Discuss., doi:10.5194/acp-2016-879, 2016Manuscript under review for journal Atmos. Chem. Phys.Published: 14 November 2016c© Author(s) 2016. CC-BY 3.0 License.
24
5
10
15
20
Figure 2: Temporal variation of PM2.5 over China at Beijing, Shanghai, and Shenyang during January 7-17, 2015. Red lines indicate observations by BAM at the U.S. Embassy in Beijing and at the U.S. Consulates in Shenyang and Shanghai. Black lines indicate the base case simulation and dotted black lines indicate the sensitivity simulation in which the anthropogenic emissions from Japan were switched off; the differences between these results shown in gray represent Japanese contributions. 25
Atmos. Chem. Phys. Discuss., doi:10.5194/acp-2016-879, 2016Manuscript under review for journal Atmos. Chem. Phys.Published: 14 November 2016c© Author(s) 2016. CC-BY 3.0 License.
25
5
10
15
20
Figure 3: Modeling domain for horizontal resolutions of (top) 81 km and (bottom) 27 km with anthropogenic NOx emissions. 25
Atmos. Chem. Phys. Discuss., doi:10.5194/acp-2016-879, 2016Manuscript under review for journal Atmos. Chem. Phys.Published: 14 November 2016c© Author(s) 2016. CC-BY 3.0 License.
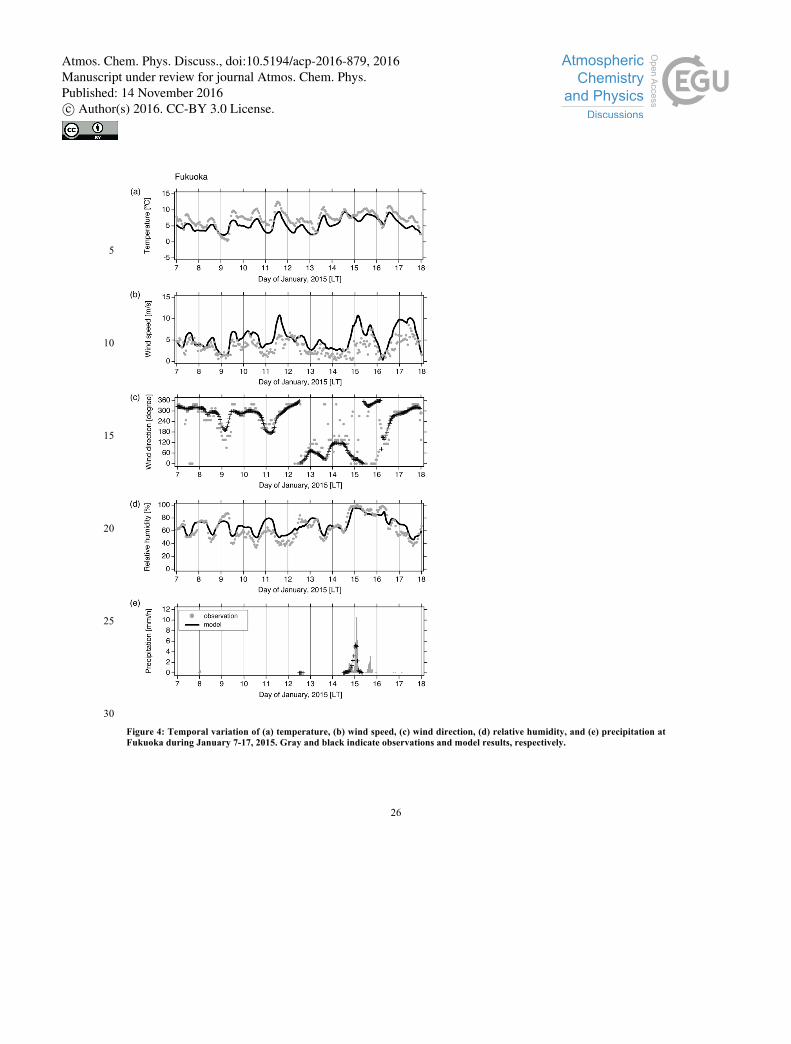
26
5
10
15
20
25
30
Figure 4: Temporal variation of (a) temperature, (b) wind speed, (c) wind direction, (d) relative humidity, and (e) precipitation at Fukuoka during January 7-17, 2015. Gray and black indicate observations and model results, respectively.
Atmos. Chem. Phys. Discuss., doi:10.5194/acp-2016-879, 2016Manuscript under review for journal Atmos. Chem. Phys.Published: 14 November 2016c© Author(s) 2016. CC-BY 3.0 License.
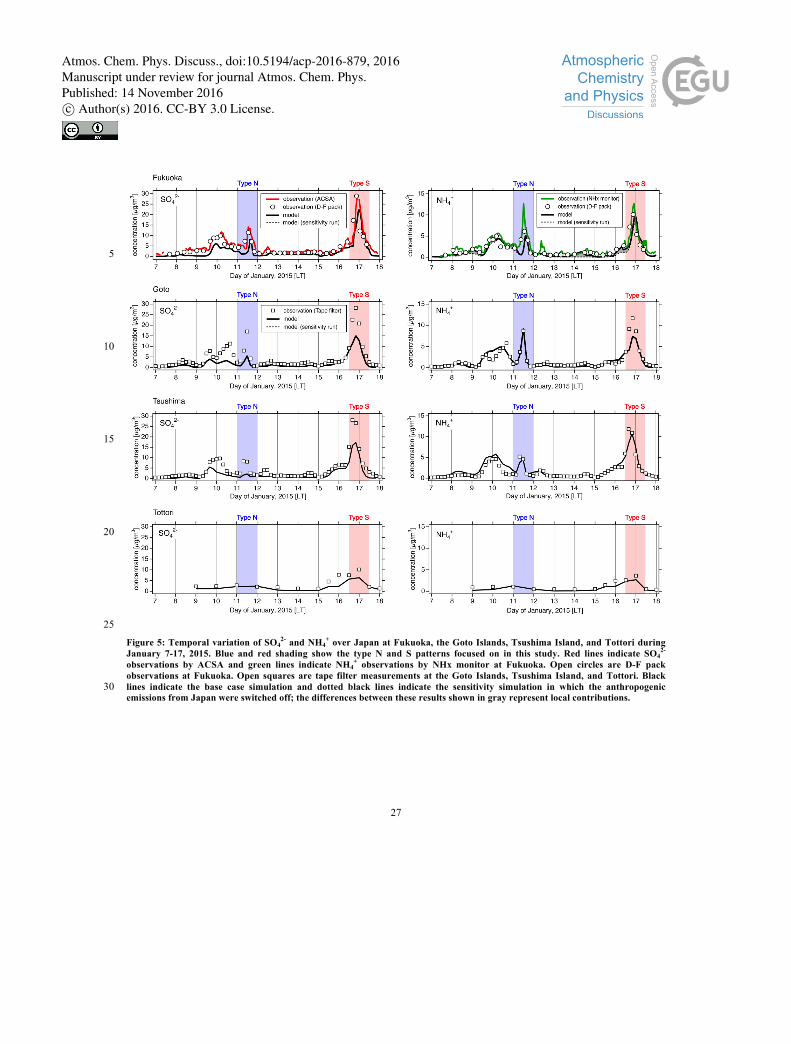
27
5
10
15
20
25
Figure 5: Temporal variation of SO42- and NH4
+ over Japan at Fukuoka, the Goto Islands, Tsushima Island, and Tottori during January 7-17, 2015. Blue and red shading show the type N and S patterns focused on in this study. Red lines indicate SO4
2- observations by ACSA and green lines indicate NH4
+ observations by NHx monitor at Fukuoka. Open circles are D-F pack observations at Fukuoka. Open squares are tape filter measurements at the Goto Islands, Tsushima Island, and Tottori. Black lines indicate the base case simulation and dotted black lines indicate the sensitivity simulation in which the anthropogenic 30 emissions from Japan were switched off; the differences between these results shown in gray represent local contributions.
Atmos. Chem. Phys. Discuss., doi:10.5194/acp-2016-879, 2016Manuscript under review for journal Atmos. Chem. Phys.Published: 14 November 2016c© Author(s) 2016. CC-BY 3.0 License.
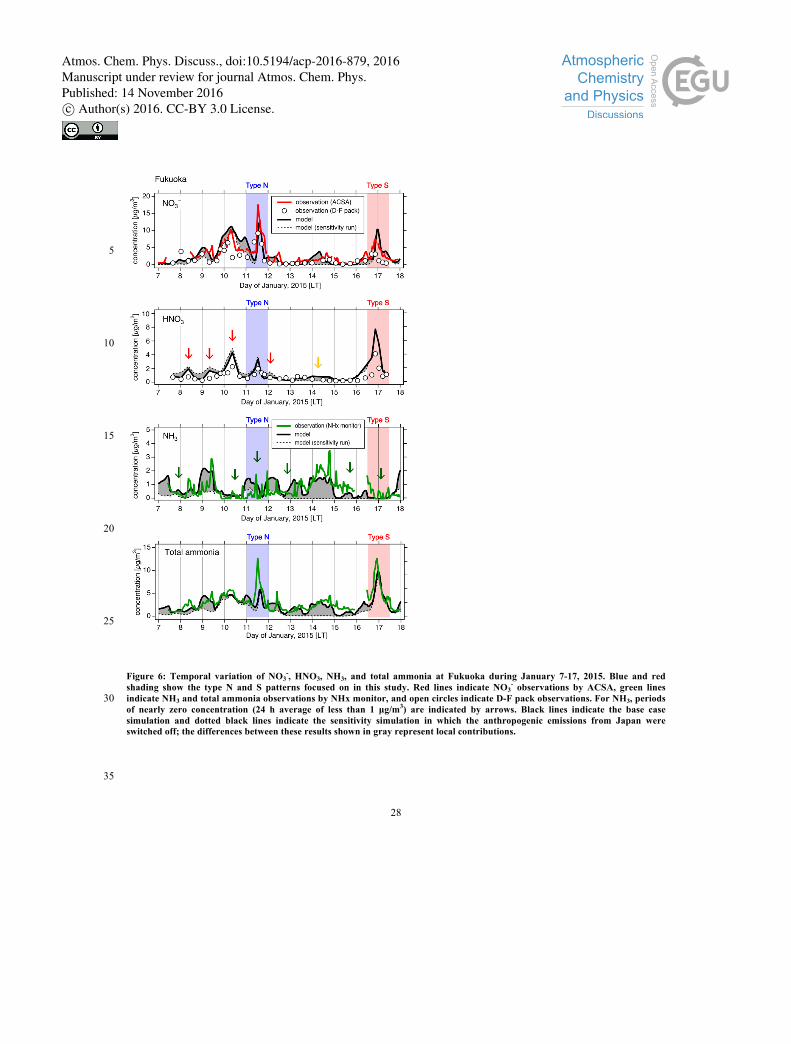
28
5
10
15
20
25
Figure 6: Temporal variation of NO3-, HNO3, NH3, and total ammonia at Fukuoka during January 7-17, 2015. Blue and red
shading show the type N and S patterns focused on in this study. Red lines indicate NO3- observations by ACSA, green lines
indicate NH3 and total ammonia observations by NHx monitor, and open circles indicate D-F pack observations. For NH3, periods 30 of nearly zero concentration (24 h average of less than 1 µg/m3) are indicated by arrows. Black lines indicate the base case simulation and dotted black lines indicate the sensitivity simulation in which the anthropogenic emissions from Japan were switched off; the differences between these results shown in gray represent local contributions.
35
Atmos. Chem. Phys. Discuss., doi:10.5194/acp-2016-879, 2016Manuscript under review for journal Atmos. Chem. Phys.Published: 14 November 2016c© Author(s) 2016. CC-BY 3.0 License.
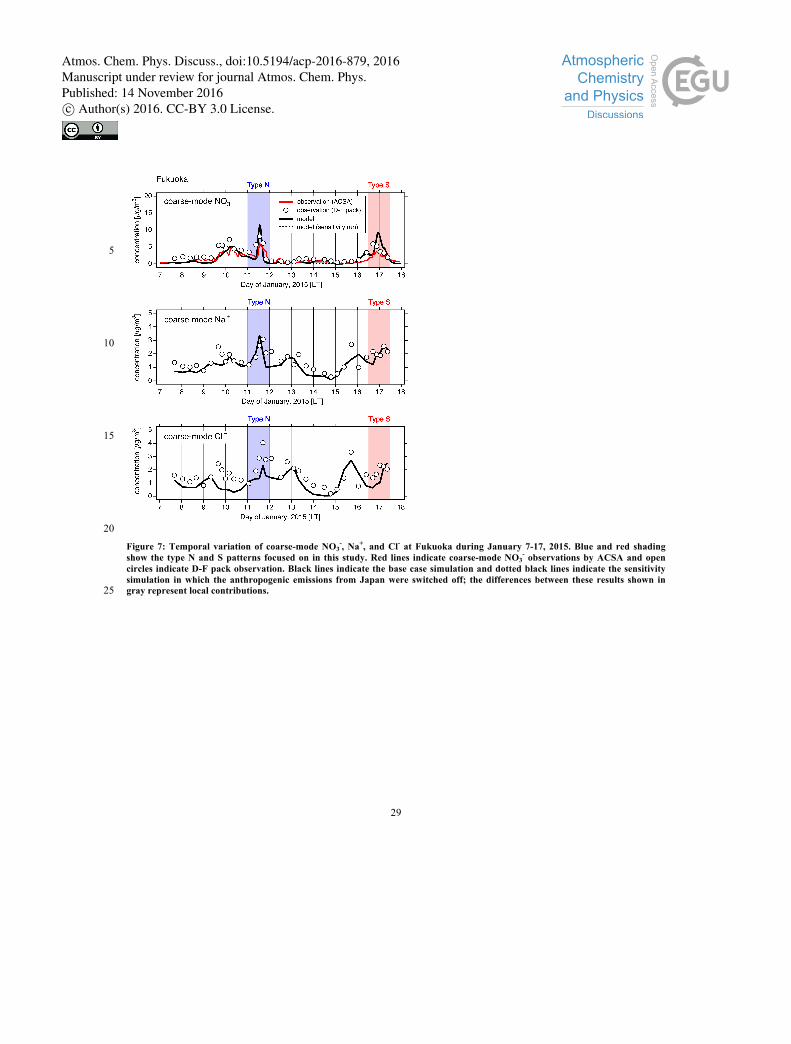
29
5
10
15
20
Figure 7: Temporal variation of coarse-mode NO3-, Na+, and Cl- at Fukuoka during January 7-17, 2015. Blue and red shading
show the type N and S patterns focused on in this study. Red lines indicate coarse-mode NO3- observations by ACSA and open
circles indicate D-F pack observation. Black lines indicate the base case simulation and dotted black lines indicate the sensitivity simulation in which the anthropogenic emissions from Japan were switched off; the differences between these results shown in gray represent local contributions. 25
Atmos. Chem. Phys. Discuss., doi:10.5194/acp-2016-879, 2016Manuscript under review for journal Atmos. Chem. Phys.Published: 14 November 2016c© Author(s) 2016. CC-BY 3.0 License.
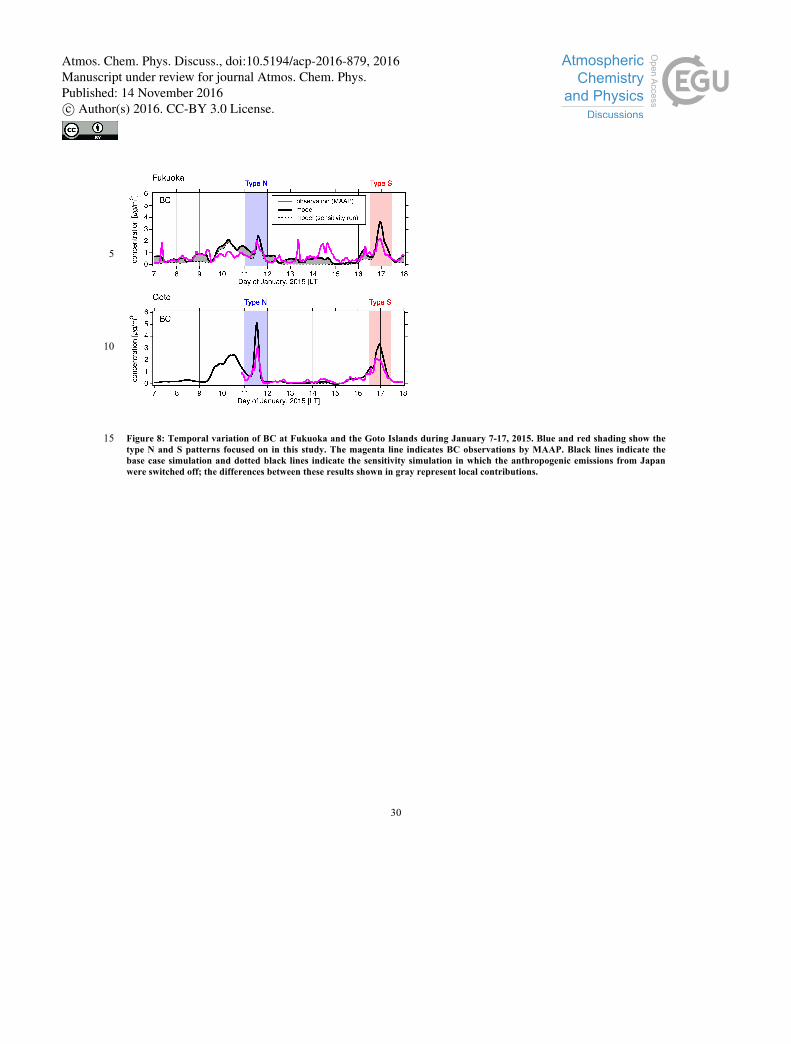
30
5
10
Figure 8: Temporal variation of BC at Fukuoka and the Goto Islands during January 7-17, 2015. Blue and red shading show the 15 type N and S patterns focused on in this study. The magenta line indicates BC observations by MAAP. Black lines indicate the base case simulation and dotted black lines indicate the sensitivity simulation in which the anthropogenic emissions from Japan were switched off; the differences between these results shown in gray represent local contributions.
Atmos. Chem. Phys. Discuss., doi:10.5194/acp-2016-879, 2016Manuscript under review for journal Atmos. Chem. Phys.Published: 14 November 2016c© Author(s) 2016. CC-BY 3.0 License.
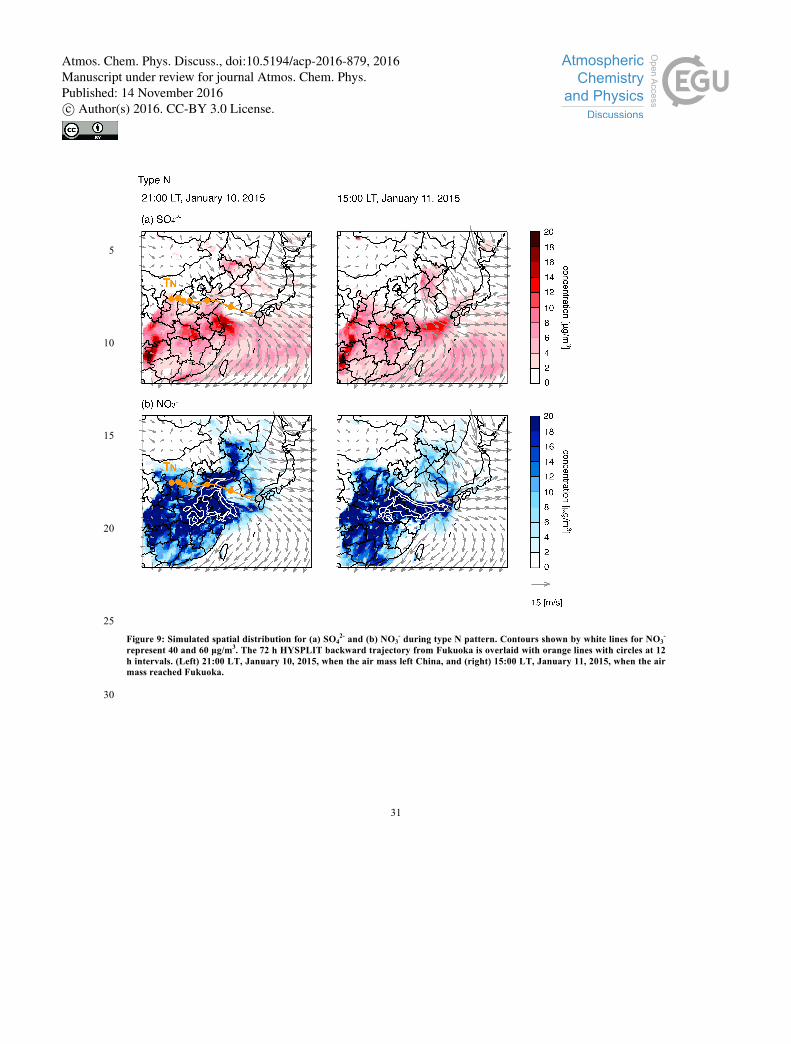
31
5
10
15
20
25
Figure 9: Simulated spatial distribution for (a) SO42- and (b) NO3
- during type N pattern. Contours shown by white lines for NO3-
represent 40 and 60 µg/m3. The 72 h HYSPLIT backward trajectory from Fukuoka is overlaid with orange lines with circles at 12 h intervals. (Left) 21:00 LT, January 10, 2015, when the air mass left China, and (right) 15:00 LT, January 11, 2015, when the air mass reached Fukuoka.
30
Atmos. Chem. Phys. Discuss., doi:10.5194/acp-2016-879, 2016Manuscript under review for journal Atmos. Chem. Phys.Published: 14 November 2016c© Author(s) 2016. CC-BY 3.0 License.
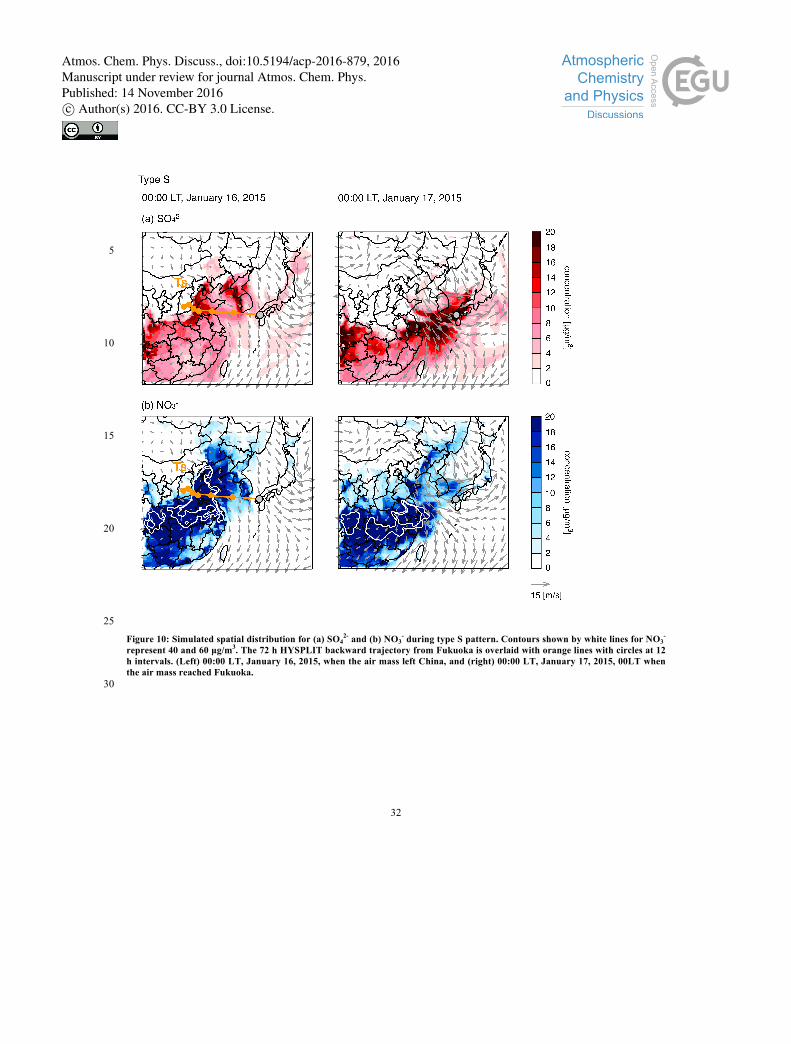
32
5
10
15
20
25
Figure 10: Simulated spatial distribution for (a) SO42- and (b) NO3
- during type S pattern. Contours shown by white lines for NO3-
represent 40 and 60 µg/m3. The 72 h HYSPLIT backward trajectory from Fukuoka is overlaid with orange lines with circles at 12 h intervals. (Left) 00:00 LT, January 16, 2015, when the air mass left China, and (right) 00:00 LT, January 17, 2015, 00LT when the air mass reached Fukuoka.
30
Atmos. Chem. Phys. Discuss., doi:10.5194/acp-2016-879, 2016Manuscript under review for journal Atmos. Chem. Phys.Published: 14 November 2016c© Author(s) 2016. CC-BY 3.0 License.
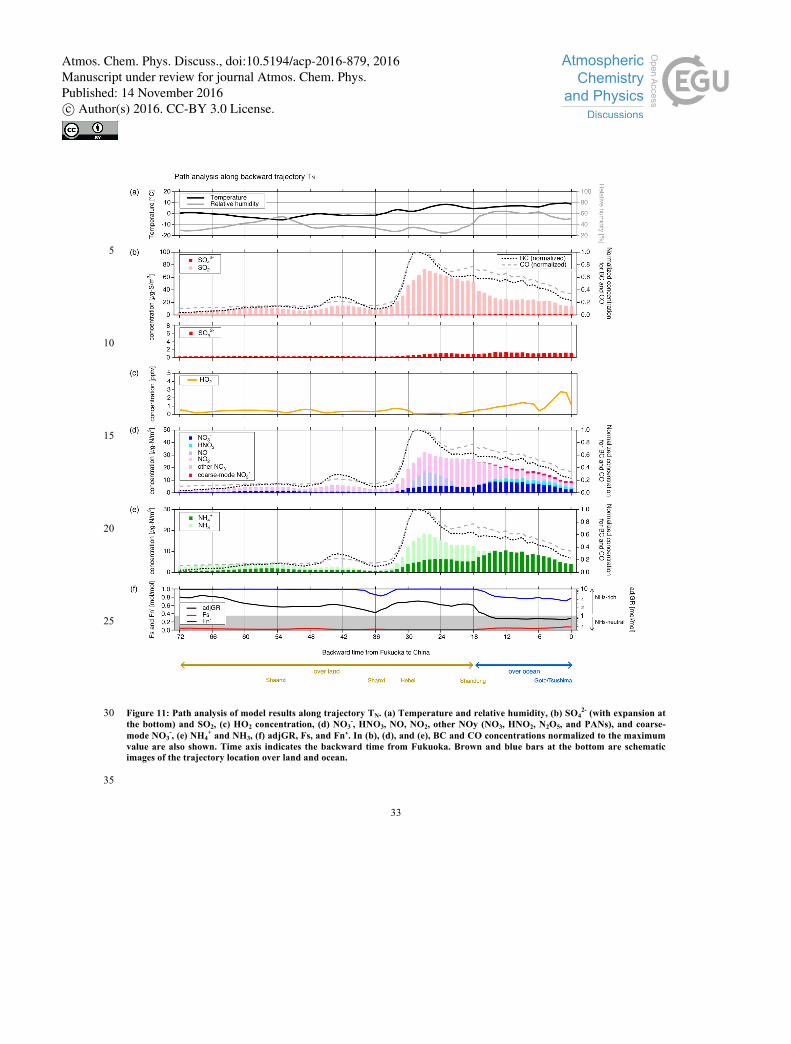
33
5
10
15
20
25
Figure 11: Path analysis of model results along trajectory TN. (a) Temperature and relative humidity, (b) SO42- (with expansion at 30
the bottom) and SO2, (c) HO2 concentration, (d) NO3-, HNO3, NO, NO2, other NOy (NO3, HNO2, N2O5, and PANs), and coarse-
mode NO3-, (e) NH4
+ and NH3, (f) adjGR, Fs, and Fn’. In (b), (d), and (e), BC and CO concentrations normalized to the maximum value are also shown. Time axis indicates the backward time from Fukuoka. Brown and blue bars at the bottom are schematic images of the trajectory location over land and ocean.
35
Atmos. Chem. Phys. Discuss., doi:10.5194/acp-2016-879, 2016Manuscript under review for journal Atmos. Chem. Phys.Published: 14 November 2016c© Author(s) 2016. CC-BY 3.0 License.
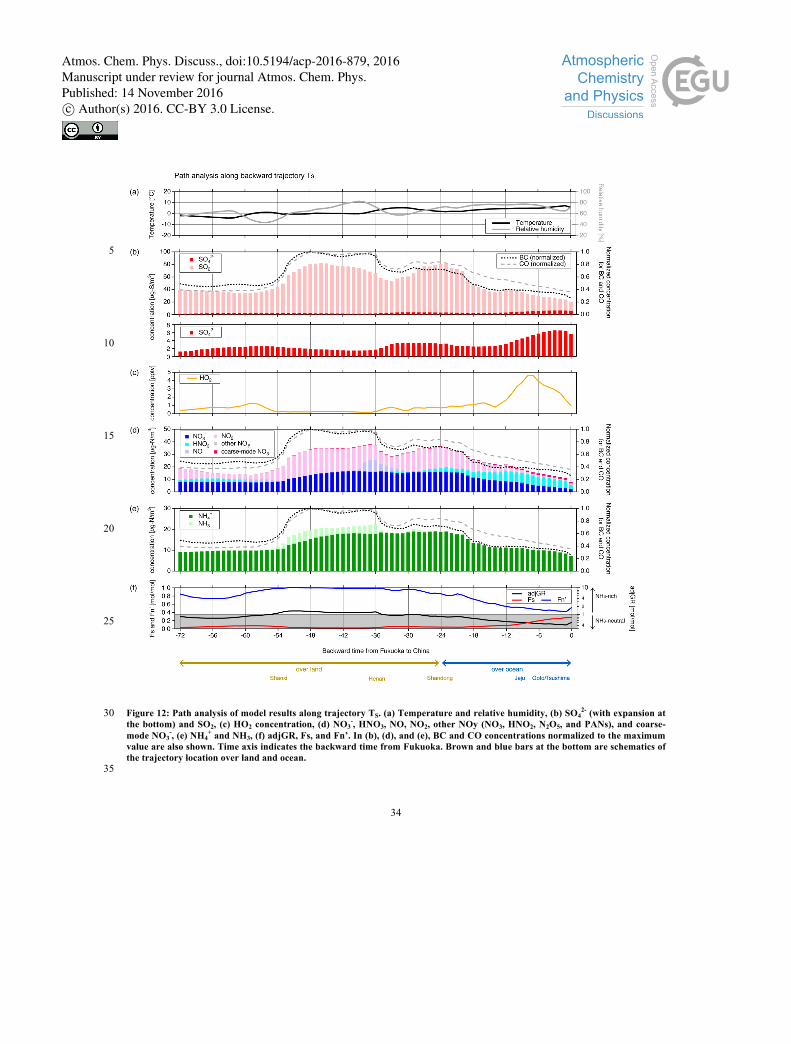
34
5
10
15
20
25
Figure 12: Path analysis of model results along trajectory TS. (a) Temperature and relative humidity, (b) SO42- (with expansion at 30
the bottom) and SO2, (c) HO2 concentration, (d) NO3-, HNO3, NO, NO2, other NOy (NO3, HNO2, N2O5, and PANs), and coarse-
mode NO3-, (e) NH4
+ and NH3, (f) adjGR, Fs, and Fn’. In (b), (d), and (e), BC and CO concentrations normalized to the maximum value are also shown. Time axis indicates the backward time from Fukuoka. Brown and blue bars at the bottom are schematics of the trajectory location over land and ocean.
35
Atmos. Chem. Phys. Discuss., doi:10.5194/acp-2016-879, 2016Manuscript under review for journal Atmos. Chem. Phys.Published: 14 November 2016c© Author(s) 2016. CC-BY 3.0 License.
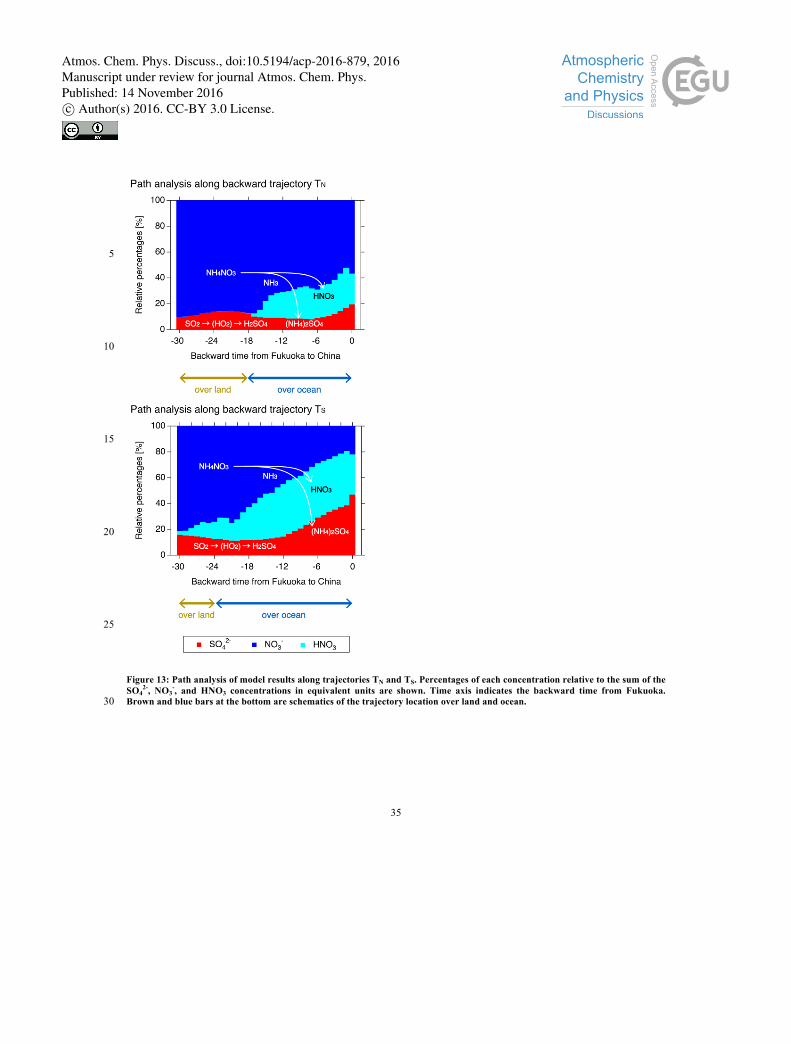
35
5
10
15
20
25
Figure 13: Path analysis of model results along trajectories TN and TS. Percentages of each concentration relative to the sum of the SO4
2-, NO3-, and HNO3 concentrations in equivalent units are shown. Time axis indicates the backward time from Fukuoka.
Brown and blue bars at the bottom are schematics of the trajectory location over land and ocean. 30
Atmos. Chem. Phys. Discuss., doi:10.5194/acp-2016-879, 2016Manuscript under review for journal Atmos. Chem. Phys.Published: 14 November 2016c© Author(s) 2016. CC-BY 3.0 License.
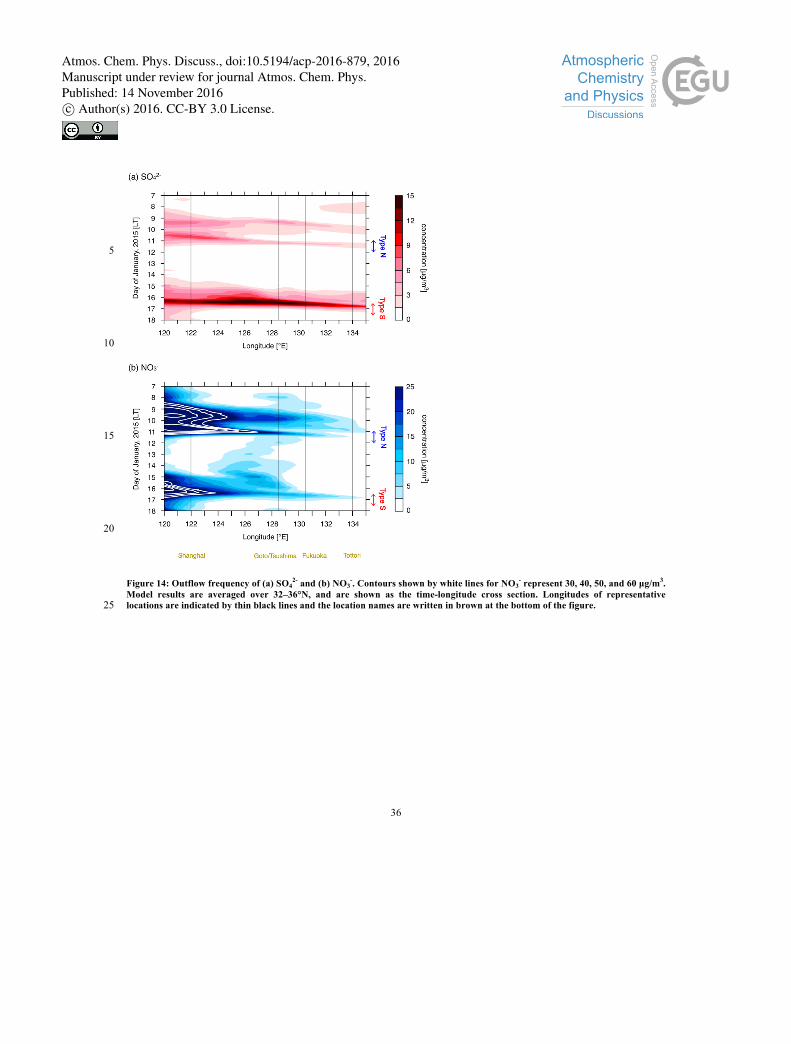
36
5
10
15
20
Figure 14: Outflow frequency of (a) SO42- and (b) NO3
-. Contours shown by white lines for NO3- represent 30, 40, 50, and 60 µg/m3.
Model results are averaged over 32–36°N, and are shown as the time-longitude cross section. Longitudes of representative locations are indicated by thin black lines and the location names are written in brown at the bottom of the figure. 25
Atmos. Chem. Phys. Discuss., doi:10.5194/acp-2016-879, 2016Manuscript under review for journal Atmos. Chem. Phys.Published: 14 November 2016c© Author(s) 2016. CC-BY 3.0 License.
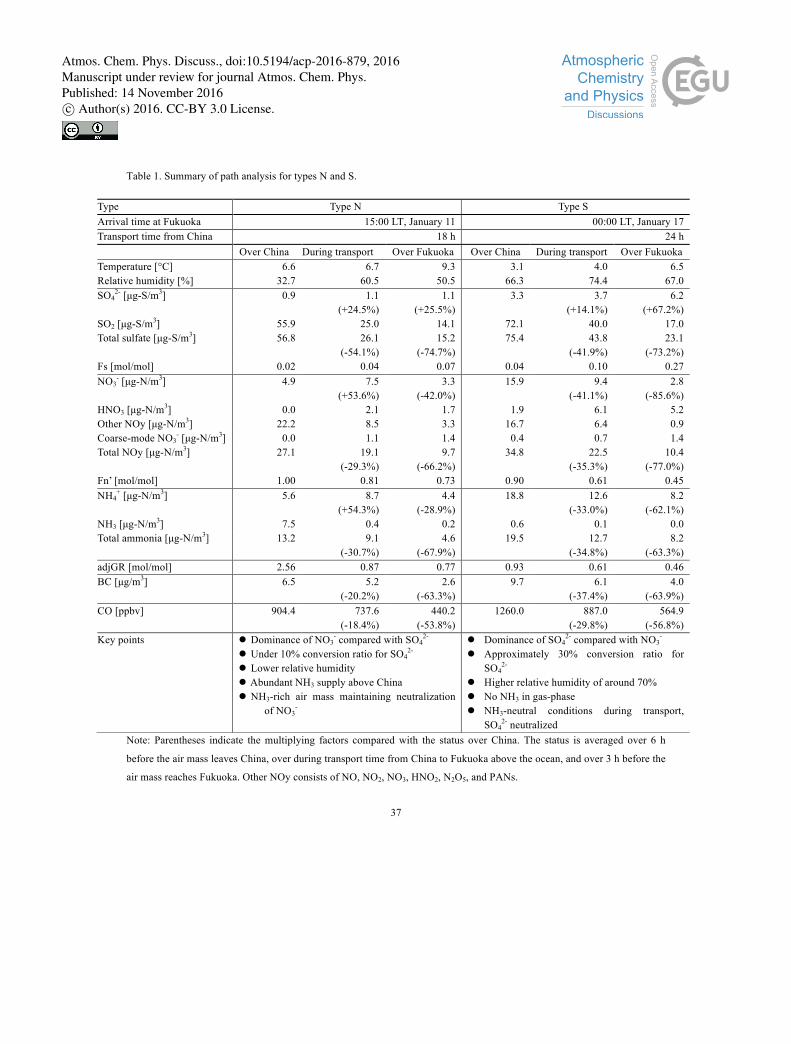
37
Table 1. Summary of path analysis for types N and S.
Note: Parentheses indicate the multiplying factors compared with the status over China. The status is averaged over 6 h
before the air mass leaves China, over during transport time from China to Fukuoka above the ocean, and over 3 h before the
air mass reaches Fukuoka. Other NOy consists of NO, NO2, NO3, HNO2, N2O5, and PANs.
Type Type N Type S Arrival time at Fukuoka 15:00 LT, January 11 00:00 LT, January 17 Transport time from China 18 h 24 h Over China During transport Over Fukuoka Over China During transport Over Fukuoka Temperature [°C] 6.6 6.7 9.3 3.1 4.0 6.5 Relative humidity [%] 32.7 60.5 50.5 66.3 74.4 67.0 SO42- [µg-S/m3] 0.9 1.1
(+24.5%) 1.1
(+25.5%) 3.3 3.7
(+14.1%) 6.2
(+67.2%) SO2 [µg-S/m3] 55.9 25.0 14.1 72.1 40.0 17.0 Total sulfate [µg-S/m3] 56.8 26.1
(-54.1%) 15.2
(-74.7%) 75.4 43.8
(-41.9%) 23.1
(-73.2%) Fs [mol/mol] 0.02 0.04 0.07 0.04 0.10 0.27 NO3- [µg-N/m3] 4.9 7.5
(+53.6%) 3.3
(-42.0%) 15.9 9.4
(-41.1%) 2.8
(-85.6%) HNO3 [µg-N/m3] 0.0 2.1 1.7 1.9 6.1 5.2 Other NOy [µg-N/m3] 22.2 8.5 3.3 16.7 6.4 0.9 Coarse-mode NO3
- [µg-N/m3] 0.0 1.1 1.4 0.4 0.7 1.4 Total NOy [µg-N/m3] 27.1 19.1
(-29.3%) 9.7
(-66.2%) 34.8 22.5
(-35.3%) 10.4
(-77.0%) Fn’ [mol/mol] 1.00 0.81 0.73 0.90 0.61 0.45 NH4+ [µg-N/m3] 5.6 8.7
(+54.3%) 4.4
(-28.9%) 18.8 12.6
(-33.0%) 8.2
(-62.1%) NH3 [µg-N/m3] 7.5 0.4 0.2 0.6 0.1 0.0 Total ammonia [µg-N/m3] 13.2 9.1
(-30.7%) 4.6
(-67.9%) 19.5 12.7
(-34.8%) 8.2
(-63.3%) adjGR [mol/mol] 2.56 0.87 0.77 0.93 0.61 0.46 BC [µg/m3] 6.5 5.2
(-20.2%) 2.6
(-63.3%) 9.7 6.1
(-37.4%) 4.0
(-63.9%) CO [ppbv] 904.4 737.6
(-18.4%) 440.2
(-53.8%) 1260.0 887.0
(-29.8%) 564.9
(-56.8%) Key points l Dominance of NO3
- compared with SO42- l Under 10% conversion ratio for SO4
2- l Lower relative humidity l Abundant NH3 supply above China l NH3-rich air mass maintaining neutralization
of NO3-
l Dominance of SO42- compared with NO3-
l Approximately 30% conversion ratio for SO42-
l Higher relative humidity of around 70% l No NH3 in gas-phase l NH3-neutral conditions during transport,
SO42- neutralized
Atmos. Chem. Phys. Discuss., doi:10.5194/acp-2016-879, 2016Manuscript under review for journal Atmos. Chem. Phys.Published: 14 November 2016c© Author(s) 2016. CC-BY 3.0 License.