Embed Size (px)
Citation preview
MARDI Res. Bull., (1984) 12,3: (305-319)
NITROGEN UTILIZATION AND THE REQUIREMENTS FORMAINTENANCE OF KEDAH.KELANTAN CATTLE
C. DEVENDRA*
Keywords: Nitrogen utilization, Maintenance, Requirements, Kedah-Kelantan cattle.
RINGKASAN
Kajian penggunaan dan keperluan nitrogen (N) untuk hidup mantap telah dijalankan ke ataslembu-lembu Kedah-Kelantan dewasa yang berumur di antara enam dan tujuh tahun dengan purata beratbadan 321 kilogram. Sembilan jenis makanan telah digunakan dalam rekabentuk yang dirawak lengkap dimana tenaga makanan ditetapkan dan6Vo,8Vo, l l%o,l27o, l4Vo,76Vo,187o,20Vo dan22% protein kasarmakanan ditambahkan. Paras protein kasar sebanyak 6Vo adalah mencukupi untuk pengambilan bahankering (DMI). Penambahan paras protein kasai meninggikan DMI di antara 307o dan 59Vo denganberkesan (P<0.01). Penambahan paras protein kasar di dalam makanan dan DMI, meninggikanimbangan N (P<0.01). Walau bagaimanapun, imbangan N yang positif adalah lebih rendah daripada nilaiyang didapati daripada kajian yang dijalankan ke atas kerbau sawah disebabkan keluaran N air kencing(UNO) yang lebih rendah pada kerbau sawah. Nilai cerna N ialah 89.37o manakala purata nilai biologi(BV) ialah 77.5 peratus. Matrik-matrik korelasi di antara pengambilan N (NI), keluaran N tahi (FNO),keluaran N air kencing (UNO), yang dicerna (ADNI), imbangan N (NB) dan kandungan N di dalammakanan (DNC) adalah berkesan secara statistik (P<0.01) bagi semua variabel kecuali di antara FNOdan UNO, ADNI dan DNC dan NB dan DNC. Korelasi yang tertinggi ialah di antara NI dan ADNIdengan r : 0.95. N air kencing endogen (EUN) ialah 39. I mg/kg berat badan/hari dan N tahi metabolik(MFN) ialah 0.220 gtM g DMl-Keperluan protein kasar yang dicerna (DCP) untuk hidup mantap ji-angdikira melalui imbangan NB dan ADNI, dan secara faktorial memberi nilai purata 1.37 g DCPiW ')kg/
hari. Nilai ini dibincangkan berhubungan dengan laporan-laporan lain yang diterbitkan di negara-negaratrooika.
INTRODUCTION
Over the last decade, a variety ofstudies have been completed in MARDI onthe attributes of Kedah-Kelantan cattle.These studies have shown that as a geneticresource, this indigenous breed has beenquite underestimated and on the contrary,makes a very valuable contribution tomeeting part of the beef requirements of thecountry, draught power especially in the ricegrowing areas, as well as income from thesale of hides and skins. The studies onnutrition included growth performance(DnveNoRe and I-rE, 1975a; 197 5b; 1975c;DE\ENDRA and WAN ZAHART, 1977) andduring pregnancy and lactation (Lr,r-, 1977).More recently, the energy requirements formaintenance in adult cattle of this samebreed has been reported (DEVENDRA,1e80).
The studies together have demonstra-ted the significance of nutrition on pro-
ductivity in Kedah-Kelantan cattle andimplicated it as one of the most importanlfactors ensuring high performance in theseanimals. Thus, several sttrdies have consis-tently demonstrated that given an adequateplane of nutrition, these animals are capableof giving very good growth rates (about460-590 glday) when managed intensivelyunder stall feeding (DEvENona and [.88,1975a; HureceruNc and MenyuoorN,1983) and grazing conditions (CI{EN, AJrrand EvANS, 1981). Both dietary energy andprotein exert an influence on perforrnanceand variations in both constituents exertvariable levels of performance in thecountry.
Between dietary energy and protein,however, the latter consistently representsthe first limiting factor. An insufficientintake of dietary nitrogen (N) due tc a lowlevel in the ration affects voluntary feedintake (Ceurlnc, FREER and BALcH,1962: BI-exreR and WLsoN. 1963: Er-uor
*Animal Research Division, MARDI, Serdang, Selangor
305
and ToPPs, 1963a), such that these diets orsimilar feed ingredients (e.g. rice straw) arenot readily eaten by ruminants. The criticalminimum level is about seven per cent crudeprotein (Mrlrono and MrNsoN, 1968). Veryoften levels beyond this minimum are notavailable in the rural areas where both quan-tity and quality of the feeds are both limiting.Partly for this reason, and more particularlybecause of the fact that there exist reportedevidence suggesting differences in thepattern of N utilization between Britishversus Zebu beef cattle (RoBrNSoN andSrpwaRr, 1968; MonaN and VERCOE.1972) or between cattle breeds e.g. Herefordversus Shorthorn (RonrNsoN and SrsweRr,1968), a study was initiated to examine thepattern of N utilization in Kedah-Kelantancattle. This paper presents the results of theinvestigation, including a determination ofthe N requirements for maintenance of thisbreed.
MATERIALS ANDMETHODS
l. Animals
A total of nine uncastrated male bulls,six to seven years of age, were assigned tonine treatments consecutively. They were inthe live weight range 267 kg-357 kilo-grammes. They were removed from stallswhere they were fed Napier grass(Pennisetum purpureum) ad libitumfollowing drenching with anthelmentics andplaced individually in raised wooden meta-bolism stalls (90 x 105 x 100 cm) to enablefaeces and urine collection. The stalls werecleaned and washed every morning.
Each treatment involved a balance triaiwhich lasted for.three weeks. The animalswere weighed on three consecutive daysbefore each balance trial began and duringthe last three days of the 21-day trial. Thesegave the initial and final live weights respec-tively. Faeces were collected manually as itwas produced during the collection periodand urine was collected through a shutewhich opened into fibre glass trays.
The bulls were housed in an open airbarn together with adult buffalo bulls, onwhom also similar dietrry treatments wereimposed to study simultaneously, compara-tive N utilization. The latter results havebeen previously reported (DEvENone,1e84).
2. Diets
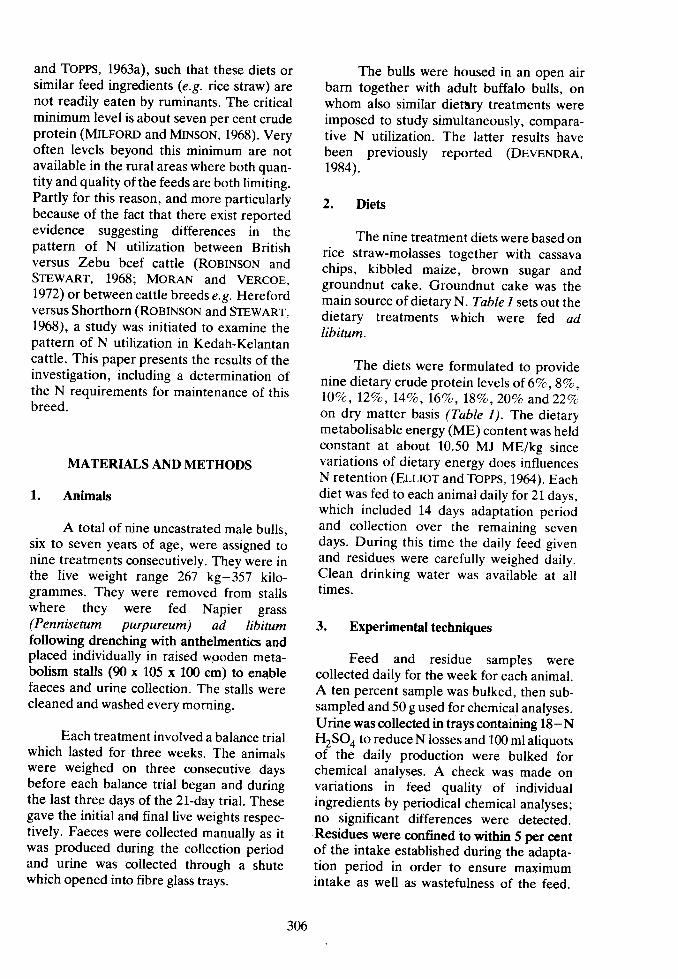
The nine treatment diets were based onrice straw-molasses together with cassavachips, kibbled maize, brown sugar andgroundnut cake. Groundnut cake was themain source of dietary N . Table t sets out thedietary treatments which were fed adlibiam.
The diets were formulated to providenine dietary crude protein levels of 6Vo,8Vo,ll7a , l2Vo , I47o, '1.67o,
l8Vo, 20Vo and 227oon dry matter basis (Table l/. The dietarymetabolisable energy (ME) content was heldconstant at about 10.50 MJ ME/kg sincevariations of dietary energy does influencesN retention (ELLroT and Topps, 1964). Eachdiet was fed to each animal daily for 21 days,which included 14 days adaptation periodand collection over the remaining sevendays. During this time the daily fee-d givenand residues were carefully weighed daily.Clean drinking water was available at alltimes.
3. Experimental techniques
Feed and residue samples werecollected daily for the week for each animal.A ten percent sample was bulked, then sub-sampled and 50 g used for chemical analyses.Urine was collected in trays containing 18-NH2SO4 to reduce N losses and 100 ml aliquotsof the daily production were bulked forchemical analyses. A check was made onvariations in feed quality of individualingredients by periodical chemical analyses;no significant differences were detected.Residues were confined to within 5 per centof the intake established during the adapta-tion period in order to ensure maximumintake as well as wastefulness of the feed.
306
ooJI
4
@
oi
B
o
I
oooo
9 ;! >d 9^ o
; ' 4' : v
; 9a ( g
; . >
9 $ l
( 6 G
e =
x c )O €
; - g9 U= ^O L
E o )e bn &
ciN
-1 iie { A
<tciN9 So t a.{ .ia.l i
d
c o o
e.r. ;00
o t. ; i
+
J A
GiN
o g
Ij
J A
od
a9 6
iO
- C
o :
= kI " r
E = O: ! <E . . H =Y Or r =
O 9
8
I
8
8
s
s
F
o ! n o o o o r ao F - o l ( a i d r ne { * d v
c > o o c { r ) d i Qa . l N F s
O o O F o O O o .o o o € h d d s(\| c.l i a.l
o o o € o o o No o o o n F o \a{ e.l N
o o o r o o o oO O O { h d d @a . l N i a l
^ r - - - €
O O O O h i H NN N _ 6
O O O F _ O O A r i
o o o n n i i rC . l 6 l i 6
c ) o o d h i d -N N H V
! ^ ^ - nO O O O \ n i i ( iC l a l i d N
*0,
- s t t
z g , E $ ; Eg s g E = 7 E
s s € e i € ; s
307
I
N
q)
O
oY
q)
/I
xA
o
oF
c)
q)
oo
0
o
c.)
u . 9e ( 0o - o
.i' ar
5 E5 >2 EZ d= At r v .
O.iq)
F
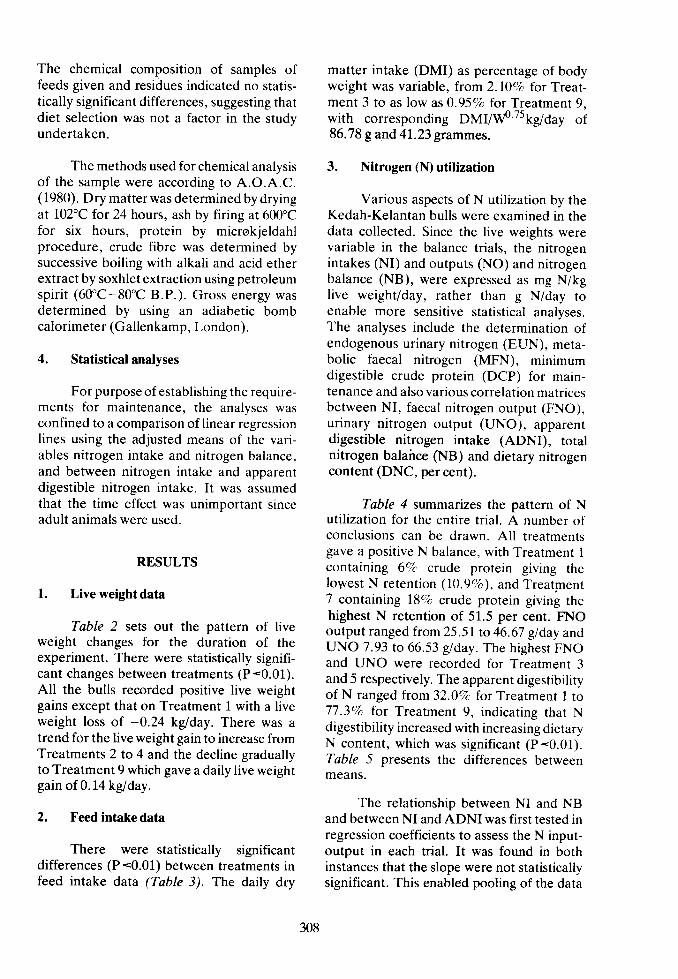
The chemical composition of samples offeeds given and residues indicated no statis-tically significant differences, suggesting thatdiet selection was not a factor in the studyundertaken.
The methods used for chemical analysisof the sample were according to A.O.A.C.(1980). Dry matter was determined by dryingat l02C for 24 hours, ash by firing at 600'Cfor six hours, protein by microkjeldahlprocedure, crude fibre was determined bysuccessive boiling with alkali and acid etherextract by soxhlet extraction using petroleumspirit (60'C-80'C B.P.). Gross energy wasdetermined by using an adiabetic bombcalorimeter (Gallenkamp, London).
4. Statisticalanalyses
For purpose of establishing the require-ments for maintenance, the analyses wasconfined to a comparison of linear regressionlines using the adjusted means of the vari-ables nitrogen intake and nitrogen balance,and between nitrogen intake and apparentdigestible nitrogen intake. It was assumedthat the time effect was unimportant sinceadult animals were used.
RESULTS
l. Live weight data
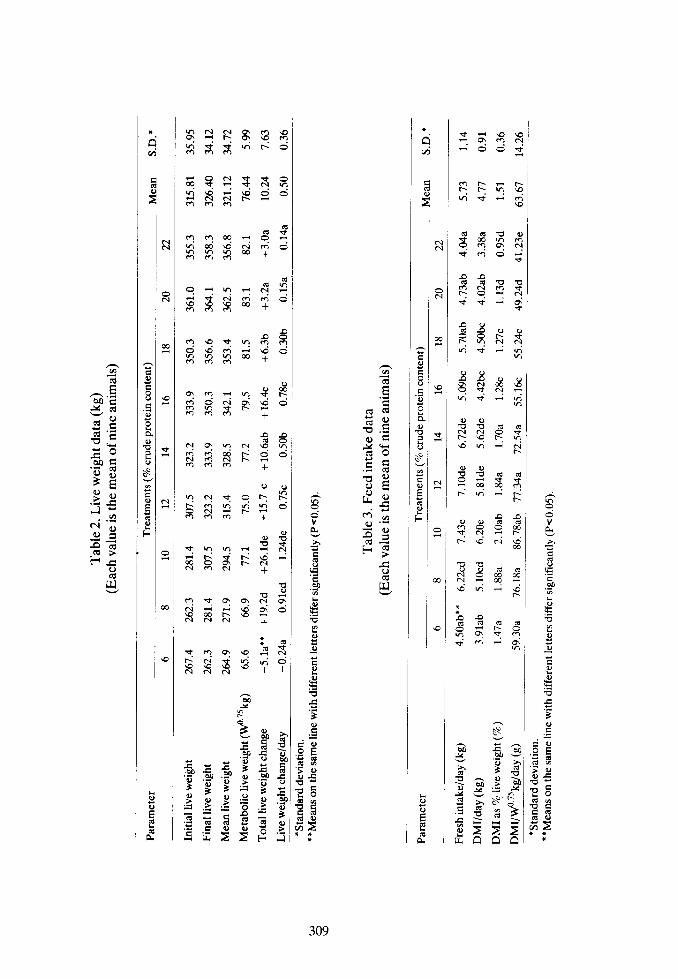
Table 2 sets out the pattern of liveweight changes for the duration of theexperiment. There were statistically signifi-cant changes between treatments (P=0.01).All the bulls recorded positive live weightgains except that on Treatment 1 with a liveweight loss of -0.24 kglday. There was atrend for the live weight gain to increase fromTreatments 2 to 4 and the decline graduallyto Treatment 9 which gave a daily live weightgain of 0.14 kg/day.
2. Feed intake data
There were statistically significantdifferences (P=0.01) between treatments infeed intake data (Table 31. The daily dry
matter intake (DMI) as percentage of bodyweight was variable, from 2.I0Vo for Treat-ment 3 to as low as0.95% for Treatment 9,with corresponding DMI/up'zslglday of86.78 g and 4l.23grammes.
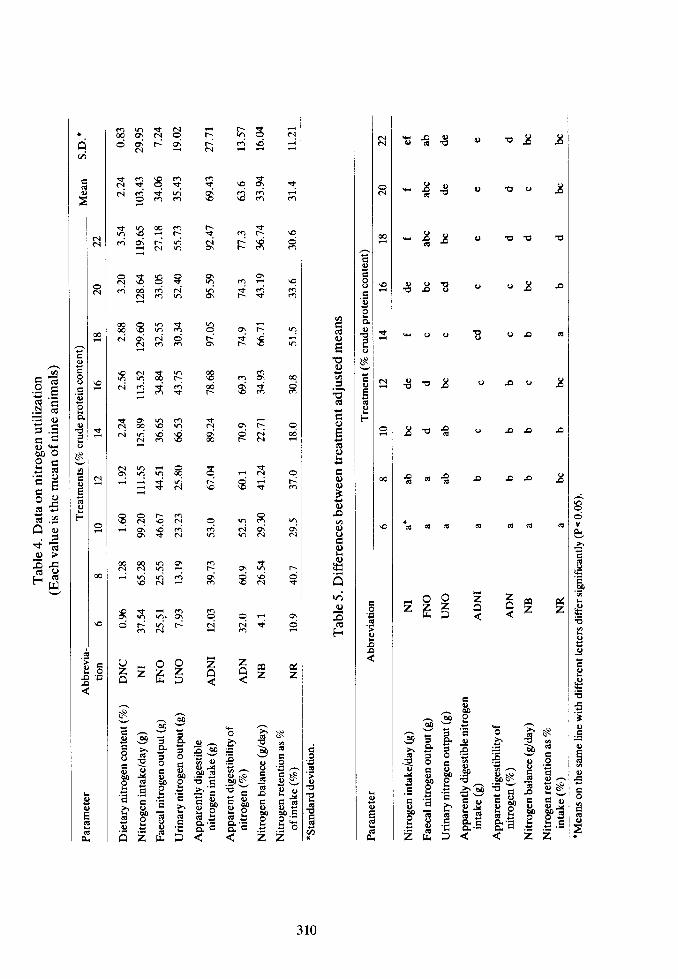
3. Nitrogen (N) utilization
Various aspects of N utilization by theKedah-Kelantan bulls were examined in thedata collected. Since the live weights werevariable in the balance trials, the nitrogenintakes (NI) and outputs (NO) and nitrogenbalance (NB), were expressed as mg N/kglive weight/day, rather than g N/day toenable more sensitive statistical analyses.The analyses include the determination ofendogenous urinary nitrogen (EUN), meta-bolic faecal nitrogen (MFN), minimumdigestible crude protein (DCP) for main-tenance and also various correlation matricesbetween NI, faecal nitrogen output (FNO),urinary nitrogen output (UNO), apparentdigestible nitrogen intake (ADNI), totalnitrogen balairce (NB) and dietary nitrogencontent (DNC, per cent).
Table 4 summarizes the pattern of Nutilization for the entire trial. A number ofconclusions can be drawn. All treatmentsgave a positive N balance, with Treatment 1containing 6c/c crude protein giving theloyest N retention (10.9%), and Treatment7 containin g l87a crude protein giving thehighest N retention of 51.5 per cent. FNOoutput ranged from 25.5i to 46.67 g/day andUNO 7.93 to 66.53 glday. The highest FNOand UNO were recorded for Treatment 3and 5 respectively. The apparent digestibilityof N ranged from32.0Vc for Treatment 1 to77.3Vc for Treatment 9, indicating that Ndigestibility increased with increasing dietaryN content, which was significant (P-0.01).Table 5 presents the differences betweenmeans.
The relationship between NI and NBand between NI and ADNI was first tested inregression coefficients to assess the N input-output in each trial. It was found in bothinstances that the slope were not statisticallysignificant. This enabled pooling of the data
308
v i \ o \ oi O \ C O N
. j c i d n
c i a - i F -F a - ' n \ or i + . i r ;
(t)
{ 0 0 h 6O . o o \ N
*
(.) c] co *t - . o * d* < ? : o \
s
d 5 t Y +r h O l a - lr ; + . j , ;
h
q \ N @ \ OQ S N F
h + i hn
o oo t N o *r € F - n\ o r ; - i c i
r
o o
o i $ vF @ € 6
r n * l -r
o o ( ! G
s N i rr \ o N \ o €
o @ 6i @ F
h H €F-
l
q n -O i O ,
s
GI
o
60
_ o
?o
a
oq)
F
)o
c a. y t rE G
> q )
< 9 o
6 ( )
6 2
Nc.l
+
l
Il
N I
-3 fo sl; e e i- q e i F l! : s l l= € K E l
- H H -
i j > > > lr i n A n I
0
Na
o
oF
q
d
t
d c !
I q.r
q t r- Y H) ^E c
i l ( )
O E
a r i c- ' 9
Y ' t 6Y o ) . -p . = c )
e H s et r 'I E Og .:\.:t t{o v
.!,
?o
q)
. ! )
to
d o. y t re €G O
t o
q 6
( ! o6 >
tobo
I
q q q E q q3 S $ n r - o
6 3 s $ X 8r ; . c j * \ c ; c j c iH N N T Tm 6 6
al| -t6 c q @ H o *
R f r E $ I -o 6 6
q - 1 v ' r r { ic € s 9 1 06 0 6
^ Acq \O \t rr F6 i6o . o c . i - i \ o dR n 3 - +
I
F-A
o
s..!
I
o
q . r . ' : n tc.l o c.t o\ \oO ( a \ t F - *( o o c i +
. l q n . i qm r i @ F - ON 6 N T im t o ( . , +
I
n q a q \r 6 h h nO o I H F - r6 c ) m +
q)
s n h * *
6 s s F sN r i N +
n n q q ES E F € 9N c l N +
i$ c ) O \ \ O . 5
c c ' s 6 ?N C I N I
6x
hF
? sb o <
= - ' 6 ef " = € | l E'f .E .i t, .Eol 3 ; E gE g € E g: - - ! -. F E F g E. = c o o :' E ' r i > > i
309
s
N
t
(a
0
o
o
onSo\
o
0
F
q)
o
o
, ,^.=b o c
,l< (!Y a.r
o o t r!a c)> F
9 Ta
N . ,o.r 55 Er(! >
or r ' l
v
o
bo
.!.)
o
0
I.q)
'o
o
o
o
,l
R
e - o oo d !
* 3 - 9
* 3 R
€ 3 8
9 O q )
9 r R
9 - - o
v !
! O
o t
o . o
9 o
O
o
Z ^ -, z z
* o d c c c
2 az e
tr
^ 6 $o ; E ! E 3 u> , l l = E = & €
+ q ; E E - E Ef g g g" gP ; teg E f [ i [ g g s tz d 5 ? a 2 2
e.la.l
c.l
a
t
N
c)
I
e
o
I
so
O
F
0
q)
4)
o
()
c.)0
q)
C)
(uq)
c)aq)()9)
.!)
\n!.)
F
o
(A
310
S E N S F h 8 Fcj ci r'- c. t- c4 <t -
N ( . I
N $ 8 $ $ . o X < r. r d * g e € s E
f i € = R S - F ' o" i d R S $ F H 3
E q e q q n ? eo 6 6 a . t n $ . o o
N c i h O . F - $ o
g € R * I o . F n^ i R d g 5 X e ;
3 S $ P € - E €" i d i 9 R e X I
q q 6 . q E q a qO f - r ) r C ' . l c { t O
6 N O
u - o o 2 1 ^ d .v 2 7l-.1 * J
,:.N:, o0r o 0 -
E o E B , - 3 g ' UE > g E E . b 9 = B :Y € = 2 8 ; Ef , I F F" $ i Es I €^! ' E $ E " g E s Y i r *c ^ . = t r = o = o> 6 c h 6 10 6 10 g g :
f ; g E F F : F : g g €6 2 r I 5 A < - 2 2
V O . n . . l ! 'N - \ o r 6 a r O \ F - Od n g e $ R R =
s f r ; 8 I - X o; - . ; + d F i - t -
i + C . l \ O \ O $ 6
q E q S q " r f i v )- O \ € m O a l o . O .
o \ + 6 l r ) n N ^ t
€ € n o . c i id N n r o \ n r- ' v d r i d o . a 6 d
\ O c l . i Q N < l
dN
N
(t)
o
I
q)
o
00
s
al
o
o
oF
q
I
o
oF
0
. Y t rs q
6 b o9 q' E 9
A C.)
A a
O c.r$ Eo >
,63 PF rii
for all nine trials to calculate the commonregression coefficient. These two equationswere:
NI: -%.456* 1.772N8(R.S.D. =29-1,r :0.66, P<0'01) - ( l )
NI= -58.287+2'564ADM(R.S.D. : 22.1, r : 0.946,P<0'01) - (2)
where NI : nitrogen intake (g/day), NB isnitrogen balance (mg/kg live weight/day),ADNI is apparently digestible N (mg/kg liveweight/day), R.S.D. is residual standarddeviation and r is the correlation coefficient.
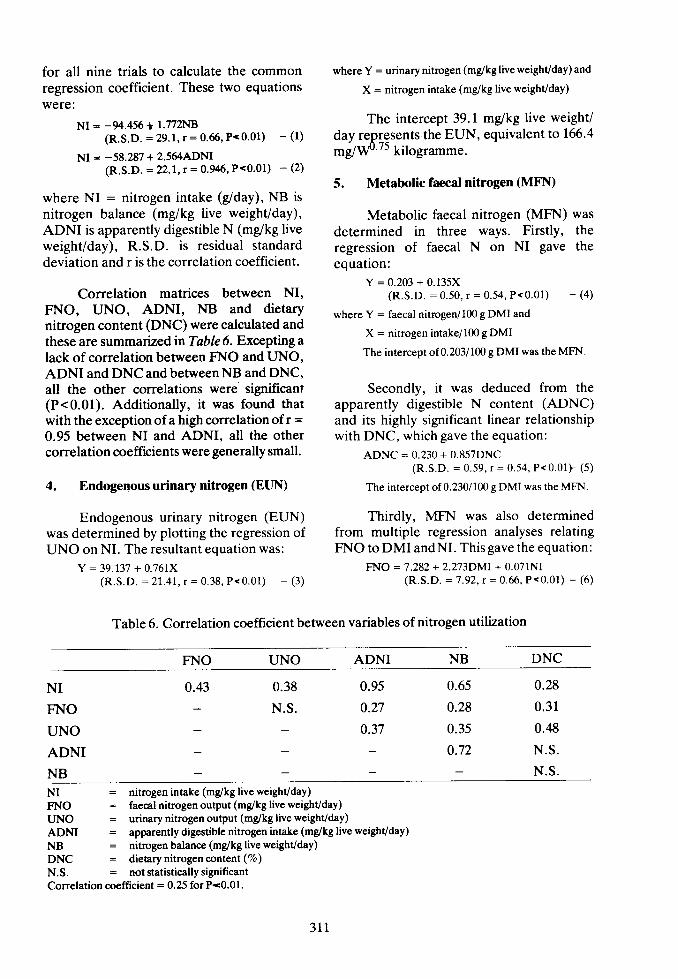
Correlation matrices between NI,FNO, UNO, ADNI, NB and dietarynitrogen content (DNC) were calculated andthese are summarized in Table 6. Excepting alack of correlation between FNO and UNO,ADNI and DNC and between NB and DNC,all the other correlations were sigrrificant(P<0.01). Additionally, it was found thatwith the exception of a high correlation of r :
0.95 between NI and ADNI, all the othercorrelation coefficients were generally small.
4. Endogenous urinary nitrogen (ELIN)
Endogenous urinary nitrogen (EUN)was determined by plotting the regression ofUNO on NI. The resultant equation was:
Y: -?9 .137+0.761X(R.S.D. :21 .41 , r = 0 .38 , P<0.01) - (3 )
where Y : urinary nitrogen (mg/kg live weight/day) and
X = nitrogen intake (mg/kg live weight/day)
The intercept 39.1 mg/kg live weight/day represents the EUN, equivalent to166.4mg/Wu'/) kilogramme.
5. Metabolic faecal nitrogen (MFItl)
Metabolic faecal nitrogen (MFN) wasdetermined in three ways. Firstly, theregression of faecal N on NI gave theequation:
Y:0.203 + 0.135X( R . S . D . = 0 . 5 0 , r = 0 . 5 4 , P < 0 . 0 1 ) - ( 4 )
where Y = faecal nitrogen/100 g DMI and
X = nitrogen intake/100 g DMI
The intercept of 0.203/100 g DMI was the MFN.
Secondly, it was deduced from the
apparently digestible N content (ADNC)and its highly significant linear relationshipwith DNC, which gave the equation:
ADNC=0.230+0.857DNC(R.S.D. = 0.59, r : 0.54, P< 0.01)- (s)
The intercept of 0.230/100 g DMI was the MFN.
Thirdly, MFN was also determinedfrom multiple regression analyses relatingFNO to DMI and NI. This gave the equation:
FNO : 7.282 + 2.273DM1+ 0.071NI(R.S.D. =7 .92 , r = 0 .66 , P<0.01) - (6 )
Table 6. Correlation coefficient between variables of nitrogen utilization
FNO UNO ADNI NB DNC
NI
FNO
UNO
ADNINB
0.43 0.38
N.S.
0.95
0.27
0.37
0.6s
0.28
0.35
0.72
0.28
0.31
0.48
N.S.N.S.
NI = nitrogen intake (mg/kg live weighVday)FNO : faecal nitrogen output (mg/kg live weighVday)UNO : urinary nitrogen output (mg/kg live weighVday)ADNI : apparently digestible nitrogen intake (mg/kg live weight/day)NB = nitrogen balance (mg/kg live weight/day)DNC = dietarynitrogencnntent(Vo)N.S. = not statistically significantCorrelation coefficient = 0.25 for P<0.01.
3 1 1
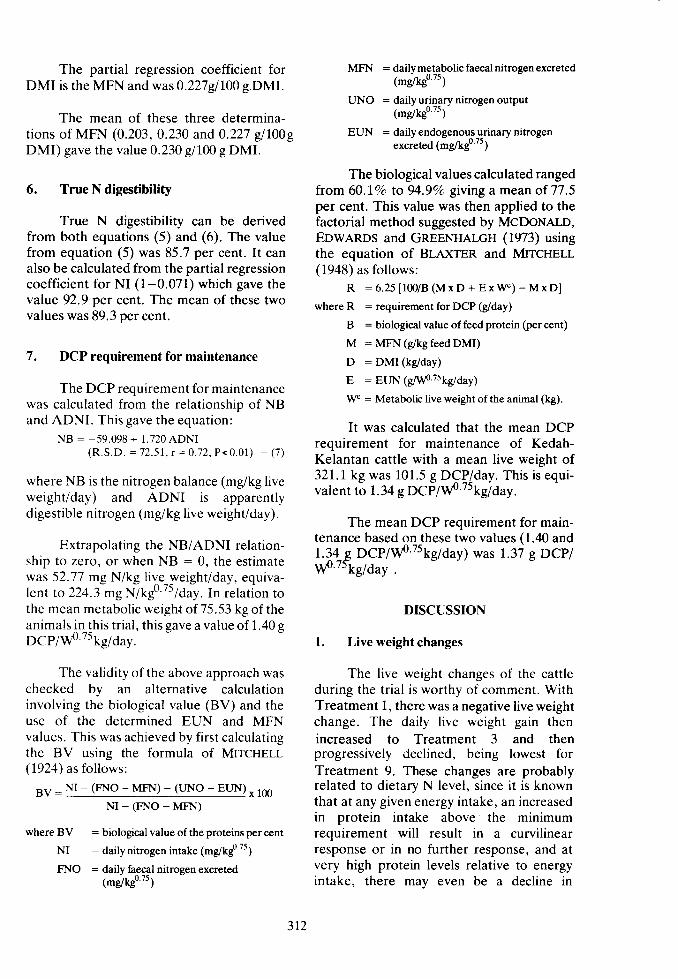
The partial regression coefficient forDMI is the MFN and was 0.227g1100 g.DMI.
The mean of these three determina-tions of MFN (0.203 , 0.230 and 0.227 g/100gDMI) gave the value 0.230 gll00 g DMI.
6. True N digestibility
True N digestibility can be derivedfrom both equations (5) and (6). The valuefrom equation (5) was 85.7 per cent. It canalso be calculated from the partial regressioncoefficient for NI (1-0.071) which gave thevalue 92.9 per cent. The mean of these twovalues was 89.3 per cent.
7. DCP requirement for maintenance
The DCP requirement for maintenancewas calculated from the relationship of NBand ADNI. This gave the equation:
N B : * 5 9 . 0 9 8 + 1 . 7 2 0 A D N I( R . S . D . : 7 2 . 5 1 , r = 0 . 7 2 . P < 0 . 0 1 ) - ( 7 )
where NB is the nitrogen balance (mg/kg liveweight/day) and ADNI is apparentlydigestible nitrogen (mg/kg live weight/day).
Extrapolating the NB/ADNI relation-ship to zero, or when NB : 0, the estimatewas 52.77 mg N/kg live weight/day. equiva-lent to 224.3mgN/kgu ' ' lduy.In relat ion tothe mean metabolic weight of 75.53 kg of theanimals in this trial, this gave a value of 1.40 gDCp/\ P.7skglday.
The validity of the above approach waschecked by an alternative calculationinvolving the biological value (BV) and theuse of the determined EUN and MFNvalues. This was achieved by first calculatingthe BV using the formula of MncHru-(1924) as follows:
BV = NI - (FNO - MFN) - (r.rNO - EW) x t00N r - ( F N O - M F N )
where BV = biological value of the proteins per cent
NI : daily nitrogen intake (-g/kgo t5)
FNO : daily fuecal nitrogen excreted(-gkgo 75)
MFN : dailymetabolicfaecalnitrogenexcreted(-g/tgntt)
UNO = daily urinary nitrogen output(-glteo ^)
EUN : daily endogenorr.s qrinary nitrogenexcreted (rng/kgu " )
The biological values calculated rangedfrom 60.IVo to 94.9% giving a mean of 77.5per cent. This value was then applied to thefactorial method suggested by McDoNALD,EownRos and GRTeNHALGH (1973) usingthe equation of BLexrsR and MrcHr,I-r(1948) as follows:
R = 6 . 2 5 [ l m / B ( M x D + E x W e ) - M x D ]
where R : requirement for DCP (g/day)
B : biological value of feod protein (per cent)
M = MFN (g/kg feed DMI)
D : DMI (ke/day)
E : EUN lgA P'75tg,/aay)
We : Metabolic live weight of the animal (kg).
It was calculated that the mean DCPrequirement for maintenance of Kedah-Kelantan cattle with a mean live weight of321. I kg was l0l .5 g DCP/ day. This is equi-valent to 1.34 g DCP/WU |rkgday.
The mean DCP requirement for main-tenance based on these two values (1.40 and1.14_e DCP/Uf Tstilday) was 1.37 g DCP/wu'/)kgTday .
DISCUSSION
l. Live weight changes
The live weight changes of the cattleduring the trial is worthy of comment. WithTreatment 1, there was a negative live weightchange. The daily live weight gain thenincreased to Treatment 3 and thenprogressively declined, being lowest forTreatment 9. These changes are probablyrelated to dietary N level, since it is knownthat at any given energy intake, an increasedin protein intake above the minimumrequirement will result in a curvilinearresponse or in no further response, and atvery high protein levels relative to energyintake, there may even be a decline in
312
response (A.R.C., 1980). In the balance trialreported, this decline was apparent forTreatnent 5 (l4Vo crude protein) and wasparticularly marked with the ISVa crudeprotein level and beyond. The mean overalldaily live weight gain was 0.50 kg/day.
2. DMI and N utilization
DMI significantly increase (P<0.01) upto Treatment 5 (14%a crude protein). Theincreased in DMI in Treatments2,3,4 and 5from Treatment 1 with 3.91 kg/day, wasabout 30.4Vo to 58.6 per cent. A similarpattern was observed for DMI as percentageof mean body weight. Associated with theDMI was the pattern of N balance. Therewas a significant increase (P<0.01) in Nbalance from Treatment I (6Vo crudeprotein) to other 8 Treatments, suggestingthat the dietary N level in Treatment 1 wasmarginal and may in fact have been limiting.In sheep it is relevant to note thata-|Vo crudeprotein level has been shown to limit intake(Mn-rono and N{nsoN, 1%8).
The various correlation coefficients,with the exception of any correlationbetween FNO and UNO, ADNI and DNCand between NB and DNC, were similar tothe findings of MoneN (1983). The tendencytowards positive N retention in all treatmentssuggests that N was well utilized. However,these cattle had a higher UNO (mean value35.4 glday) compared to 27.4 g/day forswamp buffaloes (DevENona 1983). Also.the mean overall N retention for Kedah-Kelantan cattle was only 31 .47o compared to38.AVo swamp buffaloes. These observationssuggest that swamp buffaloes are moreefficient than Kedah-Kelantan cattle. It hasbeen suggested that the reason for thissuperior ability by the swamp buffaloes wasdue to lower rates of excretion of UNO perunit increase in ADNI (Moneu, 1983). On alow quality roughage, NoRroN, MoRaN andNoI-eN (1979) found buffaloes to have ahigher plasma urea concentration, a similarurinary urea from the kidney tubules,following filteration at the glomerulus.
In support of the tendency towards asuperior N retention in swamp buffaloes is
the finding thatT,ebu cattle had a lower con-centration of bacterial N than buffaloes(MouaN and RecnavaN, 1974; StNcH,I-ANGAR, SIDHU, KOCTnR and Buena,1968; RrooY and RAGHAVAN, 1976), duepossibly to a greater concentration of a totalbacterial count and also more iodophilicorganisms (Oscillospira) type in the rumen ofbuffaloes (PlNr, 1966). Also, WaLLI andMUDGAL (1978) noted from comparativestudies between Murrah buffaloes and Zebucattle using radio isotopes that the rumenmicroorganisms in the former synthesizedmore cystine and methionine. These reportstogether suggest a possible species differencein N utilization and is consistent with theinference by ICF*IPoNANI, G[L, MAKKARand ReNruaN (1977) in a review of nutritionin the river buffaloes in India up to 1977, thatthere u'ere differences between species in thecomposition of rumen microbial population,distribution of N among rumen microbes andundigested feed, rumen ammonia concentra-tions and the composition of microbialprotein.
3. Metabolic faecal N
The mean MFN value was}.220 9/100gDMI (at a mean DMI of.4.77 kg/day). It wasnoted that one of the calculations of MFN bylinear regression analyses was lower (0.203and 0.230 S/100 g DMI) to that derived frommultiple regression analyses (0.227 9/100 gDMI). By comparison, MoRaN (1983) foundthat multiple iegression gave a lower valuecompared to linear regression analyses. TheMFN value determined in the present studyis lower than the value of 0.50 g/100 g DMIreported for Zebu cattle (Pane andMUDGAL, 1975), 0.366 glI00 g DMI forAfrican Zebu cattle (EI-ltor and Topps,1963b), 0.36 9/100 g DMI for Zebu cattle(MonaN, 1983), 0.43 and 0.48 9/100 g DMIin Zebu and British cattle (MonaN andVERcoE, 1972) and 0.496 glI0O g DMI inEuropean dairy cows (PenOuev, DeBAERE and [.oussE,, 1972a).It is also lowerthan the value of 0.341 9/100 g DMI forIndian buffaloes (Gurre, BHAcARVA,RerNe and SlNcs, 1966),0.373 gll00 g DMIfor Murrah buffaloes (Venue and SINGH,
313
1979) and 0.357 9,/100 g DMI for Malaysianswamp buffaloes (DevENone, 1984).
All these values for cattle are lowerthan the figure of 0.50 g/100 g DMI as theMNF often accepted for ruminants (A.R.C.,1965). However, it is apparent that the MFNvalues are smallest for the Zebu cattle,followed by European cattle in the tropicsand finally European cows in temperateenvironments. The real reasons for this arenot clear, but may well be due to a generallylower level of DMI in the tropics where oftenboth quality and quantity of feeds are veryvariable and do affect intake.
4. EndogenousurinaryN
The EUN value calculated in thepresent study was 39.1 mg/kg live weight/daywhich is higher than value of 19.5- 19-6 mglkg live weight/day reported by KrHan,MursnRrpE and SENK (1943) for Harianabullocks, 14-16 mg/kg live weight/dayreported by ELLIOT and Topps (1963a) forSouth African Zebu cattle, 16.2 mg/kg liveweight/day reported by PATLE and MuocaL(1975) for crossbred cattle, 20.6 mg/kg liveweight/day reported by PAReuAy, DEBAERE and Loussr, (I972b). The value isalso higher than the figures of 19.4 mg/kg liveweight/day reported by Gurra et al. (t966)for Indian buffaloes and 25.3 mg/kg liveweight/day for Malaysian swamp buffaloes(DrwNone, 1984). The reasons for thehigher EUN value in the present study arenot clear, but may be associated with the factthat this was determined in diets withincreasing availability of dietary N, whereasabsolute value of EUN are classically deter-mined in studies where treatment diets areadequate in energy but low in protein.
5. True N digestibility
The mean true N digestibilitycalculated from either linear or multipleregression analyses in the present study was89.3 per cent. This value is higher than thevalues of 75.67o reported by Et-r-lor andToPPS (1963a), 81,.4% f.or Zebu cattle and
87.47o-8l.8Vo for buffaloes reported byMoRAN (1983). MonaN (1983) found thatthe value was similar irrespective of themethod of analyses. In the present study, itwas found that the multiple regressionanalysis gave a higher value (92.9Vo) than thelinear regression analysis (85.7 %).
6. Biological value
The mean BV calculated was 77.5per cent. This value is higher than the BV of61.3Vo reported by BRosrER, TucK andBRI-cs (1963) for dairy heifers, but isapproximately similar to the value of 74.8Vofor crossbred Indian cattle reported byPATLE and Muocel (1975). It is lower thanthe mean value of 82.6Vo determined forswamp buffaloes fed the same diets(DEvnNone, lgtr.). The A.R.C. (1965)reviewed a large number of reportedbiological values for cattle and noted con-siderable variation in the results. However, avalue of 70Vc was proposed for cattle.
7. DCP requirements for maintenance
The mean DCP requifement for main-tenance determined in this studv was 1.37 sDCfTqTo'zs kglday.It is of interest to com]pare this value to other reported values in theliterature specific to cattle in the tropics.Table 7 sets out this summary, giving detailsof the breed, location and the values deter-mined. It can be seen that there wls con-siderable variation iq _t_h" reported values(1.10-2.01 g DC{f / )kgday;. The vatueof 1.37 g DCPAVU "kgTday determined inthe present study falls within this range.
The variation in the reported values inrelation to the value determined in thepresent study is worthy of comment. Thereappear to be, as one might expect, differ-ences between indigenous beef cattle,indigenous dairy and imported and crossbredcattle in the tropics, and Table 6 suggests thatthe values increase in this order. The lowestvalues,however,appear to be specific to theMashona and Africander cattle. where it hasbeen suggested that the endogenou's N losses
314
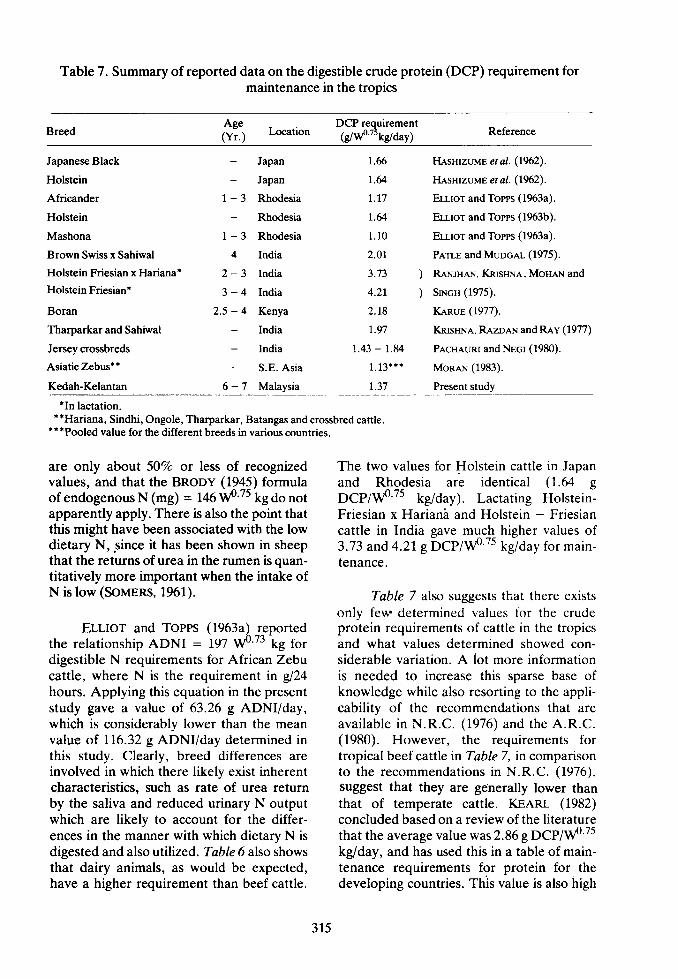
Table 7. Summary of reported data on the digestible crude protein (DCP) requirement formaintenance in the tropics
Age(Yr.) Location
DCP r^equirement(g/W''rkg/day) Reference
Japanese Black
Holstein
Africander
Holstein
Mashona
Brown Swiss x Sahiwal
Holstein Friesian x Hariana*
Holstein Friesian*
Boran
Tharparkar and Sahiwal
Jersey crossbreds
Asiatic Zebus**
Kedah-Kelantan
- Japan
- Japan
1 - 3 Rhodesia
- Rhodesia
I - 3 Rhodesia
4 India
2 - 3 India
3 - 4 India
2.5 - 4 Kenya
- India
- India
- S.E. Asia
6 - 7 Malaysia
Flessrzuue etal. $94).
HesHrzur'{e et al. (1962).
Euror and Toers (1963a).
Ellror and Torrs (1963b).
Ellror and Torns (1963a).
Pans and Muooel (1975).
ReNrrr,nN, KntsnN,c,, Mon,c,N and
SncH (195).
K.r.nun (1977).
KnrsnN,c,, Rezoex and Rev (l9TI)
Pacnnunr and Necr (1980).
MoneN (1983).
Present study
1.6
t .g
1 .17
I ,&
1.10
2.01
5 - l 5
4.21
2.18
t.97
1.43 - t .u
1 . 1 3 r * *
l - J I
'In lactation.*'Hariana, Sindhi, Ongole, Tharparkar, Batangas and crossbred cattle.
*trPooled value for the different breeds in various countries.
are only about 50Vo or less of recognizedvalues, and that the BRODY (1945) formulaof endogenous N (mg) : 146 q7o'7s kg do notapparently apply.There is also the point thatthis might have been associated with the lowdietary N,.since it has been shown in sheepthat the returns of urea in the rumen is quan-titatively more important when the intake ofN is low (Sourns, 1%1).
Elt-lot and ToPPs (1963a) reportedthe relationship ADNI : I97 Uf'73 kg fo.digestible N requirements for African Zebucattle, where N is the requirement in gl24hours. Applying this equation in the presentstudy gave a value of 63.26 g ADNI/day,which is considerably lower than the meanvalue of 116.32 g ADNI/day determined inthis study. Clearly, breed differences areinvolved in which there likely exist inherentcharacteristics, such as rate of urea returnby the saliva and reduced urinary N outputwhich are likely to account for the differ-ences in the manner with which dietary N isdigested and also utilized. Table 6 also showsthat dairy animals, as would be expected,have a higher requirement than beef cattle.
The two values for Holstein cattle in Japanand Rhodesia are identical (1.64 gDCP/!\P 75 kg/day). Lactating Holstein-Friesian x Hariana and Holstein - Friesiancattle in India gave much higher values of3.73 and 4.21gbcpluP 75 tg-/aay for main-tenance.
Table 7 also suggests that there existsonly few determined values for the crudeprotein requirements of cattle in the tropicsand what values determined showed con-siderable variation. A lot more informationis needed to increase this sparse base ofknowledge while also resorting to the appli-cability of the recommendations that areavailable in N.R.C. (1976) and the A.R.C.(1980). However, the requirements fortropical beef cattle in Table Z, in comparisonto the recommendations in N.R.C. (1976),suggest that they are generally lower thanthat of temperate cattle. Ksenl (1982)concluded based on a review of the literaturethat the average value was 2.86 g DCP/'fiP 75
kglday , and has used this in a table of main-tenance requirements for protein for thedeveloping countries. This value is also high
315
and its use is therefore questionable. There isjustification therefore for more knowledge inthis direction in relation to the finding thatthe requirements may in fact be lower(Elllor and Topps, 1963a; HASHIZUME,KASHIO, AMBO, MORIMOTO, MASUBUCHI,Asp, MOnIp, TaNare, HAMADA andTerasH.q,Ht, 1962; MoRRN, 1983; and thepresent study), suggesting the possibility thatthe standards proposed for cattle intemperate situations may not necessarilyapply to the variable circumstances in thetropics.
Another factor that exerts an influenceon nitrogen retention is the amount of avail-able or readily fermentable carbohydrate orfat in the diet. The presence of thesematerials considerably reduce the produc-tion of ammonia in the rumen. The diets usedin the trials reported here had cassava chips,kibbled maize and brown sugar whosepresence would have favoured relativelyhigher N retention. Dietary protein isdegraded in the rumen by fermentation,specifically microbial attack and theammonia that is eventually produced issynthesized to microbial protein. The extentof this synthesis depends on the energy avail-able, emphasizing the importance ofadequate energy rich feeds in the diets.
The calculation of N balance took intoaccount losses only in faeces and urine. Thelosses of N frdm falling hair, skin anddribbling saliva should also have beenconsidered, however these were consideredinsignificant in view of the observations ofBLAXTER (1959) that the losses of N in skinsecretions and shed hair were only 5.0 + 0.05
, r l l / \ , .mg/kg" ' ' lday, which in the present study
amounted to 0.4 g for an animal weighing76.4ynl.7s
The amount of nitrogen required,while it is dependent on the amount ofenergy available, is influenced by the proteinsource used and amount consumed. Thisvalue of dietary non-protein nitrogen (NPN)sources such as urea or biuret dependentirely on degradation to ammonia andsynthesis of the ammonia released to micro-bial protein in the presence of sufficientfermentable carbohydrate. Feed ingredientslike fish meal on the other hand, are moreresistant to microbial attack. Thus, degrad-abil ity is an important aspect, and it is nowwidely recognized that depending on itsextent or escape from degradation, the valueof the protein is an important supplement tomicrobial protein in providing a source ofamino acids for digestion and absorption. Incognisance of these aspects. and to improveon the DCP system init ially advocated(A .R .C . , 1965 ) , t he new app roach (A .R .C . ,1980) takes into account both microbialprotein and undergraded protein. Moreparticularly, this new approach calculates theamount of amino acid N of microbial proteinthat could be retained in the body for t issuesynthesis when the maximum rate of fermen-tation of a particular energy input is studied.
ACKNOWLEDGEMENTS
The author is grateful to Puan SamiyahMohd. Nasi r , Cik Khat i jah Ihrahim. CikJamal iah Yun, Encik Nor Ar is Al ias andEncik Amir Enibon for technical assistance.and Encik Ahmad Shokri and EncikAminuddin Zainal Abidin for the statisticalanalysis.
SUMMARY
Nitrogen (N) ut i l izat ion and the requirement for maintenance was studied in adul t Kedah-Kelantan cattle, six to seven years of age with a mean live weight of 321 kilogrammes. Nine diets were fedconsecutively to nine bulls in which dietary energy was held constant and 64? ,8.,/c ,10c/r. ,72./c ,74c/r ,16,i ,18% ,20qc and22Vc dietary crude protein (CP) levels were included. A six per cent crude protein level wasbarely adequate to promote dry matter intake (DMI); increasing higher dietary crude protein levelsincreased DMI by between 30ci and 59cZ s igni f icant ly (P<0.01). Associated wi th the increasing dietarycrude protein levels and higher DMI, were stat is t ical ly s igni f icant increased N balance (P<0.01). Thepositive nitrogen balances were,however,lower than that in similar studies in swamp buffaloes due to alower urinary nitrogen output (UNO) in the latter. The true N digestibility was 89.3% while the mean
316
biological value (BV) was 77.5 per cent. Correlation matrices between nitrogen intake (NI), faecalnitrogen output (FNO), urinary nitrogen output (UNO), apparently digestible N (ADNI), N balance(NB) and dietary N content (DNC) indicated that statistically significant correlations (P<0.01) onlyexisted between all variables excepting FNO and UNO, ADNI and DNC and between NB and DNC; thehighest correlation was r = 0.95 between NI and ADNL The endogenous urinary N (EUN) was 39.1mg/kg live weight/day and the metabolic faecal nitrogen (MFN) was 0.220 glln g DMI. The digestiblecrude protein (DCP) requirement for maintenance calculated from the relationship between NB andADNI as well as by the iactorial method gave a mean value of 1.37 g DCP/Vf ttkg/d"y, this value isdiscussed in relation to other published reports in the tropics.
REFERENCES
A.O.A.C. (1980). Official methods ofanalyses. 13th Edn. Association ofofficial agricultural chemists,Washington D.C., U.S.A., xx + L0L8pp.
A.R.C. (1965). The Nutrient Requirement ofFarm Livestock. No. 2 Ruminants.Technical review and summaries,London, H.M.S.O.
A.R.C. (1980). The nutrient requirements ofruminants livestock. Comm. Agric.Bur., Farnham Royal, England, xvi +351 pp.
BLAXTER, K.L. (1959). In ScientificPrinciples of Feeding Livestock,London: Farmer and Stock BreederPublications Ltd.
BLAXTER, K.L. and MITCHELL, H.H.(1948). The factorization of the proteinrequirements of ruminants and of theprotein values of feeds, with particularreference to the significance of themetabolic faecal nitrosen. ,/. Anim.$ci .7,351.-72.
Blexrsn, K.L. and WrLsoN, R.S. (1963).The assessment of crop husbandrYtechniques in terms of animal produc-tion. Anim. Prod. 5,27-42.
BRoDY, S. (1945). Bioenergetics andGrowth, New York: ReinholdPublishing Corp.
BRosren, W.H., TUCK, V.J. and Balcu,C.C. (1963). Experiments on thenutrition of the dairy heifer. 4. Proteinrequirements of 2 year old heifers. ,/.agric. Sci. Camb. 60,393- 8.
CeupITNc, R.C., FRETR, M. and BALCH,C.C. (1962). Factors affecting thevoluntary intake of food by cows. III.The effect of urea on the voluntaryintake of oat straw. Bril. J. Nutr. 16,1.15-24,
CggN, C.P., Arn, S.S. and EVANS, T.R.(1981). Beef production from threenitrogen fertilized grasses in PeninsularMalaysia. MARDI Res. Bull. 9,207 -24.
DEVENDRA, C. (1980). The energy require-ments for maintenance of stall-fedKedah-Kelantan cattle in Malaysia.MARDI Res. Bull. 8.267-79..
DeveNoRq., C. (1983). Nitrogen utilizationand the requirements for maintenanceof Malaysian swamp buffaloes.MARDI Res. Bull, 12,248-58.
DEVENDRA, C. and LEE KOK CHOO, T.(1975a). Studies on Kedah-Kelantancattle. 1. The effect of improvednutrition on growth. .MARDI Res.Bul l . 3,68-86.
DEVENDRA, C. and LEE KoK C:iOO, T.(1975b). Studies on Kedah-Kelantancattle. II. The effect of feedingincreasing levels of tapioca (Manihotutilissima Pohl) on growth. MARDIRes. Bull, 4.80-9.
DEVENDRA, C. ANd I-EE KOK CHOO, T.(1975c). Studies on Kedah-Kelantancattle. tII. Body composition andcarcass characteristics. MARDI Res.Bul l . 4.81-90.
317
DnveNnRa, C. and WaN Znueru M.(1977). The body composition andcarcass characteristics of
'Kedah-
Kelantan cattle at different ages fromrural areas. Malays. agric. J. 51,85- 106.
ELLIor, R.C. and Topps, J.H. (1963a).Studies of protein requirement ofruminants. I. Nitrogen balance trial ontwo breeds of African cattle given dietsadequate in energy and low in protein.Brit. L Nutr. 17,539-47.
ELLIor, R.C. and Topps, J.H. (1963b).Nitrogen metabolism of African cattlefed diets with an adequate energy, low-protein content. Nature, Lond. 197,ffi8-70.
ELLrOr, R.C. and Topps, J.H. (1964).Studies of protein requirements ofruminants. 3. Nitrogen balance trialson Blackhead Persian sheep given dietsof different energy and proteincontent. Bril. L Nutr. 18.245-52.
GugTe, B.S., BHAcARVA, V,N., RaINR,N.M. and SINcs, S.N. (1966). Studieson endogenous and metabolic faecalnitrogen in buffaloes. Indian J. Vet.Sci . 36,90-5.
HASHIZUME, T., KESTTIO, Y., AMBO, S.,MoRIMoTo, I{., MASUBUCHI, T.,ABE, M., MoRIE. S., TnNnx,c. K.,HAueoe, T. and TnxasHeHl, S.(1962). Metabolism of matter andenergy in cattle. 3. On the maintenancerequirement of energy and protein forJapanese Black breed and Holsteinbreed cows in Japan. Bull. natn. Inst.agric. Sci. Japan 21,213-21.
HUTAGALUNG, R.I. and MAHYUDDIN,M.D. (1983). Intensive feeding systemsfor Kedah-Kelantan cattle. Proc. VIlthAnn. Con. Malays. Soc. Anim. Prod.p, 128-32.
ICHHPONANI, J.S., G[L, R.S., MAKKAR,G.S. and ReNrsaN, S.K. (1977). Workdone on buffalo nutrition in India - areview. Indian J. Dairy Sci. 30,r73-91.
KRRUE, C.N. (1977). The protein andenergy requirements of the EastAfrican Boran cattle. E. Afr. agric.For. J. 42.322-7.
KEARL, L.C. (1982). Nutrient requirementsof ruminants in developing countries.Int. Feedsnffs Institute, Logan, Utah,U . S . A . , 3 8 1 p p .
KEHAR, M.D., MUKHERJEE, R. and SENK,K.C. (1943). Studies on protein meta-bolism. I. Investigations uponendogenous nitrogen metabolism ofcattle. IndianVet. Sci. 13,257 -62.
KRISHNA, G., REZONN, M.N. ANd REY,
S.N. (1977). Studies on energy andprotein requirements for Zebu cows(Bos indicus). Zeits. Tierphys. Tier.Futterm. 38,302-14.
[.EE KoK Csoo, T. (1977\. Effects of fivedietary protein levels on Kedah-Kelantan heifers during pregnancy andlactation. M. Sc. Thesis, Univ. Malaya.
MCDONALD, P., EDWARDS, R.A. ANdGREBNHaT-cg, J.F.D. (1973\. AnimalNutrition 2nd ed. London: Oliver andBoyd.
MrrcHELL, H.H. (1924). A method ofdetermining the biological value ofprotein. J. Biol. Chem. 58,873-903.
MTLFoRD, R. and MrNsON, D.J. (1968). Thedigestibility and intake of six varietiesof Rhodes grass (Chloris gayana).Aust. J. exp. Agric. Anim. Husb. 8,4r3- 8.
MOHAN, K.D.V.G. and RECHEVAN, G.V.(1974). Effect of di6tary protein levelon the ruminal nitrogen fractions incattle and buffaloes. Indian J. Anim.Sci. 44,510-9.
318
MoRAN, J.B. (1983). Aspects of nitrogenutilization in Asiatic water buffalo andZebucattle.l. agric. Sci. Camb. 100,73-23.
MoRAN, J.B. and VERCOE, I.A. (1972).Some factors affecting apParentnitrogen digestibilities of roughage dietfed to cattle. J. agric. Sci. Camb. 78,173-7 .
NORTON. 8.W.. MORAN, J.B. ANd NOLAN,J.V. (1979). Nitrogen metabolism inBrahman cross, Buffalo, Banteng andShorthorn steers fed on low qualityroughage. Aust. J. agric. Res. 30,34r-51.
N.R.C. (1,976). Nutrient requirements ofdomestic animals. No. 4 Nutrientrequirements of Beef cattle,National Academy of Sciences,Washington, D.C., U.S.A., 56 pp.
PACHAURI. V.C. and NEGI, S.S. (1980).Influence of energy intake on therequirement of digestible crude proteinfor maintenance in cattle. Indian J.Anim. Sci. 50,548-52.
PeNr, H.C. (1966). A note on the concen-tration of Oscillospira guillermondiitype organism in the rumen ingestaof buffalo and Zebu cattle. IndianVet. J. 43,Ill-3.
PARQUAY, R., DE BOERE, R. and[,USSE, A.(1972a). Statistical research ondigestibility in the cow. II. Nitrogenand ether extract. I. agric. Scl.C a m b . 7 8 , I 4 l - 5 .
PARQUAY, R., DE BAERE, R. ANdI-OUSSE, A.(1972b). Influence of diet and bodycondition on nitrogen utilization inthe cow. J. agric. Sci. Camb. 79,323-9.
PATLE, B.R. and MUDGAL, V.D. (1975).Protein requirements for main-tenance of crossbred cattle. IndianJ. Dairy Sci. 28,93-8.
RANJHAN, S.K., KRISHNA, MOHAN, D.V.G.and Swcu, R. (1975). Energy andprotein requirement of Holstein-
Accepted for publication on 27th April, 1984
319
Friesian and Holstein-Friesian xHariana crosses for maintenanceand milk producticn. Indian J. Anim.i c i . 4 5 , 7 1 7 - 2 2 .
Rsopv, T.J. and RAGHAVAN, G.V. (1976).Effect of level of intake and time ofsampling on the ruminal nitrogenfractions in cattle and buffaloes.IndianJ. Anim. Sci. 53, 106-13.
RoBrNSoN, D.W. andSrEwRRr, G.A. (1968).Protein digestibility in sheep andcattle in north western Australia.Aust. J. exp. Agric. Anim. Husb. 8,123-9.
SINcg, S., T-NNCAN, P.N., SIDHU, G.S.,KocseR, A.S. and BsArIA, I.S. (1968).Study of rumen biochemical activityin the buffalo (Bos bubalis) andZebu cattle (Bos indicu.s) under non-urea and urea feeding regimes.Indianl. Vet. Sci. 38,674-81.
SNppecoR, G.W. (1965). Statbticalmethods, 5th ed., Iowa: Iowa StatePress, Ames.
SoMERS, M. (1961). Factors influencingthe secretion of nitrogen in sheePsaliva. 3. Factors affecting thenitrogen fractions in the Parotidsaliva of sheep with sPecialreference to the influence ofammonia production in the rumenand fluctuations in the level of bloodurea. Aust. J. exp. Biol. med. Sci. 39,133-44.
VERMA, D.M. and SINcn, U.B. (1979).Studies on the metabolic faecalnitrogen excretion in buffalo calvesfed on different level of crudeprotein in the diet. Indian J. Anim.Sc i . 49 ,1015-8 .
WALLI, T.K. and MUDGAL, V.D. (1978).Effect of N:S ratio on the incorpora-tion of S into thd thioamino acids ofthe microbial protein in an in vitrorumen system. J. Nuclear Agric.biol . 7,46-50.