Embed Size (px)
Citation preview
UNIVERSIDAD DE CHILE
FACULTAD DE CIENCIAS FÍSICAS Y MATEMÁTICAS
DEPARTAMENTO DE GEOLOGÍA
NUEVO PROCEDIMIENTO PARA ANALIZAR CRYSTAL SIZE DISTRIBUTIONS
Y CÁLCULO DE T Y PH2O EN SISTEMAS MAGMÁTICOS A TRAVÉS DE UN
MODELO ACOPLADO DE PARÁMETROS CINÉTICOS DE CRISTALIZACIÓN
CON LA COMPOSICIÓN DE PLAGIOCLASA. APLICACIONES EN EL VOLCÁN
VILLARRICA (CHILE) Y EN EL VOLCÁN LASSEN PEAK (EEUU)
TESIS PARA OPTAR AL GRADO DE MAGÍSTER
EN CIENCIAS, MENCIÓN GEOLOGÍA
MEMORIA PARA OPTAR AL TÍTULO DE GEÓLOGO
CLAUDIO IGNACIO CONTRERAS HIDALGO
PROFESOR GUÍA:
MIGUEL ÁNGEL PARADA REYES
MIEMBROS DE LA COMISIÓN:
ÁNGELO CASTRUCCIO ÁLVAREZ
FRANCISCO GUTIÉRREZ FERRER
Este trabajo ha sido financiado por CONICYT, proyecto Nº 22130368, Becas para estudio de Magíster en Chile, año académico 2013 y por el Centro de Excelencia en Geotermia de Los Andes
(CEGA), proyecto FONDAP Nº 15090013.
SANTIAGO DE CHILE
2015
i
RESUMEN DE LA MEMORIA PARA OPTAR AL TÍTULO DE: Geólogo y grado de Magíster de Magíster en Ciencias, Mención en Geología POR: Claudio Ignacio Contreras Hidalgo FECHA: PROFESOR GUÍA: Miguel Ángel Parada Reyes
NUEVO PROCEDIMIENTO PARA ANALIZAR CRYSTAL SIZE DISTRIBUTIONS Y CÁLCULO
DE T Y PH2O EN SISTEMAS MAGMÁTICOS A TRAVÉS DE UN MODELO ACOPLADO DE
PARÁMETROS CINÉTICOS DE CRISTALIZACIÓN CON LA COMPOSICIÓN DE
PLAGIOCLASA. APLICACIONES EN EL VOLCÁN VILLARRICA (CHILE) Y EN EL VOLCÁN
LASSEN PEAK (EEUU)
El presente trabajo presenta un nuevo método para desarrollar Crystal Size Distributions (CSD), un tipo de
análisis textural cuantitativo que compara la densidad de población de cristales respecto a su tamaño. Basado en la
modelación de la curva de distribución acumulada del tamaño de cristales a través de una función error, se obtienen
CSD los que permiten calcular tasas de crecimiento y nucleación de distribución gaussiana asimétrica con respecto al
tiempo. Este procedimiento fue aplicado en una muestra de la erupción de 1971 del volcán Villarrica entregando el
tamaño límite que distingue microlitos de fenocristales y mostrando un fuerte incremento de las tasas de crecimientos
y nucleación de cristales en 2 y 8 órdenes de magnitud, respectivamente, producto del ascenso de magma y
cristalización en superficie. Este procedimiento también fue aplicado en cuarzo-monzodioritas del Plutón La Gloria,
entregando una distribución sigmoidal de la fracción volumétrica de cristales con respecto al tiempo la que puede ser
dividida en 3 etapas diferentes: una primera que muestra un muy bajo incrementos de la fracción volumétrica, la cual
coincide con el pico de la tasa de crecimiento, una segunda que muestra un alto incremento de la fracción volumétrica,
la cual coincide con el pico de la tasa de nucleación y una tercera que muestra una segunda disminución debido al bajo
volumen disponible para nuclear nuevos cristales y recrecer antiguos.
A pesar de los aportes que genera este nuevo método, el CSD seguiría siendo insuficiente para identificar
distintos procesos magmáticos tales como ascenso de magma respecto a cristalización en superficie o mezcla de
magmas, calentamientos o sistemas multireservorios. Es por esto que se acoplan los parámetros cinéticos de
cristalización calculados a partir de CSD con la composición de plagioclasas ya que ambos dependen tanto de la
temperatura como de la presión de agua. El modelo de acoplamiento es aplicado a la erupción de 1915 del Volcán
Lassen Peak. Se registran dos procesos de calentamiento previo a la erupción, el segundo producto de mezcla de
magmas dacíticos y andesíticos. Se registran condiciones estables del reservorio dacítico a presión de agua de 200
MPa, 830 ºC generando plagioclasas de contenido de anortita alrededor de 0.37 con lo que se infiere una cota mínima
de profundidad del reservorio de 7 km. Posterior al calentamiento se registra una etapa de devolatilización a una
temperatura estable de 940 ºC y el ascenso de magma el cual ocurriría en 18 horas.
ii
Dedicatoria
Este trabajo está dedicado a mi familia, quienes me han acompañado con su
energía y paciencia.
A Florencia y Antonia por su alegre presencia y por todo el tiempo que no les
dediqué.
A Gabriel y Esteban por distraerme cuando era necesario.
A mis padres, Jeannette, Mario, Ximena y Leonel, quienes construyeron
enérgicamente mis estructuras psíquicas, morales, emocionales y sociales: todo
raciocinio, forma, adorno, perífrasis y arte en este documento llevan sus créditos.
Particularmente, a este último, quien, dolorosamente, no podrá vivir la última etapa de
este proceso siendo quien con más orgullo lo hubiera presenciado…

iii
Agradecimientos
A CONICYT, proyecto Nº 22130368, Becas para estudio de Magíster en Chile año
académico 2013, al Centro de Excelencia en Geotermia de Los Andes (CEGA), proyecto
FONDAP Nº 15090013 y a la Universidad de Chile a través del programa “ayudas para
estadías cortas de investigación” por el financiamiento de esta tesis donde se incluyeron
salidas a terrenos, participación en congresos internacionales y análisis de microsonda
electrónica en Argentina y Reino Unido.
Al profesor Miguel Ángel Parada Reyes, profesor guía de esta tesis, por su
constante apoyo personal y académico. A los profesores Angelo y Francisco, por su activa
participación en este trabajo.
Al compañero Eduardo Morgado Bravo con quien vivimos este proceso en
conjunto, discutiendo sobre petrología y volcanología, analizando asuntos de la tesis de
alguno de los dos, conversando de política, sociedad o fútbol. También a los compañeros
Juan Norambuena, Rayén Gho, María Angélica Contreras, Gabriela Pedreros, Alejandra
Salas, Exequiel Varela, Francisco Cáceres, Consuelo Martínez, Paulo Quezada, Paula
Araya, Mauricio Valenzuela y Fernanda Álvarez por su directa o indirecta colaboración
en este trabajo.

iv
Tabla de contenido
Capítulo 1: Introducción ...................................................................................................... 1
Fundamentación del problema ......................................................................................... 1
Objetivos ........................................................................................................................... 4
Hipótesis ........................................................................................................................... 5
Metodología ...................................................................................................................... 5
Captura de imágenes ..................................................................................................... 5
Procesamiento de imágenes .......................................................................................... 6
Softwares para cálculo de CSDs con método convencional .......................................... 6
Análisis de microsonda electrónica ............................................................................... 7
Análisis de geoquímica de roca total ............................................................................. 8
Capítulo 2: State of the art ................................................................................................... 9
Numerical basis of the Open System model ..................................................................... 9
Stereology ......................................................................................................................... 11
Other models for CSD calculation .................................................................................. 16
Crystal kinetic rates as functions of thermodynamic parameters ................................. 19
Plagioclase composition from a kinetics focus .............................................................. 20
Crystal Size Distributions applied on volcanoes ............................................................ 22
Capítulo 3: Kinetic parameters and duration of melt crystallization from a new CSD
approach ............................................................................................................................. 23
Abstract ........................................................................................................................... 23
Introduction .................................................................................................................... 24
Calculation of kinetic parameters from the new CSD procedure .................................. 25
Error Analysis ................................................................................................................. 29
Discussion ...................................................................................................................... 30
Stereology ................................................................................................................... 30
The partition of N ........................................................................................................ 33
Applications ................................................................................................................. 36
Conclusion ....................................................................................................................... 44

v
Capítulo 4: Solving magmatic T – PH2O conditions through plagioclase CSDs and
anorthite content ................................................................................................................ 47
Abstract ........................................................................................................................... 47
Introduction ................................................................................................................... 48
Numerical basis .............................................................................................................. 49
Crystal kinetic parameters .......................................................................................... 49
Introducing thermodynamic and plagioclase composition parameters .................... 51
Application: The 1915 Lassen Peak Volcano eruption ................................................... 52
Plagioclase CSD and composition results ................................................................... 52
Temperature and water pressure results .................................................................... 59
Interpretation .............................................................................................................. 61
Discussion ....................................................................................................................... 64
The use of plagioclase composition ............................................................................. 64
Calibration of thermodynamic constants ................................................................... 65
Analytical errors .......................................................................................................... 65
Conclusion ....................................................................................................................... 66
Capítulo 5: Resumen y conclusiones ................................................................................. 67
Bibliografía ......................................................................................................................... 71
vi
Índice de Tablas
Table 4. 1: Fourth-degree polynomial regressions of the logarithm of population
densities as functions of the cristal length for black dacite, light dacite and andesitic
inclusión sample. ................................................................................................................ 55
Table 4. 2: Fifth-degree polynomial regressions of the final anorthite content profile as a
function of the crystal length. ............................................................................................ 59
vii
Índice de Ilustraciones
Figure 2. 1: A conventional example of a Crystal Size Distribution (CSD).. ..................... 12
Figure 2. 2: Summary of crystal shapes formed in a hydrous magma as a function of
crystallization time and undercooling. .............................................................................. 14
Figure 2. 3: Crystal aspect ratio of k-felspars and quartz from the Late Paleozoic Halle
Volcanic Complex. .............................................................................................................. 15
Figure 2. 4: Modeled CSD based on the Match System model (Marsh, 1998). ................ 16
Figure 2. 5: Parameterization of the crystal size axis in the inversion model. .................. 18
Figure 2. 6: Normalized growth and nucleation rates with respect to temperature-
liquidus temperature ratio. ............................................................................................... 20
Figure 2. 7: Logarithm of crystal growth rate as a function of temperature for An100-
Ab0, An75-Ab25, An50-Ab50 and An20-Ab80 solutions. ................................................ 21
Figure 3. 1: Flow chart to calculate a population density such as the calculated crystal
volumen fraction were equal to measured crystal área fraction. ......................................28
Figure 3. 2: 3D measured aspect ratios of Quartz and K-feldspar from the Late Paleozoic
Halle Volcanic Complex (Mock and Jerram, 2005; Jerram and Higgins, 2007) plotted in
a Zingg diagram (Zingg, 1935). .......................................................................................... 32
Figure 3. 3: CSDs of the 1971 Villarrica Volcano lava flow sample using 4, 7 and 10 bins
per decade. .......................................................................................................................... 34
Figure 3. 4: Crystallization duration histograms for the complete crystallization process
and for the syn-eruptive stage of the 1971 Villarrica Volcano lava flow using 4, 7 and 10
bins per decade. .................................................................................................................. 35

viii
Figure 3. 5: Calculated G based on CSD of the 1971 Villarrica Volcano lava flow using 4, 7
and 10 bins per decade. ...................................................................................................... 36
Figure 3. 6: Calculated CSD of the 1971 Villarrica Volcano lava flow sample and of the La
Gloria Pluton sample based on the modeled cumulative distribution curves.. ................38
Figure 3. 7: φ as a function of time for the Villarrica Volcano sample and for the La
Gloria Pluton sample. ......................................................................................................... 39
Figure 3. 8: G and J as functions of the time for the Villarrica Volcano sample and the La
Gloria Pluton sample. ........................................................................................................ 40
Figure 3. 9: BSEM image of the 1971 Villarrica Volcano sample. ..................................... 41
Figure 3. 10: Comparison between crystallization rates and the CSD of the 1971 Villarrica
Volcano sample and comparison between normalized crystallization rates and
plagioclase volume fraction of the La Gloria Pluton sample. ............................................ 44
Figure 4. 1: Tectonic setting of major volcanic centers of the Cascadia subduction zone
including the Lassen Peak Volcano. ................................................................................... 53
Figure 4. 2: The four kind of 1915 Lassen Peak eruption products. .................................. 54
Figure 4. 3: CSDs of the three kind of samples of the 1915 Lassen Peak Volcano. ........... 56
Figure 4. 4: The plagioclase crystal volume fraction for the black dacite, the light dacite
and the andesitic inclusion as functions of time. .............................................................. 57
Figure 4. 5: The built anorthite content profile from Salisbury et al.’s database (2008). 58
Figure 4. 6: Water pressure [MPa], Temperature [ºC] and anorthite content as functions
of the plagioclase crystal length. ........................................................................................ 62
Figure 4. 7: A summary of the inferred magmatic stages for the 1915 Lassen Peak
eruption. defined. ............................................................................................................... 63

1
Capítulo 1
Introducción
Fundamentación del problema
Los procesos magmáticos pueden estudiarse mediante análisis de geoquímica de
roca total (e.g., Ernst et al., 1988; Murphy et al., 2000), análisis de geoquímica mineral
(e.g., Bouvet de Maisonneuve et al., 2012; Bouvet de Maisonneuve et al., 2013),
termodinámica numérica (e.g., Lohmar et al., 2012; Ustunisik et al., 2014) o análisis
textural cuantitativo (e.g., Shea et al., 2010; Spillar and Dolejs, 2015), entre otros.
El análisis textural cuantitativo puede determinar procesos magmáticos a través
de distintos parámetros texturales tales como densidad (e.g., Riker et al., 2009),
volumen (e.g., Zieg and Marsh, 2002), morfología (e.g., Moitra et al., 2013) y tamaño
(e.g., Marsh, 1998 y referencias dentro de este) tanto de cristales como de vesículas.
Basado en el tamaño de los cristales se realiza el método más común de análisis textural
cuantitativo: Crystal Size Distribution (CSD). El CSD compara el número de cristales de
cierto tamaño que existen en una unidad volumétrica (densidad de población de
cristales) con su respectivo tamaño.
Matemáticamente, el CSD es calculado a partir de una ecuación de continuidad
suponiendo un sistema abierto, cristalización en equilibrio e independencia del tamaño
inicial entregando una curva recta de pendiente negativa en un diagrama semi-log
(Marsh, 1988). Basado en el valor de la pendiente del CSD se puede obtener la tasa de
crecimiento y la duración de la cristalización y basado en la intersección con el eje Y se
puede obtener la tasa de nucleación de cristales (Marsh, 1988). Empíricamente, el
tamaño de los cristales es calculado a partir de imágenes en 2D convirtiendo los valores
de densidad (Wager, 1961) y tamaño (Saltikov, 1967; Higgins, 2000) a cristales en 3D. La
conversión de densidad y tamaño se hace basado en una única razón de aspecto
arbitraria o calculada (Morgan y Jerram, 2006). Este supuesto es erróneo ya que supone
un undercooling constante (Lofgren, 1974; Pupier et al., 2008; Shea and Hammer, 2013)
y las rocas ígneas presentan una alta dispersión de razones de aspecto (Mock and
2
Jerram, 2005; Jerram and Higgins, 2007). Una vez transformados los cristales a figuras
en 3D, se calcula la curva de distribución acumulada de cristales. La derivada de la
distribución acumulada de cristales respecto del largo de los cristales es la densidad de
población de cristales (Marsh, 1988). Convencionalmente, la curva de distribución
acumulada de cristales es dividida en segmentos usando una distribución logarítmica
(Higgins, 2002a). Cada segmento es modelado como una línea recta. En consecuencia,
cada intervalo es representado por un punto en un diagrama CSD. Convencionalmente,
este gráfico discontinuo es interpolado para forzar la obtención de líneas rectas con
pendientes negativas, y así, calcular tasas de crecimiento y nucleación de cristales
constantes. Este trabajo pretende entregar una alternativa a la conversión estereológica
de cristales y al tratamiento matemático para la obtención de tasas de crecimiento y
nucleación de cristales modelando la curva de distribución acumulada de cristales como
una función continua y derivable.
Las tasas de crecimiento y nucleación de cristales han sido modeladas en diversos
modelos. El modelo de sistema abierto entrega una tasa de crecimiento constante y una
tasa de nucleación constantes (Marsh, 1988). El modelo de “Batch System”, el cual
supone un sistema cerrado, supone una tasa de crecimiento constante y una tasa de
nucleación de distribución exponencial creciente respecto del tiempo (Marsh, 1998).
Finalmente, el modelo de inversión de CSD calcula una tasa de crecimiento de
distribución exponencial decreciente y una tasa de nucleación de distribución
exponencial creciente respecto del tiempo basado en una curva de distribución sigmoidal
de la fracción volumétrica de cristales respecto del tiempo (Spillar and Dolejs, 2013).
Ninguno de estos tres modelos presenta una distribución gaussiana asimétrica de las
tasas de crecimiento y nucleación de cristales respecto del tiempo o del undercooling
(Spohn et al, 1988; Hort and Spohn, 1991; Hort, 1997; Couch et al., 2003). Este trabajo
pretende calcular las tasas de crecimiento y nucleación de cristales en función del tiempo
con una distribución gaussiana asimétrica y un peak de la tasa de nucleación posterior al
peak de la tasa de crecimiento basado en el modelamiento de la curva de distribución
acumulada de cristales como una función continua y derivable.
Este nuevo procedimiento para analizar CSD es aplicado en una muestra de lava
de la erupción de 1971 del Volcán Villarrica y en una muestra de cuarzomonzodiorita del
Plutón La Gloria debido al buen registro histórico y geológico de la erupción y al impacto
3
social y turístico de este complejo volcánico y al registro textural y geocronológico del
segundo.
Las tasas de crecimiento y nucleación de cristales y la fracción volumétrica de
cristales son función del undercooling o de la tasa de enfriamiento (e.g., Marsh, 1988;
Spohn et al., 1988; Maaloe et al., 1989; Cashman, 1993). Paralelamente, la composición
de los minerales es función de parámetros termodinámicos tales como la presión, la
fugacidad de oxígeno, la presión de agua y la temperatura (e.g., Bowen, 1913; Yoder and
Tilley, 1962; Smith, 1972; Tsuchiyama and Takahashi, 1983; Ghiorso and Sack, 1995;
Holland and Powell, 2003; Cashman and Blundy, 2013). Esta transitividad hace
inherente una relación entre los parámetros cinéticos de cristales con su composición.
Sin embargo, estudios que determinan esta relación lo hacen mediante coeficientes de
difusión o partición (Allegre et al., 1981; Lasaga, 1982; L’Heureux, 1993; L’Heureux and
Fowler, 1996; Gorokhova and Melnik, 2010) y no basados en análisis de CSD. Este
trabajo pretende crear una relación entre la tasa de crecimiento de cristales medida a
partir de CSD y la composición de plagioclasa.
Desde un enfoque semicuantitativo, el CSD permite determinar más de una etapa
magmática basado en la presencia de kinks donde cada segmento sería representativo de
una etapa diferente. Convencionalmente, estos se infieren en rocas extrusivas como
etapas pre- y syn-eruptivas (e.g., Armienti et al., 1994; Pappalardo y Mastrolorenzo,
2010). Sin embargo, no es posible distinguir procesos mecánicos durante la etapa pre-
eruptiva tales como acumulación-fraccionamiento (Higgins, 2002b), coarsening
(Jerram et al., 1996), mezcla de magmas (Higgins, 1996), sistemas multi-reservorios
(Armienti et al., 1994; Marsh, 1998) y zonación de reservorios (Zieg and Marsh, 2002); y
no es posible distinguir entre ascenso magmático y cristalización en superficie durante la
etapa syn-eruptiva. Este trabajo pretende mejorar la capacidad del CSD para determinar
etapas magmáticas a través del seguimiento correlativo de la fracción volumétrica de
cristales en función del tamaño y del tiempo y la composición de elementos mayores de
plagioclasa.
El modelo presentado es aplicado en la erupción de 1915 del Volcán Lassen Peak
(California, Estados Unidos) debido a que fue producida por la mezcla incompleta de
magmas dacíticos y andesíticos, y se cuenta con el registro textural cuantitativo y
composicional de los distintos miembros. Se utilizan los CSDs de plagioclasa calculados

4
por Salisbury et al., (2008) en 3 de las 4 muestras presentadas, cambiando la regresión
lineal en 3 tramos que los autores realizan por regresiones polinómicas de cuarto orden.
Las tasas de crecimiento, nucleación y fracción volumétrica de plagioclasas en función
del tamaño y del tiempo son calculadas a partir de CSD. Se utiliza la base de datos de
composición de núcleos de plagioclasa y de perfiles de plagioclasa presentada por los
autores para generar un perfil composicional en función del tamaño de cristal
acoplándolo a la fracción volumétrica de plagioclasa calculada en función del tiempo, y
así, determinando escenarios magmáticos con una resolución mayor que solo
considerando el análisis de CSD.
Objetivos
1. Desarrollar un método para calcular CSD, tal que G, J y φ obtenidos presenten
resultados en función del tiempo similares a los calculados como función de la
energía de activación (ΔG).
1.1. Desarrollar un método independiente de la razón de aspecto de los cristales
basado en la distribución acumulada de cristales (N) y que trate esta última como
una curva continua.
1.2. Generar una regresión con N tal que n resulte en una curva de pendiente
variable que derive en la obtención de un G y J con forma de campana en función
del tiempo.
1.3. Comprobar la aplicabilidad del modelo tanto en sistemas volcánicos como
en sistemas intrusivos usando una muestra de la erupción de 1971 del Volcán
Villarrica y otra de cuarzomonzodioritas pertenecientes al Plutón La Gloria.
1.4. Calcular CSD, G, J y φ de plagioclasa para ambos casos.
1.5. Determinar escenarios de cristalización para ambos casos según inflexiones
en los CSDs o en los parámetros cinéticos calculados.
2. Desarrollar un modelo para la determinación de parámetros termodinámicos a
través del acoplamiento de tasas cinéticas de plagioclasa calculadas a partir de
CSD con su composición.
5
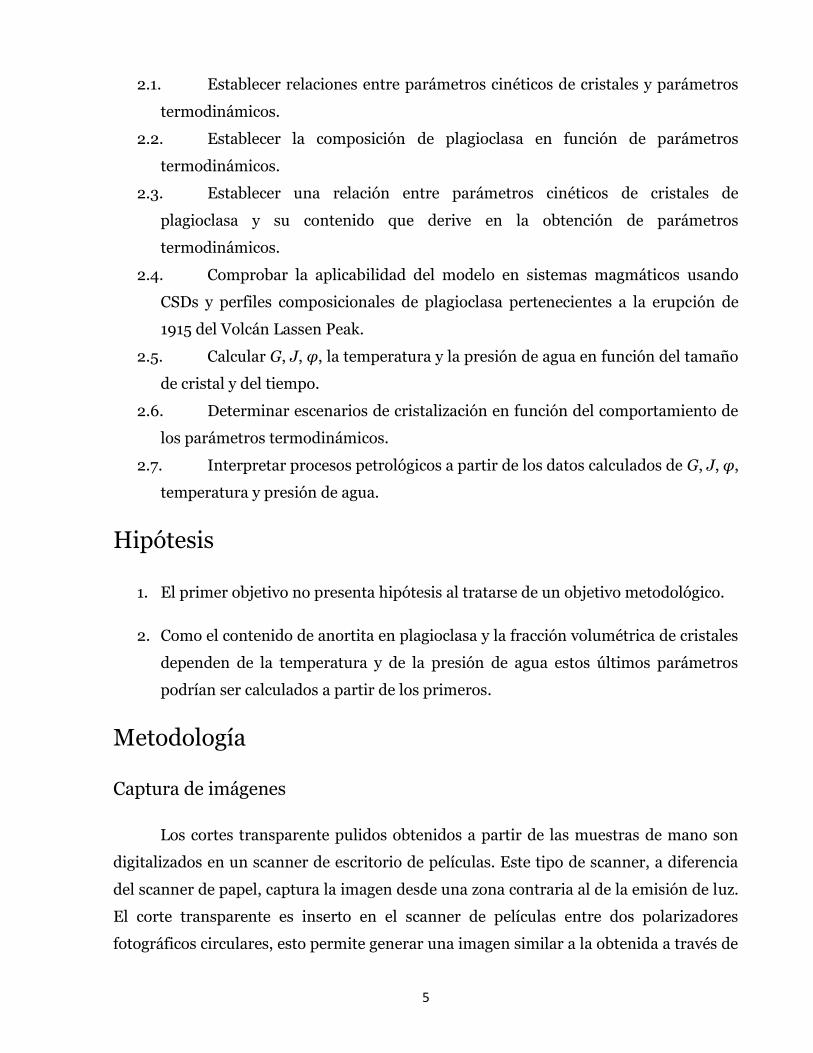
2.1. Establecer relaciones entre parámetros cinéticos de cristales y parámetros
termodinámicos.
2.2. Establecer la composición de plagioclasa en función de parámetros
termodinámicos.
2.3. Establecer una relación entre parámetros cinéticos de cristales de
plagioclasa y su contenido que derive en la obtención de parámetros
termodinámicos.
2.4. Comprobar la aplicabilidad del modelo en sistemas magmáticos usando
CSDs y perfiles composicionales de plagioclasa pertenecientes a la erupción de
1915 del Volcán Lassen Peak.
2.5. Calcular G, J, φ, la temperatura y la presión de agua en función del tamaño
de cristal y del tiempo.
2.6. Determinar escenarios de cristalización en función del comportamiento de
los parámetros termodinámicos.
2.7. Interpretar procesos petrológicos a partir de los datos calculados de G, J, φ,
temperatura y presión de agua.
Hipótesis
1. El primer objetivo no presenta hipótesis al tratarse de un objetivo metodológico.
2. Como el contenido de anortita en plagioclasa y la fracción volumétrica de cristales
dependen de la temperatura y de la presión de agua estos últimos parámetros
podrían ser calculados a partir de los primeros.
Metodología
Captura de imágenes
Los cortes transparente pulidos obtenidos a partir de las muestras de mano son
digitalizados en un scanner de escritorio de películas. Este tipo de scanner, a diferencia
del scanner de papel, captura la imagen desde una zona contraria al de la emisión de luz.
El corte transparente es inserto en el scanner de películas entre dos polarizadores
fotográficos circulares, esto permite generar una imagen similar a la obtenida a través de
6
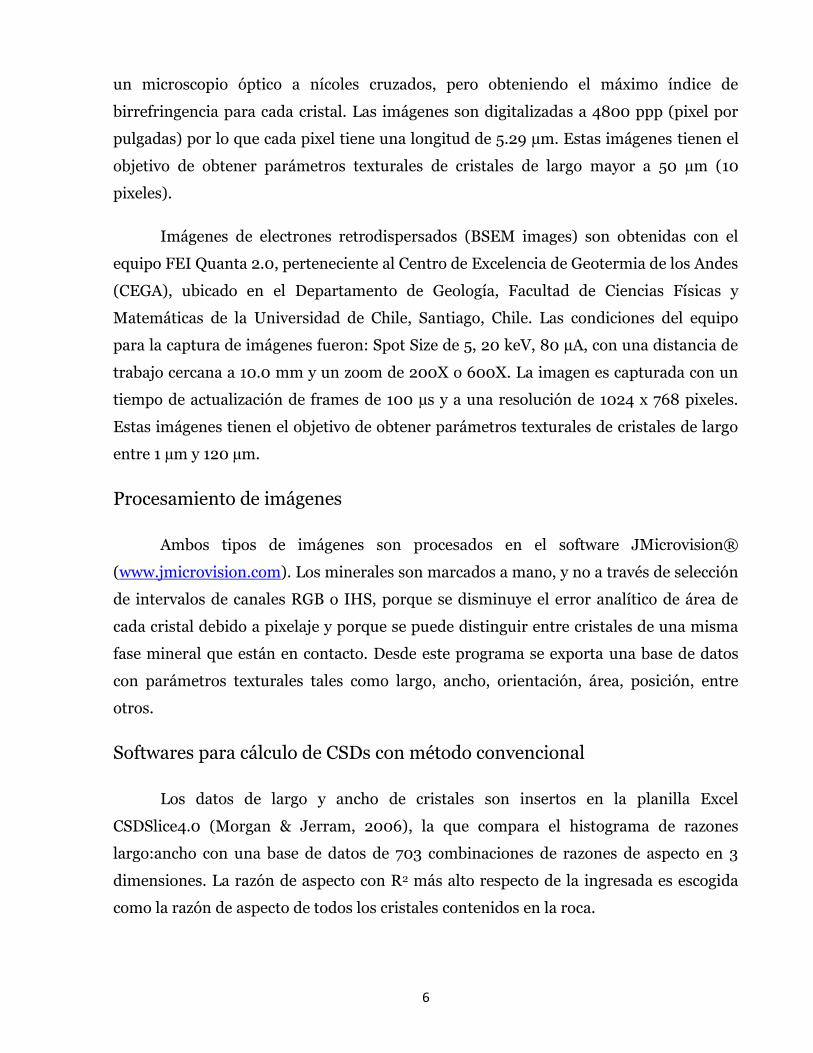
un microscopio óptico a nícoles cruzados, pero obteniendo el máximo índice de
birrefringencia para cada cristal. Las imágenes son digitalizadas a 4800 ppp (pixel por
pulgadas) por lo que cada pixel tiene una longitud de 5.29 µm. Estas imágenes tienen el
objetivo de obtener parámetros texturales de cristales de largo mayor a 50 µm (10
pixeles).
Imágenes de electrones retrodispersados (BSEM images) son obtenidas con el
equipo FEI Quanta 2.0, perteneciente al Centro de Excelencia de Geotermia de los Andes
(CEGA), ubicado en el Departamento de Geología, Facultad de Ciencias Físicas y
Matemáticas de la Universidad de Chile, Santiago, Chile. Las condiciones del equipo
para la captura de imágenes fueron: Spot Size de 5, 20 keV, 80 µA, con una distancia de
trabajo cercana a 10.0 mm y un zoom de 200X o 600X. La imagen es capturada con un
tiempo de actualización de frames de 100 µs y a una resolución de 1024 x 768 pixeles.
Estas imágenes tienen el objetivo de obtener parámetros texturales de cristales de largo
entre 1 µm y 120 µm.
Procesamiento de imágenes
Ambos tipos de imágenes son procesados en el software JMicrovision®
(www.jmicrovision.com). Los minerales son marcados a mano, y no a través de selección
de intervalos de canales RGB o IHS, porque se disminuye el error analítico de área de
cada cristal debido a pixelaje y porque se puede distinguir entre cristales de una misma
fase mineral que están en contacto. Desde este programa se exporta una base de datos
con parámetros texturales tales como largo, ancho, orientación, área, posición, entre
otros.
Softwares para cálculo de CSDs con método convencional
Los datos de largo y ancho de cristales son insertos en la planilla Excel
CSDSlice4.0 (Morgan & Jerram, 2006), la que compara el histograma de razones
largo:ancho con una base de datos de 703 combinaciones de razones de aspecto en 3
dimensiones. La razón de aspecto con R2 más alto respecto de la ingresada es escogida
como la razón de aspecto de todos los cristales contenidos en la roca.
7
Para generar CSDs según el método convencional se utiliza el software
CSDCorrections1.5 (http://www.uqac.ca/mhiggins/csdcorrections.html) (Higgins,
2000). En este software es necesario ingresar el largo, ancho, orientación, área y
posición de todos los cristales; el área total de la imagen sin considerar el área de
vesículas y bordes de imagen; la medida del eje mayor de elipse, que es el output que
entrega el software JMicrovision; la razón de aspecto calculada con el software CSDSlice,
un índice de redondeamiento y un índice de orientación calculado por el mismo
CSDCorrections.
Análisis de microsonda electrónica
Perfiles de plagioclasas y olivinos, pares de olivinos – piroxenos para
geotermobarometría y puntos para caracterización de óxidos de Cr-Fe-Ti fueron hechos
con una microsonda JEOL JXA 8230 ubicada en el Laboratorio de Microscopía
Electrónica y Análisis por Rayos X (LAMARX), Facultad de Matemática, Astronomía y
Física de la Universidad Nacional de Córdoba, Córdoba, Argentina. En plagioclasas se
midió Na, Mg, Al, Ca, K, Fe y Si a 20 µA y 15 keV con un tiempo de análisis de 10 s y 5 s
en background, el Sr se obtuvo a 20 µA y 15 keV con un tiempo de análisis de 20 s y 10 s
en background; fenocristales fueron medidos con un spot size de 10 µm y microlitos con
un sport size de 2 µm y a 10 keV para evitar fuga de Na, Sr y K. En olivinos se midió Al,
Mg, Ca, Ni, Si y Fe a 20 µA y 15 keV con un tiempo de análisis de 10 s y 5 s en
background con un spot size de 10 µm. En piroxenos y en óxidos de Cr-Fe-Ti se midió
Al, Mg, Ca, Ni, Si, Fe, Ti, Mn y Cr a 20 µA y 15 keV con un tiempo de análisis de 10 s y 5 s
en background con un spot size de 10 µm para fenocristales y 2 µm para microcristales.
Perfiles de plagioclasas y olivinos y pares núcleo-borde en ambos minerales
fueron hechos con una microsonda JEOL JXA 8200 ubicada en los Laboratorios
Analíticos de la Camborne School of Mines (CSM), College of Engineering, Mathematics
and Physical Sciences (CEMPS), University of Exeter, Tremough Campus, Cornwall,
United Kingdom. En plagioclasas se midió Si, Na, K, Al, Ca, Mg y Ti a 10 µA y 10 keV con
un tiempo de análisis de 20 s y 10 s en background y un spot size de 5 µm, Fe y Sr se
midió a 10 µA y 10 keV con un tiempo de análisis de 30 s y 15 s en background y un spot
size de 5 µm. Na y K fueron medidos primeros en sus respectivos espectrómetros para
evitar sesgo de análisis por fuga de estos elementos. En olivinos se midió Si y Mg con un
8
tiempo de análisis de 20 s y 10 s en background; Fe, Ca, Al, Ti, Cr y Mn con un tiempo de
análisis de 30 s y 15 s en background y Ni con un tiempo de análisis de 40 s y 20 s en
background; todos los elementos fueron medidos a 10 µA y 10 keV y un spot size de 5
µm.
Análisis de geoquímica de roca total
Elementos mayores, trazas y tierras raras fueron analizados en el Laboratorio
ActLabs
(http://www.actlabs.com/page.aspx?menu=40&app=220&cat1=669&tp=2&lk=no).
Elementos mayores fueron medidos con un ICP correspondiente al paquete 4Litho, el
hierro bivalente (FeO) fue medido directamente mediante titración al 19%, elementos
traza y de tierras raras fueron medidos con un ICP-MS correspondiente al paquete 8-
REE.
9
Capítulo 2
State of the art
Numerical basis of the Open System model
From the first work applied in industrial chemistry (Randolph and Larson, 1971),
Marsh and Cashman made the first studies of CSD applied to geological processes,
focusing firstly on the theory (Marsh, 1988) and secondly applied to lava lake
solidification (Cashman and Marsh, 1988). Based on the former work, the number and
the growth rate of crystals are related to changes in time, crystal size and volume of the
system through a simple continuity equation for crystal phases (Marsh, 1988)
𝑑(𝑉𝑛)
𝑑𝑡+𝑑(𝐺𝑉𝑛)
𝑑𝐿+ 𝑄𝑛 = 0
(2. 1)
Where V is the volume of the system, n is the number of crystals, G is the crystal
growth rate, t is time, L is the crystal length and Q is the flow. An open system of
constant volume is considered; that means the volume does not depend of time or size,
but considers inputs and outputs of magma. Considering τ as the ratio between the
volume and the influx, the continuity equation is expressed as (Marsh, 1988).
𝑑𝑛
𝑑𝑡+𝑑(𝐺𝑛)
𝑑𝐿+𝑛
𝜏= 0 (2. 2)
The open system model assumes the crystal growth rate independent of the
crystal size (e.g, Kirkpatrick et al., 1979; Muncill and Lasaga, 1987; Marsh, 1998), despite
some authors consider a size-dependent crystal growth treatment (e.g, Eberl et al., 1998;
Eberl et al., 2002). Moreover, a steady state system is considered that implies the crystal
number does not depend on time (Marsh, 1988).
𝑑𝑛
𝑑𝐿+
𝑛
𝐺𝜏= 0 (2. 3)
A general solution for the equation 2.3 is the CSD expression
10
𝑛(𝐿) = 𝑛0 exp(−𝑆𝐿) (2. 4)
Where n(L) is the population density defined as the number of crystals per unit
volume and per size interval. Based on the equation 2.4, the population density as a
function of crystals is a straight line in a log-normal diagram. In this kind of diagram,
the intercept (n0) is defined as the nucleation density and S is the slope of the curve
(Figure 2.1).
The integration of the product between the population density expression and a
power of crystal length is defined as moments of CSD. The zero and first moment define
the total number of crystals (NT) and the total length of crystals (LT) respectively as
𝑁𝑇 = ∫ 𝑛(𝐿)𝑑𝐿 =𝑛0𝑆
∞
0
(2. 5)
𝐿𝑇 = ∫ 𝐿 × 𝑛(𝐿)𝑑𝐿 =𝑛0𝑆2
∞
0
(2. 6)
The ratio between LT and NT defines the mean crystal length (Lm), as known as the
characteristic length. Because of kinetics, Lm can be defined as the product between the
characteristic crystal growth rate (Gc) and the characteristic time (tc) (Figure 2.1)
𝐿𝑇𝑁𝑇
=1
𝑆= 𝐿𝑀 = 𝐺𝑐 × 𝑡𝑐 (2. 7)
The characteristic crystal nucleation rate (Jc) is defined as the ratio between the
number of crystals and time. Introducing length by chain rule, Jc is expressed as (Marsh,
1988) (Figure 2.1)
𝐽𝑐 =𝜕𝑛
𝜕𝑡=𝜕𝑛
𝜕𝐿×𝜕𝐿
𝜕𝑡= 𝑛0 × 𝐺𝑐 (2. 8)
The crystal volume fraction (φ) can be defined by the third moment of CSD
(Marsh, 1988)
11
𝜑 = 𝜎∫ 𝐿3 × 𝑛(𝐿)𝑑𝐿 =
∞
0
6𝜎𝑛
𝑆4 (2. 9)
Where σ is a shape factor. Based on equation 2.9, a discrete form is expressed to
define φ (Higgins, 2002a)
𝜑 = 𝜎∑𝑛(𝐿𝑖) × 𝐿𝑖3 ×𝑊𝑖 (2. 10)
Where Wi is the width of the interval i.
Stereology
To apply the numerical basis of CSD in igneous rocks it is necessary to count and
to measure crystals inside them. Typically, crystals are measured in thin sections, a
section of a rock, slabs or outcrops. All these cases give 2D images; hence, textural
parameters such as length, width, orientation, etc, correspond to crystal sections and not
to complete crystals. The responsible discipline of converting 2D crystal data in 3D
crystal data is Stereology. In quantitative textural analysis for igneous rocks, the first
work that gives an expression to convert 2D in 3D data is in Wager (1961)
𝑛𝑉(𝐿𝑋𝑌) = 𝑛𝐴(𝑙𝑋𝑌)1.5 (2. 11)
Where nA is the measured areal crystal population density, lXY is the measured
crystal length between lengths of X and Y, nV is the calculated volumetric crystal
population density and LXY is the calculated large axis of crystals between lengths of X
and Y. The Wager’s expression modifies the measured crystal population density, but not
crystal lengths. Other expressions that only modify the crystal population density are
found in Underwood (1970) (equation 2.12) and Royet (1991) (equation 2.13)
𝑛𝑉(𝐿𝑋𝑌) =𝑛𝐴(𝑙𝑋𝑌)
1.5
𝜑 (2. 12)
𝑛𝑉(𝐿𝑋𝑌) =𝑛𝐴(𝑙𝑋𝑌)
Ħ𝑋𝑌 (2. 13)
12
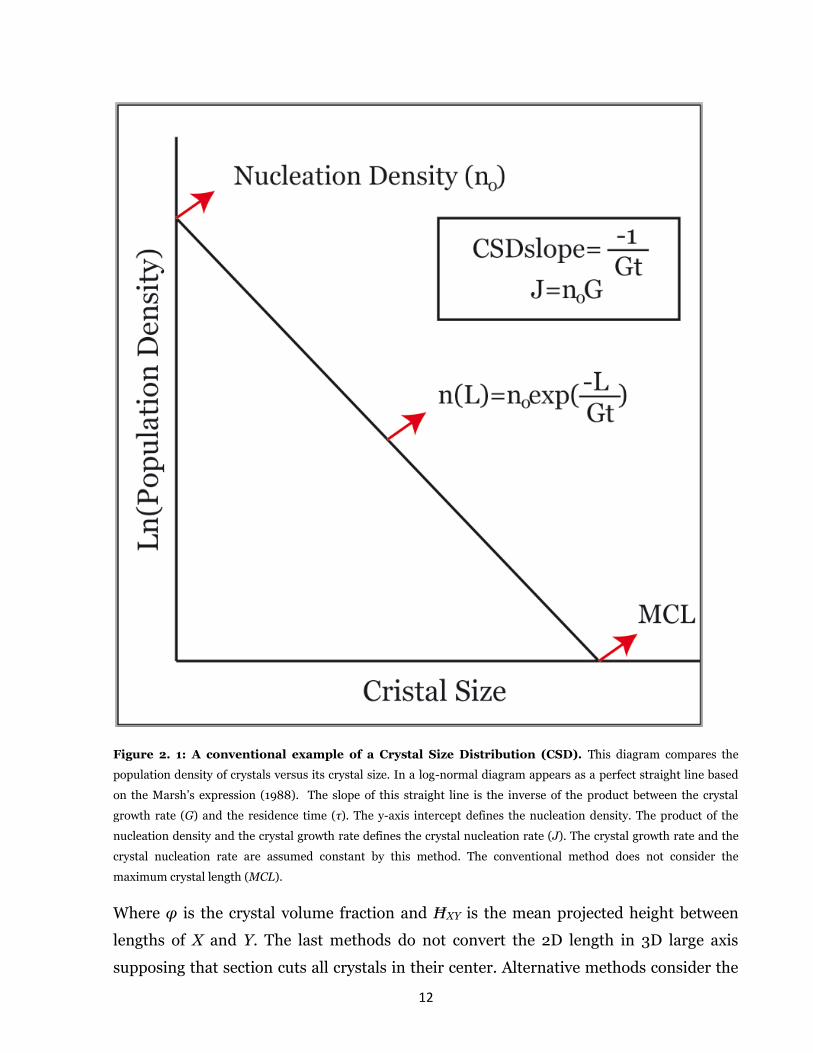
Figure 2. 1: A conventional example of a Crystal Size Distribution (CSD). This diagram compares the
population density of crystals versus its crystal size. In a log-normal diagram appears as a perfect straight line based
on the Marsh’s expression (1988). The slope of this straight line is the inverse of the product between the crystal
growth rate (G) and the residence time (τ). The y-axis intercept defines the nucleation density. The product of the
nucleation density and the crystal growth rate defines the crystal nucleation rate (J). The crystal growth rate and the
crystal nucleation rate are assumed constant by this method. The conventional method does not consider the
maximum crystal length (MCL).
Where φ is the crystal volume fraction and ĦXY is the mean projected height between
lengths of X and Y. The last methods do not convert the 2D length in 3D large axis
supposing that section cuts all crystals in their center. Alternative methods consider the
13
cut-section effect measuring the probability of a crystal of being represented in a size
interval of lower size due to cuts in crystal corners (Saltikov, 1967; Sahagian and
Proussevitch, 1998; Higgins, 2000). These methods suppose a unique and known crystal
aspect ratio (size) for all crystals inside a rock and the use of a logarithmical
segmentation of the crystal size axis. The expression that defines the calculated
volumetric crystal population density in these methods is
𝑛𝑉(𝐿𝑖) =𝑛𝐴(𝑙𝑖) − ∑ 𝑛𝑉(𝐿𝑗)𝑃𝑗𝑖Ħ𝑗
𝑖−1𝑗=1
𝑃𝑖𝑖Ħ𝑖 (2. 14)
Where i є [1…N] refers to the crystal size interval (considering the size interval 1
representing the maximum size) and Pji is the probability that a crystal with a true size in
interval j will have an intersection that falls in the interval i. Note that these methods use
the 3D crystal large axis and not the 2D measured crystal length. The Saltikov’s method
and the Higgins’s method only vary in two aspects: the different conception of the
maximum size interval and the calculation of Ħ.
The crystal aspect ratio can be assumed, directly measured or calculated. To calculate it,
Higgins (2000) shows that in parallelepipeds the ratio between length (l) and width (w)
of 2D images is very similar to the ratio between the small and intermediate axis. The
large axis is calculated from the skewness of the the w/l distributions. A complete w/l
distribution database is presented by Morgan and Jerram (2006) to compare measured
crystal lengths and widths with the database to obtain the crystal aspect ratio.
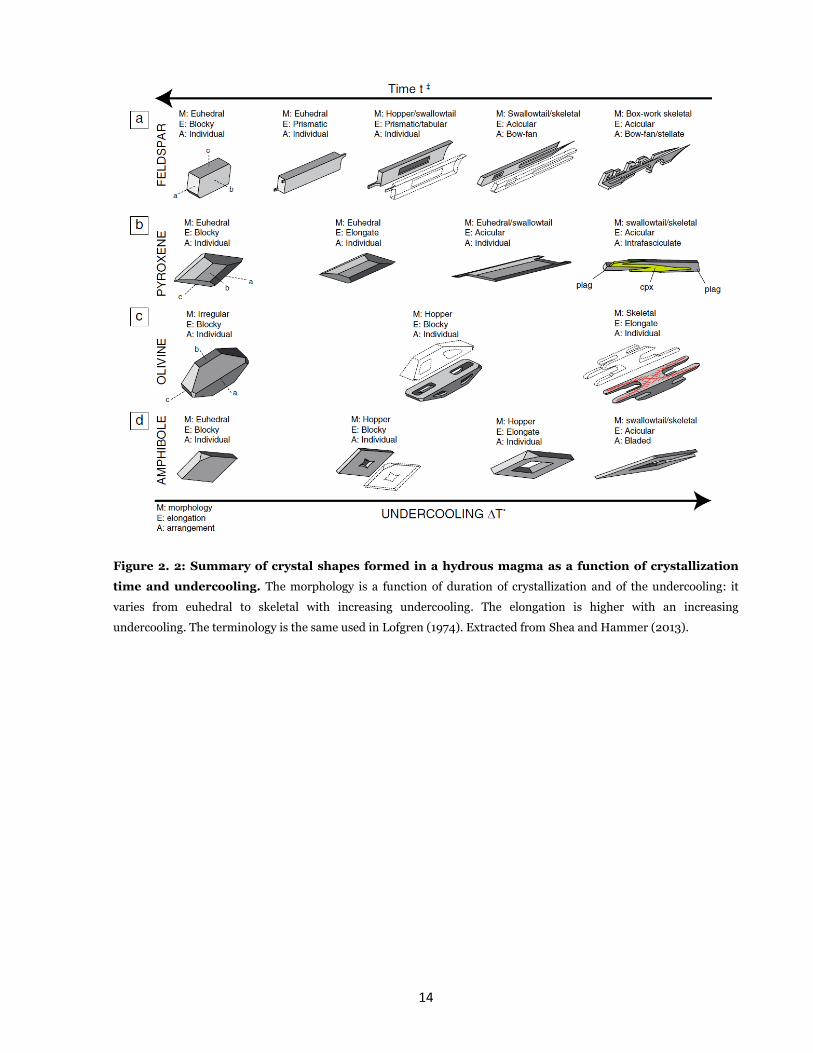
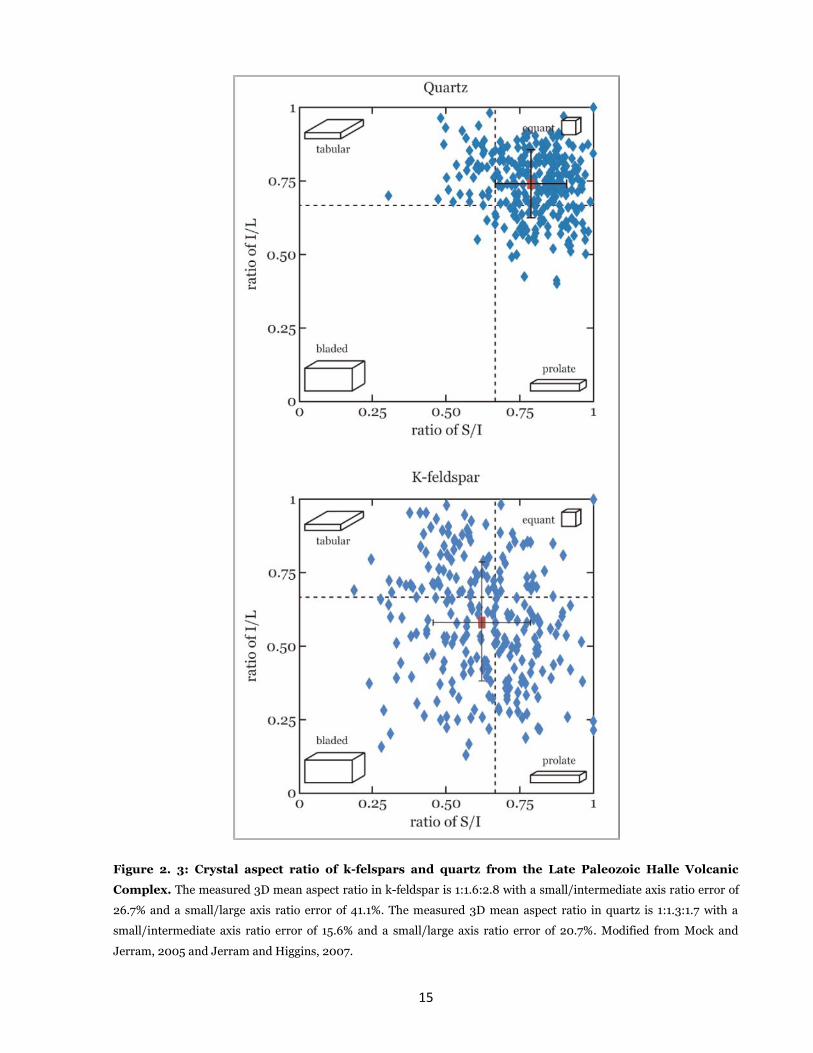
The use of a unique crystal aspect ratio for a whole igneous rock is naturally
controversial. The crystal aspect ratio is a function of the undercooling (the difference
between the liquidus temperature and the crystallization temperature) (Lofgren, 1974),
as well as the kind of crystallization (homogeneous or heterogeneous) is a function of the
undercooling rate (Shea and Hammer, 2013) (Figure 2.2); hence, to assume a unique
crystal aspect ratio is to assume the same crystallization temperature history for all
crystals. Moreover, direct measurements of crystal aspect ratio through X-ray
tomography on feldspars and quartz in natural systems show a strong scattering of the
crystal aspect ratios (Mock and Jerram, 2005; Jerram and Higgins, 2007) (Figure 2.3).
14
Figure 2. 2: Summary of crystal shapes formed in a hydrous magma as a function of crystallization
time and undercooling. The morphology is a function of duration of crystallization and of the undercooling: it
varies from euhedral to skeletal with increasing undercooling. The elongation is higher with an increasing
undercooling. The terminology is the same used in Lofgren (1974). Extracted from Shea and Hammer (2013).
15
Figure 2. 3: Crystal aspect ratio of k-felspars and quartz from the Late Paleozoic Halle Volcanic
Complex. The measured 3D mean aspect ratio in k-feldspar is 1:1.6:2.8 with a small/intermediate axis ratio error of
26.7% and a small/large axis ratio error of 41.1%. The measured 3D mean aspect ratio in quartz is 1:1.3:1.7 with a
small/intermediate axis ratio error of 15.6% and a small/large axis ratio error of 20.7%. Modified from Mock and
Jerram, 2005 and Jerram and Higgins, 2007.

16
Other models for CSD calculation
There are some alternatives of the Open System model to analyze CSDs. For
example, considering the crystal growth rate dependent on the initial crystal size (e.g.,
Marsh, 1988; Eberl et al., 1998; Eberl et al., 2002), but this option had not a great
impact. The batch system model proposes a time-dependent exponential nucleation and
a constant growth of crystals (Marsh, 1998). The resulted CSD is a concave curve with a
maximum population density close to the intercept. With a crystal volume fraction lower
than 0.5, CSDs modeled by the batch system model are very similar to modeled by the
open system model (Figure 2.4). This model does not use the measured maximum
crystal length.
Figure 2. 4: Modeled CSD based on the Match System model (Marsh, 1998). The x-axis is the crystal size
normalized by the maximum crystal length for a crystal volume fraction of 1 and the y-axis is the crystal population
density normalized by the population density of the maximum crystal length. CSDs are concave curves with a peak
close to smallest sizes. The crystal population density increases with an increasing crystallinity. For a crystallinity
lower than 50%, CSDs are very similar to CSDs obtained from the Open System model. Extracted from Marsh (1998).
17
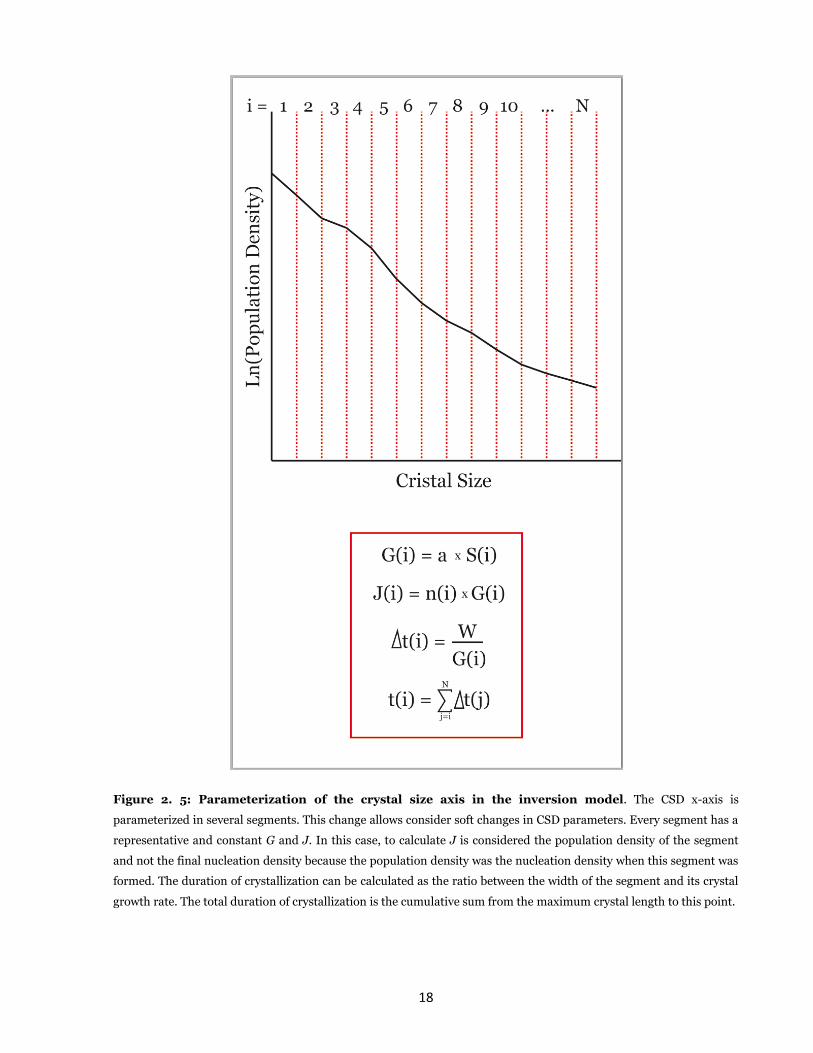
In the current decade, models of inversion of the CSD have been presented (e.g.,
Melnik et al., 2011; Spillar and Dolejs, 2013). These models are based on the Open
System model, but considering the maximum crystal length in spite of the characteristic
length. The inversion model calculates kinetic parameters as functions of the time, which
advances leftward in the CSD diagram. To consider variations into the CSD slope and the
crystal population density, the inversion model parameterizes the crystal size axis in
several small segments (Figure 2.4). Inputs to calculate kinetic parameters based on this
model are the CSD and crystal volume fraction function. This parameter can be modeled
using a sigmoidal expression
𝜑(𝑡) = 1 − exp(−𝑎𝜋𝑡4) (2. 15)
Where a is a positive constant. The equation 2.15 is consistent with the
conventional crystal volume fraction expression as a function of time, crystal growth rate
(G) and crystal nucleation rate (J) (Avrami, 1939; Avrami, 1940; Kirkpatrick, 1976).
𝜑(𝑡) = 1 − exp{−𝜎∫ 𝐽(𝜏) [∫ 𝐺(𝜏′)𝜕𝜏′𝑡
𝜏
]
3𝑡
0
𝜕𝜏} (2. 16)
Because of the discretization of the crystal size axis, Spillar and Dolejs (2013)
redefine the equation 2.16 in a sum-discrete expression
𝜑𝑖−1 = 1 − exp(𝜎
4∑
𝐽𝑗
𝐺𝑗{[∑𝐺𝑘(𝑡𝑘−1 − 𝑡𝑘)
𝑗−1
𝑘=𝑖
]
4𝑁
𝑗=𝑖
− [∑𝐺𝑘(𝑡𝑘−1 − 𝑡𝑘) + 𝐺𝑗(𝑡𝑗−1 − 𝑡𝑗)
𝑗−1
𝑘=𝑖
]
4
})
(2. 17)
Based on the sigmoidal crystal volume fraction function, the calculated G and J
are decreasing and increasing exponential function according to the time respectively.
18
Figure 2. 5: Parameterization of the crystal size axis in the inversion model. The CSD x-axis is
parameterized in several segments. This change allows consider soft changes in CSD parameters. Every segment has a
representative and constant G and J. In this case, to calculate J is considered the population density of the segment
and not the final nucleation density because the population density was the nucleation density when this segment was
formed. The duration of crystallization can be calculated as the ratio between the width of the segment and its crystal
growth rate. The total duration of crystallization is the cumulative sum from the maximum crystal length to this point.
19
Crystal kinetic rates as functions of thermodynamic
parameters
A lot of works have been focused on the crystal kinetic rate – thermodynamic
parameter relationships regardless of the use of quantitative textural analysis. From a
more theoretical focus, the crystal nucleation rate (J) is expressed as a function of the
temperature (T), the activation energy for the formation of a stable nucleus (ΔGc) and
the activation energy for the diffusion (ΔGt)
𝐽(𝑇) = 𝐽0 × exp (−∆𝐺𝑐 + ∆𝐺𝑡
𝑅𝑇) (2. 18)
Where J0 is a constant and R is the universal gas constant. From the same
perspective, the crystal growth rate (G) is expressed as a function of the temperature (T),
the activation energy for the diffusion (ΔGt), the liquidus temperature (Tl) and the
difference in free enthalpy between the melt and the crystalline phase (ΔHv)
𝐺(𝑇) = 𝐺0 × [1 − exp (∆𝐻𝑣(𝑇𝑙 − 𝑇)
𝑅𝑇𝑇𝑙)] × exp (−
∆𝐺𝑡𝑅𝑇
) (2. 19)
Where G0 is a constant. After of some algebraic operations, as the crystal
nucleation rate as the crystal growth rate are expressed as functions of T and Tl (to check
previous steps and the final expression, see Spohn et al., 1988). Both crystal kinetic rates
have bell-shaped curves with respect to undercooling. The crystal growth rate peak
occurs with lower undercooling than the crystal nucleation rate peak (e.g., Spohn et al.,
1988; Hort and Spohn, 1991; Hort, 1997) (Figure 2.6). Subsequent experimental works
with mafic magmas have obtained similar results in different phases for simple-step and
multiple-step experiments (Couch et al., 2003; Shea and Hammer, 2013).
Other perspective expresses both kinetic rates as a function of a power of
undercooling (e.g., Marsh, 1988; Maaloe et al., 1989) or of a power of cooling rate
(Cashman, 1993; Higgins, 2006).
The crystal volume fraction (φ) has also been expressed as a function of
thermodynamic parameters. From a thermal continuity equation, φ is related with latent
heat of crystallization obtaining sigmoidal curves with regard to the time (Kirkpatrick,
20
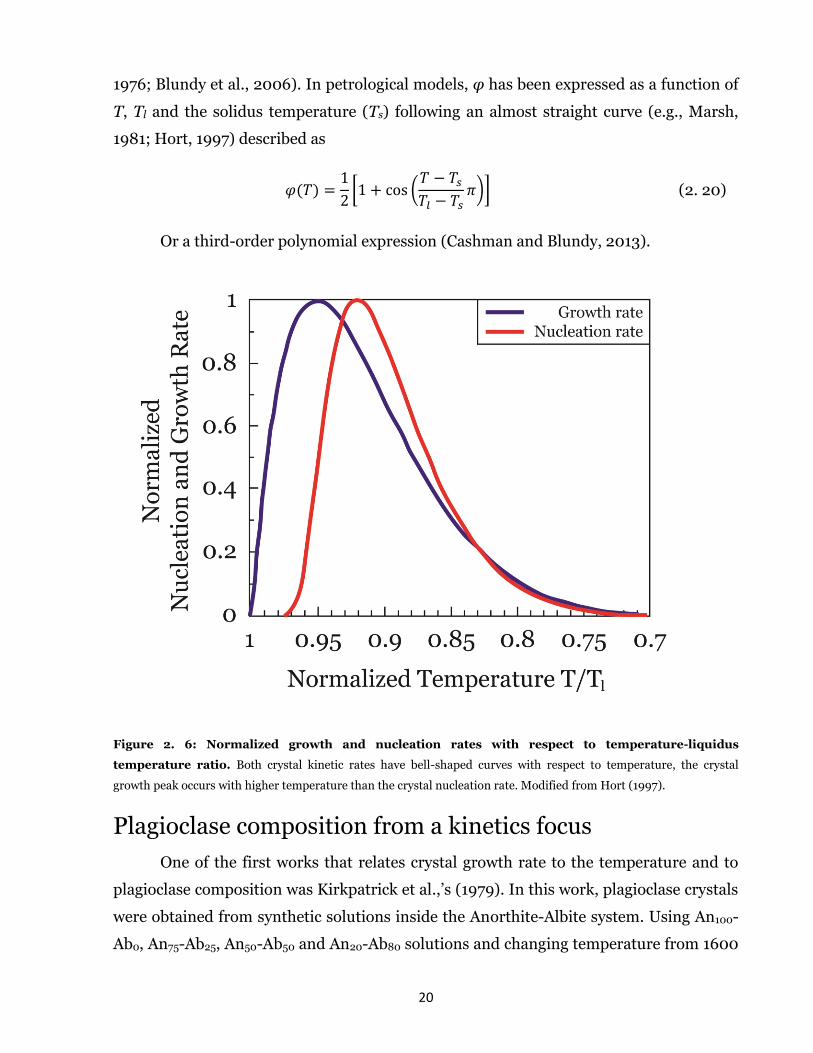
1976; Blundy et al., 2006). In petrological models, φ has been expressed as a function of
T, Tl and the solidus temperature (Ts) following an almost straight curve (e.g., Marsh,
1981; Hort, 1997) described as
𝜑(𝑇) =1
2[1 + cos (
𝑇 − 𝑇𝑠𝑇𝑙 − 𝑇𝑠
𝜋)] (2. 20)
Or a third-order polynomial expression (Cashman and Blundy, 2013).
Figure 2. 6: Normalized growth and nucleation rates with respect to temperature-liquidus
temperature ratio. Both crystal kinetic rates have bell-shaped curves with respect to temperature, the crystal
growth peak occurs with higher temperature than the crystal nucleation rate. Modified from Hort (1997).
Plagioclase composition from a kinetics focus
One of the first works that relates crystal growth rate to the temperature and to
plagioclase composition was Kirkpatrick et al.,’s (1979). In this work, plagioclase crystals
were obtained from synthetic solutions inside the Anorthite-Albite system. Using An100-
Ab0, An75-Ab25, An50-Ab50 and An20-Ab80 solutions and changing temperature from 1600

21
to 900 ºC, crystal growth rates were obtained (Figure 2.7). These results were
numerically modeled based on, among other parameters, diffusion and partition
coefficients (Lasaga, 1982). Calculated crystal growth rate are not comparable with
measured empirically rates because of the use of a single-phase system. Other studies
use diffusion coefficients assuming a linear relationship between the temperature and
the duration of crystallization or between the temperature and the crystal volume
fraction (Allegre et al., 1981; Gorokhova and Melnik, 2010), or using partition
coefficients focusing on plagioclase oscillatory zoning in isothermal systems (L’Heureux,
1993; L’Heureux and Fowler, 1996). A few of works relate both parameters through
CSDs doing a match between a volumetric parameter based on CSD calculations and a
mean plagioclase composition from several igneous bodies (Zieg and Marsh, 2002) or
analyzing qualitatively the CSD diagram with the evolution of plagioclase composition
(Salisbury et al., 2008).
Figure 2. 7: Logarithm of crystal growth rate as a function of temperature for An100-Ab0, An75-Ab25,
An50-Ab50 and An20-Ab80 solutions. Small dots are heating stage data. Larger symbols are from quenched
samples. According to Kirkpatrick, plagioclase growth rate is higher with increasing anorthite content. For all
experiments, the plagioclase growth rate increases from the liquidus temperature, it reaches a peak and later it
decreases. Modified from Kirkpatrick et al. (1979).
22
Crystal Size Distributions applied on volcanoes
The first applied CSD study on volcanoes was in the Makaopuhi Lava Lake
(Hawaii) (Cashman and Marsh, 1988), where CSD numerical basis are applied to obtain
an exponential relationship between crystal growth rate and cooling rates. The same
exponential relationship is exposed as a summary in Cashman (1993) and Higgins
(2006). The cooling of magma system affects to other subsurface processes such as
magma ascent and surface crystallization. The related textures to these stages are seen in
Nanolites and Microlites. Nanolites represent the last portion of magma cooled on
surface. Using CSD analysis is possible to describe the evolution of crystallization (Sharp
et al., 1996) or to distinguish the beginning of crystallization of different phases (Mujin
and Nakamura, 2014). Microlites represent the first stage of crystallization on surface
and crystallization during magma ascent. CSD analysis has been used to constraint the
evolution of crystallization during the advance of a lava flow (e.g., Crisp et al., 1994;
Riker et al., 2009), or to determine different stages of magma ascent (e.g., Preece et al.,
2013) or to interpret shallow processes related to cooling (Cashman, 1992) or degassing
(Hammer et al., 1999).
Most of the CSD studies focus on petrological processes inside magma reservoirs. Kinks
on CSDs could represent the limit between pre-eruptive processes and syn-eruptive
processes (e.g., Mastrolorenzo and Pappalardo, 2006; Pappalardo and Mastrolorenzo,
2010) or multi-reservoir systems (Armienti et al., 1994; Marsh, 1998; Armienti et al.,
2007). Curvatures on CSD could represent mechanical processes inside magma
reservoirs: lower values of population density for smallest sizes than higher sizes imply a
digestion of smallest crystals to form regrowth rims in higher crystals, this process is
called coarsening (Jerram et al., 1996; Higgins and Roberge, 2003); fractionation-
accumulation process is inferred if CSD diagrams are concave or convex (Marsh, 1988;
Higgins, 2002b); Magma mixing is inferred if CSDs present kinks with curved segments
(Higgins, 1996) or a fanning pattern of a CSD set represents a control by crystal growth
rate or residence time because of different cooling regimes (Zieg and Marsh, 2002;
Higgins, 2002a).
23
Capítulo 3
Kinetic parameters and duration of
melt crystallization from a new CSD
approach
Manuscrito para ser sometido en la revista American Mineralogist
Abstract
Crystal Size Distribution (CSD) is applied in igneous rocks to obtain crystal kinetic
parameters such as the crystal growth rate, the crystal nucleation rate and the volume
fraction of crystals as functions of the crystal size and the time. The crystal size is usually
obtained from measured textural parameters considering a unique crystal aspect ratio
regardless of the crystal length, but the morphology of crystals depends on the
undercooling and on the cooling rate. The population density of crystals is the
differential of the cumulative distribution of crystal lengths function, that is usually
discretized using logarithmical distribution with an arbitrary number of bins per decade
to obtain CSDs, but the cumulative distribution is a continuous function then no
discretization is needed. The discretization of the crystal axis biases the nucleation
density, the maximum crystal length and positions of kinks. Consequently, calculated
duration of crystallization and the crystal growth rate strongly depend on the number of
bins per decade. Here we propose a new procedure to calculate CSD based on the
modeling of the cumulative distribution of the crystal lengths function through an error
function. Calculated crystal growth rates and crystal nucleation rates have asymmetrical
gaussian distributions with regard to the time, where the peak of the former is previous
to the peak of the latter and both crystal rates presents an instantaneous increase just
previous to an eruption. Calculated volume fraction of crystals has a sigmoidal curve
with regard to the time revealing three ideal magmatic stages. This model can be applied
both in plutonic and extrusive igneous systems.
24
Introduction
Crystal Size Distribution (CSD) is a quantitative textural analysis applied in
igneous and metamorphic rocks that compares the number of crystals per unit of volume
per crystal size, as known as the population density of crystals (n), with its crystal size
(L) (Marsh, 1988) in a log-normal diagram. CSD has commonly been used to obtain
crystal kinetic parameters such as growth rate (G), nucleation rate (J) or volume fraction
(φ) (e.g., Cashman and Marsh, 1988; Cashman, 1993; Crisp et al., 1994; Higgins and
Roberge, 2003; Salisbury et al., 2008; Vinet and Higgins, 2010; Spillar and Dolejs, 2013)
or to define different magmatic stages (e.g., Armienti et al., 1994; Marsh, 1998;
Mastrolorenzo and Pappalardo, 2006; Armienti et al., 2007; Pappalardo and
Mastrolorenzo, 2010).
Quantitative textural parameters such as length, width, area, orientation and
center position of crystals are systematically measured from 2D images (Sahagian and
Proussevitch, 1998; Higgins, 2000). Based on these parameters, a mean 3D aspect ratio
of crystals is calculated (Higgins, 2000; Morgan and Jerram, 2006) to apply it in all
crystals of the sample regardless of its length. Considering a regular orientation of
crystals, the resulting crystal lengths are distributed partitioning the crystal size axis in
logarithmical or linear intervals defined by an arbitrary selected number of bins per
decade (Higgins, 2000). Nevertheless, the 3D aspect ratio of crystals is a function of the
undercooling (Lofgren, 1974; Shea and Hammer, 2013) and of the cooling rate (Pupier et
al., 2008; Shea and Hammer, 2013). Consequently, the use of a same 3D crystal aspect
ratio for all crystals in a system supposes a constant undercooling. Later, n(L) is
calculated as the differential of the cumulative crystal length (measured) distribution
curve (N), thus no bin selection is needed.
The calculated 3D crystal size database could be applied using three kind of
crystallization models: the open system model (Marsh, 1988) that considers an open
system of constant volume with influx and outflux of magma and G independent of the
initial crystal size (e.g, Kirkpatrick et al., 1979; Muncill and Lasaga, 1987; Marsh, 1998),
the batch system model (Marsh, 1998) that considers a closed system and G independent
of the initial crystal size, and the inversion of the CSD model (Melnik et al., 2011; Spillar
and Dolejs, 2013) that uses φ(t) as the input to calculate G and J. The first model

25
assumes constant G and J giving straight line CSDs, where G and J are calculated from
the intercept and the slope of the CSD; the second model assumes a constant G and an
exponentially increasing J giving convex CSDs with a n(L) peak different to the
intercept, where G and J are calculated from an interpolation of the CSD intercept and
the CSD slope of the longest crystals; and the last model calculates a exponentially
decreasing G and a exponentially increasing J considering soft changes of the CSD slope,
where G and J are calculated from n(L), the CSD slope and the maximum crystal size.
The resulting G and J from any of these three models do not follow an asymmetrically
bell-shaped curve with regard to the time or the undercooling like thermodynamic
models show (e.g., Spohn et al., 1988; Hort and Spohn, 1991; Hort, 1997; Couch et al.,
2003; Shea and Hammer, 2013).
For these reasons, we present a new procedure to develop CSD analysis based on
the modeling of the cumulative distribution of crystal lengths considering it like a
continuous and differentiable function. The resulted CSD is a convex curve that gives
bell-shaped G and J curves and a sigmoidal φ with regard to the time comparable with
the obtained from thermodynamic models. To verify the applicability of our model as in
volcanic as in intrusive systems, the presented model is tested using plagioclase CSDs
from the 1971 Villarrica Volcano lava flow and from the Qz-monzodiorites of the La
Gloria Pluton.
Calculation of kinetic parameters from the new CSD
procedure
The length-width ratio of crystals (l:w)(l) is a linear function of the crystal length
(l) (Pupier et al., 2008) and is comparable to the small axis-intermediate axis ratio
(Higgins, 2000; Pupier et al., 2008). We assume that crystals with the same area have
the same length. We calculate the equivalent size (Le) of any crystal k of l equals to lk
using the following expression:
26
𝐿𝑒𝑘 = √𝐴𝑘 × (𝑙: 𝑤)(𝑘) (3. 1)
Where Ak is the area of the crystal k. The cumulative distribution of crystal lengths
is obtained using Le and it is continuously modeled through the following error function
𝑁(𝐿𝑒) = 𝑎 × erf(𝑏 × 𝐿𝑒) + 𝑐 (3. 2)
Where a, b and c are constants. A partial population density (np(Le)) can be
calculated considering the relationship between N and n (Marsh, 1988)
𝑛𝑝(𝐿𝑒) =𝜕𝑁(𝐿𝑒)
𝜕𝐿𝑒 (3. 3)
The CSD slope (S) is calculated as the differential of the CSD diagram
𝑆(𝐿) =𝜕𝑙𝑛(𝑛(𝐿𝑒))
𝜕𝐿𝑒 (3. 4)
Based on empirical studies (Couch et al., 2003; Zieg and Lofgren, 2006)
indicating that the crystal population density moves rightward in the CSD diagram by an
increment ΔL in a Δt (Melnik et al., 2011; Spillar and Dolejs, 2013), the length increment
(ΔL) is related to a time-dependent G determination as follow
∆𝐿 = ∫ 𝐺(𝜏)𝜕𝜏
𝑡+∆𝑡
𝑡
(3. 5)
The nucleated crystals in the same time interval are
27
∆𝑁 = ∫ 𝐽(𝜏)𝜕𝜏
𝑡+∆𝑡
𝑡
(3. 6)
Our procedure requires finite discretization of the crystal length and of the
crystallization duration domains to apply the numerical basis. The CSD crystal length
scale is discretized into a regularly spaced sequence {Li}, where i є {0 … N} such that L0
= 0, Li+1 = Li + Δt and LN = Maximum crystal length. The crystal population density
corresponding to the size i is ni = n(Li). The crystallization duration is also discretized as
{ti} with i є {0 … N} where ti corresponds to the duration when crystals of actual size Li
nucleated. Because the rightward advance of the CSD, tN = 0 and t0 = ttotal, thus, the
resulting kinetic parameters J(t), G(t) and φ(t) according to the crystal length discrete
values can be expressed as
𝐽(𝑡𝑖) = 𝐽𝑖 ; 𝐺(𝑡𝑖) = 𝐺𝑖; 𝜑(𝑡𝑖) = 𝜑𝑖 (3. 7)
Φ is calculated as a function of the crystal size modifying the expression of Marsh
(1998) and Higgins (2002a) as
𝜑𝑖 = 𝜎 ∑ 𝑛𝑗0𝑒𝑥𝑝(−𝑆𝑗(𝐿𝑚𝑗 − 𝐿𝑀 + 𝑖))(𝐿𝑚𝑗 − 𝐿𝑀 + 𝑖)3∆𝐿
𝐿𝑀
𝑗=𝐿𝑀−𝑖
(3. 8)
Where σ is a crystal form parameter, LM is the real maximum crystal length, Lmj is
the mean size of the j interval and nj0 is the interpolation of the segment up to the
intercept defined as
𝑛𝑗0 = 𝑛𝑗 −𝑛𝑗 − 𝑛𝑗+1
∆𝐿× (𝐿𝑗 − 𝑁 + 𝑗) (3. 9)
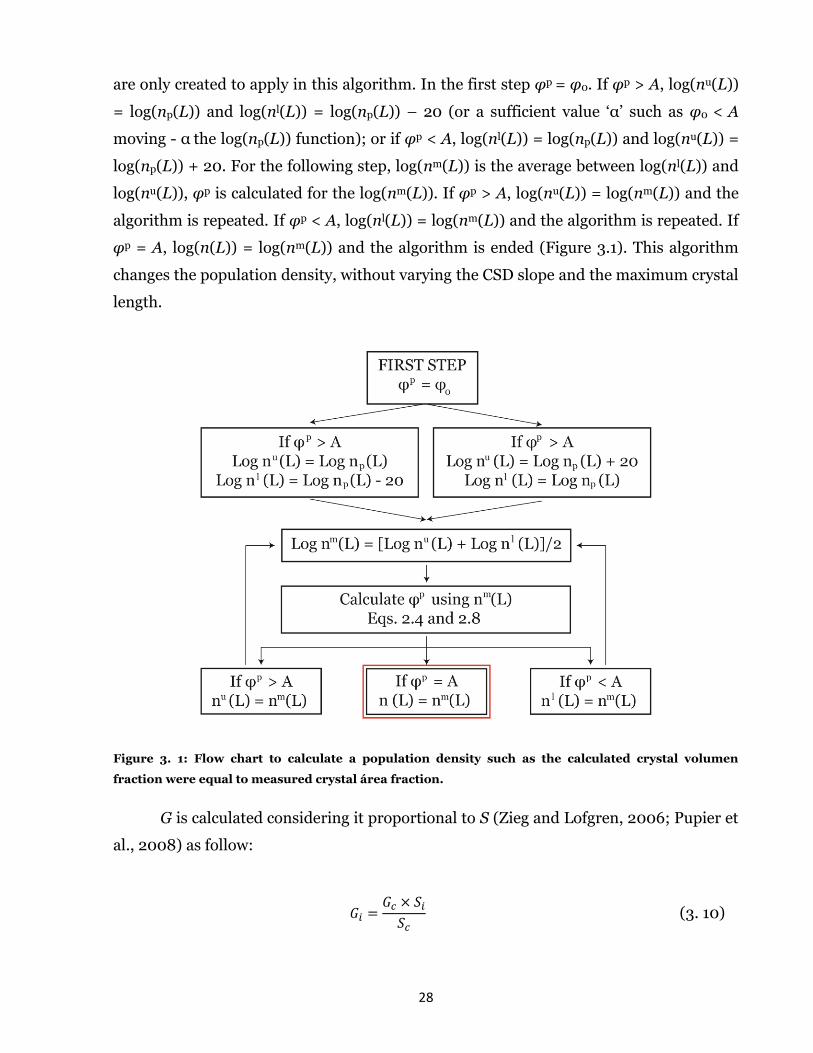
The final calculated volume fraction is obtained with i = 0. The partial population
density is moved until φ0 were equal to the area fraction of all crystals (A) to obtain the
final population density (n(L)). The variables φp, log(nu(L)), log(nm(L)) and log(nl(L))
28
are only created to apply in this algorithm. In the first step φp = φ0. If φp > A, log(nu(L))
= log(np(L)) and log(nl(L)) = log(np(L)) – 20 (or a sufficient value ‘α’ such as φ0 < A
moving - α the log(np(L)) function); or if φp < A, log(nl(L)) = log(np(L)) and log(nu(L)) =
log(np(L)) + 20. For the following step, log(nm(L)) is the average between log(nl(L)) and
log(nu(L)), φp is calculated for the log(nm(L)). If φp > A, log(nu(L)) = log(nm(L)) and the
algorithm is repeated. If φp < A, log(nl(L)) = log(nm(L)) and the algorithm is repeated. If
φp = A, log(n(L)) = log(nm(L)) and the algorithm is ended (Figure 3.1). This algorithm
changes the population density, without varying the CSD slope and the maximum crystal
length.
Figure 3. 1: Flow chart to calculate a population density such as the calculated crystal volumen
fraction were equal to measured crystal área fraction.
G is calculated considering it proportional to S (Zieg and Lofgren, 2006; Pupier et
al., 2008) as follow:
𝐺𝑖 =𝐺𝑐 × 𝑆𝑖𝑆𝑐
(3. 10)
29
Where Gc is a characteristic crystal growth rate related to a characteristic CSD
slope (Sc) and Si is the CSD slope at the position i. Gc for a certain crystal size interval can
be obtained through several methods such as heat balance models (e.g, Cashman, 1993;
Marsh, 1996; Hort, 1997; Hawkesworth et al., 2000), cooling of lava flows or lava lakes
(e.g., Cashman and Marsh, 1988; Cashman, 1993; Crisp et al., 1994; Cashman et al.,
1999), Uranium-series isotopes (e.g., Condomines et al., 1988; Albarede, 1993;
Sigmarsson et al., 2002; Hawkesworth et al., 2004), diffusion modeling (e.g, Zellmer et
al., 1999; Davidson et al., 2001; Costa et al., 2003; Costa and Chakraborty, 2004;
Morgan et al., 2004; Morgan and Blake, 2006) or using measured parameters from
other CSD studies (e.g., Salisbury et al., 2008; Vinet and Higgins, 2010).
As the crystal population density of a certain crystal length corresponds to its
nucleation density, the crystal nucleation rate is defined as
𝐽𝑖 = 𝑛𝑖 × 𝐺𝑖 (3. 11)
The representative duration of crystallization is
𝑡𝑖 =∆L
𝐺𝑖 (3. 12)
And the total duration of crystallization is the sum of the duration of all intervals
𝑡𝑡𝑜𝑡 =∑𝑡𝑖
𝐿𝑀
𝑖=1
(3. 13)
Error Analysis
Inaccuracy in the determination of CSD analysis comes mainly from two sources.
The first one is related to the image resolution. We have estimated that 2D crystal length
can vary around 10 pixels using hand-marking technique. Consequently, the error will be
higher for smallest crystals because the higher ratio between the length of 10 pixels and
30
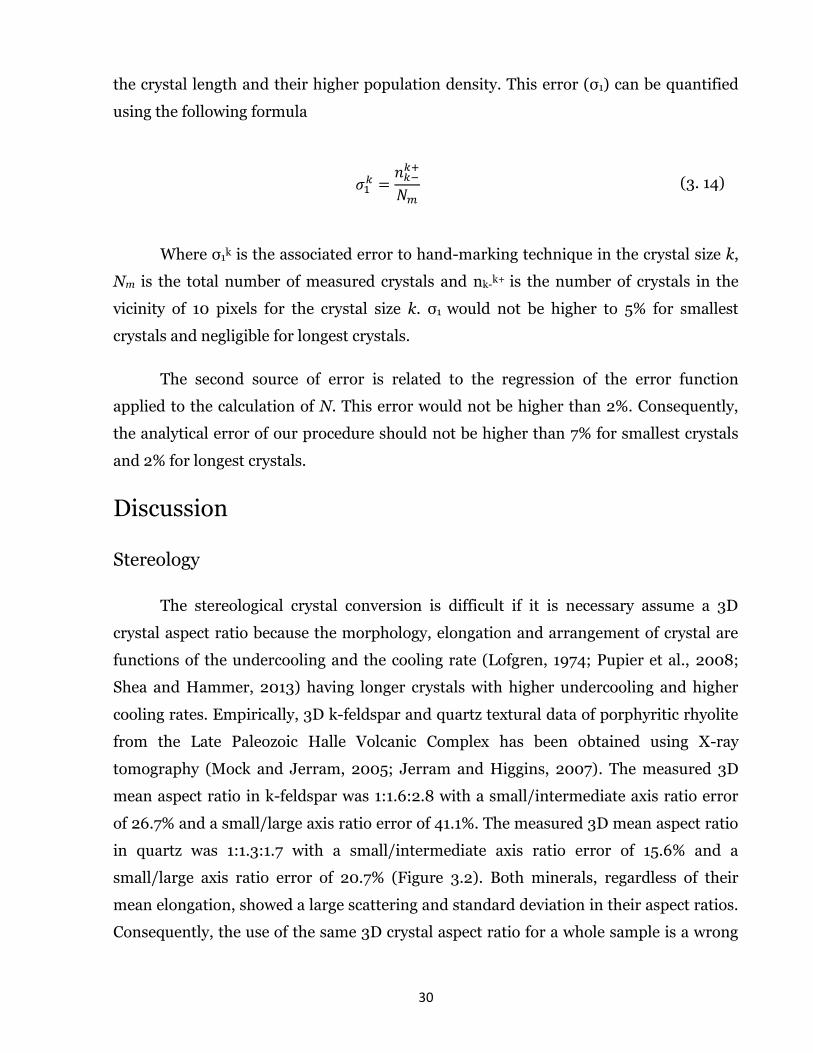
the crystal length and their higher population density. This error (σ1) can be quantified
using the following formula
𝜎1𝑘 =
𝑛𝑘−𝑘+
𝑁𝑚 (3. 14)
Where σ1k is the associated error to hand-marking technique in the crystal size k,
Nm is the total number of measured crystals and nk-k+
is the number of crystals in the
vicinity of 10 pixels for the crystal size k. σ1 would not be higher to 5% for smallest
crystals and negligible for longest crystals.
The second source of error is related to the regression of the error function
applied to the calculation of N. This error would not be higher than 2%. Consequently,
the analytical error of our procedure should not be higher than 7% for smallest crystals
and 2% for longest crystals.
Discussion
Stereology
The stereological crystal conversion is difficult if it is necessary assume a 3D
crystal aspect ratio because the morphology, elongation and arrangement of crystal are
functions of the undercooling and the cooling rate (Lofgren, 1974; Pupier et al., 2008;
Shea and Hammer, 2013) having longer crystals with higher undercooling and higher
cooling rates. Empirically, 3D k-feldspar and quartz textural data of porphyritic rhyolite
from the Late Paleozoic Halle Volcanic Complex has been obtained using X-ray
tomography (Mock and Jerram, 2005; Jerram and Higgins, 2007). The measured 3D
mean aspect ratio in k-feldspar was 1:1.6:2.8 with a small/intermediate axis ratio error
of 26.7% and a small/large axis ratio error of 41.1%. The measured 3D mean aspect ratio
in quartz was 1:1.3:1.7 with a small/intermediate axis ratio error of 15.6% and a
small/large axis ratio error of 20.7% (Figure 3.2). Both minerals, regardless of their
mean elongation, showed a large scattering and standard deviation in their aspect ratios.
Consequently, the use of the same 3D crystal aspect ratio for a whole sample is a wrong
31
assumption and the calculation of the probability of cutting in crystal corners is
impossible.
A good consideration is that the intermediate axis – small axis ratio is a linear
function of crystal length (Pupier et al., 2008). This ratio and the measured crystal area
can be used to calculate the crystal size with lower uncertainty. The use of 2D textural
parameters to decipher magmatic processes has been increasing in the last years (e.g.,
Couch et al., 2003; Toramaru, 2006; Toramaru et al., 2008; Noguchi et al., 2008;
Salisbury et al., 2008; Preece et al., 2013) guaranteeing the reliability of our procedure.
32
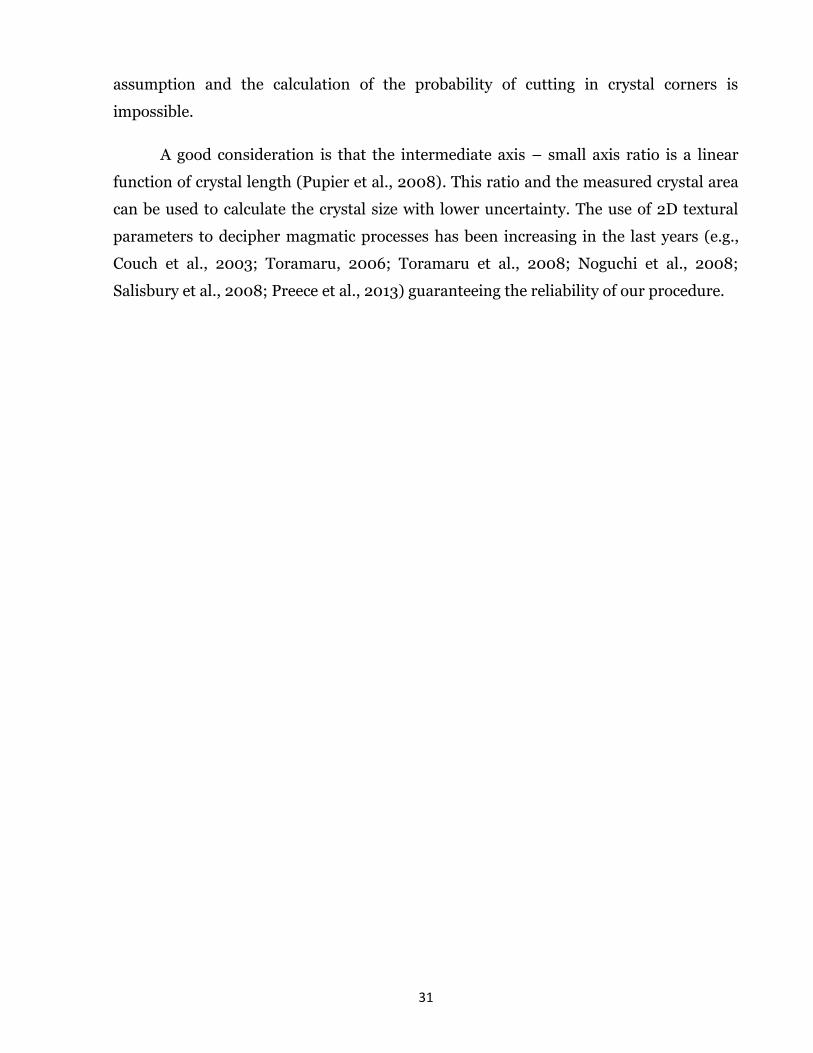
Figure 3. 2: 3D measured aspect ratios of Quartz and K-feldspar from the Late Paleozoic Halle
Volcanic Complex (Mock and Jerram, 2005; Jerram and Higgins, 2007) plotted in a Zingg diagram
(Zingg, 1935). Quartz shows a S/I ratio of 0.7883 ± 0.1233 and a I/L ratio of 0.7400 ± 0.1141 that corresponds to a
S:I:L of 1:1.27±0.20:1.72±0.36. K-feldspar shows a S/I ratio of 0.6198 ± 0.1655 and a I/L ratio of 0.5811 ± 0.2030 that
corresponds to S:I:L of 1:1.61±0.43:2.82±1.16. These high standard deviations of 3D measured aspect ratios show
there is not a common 3D aspect ratio in nature. Consequently, the use of unique 3D mean aspect ratio is not adequate
to do CSDs.

33
The partition of N
The next step to develop CSD analysis is the calculation of the crystal population
density as a function of the crystal size. The crystal population density can be directly
obtained measuring the amount of crystals in a unit of volume (e.g., Higgins, 2000) or
calculating the slope of the cumulative distribution of crystal lengths curve (e.g.,
Cashman and Marsh, 1988). Conventionally, regardless of the method used, the crystal
size axis has been partitioned in an arbitrary number of bins per decade using
logarithmical or linear distribution. CSD diagrams could indicate substantially different
values of crystallization parameters if the selected number of bins is changed. To
illustrate the effect of the selected number of bins per decade on CSD analysis, we use a
basaltic andesite lava sample of the 1971 Villarrica volcano eruption (Moreno and
Clavero, 2006). Plagioclase phenocrysts were hand- marked from a scanned thin section
image of 3.5 x 2.5 cm and plagioclase microcrysts were hand-marked from a BSEM
image with a focus of 200X. The scanned thin section image has 1569 plagioclase
crystals with a length from 64 μm to 2705 μm. The BSEM image has 1444 plagioclase
crystals with a length from 3 μm to 120 μm. The software CSDCorrections 1.40 was used
to convert 2D data in 3D data (Higgins, 2000). A mean 3D crystal aspect ratio of
1.0:2.7:4.0 was calculated by the software CSDSlice (Morgan and Jerram, 2006) that
corresponds to the calculated aspect ratio of phenocrysts. A roundness index of 0.1 and a
fabric index of 0.3 were input. Four, seven and ten bins per decade in a logarithmical
distribution on base 10 were selected for comparison. The output of CSDCorrections
software is interpolated using third-degree polynomial regressions. The resulting G, J, t
and φ of CSD diagrams were calculated using the Spillar and Dolejs’s treatment (2013).
The maximum crystal length obtained from CSD diagrams using the three
numbers of bins per decade has a standard deviation of 14%. In addition, the position of
the kink in CSD diagrams has a standard deviation of 24%. The nucleation density does
not substantially vary showing a variation of 3% (Figure 3.3). Only the CSD diagram of
ten bins per decade shows a decreasing crystal population density with decreasing
crystal size in the three smallest bins. t of the complete magmatic process shows a
variation of 34% considering the three cases. t for the segment previous to the kink
varies a 60% (Figure 3.4) and the initial crystal growth rate varies a 79% (Figure 3.5).
Every case present differences in crystal growth rate trend before and after the kink
34
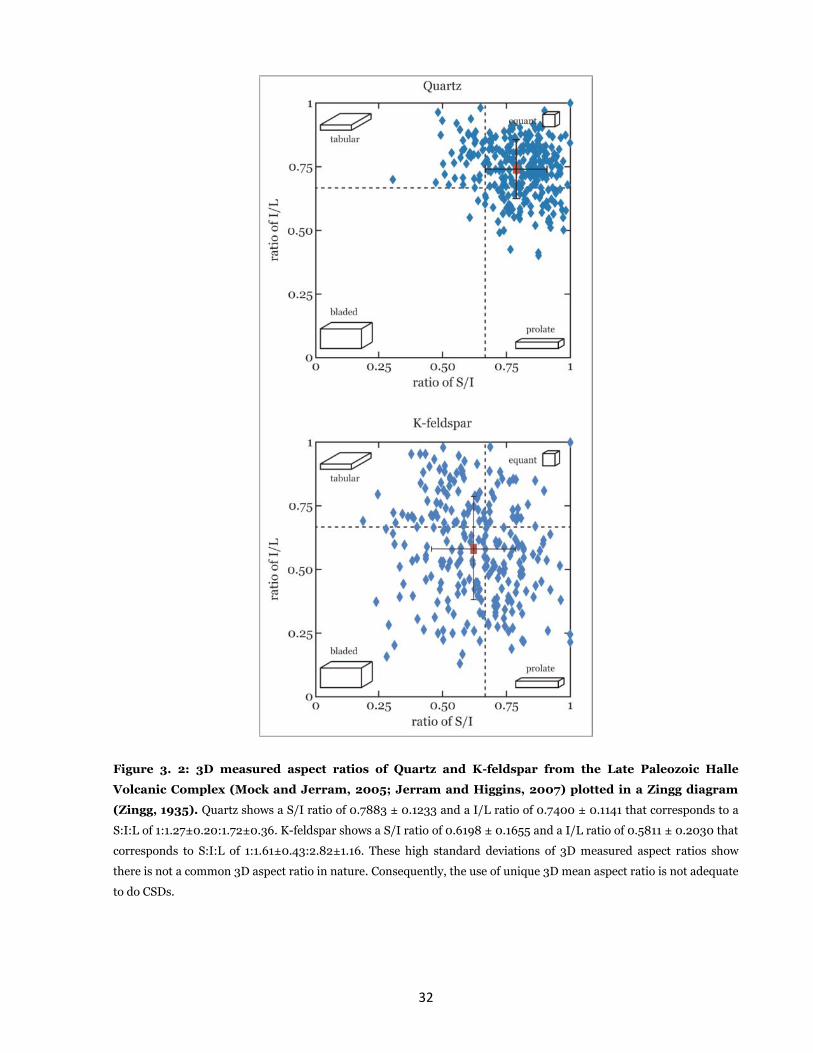
(Figure 3.5). The crystal nucleation rate and the crystal volume fraction are not
significantly affected by the number of bins per decade.
Figure 3. 3: CSDs of the 1971 Villarrica Volcano lava flow sample using 4, 7 and 10 bins per decade. The
maximum crystal length (LM), the position of the kink and the nucleation density (n0) vary if the number of bins per
decade is changed. The CSD of 4 bins per decade presents a LM of 5.41 mm, a Ln(LM) of -7.33, a kink located at 0.497
mm with a Ln(n) of 1.17 and a Ln(n0) of e16.17; the CSD of 7 bins per decade presents a LM of 7.15 mm, a Ln(LM) of -
9.70, a kink located at 0.372 mm with a Ln(n) = 1.49 and a Ln(n0) of e15.21; the CSD of 10 bins per decade presents a LM
of 6.36 mm, a Ln(LM) of -7.76, a kink located at 0.315 mm with a Ln(n) = 1.52 and a Ln(n0) of e15.95.
35
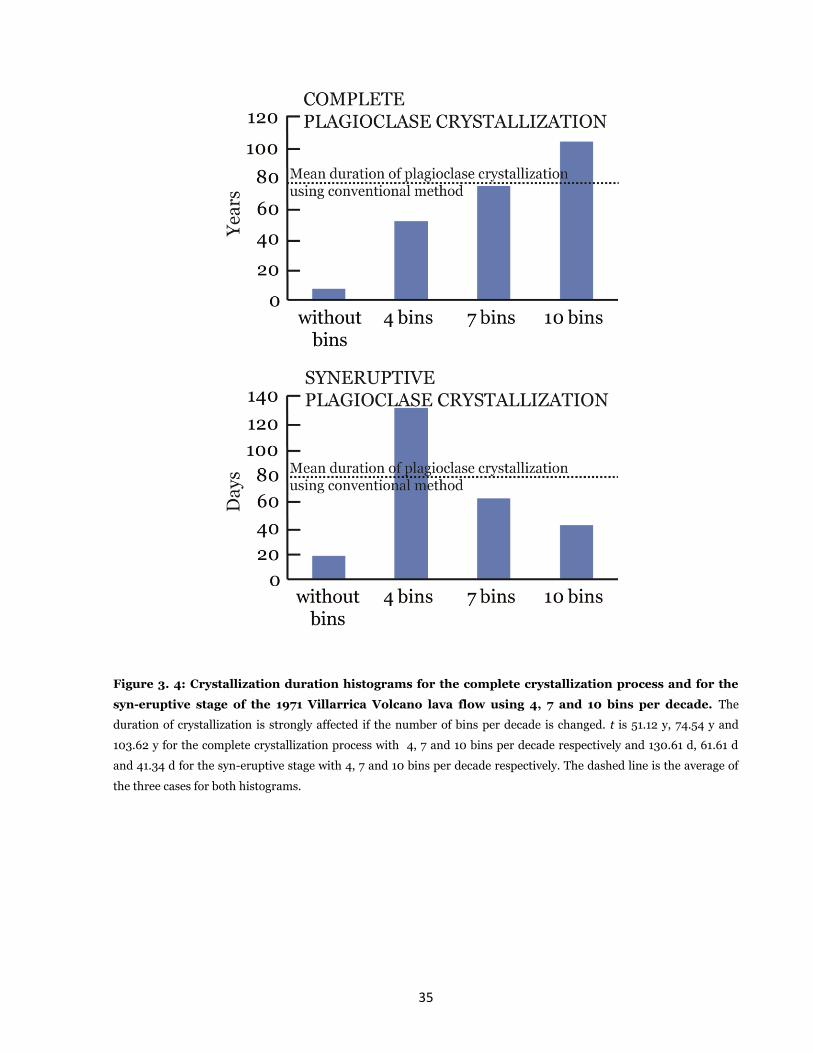
Figure 3. 4: Crystallization duration histograms for the complete crystallization process and for the
syn-eruptive stage of the 1971 Villarrica Volcano lava flow using 4, 7 and 10 bins per decade. The
duration of crystallization is strongly affected if the number of bins per decade is changed. t is 51.12 y, 74.54 y and
103.62 y for the complete crystallization process with 4, 7 and 10 bins per decade respectively and 130.61 d, 61.61 d
and 41.34 d for the syn-eruptive stage with 4, 7 and 10 bins per decade respectively. The dashed line is the average of
the three cases for both histograms.
36
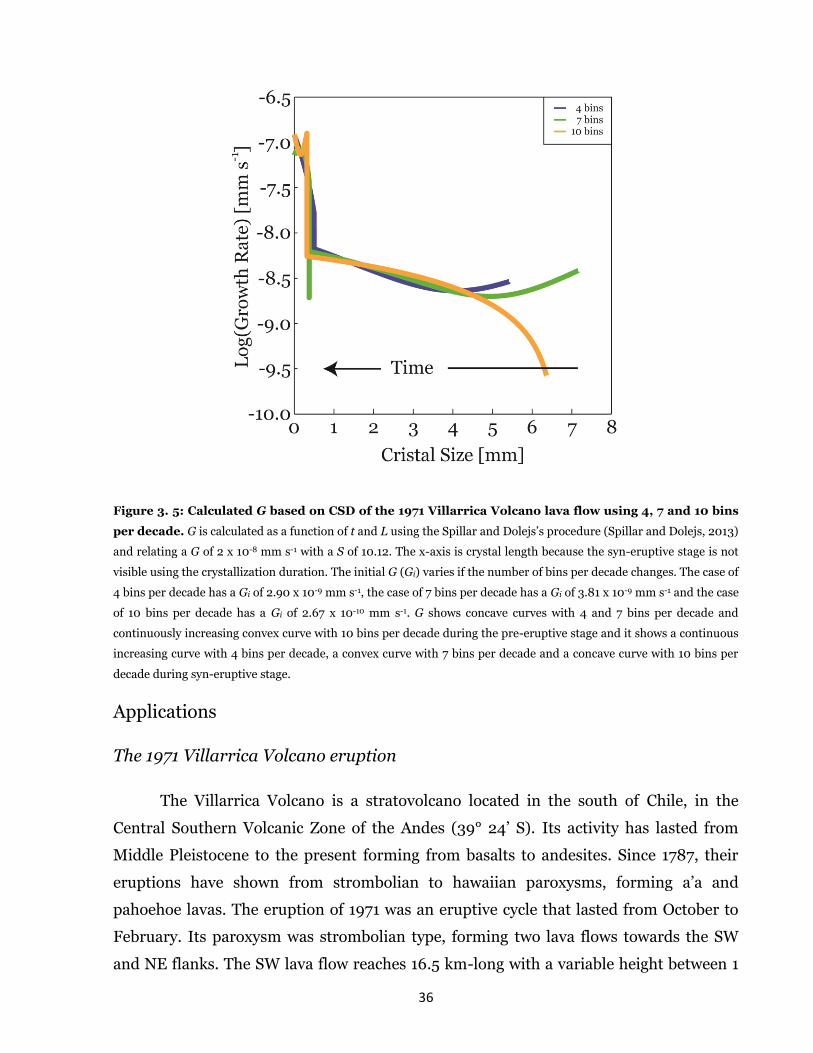
Figure 3. 5: Calculated G based on CSD of the 1971 Villarrica Volcano lava flow using 4, 7 and 10 bins
per decade. G is calculated as a function of t and L using the Spillar and Dolejs’s procedure (Spillar and Dolejs, 2013)
and relating a G of 2 x 10⁻⁸ mm s-1 with a S of 10.12. The x-axis is crystal length because the syn-eruptive stage is not
visible using the crystallization duration. The initial G (Gi) varies if the number of bins per decade changes. The case of
4 bins per decade has a Gi of 2.90 x 10⁻⁹ mm s-1, the case of 7 bins per decade has a Gi of 3.81 x 10⁻⁹ mm s-1 and the case
of 10 bins per decade has a Gi of 2.67 x 10⁻¹⁰ mm s-1. G shows concave curves with 4 and 7 bins per decade and
continuously increasing convex curve with 10 bins per decade during the pre-eruptive stage and it shows a continuous
increasing curve with 4 bins per decade, a convex curve with 7 bins per decade and a concave curve with 10 bins per
decade during syn-eruptive stage.
Applications
The 1971 Villarrica Volcano eruption
The Villarrica Volcano is a stratovolcano located in the south of Chile, in the
Central Southern Volcanic Zone of the Andes (39° 24’ S). Its activity has lasted from
Middle Pleistocene to the present forming from basalts to andesites. Since 1787, their
eruptions have shown from strombolian to hawaiian paroxysms, forming a’a and
pahoehoe lavas. The eruption of 1971 was an eruptive cycle that lasted from October to
February. Its paroxysm was strombolian type, forming two lava flows towards the SW
and NE flanks. The SW lava flow reaches 16.5 km-long with a variable height between 1
37
to 5 m. Samples from this lava flow are basalts to basaltic andesites with phenocrysts of
Plagioclase, Olivine, Clinopyroxene and Orthopyroxene. The groundmass is formed by
plagioclase, clinopyroxene, olivine and Fe-Ti oxides (Moreno and Clavero, 2006). The
CSD was made based on plagioclase phenocrysts and microcrysts.
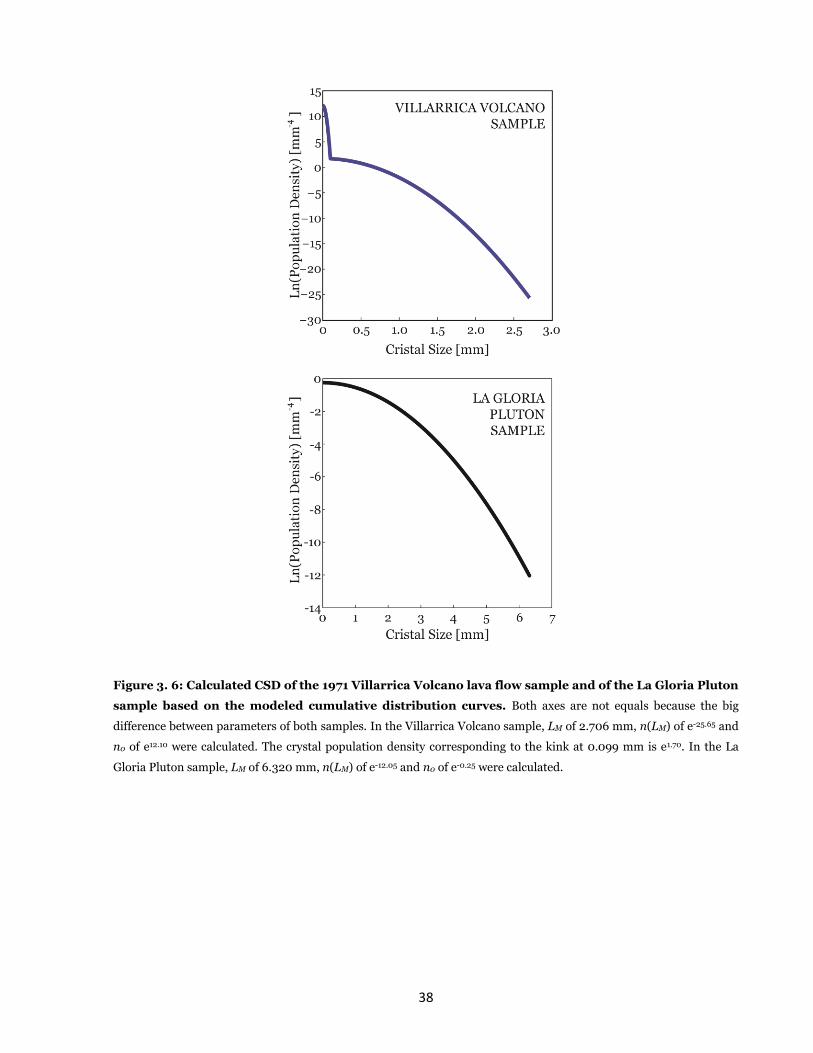
The CSD based on cumulative distribution curve of plagioclase was calculated
from the two different scale images. LM of 2.706 mm, n(LM) of e-25.65 and n0 of e12.10 were
calculated using our procedure. The crystal population density corresponding to the kink
at 0.099 mm is e1.70 (Figure 3.6) and the calculated t for the syn-eruptive stage is c.a. 18
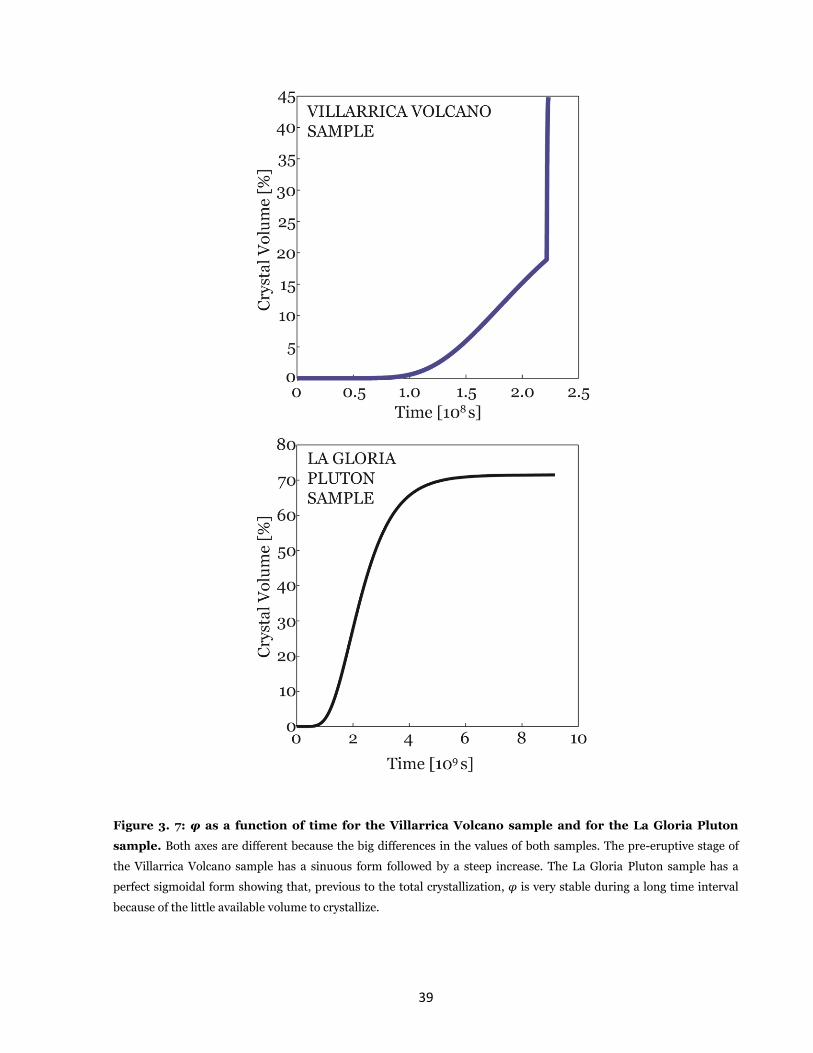
days and for the complete process is c.a. 7 years (Figure 3.4). φ varies sinuously with
respect to t in the pre-eruptive stage reaching up to 0.2, whereas φ in the syn-eruptive
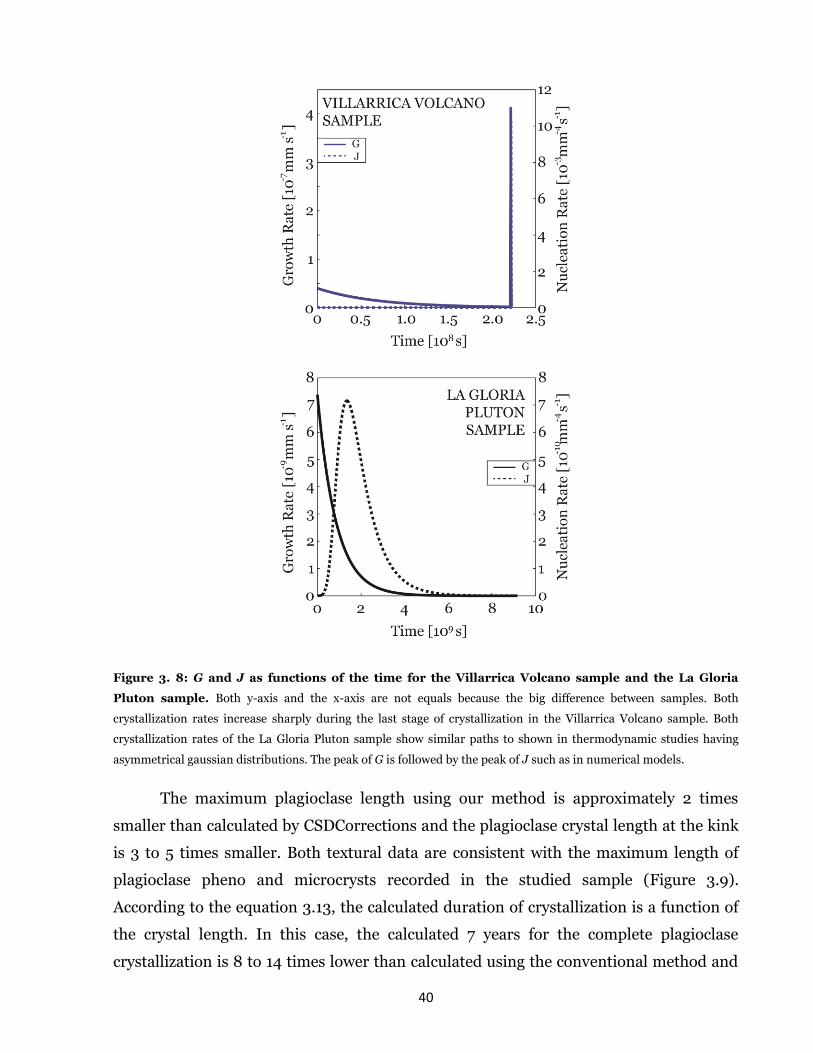
stage increases abruptly up to 0.45 (Figure 3.7). G, calculated from eq. 3.10 with Gc
value of 2 x 10⁻⁸ mm s-1 and Sc of 10.12, decreases progressively more than one order of
magnitude during the pre-eruptive stage. On the other hand, G increases up to two
orders of magnitude at the beginning of the syn-eruptive stage (Figure 3.8). J varies with
time following an asymmetrical gaussian distribution in both pre- and syn-eruptive
stages and the ratio between the lowest and highest J values is about 1011 and 106 for the
pre- and syn-eruptive stage, respectively (Figure 3.8).
38
Figure 3. 6: Calculated CSD of the 1971 Villarrica Volcano lava flow sample and of the La Gloria Pluton
sample based on the modeled cumulative distribution curves. Both axes are not equals because the big
difference between parameters of both samples. In the Villarrica Volcano sample, LM of 2.706 mm, n(LM) of e-25.65 and
n0 of e12.10 were calculated. The crystal population density corresponding to the kink at 0.099 mm is e1.70. In the La
Gloria Pluton sample, LM of 6.320 mm, n(LM) of e-12.05 and n0 of e-0.25 were calculated.
39
Figure 3. 7: φ as a function of time for the Villarrica Volcano sample and for the La Gloria Pluton
sample. Both axes are different because the big differences in the values of both samples. The pre-eruptive stage of
the Villarrica Volcano sample has a sinuous form followed by a steep increase. The La Gloria Pluton sample has a
perfect sigmoidal form showing that, previous to the total crystallization, φ is very stable during a long time interval
because of the little available volume to crystallize.
40
Figure 3. 8: G and J as functions of the time for the Villarrica Volcano sample and the La Gloria
Pluton sample. Both y-axis and the x-axis are not equals because the big difference between samples. Both
crystallization rates increase sharply during the last stage of crystallization in the Villarrica Volcano sample. Both
crystallization rates of the La Gloria Pluton sample show similar paths to shown in thermodynamic studies having
asymmetrical gaussian distributions. The peak of G is followed by the peak of J such as in numerical models.
The maximum plagioclase length using our method is approximately 2 times
smaller than calculated by CSDCorrections and the plagioclase crystal length at the kink
is 3 to 5 times smaller. Both textural data are consistent with the maximum length of
plagioclase pheno and microcrysts recorded in the studied sample (Figure 3.9).
According to the equation 3.13, the calculated duration of crystallization is a function of
the crystal length. In this case, the calculated 7 years for the complete plagioclase
crystallization is 8 to 14 times lower than calculated using the conventional method and
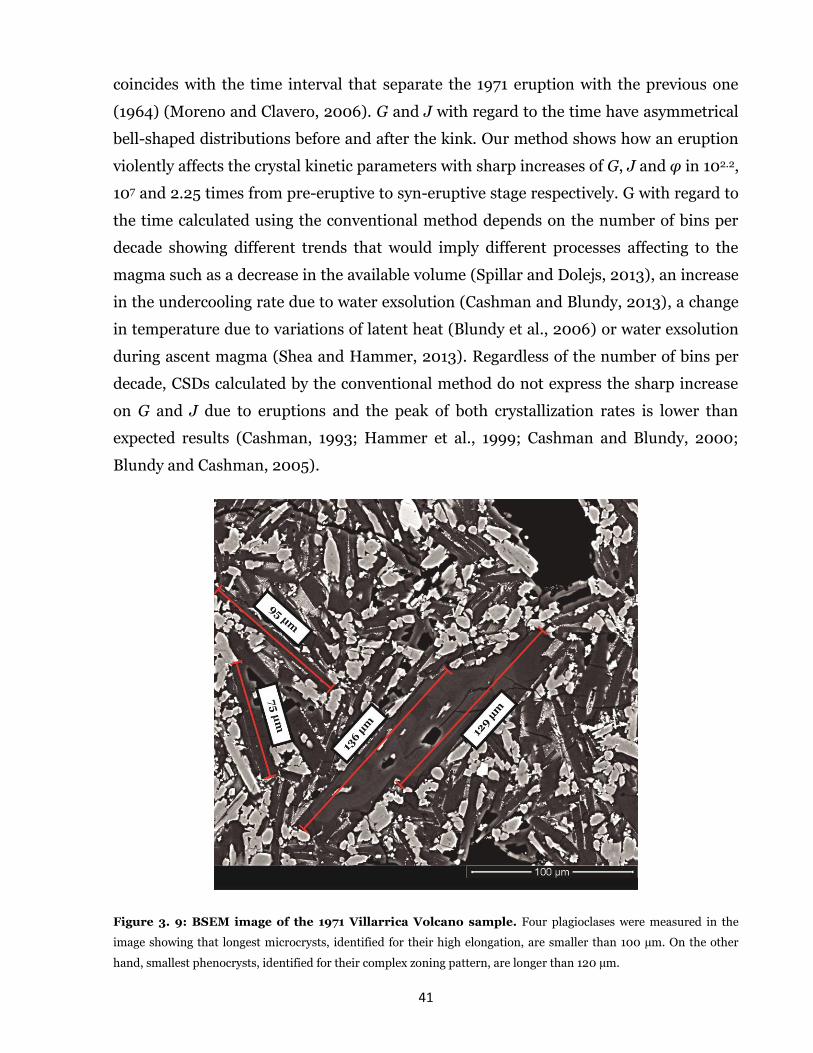
41
coincides with the time interval that separate the 1971 eruption with the previous one
(1964) (Moreno and Clavero, 2006). G and J with regard to the time have asymmetrical
bell-shaped distributions before and after the kink. Our method shows how an eruption
violently affects the crystal kinetic parameters with sharp increases of G, J and φ in 102.2,
107 and 2.25 times from pre-eruptive to syn-eruptive stage respectively. G with regard to
the time calculated using the conventional method depends on the number of bins per
decade showing different trends that would imply different processes affecting to the
magma such as a decrease in the available volume (Spillar and Dolejs, 2013), an increase
in the undercooling rate due to water exsolution (Cashman and Blundy, 2013), a change
in temperature due to variations of latent heat (Blundy et al., 2006) or water exsolution
during ascent magma (Shea and Hammer, 2013). Regardless of the number of bins per
decade, CSDs calculated by the conventional method do not express the sharp increase
on G and J due to eruptions and the peak of both crystallization rates is lower than
expected results (Cashman, 1993; Hammer et al., 1999; Cashman and Blundy, 2000;
Blundy and Cashman, 2005).
Figure 3. 9: BSEM image of the 1971 Villarrica Volcano sample. Four plagioclases were measured in the
image showing that longest microcrysts, identified for their high elongation, are smaller than 100 µm. On the other
hand, smallest phenocrysts, identified for their complex zoning pattern, are longer than 120 µm.

42
La Gloria Pluton
The Pluton La Gloria is an epizonal intrusion located 40 km eastward from
Santiago, Chile (33° S). It belongs to a N-S belt compound by granodioritic to qz-
monzonitic intrusions with a data from middle to upper Miocene. This intrusion
presents an elongated form of NNW orientation, with 20 km –long, a width between 3
and 6 km and an exposed height of 2.5 km. Pluton La Gloria presents five zones
according to its composition and textures: 1) The lower-central zone is compound by
granodiorite and qz-monzodiorite, 2) The lower-rim zone is compound by granodiorite
and qz-monzodiorite with a higher volume of hornblende, 3) The center zone is
compound by qz-monzodiorite and qz-monzonite, 4) The central-rim zone is compound
by qz-monzodiorite and qz-monzonite with higher crystal sizes and 5) The upper zone is
comppund by qz-monzonite. All rocks are formed by plagioclase, quartz, pyroxene,
hornblende, biotite, k-feldspar, Fe-Ti oxides, apatite and titanite (Cornejo and Mahood,
1997). The CSD was made based on plagioclase from several samples of qz-monzodiorite.
The plagioclase CSD was made supposing an only one and continuous
crystallization. Plagioclases were hand-marked from a scanned thin section image where
696 crystals were found with a length from 0.290 mm to 6.320 mm. The resulting CSD
is a continuous and convex curve with n0 of e-0.25 and n(LM) of e-12.05 (Figure 3.6). The
total duration of crystallization used was 4000 years, the intermediate duration
presented by Gutierrez et al., (2013). Both crystal kinetic rates present asymmetrical
gaussian distributions: G varies from 5.37 x 10⁻¹⁰ mm s-1 to 4.25 x 10⁻¹⁴ mm s-1 and J
begins with a rate of 3.14 x 10⁻¹⁵ mm-4 s-1, reaching a peak of 5.21 x 10⁻¹¹ mm-4 s-1 and
decreasing up to 3.29 x 10⁻¹⁴ mm-4 s-1 (Figure 3.8). φ has a sigmoidal form, it is stable
during the first 330 years, later it increases sharply up to 2220 years reaching almost the
final φ and it is almost stable in the last 1450 years with a φ of 0.70 (Figure 3.7).
The resulting convex CSD is very similar to CSD curves obtained by Batch system
model (Marsh, 1998) that calculates crystal population densities considering a constant
G and an exponentially increasing J. On the other hand, our procedure calculates
asymmetrical gaussian distributions of G and J with regard to the time, where the peak
of the former is always previous to the peak of the latter such as it has described in
numerical and experimental models (Spohn et al, 1988; Hort and Spohn, 1991; Hort,
43
1997; Couch et al., 2003). The sigmoidal form of the calculated time-dependent φ is very
similar to the obtained φ by theoretical and experimental models (Avrami, 1939;
Avrami, 1940; Kirkpatrick, 1976). The first stable stage coincides with the G peak
considering an initial φ equals to zero. The second stage characterized by a sharp
increase of φ coincides with the J peak that is consistent with the strong crystal
nucleation dependence of φ related to magmatic processes of high nucleation of crystals
such as magma ascent, water exsolution or high undercooling rates (e.g., Couch et al.,
2003; Blundy et al., 2006; Pupier et al., 2008; Cashman and Blundy, 2013; Shea and
Hammer, 2013). Finally, the third stage shows a final stable crystal volume fraction of
0.7 where magmatic systems can be considered like mush-type reservoirs (e.g,
Bachmann and Bergantz, 2004). In reservoirs with φ > 0.5, crystals are almost in
contact, decreasing the possibility to form new nuclei or to regrowth previous crystals
regardless of the temperature and water pressure conditions (Marsh, 1998; Resmini,
2007; Spillar and Dolejs, 2013) (Figure 3.10).
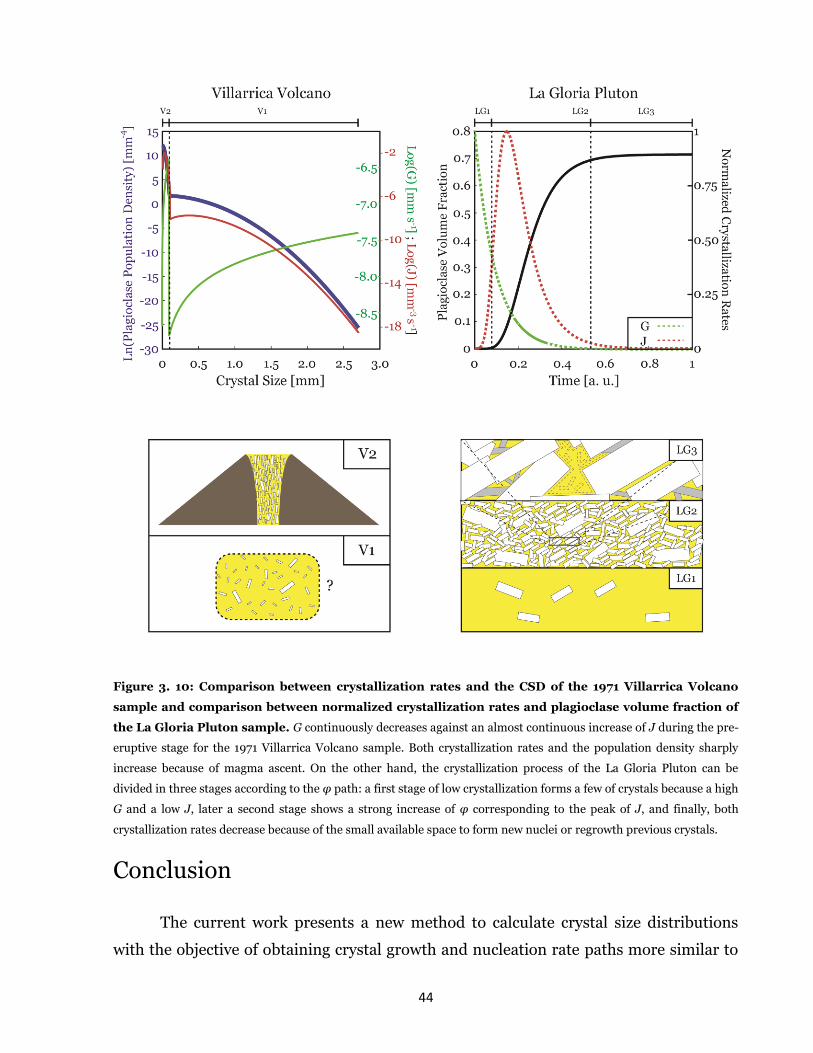
44
Figure 3. 10: Comparison between crystallization rates and the CSD of the 1971 Villarrica Volcano
sample and comparison between normalized crystallization rates and plagioclase volume fraction of
the La Gloria Pluton sample. G continuously decreases against an almost continuous increase of J during the pre-
eruptive stage for the 1971 Villarrica Volcano sample. Both crystallization rates and the population density sharply
increase because of magma ascent. On the other hand, the crystallization process of the La Gloria Pluton can be
divided in three stages according to the φ path: a first stage of low crystallization forms a few of crystals because a high
G and a low J, later a second stage shows a strong increase of φ corresponding to the peak of J, and finally, both
crystallization rates decrease because of the small available space to form new nuclei or regrowth previous crystals.
Conclusion
The current work presents a new method to calculate crystal size distributions
with the objective of obtaining crystal growth and nucleation rate paths more similar to
45
expressed by numerical and experimental thermodynamic works. The measured
quantitative textural parameter database is not converted to 3D crystal sizes using
probabilistic models (Saltikov, 1967; Higgins, 2000) because these need an input of a
unique crystal aspect ratio. The morphology of crystals varies with the variation of the
undercooling and with the variation of the cooling rate (Lofgren, 1974; Shea and
Hammer, 2013) giving a final high scattering of empirical crystal aspect ratios (Mock
and Jerram, 2005; Jerram and Higgins, 2007).
In this work, the cumulative distribution of crystal length function is not
discretized in intervals logarithmically distributed because this method biases the
calculation of the population density. CSDs were calculated using 4, 7 and 10 bins per
decade using a logarithmical distribution obtaining a standard deviation with regard to
the average of 13.8% for the maximum crystal length, 23.6% for the position of the kink
and 3.2% for the nucleation density. These scatterings affect the resulting duration of
crystallization of pre-eruptive stage, the resulting duration of crystallization of syn-
eruptive stage and the initial crystal growth rate obtaining a standard deviation with
regard to the average of 34.4%, 60.1% and 79.1% respectively.
Consequently, CSDs are modeled based on measured crystal lengths focusing on
the cumulative distribution of crystal length function, the integral of the population
density that is continuously modeled using an error function. Considering that G is
proportional to the CSD slope and that the time advances leftward in the CSD diagram,
G, J and φ are obtained as a function of the time. The calculated duration of
crystallization was very similar to the time interval between the presented and its
previous eruption and as G as J show an instantaneous increase just after of the
eruption. A plutonic system was also modeled showing asymmetrical gaussian
distributions of G and J with regard to the time, with the G peak previous to the J peak.
The calculated φ shows a sigmoidal curve with regard to the time. This form can be
interpreted as three stages of crystallization: a first stage of a very low increase of
crystallization corresponding to the G peak, a second stage of a sharp increase of
crystallization corresponding to the J peak and a final stage of soft increase of
crystallization due to the small available space to create new nuclei or to regrowth
previous crystals.
46
Finally, the use of measured textural parameters to do CSD analysis increases the
possibility of coupling this technique with other ones to decipher magmatic processes.
The quantitative textural analysis with regard to the crystal size could be followed by the
qualitative textural analysis of the same crystals such as zoning (e.g., Murphy et al.,
2000; Bouvet de Maisonneuve et al., 2013), disequilibrium textures (Tsuchiyama, 1985;
Cashman and Blundy, 2013) or the form of crystal rims (Tsune and Toramaru, 2007)
that reveal how crystal grew (or dissolved). The mineral composition (X) can be
measured through 2D profiles (e.g., Salisbury et al., 2008; Vinet and Higgins, 2010;
Bouvet de Maissoneuve et al., 2012) that allows express X as a function of crystal size,
such as CSD allows with G and J. Consequently, X could be mathematically related with
G or J through L using CSD analysis to decipher thermodynamic conditions in which
crystals formed (e.g, Lasaga, 1982; L’Heureux, 1993).
47
Capítulo 4
Solving magmatic T – PH2O conditions
through plagioclase CSDs and
anorthite content
Manuscrito para ser sometido en la revista Contributions to Mineralogy and Petrology
Abstract
Crystal size distribution analysis can be coupled with other numerical parameters
to constrain magmatic processes with a higher resolution. The anorthite content in
plagioclase can be expressed as function of the crystal size in the same way of the
calculated crystal growth rate, the crystal nucleation rate and the volume fraction of
crystals by CSD. As the plagioclase composition as crystal kinetic parameters are
functions of thermodynamic parameters such as the temperature and the water
pressure. Using a crystal volume fraction - undercooling relationship, the calculation of
the liquidus temperature as a function of the water pressure and an anorthite content -
temperature - water pressure relationship, the temperature and the water pressure can
be calculated. The model is applied in volcanic products of the 1915 Lassen Peak Volcano
eruption. Two heating events previous to the eruption are inferred. The latter is because
of the mixing of the dacitic magma with an andesitic magma. A stable stage follows the
first heating event showing a PH2O of 199 Mpa, a T of 830 ºC forming plagioclase of
anorthite content of 0.37. The magma mixing is followed by a second stable stage of a
PH2O of 76 Mpa, a T of 959 ºC and forming plagioclase of anorthite content of 0.68. A
devolatilization process occurs just previous to the eruption. From the first stable stage,
a minimum depth of 7 km is calculated. According to CSD calculations, the magma
ascent lasts 18 hours. Thus, a magma ascent rate of 0.11 m s-1 was calculated. In
summary, seven magmatic stages were recognized, distinguishing heating events, stable
48
stages and magma mixing into the pre-eruptive stage and magma ascent from the
surface crystallization into the syn-eruptive stage.
Introduction
Igneous thermodynamic data have been usually obtained from
geothermobarometers and hygrometers models (e.g., Putirka, 2008; Lange et al., 2009).
Based on these singular data and the whole melt composition, thermodynamic paths are
obtained using numerical thermodynamic softwares (e.g., Ghiorso and Sack, 1995;
Holland and Powell, 2003). Calculated mineral compositions are compared with real
mineralogy to check if the result model is consistent (e.g., Riker et al., 2009; Lohmar et
al., 2012, Ustunisik et al., 2014). The crystal volume fraction and quantitative textural
parameters are secondary results.
Quantitative textural parameters are usually measured in igneous rocks to apply
their on Crystal Size Distribution (CSD) analysis (Marsh, 1988) that compares the
population density of crystals with their size. The slope and the intercept of these
diagrams have been used to calculate the crystal nucleation rate (J) and the crystal
growth rate (G) (e.g., Cashman and Marsh, 1988; Marsh, 1998) and the existence of
kinks or concave curves has been used to conclude different magmatic stages (e.g.,
Armienti et al., 1994) or mechanical processes affecting the crystallization (e.g., Spillar
and Dolejs, 2015).
Both crystallization rates have been related with thermodynamic parameters. G
and J show asymmetrical bell-shaped curves with regard to the undercooling (e.g.,
Spohn et al., 1988; Hort., 1997; Couch et al., 2003) and both rates have an exponential
dependence with the cooling rate (Marsh, 1988; Cashman, 1993). The crystal volume
fraction (φ) has been also related with the undercooling through almost linear functions
(e.g., Marsh, 1981; Riker et al., 2009). There are some approaches to express plagioclase
kinetic parameters as functions of temperature (T) and anorthite content (XAn) limited to
anorthite-albite solid solutions (Kirkpatrick et al., 1979; Lasaga, 1982). On the other
hand, the anorthite content has been expressed in several thermodynamic models as
function of thermodynamic parameters (e.g, Bowen, 1913; Yoder and Tilley, 1962; Smith,
1972; Tsuchiyama and Takahashi, 1983; Schmidt et al., 2008; Cashman and Blundy,
49
2013). Despite of the clear G – T- XAn relationship, there is no studies that coupling CSD
with obtained mineral composition to calculate thermodynamic paths, but some
approaches that relate qualitatively quantitative textural parameters with mineral
composition (Salisbury et al., 2008; Vinet and Higgins, 2010).
In the current work, the crystal volume fraction – undercooling relationship is
used (Hort, 1997) inputting the calculated φ by CSD analysis. The liquidus temperature
is calculated as a function of the water pressure (Cashman and Blundy, 2013). Moreover,
the anorthite content – temperature – water pressure relationship is used (Cashman and
Blundy, 2013) inputting measured plagioclase composition to calculate the
crystallization temperature. Thus, a XAn – T – PH2O – φ – G – J path is obtained from the
coupling of plagioclase CSD analysis and the anorthite content allowing the
interpretation of magmatic processes with a higher accuracy than only using quantitative
textural analysis.
To verify its applicability, the presented model is tested with plagioclase CSDs
from different products and plagioclase composition database of the 1915 Lassen Peak
volcano eruption from Salisbury et al.’s work (2008).
Numerical basis
Crystal kinetic parameters
Salisbury et al., (2008) develop plagioclase CSDs using the Wager formula to
convert the areal population density (nA(l)) in volumetric population density nV(L)
𝑛𝑉(𝐿𝑋𝑌) = 𝑛𝐴(𝑙𝑋𝑌)1.5 (4. 1)
The goal of this formula is not to change the measured crystal size. To consider
the variable time on CSD analysis, such that in Chapter 2, the crystal population density
moves rightward in the CSD diagram by an increment ΔL in a Δt (Melnik et al., 2011;
Spillar and Dolejs, 2013), where the length increment (ΔL) is related to a time-
dependent G determination as follow
50
∆𝐿 = ∫ 𝐺(𝜏)𝜕𝜏
𝑡+∆𝑡
𝑡
(4. 2)
The nucleated crystals in the same time interval are
∆𝑁 = ∫ 𝐽(𝜏)𝜕𝜏
𝑡+∆𝑡
𝑡
(4. 3)
The same finite discretization of the crystal length and of the crystallization
duration domains of the Chapter 2 is applied such that the resulting kinetic parameters
J(t), G(t) and φ(t) according to the crystal length discrete values are expressed as
𝐽(𝑡𝑖) = 𝐽𝑖 ; 𝐺(𝑡𝑖) = 𝐺𝑖; 𝜑(𝑡𝑖) = 𝜑𝑖 (4. 4)
And φ is calculated with the same equation
𝜑𝑖 = 𝜎 ∑ 𝑛𝑗0𝑒𝑥𝑝(−𝑆𝑗(𝐿𝑚𝑗 − 𝐿𝑀 + 𝑖))(𝐿𝑚𝑗 − 𝐿𝑀 + 𝑖)3∆𝐿
𝐿𝑀
𝑗=𝐿𝑀−𝑖
(4. 5)
G, J and t are calculated according to the following equations
𝐺𝑖 =𝐺𝑐 × 𝑆𝑖𝑆𝑐
(4. 6)
𝐽𝑖 = 𝑛𝑖 × 𝐺𝑖 (4. 7)
𝑡𝑖 =∆L
𝐺𝑖 (4. 8)

51
And the total duration of crystallization is the sum of the duration of all intervals
𝑡𝑡𝑜𝑡 = ∑𝑡𝑖
𝐿𝑀
𝑖=1
(4. 9)
Introducing thermodynamic and plagioclase composition parameters
As plagioclase crystals grow, anorthite content is recorded. Due to this obvious
statement, the anorthite content can be considered as a numerical parameter using the
same finite discretization of kinetic parameters, recording the anorthite content as
{XAni}, where i є {0 … N} such that XAn0 = the rim composition, XAni+1 = XAni + Δt and
XAnN = the core composition. Other thermodynamic parameters such as the
crystallization temperature (T), the liquidus temperature (Tl) and the water pressure
(PH2O) are parameterized using the same procedure. Thus, measured and calculated
thermodynamic parameters XAn(t), T(t), Tl(t) and PH2O(t) according to the crystal length
discrete values can be expressed as
𝑋𝐴𝑛(𝑡𝑖) = 𝑋𝐴𝑛𝑖; 𝑇(𝑡𝑖) = 𝑇𝑖; 𝑇𝑙(𝑡𝑖) = 𝑇𝑙𝑖; 𝑃𝐻2𝑂(𝑡𝑖) = 𝑃𝐻2𝑂𝑖 (4. 10)
For following equations, the term undercooling (ΔTu) is the difference between Tl
and T and the solidus temperature (Ts) will be considered as a function of Tl (Cashman
and Blundy, 2013)
𝑇𝑠 = 𝑇𝑙 − 255 (4. 11)
The relationship between T and φ (Hort, 1997)
∆𝑇𝑖𝑢 = 255 −
255 × arccos(2𝜑𝑖 − 1)
𝜋 (4. 12)
Tl is a third-degree polynomial function of PH2O if the whole melt composition
does not vary
52
𝑇𝑙𝑖 = 𝑐0 + 𝑐1𝑃𝐻2𝑂𝑖 + 𝑐2𝑃𝐻2𝑂𝑖2 + 𝑐3𝑃𝐻2𝑂𝑖
3 (4. 13)
Where Tl is in ºC and PH2O is in MPa. XAn is mainly a function of temperature and
water pressure (Putirka, 2008; Rutherford and Devine, 2008; Lange et al., 2009;
Ustunisik et al., 2014) and it can be expressed as
𝑋𝐴𝑛𝑖 = 𝑘0𝑇𝑖 + 𝑘1𝑃𝐻2𝑂𝑖 + 𝑘2 (4. 14)
Finally, T and PH2O are found when ΔTiu(φi) is equal to ΔTi
u(Ti,PH2Oi).
Application: The 1915 Lassen Peak Volcano eruption
Plagioclase CSD and composition results
The Lassen Peak volcano is located on the southernmost Cascade Range in the
Pacific coast of The United States of America. It is one of the few long-lived volcanoes
which show a variable composition from andesites to rhyolites (Clynne, 1990; 1999)
(Figure 4.1). Since 300 ky, a hybrid andesite consisting of mixed mafic and silicic magma
has been erupted from a dacite domefield. The 1915 event was an explosive subplinian
eruption that produced four volcanic rock types within 3 days: a hybrid black dacite that
contains undercooled andesitic inclusions, a dark andesite and a light dacite.
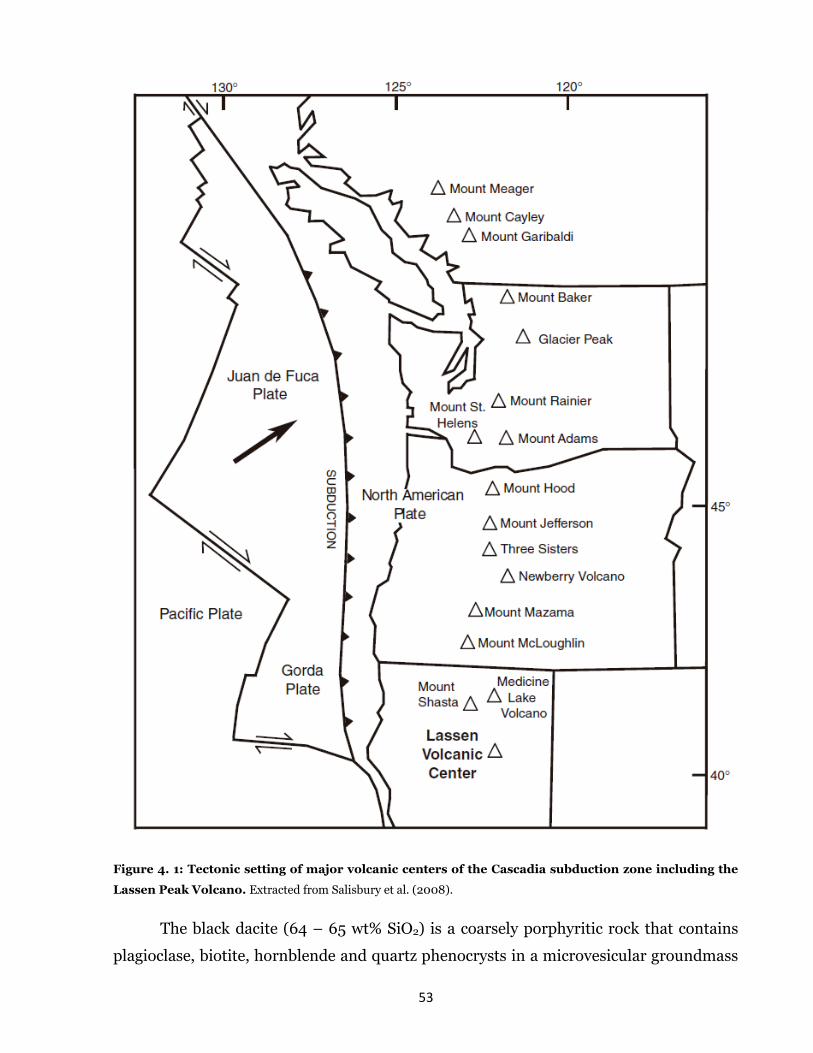
53
Figure 4. 1: Tectonic setting of major volcanic centers of the Cascadia subduction zone including the
Lassen Peak Volcano. Extracted from Salisbury et al. (2008).
The black dacite (64 – 65 wt% SiO2) is a coarsely porphyritic rock that contains
plagioclase, biotite, hornblende and quartz phenocrysts in a microvesicular groundmass
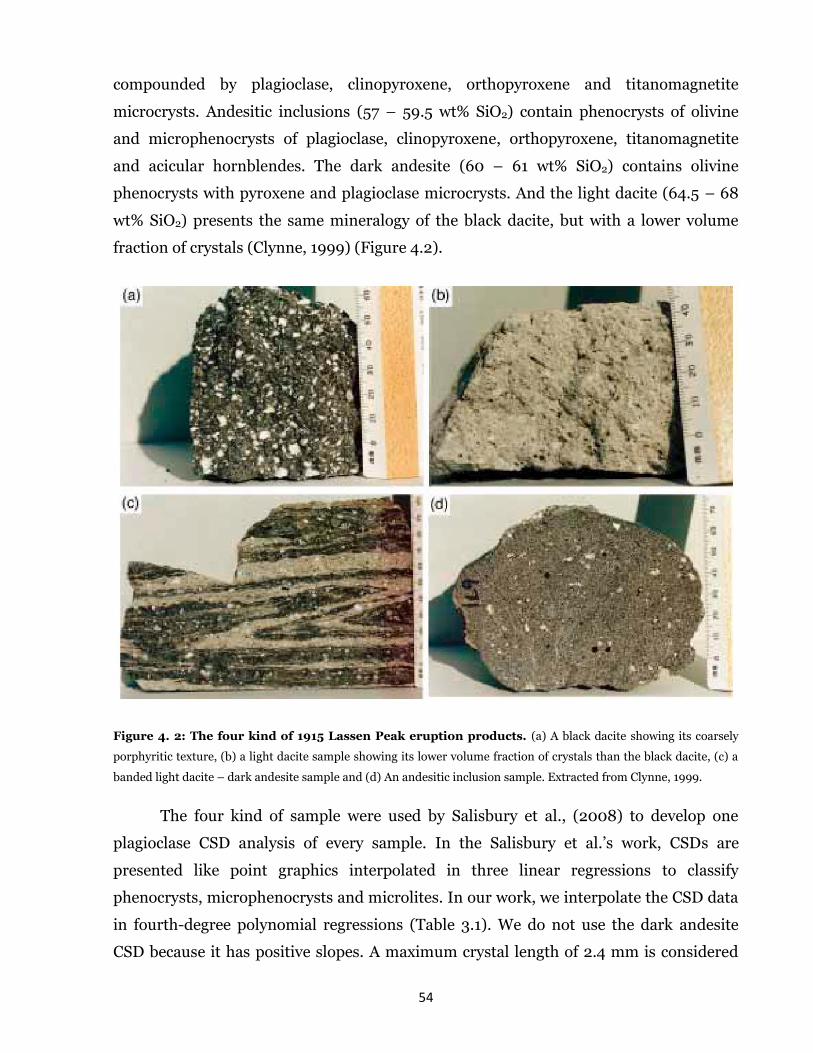
54
compounded by plagioclase, clinopyroxene, orthopyroxene and titanomagnetite
microcrysts. Andesitic inclusions (57 – 59.5 wt% SiO2) contain phenocrysts of olivine
and microphenocrysts of plagioclase, clinopyroxene, orthopyroxene, titanomagnetite
and acicular hornblendes. The dark andesite (60 – 61 wt% SiO2) contains olivine
phenocrysts with pyroxene and plagioclase microcrysts. And the light dacite (64.5 – 68
wt% SiO2) presents the same mineralogy of the black dacite, but with a lower volume
fraction of crystals (Clynne, 1999) (Figure 4.2).
Figure 4. 2: The four kind of 1915 Lassen Peak eruption products. (a) A black dacite showing its coarsely
porphyritic texture, (b) a light dacite sample showing its lower volume fraction of crystals than the black dacite, (c) a
banded light dacite – dark andesite sample and (d) An andesitic inclusion sample. Extracted from Clynne, 1999.
The four kind of sample were used by Salisbury et al., (2008) to develop one
plagioclase CSD analysis of every sample. In the Salisbury et al.’s work, CSDs are
presented like point graphics interpolated in three linear regressions to classify
phenocrysts, microphenocrysts and microlites. In our work, we interpolate the CSD data
in fourth-degree polynomial regressions (Table 3.1). We do not use the dark andesite
CSD because it has positive slopes. A maximum crystal length of 2.4 mm is considered
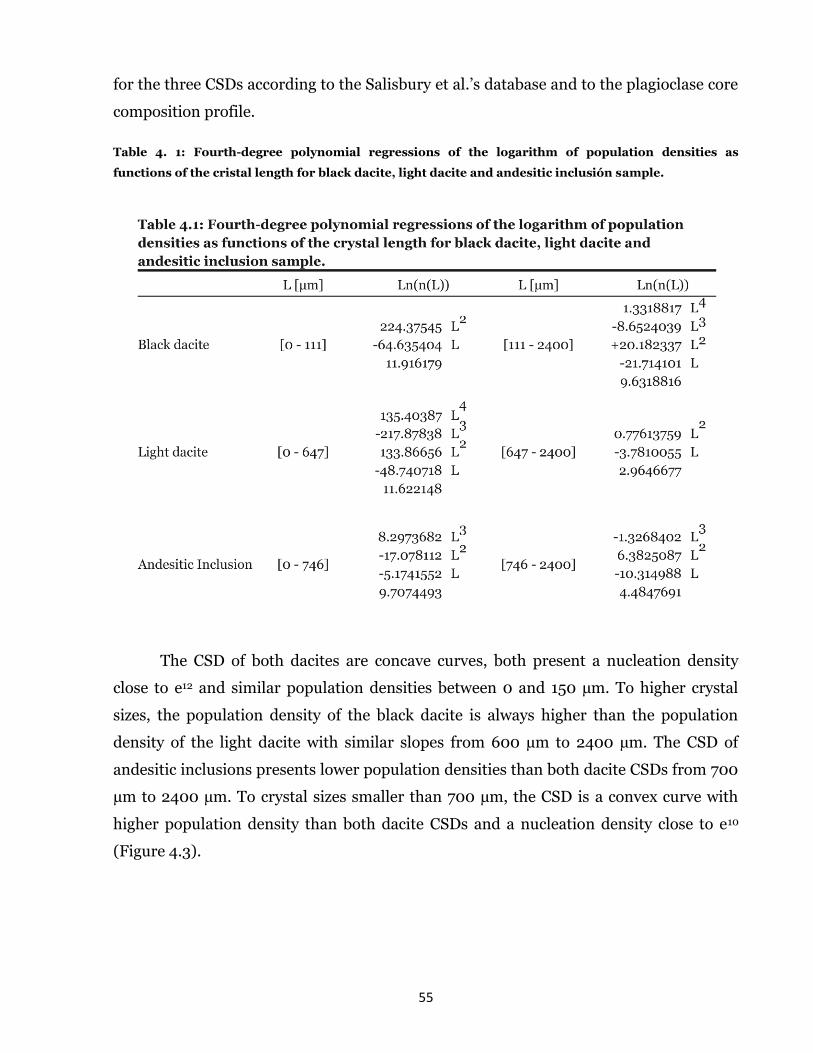
55
for the three CSDs according to the Salisbury et al.’s database and to the plagioclase core
composition profile.
Table 4. 1: Fourth-degree polynomial regressions of the logarithm of population densities as
functions of the cristal length for black dacite, light dacite and andesitic inclusión sample.
The CSD of both dacites are concave curves, both present a nucleation density
close to e12 and similar population densities between 0 and 150 µm. To higher crystal
sizes, the population density of the black dacite is always higher than the population
density of the light dacite with similar slopes from 600 µm to 2400 µm. The CSD of
andesitic inclusions presents lower population densities than both dacite CSDs from 700
µm to 2400 µm. To crystal sizes smaller than 700 µm, the CSD is a convex curve with
higher population density than both dacite CSDs and a nucleation density close to e10
(Figure 4.3).
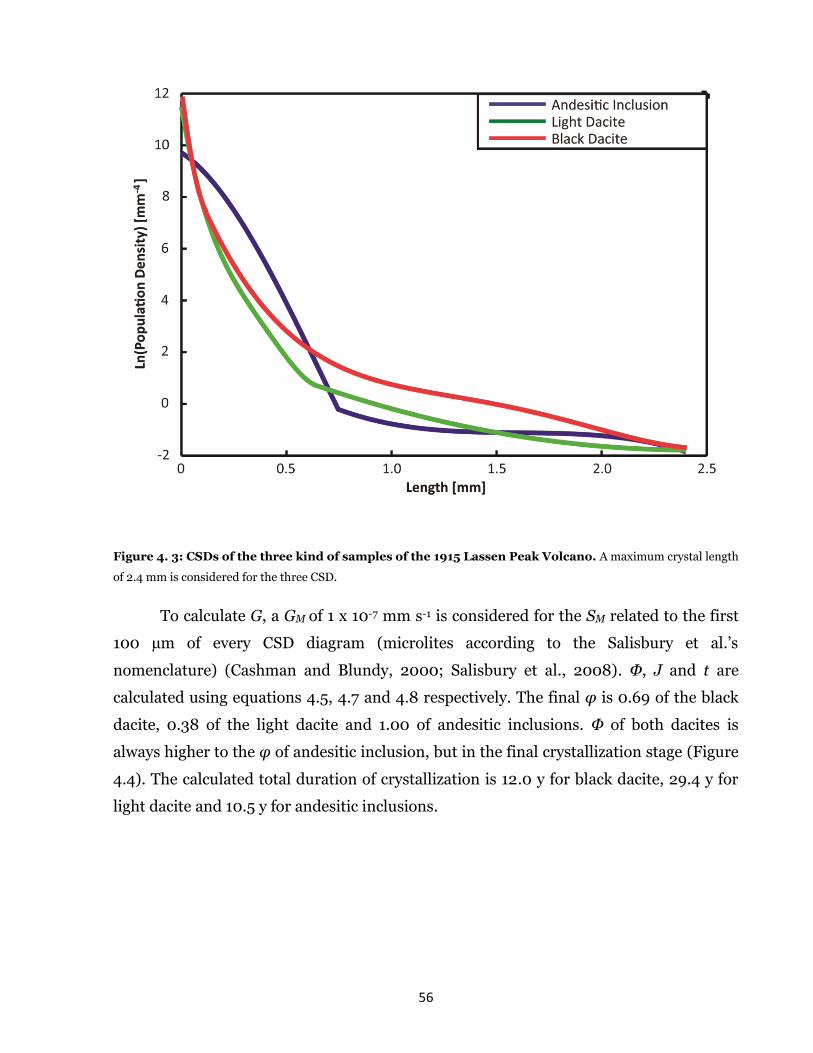
56
Figure 4. 3: CSDs of the three kind of samples of the 1915 Lassen Peak Volcano. A maximum crystal length
of 2.4 mm is considered for the three CSD.
To calculate G, a GM of 1 x 10⁻⁷ mm s-1 is considered for the SM related to the first
100 µm of every CSD diagram (microlites according to the Salisbury et al.’s
nomenclature) (Cashman and Blundy, 2000; Salisbury et al., 2008). Φ, J and t are
calculated using equations 4.5, 4.7 and 4.8 respectively. The final φ is 0.69 of the black
dacite, 0.38 of the light dacite and 1.00 of andesitic inclusions. Φ of both dacites is
always higher to the φ of andesitic inclusion, but in the final crystallization stage (Figure
4.4). The calculated total duration of crystallization is 12.0 y for black dacite, 29.4 y for
light dacite and 10.5 y for andesitic inclusions.
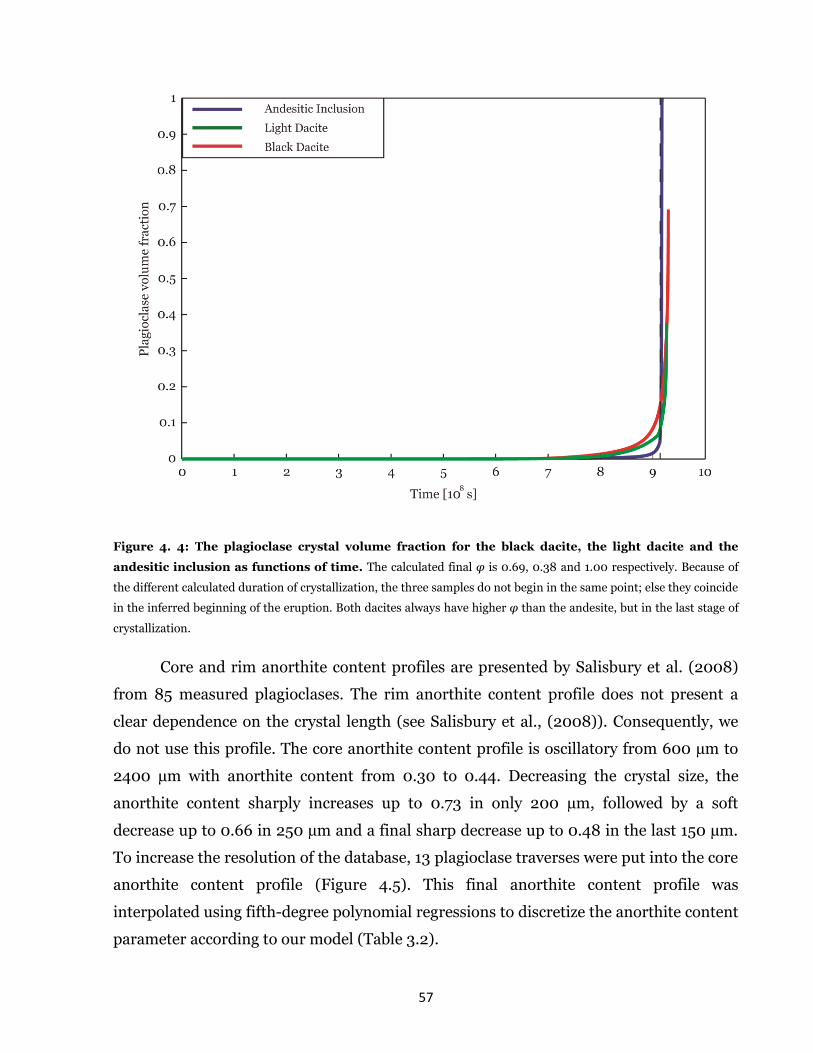
57
Figure 4. 4: The plagioclase crystal volume fraction for the black dacite, the light dacite and the
andesitic inclusion as functions of time. The calculated final φ is 0.69, 0.38 and 1.00 respectively. Because of
the different calculated duration of crystallization, the three samples do not begin in the same point; else they coincide
in the inferred beginning of the eruption. Both dacites always have higher φ than the andesite, but in the last stage of
crystallization.
Core and rim anorthite content profiles are presented by Salisbury et al. (2008)
from 85 measured plagioclases. The rim anorthite content profile does not present a
clear dependence on the crystal length (see Salisbury et al., (2008)). Consequently, we
do not use this profile. The core anorthite content profile is oscillatory from 600 µm to
2400 µm with anorthite content from 0.30 to 0.44. Decreasing the crystal size, the
anorthite content sharply increases up to 0.73 in only 200 µm, followed by a soft
decrease up to 0.66 in 250 µm and a final sharp decrease up to 0.48 in the last 150 µm.
To increase the resolution of the database, 13 plagioclase traverses were put into the core
anorthite content profile (Figure 4.5). This final anorthite content profile was
interpolated using fifth-degree polynomial regressions to discretize the anorthite content
parameter according to our model (Table 3.2).
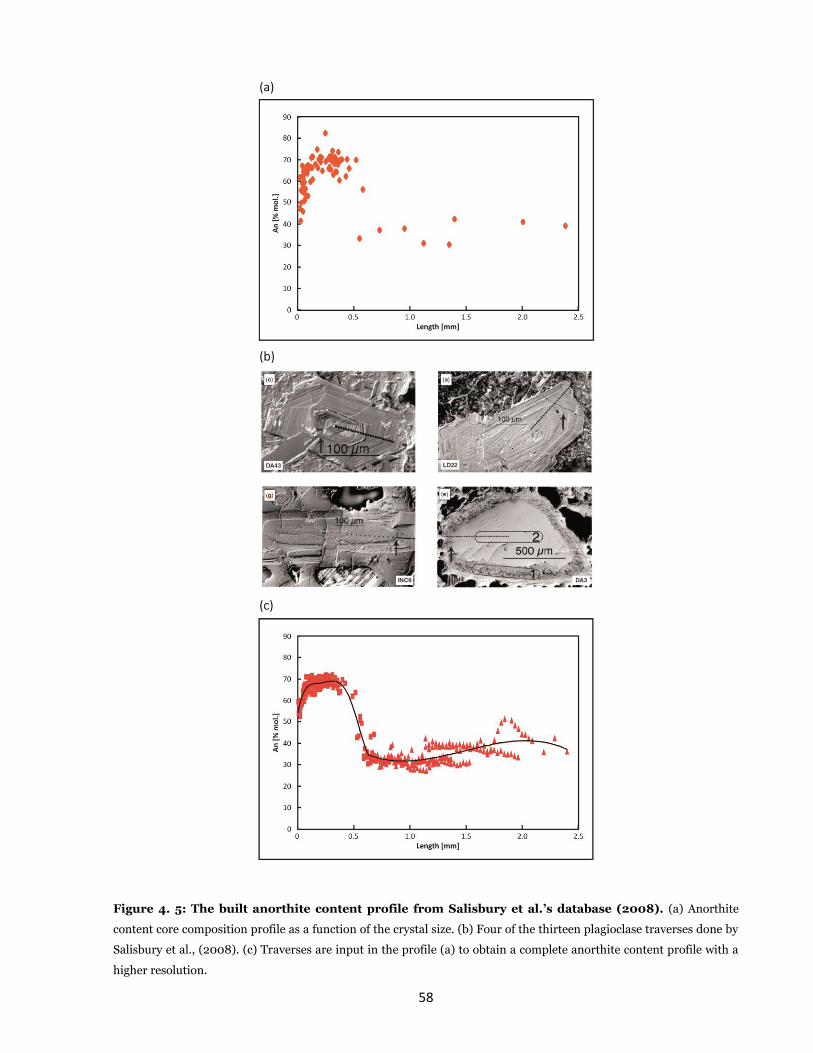
58
Figure 4. 5: The built anorthite content profile from Salisbury et al.’s database (2008). (a) Anorthite
content core composition profile as a function of the crystal size. (b) Four of the thirteen plagioclase traverses done by
Salisbury et al., (2008). (c) Traverses are input in the profile (a) to obtain a complete anorthite content profile with a
higher resolution.
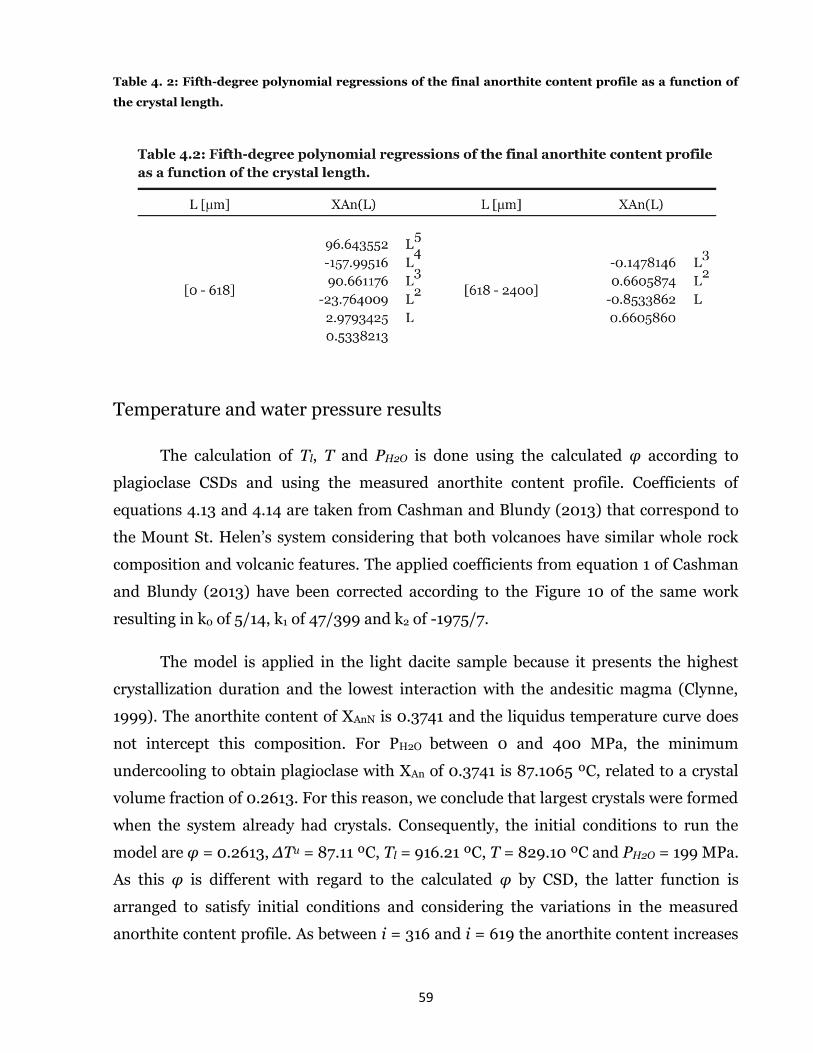
59
Table 4. 2: Fifth-degree polynomial regressions of the final anorthite content profile as a function of
the crystal length.
Temperature and water pressure results
The calculation of Tl, T and PH2O is done using the calculated φ according to
plagioclase CSDs and using the measured anorthite content profile. Coefficients of
equations 4.13 and 4.14 are taken from Cashman and Blundy (2013) that correspond to
the Mount St. Helen’s system considering that both volcanoes have similar whole rock
composition and volcanic features. The applied coefficients from equation 1 of Cashman
and Blundy (2013) have been corrected according to the Figure 10 of the same work
resulting in k0 of 5/14, k1 of 47/399 and k2 of -1975/7.
The model is applied in the light dacite sample because it presents the highest
crystallization duration and the lowest interaction with the andesitic magma (Clynne,
1999). The anorthite content of XAnN is 0.3741 and the liquidus temperature curve does
not intercept this composition. For PH2O between 0 and 400 MPa, the minimum
undercooling to obtain plagioclase with XAn of 0.3741 is 87.1065 ºC, related to a crystal
volume fraction of 0.2613. For this reason, we conclude that largest crystals were formed
when the system already had crystals. Consequently, the initial conditions to run the
model are φ = 0.2613, ΔTu = 87.11 ºC, Tl = 916.21 ºC, T = 829.10 ºC and PH2O = 199 MPa.
As this φ is different with regard to the calculated φ by CSD, the latter function is
arranged to satisfy initial conditions and considering the variations in the measured
anorthite content profile. As between i = 316 and i = 619 the anorthite content increases
60
0.35, we infer that dacitic and andesitic magmas interact in this interval. Consequently,
φ is recalculated as
𝜑𝑚𝑜𝑑𝑒𝑙 = 𝜑𝐶𝑆𝐷 , 𝑖𝜖[1, 315] (4. 15)
𝜑𝑚𝑜𝑑𝑒𝑙 = 𝜑𝐶𝑆𝐷 +0.2613 × (𝑖 − 316)
303, 𝑖𝜖[316, 618] (4. 16)
𝜑𝑚𝑜𝑑𝑒𝑙 = 𝜑𝐶𝑆𝐷 + 0.2613, 𝑖𝜖[619, 2401] (4. 17)
Finally, as the search of a φ(T,PH2O)i very close to the φ(CSD)i could imply high
differences between a T or PH2O and their following steps, a vicinity (v) for the PH2O value
is applied as a function of the variation in the anorthite content in the same interval such
that
𝑣𝑖−1 = 30000 × |𝑋𝐴𝑛𝑖−1 − 𝑋𝐴𝑛𝑖| (4. 18)
𝑃𝐻2𝑂𝑖−1𝜖[𝑃𝐻2𝑂𝑖 − 𝑣𝑖−1; 𝑃𝐻2𝑂𝑖 + 𝑣𝑖−1] (4. 19)
To obtain a better description and interpretation of the thermodynamic database,
the record is divided in numerical stages according to inflections in the PH2O. In a first
stage (i є [2034,2401]) with a duration of 17.8 y, PH2O decreases from 199 MPa to 144
MPa, T increases from 829 ºC to 858 ºC and XAn increases from 0.37 to 0.41. Later, (i є
[1532,2033]) in a second period of 5.9 y, the three thermodynamic parameters returned
to the initial conditions. The third stage (i є [687,1531]) is characterized for a stable PH2O
of 199 MPa, a soft decrease on T from 829 ºC to 819 ºC and a soft decrease on XAn from
0.37 to 0.34 and a duration of 4.8 y. A fourth stage (i є [313,686]) of 223 days of
duration is characterized for a sharp decrease of PH2O from 199 MPa to 76 MPa, a sharp
increase of T from 819 ºC to 959 ºC and a strong increase of XAn from 0.34 to 0.69. In a
fifth stage (i є [112,313]) of 51 days of duration, PH2O decreases from 76 MPa to 64 MPa
and T and XAn are almost stable from 959 ºC to 957 ºC and from 0.69 to 0.67
respectively. The sixth stage lasts 7 days (i є [58,111]), PH2O keeps constant with 64 MPa,

61
T decreases from 957 ºC to 949 ºC and XAn decreases from 0.67 to 0.64. Finally, the
seventh stage lasts 6 days (i є [1,57]), characterized for a higher decrease of T from 949
ºC to 914 ºC and a higher decrease of XAn from 0.64 to 0.53 (Figure 4.6).
Interpretation
The 1915 Lassen Peak Volcano eruption is characterized by at least two heating
events previous to the eruption, a first one of 29 ºC and a second one very higher than
the former of 140ºC. Indeed, the crystallization temperature during last stages is higher
than in reservoir. In both heating events, plagioclase crystals grew around 350 µm, the
water pressure decreases 50 MPa and 135 MPa and XAn sharply increases 0.04 and 0.35
respectively. The beginning of the stage 1 and the whole stage 3 reveal the stable
conditions of the dacitic reservoir of the Lassen Peak Volcano: a water pressure of 200
MPa, a temperature between 820 ºC and 830 ºC crystallizing albitic plagioclases with
anorthite content from 0.34 to 0.37 and a maximum crystal size of almost 1 mm.
Supposing water saturation in stable conditions and without considering the pressure of
other volatiles, the depth of the dacitic reservoir is of at least 7 km that is consistent with
previous studies (Guffanti and Weaver, 1988; Pitt et al., 2002). Textural features
indicate that the second heating is due to an incomplete magma mixing between the
dacitic and an andesitic melts (Clynne, 1999). The fifth stage shows the stable conditions
after the andesite input with a water pressure between 64 MPa and 76 MPa, and XAn and
T almost stables around 0.68 and 958 ºC respectively. The sixth stage would show the
magma ascent stage with a decrease of T and XAn of 10 ºC and 0.03 respectively forming
regrowth rims of 60 µm. Finally, the last stage show a short period of surface
crystallization characterized by a decrease of 35 ºC and a variation of XAn from 0.64 to
0.53 forming a rim of 55 µm.

62
Figure 4. 6: Water pressure [MPa], Temperature [ºC] and anorthite content as functions of the
plagioclase crystal length. The time advances leftward according to the applied parameterization. Dashed lines
highlight the inferred magmatic stages based on inflections in the water pressure curve.
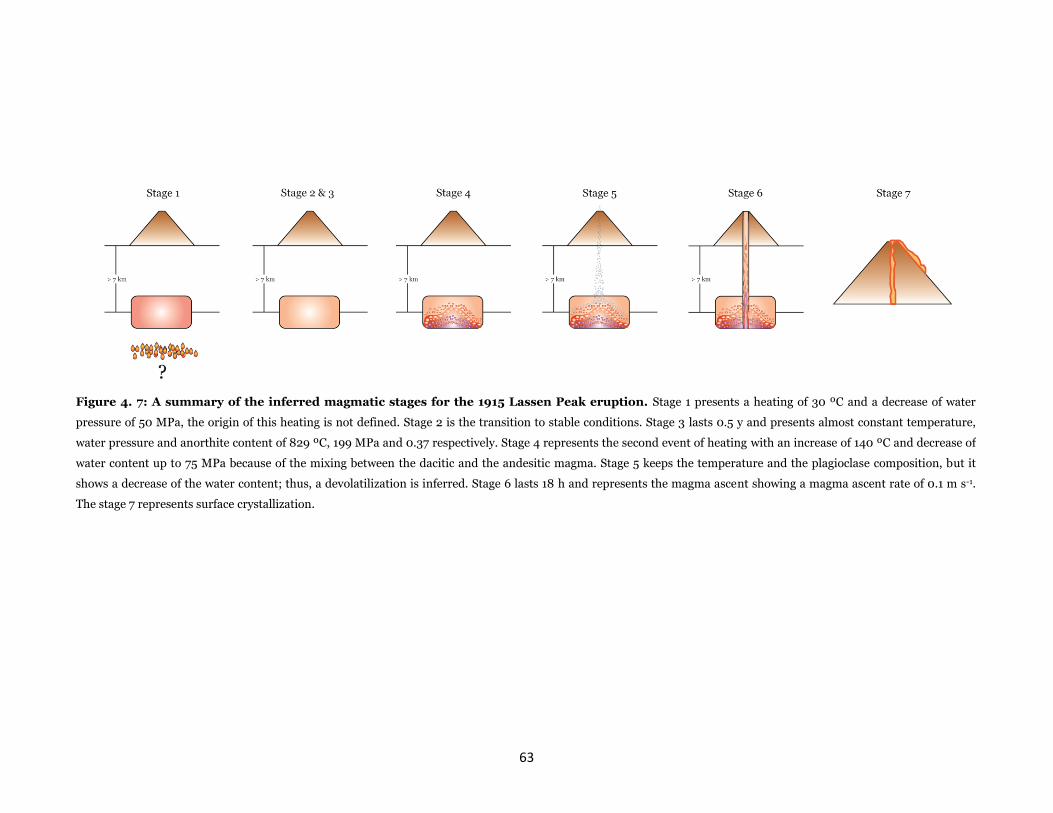
63
Figure 4. 7: A summary of the inferred magmatic stages for the 1915 Lassen Peak eruption. Stage 1 presents a heating of 30 ºC and a decrease of water
pressure of 50 MPa, the origin of this heating is not defined. Stage 2 is the transition to stable conditions. Stage 3 lasts 0.5 y and presents almost constant temperature,
water pressure and anorthite content of 829 ºC, 199 MPa and 0.37 respectively. Stage 4 represents the second event of heating with an increase of 140 ºC and decrease of
water content up to 75 MPa because of the mixing between the dacitic and the andesitic magma. Stage 5 keeps the temperature and the plagioclase composition, but it
shows a decrease of the water content; thus, a devolatilization is inferred. Stage 6 lasts 18 h and represents the magma ascent showing a magma ascent rate of 0.1 m s-1.
The stage 7 represents surface crystallization.

64
Considering the sixth stage as the magma ascent stage, the calculated magma
ascent rate is of at least 0.01 m s-1 that is one order of magnitude smaller than calculated
by previous studies (e.g., Rutherford, 2008). Consequently, we think that the applied
mean plagioclase growth rate of 1 x 10⁻⁷ mm s-1 for plagioclase microcrysts by Salisbury
et al. (2008) would be underestimated in one order of magnitude and then, the
crystallization process previous to the 1915 Lassen Peak eruption would last 3 y and not
30 y. Thus, the duration of the first stage would last 1.8 y and the calculated G and J
would vary from 10-9 mm s-1 to 10-8 mm s-1 and from 10-9.5 mm-4 s-1 to 10-8 mm-4 s-1 which
are consistent values for crystallization in reservoirs (e.g., Morgan et al., 2006).
Moreover, the magma ascent and the surface crystallization stages would last 18 h and 14
h respectively which are more consistent for explosive eruptions (e.g., Rutherford, 2008)
and calculated crystallization rates are around 10-6 mm s-1 for G and 10-1.5 mm-4 s-1 for J.
Discussion
The use of plagioclase composition
Our model use the major elements of plagioclase due to several reasons: 1.
Plagioclase displays a wide compositional range from basalts to rhyolites in extrusive
rocks and from gabbros to granites in intrusive rocks. Consequently, our model can be
used for any whole rock composition. 2. The geochemical structure of plagioclase
consists in a simple binary solid solution with coupled substitution. The former feature
allows the obtaining of a simple index comparable with other physical parameters and
the latter index assures that major elements do not remobilize later of the closure of the
system (e.g., Costa et al., 2003; Costa and Chackaborty, 2004). 3. Major elements of
plagioclase are sensitive to whole rock composition, temperature and water pressure.
Then, it is not needed the use of partition or diffusion coefficients or trace elements to
complement our model.
The coupling of anorthite content to the calculation of crystallization rates by
Crystal Size Distribution increases the resolution for deciphering magmatic stages with
regard to previous semi-quantitative advances (e.g., Salisbury et al., 2008; Vinet and
Higgins, 2010; 2011). For example, Salisbury et al., (2008) infer three stages based on
qualitative analysis of plagioclase CSD and composition profiles and our study infer
65
seven. Particularly, our study allows distinguish between magma ascent and surface
crystallization inside the complete syn-eruptive stage and it allows distinguish
mechanical processes such as heating or magma mixing during pre-eruptive stages.
Calibration of thermodynamic constants
To use equations from 4.12 to 4.14, the thermodynamic parameters should be
calibrated for different igneous systems due to the different dependence of the
plagioclase composition to temperature or water content if the whole melt composition
varies. A good example is the comparison between the plagioclase composition –
temperature relationship shown by Schmidt et al., (2008) for primitive basalts and the
plagioclase composition – temperature relationship shown by Rutherfore and Devine
(2008) for dacites, both belonging to the Cascade Range. Later of the calibration,
resulting crystallization temperature, liquidus temperature and water pressure are
output as functions of the plagioclase crystal size and the time due to the parallel CSD
analysis, allowing showing the evolution of thermodynamic parameters and easing the
exhibition of a sequentially interpretation of magmatic processes. The water pressure
can be easily converted to water content using numerical thermodynamic softwares (e.g.,
Newman and Lowenstern, 2002).
Analytical errors
The analytical errors of our coupled model can be divided from its two sources:
error from the CSD analysis and error from the thermodynamic acquirement. The
former presents two main sources of error: 1. The counting error related to potential
differences between measurements of a same crystal that is more significant for crystal
sizes with smaller population densities and 2. The related error to the method used to
the stereological conversion.
The thermodynamic procedure presents X main sources of error: 1. The analytical
error related to the acquisition of plagioclase composition. 2. The r2 belonging to the
polynomial regressions to create the final anorthite content profile. 3. The related error
to the numerical method to calibrate the thermodynamic coefficients.
66
Conclusion
The presented model combines the Crystal Size Distribution analysis with the
anorthite content in plagioclase to constrain magmatic processes with a higher
resolution than using only quantitative textural analysis. Crystal Size Distributions allow
calculate crystallization kinetic parameter as functions of the crystal size and the
anorthite content is intrinsically a function of the crystal size.
Previous works have shown that as crystal kinetic parameters such as the crystal
growth rate, the crystal nucleation rate and the volume fraction of crystals as the
plagioclase composition are functions of thermodynamic parameters such as the
temperature and the water pressure (e.g., Spohn et al., 1988; Hort, 1997; Rutherford and
Devine, 2008). Thus, both thermodynamic parameters can be calculated as functions of
the crystal size through the calculation of kinetic parameters by CSD and the
measurement of the anorthite content in plagioclase.
The presented model was applied in the volcanic products of the 1915 Lassen Peak
volcano eruption giving one heating process followed by a stable stage of the dacitic
reservoir that show PH2O of 200 MPa, T of 830 ºC forming plagioclase of XAn = 0.37. The
stable stage is followed by a strong heating due to a magma mixing between the dacitic
magma and an andesitic magma that changes the thermodynamic conditions to PH2O of
76 MPa, T of 959 ºC forming plagioclase of XAn = 0.68. The eruption is preceded by a
short stage of devolatilization and followed by a surface crystallization stage. As a
summary, a record of seven stages is measured due to the coupling of CSD analysis and
plagioclase composition.
Secondarily, as the water pressure is constant during the stable stage, water
saturation is assumed giving a minimum depth of the dacitic reservoir of 7 km. The
magma ascent lasts 18 hours according to the CSD calculation implying a magma ascent
rate of 0.1 m s-1.
67
Capítulo 5
Resumen y conclusiones
El presente trabajo ha presentado el diagnóstico de diversos problemas en el
procedimiento para realizar análisis Crystal Size Distributions: 1. Convencionalmente,
se parametriza el eje de tamaño de cristal usando una distribución logarítmica siendo
que la densidad de población de cristales es la derivada de la distribución acumulada de
tamaños de cristales, la que es una función continua y derivable, por lo tanto, no necesita
ser discretizada, 2. Se realiza una conversión estereológica de los datos en 2 dimensiones
para convertirlos a datos en 3 dimensiones suponiendo que todos los cristales presentan
la misma razón de aspecto y que cumplen funciones probabilísticas de corte; no
obstante, la razón de aspecto es función del undercooling y de la tasa de enfriamiento y
empíricamente, los cristales en rocas ígneas no siguen tendencias ordenadas. 3. Las tasas
de nucleación y crecimiento de cristales calculadas a partir de CSD con los modelos de
Open System, Batch System o inversión de CSD entregan ambas tasas constantes, tasa
de crecimiento constante y tasa de nucleación crecientemente exponencial o tasa de
crecimiento decrecientemente exponencial y tasa de nucleación crecientemente
exponencial con respecto al tiempo respectivamente; no obstante, las tasas de
crecimiento y nucleación calculadas numérica y experimentalmente considerando la
energía de activación necesaria para nuclear y crecer presentan distribuciones con forma
de campana y asimétricas, encontrándose el pico de la tasa de crecimiento siempre
previo al de nucleación.
Para solucionar este problema, se ha creado un modelo de obtención de
diagramas de CSD basado en el análisis de la curva de distribución acumulada de
tamaños de cristales, usando los tamaños de largo y área medidos en 2 dimensiones,
entendiendo la curva como una función continua y derivable. Por lo tanto, se utiliza una
función error para modelarla. El CSD obtenido es corregido desplazando la densidad de
población de cristales tal que la fracción volumétrica de cristales calculada sea igual a la
fracción de área de cristales medida. El resultado es un CSD convexo el cual es
parametrizado para la aplicación de un modelo de inversión de CSD para el cálculo de
tasas de crecimiento y nucleación entendiendo que los cristales más largos son más
68
antiguos (por lo tanto, el eje tiempo avanza hacia la izquierda en un CSD) y que la tasa
de crecimiento es proporcional al negativo de la pendiente del CSD. Las tasas de
crecimiento y nucleación de cristales obtenidos presentan curvas de distribución
gaussiana asimétricas con respecto al tiempo, encontrándose siempre el pico de la tasa
de crecimiento previo al de la tasa de nucleación tal como registran modelos numéricos y
experimentales y la fracción volumétrica de cristales presenta curvas sigmoidales tal
como modelos numéricos y experimentales lo han presentado.
Este modelo fue aplicado en un sistema ígneo extrusivo y en un sistema ígneo
intrusivo: lavas de 1971 del Volcán Villarrica y cuarzo-monzodioritas del Plutón La
Gloria, respectivamente. En el primer caso, se entrega un CSD con un kink, que separa
microlitos de fenocristales, ubicado en una posición coherente con lo observado
texturalmente cualitativamente. Los diagramas de ambas tasas de cristalización con
respecto al tiempo muestran claramente como una erupción, como evento instantáneo,
aumenta la tasa de crecimiento en dos órdenes de magnitud y la de nucleación en 8
órdenes de magnitud y como la fracción volumétrica de cristales se duplica en la fase
syn-eruptiva respecto a la fase pre-eruptiva. Los tiempos calculados son de 7 años para la
fase pre-eruptiva y 17 días para la fase syn-eruptiva. El primer tiempo coincide con el
desfase entre esta y su erupción previa (1964) dejando abierta la hipótesis de contener
cristales heredados del ciclo eruptivo anterior. El segundo tiempo es alto para
corresponder únicamente a ascenso y cristalización en superficie.
En el segundo caso, se entrega un CSD convexo ya que se consideró cristalización
continua. Este ejemplo ilustra muy bien las distribuciones gaussianas asimétricas de
ambas tasas de cristalización y una distribución sigmoidal de la fracción volumétrica de
cristales con respecto al tiempo. Esta última curva es dividida en 3 etapas según sus
inflexiones: 1. Una etapa de muy bajo incremento de la fracción volumétrica de cristales
la que coincide con el pico de la tasa de crecimiento lo que evidencia que al no
considerarse antecristales, el aumento de la fracción volumétrica es lento, 2. Una etapa
de crecimiento muy fuerte de la fracción volumétrica de cristales que coincide con el pico
de la tasa de nucleación de cristales evidenciando la mayor dependencia de la fracción
volumétrica a la nucleación que al crecimiento de cristales, 3. Un descenso en el
incremento de la fracción volumétrica de cristales debido a la disminución del espacio
disponible para nuclear nuevos cristales o para recrecer los antiguos.

69
Luego de la obtención de tasas de crecimiento y nucleación y de la fracción
volumétrica de cristales similares a los esperables, el CSD seguiría sin poder distinguir
procesos magmáticos con una alta resolución, por ejemplo: no distingue entre la fase de
ascenso de magma y la de cristalización en superficie dentro de la fase syn-eruptiva; o no
distingue procesos mecánicos en reservorio tales como mezcla de magma o cristalización
en multireservorios para la fase pre-eruptiva.
Basado en que tanto los parámetros cinéticos de cristalización como el contenido
de anortita en plagioclasa son función de la temperatura y de la presión de agua estos
últimos pueden ser calculados si se cuenta con los primeros. Para esto se utiliza la
relación de la fracción volumétrica de cristales con el undercooling, la temperatura
liquidus se expresa como un polinomio de la presión de agua y el contenido de anortita
como función de lineal de la temperatura y de la presión de agua.
Estas bases numéricas son aplicadas para la erupción de 1915 del Volcán Lassen
ubicado en la Cordillera Cascadia ubicada en la costa oeste de Estados Unidos utilizando
los CSDs y el perfil del contenido de anortita en plagioclasa desarrollado por Morgan
Salisbury y colaboradores (2008). Los resultados entregan que se requiere de una
fracción volumétrica de cristales mínima de 0.26 al inicio del proceso. Se registran dos
procesos de calentamiento previos a la erupción: el primero de 30 ºC y el segundo de 140
ºC. Además, existe una fase muy estable previa al segundo calentamiento que registra
una presión de agua de 200 MPa, una temperatura de 830 ºC generando plagioclasas
con contenido de anortita de 0.37. Dada la estabilidad y suponiendo que el agua no es el
único volátil que se encuentra en el sistema, se entiende saturación del agua y, por ende,
presión litostática igual a presión de fluidos. En consecuencia, se fija una cota mínima de
200 MPa de presión litostática del reservorio dacítico correspondiente a unos 7 km de
profundidad, resultado coherente a estudios previos. Posterior al segundo
calentamiento, la temperatura se estabiliza, pero la presión de agua disminuye por lo que
se interpreta como una fase de desvolatilización justo previa a la erupción. Se calcula un
ascenso magmático de 18 horas, lo que correspondería a una tasa de ascenso magmático
mínima de aproximadamente 0.11 m s-1, resultado coherente con erupciones explosivas
dacíticas. El tiempo total del proceso de cristalización registrado son aproximadamente,
3 años.
70
La aplicación de nuestro modelo confirma que el acoplamiento del cálculo de
parámetros cinéticos de cristalización con la composición de los mismos minerales
permite la obtención de una evolución petrológica de sistemas magmáticos de gran
resolución con que es posible distinguir procesos magmáticos pre-eruptivos tales como
calentamiento, mezcla de magma y devolatilización y es posible distinguir procesos
magmáticos syn-eruptivos tales como ascenso de magma y cristalización en superficie.
71
Bibliografía
Albarede, F. (1993). Residence time analysis of geochemical fluctuations in volcanic
series. Geochimica et Cosmochimica Acta 57, 615-621.
Allègre, C. J., Provost, A. & Jaupart, C. (1981). Oscillatory zoning: a pathological case of
cristal growth. Nature 294, 223–228.
Armienti, P., Francalanci, L. & Landi, P. (2007). Textural effects of steady state
behaviour of the Stromboli feeding system. Journal of Volcanology and Geothermal
Research 160, 86–98.
Armienti, P., Pareschi, M. T., Innocenti, F. & Pompilio, M. (1994). Effects of magma
storage and ascent on the kinetics of cristal growth. The case of the 1991-93 Mt. Etna
eruption. Contributions to Mineralogy and Petrology 115, 402–414.
Avrami, M. (1939). Kinetics of phase change I. General theory. Journal of Chemical
Physics 7, 1103–1112.
Avrami, M. (1940). Kinetics of phase change II. Transformation-time relation for
random distribution of nuclei. Journal of Chemical Physics 8, 211–224.
Bachmann, O & Bergantz, G. W. (2004). On the origin of crystal-poor rhyolites:
extracted from batholitic crystal mushes. Journal of Petrology 45, 1565–1582.
Blundy, J. & Cashman, K. V. (2005). Rapid decompression-driven crystallization
recorded by melt inclusions from Mount St. Helens volcano. Geology 33, 793-796.
Blundy, J., Cashman, K., Humphreys, M. (2006). Magma heating by decompression-
driven crystallization beneath andesite volcanoes. Nature 443, 76–80.
Bouvet de Maisonneuve, C., Dungan, M. A., Bachmann, O. & Burgisser, A. (2012).
Insights into shallow magma storage and crystallization at Volcán Llaima (Andean
Southern Volcanic Zone, Chile). Journal of Volcanology and Geothermal Research 211-
212, 76–91.
72
Bouvet de Maisonneuve, C., Dungan, M. A., Bachmann, O. & Burgisser, A. (2013).
Petrological insights into shifts in eruptive styles at Volcán Llaima (Chile). Journal of
Petrology 54, 393–420.
Bowen, N. L. (1913). The melting phenomena of the plagioclase feldspars. American
Journal of Science 35, 577-599.
Cashman, K. & Blundy, J. (2013). Petrological cannibalism: the chemical and textural
consequences of incremental magma body growth. Contributions to Mineralogy and
Petrology 166, 703–729.
Cashman, K. V. (1992). Groundmass crystallization of Mount St. Helens dacite, 1980 –
1986: a tool for interpreting shallow magmatic processes. Contributions to Mineralogy
and Petrology 109, 431–449.
Cashman, K. V. (1993). Relationship between plagioclase crystallization and cooling rate
in basaltic melts. Contributions to Mineralogy and Petrology 113, 126–142.
Cashman, K. V., Thornber, C. & Kauahikaua, J. P. (1999). Cooling and crystallization of
lava in open channels, and the transition of Pahoehoe Lava to ‘A’a. Bulletin of
Volcanology 61, 306-323.
Cashman, K. V. & Blundy, J. (2000). Degassing and crystallization of ascending andesite
and dacite. Philosophical Transactions of the Royal Society of London 358, 1487-1513.
Cashman, K. V. & Marsh, B. D. (1988). Crystal size distribution (CSD) in rocks and the
kinetics and dynamics of crystallization II: Makaopuhi lava lake. Contributions to
Mineralogy and Petrology 99, 292–305.
Clynne, M. A. (1990). Stratigraphic, lithologic, and major element geochemical
constraints on magmatic evolution at Lassen volcanic center, California. Journal of
Geophysical Research 95, 19651-19669.
Clynne, M. A. (1999). A complex magma mixing origin for rocks erupted in 1915, Lassen
Peak, California. Journal of Petrology 40, 105-132.
73
Condomines, M., Hemond, C. & Allegre, C. J. (1988). U–Th–Ra radioactive disequilibria
and magmatic processes. Earth and Planetary Science Letters 90, 243–262.
Cornejo, P. C. & Mahood, G. A. (1997). Seeing past the effects of re-equilibration to
reconstruct magmatic gradients in plutons: La Gloria Pluton, central Chilean Andes.
Contributions to Mineralogy and Petrology 127, 159–175.
Costa, F. & Chakraborty, S. (2004). Decadal time gaps between mafic intrusion and
silicic eruption obtained from chemical zoning patterns in olivine. Earth and Planetary
Science Letters 227, 517-530.
Costa, F., Chakraborty, S. & Dohmen, R. (2003). Diffusion coupling between trace and
major elements and a model for calculation of magma residence times using plagioclase.
Geochimica et Cosmochimica Acta 67, 2189-2200.
Couch, S., Sparks, R. S. J. & Carroll, M. R. (2003). The kinetics of degassing-induced
crystallization at Soufriere Hills Volcano, Montserrat. Journal of Petrology 44, 1477-
1502.
Crisp, J., Cashman, K. V., Bonini, J. A., Hougen, S. B. & Pieri, D. C. (1994).
Crystallization history of the 1984 Mauna Loa lava flow. Journal of Geophysical
Research 99, 7177-7198.
Davidson, J., Tepley, F., Palacz, Z. & Meffan-Main, S. (2001). Magma recharge,
contamination and residence times revealed by in situ laser ablation isotopic analysis of
feldspar in volcanic rocks. Earth and Planetary Science Letters 184, 427-442.
Eberl, D. D., Drits, V. A. & Srodon, J. (1998). Deducing growth mechanisms for minerals
from the shapes of crystal sizes distributions. American Journal of Science 298, 499–
533.
Eberl, D. D., Kile, D. E. & Drits, V. A. (2002). On geological interpretations of crystal size
distributions: Constant vs proportionate growth. American Mineralogist 87, 1235–1241.
Ernst, R. E., Fowler, A. D. & Pearce, T. H. (1988). Modelling of igneous fractionation and
other processes using Pearce diagrams. Contributions to Mineralogy and Petrology
100, 12–18.
74
Ghiorso, M. S. & Sack, R. O. (1995). Chemical mass transfer in magmatic processes IV, A
revised and internally consistent thermodynamic model for the interpolation and
extrapolation of liquid-solid equilibria in magmatic systems at elevated temperatures
and pressures. Contributions to Mineralogy and Petrology 119, 197–212.
Gorokhova, N. V. & Melnik, O. E. (2010). Modeling of the Dynamics of Diffusion Crystal
Growth from a Cooling Magmatic Melt. Fluid Dynamics 45, 679–690.
Guffanti, M. & Weaver, C. S. (1988). Distribution of Late Cenozoic Volcanic Vents in the
Cascade Range: Volcanic Arc Segmentation and Regional Tectonic Considerations.
Journal of Geophysical Research 93, 6513–6529.
Gutierrez, F., Payacan, I., Gelman, S. E., Bachmann, O. & Parada, M. A. (2013). Late-
stage magma flow in a shallow felsic reservoir: merging the anisotropy of magnetic
susceptibility record with numerical simulations in La Gloria Pluton, central Chile.
Journal of Geophysical Research 118, 1984–1998.
Hammer, J. E., Cashman, K. V., Hoblitt, R. P. & Newman, S. (1999). Degassing and
microlite crystallization during pre-climactic events of the 1991 eruption of Mt.
Pinatubo, Philippines. Bulletin of Volcanology 60, 355-380.
Hawkesworth, C. J., Blake, S., Evans, P., Hughes, R., Macdonald, R., Thomas, L. E.,
Turner, S. P. & Zellmer, G. (2000). Time Scales of Crystal Fractionation in Magma
Chambers – Integrating Physical, Isotopic and Geochemical Perspectives. Journal of
Petrology 41, 991-1006.
Hawkesworth, C., George, R., Turner, S. & Zellmer, G. (2004). Time scales of magmatic
processes. Earth and Planetary Science Letters 218, 1-16.
Higgins, M. D. (1996). Magma dynamics beneath Kameni volcano, Greece, as revealed
by crystal size and shape measurements. Journal of Volcanology and Geothermal
Research 70, 37–48.
Higgins, M. D. (2000). Measurements of crystal size distributions. American
Mineralogist 85, 1105–1116.

75
Higgins, M. D. (2002a). Closure in crystal size distributions (CSD), verification of CSD
calculations, and the significance of CSD fans. American Mineralogist 87, 171–175.
Higgins, M. D. (2002b). A crystal size-distribution study of the Kiglapait layered mafic
intrusion, Labrador, Canada: evidence for textural coarsening. Contributions to
Mineralogy and Petrology 144, 314–330.
Higgins, M. D. (2006). Quantitative Textural Measurements in Igneous and
Metamorphic Petrology. Cambridge University Press, 265 pp.
Higgins, M. D. & Roberge, J. (2003). Crystal Size Distribution of Plagioclase and
Amphibole from Soufrière Hills Volcano, Montserrat: Evidence for Dynamic
Crystallization-Textural Coarsening Cycles. Journal of Petrology 44, 1401–1411.
Holland, T. & Powell, R. (2003). Activity-composition relations for phases in petrological
calculations: an asymmetric multicomponent formulation. Contributions to Mineralogy
and Petrology 145, 492–501.
Hort, M. (1997). Cooling and crystallization in sheet-like magma bodies revisited.
Journal of Volcanology and Geothermal Research 76, 297–317.
Hort, M. & Spohn, T. (1991). Crystallization calculations for a binary melt cooling at
constant rates of heat removal: implications for the crystallization of magma bodies.
Earth and Planetary Science Letters 107, 463–474.
Jerram, D. A., Cheadle, M. J., Hunter, R. H. & Elliott, M. T. (1996). The spatial
distribution of grains and crystals in rocks. Contributions to Mineralogy and Petrology
125, 60–74.
Jerram, D. A. & Higgins, M. D. (2007). 3D Analysis of rock textures: Quantifying igneous
microstructures. Elements 3, 239–245.
Kirkpatrick, J. R. (1976). Towards a kinetic model for the crystallization of magma
bodies. Journal of geophysical research 81, 2565–2571.
76
Kirkpatrick, R. J., Klein, L., Uhlmann, D. R. & Hays, J. F. (1979). Rates and Processes of
crystal growth in the system Anorthite-Albite. Journal of Geophysical Research 84,
3671–3676.
Lange, R. A., Frey, H. M. & Hector, J. (2009). A thermodynamic model for the
plagioclase-liquid hygrometer/thermometer. American Mineralogist 94, 494–506.
Lasaga, A. C. (1982). Toward a master equation in crystal growth. American Journal of
Science 282, 1264–1288.
L’Heureux, I. (1993). Oscillatory zoning in crystal growth: A constitutional undercooling
mechanism. Physical Review E. 48, 4460–4469.
L’Heureux, I. & Fowler, A. D. (1996). Dynamical model of oscillatory zoning in
plagioclase with nonlinear partition relation. Geophysical Research Letters 23, 17–20.
Lofgren, G. E. (1974). An experimental study of plagioclase crystal morphology:
isothermal crystallization. American Journal of Science 274, 243–273.
Lohmar, S., Parada, M., Gutierrez, F., Robin, C. & Gerbe, M. C. (2012). Mineralogical
and numerical approaches to establish the pre-eruptive conditions of the mafic Licán
Ignimbrite, Villarrica Volcano (Chilean Southern Andes). Journal of Volcanology and
Geothermal Research 235-236, 55–69.
Maaloe, S., Tumyr, O. & James, D. (1989). Population density and zoning of olivine
phenocrysts in tholeiites from Kauai, Hawaii. Contributions to Mineralogy and
Petrology 101, 176–186.
Marsh, B. D. (1981). On the crystallinity, probability of occurrence, and rheology of lava
and Magma. Contributions to Mineralogy and Petrology 78, 85–98.
Marsh, B. D. (1988). Crystal size distribution (CSD) in rocks and the kinetics and
dynamics of crystallization I: Theory. Contributions to Mineralogy and Petrology 99,
277–291.
Marsh, B. D. (1996). Solidification fronts and magmatic evolution. Mineralogical
Magazine 60, 5–40.
77
Marsh, B. D. (1998). On the Interpretations of Crystal Size Distributions in Magmatic
Systems. Journal of Petrology 39, 553–599.
Mastrolorenzo, G. & Pappalardo, L. (2006). Magma degassing and crystallization
processes during eruptions of high-risk Neapolitan-volcanoes: Evidence of common
equilibrium rising processes in alkaline magmas. Earth and Planetary Science Letters
250, 164–181.
Melnik, O. E., Blundy, J. D., Rust, A. C. & Muir, D. D. (2011). Subvolcanic plumbing
systems imaged through crystal size distributions. Geology 39, 403–406.
Mock, A. & Jerram, D. A. (2005). Crystal Size Distributions (CSD) in three dimensions:
Insights from the 3D reconstruction of a highly porphyritic rhyolite. Journal of
Petrology 46, 1525–1541.
Moitra, P., Gonnermann, H. M., Houghton, B. F. & Giachetti, T. (2013). Relating vesicle
shapes in pyroclasts to eruption styles. Bulletin of Volcanology 75, 691-704.
Moreno, H. & Clavero, J. (2006). Geología del volcán Villarrica, Regiones de La
Araucanía y de Los Lagos. Servicio Nacional de Geología y Minería, Carta Geológica de
Chile, Serie Geología Básica, No. 98, 35 pp.
Morgan, D. J. & Blake, S. (2006). Magmatic residence times of zoned phenocrysts:
introduction and application of the binary element diffusion modeling (BEDM)
technique. Contributions to Mineralogy and Petrology 151, 58–70.
Morgan, D. J., Blake, S., Rogers, N. W., DeVivo, B., Rolandi, G., Macdonald, R. &
Hawkesworth, C. J. (2004). Time scales of crystal residence and magma chamber
volume from modelling of diffusion profiles in phenocrysts: Vesuvius 1944. Earth and
Planetary Science Letters 222, 933–946.
Morgan, D. J. & Jerram, D. A. (2006). On estimating crystal shape for crystal size
distribution analysis. Journal of Volcanology and Geothermal Research 154, 1-7.
Mujin, M. & Nakamura, M. (2014). A nanolite record of eruption style transition.
Geology 42, 611–614.
78
Muncill, G. E. & Lasaga, A. C. (1987). Crystal-growth kinetics of plagioclase in igneous
system: One-atmosphere experiments and applications of a simplified growth model.
American Mineralogist 72, 299–311.
Murphy, M. D., Sparks, R. S. J., Barclay, J., Carroll, M. R. & Brewer, T. S. (2000).
Remobilization of andesite magma by intrusion of mafic magma at the Soufriere Hills
Volcano, Montserrat, West Indies. Journal of Petrology 54, 393–420.
Newman, S. & Lowenstern, J. B. (2002). VOLATILECALC: a silicate melt-H2O-CO2
solution model written in Visual Basic for Excel. Computers and Geosciences 28, 597-
604.
Noguchi, S., Toramaru, A. & Nakada, S. (2008). Relation between microlite textures and
discharge rate during the 1991–1995 eruptions at Unzen, Japan. Journal of Volcanology
and Geothermal Research 175, 141–155.
Pappalardo, L. & Mastrolorenzo, G. (2010). Short residence times for alkaline Vesuvius
magmas in a multi-depth supply system: Evidence from geochemical and textural
studies. Earth and Planetary Science Letters 296, 133-143.
Pitt, A. M., Hill, D. P., Walter, S. W. & Johnson, M. J. S. (2002). Midcrustal, Long-period
Earthquakes beneath Northern California Volcanic Areas. Seismological Research
Letters 73, 144–152.
Preece, K., Barclay, J., Gertisser, R. & Herd, R. A. (2013). Textural and micro-
petrological variations in the eruptive products of the 2006 dome-forming eruption of
Merapi volcano, Indonesia: Implications for sub-surface processes. Journal of
Volcanology and Geothermal Research 261, 98–120.
Pupier, E., Duchene, S. & Toplis, M. J. (2008). Experimental quantification of
plagioclase crystal size distribution during cooling of a basaltic liquid. Contributions to
Mineralogy and Petrology 155, 555–570.
Putirka, K. D. (2008). Thermometers and Barometers for Volcanic Systems. Reviews in
Mineralogy & Geochemistry 69, 61–120.

79
Randolph, A. D. & Larson, M. A. (1971). Theory of particulate processes. Academic
Press, New York, 251 pp.
Resmini, R. G. (2007). Modeling of crystal size distributions (CSDs) in sills. Journal of
Volcanology and Geothermal Research 161, 118–130.
Riker, J. M., Cashman, K. V., Kauahikaua, J. P. & Montierth, C. M. (2009). The length of
channelized lava flows: Insight from the 1859 eruption of Mauna Loa Volcano, Hawai’i.
Journal of Volcanology and Geothermal Research 183, 139–156.
Royet, J. P. (1991). Stereology: A method for analyzing images. Progress in
Neurobiology 37, 433–474.
Rutherford, M. J. (2008). Magma Ascent Rates. Reviews in Mineralogy and
Geochemistry 69, 241–271.
Rutherford, M. J. & Devine, J. D. (2008). Magmatic conditions and processes in the
storage zone of the 2004–2006 Mount St. Helens Dacite. In Sherrod DR, Scott WE,
Stauffer PH (eds) A volcano rekindled; the renewed eruption of Mount St. Helens,
2004–2006. U.S. Geological Survey Professional Paper 1750, 703–726
Sahagian, D. L. & Proussevitch, A. A. (1998). 3D particle size distributions from 2D
observations; stereology for natural applications. Journal of Volcanology and
Geothermal Research 84, 173–196.
Salisbury, M. J., Bohrson, W. A., Clynne, M. A., Ramos, F. C. & Hoskin, P. (2008).
Multiple plagioclase crystal populations identified by crystal size distribution and in situ
chemical data: Implications for timescales of magma chamber processes associated with
the 1915 eruption of Lassen Peak, CA. Journal of Petrology 49, 1755–1780.
Saltikov, S. A. (1967). The determination of the size distribution of particles in an opaque
material from a measurement of the size distributions of their sections. In H. Elias, ed.,
Proceedings of the Second International Congress for Stereology. Berlin: Springer-
Verlag, pp. 163–173.

80
Schmidt, M. E., Grunder, A. L. & Rowe, M. C. (2008). Segmentation of the cascade arc as
indicated by Sr and Nd isotopic variation among diverse primitive basalts. Earth and
Planetary Science Letters 266, 166–181.
Sharp, T. G., Stevenson, R. J. & Dingwell, D. B. (1996). Microlites and “nanolites” in
rhyolitic glass: microstructural and chemical characterization. Bulletin of Volcanology
57, 631–640.
Shea, T. & Hammer, J. E. (2013). Kinetics of cooling- and decompression-induced
crystallization in hydrous mafic-intermediate magmas. Journal of Volcanology and
Geothermal Research 260, 127-145.
Shea, T., Houghton, B. F., Gurioli, L., Cashman, K. V., Hammer, J. E. & Hobden, B. J.
(2010). Textural studies of vesicles in volcanic rocks: An integrated methodology.
Journal of Volcanology and Geothermal Research 190, 271–289.
Sigmarsson, O., Chmeleff, J., Morris, J. & Lopez-Escobar, L. (2002). Origin of 226Ra-
230Th disequilibria in arc lavas from southern Chile and implications for magma
transfer time. Earth and Planetary Science Letters 196, 189–196.
Smith, J. V. (1972). Critical Review of synthesis and occurrence of plagioclase feldspars
and a possible phase diagram. Geology 80, 505-525.
Spillar, V. & Dolejs, D. (2013). Calculation of Time-dependent Nucleation and Growth
Rates from Quantitative Textural Data: Inversion of Crystal Size Distribution. Journal of
Petrology 54, 913–931.
Spillar, V. & Dolejs, D. (2015). Heterogeneous nucleation as the predominant mode of
crystallization in natural magmas: numerical model and implications for crystal-melt
interaction. Contributions to Mineralogy and Petrology 169, 4–19.
Spohn, T., Hort, M. & Fischer, H. (1988). Numerical Simulation of the Crystallization of
Multicomponent Melts in Thin Dikes or Sills. 1. The Liquidus Phase. Journal of
Geophysical Research 93, 4880–4894.
81
Toramaru, A. (2006). BND (bubble number density) decompression rate meter for
explosive volcanic eruptions. Journal of Volcanology and Geothermal Research 154,
303–316.
Toramaru, A., Noguchi, S., Oyoshihara, S., Tsune, A. (2008). MND(microlite number
density) water exsolution rate meter. Journal of Volcanology and Geothermal Research
175, 156–167.
Tsuchiyama, A. (1985). Dissolution kinetics of plagioclase in the melt of the system
diopside-albite-anorthite, and origin of dusty plagioclase in andesites. Contributions to
Mineralogy and Petrology 89, 1–16.
Tsuchiyama, A. & Takahashi, E. (1983). Melting kinetics of a plagioclase feldspar.
Contributions to Mineralogy and Petrology 84, 345–354.
Tsune, A. & Toramaru A. (2007). A simple model of oscillatory zoning in magmatic
plagioclase: Development of an isothermal undercooling model. American Mineralogist
92, 1071–1079.
Underwood, E. (1970). Quantitative stereology. Addison Wesley-Longman, Reading,
MA. 274 pp.
Ustunisik, G., Kilinc, A. & Nielsen, R. L. (2014). New insights into the processes
controlling compositional zoning in plagioclase. Lithos, 200-201, 80–93.
Vinet, N. & Higgins, M. D. (2010). Magma solidification processes beneath Kilauea
Volcano, Hawaii: a quantitative textural and geochemical study of the 1969 – 1974
Mauna Ulu lavas. Journal of Petrology 51, 1297–1332.
Vinet, N. & Higgins, M. D. (2011). What can crystal size distributions and olivine
compositions tell us about magma solidification processes inside Kilauea Iki lava lake,
Hawaii? Journal of Volcanology and Geothermal Research 208, 136–162.
Wager, L. R. (1961). A note on the origin of ophitic texture in the chilled olivine gabbro of
the Skaergaard intrusion. Geological Magazine 98, 353–366.
82
Yoder, H. S. & Tilley, C. E. (1962). Origin of basalt magmas: an experimental study of
natural and synthetic rock systems. Journal of Petrology 3, 342–532.
Zellmer, G. F., Blake, S., Vance, D., Hawkesworth, C. & Turner, S. (1999). Short
plagioclase residence times at two island arc volcanoes (Kameni islands, Santorini, and
Soufriere, St. Vincent) determined by Sr diffusion systematics. Contributions to
Mineralogy and Petrology 136, 345-357.
Zieg, M. J. & Lofgren, G. E. (2006). An experimental investigation of texture evolution
during continuous cooling. Journal of Volcanology and Geothermal Research 154, 74–
88.
Zieg, M. J. & Marsh, B. D. (2002). Crystal Size Distributions and Scaling Laws in the
Quantification of Igneous Textures. Journal of Petrology 43, 85–101.