Embed Size (px)
Citation preview
SIVAPALAN ET AL. VOL. 7 ’ NO. 3 ’ 2099–2105 ’ 2013
www.acsnano.org
2099
February 25, 2013
C 2013 American Chemical Society
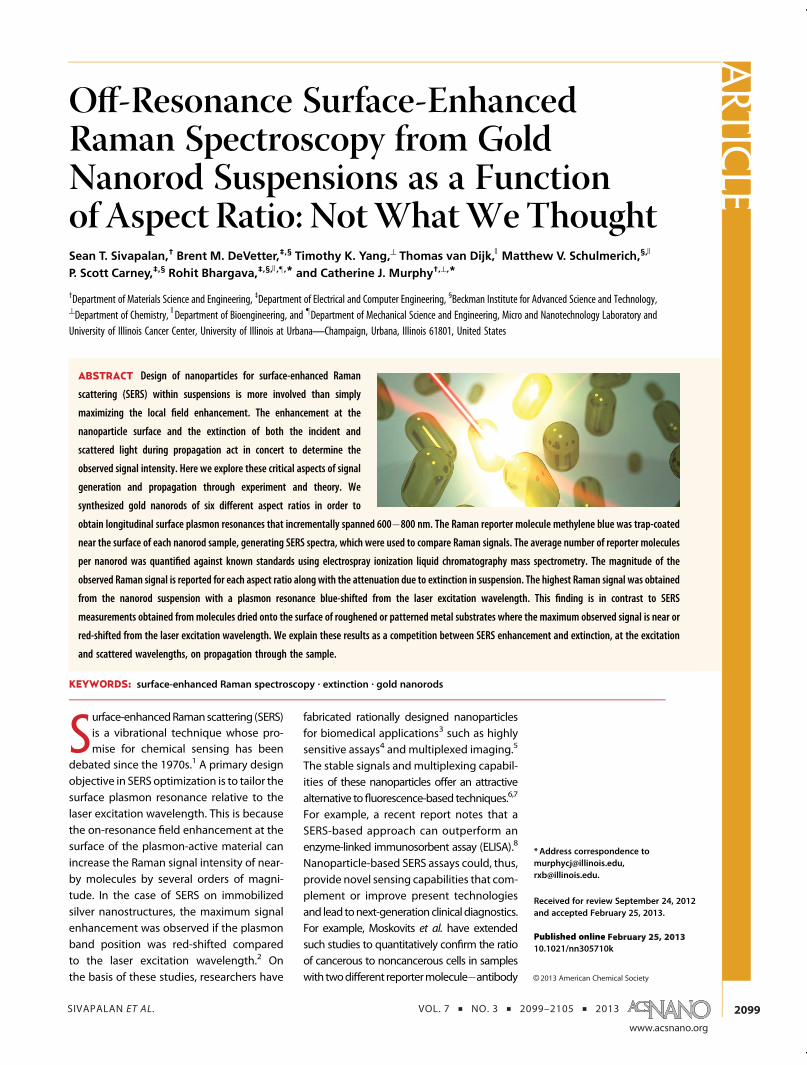
Off-Resonance Surface-EnhancedRaman Spectroscopy from GoldNanorod Suspensions as a Functionof Aspect Ratio: NotWhatWeThoughtSean T. Sivapalan,† Brent M. DeVetter,‡,§ Timothy K. Yang,^ Thomas van Dijk, ) Matthew V. Schulmerich,§, )
P. Scott Carney,‡,§ Rohit Bhargava,‡,§, ),z,* and Catherine J. Murphy†,^,*
†Department of Materials Science and Engineering, ‡Department of Electrical and Computer Engineering, §Beckman Institute for Advanced Science and Technology,^Department of Chemistry, )Department of Bioengineering, and zDepartment of Mechanical Science and Engineering, Micro and Nanotechnology Laboratory andUniversity of Illinois Cancer Center, University of Illinois at Urbana;Champaign, Urbana, Illinois 61801, United States
Surface-enhancedRamanscattering (SERS)is a vibrational technique whose pro-mise for chemical sensing has been
debated since the 1970s.1 A primary designobjective in SERS optimization is to tailor thesurface plasmon resonance relative to thelaser excitation wavelength. This is becausethe on-resonance field enhancement at thesurface of the plasmon-active material canincrease the Raman signal intensity of near-by molecules by several orders of magni-tude. In the case of SERS on immobilizedsilver nanostructures, the maximum signalenhancement was observed if the plasmonband position was red-shifted comparedto the laser excitation wavelength.2 Onthe basis of these studies, researchers have
fabricated rationally designed nanoparticlesfor biomedical applications3 such as highlysensitive assays4 andmultiplexed imaging.5
The stable signals andmultiplexing capabil-ities of these nanoparticles offer an attractivealternative tofluorescence-based techniques.6,7
For example, a recent report notes that aSERS-based approach can outperform anenzyme-linked immunosorbent assay (ELISA).8
Nanoparticle-based SERS assays could, thus,provide novel sensing capabilities that com-plement or improve present technologiesand lead tonext-generationclinicaldiagnostics.For example, Moskovits et al. have extendedsuch studies to quantitatively confirm the ratioof cancerous to noncancerous cells in sampleswith twodifferent reportermolecule�antibody
* Address correspondence [email protected],[email protected].
Received for review September 24, 2012and accepted February 25, 2013.
Published online10.1021/nn305710k
ABSTRACT Design of nanoparticles for surface-enhanced Raman
scattering (SERS) within suspensions is more involved than simply
maximizing the local field enhancement. The enhancement at the
nanoparticle surface and the extinction of both the incident and
scattered light during propagation act in concert to determine the
observed signal intensity. Here we explore these critical aspects of signal
generation and propagation through experiment and theory. We
synthesized gold nanorods of six different aspect ratios in order to
obtain longitudinal surface plasmon resonances that incrementally spanned 600�800 nm. The Raman reporter molecule methylene blue was trap-coated
near the surface of each nanorod sample, generating SERS spectra, which were used to compare Raman signals. The average number of reporter molecules
per nanorod was quantified against known standards using electrospray ionization liquid chromatography mass spectrometry. The magnitude of the
observed Raman signal is reported for each aspect ratio along with the attenuation due to extinction in suspension. The highest Raman signal was obtained
from the nanorod suspension with a plasmon resonance blue-shifted from the laser excitation wavelength. This finding is in contrast to SERS
measurements obtained from molecules dried onto the surface of roughened or patterned metal substrates where the maximum observed signal is near or
red-shifted from the laser excitation wavelength. We explain these results as a competition between SERS enhancement and extinction, at the excitation
and scattered wavelengths, on propagation through the sample.
KEYWORDS: surface-enhanced Raman spectroscopy . extinction . gold nanorods
ARTIC
LE
SIVAPALAN ET AL. VOL. 7 ’ NO. 3 ’ 2099–2105 ’ 2013
www.acsnano.org
2100
combinations.9 Using labeled nanoparticles as Ramanreporters to achieve contrast in deep-tissue measure-ments is currently an active area of research.10,11
Light scattering, absorption, and fluorescence aris-ing from the tissue limit the choice of Raman excita-tion wavelengths to the near-infrared (NIR) spectralregion.12 In this spectral region (700�1100 nm), goldnanorods13 and nanoshells14 can be used as effectiveSERS-active nanoparticles as they exhibit a tunableplasmon band15 where tissue has low absorption.12
Additionally, the presence of the nanoparticles dis-persed throughout the tissue adds absorption andscattering effects to the Raman measurement as thelight propagates. In this way, nanoparticles that wouldbe injected into tissue behave much like in colloidalsuspensions.For suspensions, as opposed to substrates, account-
ing for light propagation and attenuation is vital. Whilethe resonant plasmon helps to enhance the Ramansignal, attenuation by absorption and scattering com-plicates experimental design and optimization.16 Uponplasmonic excitation for anisotropic shapes like rods,the maximum electric field, on average, is at the tips ofthe rods; therefore, SERS signals will be dominated byevents at the tips of the rods. The overall extinction ofthe nanorods depends not only on their shape but alsoon their absolute size: larger nanorods, for the sameaspect ratio, lead to more extinction, with little relationto the qualities of the rod tips. Therefore, it is not asurprise that, in colloidal solution, SERS and extinctioneffects need to be unraveled.This effect is clearly visible in a solution of nanopar-
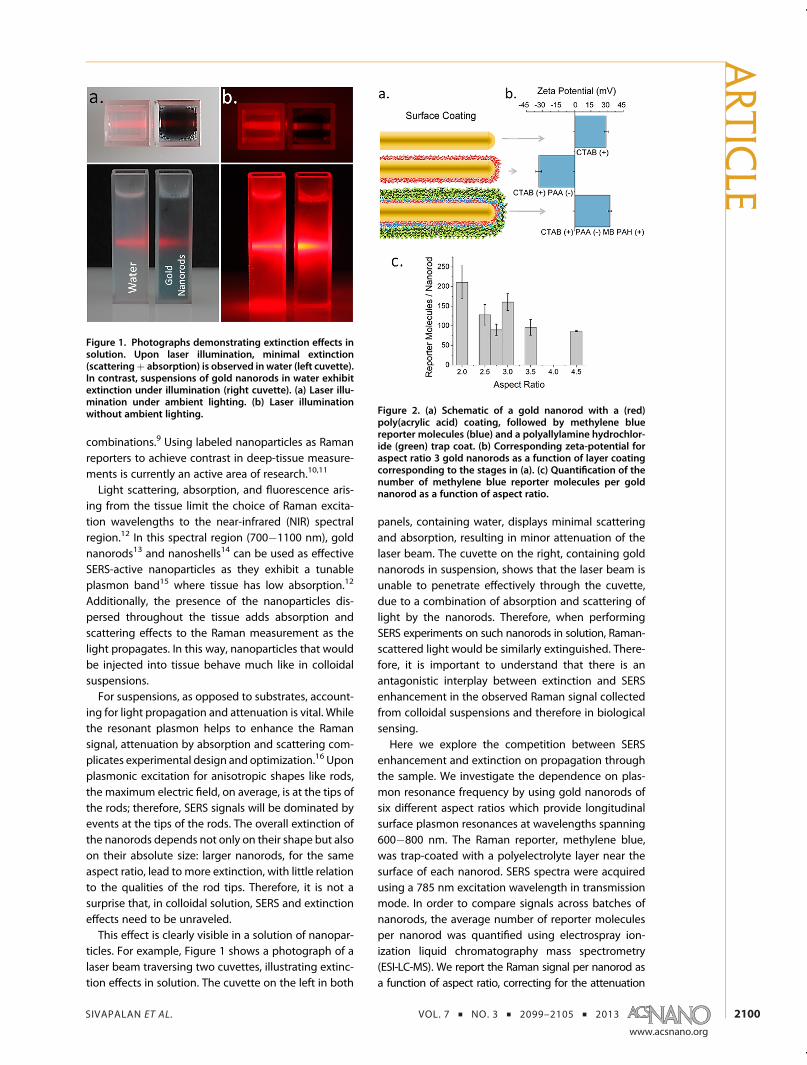
ticles. For example, Figure 1 shows a photograph of alaser beam traversing two cuvettes, illustrating extinc-tion effects in solution. The cuvette on the left in both
panels, containing water, displays minimal scatteringand absorption, resulting in minor attenuation of thelaser beam. The cuvette on the right, containing goldnanorods in suspension, shows that the laser beam isunable to penetrate effectively through the cuvette,due to a combination of absorption and scattering oflight by the nanorods. Therefore, when performingSERS experiments on such nanorods in solution, Raman-scattered light would be similarly extinguished. There-fore, it is important to understand that there is anantagonistic interplay between extinction and SERSenhancement in the observed Raman signal collectedfrom colloidal suspensions and therefore in biologicalsensing.Here we explore the competition between SERS
enhancement and extinction on propagation throughthe sample. We investigate the dependence on plas-mon resonance frequency by using gold nanorods ofsix different aspect ratios which provide longitudinalsurface plasmon resonances at wavelengths spanning600�800 nm. The Raman reporter, methylene blue,was trap-coated with a polyelectrolyte layer near thesurface of each nanorod. SERS spectra were acquiredusing a 785 nm excitation wavelength in transmissionmode. In order to compare signals across batches ofnanorods, the average number of reporter moleculesper nanorod was quantified using electrospray ion-ization liquid chromatography mass spectrometry(ESI-LC-MS). We report the Raman signal per nanorod asa function of aspect ratio, correcting for the attenuation
Figure 1. Photographs demonstrating extinction effects insolution. Upon laser illumination, minimal extinction(scatteringþ absorption) is observed in water (left cuvette).In contrast, suspensions of gold nanorods in water exhibitextinction under illumination (right cuvette). (a) Laser illu-mination under ambient lighting. (b) Laser illuminationwithout ambient lighting. Figure 2. (a) Schematic of a gold nanorod with a (red)
poly(acrylic acid) coating, followed by methylene bluereporter molecules (blue) and a polyallylamine hydrochlor-ide (green) trap coat. (b) Corresponding zeta-potential foraspect ratio 3 gold nanorods as a function of layer coatingcorresponding to the stages in (a). (c) Quantification of thenumber of methylene blue reporter molecules per goldnanorod as a function of aspect ratio.
ARTIC
LE
SIVAPALAN ET AL. VOL. 7 ’ NO. 3 ’ 2099–2105 ’ 2013
www.acsnano.org
2101
due to extinction in suspension using methanol as aninternal standard.
RESULTS AND DISCUSSION
SERS measurements are typically based on Ramanreporter molecules attached directly to the surface ofthe nanoparticles by either covalent or electrostaticinteractions.17 Other reports have examined the use ofSERS using reporter molecules separated at fixed dis-tances from the surface of the nanoparticles by em-ploying a dielectric silica shell.18 Here, we utilize apolyelectrolyte dielectric layer to wrap gold nanorodsof a variety of aspect ratios.19 A schematic of this tech-nique is illustrated in Figure 2a. First, positively chargedCTAB-capped gold nanorods were wrapped with ne-gatively charged poly(acrylic acid) (PAA). We then at-tached methylene blue reporter molecules by electro-static interactions. The reporter molecules were thentrap-coated by an additional polyallylamine hydro-chloride (PAH) polyelectrolyte layer.20 Layer wrappingwas confirmed at each step by zeta-potential measure-ments (Figure 2b) and electronic absorption spectra aspreviously described.21 Shifts in the longitudinal plasmonpeak of 5 nm or less are observed as the surface func-tionalization proceeds (Supporting InformationFigureS1).The polyelectrolyte coating also stabilizes the as-synthesized CTAB-capped gold nanorods from aggre-gating in polar protic solvents.22 As an approximateguide, assuming a 2.5 nm thick CTAB bilayer and1.5 nm thicknesses for the polyelectrolyte layers,19,21
the Raman reporter dyes should be about 4 nm fromthe metal surface. There is no apparent aggregation insolution, as suggested by the lack of plasmon bandbroadening. In the case that two nanorods are incontact, the spacer layers guarantee that the reportermolecule is approximately 4 nm away from the prox-imal metal surface and about 12 nm away from thedistal metal surface. Although we cannot rigorouslyprove that there are zero aggregates in solution, theserelative distances suggest that the reporter moleculesare not expected to lie in hot spots.The number of reporter molecules per nanorod was
quantified for each aspect ratio by ESI-LC-MS.21 Wefound that the average number of reporters per goldnanorod was 100�300 reporter molecules (Figure 2c).These ESI-LC-MS measurements were carried out intriplicate for three independent batches, for eachaspect ratio of nanorods. The means of 9 measurementsper aspect ratio,with attendant errorbars of one standarddeviation from the means, are shown in Figure 2c withfurther details in Figure S2. The values of 100�300reporters per nanorod are far fewer than monolayercoverage. Forexample,methyleneblueadsorbs tochargedsurfaces from water with a footprint of 0.66 nm2.23 A fullmonolayer of methylene blue, hence, would imply ap-proximately 3000 molecules per nanorod. Therefore,
experimental loadings are less than 10% of monolayercoverage. Using these values, we compare the experi-mentally observed SERS signal intensity from each goldnanorod suspension and relate them to theory.To characterize the observed spectral signatures, we
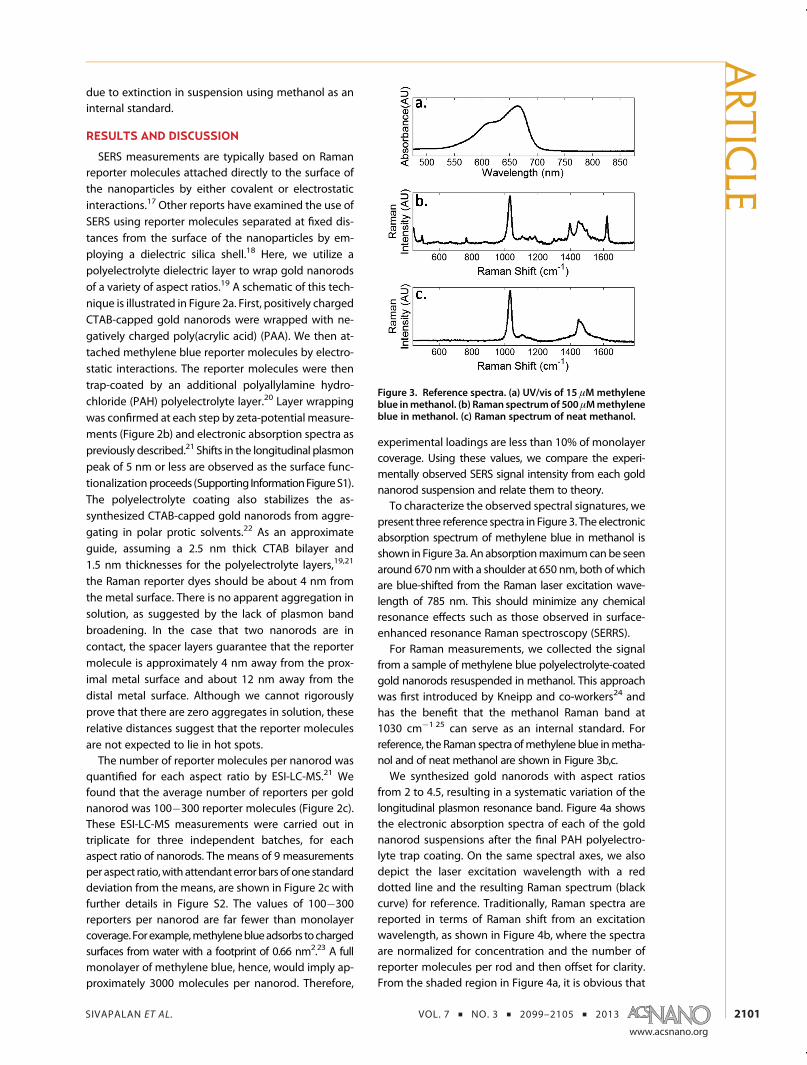
present three reference spectra in Figure 3. The electronicabsorption spectrum of methylene blue in methanol isshown in Figure 3a. An absorptionmaximumcanbe seenaround 670 nmwith a shoulder at 650 nm, both of whichare blue-shifted from the Raman laser excitation wave-length of 785 nm. This should minimize any chemicalresonance effects such as those observed in surface-enhanced resonance Raman spectroscopy (SERRS).For Raman measurements, we collected the signal
from a sample of methylene blue polyelectrolyte-coatedgold nanorods resuspended in methanol. This approachwas first introduced by Kneipp and co-workers24 andhas the benefit that the methanol Raman band at1030 cm�1 25 can serve as an internal standard. Forreference, the Raman spectra ofmethylene blue inmetha-nol and of neat methanol are shown in Figure 3b,c.We synthesized gold nanorods with aspect ratios
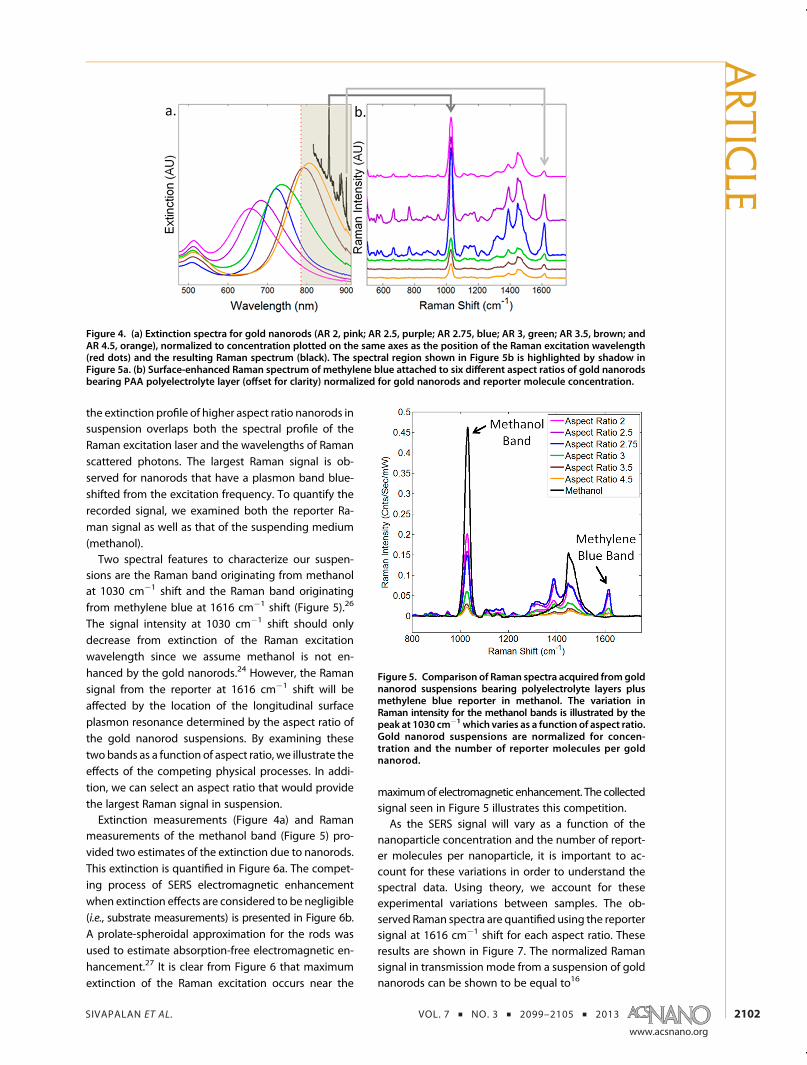
from 2 to 4.5, resulting in a systematic variation of thelongitudinal plasmon resonance band. Figure 4a showsthe electronic absorption spectra of each of the goldnanorod suspensions after the final PAH polyelectro-lyte trap coating. On the same spectral axes, we alsodepict the laser excitation wavelength with a reddotted line and the resulting Raman spectrum (blackcurve) for reference. Traditionally, Raman spectra arereported in terms of Raman shift from an excitationwavelength, as shown in Figure 4b, where the spectraare normalized for concentration and the number ofreporter molecules per rod and then offset for clarity.From the shaded region in Figure 4a, it is obvious that
Figure 3. Reference spectra. (a) UV/vis of 15 μMmethyleneblue inmethanol. (b) Raman spectrumof 500 μMmethyleneblue in methanol. (c) Raman spectrum of neat methanol.
ARTIC
LE
SIVAPALAN ET AL. VOL. 7 ’ NO. 3 ’ 2099–2105 ’ 2013
www.acsnano.org
2102
the extinction profile of higher aspect ratio nanorods insuspension overlaps both the spectral profile of theRaman excitation laser and the wavelengths of Ramanscattered photons. The largest Raman signal is ob-served for nanorods that have a plasmon band blue-shifted from the excitation frequency. To quantify therecorded signal, we examined both the reporter Ra-man signal as well as that of the suspending medium(methanol).Two spectral features to characterize our suspen-
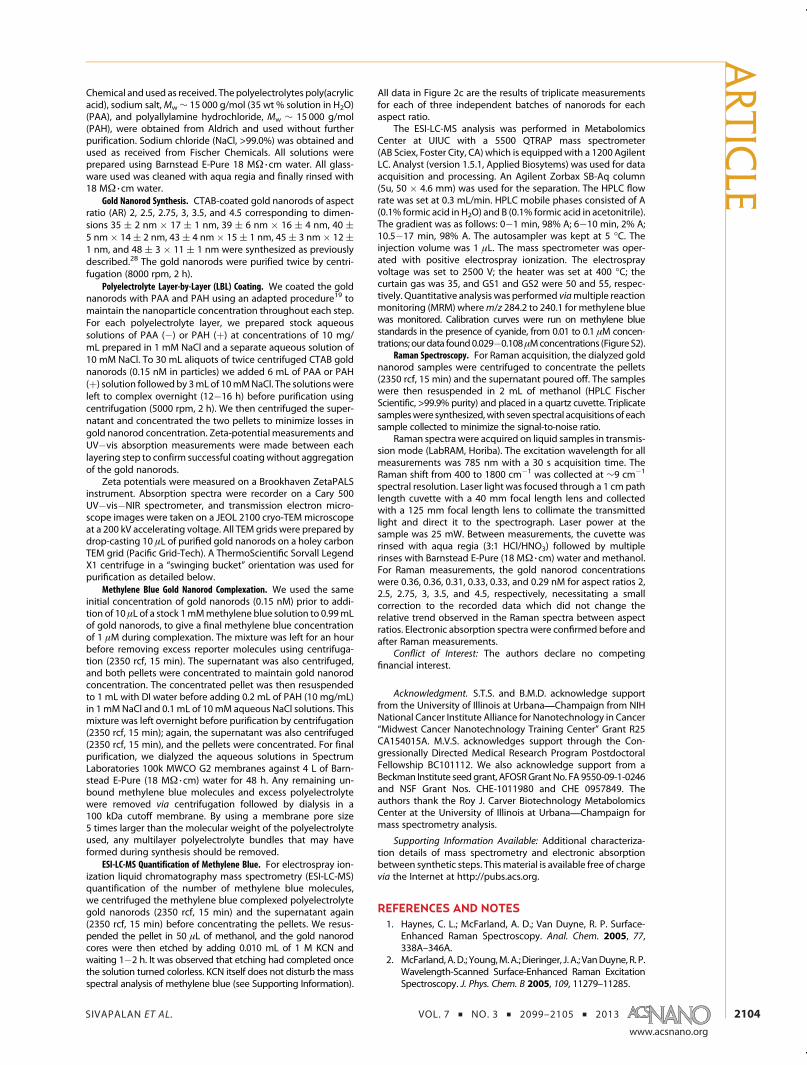
sions are the Raman band originating from methanolat 1030 cm�1 shift and the Raman band originatingfrom methylene blue at 1616 cm�1 shift (Figure 5).26
The signal intensity at 1030 cm�1 shift should onlydecrease from extinction of the Raman excitationwavelength since we assume methanol is not en-hanced by the gold nanorods.24 However, the Ramansignal from the reporter at 1616 cm�1 shift will beaffected by the location of the longitudinal surfaceplasmon resonance determined by the aspect ratio ofthe gold nanorod suspensions. By examining thesetwobands as a function of aspect ratio, we illustrate theeffects of the competing physical processes. In addi-tion, we can select an aspect ratio that would providethe largest Raman signal in suspension.Extinction measurements (Figure 4a) and Raman
measurements of the methanol band (Figure 5) pro-vided two estimates of the extinction due to nanorods.This extinction is quantified in Figure 6a. The compet-ing process of SERS electromagnetic enhancementwhen extinction effects are considered to be negligible(i.e., substrate measurements) is presented in Figure 6b.A prolate-spheroidal approximation for the rods wasused to estimate absorption-free electromagnetic en-hancement.27 It is clear from Figure 6 that maximumextinction of the Raman excitation occurs near the
maximumof electromagnetic enhancement. The collectedsignal seen in Figure 5 illustrates this competition.As the SERS signal will vary as a function of the
nanoparticle concentration and the number of report-er molecules per nanoparticle, it is important to ac-count for these variations in order to understand thespectral data. Using theory, we account for theseexperimental variations between samples. The ob-served Raman spectra are quantified using the reportersignal at 1616 cm�1 shift for each aspect ratio. Theseresults are shown in Figure 7. The normalized Ramansignal in transmission mode from a suspension of goldnanorods can be shown to be equal to16
Figure 4. (a) Extinction spectra for gold nanorods (AR 2, pink; AR 2.5, purple; AR 2.75, blue; AR 3, green; AR 3.5, brown; andAR 4.5, orange), normalized to concentration plotted on the same axes as the position of the Raman excitation wavelength(red dots) and the resulting Raman spectrum (black). The spectral region shown in Figure 5b is highlighted by shadow inFigure 5a. (b) Surface-enhanced Raman spectrum of methylene blue attached to six different aspect ratios of gold nanorodsbearing PAA polyelectrolyte layer (offset for clarity) normalized for gold nanorods and reporter molecule concentration.
Figure 5. Comparison of Raman spectra acquired fromgoldnanorod suspensions bearing polyelectrolyte layers plusmethylene blue reporter in methanol. The variation inRaman intensity for the methanol bands is illustrated by thepeak at 1030 cm�1 which varies as a function of aspect ratio.Gold nanorod suspensions are normalized for concen-tration and the number of reporter molecules per goldnanorod.
ARTIC
LE

SIVAPALAN ET AL. VOL. 7 ’ NO. 3 ’ 2099–2105 ’ 2013
www.acsnano.org
2103
R(ω,ω0, F, h) ¼ AR(0)ÆGN(ω,ω0)æe�mCext(ω0)hF � e�mCext(ω)hF
mCext(ω) �mCext(ω0)ð1Þ
where the frequencies ω0 and ω correspond to theincident light and the Stokes' shifted frequencies,respectively, A is the effective cross-sectional area ofthe illuminating and collecting beams, R(0) is the Ra-man signal from a single reporter molecule absent thenanorod, F is the concentration of the nanorods in thesolution, N indicates the number of bound Raman
reporter molecules, h is the interaction path length,Cext is the extinction cross section of the individualnanorods,m is the refractive index of the solution, andÆGN(ω,ω0)æ is the ensemble-averaged extinction-modified enhancement factor. The ratio in eq 1modelsthe propagation of incident light and Raman scatteredlight through the suspension and is a form of Beer'sLaw. This expression can be simplified if the number ofreporter molecules is small, in which case the ensemble-averaged, extinction-modified enhancement factorÆGN(ω,ω0)æ can be linearized, that is, ÆGN(ω,ω0)æ =ÆG(ω,ω0)Næ = ÆG(ω,ω0)æÆNæ. This allows us to obtainthe averaged per particle extinction-modified enhance-ment factor.
ÆG(ω,ω0)æ ¼ R(ω,ω0, F, h)R(0)ÆNæ
mCext(ω) �mCext(ω0)e�mCext (ω0)hF � e�mCext(ω)hF
ð2ÞThe single-particle, extinction-modified enhancementfactor was computed using eq 2 and is shown inFigure 7. A maximum per-particle signal enhancementis found at an aspect ratio of 2.75, with 2.5 also withinerror bounds. This implies thatmaximumobserved signaloccurs with gold nanorods blue-shifted from the laserexcitation wavelength. This differs from the field en-hancement maximum expected at an aspect ratio of 4.
CONCLUSION
In contrast to SERS experiments of immobilizednanoparticle substrates, where absorption effects areminimal, a significant extinction contribution is realizedfor SERS particles in suspension. In analyzing the signalgeneration and recording rigorously, we have demon-strated that Raman-active molecules do not providemonolayer coverage of our polyelectrolyte-bearingnanorods as usually assumed. In our experiments, load-ings are less than 10% of the expected maximum formonolayer coverage. The calculated ensemble-average signal intensity based on experimentally de-termined molecular coverage suggests the maximumRaman scattered signal is obtained from that plasmonresonance that is blue-shifted from excitation. Thisimplies the use of nanorods of lower aspect ratios foroptimal sensing. Extinction is an important considera-tion in combination with maximal SERS enhancementwhen designing tagged Raman probes for suspensionapplications such as collecting Raman reporter signalthrough tissue. Efforts toward refining our model byaccurately spatially localizing reporter binding sites on thegold nanorods are currently underway in our laboratories.
MATERIALS AND METHODS
Materials. Hydrogentetrachloroaurate(III) hydrate (HAuCl4 3 3H2O,>99.999%), sodium borohydride (NaBH4, 99.99%), and silver
nitrate (AgNO3, >99.0%) were obtained from Aldrich and usedas received. Methylene blue (>82%) with the remainder inorganic salts, cetyltrimethylammonium bromide (CTAB, >99%),and ascorbic acid (C6H8O6, >99.0%) were obtained from Sigma
Figure 6. (a) Blue dots: Experimentally observed extinctionof Raman excitation at 785 nm. Red triangles: Difference inRaman band at 1030 cm�1 shift with neat methanol andeach aspect ratio of gold nanorods suspended in methanol.(b) Predicted electromagnetic enhancement from varyingaspect ratios of spheroids in the quasi-static limit. Mean-free electron path and depolarization/radiative dampingcorrections were applied.
Figure 7. Determinedaverageperparticle extinction-modifiedenhancement factor GR(0) (G as a function of aspect ratio)from eq 2; some error bars are smaller than the data points.
ARTIC
LE
SIVAPALAN ET AL. VOL. 7 ’ NO. 3 ’ 2099–2105 ’ 2013
www.acsnano.org
2104
Chemical and used as received. The polyelectrolytes poly(acrylicacid), sodium salt,Mw∼ 15 000 g/mol (35 wt % solution in H2O)(PAA), and polyallylamine hydrochloride, Mw ∼ 15 000 g/mol(PAH), were obtained from Aldrich and used without furtherpurification. Sodium chloride (NaCl, >99.0%) was obtained andused as received from Fischer Chemicals. All solutions wereprepared using Barnstead E-Pure 18 MΩ 3 cm water. All glass-ware used was cleaned with aqua regia and finally rinsed with18 MΩ 3 cm water.
Gold Nanorod Synthesis. CTAB-coated gold nanorods of aspectratio (AR) 2, 2.5, 2.75, 3, 3.5, and 4.5 corresponding to dimen-sions 35 ( 2 nm � 17 ( 1 nm, 39 ( 6 nm � 16 ( 4 nm, 40 (5 nm� 14( 2 nm, 43( 4 nm� 15( 1 nm, 45( 3 nm� 12(1 nm, and 48 ( 3 � 11 ( 1 nm were synthesized as previouslydescribed.28 The gold nanorods were purified twice by centri-fugation (8000 rpm, 2 h).
Polyelectrolyte Layer-by-Layer (LBL) Coating. We coated the goldnanorods with PAA and PAH using an adapted procedure19 tomaintain the nanoparticle concentration throughout each step.For each polyelectrolyte layer, we prepared stock aqueoussolutions of PAA (�) or PAH (þ) at concentrations of 10 mg/mL prepared in 1 mM NaCl and a separate aqueous solution of10 mM NaCl. To 30 mL aliquots of twice centrifuged CTAB goldnanorods (0.15 nM in particles) we added 6 mL of PAA or PAH(þ) solution followedby 3mLof 10mMNaCl. The solutionswereleft to complex overnight (12�16 h) before purification usingcentrifugation (5000 rpm, 2 h). We then centrifuged the super-natant and concentrated the two pellets to minimize losses ingold nanorod concentration. Zeta-potential measurements andUV�vis absorption measurements were made between eachlayering step to confirm successful coatingwithout aggregationof the gold nanorods.
Zeta potentials were measured on a Brookhaven ZetaPALSinstrument. Absorption spectra were recorder on a Cary 500UV�vis�NIR spectrometer, and transmission electron micro-scope images were taken on a JEOL 2100 cryo-TEM microscopeat a 200 kV accelerating voltage. All TEM grids were prepared bydrop-casting 10 μL of purified gold nanorods on a holey carbonTEM grid (Pacific Grid-Tech). A ThermoScientific Sorvall LegendX1 centrifuge in a “swinging bucket” orientation was used forpurification as detailed below.
Methylene Blue Gold Nanorod Complexation. We used the sameinitial concentration of gold nanorods (0.15 nM) prior to addi-tion of 10 μL of a stock 1mMmethylene blue solution to 0.99mLof gold nanorods, to give a final methylene blue concentrationof 1 μM during complexation. The mixture was left for an hourbefore removing excess reporter molecules using centrifuga-tion (2350 rcf, 15 min). The supernatant was also centrifuged,and both pellets were concentrated to maintain gold nanorodconcentration. The concentrated pellet was then resuspendedto 1 mL with DI water before adding 0.2 mL of PAH (10 mg/mL)in 1mMNaCl and 0.1 mL of 10mM aqueous NaCl solutions. Thismixture was left overnight before purification by centrifugation(2350 rcf, 15 min); again, the supernatant was also centrifuged(2350 rcf, 15 min), and the pellets were concentrated. For finalpurification, we dialyzed the aqueous solutions in SpectrumLaboratories 100k MWCO G2 membranes against 4 L of Barn-stead E-Pure (18 MΩ 3 cm) water for 48 h. Any remaining un-bound methylene blue molecules and excess polyelectrolytewere removed via centrifugation followed by dialysis in a100 kDa cutoff membrane. By using a membrane pore size5 times larger than the molecular weight of the polyelectrolyteused, any multilayer polyelectrolyte bundles that may haveformed during synthesis should be removed.
ESI-LC-MS Quantification of Methylene Blue. For electrospray ion-ization liquid chromatography mass spectrometry (ESI-LC-MS)quantification of the number of methylene blue molecules,we centrifuged the methylene blue complexed polyelectrolytegold nanorods (2350 rcf, 15 min) and the supernatant again(2350 rcf, 15 min) before concentrating the pellets. We resus-pended the pellet in 50 μL of methanol, and the gold nanorodcores were then etched by adding 0.010 mL of 1 M KCN andwaiting 1�2 h. It was observed that etching had completed oncethe solution turned colorless. KCN itself does not disturb the massspectral analysis of methylene blue (see Supporting Information).
All data in Figure 2c are the results of triplicate measurementsfor each of three independent batches of nanorods for eachaspect ratio.
The ESI-LC-MS analysis was performed in MetabolomicsCenter at UIUC with a 5500 QTRAP mass spectrometer(AB Sciex, Foster City, CA) which is equippedwith a 1200 AgilentLC. Analyst (version 1.5.1, Applied Biosytems) was used for dataacquisition and processing. An Agilent Zorbax SB-Aq column(5u, 50 � 4.6 mm) was used for the separation. The HPLC flowrate was set at 0.3 mL/min. HPLC mobile phases consisted of A(0.1% formic acid in H2O) and B (0.1% formic acid in acetonitrile).The gradient was as follows: 0�1 min, 98% A; 6�10 min, 2% A;10.5�17 min, 98% A. The autosampler was kept at 5 �C. Theinjection volume was 1 μL. The mass spectrometer was oper-ated with positive electrospray ionization. The electrosprayvoltage was set to 2500 V; the heater was set at 400 �C; thecurtain gas was 35, and GS1 and GS2 were 50 and 55, respec-tively. Quantitative analysis was performed viamultiple reactionmonitoring (MRM) wherem/z 284.2 to 240.1 for methylene bluewas monitored. Calibration curves were run on methylene bluestandards in the presence of cyanide, from 0.01 to 0.1 μM concen-trations; our data found0.029�0.108μMconcentrations (FigureS2).
Raman Spectroscopy. For Raman acquisition, the dialyzed goldnanorod samples were centrifuged to concentrate the pellets(2350 rcf, 15 min) and the supernatant poured off. The sampleswere then resuspended in 2 mL of methanol (HPLC FischerScientific, >99.9% purity) and placed in a quartz cuvette. Triplicatesampleswere synthesized,with seven spectral acquisitions of eachsample collected to minimize the signal-to-noise ratio.
Raman spectra were acquired on liquid samples in transmis-sion mode (LabRAM, Horiba). The excitation wavelength for allmeasurements was 785 nm with a 30 s acquisition time. TheRaman shift from 400 to 1800 cm�1 was collected at ∼9 cm�1
spectral resolution. Laser light was focused through a 1 cm pathlength cuvette with a 40 mm focal length lens and collectedwith a 125 mm focal length lens to collimate the transmittedlight and direct it to the spectrograph. Laser power at thesample was 25 mW. Between measurements, the cuvette wasrinsed with aqua regia (3:1 HCl/HNO3) followed by multiplerinses with Barnstead E-Pure (18 MΩ 3 cm) water and methanol.For Raman measurements, the gold nanorod concentrationswere 0.36, 0.36, 0.31, 0.33, 0.33, and 0.29 nM for aspect ratios 2,2.5, 2.75, 3, 3.5, and 4.5, respectively, necessitating a smallcorrection to the recorded data which did not change therelative trend observed in the Raman spectra between aspectratios. Electronic absorption spectra were confirmed before andafter Raman measurements.
Conflict of Interest: The authors declare no competingfinancial interest.
Acknowledgment. S.T.S. and B.M.D. acknowledge supportfrom the University of Illinois at Urbana;Champaign from NIHNational Cancer Institute Alliance for Nanotechnology in Cancer“Midwest Cancer Nanotechnology Training Center” Grant R25CA154015A. M.V.S. acknowledges support through the Con-gressionally Directed Medical Research Program PostdoctoralFellowship BC101112. We also acknowledge support from aBeckman Institute seedgrant, AFOSRGrantNo. FA 9550-09-1-0246and NSF Grant Nos. CHE-1011980 and CHE 0957849. Theauthors thank the Roy J. Carver Biotechnology MetabolomicsCenter at the University of Illinois at Urbana;Champaign formass spectrometry analysis.
Supporting Information Available: Additional characteriza-tion details of mass spectrometry and electronic absorptionbetween synthetic steps. Thismaterial is available free of chargevia the Internet at http://pubs.acs.org.
REFERENCES AND NOTES1. Haynes, C. L.; McFarland, A. D.; Van Duyne, R. P. Surface-
Enhanced Raman Spectroscopy. Anal. Chem. 2005, 77,338A–346A.
2. McFarland,A.D.; Young,M.A.;Dieringer, J. A.; VanDuyne, R. P.Wavelength-Scanned Surface-Enhanced Raman ExcitationSpectroscopy. J. Phys. Chem. B 2005, 109, 11279–11285.
ARTIC
LE
SIVAPALAN ET AL. VOL. 7 ’ NO. 3 ’ 2099–2105 ’ 2013
www.acsnano.org
2105
3. Banholzer, M. J.; Millstone, J. E.; Qin, L.; Mirkin, C. A.Rationally Designed Nanostructures for Surface-EnhancedRaman Spectroscopy. Chem. Soc. Rev. 2008, 37, 885–897.
4. Porter,M. D.; Lipert, R. J.; Siperko, L.M.;Wang, G.; Narayanana,R. SERS as a Bioassay Platform: Fundamentals, Design, andApplications. Chem. Soc. Rev. 2008, 37, 1001–1011.
5. Kodali, A. K.; Llora, X.; Bhargava, R. Optimally DesignedNanolayered Metal-Dielectric Particles as Probes for Mas-sively Multiplexed and Ultrasensitive Molecular Assays.Proc. Natl. Acad. Sci. U.S.A. 2010, 107, 13620–13625.
6. Zavaleta, C. L.; Smith, B. R.; Walton, I.; Doering, W.; Davis, G.;Shojaei, B.; Natan, M. J.; Gambhir, S. S. Multiplexed Imagingof Surface Enhanced Raman Scattering Nanotags in LivingMice Using Noninvasive Raman Spectroscopy. Proc. Natl.Acad. Sci. U.S.A. 2009, 106, 13511–13516.
7. Xing, Y.; Chaudry, Q.; Shen, C.; Kong, K. Y.; Zhau, H. E.;Wchung, L.; Petros, J. A.; O'Regan, R. M.; Yezhelyev, M. V.;Simons, J. W.; et al. Bioconjugated Quantum Dots forMultiplexed and Quantitative Immunohistochemistry.Nat. Protoc. 2007, 2, 1152–1165.
8. Wang, G.; Lipert, R. J.; Jain, M.; Kaur, S.; Chakraboty, S.;Torres, M. P.; Batra, S. K.; Brand, R. E.; Porter, M. D. Detectionof the Potential Pancreatic Cancer Marker MUC4 in SerumUsing Surface-Enhanced Raman Scattering. Anal. Chem.2011, 83, 2554–2561.
9. Pallaoro, A.; Braun, G. B.; Moskovits, M. Quantitative Ratio-metric Discrimination between Noncancerous and Cancer-ous Prostate Cells Based on Neuropilin-1 Overexpression.Proc. Natl. Acad. Sci. U.S.A. 2011, 108, 16559–16564.
10. Stone, N.; Faulds, K.; Graham, D.; Matousek, P. Prospects ofDeep Raman Spectroscopy for Noninvasive Detection ofConjugated Surface Enhanced Resonance Raman Scatter-ing Nanoparticles Buried within 25 mm of MammalianTissue. Anal. Chem. 2010, 82, 3969–3973.
11. Stone, N.; Kerssens, M.; Lloyd, G. R.; Faulds, K.; Graham, D.;Matousek, P. Surface Enhanced Spatially Offset RamanSpectroscopic (SESORS) Imaging;The Next Dimension.Chem. Sci. 2011, 2, 776–780.
12. Richards-Kortum, R.; Sevick-Muraca, E. Quantitative Opti-cal Spectroscopy for Tissue Diagnosis. Annu. Rev. Phys.Chem. 1996, 47, 555–606.
13. Huang, X.; El-Sayed, I. H.; Qian, W.; El-Sayed, M. A. CancerCells Assemble and Align Gold Nanorods Conjugated toAntibodies To Produce Highly Enhanced, Sharp, andPolarized Surface Raman Spectra: A Potential CancerDiagnostic Marker. Nano Lett. 2007, 7, 1591–1597.
14. Lal, S.; Grady, N. K.; Kundu, J.; Levin, C. S.; Lassiter, J. B.; Halas,N. J. Tailoring Plasmonic Substrates for Surface EnhancedSpectroscopies. Chem. Soc. Rev. 2008, 37, 898–911.
15. Jain, P. K.; Huang, X.; El-Sayed, I. H.; El-Sayed, M. A. NobleMetals on the Nanoscale: Optical and Photothermal Prop-erties and SomeApplications in Imaging, Sensing, Biology,and Medicine. Acc. Chem. Res. 2008, 41, 1578–1586.
16. van Dijk, T.; Sivapalan, S. T.; DeVetter, B. M.; Yang, T. K.;Schulmerich, M. V.; Murphy, C. J.; Bhargava, R.; Carney, P. S.Competition between extinction and enhancement in sur-face enhanced Raman spectroscopy. 2013, arXiv:1303.0277.
17. Guerrini, L.; Jurasekova, Z.; Domingo, C.; Perez-Mendez, M.;Leyton, P.; Campos-Vallette, M.; Garcia-Ramos, J. V.; Sanchez-Cortes, S. Importance ofMetal-Adsorbate Interactions for theSurface-Enhanced Raman Scattering of Molecules Adsorbedon Plasmonic Nanoparticles. Plasmonics 2007, 2, 147–156.
18. Li, J. F.; Huang, Y. F.; Ding, Y.; Yang, Z. L.; Li, S. B.; Zhou, X. S.;Fan, F. R.; Zhang, W.; Zhou, Z. Y.; Wu, D. Y.; et al. Shell-Isolated Nanoparticle-Enhanced Raman Spectroscopy.Nature 2010, 464, 392–395.
19. Gole, A.; Murphy, C. J. Polyelectrolyte-Coated Gold Nano-rods: Synthesis, Characterization and Immobilization.Chem. Mater. 2005, 17, 1325–1330.
20. Huang, J. Y.; Jackson, K. S.; Murphy, C. J. PolyelectrolyteWrapping Layers Control Rates of PhotothermalMolecularRelease from Gold Nanorods. Nano Lett. 2012, 12, 2982–2987.
21. Sivapalan, S. T.; Vella, J. H.; Yang, T. K.; Dalton, M. J.; Swiger,R. N.; Haley, J. E.; Cooper, T. M.; Urbas, A. M.; Tan, L. S.;
Murphy, C. J. Plasmonic Enhancement of the Two PhotonAbsorption Cross Section of an Organic ChromophoreUsing Polyelectrolyte-Coated Gold Nanorods. Langmuir2012, 28, 9147–9154.
22. Alkilany, A. M.; Thompson, L. B.; Murphy, C. J. Polyelec-trolyte Coating Provides a Facile Route To Suspend GoldNanorods in Polar Organic Solvents and HydrophobicPolymers. ACS Appl. Mater. Interfaces 2010, 2, 3417–3421.
23. Hahner, G.; Marti, A.; Spencer, N. D.; Caseri, W. R. Orienta-tion and Electronic Structure of Methylene Blue onMica: ANear Edge X-ray Absorption Fine Structure SpectroscopyStudy. J. Chem. Phys. 1996, 104, 7749–7757.
24. Kneipp, K.; Dasari, R. R.; Wang, Y. Near-Infrared Surface-Enhanced Raman Scattering (NIR SERS) on Colloidal Silverand Gold. Appl. Spectrosc. 1994, 48, 951–957.
25. Dixit, S.; Poon, W. C. K.; Crain, J. Hydration of Methanol inAqueous Solutions: A Raman Spectroscopic Study. J. Phys.:Condens. Matter 2000, 12, L323–L328.
26. Naujok, R. R.; Duevel, R. V.; Corn, R. M. Fluorescence andFourier-Transform Surface-Enhanced Raman-ScatteringMeasurements of Methylene-Blue Adsorbed onto a Sul-fur-Modified Gold Electrode. Langmuir 1993, 9, 1771–1774.
27. Schatz, G. C., Van Duyne, R. P. Electromagnetic Mechanismof Surface-Enhanced Spectroscopy. In Handbook of Vibra-tional Spectroscopy; John Wiley & Sons, Ltd.: Chichester,UK, 2002; Vol. 1; pp 759�774.
28. Sau, T. K.; Murphy, C. J. Seeded High Yield Synthesis ofShort Au Nanorods in Aqueous Solution. Langmuir 2004,20, 6414–6420.
ARTIC
LE