Embed Size (px)
Citation preview

October 2015

Disclaimer By reading these materials, you agree to be bound by the following limitations: No representation or warranty, express or implied, is made as to, and no reliance should be placed on, the fairness, accuracy, completeness or correctness of the information, or opinions contained herein. Neither the company nor any of the company’s advisors or representatives shall have any responsibility or liability whatsoever (for negligence or otherwise) for any loss howsoever arising from any use of these materials or their contents or otherwise arising in connection with these materials. The information set out herein may be subject to updating, completion, revision, verification and amendment and such information may change materially. These materials are based on the economic, regulatory, market and other conditions as in effect on the date hereof. It should be understood that subsequent developments may affect the information contained in these materials, which neither the company nor its advisors or representatives are under an obligation to update, revise or affirm. Forward-looking statements, including the company’s plans in these materials, are based on information available to the company at the time they were prepared and involve potential risks and uncertainties. Actual results, therefore, may differ from those described in these materials due to changes in a variety of factors, such as market trends, economic conditions and regulations. Accordingly, investors are advised to use their own discretion and exercise great caution when making investment decisions. These materials and the information contained herein do not constitute or form part of any offer for sale or subscription of or solicitation or invitation of any offer to buy or subscribe for any securities of the company. Securities of the company not registered under the U.S. Securities Act of 1933, as amended (the “Securities Act”), may not be offered, sold or delivered within the United States or to U.S. persons absent registration under or an applicable exemption from the registration requirements of the United States securities laws. These materials and the information contained herein are being furnished to you solely for your information and may not be reproduced or redistributed to any other person, in whole or in part. In particular, neither the information contained in these materials nor any copy hereof may be, directly or indirectly, taken or transmitted into or distributed in the United States, Canada, Australia, Japan, Hong Kong or any other jurisdiction which prohibits the same except in compliance with applicable securities laws. Any failure to comply with this restriction may constitute a violation of U.S. or other national securities laws. No money, securities or other consideration is being solicited, and, if sent in response to this presentation or the information contained herein, will not be accepted.

Table of Contents
Japan Finance Organization for Municipalities (JFM) P.10
Capital Market Activities P.11
Credit Highlights P.15
Appendix P.17

Japan Finance Organization for Municipalities (JFM)
1

Brief Profile of JFM
A Joint Funding Organization for Local Governments
Objective To provide local governments with long-term funding at low interest rates
Establishment The predecessor of JFM was established in 1957 as a government financial institution (the “predecessor”) Succeeded the predecessor on 1 October 2008 (reorganised on 1 June 2009)
Governing Law Japan Finance Organization for Municipalities Law
– Act No. 64 of 2007, as amended
Capital
JPY 16.6 bn (USD 138 mm)* 100% owned by Japanese local governments
– Capitalized by all 1,789 local governments of Japan (as of 31 March 2015) (e.g., Tokyo, Osaka, Yokohama and Nagoya)
Outstanding Loan Balance JPY 23.4 tn (USD 195 bn)*
– Providing loans to 2,146 public institutions in Japan including almost all local governments (as of 31 March 2015)
Credit Ratings A+ (stable: S&P) / A1 (stable: Moody’s)
– The ratings of JFM are the same as those of the Japanese sovereign
JFM has been playing an important role in the Japanese local government system since 1957.
*USD 1 = JPY 120.37 as of 31 March 2015.
2

Basic Framework of JFM’s Business Operations
Local Governments
Financial Markets
JPY 19.6 tn(1)
(USD 163 bn(2))
JFM
Fund for Lending Rate Reduction(4)
Reserve for Interest Rate Volatility, etc.
JPY 3.6 tn(1) (USD 30.0 bn(2))
JPY 0.9 tn(1)
(USD 7.6 bn(2))
Reduction of Interest Rates
Proceeds from Public Races(3)
Funding (Bonds)
JPY 23.4 tn(1) (USD 195 bn(2))
Lending (Long-term/
low interest rates) Outstanding
Bond Amount: Outstanding
Loan Amount:
(1) As of 31 March 2015. (2) USD 1 = JPY 120.37 as of 31 March 2015. (3) A portion of the earnings from municipally operated racing (horse, bicycle, motorcycle and speedboat). (4) Sometimes also translated as “Fund for Improvement of Operations of Municipalities”.
3
Peer Group Comparison
Source: Compiled by JFM based on published materials of each issuer.
4
Issuer JFM AFL (Agence France
Locale)
BNG (Bank
Nederlandse)
KBN (Kommunalbanken)
KK (KommuneKredit)
KOMINS (Kommuninvest)
MuniFin (Municipality
Finance) JBIC DBJ
Issuer Rating (Moody’s/S&P) A1/A+ Aa2/ - Aaa/AA+ Aaa/AAA Aaa/AAA Aaa/AAA Aaa/AA+ A1/A+ A1/A
Sovereign Rating A1/A+ Aa1/AA Aaa/AAA Aaa/AAA Aaa/AAA Aaa/AAA Aaa/AA+ A1/A+ A1/A+
Country Japan France Netherlands Norway Denmark Sweden Finland Japan Japan
Guarantee Structure
Local govts to bear all costs to
satisfy JFM’s obligations on
dissolution
Explicit support from French local govts
Implicit support from Dutch
Ministry of Finance
Letter of support from
Kingdom of Norway
Joint and several
guarantee from local govts
Joint and several
guarantee from local govts
Joint guarantee from local govts
through Municipal Guarantee
Board
With explicit central govt guarantee
for overseas bonds
With / Without explicit central govt guarantee
for overseas bonds
Ownership 100% local govts
100% local govts
50% central 50% local govts (most of local
govts)
100% central govts
100% local govts
100% local govts
(most of local govts)
30.66% local govts pension
fund 53.34% local
govts 16% central
govts (part of local
govts)
100% central govts
100% central govts
(potential privatization)
Establishment 1957/2008 2013 1914 1926/1999 1898 1986 1989/1993 1950/1999/ 2008/2012
1951/1999/ 2008

0
2
4
6
8
10
12
14
16Non JPY denominated bonds JPY denominated bonds
Lending and Funding Operations Annual lending volume has generally increased since
JFM’s lending scope was expanded in FY2009 due to reorganisation.
Loans planned to be made in FY2015 amount to USD 15.2 bn(1)(2).
(USD bn(1))
FY
Annual Lending Volume Bond Issuance (Non-Guaranteed)
FY (1) USD 1 = JPY 120.37 as of 31 March 2015. (2) Initially planned amount; subject to change depending on lending status, market conditions and other factors.
(USD bn(1))
5
The annual volume of non-guaranteed bond issuance has increased since 2009, corresponding to the increase in the lending volume.
We currently plan to raise a total of USD 10.8 bn(1) in FY2015 by issuing non-guaranteed bonds.
0
2
4
6
8
10
12
14
16
18
20New JFM Predecessor

Breakdown of JFM’s Loan Portfolio
Total of USD 195 bn(1)(4) (JPY 23.4 tn)
(1) As of 31 March 2015. (2) Sometimes also translated as “Extraordinary Financial Countermeasures Funding”. It represents the funding by local governments to cover shortfalls in the local allocation tax pursuant to the provisions of the Local Government Finance Act (Law No. 109 of 1948). (3) Excludes government-designated cities. (4) USD 1 = JPY 120.37 as of 31 March 2015.
By Business(1) By Borrower(1)
6
Sewage 36%
Water Supply 16%
Temporary Financial Countermeasures
Funding(2)
17%
Local Road Development
(Previous)
10%
Others 6%
Transportation 5%
Hospitals 3%
Public Housing 2%
Cities(3) and Special Wards of
Tokyo
52%
Prefectures 20%
Government-designated Cities
18%
Town and Villages
7%
Local government assoc. and corp.
3%
Special Municipal Mergers
4%
Disaster Management and Mitigation 2%

0.0
0.1
0.2
0.3
FY2009 2010 2011 2012 2013 2014
Balance Sheet
Financial Performance
As of 31 Mar. 2015
(USD bn(2)) Change from 31 Mar. 2014
Total Assets 204 +3.5 Loans 195 +2.9 Total Liabilities 202 +3.3 Bonds 162 +1.0 Reserves 30 +1.2 Total Net Assets 1.4 +0.3 Capital 0.1 0
Statement of Income
12 months ended 31 Mar. 2015
(USD bn(2)) Change from 31 Mar. 2014
Income 3.6 -0.2 Interest Income 3.6 -0.2 Expenses 2.1 -0.1 Interest Expenses 2.0 -0.1 Ordinary Income 1.5 -0.1 Net Special Gains (Losses)(1) (1.2) +0.1 Net Income 0.3 +0.0
Stable Income
(2) USD 1 = JPY 120.37 as of 31 March 2015.
(USD bn(2))
7
(1) Net Special Gains (Losses) represents the difference between the amounts show in (a) the Special Gains and (b) the Special Losses line items in our audited Statement of Income for FY2014.

Capital Market Activities
8

Type of Bonds FY ended 31 March 2014 (achieved)(1)
FY ended 31 March 2015 (achieved)(1)
FY ended 31 March 2016 (plan)(2)
Non-guaranteed USD 14.0 bn USD 12.1 bn USD 10.8 bn
Domestic Issuance USD 10.8 bn USD 9.6 bn USD 7.6 bn
GMTN USD 3.2 bn USD 2.6 bn USD 1.8 bn
Open Issuance(3) - - USD 1.4 bn
Guaranteed Domestic issuance only
USD 10.6 bn USD 5.2 bn USD 6.0 bn
Bank Loans USD 0.4 bn USD 0.1 bn -
Total Funding Amount USD 25.1 bn USD 17.5 bn USD 16.8 bn
Funding Plan for FY2015
FY 2013
(1) USD 1 = JPY 120.37 as of 31 March 2015. (2) Planned amount is subject to change depending on lending status, market conditions and other factors. (3) Issuance market and details will be determined subject to market conditions.
9
FY 2014 FY 2015

Funding Activities in Overseas Markets
Program Issue Date Format Currency Issue Amount
Coupon (%) Tenor
GMTN
21 Apr 2015 144A / Reg.S USD 1,000 mm 2.000 7y
13 Feb 2015 144A / Reg.S USD 1,000 mm 2.375 10y
22 Sep 2014 Reg.S EUR 1,000 mm 0.875 7y
6 Mar 2014 144A / Reg.S USD 1,000 mm 2.125 5y
12 Sep 2013 144A / Reg.S USD 1,500 mm 2.500 5y
EMTN
5 Feb 2013 Reg.S USD 1,000 mm 1.375 5y
12 Sep 2012 Reg.S USD 1,000 mm 1.500 5y
Uridashi Bonds
– Issuances in various major currencies through the GMTN Programme to meet specific investor demand.
– Issuances targeting Japanese retail investors.
10
JFM continues to access overseas markets through benchmark transactions as well as private placements. Benchmark Issuance (Outstanding)
Private Placements 0% 20% 40% 60% 80% 100%
12 Sep 2012
5 Feb 2013
12 Sep 2013
6 Mar 2014
22 Sep 2014
13 Feb 2015
21 Apr 2015
Asia
EMEA
US
US offshore
Others
Distribution by Geography Issue Date

JFM’s GMTN issuance in FY2015
11
Fund 17%
CB / OI 36%
Bank 31%
Ins / Pens 16%
JFM issued 2.000% USD 1 bn 7yr in April 2015 Issue Details
Format: 144A / Reg.S (GMTN Programme) Tenor: 7yr Issue Size: USD 1 bn Pricing Date: 14th April 2015 Issue Date: 21st April 2015 Maturity Date: 21st April 2022 Re-offer Spread: MS+38bp Coupon: 2.000% Issue Price: 99.391% Listing: London Lead Managers: BofAML / Daiwa / MS
EMEA 45%
Asia 40%
Americas 15%
Distribution by Investor
Distribution by Geography
JFM’s most recent benchmark transaction appeared in April 2015 with 7yr USD 1.0 bn at mid-swap+38bp − Book size reached over USD 1.6 bn − Active participation from central banks
and public institutions was observed
USD 1.0 bn has been already raised out of USD 1.8 bn of initial funding plan for MTNs during FY2015
JFM seeks an opportunity for another benchmark transaction through the fiscal year subject to market conditions and progress of other funding measures

Credit Highlights
12

Credit Highlights
JFM is a joint funding organization for all local governments, established under a special law. JFM has strong ties with the national government. If JFM’s obligations cannot be satisfied in full during the dissolution process, local governments
bear all of the costs to satisfy such obligations in full, via payments to JFM.
1. Solid Institutional Framework
Loans are provided exclusively to local governments. Local governments must have the consent or approval of the Minister* or respective prefectural
governors when they undertake borrowings from JFM. Local governments have support from the national level via the Local Allocation Tax system. JFM has never experienced a default on its lending for more than 50 years since its establishment.
2. High Quality of Assets
JFM maintains appropriate reserves. JFM conducts prudent ALM.
3. Sound Financial Foundation
*Minister for Internal Affairs and Communications.
13

Appendix
14

Date Event Source of Capital
1 June 1957
<Foundation> Japan Finance Corporation for Municipal Enterprises
National Government
1 October 2008
< Start-up of Operation> Japan Finance Organization for Municipal Enterprises
Local Governments
1 June 2009 <Reorganization> Japan Finance Organization for Municipalities (The expansion of lending scope)
Local Governments
History of JFM
As a result of the reorganisation mandated by the policy-based financial reform, JFM’s ownership transferred from the national government to local governments.
Despite the structural change, JFM has strong ties with the national government, playing a vital role in the funding system for local governments.
Substantially all rights and obligations are succeeded to
15

JFM Shareholders JFM has paid-in capital of JPY 16.6 bn (USD 138 mm(1)(2)) contributed by 1,789(1) Japanese local governments.
Amount of Capital Contribution(1)
(1) As of 31 March 2015. (2) USD 1 = JPY 120.37 as of 31 March 2015. (3) Excludes Government-designated cities. (4) Government-designated cities: Cities with populations of 500,000 or more designated in accordance with Paragraph 1, Article 252-19 of the Local Autonomy Act. Such government-designated cities are allowed to administer certain matters such as social welfare, food sanitation, urban planning and so on, for which prefectures are responsible in principle.
USD 137.9 mm(2)
16
Towns, villages and local government associations
USD 8.6 mm 6.3%
Prefectures USD 52.9 mm
38.4%
Cities(3) and special wards of Tokyo
USD 52.5 mm 38.0%
Government- Designated cities(4)
USD 23.9 mm 17.3%

General Account: New loans to be extended and new bonds to be issued by JFM (since 2008). Management Account: Legacy operations to manage loans carried over from the predecessor.
General Account and Management Account
Reserve for Losses on the Refinancing of
Bonds JPY 3.4 tn
(USD 28 bn*)
General Account
Management Account
Ensure a financial foundation that can withstand the refinancing risk for the government-guaranteed bonds, etc.
FY2008-2017 USD 1.8* bn transferred each year
Predecessor JFM
JFM’s Reserves under Special Laws
Reserve for Interest Rate Volatility
Management Account Reserve for Interest Rate Volatility
Ensure a financial foundation necessary to sustain the business into the future
*USD 1 = JPY 120.37 as of 31 March 2015.
17

Special Gains and Special Losses
Provision for Management Account Reserve
for Interest Rate Volatility JPY 158 bn(1) (USD 1.3 bn(2))
Reversal of Management Account Reserve
for Interest Rate Volatility JPY 220 bn(1) (USD 1.8 bn(2))
Provision for Reserve for Interest Rate Volatility
JPY 220 bn(1) (USD 1.8 bn(2)) ≪General Account≫
Reversal of Reserve for Interest Rate Reduction
JPY 9.1 bn(1) (USD 0.1 bn(2))
Special Gains JPY 229 bn(1) (USD 1.9 bn(2))
Special Losses JPY 378 bn(1) (USD 3.1 bn(2))
USD 1.8 bn(2)
between JFM Account
Transfer
18
(1) As of 31 March 2015. (2) USD 1 = JPY 120.37 as of 31 March 2015.
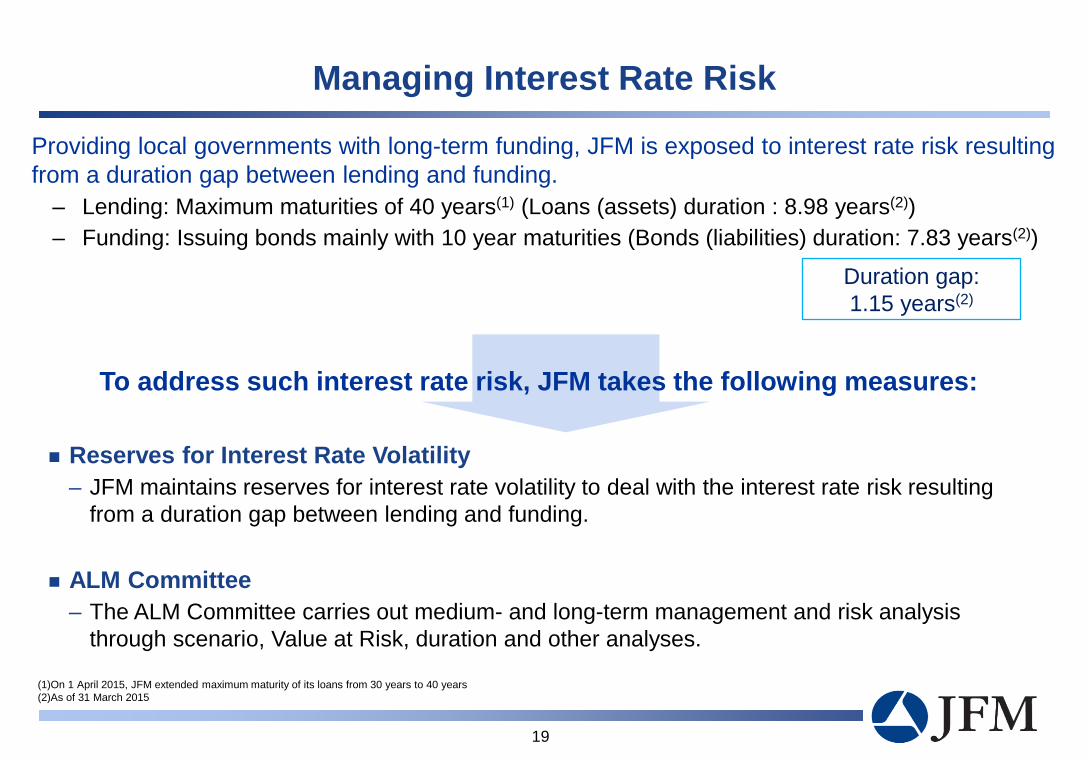
Managing Interest Rate Risk
Providing local governments with long-term funding, JFM is exposed to interest rate risk resulting from a duration gap between lending and funding.
– Lending: Maximum maturities of 40 years(1) (Loans (assets) duration : 8.98 years(2)) – Funding: Issuing bonds mainly with 10 year maturities (Bonds (liabilities) duration: 7.83 years(2))
Reserves for Interest Rate Volatility – JFM maintains reserves for interest rate volatility to deal with the interest rate risk resulting
from a duration gap between lending and funding.
ALM Committee – The ALM Committee carries out medium- and long-term management and risk analysis
through scenario, Value at Risk, duration and other analyses.
To address such interest rate risk, JFM takes the following measures:
Duration gap: 1.15 years(2)
(1)On 1 April 2015, JFM extended maximum maturity of its loans from 30 years to 40 years (2)As of 31 March 2015
19

Under the Local Allocation Tax (“LAT”) system, the national government allocates a part of national tax revenue to local governments in order to adjust the imbalance of revenue sources among the local governments.
LAT for each local government is decided based on its requirement and revenue as follows:
Shortage Standard Financial
Requirements(1) Standard
Local Tax Revenue(2)
LAT for City A
Example: City A
(1) Standard financial requirements are the amount of funds necessary to provide standard public services. The requirements are calculated for each local government according to the standard specified by the Ministry of Internal Affairs and Communications.
(2) Local governments have a right to tax only within their respective local regions in Japan. Regional imbalances in tax revenues are common.
Local Allocation Tax System
20

Amount (USD bn) (%)
Local Tax 334.8 47.3% Local Allocation Tax 139.2 19.6%
National Government Disbursements 108.6 15.3%
Local Government Bonds and Loans 78.9 11.1%
Others 46.9 6.6% Total 708.4 100.0%
Local Government Finance Program (“LGFP”): The national government formulates LGFP each fiscal year based on assessments of the scale of
local government finance and forecasts of overall revenues and expenditures. In the LGFP, the total amount of local government revenues and expenditure are balanced.
LGFP secures revenue sources for all local governments, including Local Allocation Tax grants as well as bonds and loans to be issued or borrowed to ensure uniform public service standards.
As of January 2015 and the program includes Great East Japan Earthquake related budgets.
Local Government Finances
21
Local Government Finance Program (Initial Plan for FY2015)(1)
Local Government Borrowing Programme (LGBP)
(USD 101.4bn)
Funds for Municipal Enterprises (USD 22.5bn)
National Government USD 27.2 bn
JFM USD 16.4 bn
Publicly Offered Bonds USD 33.2 bn
Other Private Sectors USD 24.6 bn 24.3%
32.8% 16.1%
26.8%
42.9% 57.1%
Public Funds
Private Funds

National Government
47 Prefectures*
1,741 Cities, Towns, Villages and Special Wards*
Handling administrative issues related to their respective regions, e.g., Yokohama, Nagoya, Sapporo
Serving broader areas, e.g., Tokyo, Kanagawa, Osaka, Aichi, Saitama
- Foreign affairs - National defense - Monetary policy
Local Government System in Japan
Local governments are responsible for a wide range of services closely related to the daily lives of citizens such as:
*As of 31 March 2015.
Local Governments
22
- Water supply and Sewage systems - Roads - Public health - Social welfare - Education
- Policing - Fire fighting - Disaster prevention - Transportation

4. Financial Conditions Monitoring
Early Warning or Reconstruction
Under the supervision of upper level government
National Government
4. Financial Conditions Monitoring
Early Warning or Reconstruction
Under the supervision of upper level government
Prefectures
(Local Governments)
Cities Towns
Villages Special Wards
(Local
Governments)
3. Consent or Approval
for Borrowing
Borrowing Consultation
Secure Financial Resources for Local Governments 1.Local Allocation Tax System: a portion of national tax revenue is allocated to the local governments in order to cover the shortfall. (See Appendix P23) 2.Local Government Borrowing Programme (LGBP): determines the amount and sources of local government funding and ensures that funds will be sufficiently provided. (See P7)
23
Systems Designed to Secure Financial Soundness of Local Governments
Borrowing Consultation
3. Consent or Approval
for Borrowing

0.0
2.0
4.0
6.0
8.0
10.0
12.0
14.0
16.0
18.0
0.0
20.0
40.0
60.0
80.0
100.0
120.0
140.0
160.0
180.0
2010 2011 2012 2013 2014 2015
Other Private Sector Publicly Offered Bond
National Government JFM
JFM Ratio
The national government decides guidelines for the amount of local government borrowing according to the Local Government Borrowing Programme (the “LGBP”). Each local government raises funds within this amount.
The total amount of JFM funds is based on the LGBP, prepared by the national government each fiscal year. JFM funds account for around 16% of local government funding.
(USD bn*)
FY
Funding measures of local governments Funding amount of local governments (Initial plan)
Source: Ministry of Internal Affairs and Communications The figures above are the initially planned numbers (not actual).
Local Government Borrowing Programme
(%)
*USD 1 = JPY 120.37 as of 31 March 2015.
24
13.6 13.8
15.5 15.9 16.1 15.8 National Government
JFM Publicly Offered Bonds
Other Private Sectors
USD 27.2 bn 26.8%
USD 16.4 bn 16.1%
USD 33.2 bn 32.8%
USD 24.6 bn 24.3%
42.9% 57.1%
Public Funds
Private Funds
LGBP for FY 2015 : Total USD 101.4 bn

Finance, Finance Department
Postal address: Shisei Kaikan,1-3 Hibiya Koen, Chiyoda-ku Tokyo 100-0012, Japan
Tel: +81-3-3539-2697 Fax: +81-3-3539-2615 E-mail: [email protected] Bloomberg ticker: JFM Govt
Japan Finance Organization for Municipalities
Contact Information
(JFM in Tokyo)
25