Embed Size (px)
Citation preview
ODIN Sverige C
Årskommentar december 2018
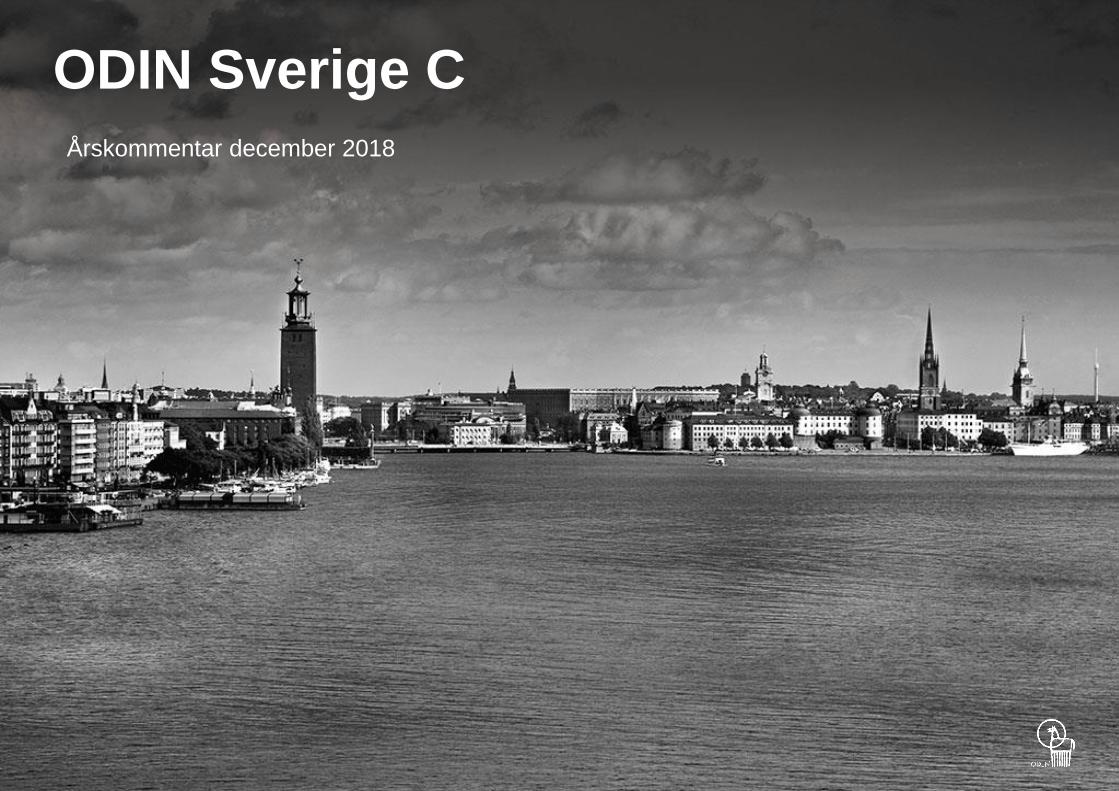
Fondens portfölj
ODIN Sverige C – december 2018
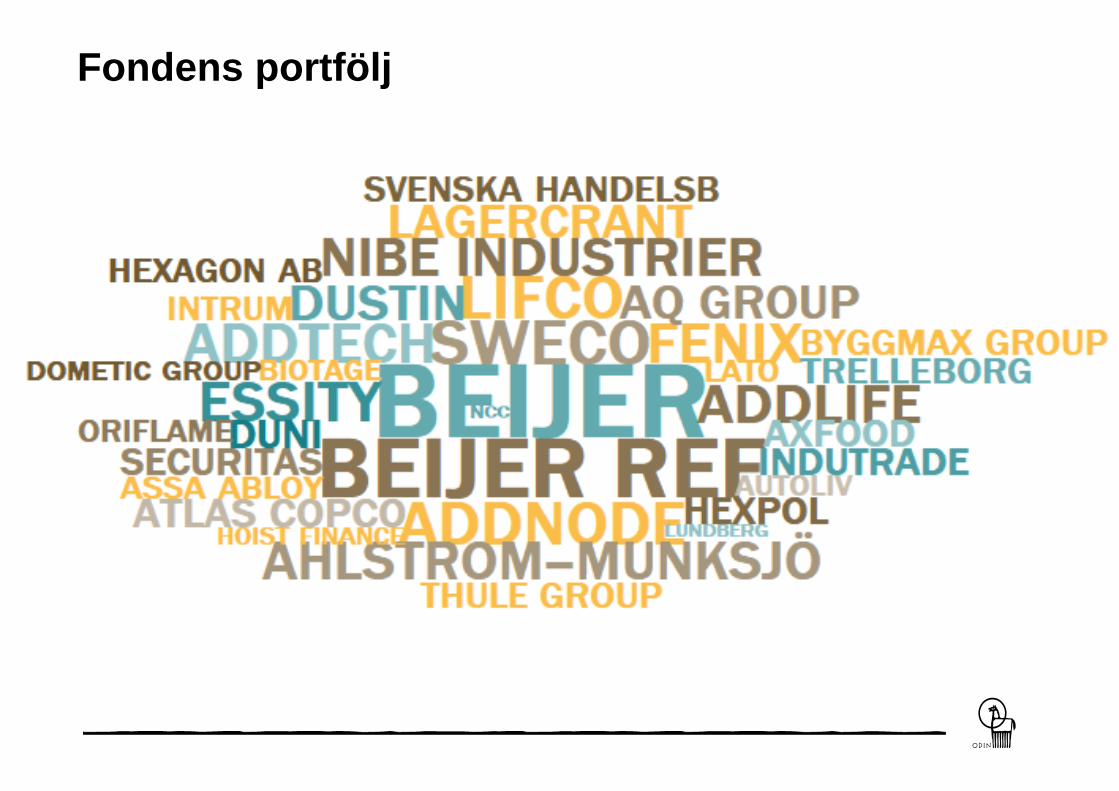
Avkastning senaste månaden och hittills i år
Fondens avkastning var -5,8 procent under den senaste månaden
Fondens referensindex avkastade under samma tidsperiod -6,2 procent
Fonden har levererat en avkastning på -5,6 procent hittills i år
Fondens referensindex avkastade under samma tidsperiod -4,9 procent
Köp och försäljning i fonden, senaste månaden och hittills i år
• Den senaste månaden har vi sålt aktierna i Ahlsell och köpt fler aktier i Dometic
• De största ändringarna hittills i år är köp av aktier i Hoist, Securitas, Dometic, Biotage och NCC och sälj av Ahlsell,
Avanza, H&M, Clas Ohlson, Epiroc och Veoneer
Bidragsgivare, senaste månaden och hittills i år
• De bästa bidragsgivarna under månaden var Addlife och AQ Group
• De bolag som bidrog minst denna månad var Autoliv och Hoist Finance
• De bästa bidragsgivarna hittills i år är Beijer Ref och Addnode Group
• De bolag som bidragit minst hittills i år är Oriflame och Byggmax
ODIN Sverige C – december 2018
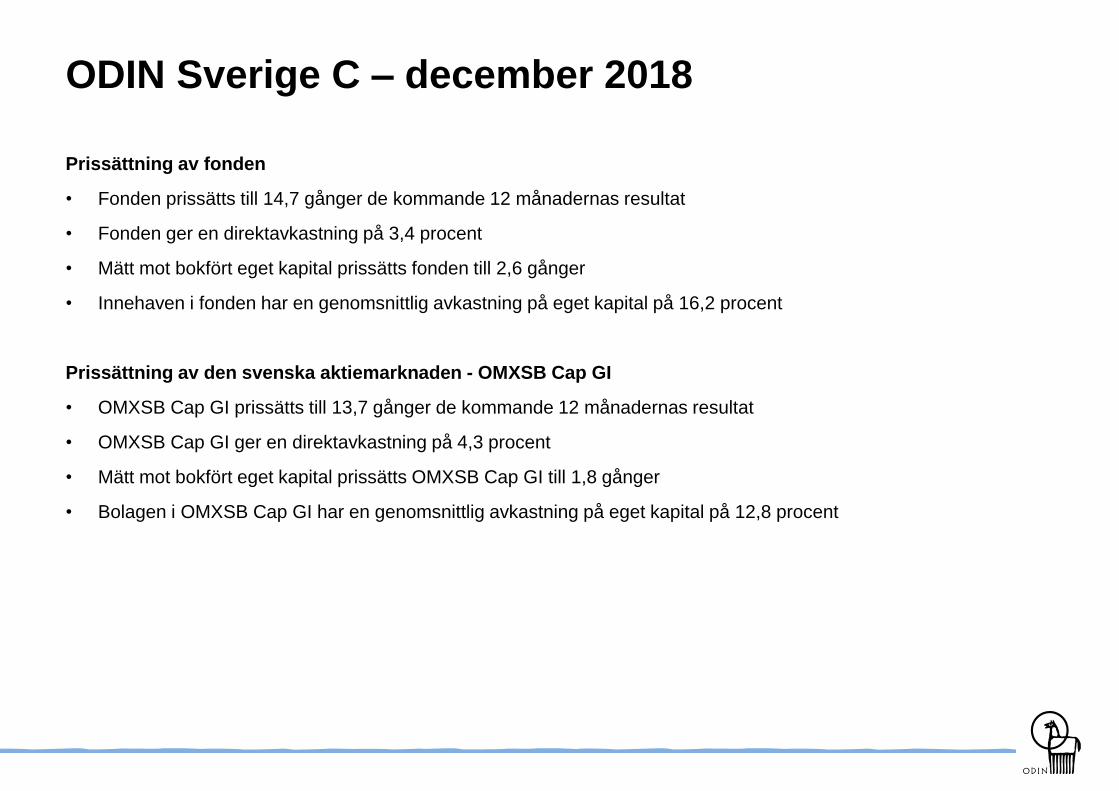
Prissättning av fonden
• Fonden prissätts till 14,7 gånger de kommande 12 månadernas resultat
• Fonden ger en direktavkastning på 3,4 procent
• Mätt mot bokfört eget kapital prissätts fonden till 2,6 gånger
• Innehaven i fonden har en genomsnittlig avkastning på eget kapital på 16,2 procent
Prissättning av den svenska aktiemarknaden - OMXSB Cap GI
• OMXSB Cap GI prissätts till 13,7 gånger de kommande 12 månadernas resultat
• OMXSB Cap GI ger en direktavkastning på 4,3 procent
• Mätt mot bokfört eget kapital prissätts OMXSB Cap GI till 1,8 gånger
• Bolagen i OMXSB Cap GI har en genomsnittlig avkastning på eget kapital på 12,8 procent
Årskommentar 2018Året som gick
Ett annat positivt sektorbidrag kommer från finanssektorn. Att
bankverksamheten i fonden är liten har varit positivt på en marknad
som består av fyra stora banker som har varit svaga under 2018.
På den negativa sidan har vi cyklisk och stabil konsumtion för
fonden. Den förändring vi ser inom handeln har drabbat oss negativt
via bolagen Byggmax, H&M och Clas Ohlson. De två sistnämnda
sålde vi i första halvan av 2018. Vi behåller Byggmax eftersom vi ser
en betydande potential i aktiekursen i förhållande till det vi anser är
underliggande värden.
ODIN Sverige ska på sikt gå bättre än index, vilket innebär att vi ska
avvika från index. Vi är en långsiktig aktieägare som för att
maximera våra investeringsidéer väljer att ha få bolag i portföljen. Vi
vet att värdeskapande tar tid och att kursutvecklingen i våra bolag
kommer att vara svagare under vissa år. Därför är det viktigt att
identifiera bolag som är väl positionerade på lång sikt, snarare än
sådana som levererar fina siffror i det korta perspektivet. Denna
grundläggande inställning förändras inte på turbulenta marknader,
särskilt då det är under tuffa perioder som de bästa långsiktiga
investeringsmöjligheterna uppstår.
Den svenska aktiemarknaden har fluktuerat kraftigt under 2018.
Efter ett negativt första kvartal var uppgången i Q2 och Q3 utmärkt,
men under Q4 sjönk marknaden kraftigt och slutar helt klart på
minussidan för året som helhet. Små bolag har lyckats något bättre
än de större bolagen på aktiemarknaden. Bolagen är generellt sett
fortfarande positiva till framtiden, men de har sällan varit bra på att
förutsäga framtiden. Efter 10 år av god avkastning på
aktiemarknaden är många investerare nervösa, särskilt då det
verkar som att den ekonomiska tillväxten kommer att sakta ned
framöver. Riksbanken höjde räntorna i slutet av året, och det finns
politisk osäkerhet omkring Brexit och ett potentiellt handelskrig
mellan USA och Kina.
Vår målsättning för fonden är enkel. Med hjälp av våra verktyg och
erfarenheter ska vi leverera en god och riskjusterad avkastning för
våra andelsägare. Vi vill investera i bolag med dokumenterat goda
resultat, som har starka positioner inför framtiden och som kan
köpas till ett attraktivt pris.
Även med en svagare makro i slutet av året har en stark global
makro drivit industrisektorn till att bli fondens bästa bidragsgivare
under 2018. Sektorn består av många olika bolag och vår
aktieplockning inom sektorn har gett resultat. De traditionella
industribolagen i Sverige, som t.ex. Volvo, SKF och Sandvik, har vi
inte ägt och det har i kombination med våra bidragsgivare relativt
sett påverkat positivt.
Årskommentar 2018 Fundamental utveckling
Det vi fokuserar på när vi utvärderar året som gått är den
fundamentala utvecklingen för de bolag som ingår i fonden. Bolagen
i ODIN Sverige förväntas kunna uppvisa en resultatökning på cirka
12 procent i SEK under 2018. Jämförelsevis förväntas vårt
referensindex (OMXSBENC) leverera en resultatökning på 8
procent.
Försäljningsökningen för bolagen i ODIN Sverige uppgår till drygt 6
procent. Beijer Ref, Dometic, Biotage och Addtech var bland de
bolag i Sverige-portföljen som hade högst försäljningstillväxt.
Den bästa resultatutvecklingen i fonden stod Addnode, Autoliv,
Beijer Ref och Lifco för, medan NCC*, Byggmax, Essity och
Ahlstrom-Munksjö gick sämst. Sex av våra 36 bolag uppvisade en
negativ resultatutveckling mellan 2017 och 2018.
Avkastningen på eget kapital beräknas till 16,5 procent för bolagen i
fonden. En direktavkastning på 3,2 procent från utdelningar är vi
nöjda med.
Om vi tittar på resultatprognosen för kommande år ligger den för
den svenska marknaden (SBXCAP) på 5 procent och for ODIN
Sverige på 13 procent.
* NCC endast ägd delar av året
Avkastningen på aktiemarknaden är svår att förutspå, åtminstone på
kort sikt. Det vi vet är att totalavkastningen på lång sikt består av
bolagets fundamentala utveckling (resultatökning + utdelning) och
prisförändring (multipelförändring).
I ODIN Sverige förväntas resultatökningen hamna på drygt 13
procent. En direktavkastning på omkring 3 procent pekar på en
möjlig totalavkastning på drygt 16 procent före eventuella
prisändringar på våra bolag i fonden.
Årskommentar 2018Förändringar i portföljen
sin vinst under de kommande åren genom organisk tillväxt och
förvärv. Dessutom tror vi att det finns utrymme för ytterligare
marginalförbättringar tack vare industrialiseringen av bolaget samt
kostnadssynergier från förvärvet av Seastar. Vi ser fram emot att
följa bolaget och menar att värdet ligger betydligt högre än dagens
kursnivå.
Vi köpte in oss i entreprenörsbolaget NCC, som utvecklades svagt
såväl verksamhets- som kursmässigt under 2017 och 2018. I maj
tillträdde den nya vd:n Tomas Carlsson. Han var tidigare vd för
konsultbolaget Sweco (2012-2018) där han lyckades mycket väl.
Dessförinnan arbetade han i över 20 år på NCC och har med andra
ord en mycket relevant bakgrund och kompetensbas. Vi tror att
Carlsson och resten av ledningen kommer att klara att vända den
svaga utvecklingen vi har sett på NCC och lyfta rörelsemarginalerna
mot forna höjder. Aktiemarknaden ser inte ut att väga ta in detta i
dagsläget. Vi anser därför att detta är en attraktiv investeringschans
för de som har tillräckligt med is i magen att behålla aktien under en
omställningsperiod.
Biotage är ett globalt bolag som utvecklar innovativa och effektiva
lösningar för separation inom organisk och analytisk kemi samt för
industriella tillämpningar. Vi gillar bolagets nuvarande
marknadsposition och ser stora tillväxtmöjligheter i nya segment och
branscher som miljö och livsmedelssäkerhet. Med en stark
topplinjetillväxt och marginalexpansion tror vi att beståndet har mer
att gå på i framtiden.
Under 2018 tog vi in fem nya bolag i portföljen. Vi köpte Securitas,
Dometic och NCC under första halvåret och två nya bolag under
andra halvåret – Biotage och Hoist Finance. Två av våra bolag har
under året knoppat av en del av sina respektive verksamheter. Här
valde vi att inte behålla de avknoppade bolagen Epiroc och
Veoneer. Utöver denna försäljning sålde vi ut oss ur Clas Ohlson
och H&M under årets första hälft. Under andra halvåret sålde vi oss
ut ur Avanza.
Vi lyfte in Securitas i ODIN Sverige i slutet av mars. Vi har följt
bolaget länge och betraktar aktiekursnivån kombinerat med
stabiliteten i verksamheten som attraktiv. ODIN Norden har länge
ägt aktier i Securitas. Genom ökat teknikinnehåll och försäljning av
säkerhetslösningar kommer bolaget att bli mer lönsamt framöver. I
kombination med en relativt stabil efterfrågan, långsiktigt behov av
ökad säkerhet och en attraktiv prislapp på aktien har vi valt att
bygga upp en position även för ODIN Sverige.
Svenska Dometic producerar bland annat klimatanläggningar,
kylsystem, sanitetssystem, belysning och andra komfortprodukter
för primärt husbilar, fritidsbåtar, kommersiella marina fartyg och
varubilar/lastbilar. De är globala marknadsledare som ligger på
första eller andra plats i 75 procent av sina verksamhetsområden
och tillverkar premiumprodukter. Detta förklarar bolagets höga
bruttomarginaler jämfört med konkurrenterna. I januari fick bolaget
en ny vd i Juan Vargues. Han imponerade på oss under tiden i Assa
Abloy (2006-2017) där han bidrog starkt till bolagets tillväxt genom
en rad förvärv. Dometic har en stark position på attraktiva
tillväxtmarknader och vi tror att bolaget kommer att fortsätta att öka
Årskommentar 2018Förändringar i portföljen
Ut ur portföljen 2018
Förutom två avknoppningar har vi sålt fyra bolag; HM, Clas Ohlson,
Avanza och Ahlsell.
H&M har varit en problematisk investering för oss under en längre
tid. Det har varit kärvt i detaljhandeln på senare år, även under
2018. Hela branschen förändras snabbt och det har skett mycket
snabbare och med mycket större kraft än vad både vi och de flesta
etablerade aktörer hade föreställt sig. Frågan är hur långt
utvecklingen kommer att gå. Kommer försäljningen via nätet att stå
för 20, 30 eller 70 procent av all handel inom fem år?
Vi sitter inte inne med svaret men att tillväxten i hög grad kommer
att ske på nätet råder det föga tvivel om. De aktörer som vi ska äga
framöver måste därför kunna hävda sig på nätet. Vi är som regel
inte den typen av investerare som säljer bolag så snart det blåser
upp. När vi väl har valt våra 25–35 kvalitetsbolag ökar vi normalt
innehavet i dem när aktiekurserna faller. I maj bestämde vi oss ändå
för att sälja av vårt innehav i bolaget och utnyttjade den tillfälliga
kursuppgång som kom efter huvudägarens aktieköp till att sälja. Det
var ett svårt beslut, mentalt sett, då vi gärna går mot strömmen när
kvalitetsbolag faller. Fokus i vår investeringsfilosofi ligger på historik,
framtid och pris, men i fallet med H&M var nog vårt misstag att vi
inte i tid insåg hur snabbt, och med vilken kraft, förutsättningarna i
detaljhandeln skulle komma att förändras.
Hoist Finance är också en av våra nyare investeringar. Vi köpte i
september in oss i en emission i bolaget. Vi ser tydliga tecken på att
prispressen kring portföljköp är på väg att mattas av. Detta beror på
att finansieringskostnaderna har stigit och att de renodlade
finansiella aktörerna inte är lika aktiva. Hoist Finance är en aktör i
branschen med egen banklicens. Tack vare sin insättningsprodukt
har bolaget lägre finansieringskostnader. Detta betraktar vi som en
konkurrensfördel. Dessutom har den nye vd:n (tidigare vd på
Lindorff) satt ihop ett starkt team som ska bli effektivare på det
operativa planet.
ÅrskommentarFörändringar i portföljen
Avknoppningar
Precis före sommaren delade både Autoliv och Atlas Copco upp
sina respektive verksamheter i två börsnoterade bolag.
Autoliv lade ut den del av verksamheten som arbetar med aktiv
säkerhet i ett nytt bolag. Aktiv säkerhet är produkter som ska
förhindra en olycka, och bolaget fick namnet Veoneer. Den del av
verksamheten som arbetar med passiv säkerhet, dvs. utrustning
som ska minska konsekvenserna av en redan inträffad olycka, ligger
kvar i moderbolaget som behåller namnet Autoliv. Det slutade med
att vi sålde ut Veoneer ur fonden i augusti. Vad som händer på
marknaden kring aktiv säkerhet är mycket spännande. Den stora
osäkerheten är vilken position bolaget kommer att sluta med. Utan
en god historia, resultat och med brist på underlag för att utvärdera
framtiden, ansåg vi detta bortom vår investeringsfilosofi, med alltför
många osäkerhetsfaktorer. Vi behöll Autoliv.
Atlas Copco valde å sin sida att förlägga den del av verksamheten
som är exponerad mot gruvindustrin i bolaget Epiroc. Här slutade
det också med att vi sålde våra aktier i Epiroc för mer aktier i Atlas
Copco.
I slutet av året fick vi en god nyhet. CVC, som har varit långsiktig
ägare av Ahlsell och fortfarande ägde 25 procent av bolaget efter
börsnoteringen för två år sedan, valde att lägga bud på hela
bolaget. Priset var 33 procent högre än aktuell börskurs och 25
procent över IPO, justerat för erhållen utdelning. Ahlsell var därför
en bra investering för aktieägarna. För att kunna utnyttja andra
köpmöjligheter i korrigeringen valde vi att sälja våra aktier på
marknaden istället för att vänta på den färdiga uppgörelsen i slutet
av februari.
När det gäller beslutet om Clas Ohlson så har detta varit en
investering för oss i 2,5 år. Vi köpte in oss i bolaget när vi trodde att
man lärt sig av misstaget med expansionen i Storbritannien. Detta
var under den tid som bolaget leddes av vd Klas Balkow. De var då
ute på en expansionsresa med Tyskland som nästa anhalt. Med en
filosofi inriktad på historik, framtid och pris så anser vi att det största
felet med vår investering i Clas Ohlson är att bolaget säljer 3,5
procent av sina varor på nätet. Trots ny vd och ny strategi är vi inte
imponerade och det är en del av orsaken till att vi har valt att sälja
av denna position, som utgjorde 1,7 procent av fonden.
Avanza är ett välskött bolag med exponering mot sparande – ett
segment som upplever strukturell tillväxt. Avanza har en stark
nischposition och tack vare sin kapitallätta affärsmodell tror vi att
bolaget har en god position för framtiden. Stark aktiekursutveckling
och höga priser i kombination med att den underliggande
resultattillväxt har varit en besvikelse, har dock fått oss att sälja av
vårt innehav i bolaget. Även om vi gillar bolaget och kulturen finns
det en del orosmoln i och med att fondbranschen i allt högre grad
övergår till att sälja nettoklasser direkt till kunderna. Vi är osäkra på
vilken effekt detta kommer att få på Avanza.
Årskommentar 2018Vad gick bra?
Som nämnts har Avanza varit en bra investering för aktieägarna i ODIN
Sverige, men efter stark kursutveckling har vi sålt oss ut ur bolaget
under andra halvåret.
Förvärvsmaskinen Lifco fortsätter att leverera. Försäljningsintäkterna
och resultatet per aktie fortsätter att öka stadigt. Bolaget rapporterar i år
om goda utsikter i sina dotterbolag och växer stadigt genom nya,
stimulerande förvärv. Bolaget har också en stark balans med kapacitet
för ytterligare förvärv framöver.
2016 knoppades AddLife av från ett annat bolag i portföljen: Addtech.
Bolaget utvecklar och köper lönsamma och marknadsledande
nischbolag inom området medicinsk teknik. Merparten av kunderna
finns inom hälso- och sjukvården i Norden, men AddLife växer också
globalt. Med en förvärvsfokuserad och decentraliserad struktur
säkerställer de en stark entreprenörsanda i sina oberoende dotterbolag,
och det är en typ av bolagsstruktur och affärsmodell som vi i ODIN
uppskattar. 2018 har varit ett bra år för AddLife, med god
topplinjetillväxt och annonsering om nya förvärv. Allt tyder på att
AddLife kommer att fortsätta den starka utvecklingen under de
kommande åren. I november stöttade vi bolaget när de genomförde en
emission som finansierar ytterligare förvärv av en större verksamhet i
Österrike.
NIBE är ett annat svenskt bolag som har levererat mycket bra i år.
Bolaget erbjuder energibesparande lösningar för både hushåll och
industri, vilket bidrar till energieffektiva bostäder och byggnader. Nibe är
ett typiskt kvalitetsbolag som passar in i vår investeringsfilosofi. De har
en distinkt affärsidé och fokuserar på kvalitet och bra lösningar. De kan
hänvisa till en god historia och en stark bolagskultur. Vi tror fortfarande
att Nibe har många spännande år framför sig.
Efter ett turbulent aktieår är de positiva bidragsgivarna få, men det finns
några som har presterat mycket bra i 2018 trots fallande börser. Som
exempel kan Beijer Ref, Addnode, Avanza Bank, Lifco, AddLife och
NIBE nämnas.
Beijer Ref verkar på en stark marknad och fortsätter att rida på den
lagstadgade utfasningen av kylmedel i kylanläggningar. Detta beror på
att innan 2030 måste alla livsmedelsbutiker och restauranger ersätta sin
kylutrustning för att uppfylla nya EU-krav på utsläpp av farlig gas. I
Sverige har endast tio procent gjort denna investering hittills. Bolaget
driver sin verksamhet globalt och expanderar stadigt, senast med stora
förvärv i Australien och Asien. Ökade krav på miljövänliga lösningar och
en global exponering bidrar till att öka efterfrågan på Beijer Ref och
deras produkter under de kommande åren. Med gynnsamma
marknadsförutsättningar som bakgrund är bolagets starka resultat
under det senaste året inte någon överraskning.
Addnode är en ledande leverantör av programvara och andra IT-
tjänster som hjälper till med att digitalisera samhället. Deras
kärnverksamhet ligger inom design, konstruktion och produktdata. De är
också en ledande aktör inom dokument- och ledningssystem, där de
tillhandahåller tjänster och lösningar till den offentliga sektorn i Sverige
och Norge. Bolaget har vuxit med totalt 15 procent årligen sedan 2013,
både genom organisk tillväxt och förvärv av kompletterande
verksamheter. I år har de kvartalsvisa siffrorna varit bättre än väntat,
något som har premierats av marknaden med en stigande aktiekurs. Vi
tror att bolaget är väl positionerat för att fortsätta växa under många år
framöver och är positivt inställda till bolagets exponering och
positionering inom den starka digitaliseringstrenden inom både privat
och offentlig sektor. I somras genomförde Addnode en riktad
nyemission som kommer att bidra till att finansiera ytterligare tillväxt
genom förvärv, vilket vi är positiva till. Vi deltog därför i emissionen.
Årskommentar 2018 Vad gick mindre bra?
Förra året köpte vi in oss i Ahlstrom-Munksjö, en global ledare
inom fiberbaserade material. Bolaget har grundläggande
egenskaper som vi värdesätter, bland annat att man är
marknadsledande i nischer som skyddas av starka kundrelationer
via kontinuerlig produktutveckling. Högre priser för massa och
titandioxid har lett till ett fortsatt marginaltryck som har belastat
aktien under hela året. Vi ser tecken på att marginalpressen ger sig
nu, samtidigt som bolaget har meddelat att man vidtar åtgärder för
att vända de olönsamma delarna av verksamheten. Vi tror att
bolaget har kontroll över situationen och kommer att komma tillbaka
starkt, då också med hjälp av synergier från de två stora förvärven
av Expera (USA) och Caieiras (Brasilien) som slutfördes i oktober i
år.
Efter en stark inledning på året har Oriflames aktiekurs varit under
stark press sedan i början av maj. Resultaten från första halvåret
var svagare än väntat och drevs av prishöjningar till kunderna, vilket
gav negativ effekt på efterfrågan. Vi tror att rädslan för att Oriflame
kommer att få se svag topplinjetillväxt och negativ
marginalutveckling under de kommande åren är överdriven. Vi tittar
nu på de låga förväntningar som ligger bakom dagens aktiekurs.
De svagaste bidragsgivarna i 2018 var Byggmax, AQ Group,
Ahlstrom-Munksjö och Oriflame.
Byggmax har en stark marknadsposition, men vinsten dämpas av
att Skånska Byggvaror genomgår en omstrukturering.
Vändningsarbetet har fortsatt under 2018, vilket har hållit tillbaka
gruppen något. Efter sommaren redovisade Byggmax både svagare
försäljning och marginaler på grund av den varma väderleken i
sommar och högre priser på virke. Det är positivt att
förändringsprocessen i Skånska Byggvaror ser ut att börja få effekt.
Bolagets utmaningar är redan inbakade i priset på aktien och vi är
övertygade om att ledningen kommer att få bolaget på banan igen.
2018 har varit ett utmanande år för AQ Group. Bolaget har
rapporterat om fortsatt stark organisk försäljningstillväxt, men tyvärr
har rörelsemarginalerna pressats på grund av svagare operationell
verksamhet i vissa dotterbolag samt högre råvarupriser. I egenskap
av långsiktiga investerare är vi dock naturligtvis beredda på att
resultaten svänger på kort- och medellång sikt. Vi anser att en hel
del av de utmaningar som bolaget tampas med är av övergående
art och känner oss trygga med att ledningen ska kunna vända den
negativa marginaltrenden.

Den globala konjunkturen är stark, men makroindikatorer har på
sistone pekat på en svagare utveckling. Norden, som är en
exportinriktad region, är emellertid sällan ensam om att uppleva
recession. Vi ser ingen stor risk för recession så länge räntor och
inflation håller sig på låga nivåer. Svagare makrostatistik och ökad
risk för negativa ekonomiska följder av ett uppseglande handelskrig
har emellertid ökat under det gångna halvåret.
Som vi ser det är de största riskerna knutna till ränteutvecklingen
och stimulanser från centralbanken. 10 år av sjunkande räntor har
fungerat som ett dopingpreparat på ekonomin. Mindre av den varan
utgör en uppenbar risk för tillväxten i världsekonomin. FED:s
trevande räntehöjningar hoppas vi ska verka "lärande" på resten av
världen. Snabba och tvära ändringar av detta mönster utgör en
uppenbar risk framöver.
Som vi har beskrivit tidigare har vi gjort ett antal förändringar i
portföljen under hela året för att förbättra den. ODIN Sverige
förväntas ge en direktavkastning på drygt tre procent i år. Fonden är
prissatt till 14,7 gånger årets resultat, vilket är marginellt högre än
referensindex. När det gäller de bokförda värdena är fondens
prissättning något högre. Detta beror på att fonden har högre
avkastning på sitt kapital.
Årskommentar ODIN SverigeUtsikter för 2019
Fonden består idag av 48 procent små bolag, 32 procent
medelstora bolag och 20 procent stora bolag. Börskorrigeringen har
gjort att några av våra större och medelstora bolag har gått över till
att bli små och medelstora bolag. Vårt minsta bolag i fonden är
Byggmax med ett marknadsvärde på cirka 2 miljarder SEK. Vi har
en all cap-fond som ska ta del av de möjligheter vi hittar där ute,
oavsett om det är små eller stora bolag.
Jämfört med den historiska prissättningen handlar marknaden nu
något över genomsnittet mellan 2007 och idag, något som inte
verkar avskräckande med tanke på rådande låga ränteläge. Som
sagt, vi rör oss mot slutet av en högkonjunktur. Som aktiv
aktieväljare kommer det alltid att finnas möjligheter att hitta bolag
som också kan utvecklas väl i en lågkonjunktur. Därför anser vi att
det blir allt viktigare att vara aktiv i tiden framöver. Det går alltid att
hitta bolag med god kapitalavkastning, lönsam tillväxt och attraktiv
prislapp.
Med förhoppning om ett gott investeringsår 2019!
Nyckeltal och nyheter från
portföljen
- presenterat på engelska
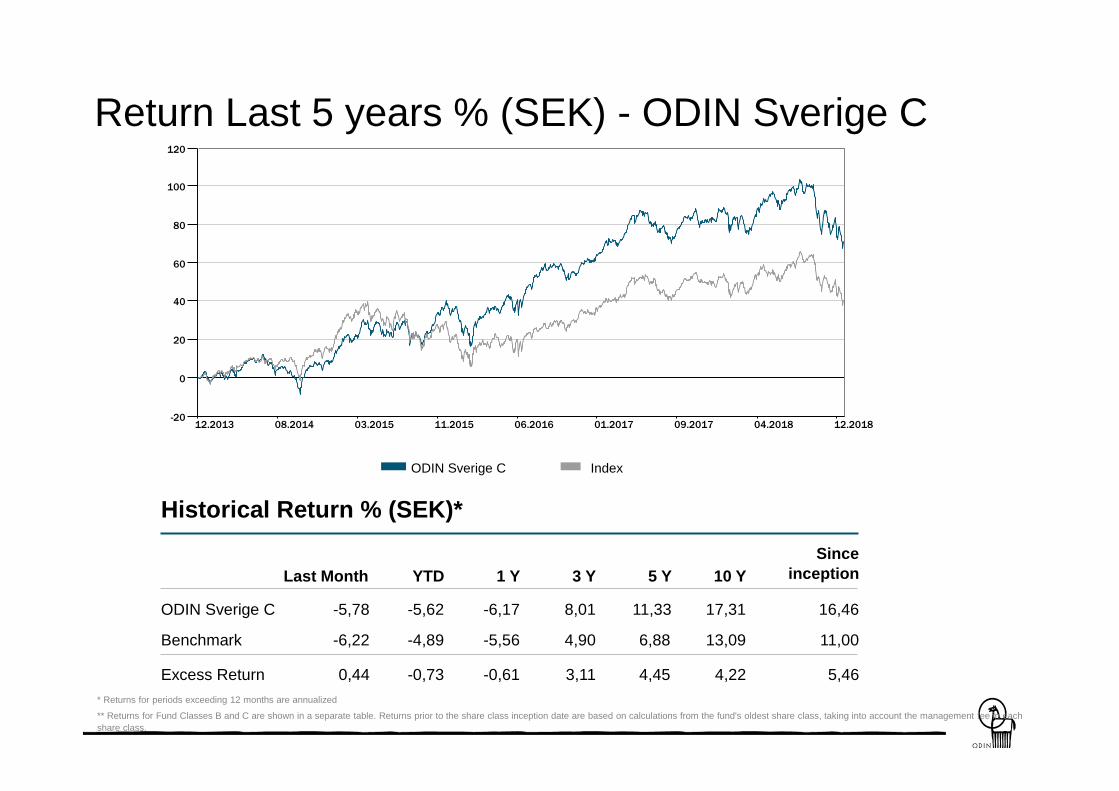
ODIN Sverige C Index
Return Last 5 years % (SEK) - ODIN Sverige C
Historical Return % (SEK)*
* Returns for periods exceeding 12 months are annualized
Last Month YTD 1 Y 3 Y 5 Y 10 Y
Since
inception
ODIN Sverige C
Benchmark
-5,78
-6,22
-5,62
-4,89
-6,17
-5,56
8,01
4,90
11,33
6,88
17,31
13,09
16,46
11,00
Excess Return 0,44 -0,73 -0,61 3,11 4,45 4,22 5,46
** Returns for Fund Classes B and C are shown in a separate table. Returns prior to the share class inception date are based on calculations from the fund's oldest share class, taking into account the management fee in each
share class.
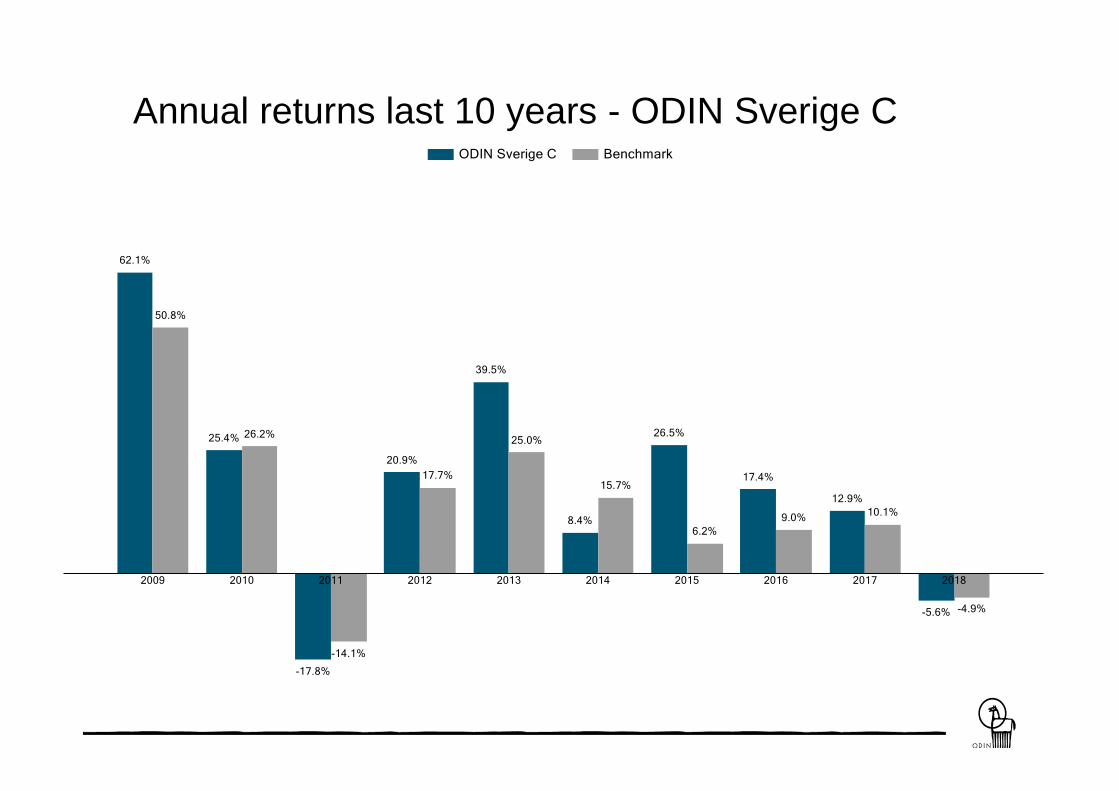
Annual returns last 10 years - ODIN Sverige C
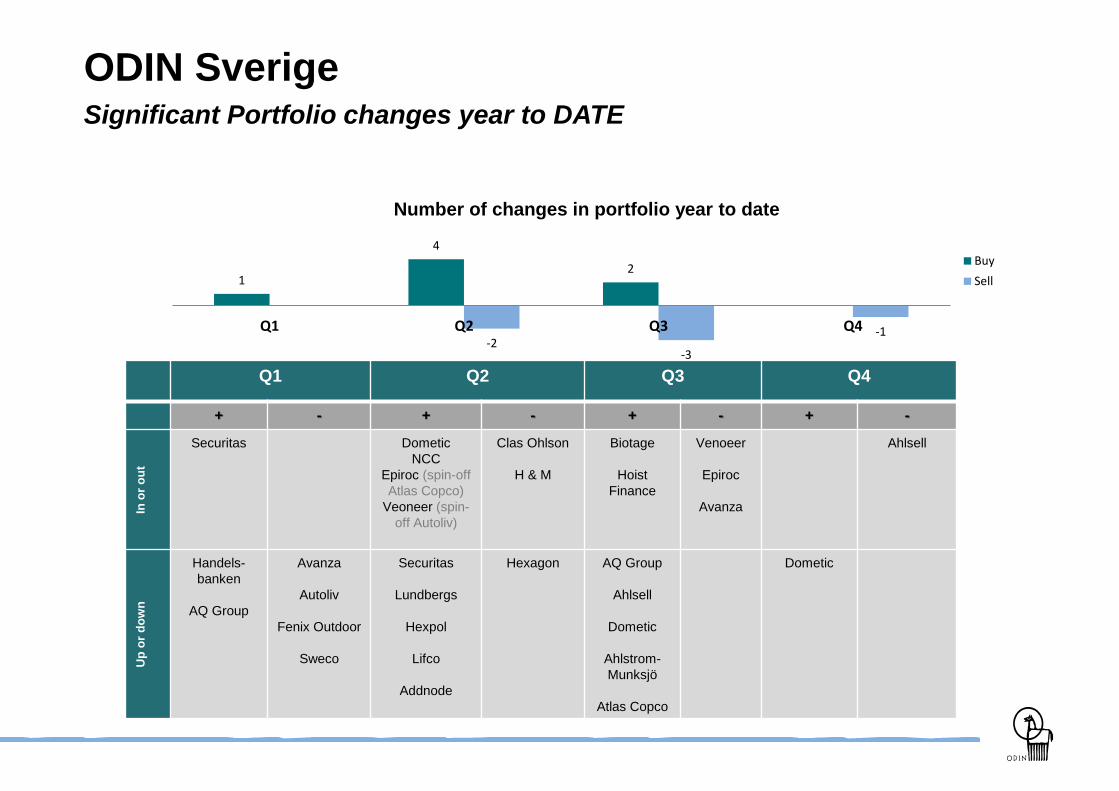
ODIN SverigeSignificant Portfolio changes year to DATE
1
4
2
-2-3
-1Q1 Q2 Q3 Q4
Number of changes in portfolio year to date
Buy
Sell
Q1 Q2 Q3 Q4
+ - + - + - + -
In o
r o
ut
Securitas Dometic
NCC
Epiroc (spin-off
Atlas Copco)
Veoneer (spin-
off Autoliv)
Clas Ohlson
H & M
Biotage
Hoist
Finance
Venoeer
Epiroc
Avanza
Ahlsell
Up
or
do
wn
Handels-
banken
AQ Group
Avanza
Autoliv
Fenix Outdoor
Sweco
Securitas
Lundbergs
Hexpol
Lifco
Addnode
Hexagon AQ Group
Ahlsell
Dometic
Ahlstrom-
Munksjö
Atlas Copco
Dometic
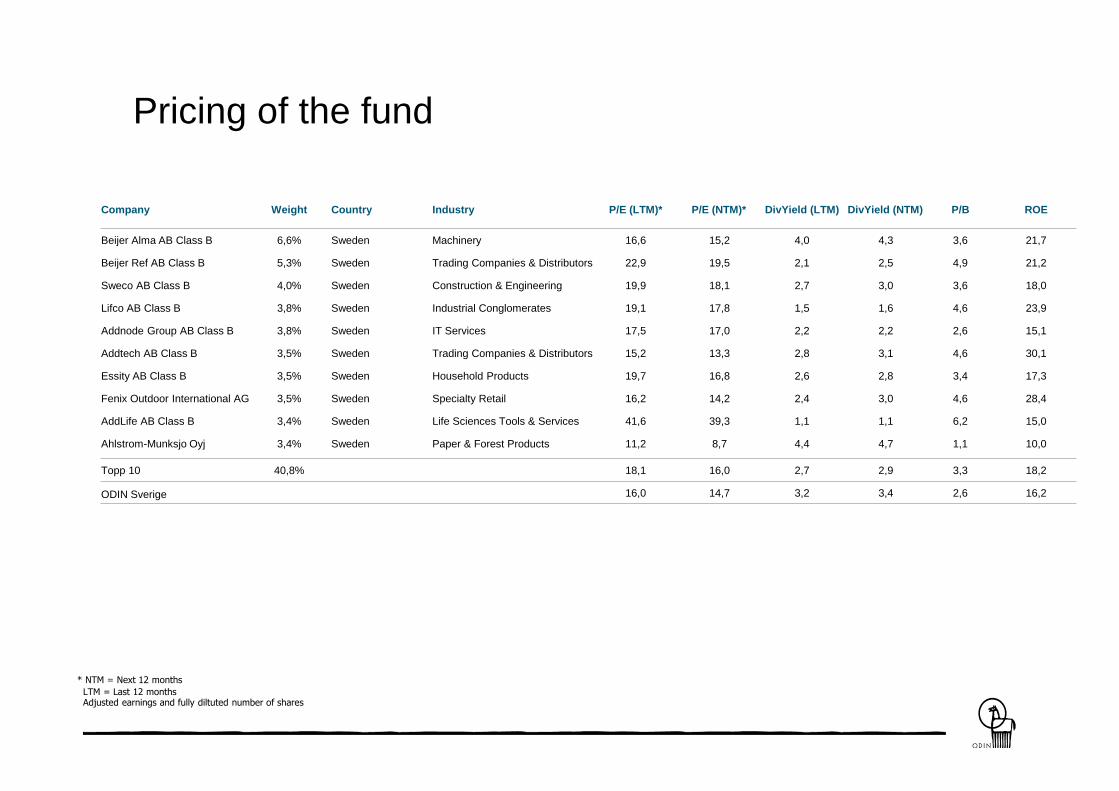
Pricing of the fund
Company Weight Country Industry P/E (LTM)* P/E (NTM)* DivYield (LTM) DivYield (NTM) P/B ROE
Beijer Alma AB Class B 6,6% Sweden Machinery 16,6 15,2 4,0 4,3 3,6 21,7
Beijer Ref AB Class B 5,3% Sweden Trading Companies & Distributors 22,9 19,5 2,1 2,5 4,9 21,2
Sweco AB Class B 4,0% Sweden Construction & Engineering 19,9 18,1 2,7 3,0 3,6 18,0
Lifco AB Class B 3,8% Sweden Industrial Conglomerates 19,1 17,8 1,5 1,6 4,6 23,9
Addnode Group AB Class B 3,8% Sweden IT Services 17,5 17,0 2,2 2,2 2,6 15,1
Addtech AB Class B 3,5% Sweden Trading Companies & Distributors 15,2 13,3 2,8 3,1 4,6 30,1
Essity AB Class B 3,5% Sweden Household Products 19,7 16,8 2,6 2,8 3,4 17,3
Fenix Outdoor International AG 3,5% Sweden Specialty Retail 16,2 14,2 2,4 3,0 4,6 28,4
AddLife AB Class B 3,4% Sweden Life Sciences Tools & Services 41,6 39,3 1,1 1,1 6,2 15,0
Ahlstrom-Munksjo Oyj 3,4% Sweden Paper & Forest Products 11,2 8,7 4,4 4,7 1,1 10,0
Topp 10 40,8% 18,1 16,0 2,7 2,9 3,3 18,2
ODIN Sverige 16,0 14,7 3,2 3,4 2,6 16,2
* NTM = Next 12 months
LTM = Last 12 monthsAdjusted earnings and fully diltuted number of shares
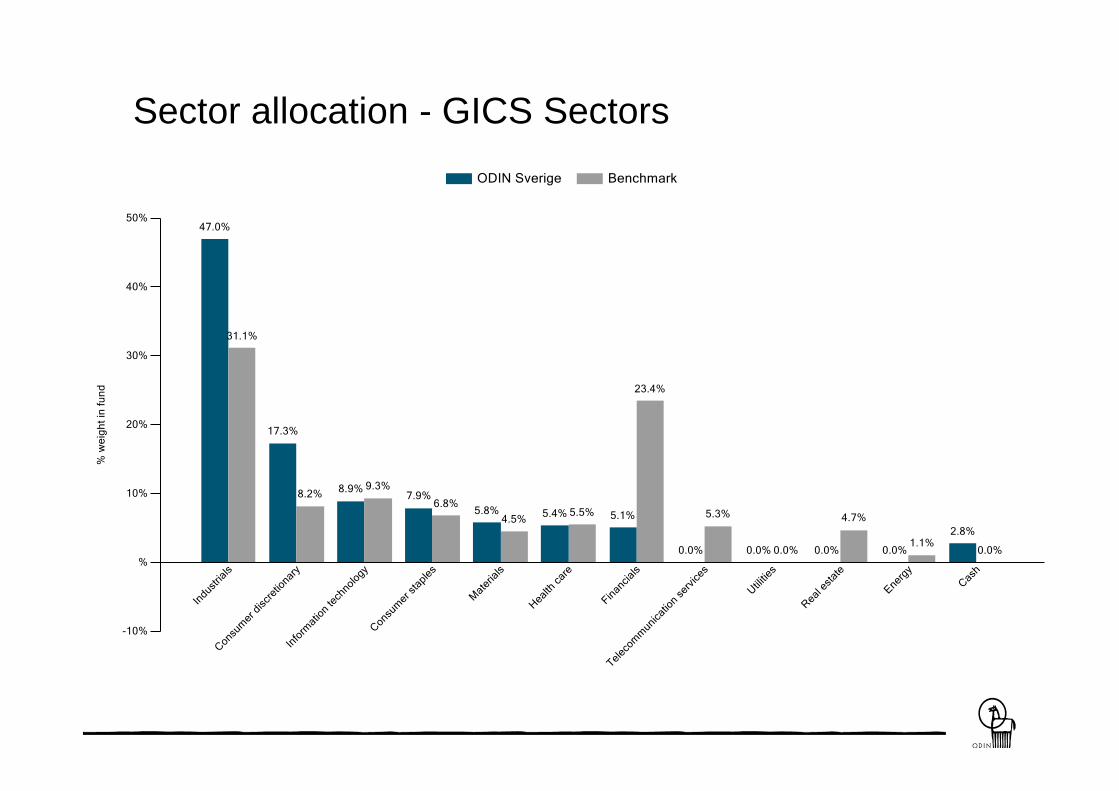
Sector allocation - GICS Sectors
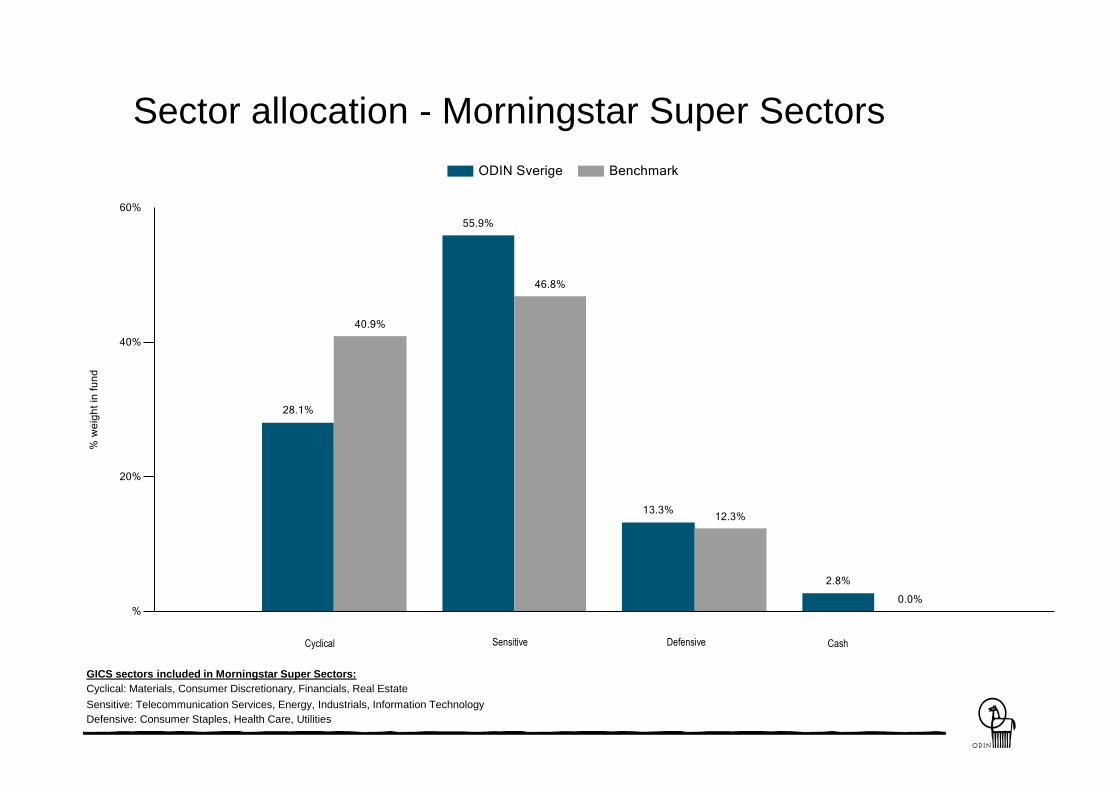
Sector allocation - Morningstar Super Sectors
GICS sectors included in Morningstar Super Sectors:
Cyclical: Materials, Consumer Discretionary, Financials, Real Estate
Sensitive: Telecommunication Services, Energy, Industrials, Information Technology
Defensive: Consumer Staples, Health Care, Utilities
Cyclical Sensitive Defensive Cash

Current holdings

*) Share price performance for equities included in the benchmark. Equities not included in the benchmark are calculated from portfolio figures.
(Sorted by weight in portfolio)
Share price performance*, year to date (SEK)
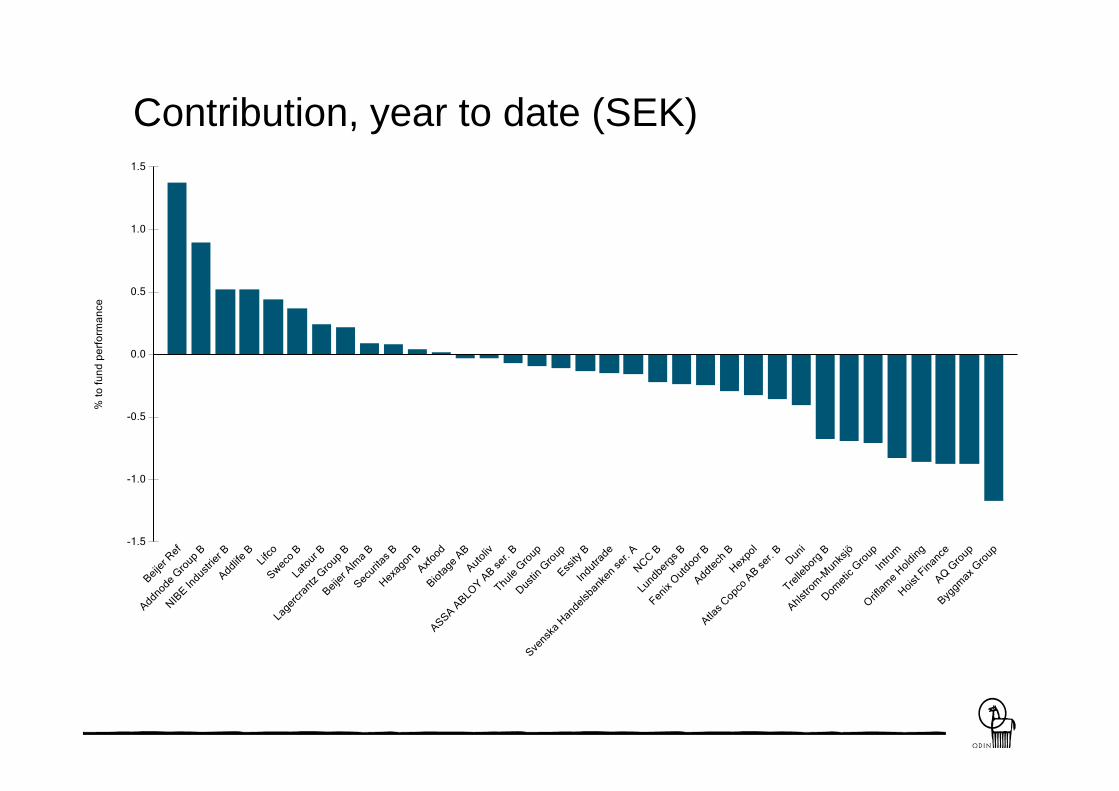
Contribution, year to date (SEK)
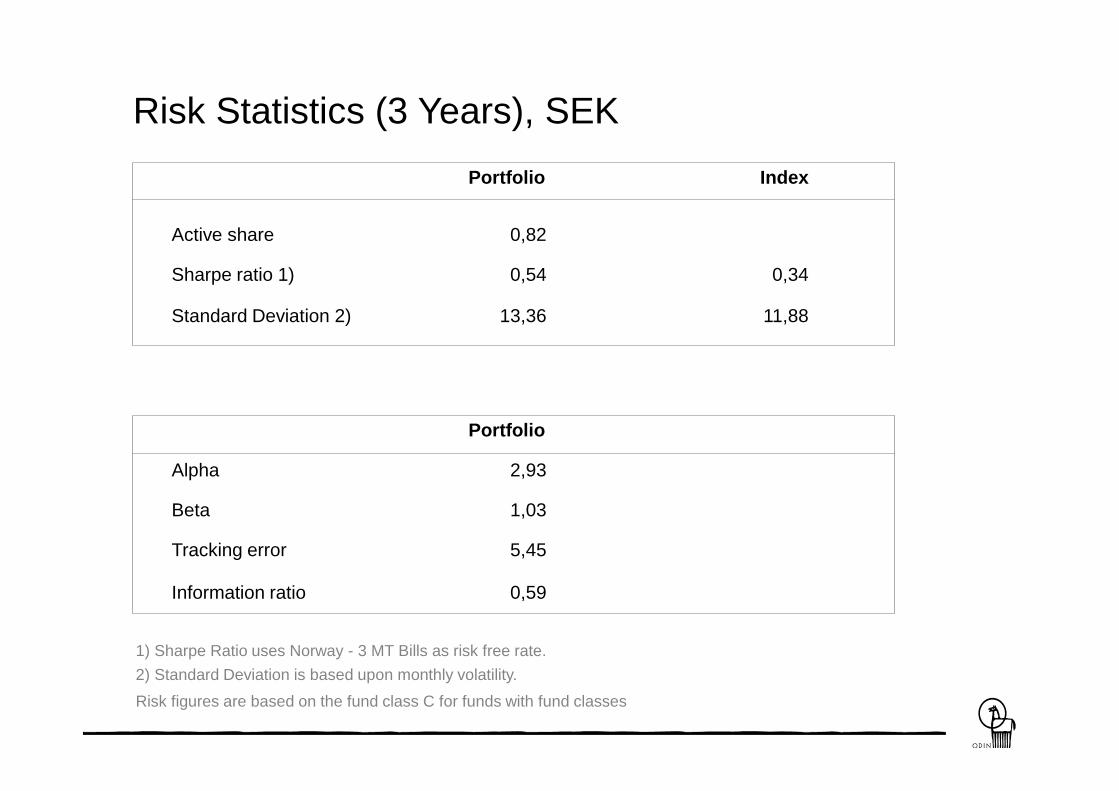
1) Sharpe Ratio uses Norway - 3 MT Bills as risk free rate.
2) Standard Deviation is based upon monthly volatility.
Risk Statistics (3 Years), SEK
Active share 0,82
Sharpe ratio 1) 0,54
Portfolio
Standard Deviation 2) 13,36
Index
0,34
11,88
Portfolio
Alpha 2,93
Beta 1,03
Tracking error 5,45
Information ratio 0,59
Risk figures are based on the fund class C for funds with fund classes
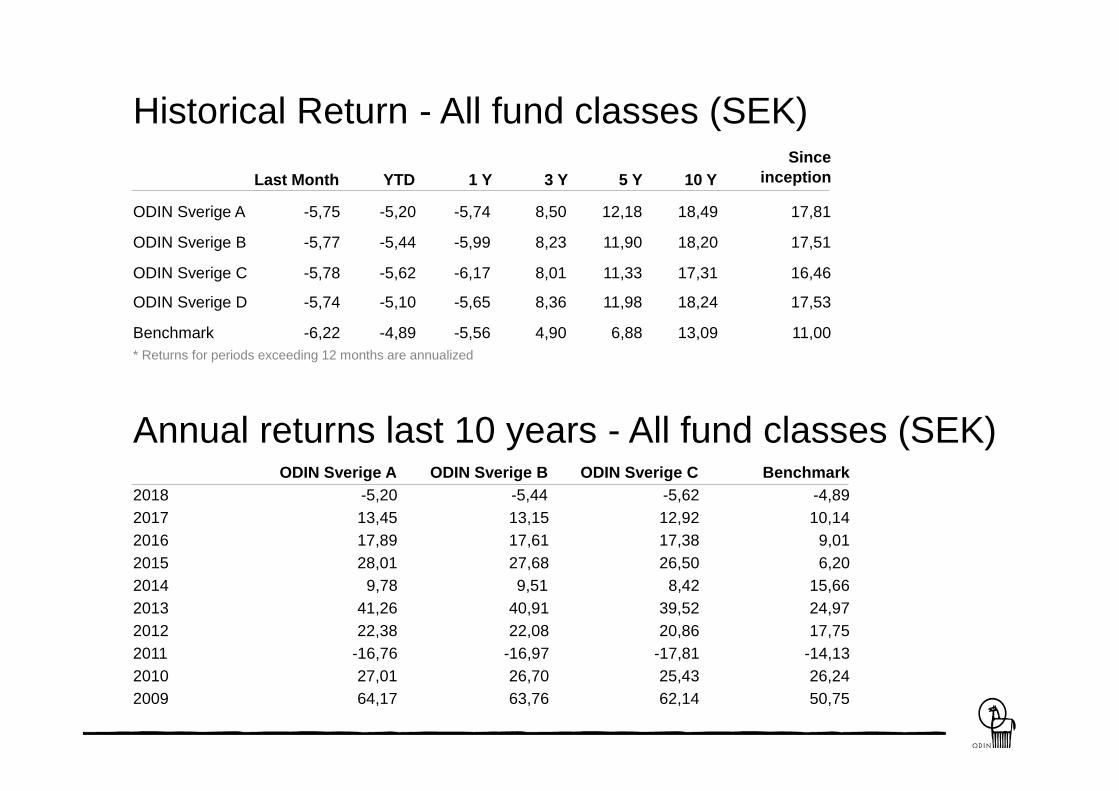
Historical Return - All fund classes (SEK)
Last Month YTD 1 Y 3 Y 5 Y 10 Y
Since
inception
ODIN Sverige A -5,75 -5,20 -5,74 8,50 12,18 18,49 17,81
ODIN Sverige B -5,77 -5,44 -5,99 8,23 11,90 18,20 17,51
ODIN Sverige C -5,78 -5,62 -6,17 8,01 11,33 17,31 16,46
ODIN Sverige D -5,74 -5,10 -5,65 8,36 11,98 18,24 17,53
Benchmark -6,22 -4,89 -5,56 4,90 6,88 13,09 11,00
* Returns for periods exceeding 12 months are annualized
Annual returns last 10 years - All fund classes (SEK)ODIN Sverige A
2018 -5,20
2017 13,45
2016 17,89
2015 28,01
2014 9,78
2013 41,26
2012 22,38
2011 -16,76
2010 27,01
2009 64,17
ODIN Sverige B
-5,44
13,15
17,61
27,68
9,51
40,91
22,08
-16,97
26,70
63,76
ODIN Sverige C
-5,62
12,92
17,38
26,50
8,42
39,52
20,86
-17,81
25,43
62,14
Benchmark
-4,89
10,14
9,01
6,20
15,66
24,97
17,75
-14,13
26,24
50,75
Macro and Market

Pricing - Swedish Equities (OMX Stockholm Benchmark Cap.)
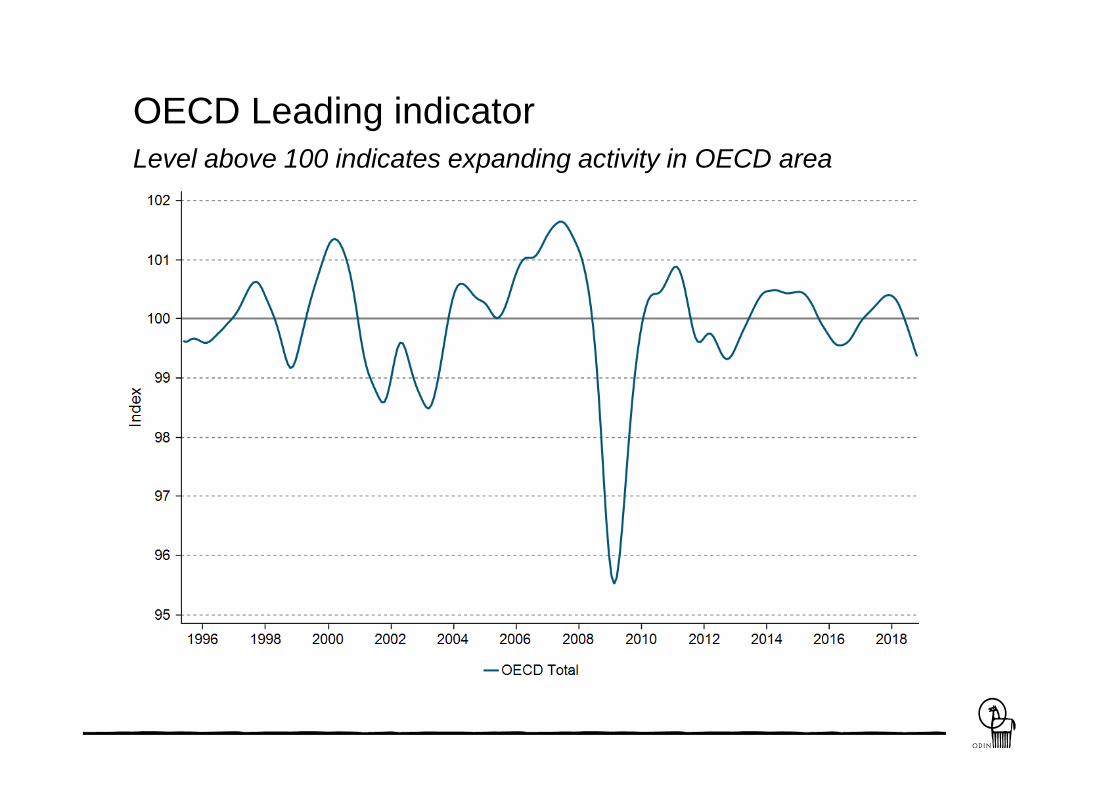
OECD Leading indicator
Level above 100 indicates expanding activity in OECD area
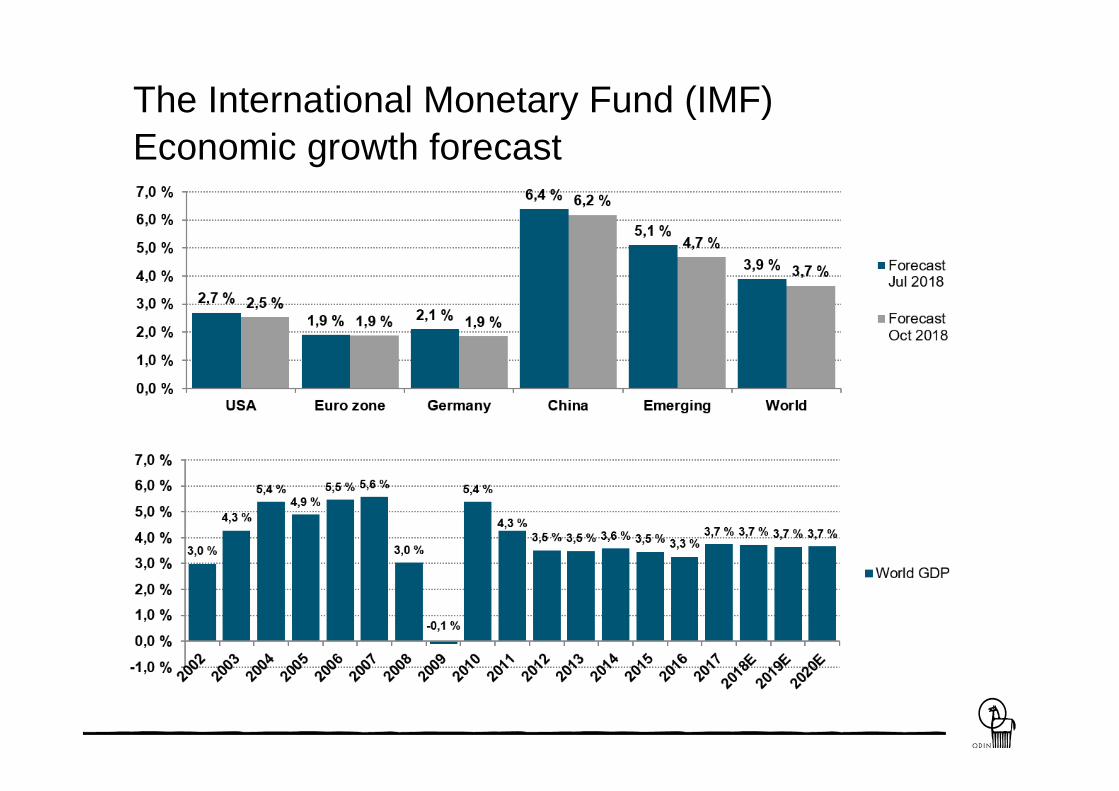
The International Monetary Fund (IMF)
Economic growth forecast
Investments
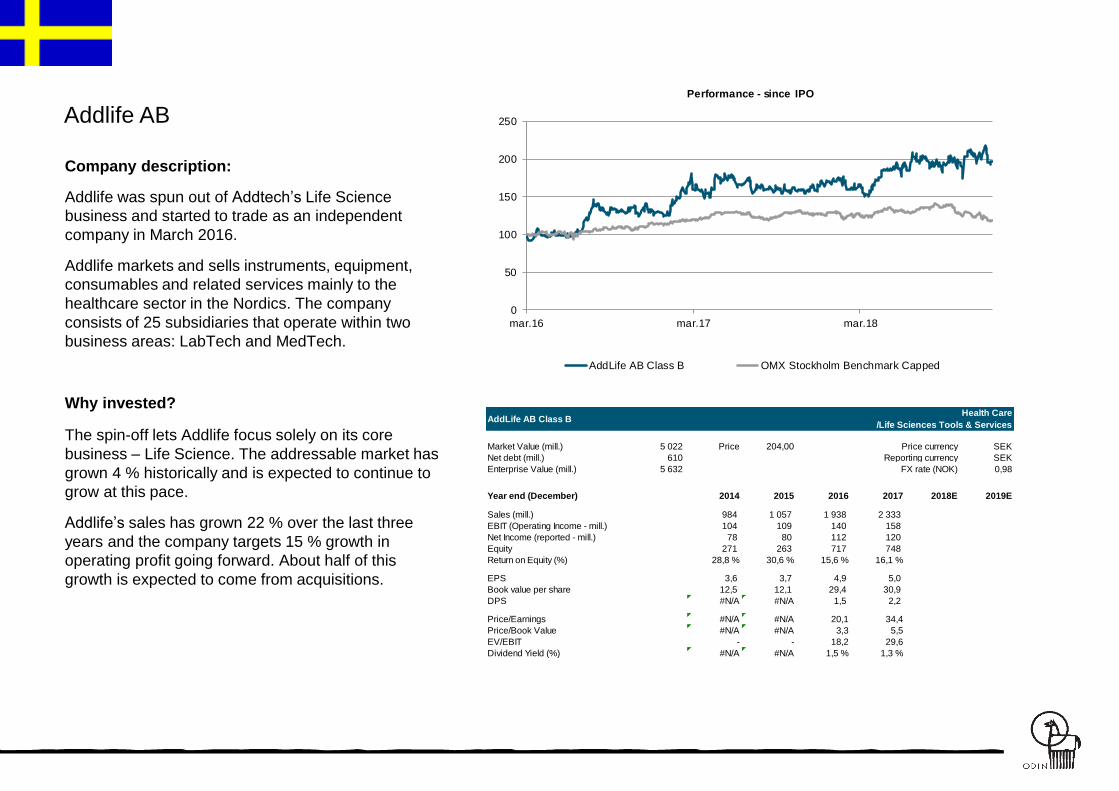
Addlife AB
Company description:
Addlife was spun out of Addtech’s Life Science
business and started to trade as an independent
company in March 2016.
Addlife markets and sells instruments, equipment,
consumables and related services mainly to the
healthcare sector in the Nordics. The company
consists of 25 subsidiaries that operate within two
business areas: LabTech and MedTech.
Why invested?
The spin-off lets Addlife focus solely on its core
business – Life Science. The addressable market has
grown 4 % historically and is expected to continue to
grow at this pace.
Addlife’s sales has grown 22 % over the last three
years and the company targets 15 % growth in
operating profit going forward. About half of this
growth is expected to come from acquisitions.
0
50
100
150
200
250
mar.16 mar.17 mar.18
Performance - since IPO
AddLife AB Class B OMX Stockholm Benchmark Capped
Market Value (mill.) 5 022 Price 204,00 SEK
Net debt (mill.) 610 SEK
Enterprise Value (mill.) 5 632 0,98
Year end (December) 2014 2015 2016 2017 2018E 2019E
Sales (mill.) 984 1 057 1 938 2 333
EBIT (Operating Income - mill.) 104 109 140 158
Net Income (reported - mill.) 78 80 112 120
Equity 271 263 717 748
Return on Equity (%) 28,8 % 30,6 % 15,6 % 16,1 %
EPS 3,6 3,7 4,9 5,0
Book value per share 12,5 12,1 29,4 30,9
DPS #N/A #N/A 1,5 2,2
Price/Earnings #N/A #N/A 20,1 34,4
Price/Book Value #N/A #N/A 3,3 5,5
EV/EBIT - - 18,2 29,6
Dividend Yield (%) #N/A #N/A 1,5 % 1,3 %
AddLife AB Class BHealth Care
/Life Sciences Tools & Services
Price currency
Reporting currency
FX rate (NOK)
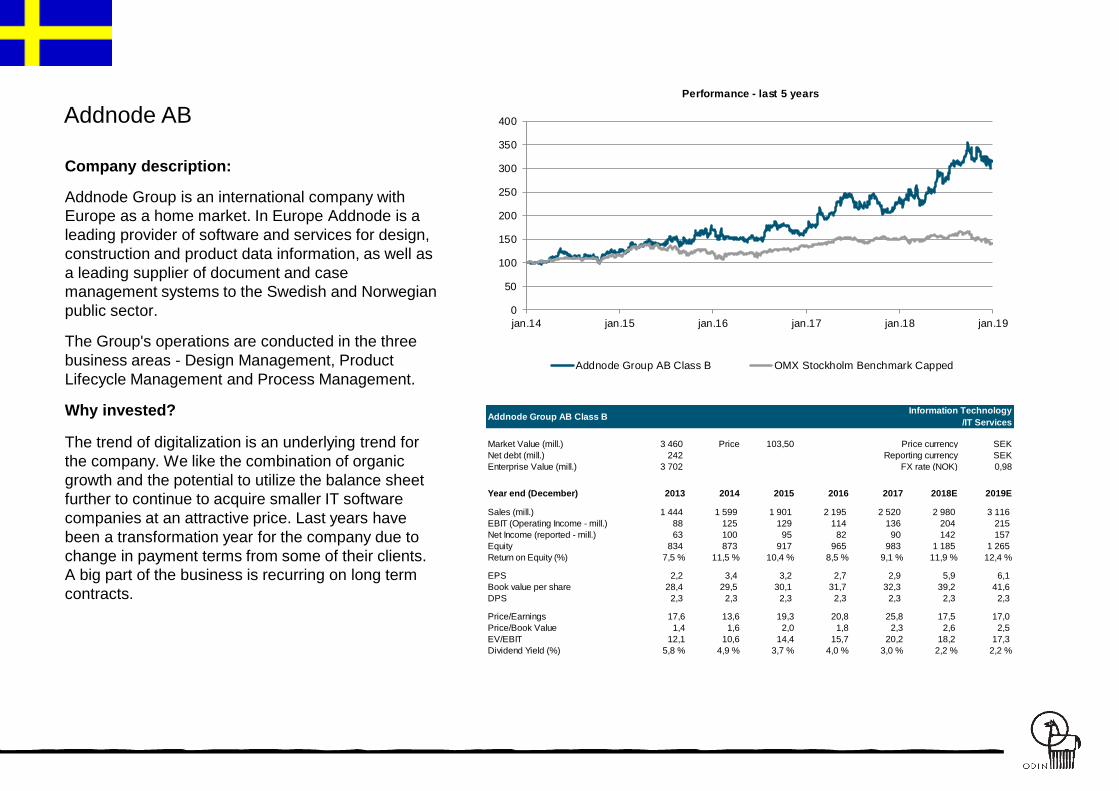
Addnode AB
Company description:
Addnode Group is an international company with
Europe as a home market. In Europe Addnode is a
leading provider of software and services for design,
construction and product data information, as well as
a leading supplier of document and case
management systems to the Swedish and Norwegian
public sector.
The Group's operations are conducted in the three
business areas - Design Management, Product
Lifecycle Management and Process Management.
Why invested?
The trend of digitalization is an underlying trend for
the company. We like the combination of organic
growth and the potential to utilize the balance sheet
further to continue to acquire smaller IT software
companies at an attractive price. Last years have
been a transformation year for the company due to
change in payment terms from some of their clients.
A big part of the business is recurring on long term
contracts.
Market Value (mill.) 3 460 Price 103,50 SEK
Net debt (mill.) 242 SEK
Enterprise Value (mill.) 3 702 0,98
Year end (December) 2013 2014 2015 2016 2017 2018E 2019E
Sales (mill.) 1 444 1 599 1 901 2 195 2 520 2 980 3 116
EBIT (Operating Income - mill.) 88 125 129 114 136 204 215
Net Income (reported - mill.) 63 100 95 82 90 142 157
Equity 834 873 917 965 983 1 185 1 265
Return on Equity (%) 7,5 % 11,5 % 10,4 % 8,5 % 9,1 % 11,9 % 12,4 %
EPS 2,2 3,4 3,2 2,7 2,9 5,9 6,1
Book value per share 28,4 29,5 30,1 31,7 32,3 39,2 41,6
DPS 2,3 2,3 2,3 2,3 2,3 2,3 2,3
Price/Earnings 17,6 13,6 19,3 20,8 25,8 17,5 17,0
Price/Book Value 1,4 1,6 2,0 1,8 2,3 2,6 2,5
EV/EBIT 12,1 10,6 14,4 15,7 20,2 18,2 17,3
Dividend Yield (%) 5,8 % 4,9 % 3,7 % 4,0 % 3,0 % 2,2 % 2,2 %
Addnode Group AB Class BInformation Technology
/IT Services
Price currency
Reporting currency
FX rate (NOK)
0
50
100
150
200
250
300
350
400
jan.14 jan.15 jan.16 jan.17 jan.18 jan.19
Performance - last 5 years
Addnode Group AB Class B OMX Stockholm Benchmark Capped
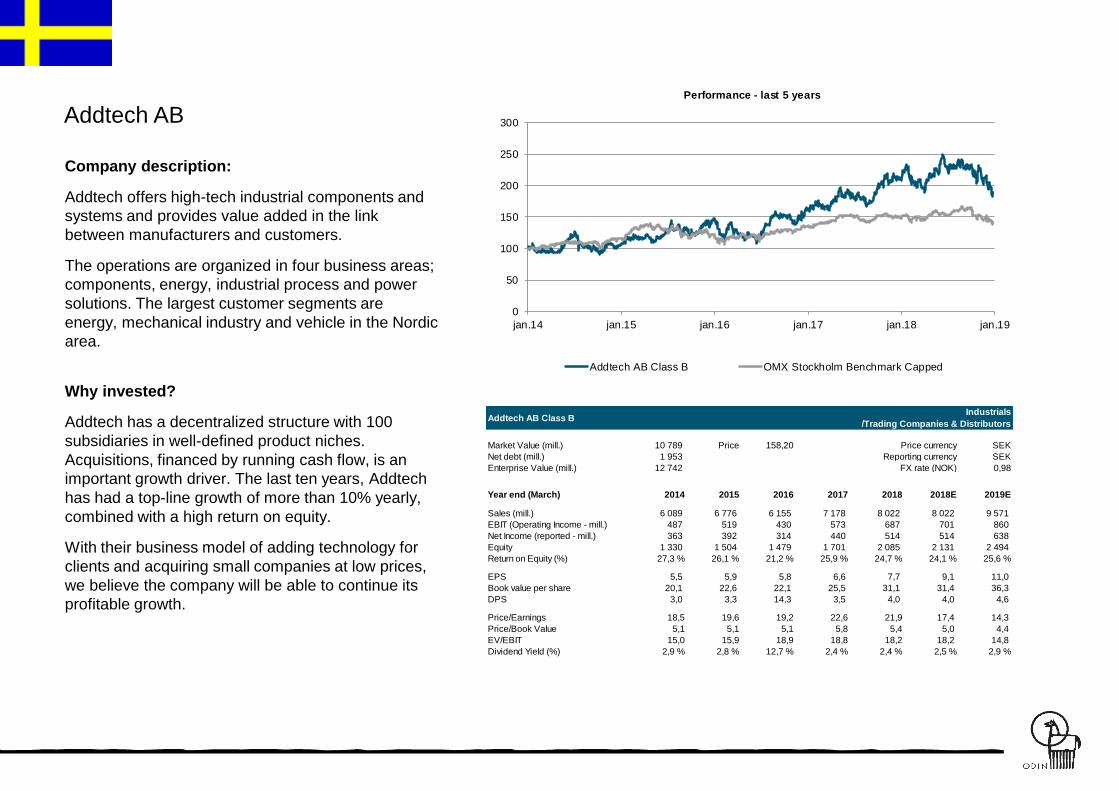
Addtech AB
Company description:
Addtech offers high-tech industrial components and
systems and provides value added in the link
between manufacturers and customers.
The operations are organized in four business areas;
components, energy, industrial process and power
solutions. The largest customer segments are
energy, mechanical industry and vehicle in the Nordic
area.
Why invested?
Addtech has a decentralized structure with 100
subsidiaries in well-defined product niches.
Acquisitions, financed by running cash flow, is an
important growth driver. The last ten years, Addtech
has had a top-line growth of more than 10% yearly,
combined with a high return on equity.
With their business model of adding technology for
clients and acquiring small companies at low prices,
we believe the company will be able to continue its
profitable growth.
Market Value (mill.) 10 789 Price 158,20 SEK
Net debt (mill.) 1 953 SEK
Enterprise Value (mill.) 12 742 0,98
Year end (March) 2014 2015 2016 2017 2018 2018E 2019E
Sales (mill.) 6 089 6 776 6 155 7 178 8 022 8 022 9 571
EBIT (Operating Income - mill.) 487 519 430 573 687 701 860
Net Income (reported - mill.) 363 392 314 440 514 514 638
Equity 1 330 1 504 1 479 1 701 2 085 2 131 2 494
Return on Equity (%) 27,3 % 26,1 % 21,2 % 25,9 % 24,7 % 24,1 % 25,6 %
EPS 5,5 5,9 5,8 6,6 7,7 9,1 11,0
Book value per share 20,1 22,6 22,1 25,5 31,1 31,4 36,3
DPS 3,0 3,3 14,3 3,5 4,0 4,0 4,6
Price/Earnings 18,5 19,6 19,2 22,6 21,9 17,4 14,3
Price/Book Value 5,1 5,1 5,1 5,8 5,4 5,0 4,4
EV/EBIT 15,0 15,9 18,9 18,8 18,2 18,2 14,8
Dividend Yield (%) 2,9 % 2,8 % 12,7 % 2,4 % 2,4 % 2,5 % 2,9 %
Addtech AB Class BIndustrials
/Trading Companies & Distributors
Price currency
Reporting currency
FX rate (NOK)
0
50
100
150
200
250
300
jan.14 jan.15 jan.16 jan.17 jan.18 jan.19
Performance - last 5 years
Addtech AB Class B OMX Stockholm Benchmark Capped
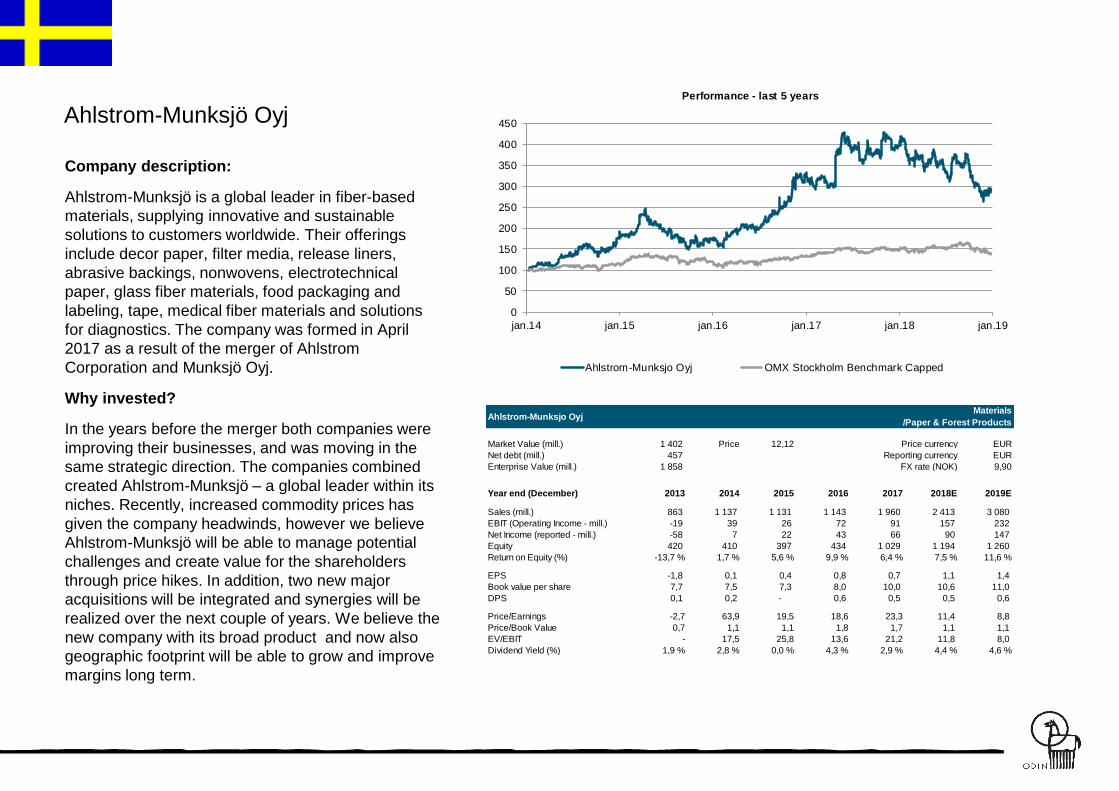
Ahlstrom-Munksjö Oyj
Company description:
Ahlstrom-Munksjö is a global leader in fiber-based
materials, supplying innovative and sustainable
solutions to customers worldwide. Their offerings
include decor paper, filter media, release liners,
abrasive backings, nonwovens, electrotechnical
paper, glass fiber materials, food packaging and
labeling, tape, medical fiber materials and solutions
for diagnostics. The company was formed in April
2017 as a result of the merger of Ahlstrom
Corporation and Munksjö Oyj.
Why invested?
In the years before the merger both companies were
improving their businesses, and was moving in the
same strategic direction. The companies combined
created Ahlstrom-Munksjö – a global leader within its
niches. Recently, increased commodity prices has
given the company headwinds, however we believe
Ahlstrom-Munksjö will be able to manage potential
challenges and create value for the shareholders
through price hikes. In addition, two new major
acquisitions will be integrated and synergies will be
realized over the next couple of years. We believe the
new company with its broad product and now also
geographic footprint will be able to grow and improve
margins long term.
Market Value (mill.) 1 402 Price 12,12 EUR
Net debt (mill.) 457 EUR
Enterprise Value (mill.) 1 858 9,90
Year end (December) 2013 2014 2015 2016 2017 2018E 2019E
Sales (mill.) 863 1 137 1 131 1 143 1 960 2 413 3 080
EBIT (Operating Income - mill.) -19 39 26 72 91 157 232
Net Income (reported - mill.) -58 7 22 43 66 90 147
Equity 420 410 397 434 1 029 1 194 1 260
Return on Equity (%) -13,7 % 1,7 % 5,6 % 9,9 % 6,4 % 7,5 % 11,6 %
EPS -1,8 0,1 0,4 0,8 0,7 1,1 1,4
Book value per share 7,7 7,5 7,3 8,0 10,0 10,6 11,0
DPS 0,1 0,2 - 0,6 0,5 0,5 0,6
Price/Earnings -2,7 63,9 19,5 18,6 23,3 11,4 8,8
Price/Book Value 0,7 1,1 1,1 1,8 1,7 1,1 1,1
EV/EBIT - 17,5 25,8 13,6 21,2 11,8 8,0
Dividend Yield (%) 1,9 % 2,8 % 0,0 % 4,3 % 2,9 % 4,4 % 4,6 %
Ahlstrom-Munksjo OyjMaterials
/Paper & Forest Products
Price currency
Reporting currency
FX rate (NOK)
0
50
100
150
200
250
300
350
400
450
jan.14 jan.15 jan.16 jan.17 jan.18 jan.19
Performance - last 5 years
Ahlstrom-Munksjo Oyj OMX Stockholm Benchmark Capped
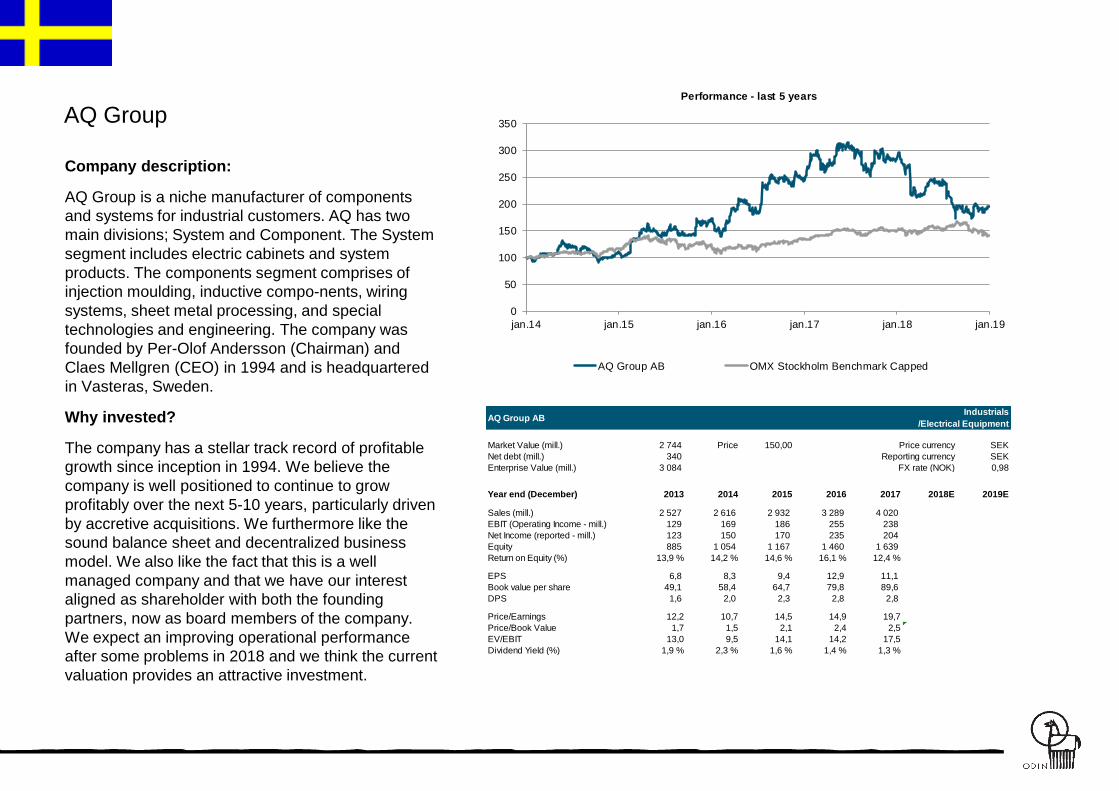
AQ Group
Company description:
AQ Group is a niche manufacturer of components
and systems for industrial customers. AQ has two
main divisions; System and Component. The System
segment includes electric cabinets and system
products. The components segment comprises of
injection moulding, inductive compo-nents, wiring
systems, sheet metal processing, and special
technologies and engineering. The company was
founded by Per-Olof Andersson (Chairman) and
Claes Mellgren (CEO) in 1994 and is headquartered
in Vasteras, Sweden.
Why invested?
The company has a stellar track record of profitable
growth since inception in 1994. We believe the
company is well positioned to continue to grow
profitably over the next 5-10 years, particularly driven
by accretive acquisitions. We furthermore like the
sound balance sheet and decentralized business
model. We also like the fact that this is a well
managed company and that we have our interest
aligned as shareholder with both the founding
partners, now as board members of the company.
We expect an improving operational performance
after some problems in 2018 and we think the current
valuation provides an attractive investment.
Market Value (mill.) 2 744 Price 150,00 SEK
Net debt (mill.) 340 SEK
Enterprise Value (mill.) 3 084 0,98
Year end (December) 2013 2014 2015 2016 2017 2018E 2019E
Sales (mill.) 2 527 2 616 2 932 3 289 4 020 - -
EBIT (Operating Income - mill.) 129 169 186 255 238 - -
Net Income (reported - mill.) 123 150 170 235 204 - -
Equity 885 1 054 1 167 1 460 1 639 - -
Return on Equity (%) 13,9 % 14,2 % 14,6 % 16,1 % 12,4 % #VALUE! #VALUE!
EPS 6,8 8,3 9,4 12,9 11,1 - -
Book value per share 49,1 58,4 64,7 79,8 89,6 - -
DPS 1,6 2,0 2,3 2,8 2,8 - -
Price/Earnings 12,2 10,7 14,5 14,9 19,7 #VALUE! #VALUE!
Price/Book Value 1,7 1,5 2,1 2,4 2,5 #VALUE! #VALUE!
EV/EBIT 13,0 9,5 14,1 14,2 17,5 #VALUE! #VALUE!
Dividend Yield (%) 1,9 % 2,3 % 1,6 % 1,4 % 1,3 % #VALUE! #VALUE!
AQ Group ABIndustrials
/Electrical Equipment
Price currency
Reporting currency
FX rate (NOK)
0
50
100
150
200
250
300
350
jan.14 jan.15 jan.16 jan.17 jan.18 jan.19
Performance - last 5 years
AQ Group AB OMX Stockholm Benchmark Capped
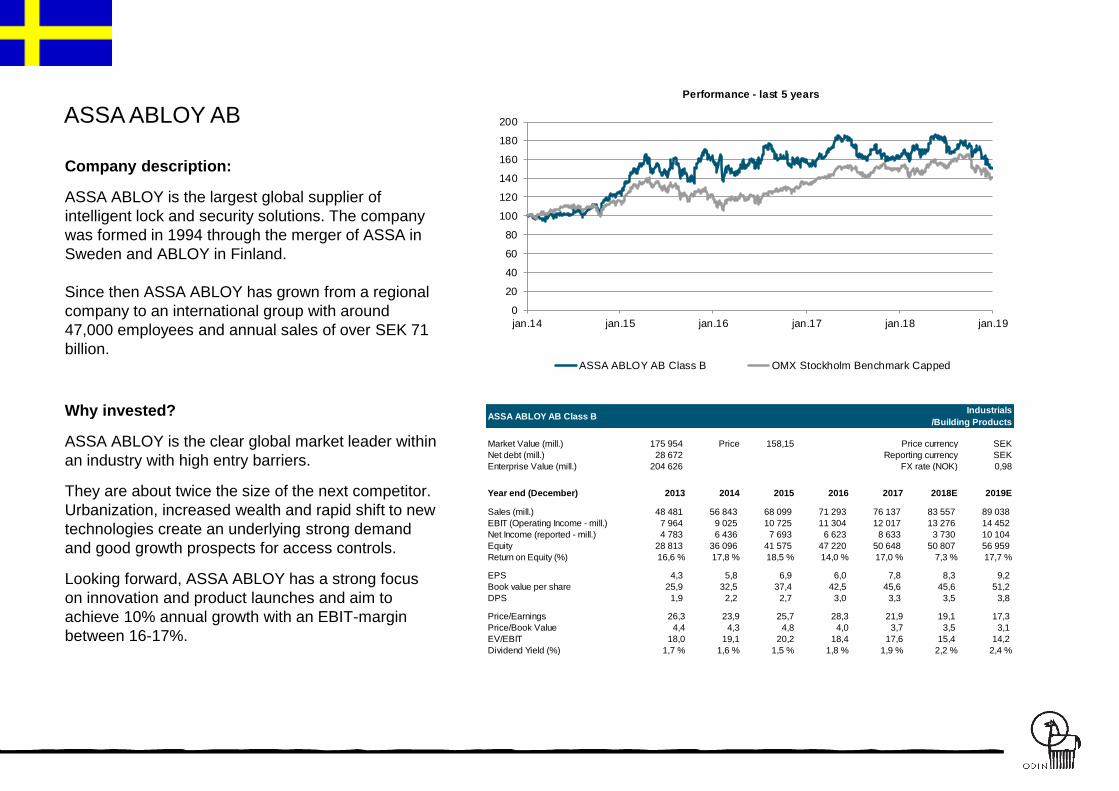
ASSA ABLOY AB
Company description:
ASSA ABLOY is the largest global supplier of
intelligent lock and security solutions. The company
was formed in 1994 through the merger of ASSA in
Sweden and ABLOY in Finland.
Since then ASSA ABLOY has grown from a regional
company to an international group with around
47,000 employees and annual sales of over SEK 71
billion.
Why invested?
ASSA ABLOY is the clear global market leader within
an industry with high entry barriers.
They are about twice the size of the next competitor.
Urbanization, increased wealth and rapid shift to new
technologies create an underlying strong demand
and good growth prospects for access controls.
Looking forward, ASSA ABLOY has a strong focus
on innovation and product launches and aim to
achieve 10% annual growth with an EBIT-margin
between 16-17%.
Market Value (mill.) 175 954 Price 158,15 SEK
Net debt (mill.) 28 672 SEK
Enterprise Value (mill.) 204 626 0,98
Year end (December) 2013 2014 2015 2016 2017 2018E 2019E
Sales (mill.) 48 481 56 843 68 099 71 293 76 137 83 557 89 038
EBIT (Operating Income - mill.) 7 964 9 025 10 725 11 304 12 017 13 276 14 452
Net Income (reported - mill.) 4 783 6 436 7 693 6 623 8 633 3 730 10 104
Equity 28 813 36 096 41 575 47 220 50 648 50 807 56 959
Return on Equity (%) 16,6 % 17,8 % 18,5 % 14,0 % 17,0 % 7,3 % 17,7 %
EPS 4,3 5,8 6,9 6,0 7,8 8,3 9,2
Book value per share 25,9 32,5 37,4 42,5 45,6 45,6 51,2
DPS 1,9 2,2 2,7 3,0 3,3 3,5 3,8
Price/Earnings 26,3 23,9 25,7 28,3 21,9 19,1 17,3
Price/Book Value 4,4 4,3 4,8 4,0 3,7 3,5 3,1
EV/EBIT 18,0 19,1 20,2 18,4 17,6 15,4 14,2
Dividend Yield (%) 1,7 % 1,6 % 1,5 % 1,8 % 1,9 % 2,2 % 2,4 %
ASSA ABLOY AB Class BIndustrials
/Building Products
Price currency
Reporting currency
FX rate (NOK)
0
20
40
60
80
100
120
140
160
180
200
jan.14 jan.15 jan.16 jan.17 jan.18 jan.19
Performance - last 5 years
ASSA ABLOY AB Class B OMX Stockholm Benchmark Capped
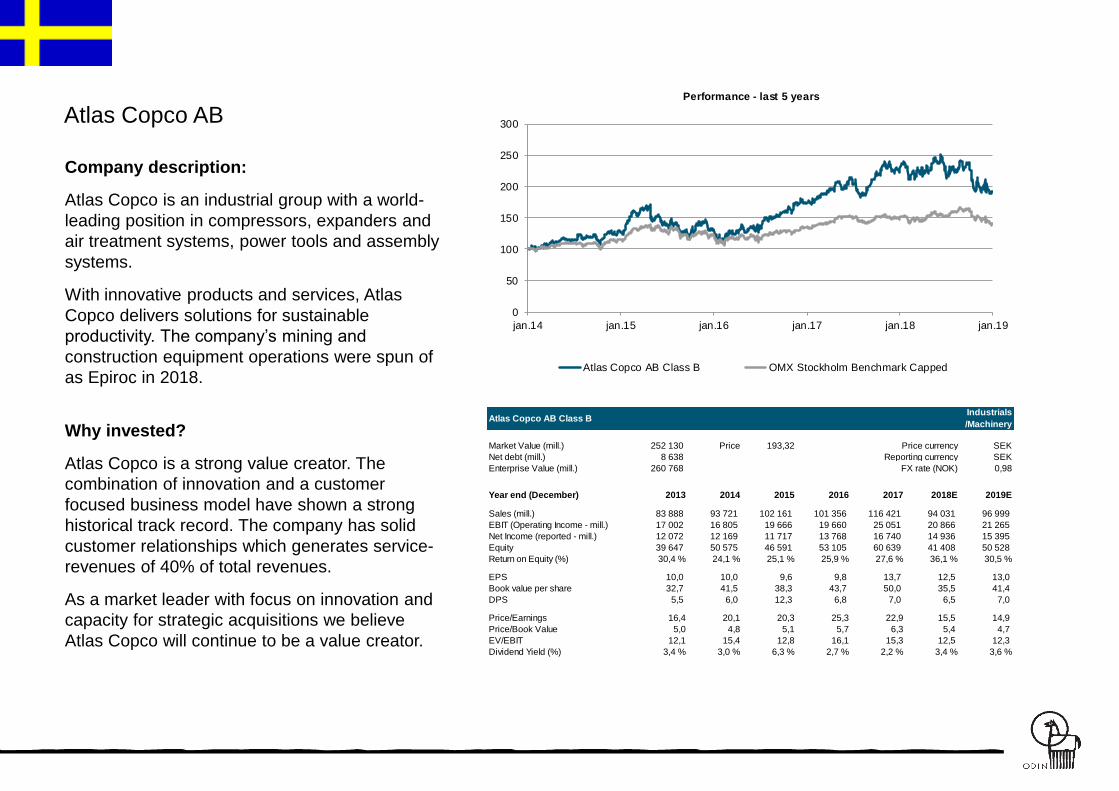
Atlas Copco AB
Company description:
Atlas Copco is an industrial group with a world-
leading position in compressors, expanders and
air treatment systems, power tools and assembly
systems.
With innovative products and services, Atlas
Copco delivers solutions for sustainable
productivity. The company’s mining and
construction equipment operations were spun of
as Epiroc in 2018.
Why invested?
Atlas Copco is a strong value creator. The
combination of innovation and a customer
focused business model have shown a strong
historical track record. The company has solid
customer relationships which generates service-
revenues of 40% of total revenues.
As a market leader with focus on innovation and
capacity for strategic acquisitions we believe
Atlas Copco will continue to be a value creator.
Market Value (mill.) 252 130 Price 193,32 SEK
Net debt (mill.) 8 638 SEK
Enterprise Value (mill.) 260 768 0,98
Year end (December) 2013 2014 2015 2016 2017 2018E 2019E
Sales (mill.) 83 888 93 721 102 161 101 356 116 421 94 031 96 999
EBIT (Operating Income - mill.) 17 002 16 805 19 666 19 660 25 051 20 866 21 265
Net Income (reported - mill.) 12 072 12 169 11 717 13 768 16 740 14 936 15 395
Equity 39 647 50 575 46 591 53 105 60 639 41 408 50 528
Return on Equity (%) 30,4 % 24,1 % 25,1 % 25,9 % 27,6 % 36,1 % 30,5 %
EPS 10,0 10,0 9,6 9,8 13,7 12,5 13,0
Book value per share 32,7 41,5 38,3 43,7 50,0 35,5 41,4
DPS 5,5 6,0 12,3 6,8 7,0 6,5 7,0
Price/Earnings 16,4 20,1 20,3 25,3 22,9 15,5 14,9
Price/Book Value 5,0 4,8 5,1 5,7 6,3 5,4 4,7
EV/EBIT 12,1 15,4 12,8 16,1 15,3 12,5 12,3
Dividend Yield (%) 3,4 % 3,0 % 6,3 % 2,7 % 2,2 % 3,4 % 3,6 %
Atlas Copco AB Class BIndustrials
/Machinery
Price currency
Reporting currency
FX rate (NOK)
0
50
100
150
200
250
300
jan.14 jan.15 jan.16 jan.17 jan.18 jan.19
Performance - last 5 years
Atlas Copco AB Class B OMX Stockholm Benchmark Capped
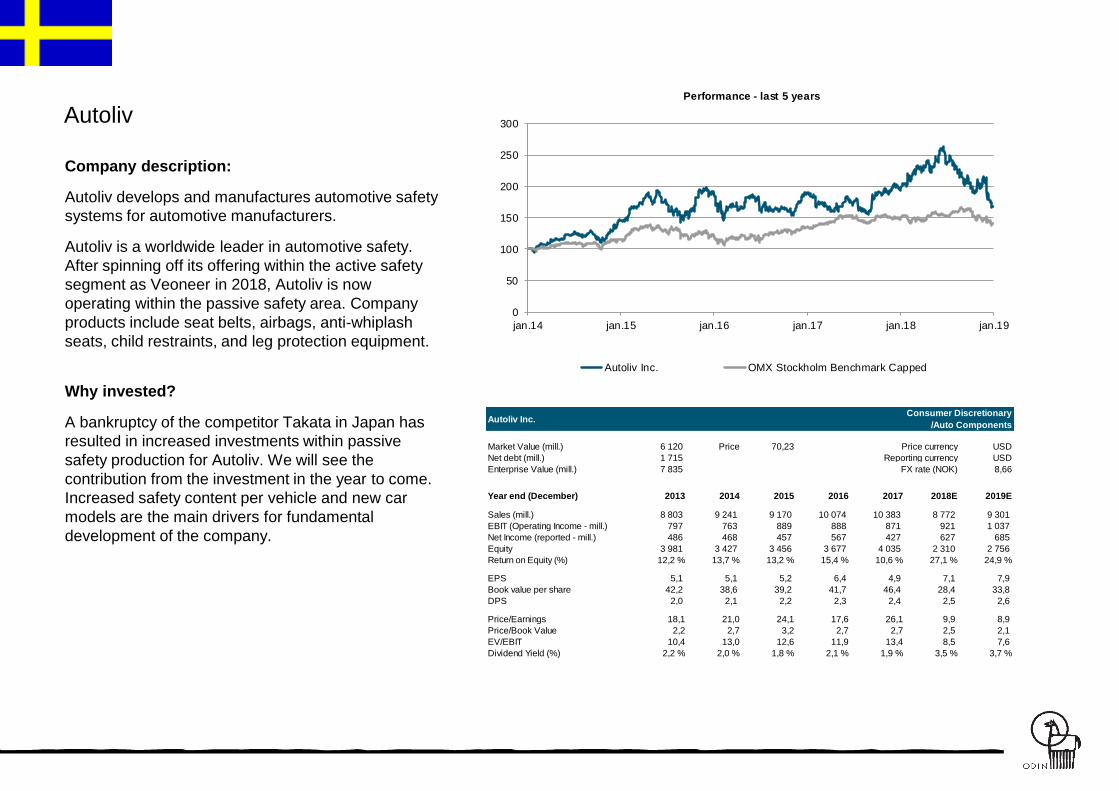
Autoliv
Company description:
Autoliv develops and manufactures automotive safety
systems for automotive manufacturers.
Autoliv is a worldwide leader in automotive safety.
After spinning off its offering within the active safety
segment as Veoneer in 2018, Autoliv is now
operating within the passive safety area. Company
products include seat belts, airbags, anti-whiplash
seats, child restraints, and leg protection equipment.
Why invested?
A bankruptcy of the competitor Takata in Japan has
resulted in increased investments within passive
safety production for Autoliv. We will see the
contribution from the investment in the year to come.
Increased safety content per vehicle and new car
models are the main drivers for fundamental
development of the company.
Market Value (mill.) 6 120 Price 70,23 USD
Net debt (mill.) 1 715 USD
Enterprise Value (mill.) 7 835 8,66
Year end (December) 2013 2014 2015 2016 2017 2018E 2019E
Sales (mill.) 8 803 9 241 9 170 10 074 10 383 8 772 9 301
EBIT (Operating Income - mill.) 797 763 889 888 871 921 1 037
Net Income (reported - mill.) 486 468 457 567 427 627 685
Equity 3 981 3 427 3 456 3 677 4 035 2 310 2 756
Return on Equity (%) 12,2 % 13,7 % 13,2 % 15,4 % 10,6 % 27,1 % 24,9 %
EPS 5,1 5,1 5,2 6,4 4,9 7,1 7,9
Book value per share 42,2 38,6 39,2 41,7 46,4 28,4 33,8
DPS 2,0 2,1 2,2 2,3 2,4 2,5 2,6
Price/Earnings 18,1 21,0 24,1 17,6 26,1 9,9 8,9
Price/Book Value 2,2 2,7 3,2 2,7 2,7 2,5 2,1
EV/EBIT 10,4 13,0 12,6 11,9 13,4 8,5 7,6
Dividend Yield (%) 2,2 % 2,0 % 1,8 % 2,1 % 1,9 % 3,5 % 3,7 %
Autoliv Inc.Consumer Discretionary
/Auto Components
Price currency
Reporting currency
FX rate (NOK)
0
50
100
150
200
250
300
jan.14 jan.15 jan.16 jan.17 jan.18 jan.19
Performance - last 5 years
Autoliv Inc. OMX Stockholm Benchmark Capped

Axfood
Company description:
Axfood is the second largest food retailer in Sweden
with brands such as Willys, Närlivs, Hemköp,
Snabbgross, Mat.se, Middagsfrid and Eurocash.
Axfood currently has a market share of approximately
21 percent.
Axfoods business model is built on a strong focus on
their customers and employees, in addition to
sustainability, efficiency and profitable growth.
Why invested?
Urbanization, digitalization and focus on sustainable
lifestyles are trends that affect the food retail trade.
We believe Axfood is up to the task, with a broad
selection of brands in different segments, including
private label (28%), omni-channel strategies and
focus on sustainability.
With decent growth and stable operating margins we
find the business appealing. We think the strong
fundamental story will continue despite higher
investments within digital offering going forward.
Market Value (mill.) 31 837 Price 151,70 SEK
Net debt (mill.) -557 SEK
Enterprise Value (mill.) 31 280 0,98
Year end (December) 2013 2014 2015 2016 2017 2018E 2019E
Sales (mill.) 37 522 38 484 41 247 43 355 45 968 47 979 49 639
EBIT (Operating Income - mill.) 972 1 118 1 410 1 486 1 429 2 025 2 048
Net Income (reported - mill.) 987 1 095 1 361 1 473 1 463 1 565 1 600
Equity 3 768 4 029 4 530 4 117 4 266 4 404 4 451
Return on Equity (%) 26,2 % 27,2 % 30,0 % 35,8 % 34,3 % 35,5 % 36,0 %
EPS 4,7 5,2 6,5 7,0 7,0 7,5 7,6
Book value per share 18,0 19,2 21,6 19,6 20,3 20,6 21,1
DPS 3,8 4,3 9,0 6,0 7,0 7,0 7,0
Price/Earnings 17,2 22,4 22,7 20,4 22,7 20,3 19,9
Price/Book Value 4,5 6,1 6,8 7,3 7,8 7,4 7,2
EV/EBIT 17,1 21,1 20,5 19,1 22,5 15,4 15,3
Dividend Yield (%) 4,6 % 3,6 % 6,1 % 4,2 % 4,4 % 4,6 % 4,6 %
Axfood ABConsumer Staples
/Food & Staples Retailing
Price currency
Reporting currency
FX rate (NOK)
0
50
100
150
200
250
300
350
jan.14 jan.15 jan.16 jan.17 jan.18 jan.19
Performance - last 5 years
Axfood AB OMX Stockholm Benchmark Capped

Beijer Alma AB
Company description:
Beijer Alma AB, through subsidiaries, develops,
manufactures, and markets industrial components.
The company makes specialty cables, chassis
springs, industrial springs and wire components,
valves, dampers, and ventilators, as well as precision
parts using the high speed machining and salt bath
dip brazing techniques.
Beijer Alma sells to telecommunications, electronic,
and high-tech companies.
Why invested?
The company has a strong track record of growth,
both organically and through acquisitions. With a
strong balance sheet and good cash generation
capacity in existing units, we expect acquisition
activity to step up. The first move into industrial
springs in the US could materialize in strong growth
prospects.
The company is very well managed with a strong
philosophy. We think the current valuation doesn’t
reflect the attractive niche markets they are serving
and the long term track record of the company.
Market Value (mill.) 7 834 Price 129,98 SEK
Net debt (mill.) 536 SEK
Enterprise Value (mill.) 8 370 0,98
Year end (December) 2013 2014 2015 2016 2017 2018E 2019E
Sales (mill.) 3 066 3 298 3 522 3 528 3 971 4 430 4 741
EBIT (Operating Income - mill.) 393 425 511 453 525 642 697
Net Income (reported - mill.) 289 319 354 328 388 473 517
Equity 1 611 1 745 1 835 1 902 1 991 2 178 2 351
Return on Equity (%) 17,9 % 18,3 % 19,3 % 17,2 % 19,5 % 21,7 % 22,0 %
EPS 4,8 5,3 5,9 5,4 6,4 7,8 8,6
Book value per share 26,7 29,0 30,5 31,6 33,0 36,1 39,0
DPS 4,0 4,3 4,8 4,8 4,8 5,3 5,6
Price/Earnings 18,5 17,2 18,7 21,4 20,3 16,6 15,2
Price/Book Value 3,3 3,2 3,6 3,7 4,0 3,6 3,3
EV/EBIT 13,8 13,4 13,8 16,2 15,8 13,0 12,0
Dividend Yield (%) 4,5 % 4,7 % 4,3 % 4,1 % 3,6 % 4,0 % 4,3 %
Beijer Alma AB Class BIndustrials
/Machinery
Price currency
Reporting currency
FX rate (NOK)
0
50
100
150
200
250
jan.14 jan.15 jan.16 jan.17 jan.18 jan.19
Performance - last 5 years
Beijer Alma AB Class B OMX Stockholm Benchmark Capped

Beijer Ref AB
Company description:
Beijer Ref is one of the largest refrigeration
wholesalers in the world and offers its customers
competitive solutions within refrigeration and air
conditioning, including refrigeration systems,
components for refrigeration systems, air conditioning
and heat pumps. The aftermarket accounts for 60-70
percent of sales. Europe make up 82 % of sales.
Why invested?
Beijer Ref is a well-run company with exposure to the
refrigeration business. The market is still fragmented
and Beijer Ref is one of only three global players,
which makes it possible to further consolidate the
market.
As older refrigeration systems are being phased out,
Beijer Ref will likely see increased demand. We
believe Beijer Ref is well positioned to continue to
grow through acquisitions as well as organic growth.
Market Value (mill.) 18 590 Price 145,88 SEK
Net debt (mill.) 2 909 SEK
Enterprise Value (mill.) 21 499 0,98
Year end (December) 2013 2014 2015 2016 2017 2018E 2019E
Sales (mill.) 6 595 7 189 8 361 9 045 9 830 13 033 14 597
EBIT (Operating Income - mill.) 398 462 550 577 716 1 141 1 340
Net Income (reported - mill.) 234 316 366 389 511 796 933
Equity 2 368 2 592 2 594 2 915 3 234 3 821 4 365
Return on Equity (%) 9,9 % 12,2 % 14,1 % 13,3 % 15,8 % 20,8 % 21,4 %
EPS 1,8 2,5 2,9 3,1 4,0 6,4 7,5
Book value per share 18,6 20,4 20,4 22,9 25,4 30,1 34,4
DPS 1,6 1,7 1,8 1,8 1,9 3,1 3,6
Price/Earnings 25,4 17,1 23,2 23,6 26,2 22,9 19,5
Price/Book Value 2,5 2,1 3,3 3,1 4,1 4,9 4,2
EV/EBIT 17,9 14,7 18,0 18,9 21,0 18,8 16,0
Dividend Yield (%) 3,4 % 3,9 % 2,6 % 2,5 % 1,8 % 2,1 % 2,5 %
Beijer Ref AB Class BIndustrials
/Trading Companies & Distributors
Price currency
Reporting currency
FX rate (NOK)
0
100
200
300
400
500
600
jan.14 jan.15 jan.16 jan.17 jan.18 jan.19
Performance - last 5 years
Beijer Ref AB Class B OMX Stockholm Benchmark Capped
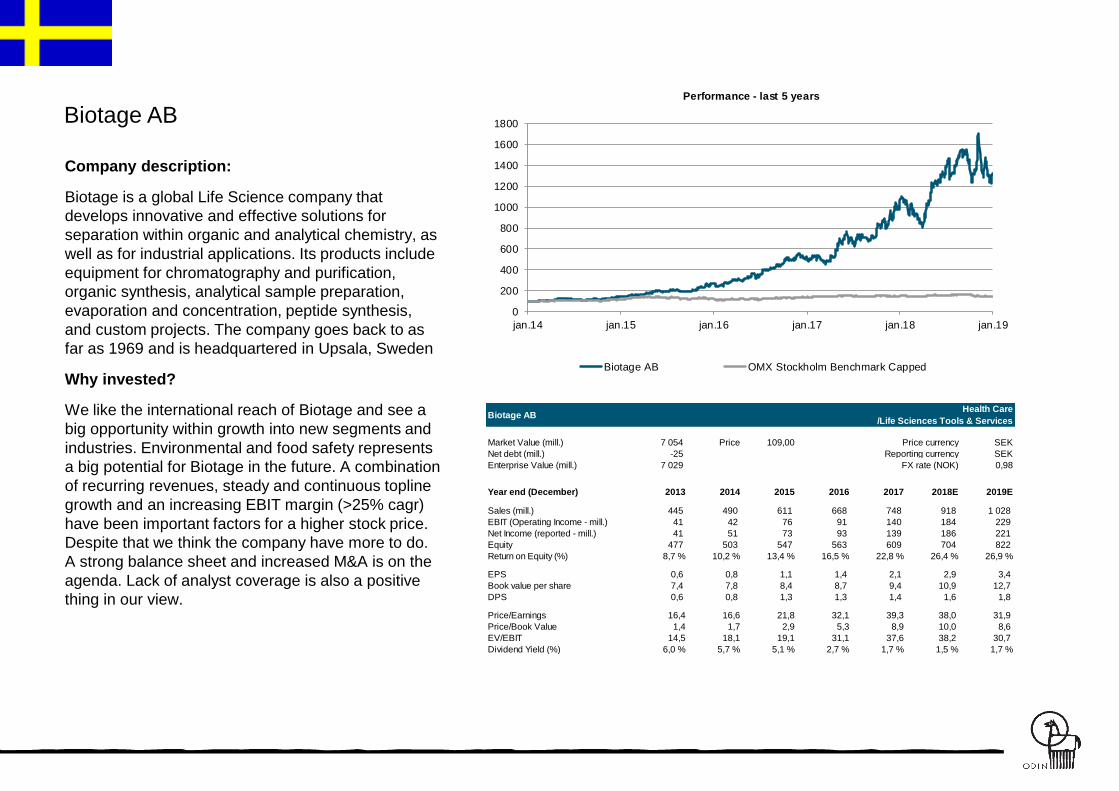
Biotage AB
Company description:
Biotage is a global Life Science company that
develops innovative and effective solutions for
separation within organic and analytical chemistry, as
well as for industrial applications. Its products include
equipment for chromatography and purification,
organic synthesis, analytical sample preparation,
evaporation and concentration, peptide synthesis,
and custom projects. The company goes back to as
far as 1969 and is headquartered in Upsala, Sweden
Why invested?
We like the international reach of Biotage and see a
big opportunity within growth into new segments and
industries. Environmental and food safety represents
a big potential for Biotage in the future. A combination
of recurring revenues, steady and continuous topline
growth and an increasing EBIT margin (>25% cagr)
have been important factors for a higher stock price.
Despite that we think the company have more to do.
A strong balance sheet and increased M&A is on the
agenda. Lack of analyst coverage is also a positive
thing in our view.
0
200
400
600
800
1000
1200
1400
1600
1800
jan.14 jan.15 jan.16 jan.17 jan.18 jan.19
Performance - last 5 years
Biotage AB OMX Stockholm Benchmark Capped
Market Value (mill.) 7 054 Price 109,00 SEK
Net debt (mill.) -25 SEK
Enterprise Value (mill.) 7 029 0,98
Year end (December) 2013 2014 2015 2016 2017 2018E 2019E
Sales (mill.) 445 490 611 668 748 918 1 028
EBIT (Operating Income - mill.) 41 42 76 91 140 184 229
Net Income (reported - mill.) 41 51 73 93 139 186 221
Equity 477 503 547 563 609 704 822
Return on Equity (%) 8,7 % 10,2 % 13,4 % 16,5 % 22,8 % 26,4 % 26,9 %
EPS 0,6 0,8 1,1 1,4 2,1 2,9 3,4
Book value per share 7,4 7,8 8,4 8,7 9,4 10,9 12,7
DPS 0,6 0,8 1,3 1,3 1,4 1,6 1,8
Price/Earnings 16,4 16,6 21,8 32,1 39,3 38,0 31,9
Price/Book Value 1,4 1,7 2,9 5,3 8,9 10,0 8,6
EV/EBIT 14,5 18,1 19,1 31,1 37,6 38,2 30,7
Dividend Yield (%) 6,0 % 5,7 % 5,1 % 2,7 % 1,7 % 1,5 % 1,7 %
Biotage ABHealth Care
/Life Sciences Tools & Services
Price currency
Reporting currency
FX rate (NOK)
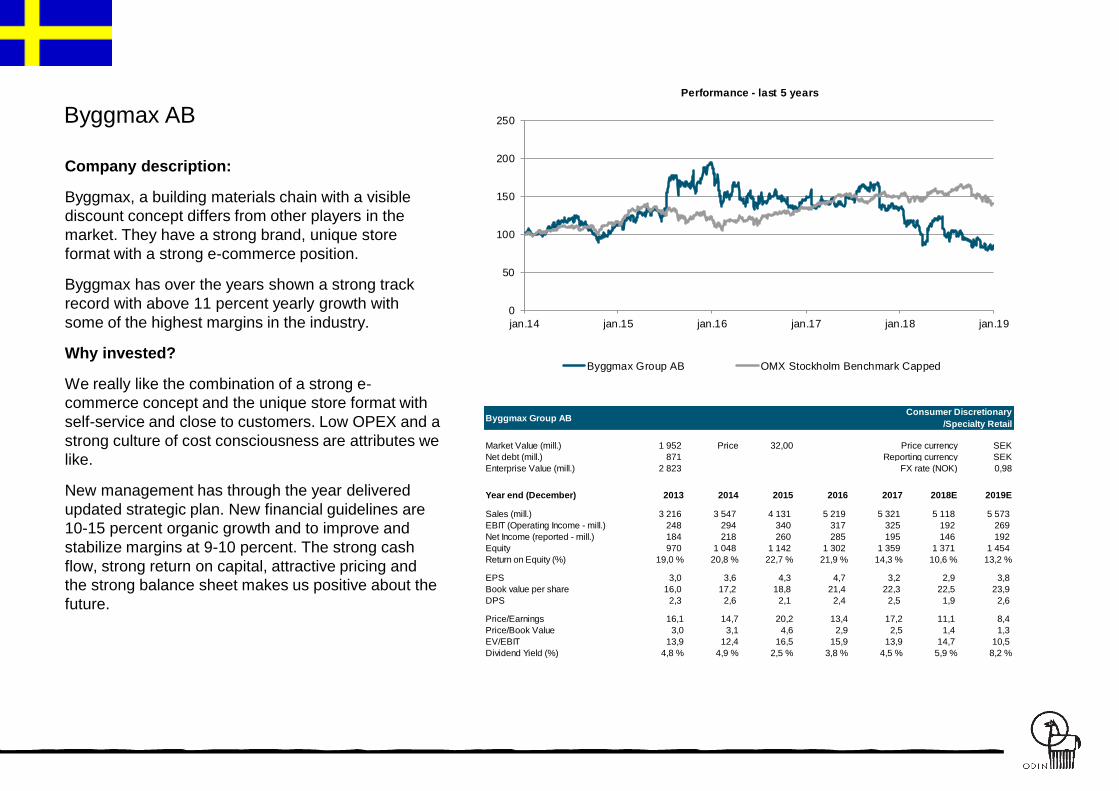
Byggmax AB
Company description:
Byggmax, a building materials chain with a visible
discount concept differs from other players in the
market. They have a strong brand, unique store
format with a strong e-commerce position.
Byggmax has over the years shown a strong track
record with above 11 percent yearly growth with
some of the highest margins in the industry.
Why invested?
We really like the combination of a strong e-
commerce concept and the unique store format with
self-service and close to customers. Low OPEX and a
strong culture of cost consciousness are attributes we
like.
New management has through the year delivered
updated strategic plan. New financial guidelines are
10-15 percent organic growth and to improve and
stabilize margins at 9-10 percent. The strong cash
flow, strong return on capital, attractive pricing and
the strong balance sheet makes us positive about the
future.
Market Value (mill.) 1 952 Price 32,00 SEK
Net debt (mill.) 871 SEK
Enterprise Value (mill.) 2 823 0,98
Year end (December) 2013 2014 2015 2016 2017 2018E 2019E
Sales (mill.) 3 216 3 547 4 131 5 219 5 321 5 118 5 573
EBIT (Operating Income - mill.) 248 294 340 317 325 192 269
Net Income (reported - mill.) 184 218 260 285 195 146 192
Equity 970 1 048 1 142 1 302 1 359 1 371 1 454
Return on Equity (%) 19,0 % 20,8 % 22,7 % 21,9 % 14,3 % 10,6 % 13,2 %
EPS 3,0 3,6 4,3 4,7 3,2 2,9 3,8
Book value per share 16,0 17,2 18,8 21,4 22,3 22,5 23,9
DPS 2,3 2,6 2,1 2,4 2,5 1,9 2,6
Price/Earnings 16,1 14,7 20,2 13,4 17,2 11,1 8,4
Price/Book Value 3,0 3,1 4,6 2,9 2,5 1,4 1,3
EV/EBIT 13,9 12,4 16,5 15,9 13,9 14,7 10,5
Dividend Yield (%) 4,8 % 4,9 % 2,5 % 3,8 % 4,5 % 5,9 % 8,2 %
Byggmax Group ABConsumer Discretionary
/Specialty Retail
Price currency
Reporting currency
FX rate (NOK)
0
50
100
150
200
250
jan.14 jan.15 jan.16 jan.17 jan.18 jan.19
Performance - last 5 years
Byggmax Group AB OMX Stockholm Benchmark Capped
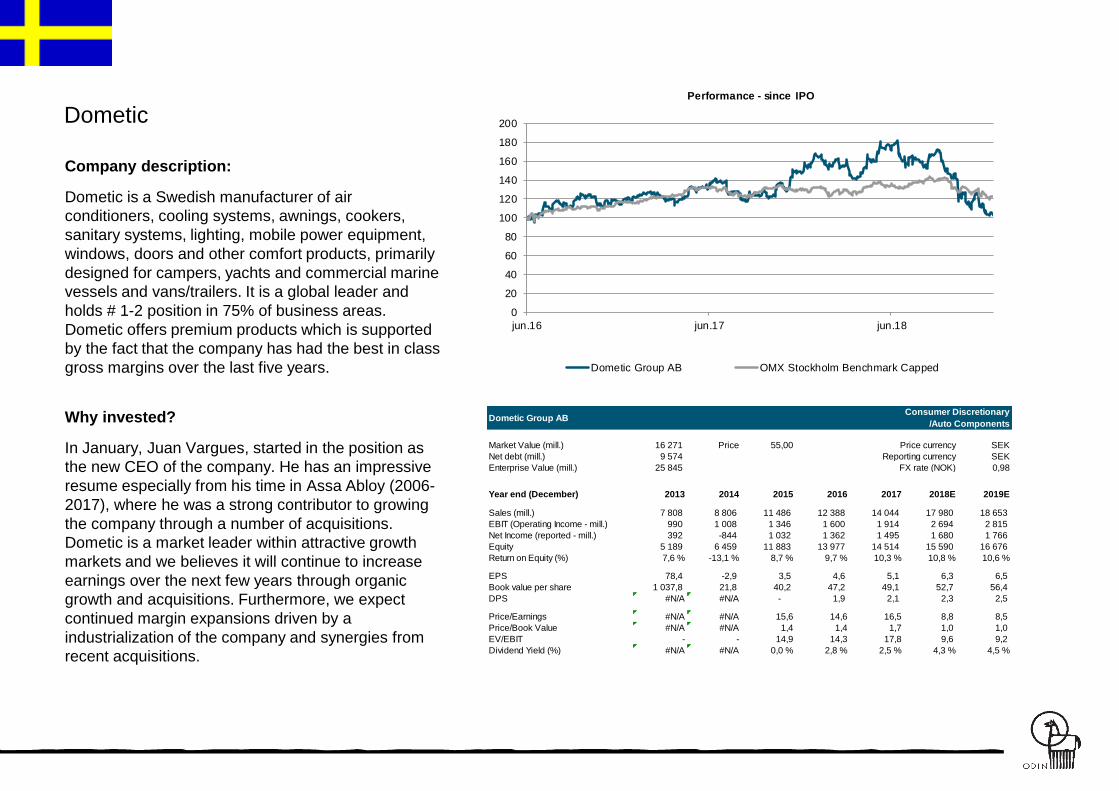
Dometic
Company description:
Dometic is a Swedish manufacturer of air
conditioners, cooling systems, awnings, cookers,
sanitary systems, lighting, mobile power equipment,
windows, doors and other comfort products, primarily
designed for campers, yachts and commercial marine
vessels and vans/trailers. It is a global leader and
holds # 1-2 position in 75% of business areas.
Dometic offers premium products which is supported
by the fact that the company has had the best in class
gross margins over the last five years.
Why invested?
In January, Juan Vargues, started in the position as
the new CEO of the company. He has an impressive
resume especially from his time in Assa Abloy (2006-
2017), where he was a strong contributor to growing
the company through a number of acquisitions.
Dometic is a market leader within attractive growth
markets and we believes it will continue to increase
earnings over the next few years through organic
growth and acquisitions. Furthermore, we expect
continued margin expansions driven by a
industrialization of the company and synergies from
recent acquisitions.
Market Value (mill.) 16 271 Price 55,00 SEK
Net debt (mill.) 9 574 SEK
Enterprise Value (mill.) 25 845 0,98
Year end (December) 2013 2014 2015 2016 2017 2018E 2019E
Sales (mill.) 7 808 8 806 11 486 12 388 14 044 17 980 18 653
EBIT (Operating Income - mill.) 990 1 008 1 346 1 600 1 914 2 694 2 815
Net Income (reported - mill.) 392 -844 1 032 1 362 1 495 1 680 1 766
Equity 5 189 6 459 11 883 13 977 14 514 15 590 16 676
Return on Equity (%) 7,6 % -13,1 % 8,7 % 9,7 % 10,3 % 10,8 % 10,6 %
EPS 78,4 -2,9 3,5 4,6 5,1 6,3 6,5
Book value per share 1 037,8 21,8 40,2 47,2 49,1 52,7 56,4
DPS #N/A #N/A - 1,9 2,1 2,3 2,5
Price/Earnings #N/A #N/A 15,6 14,6 16,5 8,8 8,5
Price/Book Value #N/A #N/A 1,4 1,4 1,7 1,0 1,0
EV/EBIT - - 14,9 14,3 17,8 9,6 9,2
Dividend Yield (%) #N/A #N/A 0,0 % 2,8 % 2,5 % 4,3 % 4,5 %
Dometic Group ABConsumer Discretionary
/Auto Components
Price currency
Reporting currency
FX rate (NOK)
0
20
40
60
80
100
120
140
160
180
200
jun.16 jun.17 jun.18
Performance - since IPO
Dometic Group AB OMX Stockholm Benchmark Capped
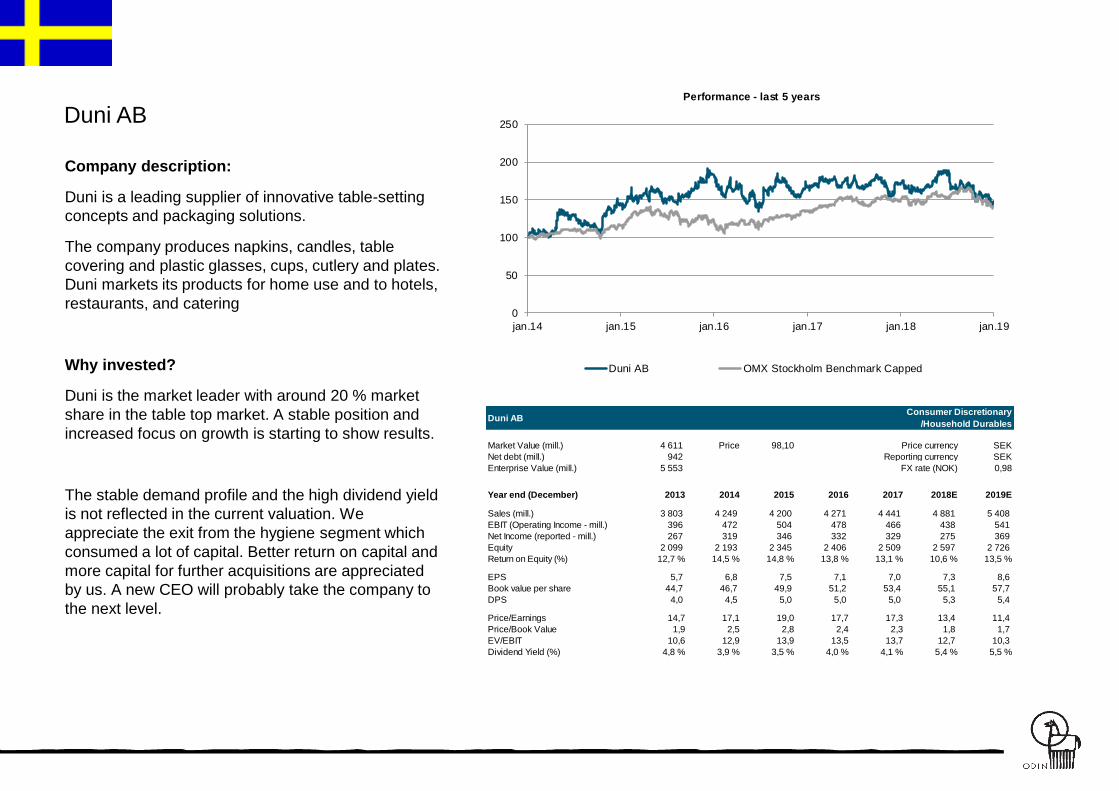
Duni AB
Company description:
Duni is a leading supplier of innovative table-setting
concepts and packaging solutions.
The company produces napkins, candles, table
covering and plastic glasses, cups, cutlery and plates.
Duni markets its products for home use and to hotels,
restaurants, and catering
Why invested?
Duni is the market leader with around 20 % market
share in the table top market. A stable position and
increased focus on growth is starting to show results.
The stable demand profile and the high dividend yield
is not reflected in the current valuation. We
appreciate the exit from the hygiene segment which
consumed a lot of capital. Better return on capital and
more capital for further acquisitions are appreciated
by us. A new CEO will probably take the company to
the next level.
Market Value (mill.) 4 611 Price 98,10 SEK
Net debt (mill.) 942 SEK
Enterprise Value (mill.) 5 553 0,98
Year end (December) 2013 2014 2015 2016 2017 2018E 2019E
Sales (mill.) 3 803 4 249 4 200 4 271 4 441 4 881 5 408
EBIT (Operating Income - mill.) 396 472 504 478 466 438 541
Net Income (reported - mill.) 267 319 346 332 329 275 369
Equity 2 099 2 193 2 345 2 406 2 509 2 597 2 726
Return on Equity (%) 12,7 % 14,5 % 14,8 % 13,8 % 13,1 % 10,6 % 13,5 %
EPS 5,7 6,8 7,5 7,1 7,0 7,3 8,6
Book value per share 44,7 46,7 49,9 51,2 53,4 55,1 57,7
DPS 4,0 4,5 5,0 5,0 5,0 5,3 5,4
Price/Earnings 14,7 17,1 19,0 17,7 17,3 13,4 11,4
Price/Book Value 1,9 2,5 2,8 2,4 2,3 1,8 1,7
EV/EBIT 10,6 12,9 13,9 13,5 13,7 12,7 10,3
Dividend Yield (%) 4,8 % 3,9 % 3,5 % 4,0 % 4,1 % 5,4 % 5,5 %
Duni ABConsumer Discretionary
/Household Durables
Price currency
Reporting currency
FX rate (NOK)
0
50
100
150
200
250
jan.14 jan.15 jan.16 jan.17 jan.18 jan.19
Performance - last 5 years
Duni AB OMX Stockholm Benchmark Capped

Dustin AB
Company description:
Dustin is a leading online reseller of IT products and
services in the Nordic countries. Dustin offers a
comprehensive product and service range, primarily
through its online platform, to businesses, public
organisations and consumers.
Dustin was founded in 1984 and has its headquarters
in Nacka, Sweden. Dustin has operations in Sweden,
Denmark, Finland and Norway, and employs more
than 900 people.
Why invested?
Demand in IT products are shifting from offline to
online, where Dustin with its high efficiency, strong
brand and leading market position is well positioned
to capture this opportunity. There is also the
opportunity to leverage on Dustin’s big customer
base by adding more services to its offering, which
may drive additional sales and make its customer
more loyal. On top of this we also see potential for
M&A, which could be done at low multiples and with
operational synergies.
Market Value (mill.) 6 469 Price 73,30 SEK
Net debt (mill.) 1 720 SEK
Enterprise Value (mill.) 8 189 0,98
Year end (August) 2014 2015 2016 2017 2018 2019E 2020E
Sales (mill.) 7 389 7 953 8 301 9 306 10 301 11 796 12 428
EBIT (Operating Income - mill.) 225 301 335 363 451 560 637
Net Income (reported - mill.) 164 125 225 239 305 391 440
Equity 743 1 324 1 422 1 485 1 647 2 504 2 642
Return on Equity (%) 22,0 % 9,4 % 15,8 % 16,1 % 18,5 % 15,6 % 16,6 %
EPS 1,0 1,7 2,9 3,1 3,9 4,9 5,3
Book value per share 9,4 16,9 18,2 19,0 20,7 27,6 29,2
DPS #N/A 1,7 2,3 2,7 2,7 3,3 3,9
Price/Earnings #N/A 32,3 20,4 21,3 22,6 15,1 13,8
Price/Book Value #N/A 3,3 3,2 3,4 4,2 2,7 2,5
EV/EBIT - 17,4 16,1 16,8 19,2 14,6 12,9
Dividend Yield (%) #N/A 3,0 % 4,0 % 4,2 % 3,1 % 4,5 % 5,3 %
Dustin Group ABConsumer Discretionary
/Internet & Direct Marketing Retail
Price currency
Reporting currency
FX rate (NOK)
0
20
40
60
80
100
120
140
160
180
200
sep.15 sep.16 sep.17 sep.18
Performance - since IPO
Dustin Group AB OMX Stockholm Benchmark Capped
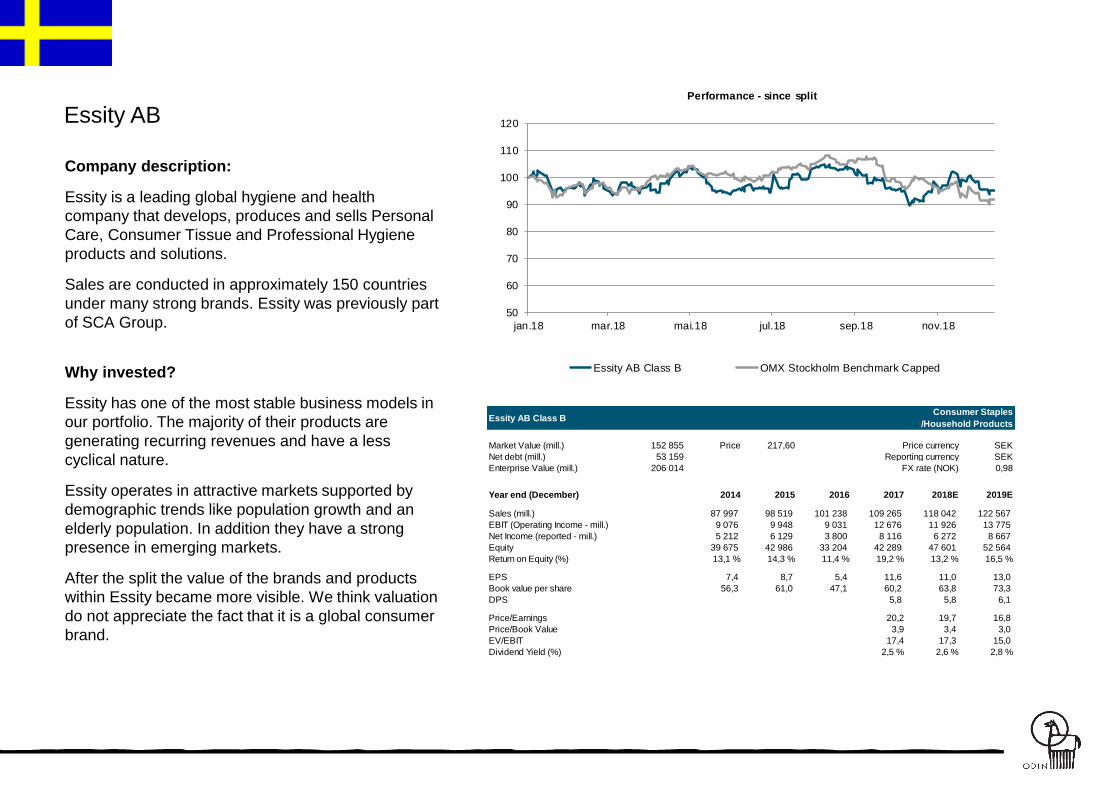
Essity AB
Company description:
Essity is a leading global hygiene and health
company that develops, produces and sells Personal
Care, Consumer Tissue and Professional Hygiene
products and solutions.
Sales are conducted in approximately 150 countries
under many strong brands. Essity was previously part
of SCA Group.
Why invested?
Essity has one of the most stable business models in
our portfolio. The majority of their products are
generating recurring revenues and have a less
cyclical nature.
Essity operates in attractive markets supported by
demographic trends like population growth and an
elderly population. In addition they have a strong
presence in emerging markets.
After the split the value of the brands and products
within Essity became more visible. We think valuation
do not appreciate the fact that it is a global consumer
brand.
Market Value (mill.) 152 855 Price 217,60 SEK
Net debt (mill.) 53 159 SEK
Enterprise Value (mill.) 206 014 0,98
Year end (December) #N/A 2014 2015 2016 2017 2018E 2019E
Sales (mill.) #VALUE! 87 997 98 519 101 238 109 265 118 042 122 567
EBIT (Operating Income - mill.) #VALUE! 9 076 9 948 9 031 12 676 11 926 13 775
Net Income (reported - mill.) #VALUE! 5 212 6 129 3 800 8 116 6 272 8 667
Equity #VALUE! 39 675 42 986 33 204 42 289 47 601 52 564
Return on Equity (%) #VALUE! 13,1 % 14,3 % 11,4 % 19,2 % 13,2 % 16,5 %
EPS #VALUE! 7,4 8,7 5,4 11,6 11,0 13,0
Book value per share #VALUE! 56,3 61,0 47,1 60,2 63,8 73,3
DPS #VALUE! #N/A #N/A #N/A 5,8 5,8 6,1
Price/Earnings #VALUE! #N/A #N/A #N/A 20,2 19,7 16,8
Price/Book Value #VALUE! #N/A #N/A #N/A 3,9 3,4 3,0
EV/EBIT #VALUE! - - - 17,4 17,3 15,0
Dividend Yield (%) #VALUE! #N/A #N/A #N/A 2,5 % 2,6 % 2,8 %
Essity AB Class BConsumer Staples
/Household Products
Price currency
Reporting currency
FX rate (NOK)
50
60
70
80
90
100
110
120
jan.18 mar.18 mai.18 jul.18 sep.18 nov.18
Performance - since split
Essity AB Class B OMX Stockholm Benchmark Capped
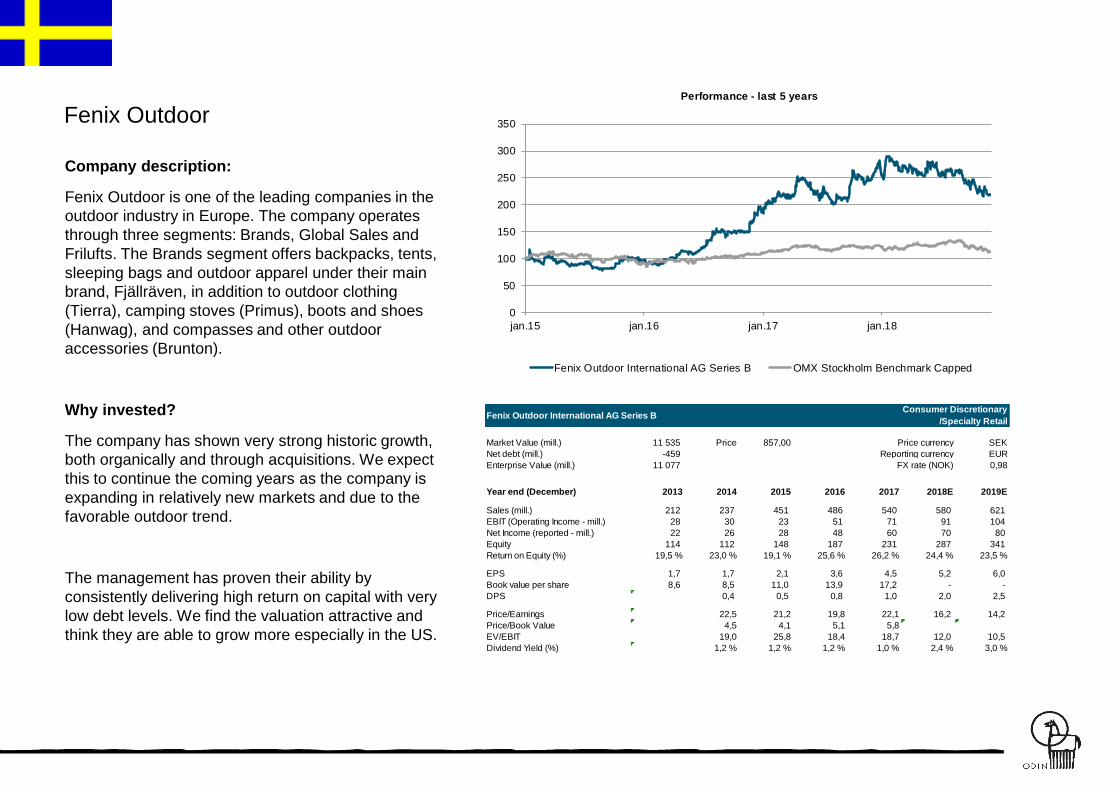
Fenix Outdoor
Company description:
Fenix Outdoor is one of the leading companies in the
outdoor industry in Europe. The company operates
through three segments: Brands, Global Sales and
Frilufts. The Brands segment offers backpacks, tents,
sleeping bags and outdoor apparel under their main
brand, Fjällräven, in addition to outdoor clothing
(Tierra), camping stoves (Primus), boots and shoes
(Hanwag), and compasses and other outdoor
accessories (Brunton).
Why invested?
The company has shown very strong historic growth,
both organically and through acquisitions. We expect
this to continue the coming years as the company is
expanding in relatively new markets and due to the
favorable outdoor trend.
The management has proven their ability by
consistently delivering high return on capital with very
low debt levels. We find the valuation attractive and
think they are able to grow more especially in the US.
Market Value (mill.) 11 535 Price 857,00 SEK
Net debt (mill.) -459 EUR
Enterprise Value (mill.) 11 077 0,98
Year end (December) 2013 2014 2015 2016 2017 2018E 2019E
Sales (mill.) 212 237 451 486 540 580 621
EBIT (Operating Income - mill.) 28 30 23 51 71 91 104
Net Income (reported - mill.) 22 26 28 48 60 70 80
Equity 114 112 148 187 231 287 341
Return on Equity (%) 19,5 % 23,0 % 19,1 % 25,6 % 26,2 % 24,4 % 23,5 %
EPS 1,7 1,7 2,1 3,6 4,5 5,2 6,0
Book value per share 8,6 8,5 11,0 13,9 17,2 - -
DPS #N/A 0,4 0,5 0,8 1,0 2,0 2,5
Price/Earnings #N/A 22,5 21,2 19,8 22,1 16,2 14,2
Price/Book Value #N/A 4,5 4,1 5,1 5,8 #VALUE! #VALUE!
EV/EBIT - 19,0 25,8 18,4 18,7 12,0 10,5
Dividend Yield (%) #N/A 1,2 % 1,2 % 1,2 % 1,0 % 2,4 % 3,0 %
Fenix Outdoor International AG Series BConsumer Discretionary
/Specialty Retail
Price currency
Reporting currency
FX rate (NOK)
0
50
100
150
200
250
300
350
jan.15 jan.16 jan.17 jan.18
Performance - last 5 years
Fenix Outdoor International AG Series B OMX Stockholm Benchmark Capped
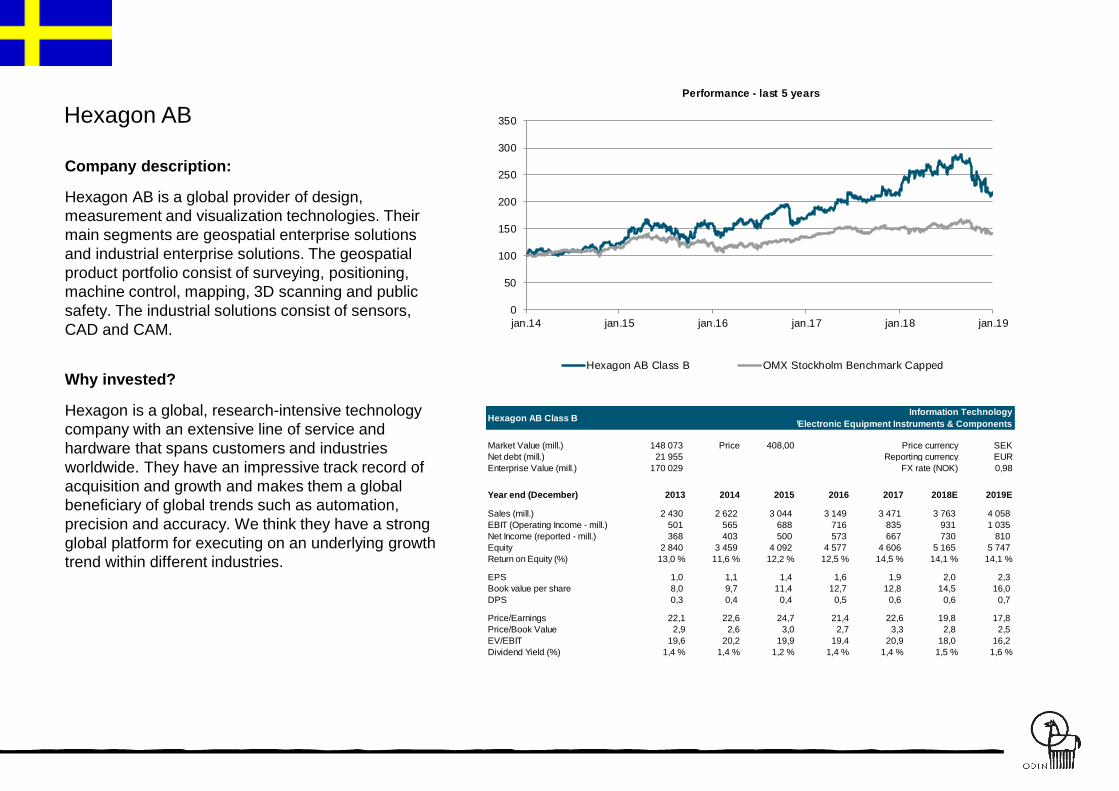
Hexagon AB
Company description:
Hexagon AB is a global provider of design,
measurement and visualization technologies. Their
main segments are geospatial enterprise solutions
and industrial enterprise solutions. The geospatial
product portfolio consist of surveying, positioning,
machine control, mapping, 3D scanning and public
safety. The industrial solutions consist of sensors,
CAD and CAM.
Why invested?
Hexagon is a global, research-intensive technology
company with an extensive line of service and
hardware that spans customers and industries
worldwide. They have an impressive track record of
acquisition and growth and makes them a global
beneficiary of global trends such as automation,
precision and accuracy. We think they have a strong
global platform for executing on an underlying growth
trend within different industries.
0
50
100
150
200
250
300
350
jan.14 jan.15 jan.16 jan.17 jan.18 jan.19
Performance - last 5 years
Hexagon AB Class B OMX Stockholm Benchmark Capped
Market Value (mill.) 148 073 Price 408,00 SEK
Net debt (mill.) 21 955 EUR
Enterprise Value (mill.) 170 029 0,98
Year end (December) 2013 2014 2015 2016 2017 2018E 2019E
Sales (mill.) 2 430 2 622 3 044 3 149 3 471 3 763 4 058
EBIT (Operating Income - mill.) 501 565 688 716 835 931 1 035
Net Income (reported - mill.) 368 403 500 573 667 730 810
Equity 2 840 3 459 4 092 4 577 4 606 5 165 5 747
Return on Equity (%) 13,0 % 11,6 % 12,2 % 12,5 % 14,5 % 14,1 % 14,1 %
EPS 1,0 1,1 1,4 1,6 1,9 2,0 2,3
Book value per share 8,0 9,7 11,4 12,7 12,8 14,5 16,0
DPS 0,3 0,4 0,4 0,5 0,6 0,6 0,7
Price/Earnings 22,1 22,6 24,7 21,4 22,6 19,8 17,8
Price/Book Value 2,9 2,6 3,0 2,7 3,3 2,8 2,5
EV/EBIT 19,6 20,2 19,9 19,4 20,9 18,0 16,2
Dividend Yield (%) 1,4 % 1,4 % 1,2 % 1,4 % 1,4 % 1,5 % 1,6 %
Hexagon AB Class BInformation Technology
/Electronic Equipment Instruments & Components
Price currency
Reporting currency
FX rate (NOK)
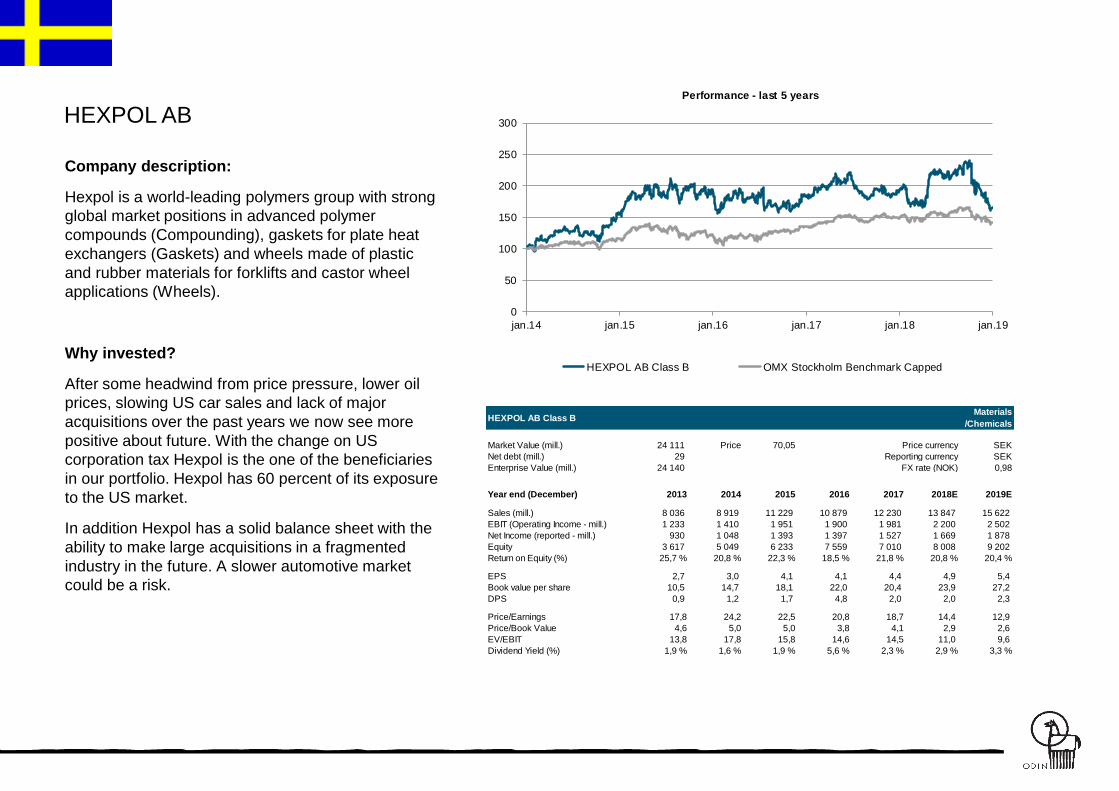
HEXPOL AB
Company description:
Hexpol is a world-leading polymers group with strong
global market positions in advanced polymer
compounds (Compounding), gaskets for plate heat
exchangers (Gaskets) and wheels made of plastic
and rubber materials for forklifts and castor wheel
applications (Wheels).
Why invested?
After some headwind from price pressure, lower oil
prices, slowing US car sales and lack of major
acquisitions over the past years we now see more
positive about future. With the change on US
corporation tax Hexpol is the one of the beneficiaries
in our portfolio. Hexpol has 60 percent of its exposure
to the US market.
In addition Hexpol has a solid balance sheet with the
ability to make large acquisitions in a fragmented
industry in the future. A slower automotive market
could be a risk.
Market Value (mill.) 24 111 Price 70,05 SEK
Net debt (mill.) 29 SEK
Enterprise Value (mill.) 24 140 0,98
Year end (December) 2013 2014 2015 2016 2017 2018E 2019E
Sales (mill.) 8 036 8 919 11 229 10 879 12 230 13 847 15 622
EBIT (Operating Income - mill.) 1 233 1 410 1 951 1 900 1 981 2 200 2 502
Net Income (reported - mill.) 930 1 048 1 393 1 397 1 527 1 669 1 878
Equity 3 617 5 049 6 233 7 559 7 010 8 008 9 202
Return on Equity (%) 25,7 % 20,8 % 22,3 % 18,5 % 21,8 % 20,8 % 20,4 %
EPS 2,7 3,0 4,1 4,1 4,4 4,9 5,4
Book value per share 10,5 14,7 18,1 22,0 20,4 23,9 27,2
DPS 0,9 1,2 1,7 4,8 2,0 2,0 2,3
Price/Earnings 17,8 24,2 22,5 20,8 18,7 14,4 12,9
Price/Book Value 4,6 5,0 5,0 3,8 4,1 2,9 2,6
EV/EBIT 13,8 17,8 15,8 14,6 14,5 11,0 9,6
Dividend Yield (%) 1,9 % 1,6 % 1,9 % 5,6 % 2,3 % 2,9 % 3,3 %
HEXPOL AB Class BMaterials
/Chemicals
Price currency
Reporting currency
FX rate (NOK)
0
50
100
150
200
250
300
jan.14 jan.15 jan.16 jan.17 jan.18 jan.19
Performance - last 5 years
HEXPOL AB Class B OMX Stockholm Benchmark Capped

Hoist Finance
Company description:
Hoist Finance (HOFI) is pan-European debt
purchaser focusing on unsecured and secured
consumer NPL market. The company has currently
operations in 11 European countries with and 1,335
FTEs at the end of 2017.
Why invested?
The company has a cost cutting program which
together with scale advantages will lower the C/I
significantly from ~80% to below 70%. We believe
management will be successful executing on its
current strategy which could potentially more than
double the value of the shareprice in the coming
years. A better more disciplined market behavior is
also positive for Hoist.
We consider its status as a Credit Market Company
to be a key competitive advantage, as certain claims
sold by banks are required to be handled by financial
institutions. It furthermore enables a higher leverage
at lower funding costs than peers. The flipside of it is
the regulation risk which we saw an example of in the
end of the year. Despite this we think they could
deliver on both cost and growth going forward.
0
20
40
60
80
100
120
140
160
180
jul.15 jul.16 jul.17 jul.18
Performance - last 5 years
Hoist Finance AB OMX Stockholm Benchmark Capped
Market Value (mill.) 3 853 Price 43,15 SEK
Net debt (mill.) 6 871 SEK
Enterprise Value (mill.) 10 724 0,98
2013 2014 2015 2016 2017
Year end (December) 2013 2014 2015 2016 2017 2018E 2019E
Total Income - 1 660 2 247 2 627 2 806 2 978 3 367
Net Interest Income - - 1 646 - - 2 470 3 045
Net Result 94 155 219 401 412 587 760
Equity 815 1 397 2 289 2 925 3 228 4 452 4 908
Return on Equity (%) 11,5 % 11,1 % 9,6 % 13,7 % 12,8 % 13,2 % 15,5 %
EPS 6,1 9,2 2,9 5,1 5,1 6,4 7,7
Book value per share 10,3 17,6 29,1 36,2 39,8 51,7 56,4
DPS #N/A #N/A 0,8 1,3 1,9 2,1 2,5
Price/Earnings #N/A #N/A 30,5 16,7 18,1 6,8 5,6
Price/Book Value 0,0 0,0 0,0 0,0 0,0 0,8 0,8
Dividend Yield (%) #N/A #N/A 0,8 % 1,5 % 2,1 % 4,8 % 5,8 %
Hoist Finance ABFinancials
/Consumer Finance
Price currency
Reporting currency
FX rate (NOK)

Indutrade AB
Company description:
Indutrade provides engineering and equipment, flow
technology, industrial components, and special
products. The company sells its products to industrial
companies primarily in Northern Europe. The group
consists of more than 200 independent subsidiaries
in 31 countries and four continents. The foundation of
their business model is to acquire many small
companies with strong positions in a narrow niche at
low prices.
Why invested?
Indutrade has an impressing track record when it
comes to profitable growth. The last ten years they
have acquired more than 100 companies while the
average return on equity has been well above 25 %
for the same period. We believe the company will
continue its profitable growth through a combination
of acquisitions and organic growth. In addition the
new CEO will also work on profitability improvement
in existing underperforming businesses. We tend to
like decentralized business models where internal
benchmarking are a strong internal driver.
Market Value (mill.) 24 848 Price 205,60 SEK
Net debt (mill.) 4 324 SEK
Enterprise Value (mill.) 29 172 0,98
Year end (December) 2013 2014 2015 2016 2017 2018E 2019E
Sales (mill.) 8 831 9 746 11 881 12 955 14 847 16 775 17 669
EBIT (Operating Income - mill.) 832 932 1 222 1 222 1 432 2 049 2 219
Net Income (reported - mill.) 587 704 893 936 1 029 1 327 1 472
Equity 2 623 3 160 3 703 4 389 5 151 6 051 7 004
Return on Equity (%) 22,4 % 22,3 % 24,1 % 21,3 % 20,0 % 21,9 % 21,0 %
EPS 4,9 5,9 7,4 7,8 8,5 13,2 14,4
Book value per share 21,9 26,3 30,9 36,6 42,6 50,2 58,0
DPS 2,4 2,6 3,0 3,2 3,8 4,6 5,1
Price/Earnings 18,3 17,7 21,5 23,5 26,2 15,6 14,3
Price/Book Value 4,1 3,9 5,2 5,0 5,2 4,1 3,5
EV/EBIT 15,5 15,8 17,9 20,8 21,3 14,2 13,1
Dividend Yield (%) 2,6 % 2,5 % 1,9 % 1,7 % 1,7 % 2,2 % 2,5 %
Indutrade ABIndustrials
/Trading Companies & Distributors
Price currency
Reporting currency
FX rate (NOK)
0
50
100
150
200
250
300
350
jan.14 jan.15 jan.16 jan.17 jan.18 jan.19
Performance - last 5 years
Indutrade AB OMX Stockholm Benchmark Capped
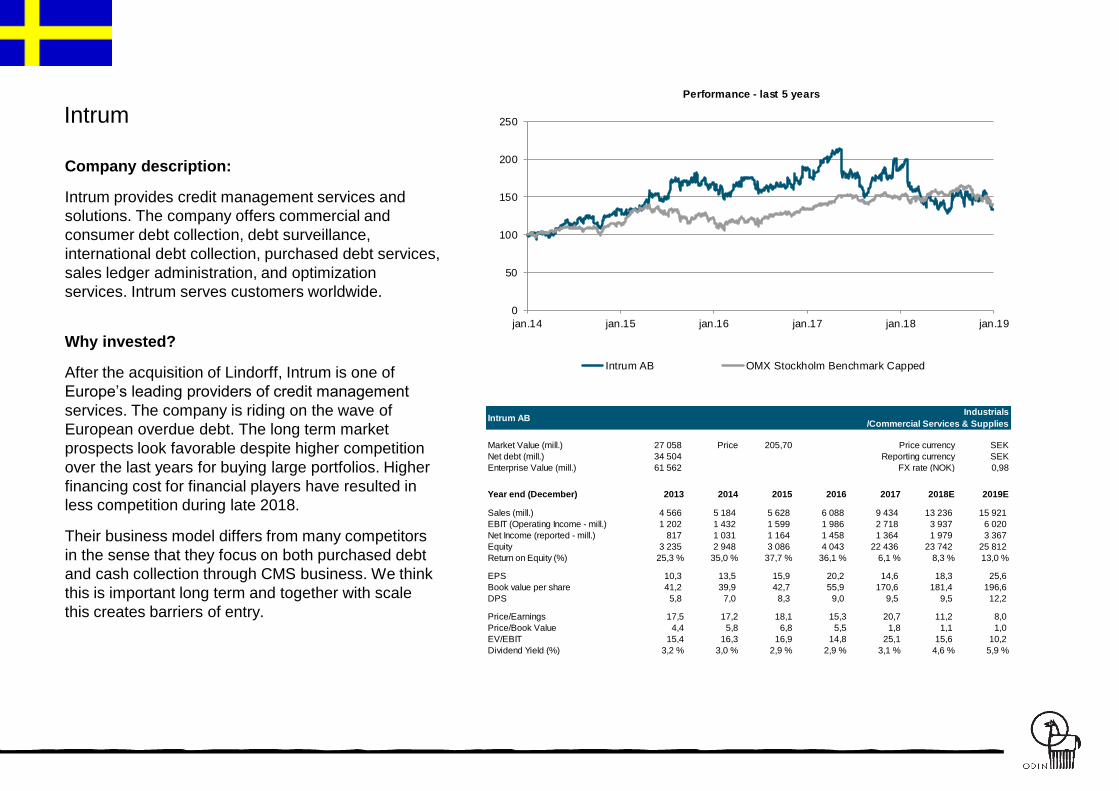
Intrum
Company description:
Intrum provides credit management services and
solutions. The company offers commercial and
consumer debt collection, debt surveillance,
international debt collection, purchased debt services,
sales ledger administration, and optimization
services. Intrum serves customers worldwide.
Why invested?
After the acquisition of Lindorff, Intrum is one of
Europe’s leading providers of credit management
services. The company is riding on the wave of
European overdue debt. The long term market
prospects look favorable despite higher competition
over the last years for buying large portfolios. Higher
financing cost for financial players have resulted in
less competition during late 2018.
Their business model differs from many competitors
in the sense that they focus on both purchased debt
and cash collection through CMS business. We think
this is important long term and together with scale
this creates barriers of entry.
Market Value (mill.) 27 058 Price 205,70 SEK
Net debt (mill.) 34 504 SEK
Enterprise Value (mill.) 61 562 0,98
Year end (December) 2013 2014 2015 2016 2017 2018E 2019E
Sales (mill.) 4 566 5 184 5 628 6 088 9 434 13 236 15 921
EBIT (Operating Income - mill.) 1 202 1 432 1 599 1 986 2 718 3 937 6 020
Net Income (reported - mill.) 817 1 031 1 164 1 458 1 364 1 979 3 367
Equity 3 235 2 948 3 086 4 043 22 436 23 742 25 812
Return on Equity (%) 25,3 % 35,0 % 37,7 % 36,1 % 6,1 % 8,3 % 13,0 %
EPS 10,3 13,5 15,9 20,2 14,6 18,3 25,6
Book value per share 41,2 39,9 42,7 55,9 170,6 181,4 196,6
DPS 5,8 7,0 8,3 9,0 9,5 9,5 12,2
Price/Earnings 17,5 17,2 18,1 15,3 20,7 11,2 8,0
Price/Book Value 4,4 5,8 6,8 5,5 1,8 1,1 1,0
EV/EBIT 15,4 16,3 16,9 14,8 25,1 15,6 10,2
Dividend Yield (%) 3,2 % 3,0 % 2,9 % 2,9 % 3,1 % 4,6 % 5,9 %
Intrum ABIndustrials
/Commercial Services & Supplies
Price currency
Reporting currency
FX rate (NOK)
0
50
100
150
200
250
jan.14 jan.15 jan.16 jan.17 jan.18 jan.19
Performance - last 5 years
Intrum AB OMX Stockholm Benchmark Capped

LE Lundbergforetagen
Company description:
Lundbergs is an investment company which develops
and takes large positions in Swedish listed
companies. In addition they own the unlisted
company Fastighets AB L E Lundberg.
Of the listed entities they own the property company
Hufvudstaden, the investment company
Industrivärden, forestry company Holmen, industrial
companies Sandvik and Indutrade. Handelsbanken
and Skanska are the largest positions.
Why invested?
Fredrik Lundberg, who is the principal owner, has
over time shown strong value generation in the
underlying companies. We think Lundbergs
represent an exciting exposure to the change in
Industrivärden and also what will happen to the forest
in SCA and Holmen going forward. The discount to
the underlying shares are attractive when putting
market valuation to the property company.
0
50
100
150
200
250
300
jan.14 jan.15 jan.16 jan.17 jan.18 jan.19
Performance - last 5 years
L E Lundbergforetagen AB Class B OMX Stockholm Benchmark Capped
Market Value (mill.) 64 778 Price 261,20 SEK
Net debt (mill.) #N/A SEK
Enterprise Value (mill.) #N/A 0,98
Year end (December) 2013 2014 2015 2016 2017 2018E 2019E
Sales (mill.) 21 003 20 992 21 314 20 785 21 564
EBIT (Operating Income - mill.) 3 126 3 588 3 698 4 501 4 274
Net Income (reported - mill.) 3 008 3 193 4 376 12 242 6 682
Equity 39 753 43 831 48 024 57 106 62 596
Return on Equity (%) 7,6 % 7,3 % 9,1 % 21,4 % 10,7 %
EPS 12,1 12,9 17,6 49,4 26,9
Book value per share 160,3 176,7 193,6 230,3 252,4
DPS 2,3 2,5 2,7 2,8 3,0
Price/Earnings 11,2 13,1 13,2 5,7 11,4
Price/Book Value 0,9 1,0 1,2 1,2 1,2
EV/EBIT 22,7 22,5 26,5 24,7 27,8
Dividend Yield (%) 1,7 % 1,5 % 1,1 % 1,0 % 1,0 %
L E Lundbergforetagen AB Class BFinancials
/Diversified Financial Services
Price currency
Reporting currency
FX rate (NOK)

Lagercrantz
Company description:
Lagercrantz sells products and solutions in the
electronics and communications area.
The company's product line includes special
components and modules, wiring harnesses, as well
as products and solutions in security and
communication. Lagercrantz sells and markets to
manufacturing companies mainly in northern Europe.
Why invested?
Despite that margins maybe have difficulties to
improve from current levels we still think there is a
high potential for the group to continue to grow sales
both organic and by acquisitions.
When acquiring companies they rarely pay more than
5x EBIT. This is an ongoing value generator going
forward. Since the spin off 15 years ago they have
grown around 20 % yearly. We think the strong
balance sheet and the focused management will
continue the acquisition driven growth strategy for the
company in many years to come.
Market Value (mill.) 5 986 Price 86,10 SEK
Net debt (mill.) 961 SEK
Enterprise Value (mill.) 6 947 0,98
Year end (March) 2014 2015 2016 2017 2018 2019E 2020E
Sales (mill.) 2 546 2 846 3 057 3 096 3 410 3 915 4 258
EBIT (Operating Income - mill.) 233 266 302 354 338 444 508
Net Income (reported - mill.) 177 203 241 274 286 324 366
Equity 805 917 1 032 1 197 1 303 1 489 1 699
Return on Equity (%) 22,0 % 22,1 % 23,4 % 22,9 % 21,9 % 21,7 % 21,5 %
EPS 2,6 3,0 3,6 4,0 4,2 5,3 6,0
Book value per share 11,9 13,5 15,2 17,6 19,3 21,9 25,0
DPS 1,3 1,5 1,8 2,0 2,0 2,3 2,5
Price/Earnings 16,2 17,6 21,8 21,6 19,8 16,2 14,4
Price/Book Value 3,6 3,9 5,1 4,9 4,3 3,9 3,4
EV/EBIT 13,6 14,6 19,3 18,3 19,8 15,7 13,7
Dividend Yield (%) 3,1 % 2,8 % 2,3 % 2,3 % 2,4 % 2,7 % 2,9 %
Lagercrantz Group AB Class BInformation Technology
/Electronic Equipment Instruments & Components
Price currency
Reporting currency
FX rate (NOK)
0
50
100
150
200
250
300
jan.14 jan.15 jan.16 jan.17 jan.18 jan.19
Performance - last 5 years
Lagercrantz Group AB Class B OMX Stockholm Benchmark Capped

Latour
Company description:
Investment AB Latour is an investment holding
company. The Company also develops industrial and
trading operations in automotive, hand tools,
hydraulics, air treatment, machinery trading, and
engineering technology. About 2/3 of Latour’s
underlying value consists of listed companies, while
the remaining part is wholly-owned companies. Their
largest holding is the listed company, Assa Abloy,
where they own 9,5% of the company and have 30%
of the voting rights.
Why invested?
Latour focus on quality companies with solid return
on equity, ability to grow internationally and with
favorable long term prospects. This investment
philosophy is very similar to our own.
It has proven successful in the past and we strongly
believe this will be the case in the future as well.
0
50
100
150
200
250
300
350
jan.14 jan.15 jan.16 jan.17 jan.18 jan.19
Performance - last 5 years
Latour AB Investment Class B OMX Stockholm Benchmark Capped
Market Value (mill.) 66 326 Price 112,00 SEK
Net debt (mill.) 5 269 SEK
Enterprise Value (mill.) 71 595 0,98
Year end (December) 2013 2014 2015 2016 2017 2018E 2019E
Sales (mill.) 6 945 7 577 7 190 8 333 9 935
EBIT (Operating Income - mill.) 606 728 838 969 1 099
Net Income (reported - mill.) 1 483 1 874 4 069 3 490 2 793
Equity 11 658 13 523 16 080 19 212 20 245
Return on Equity (%) 12,7 % 13,9 % 25,3 % 18,2 % 13,8 %
EPS 2,3 2,9 6,5 5,5 4,4
Book value per share 18,3 21,2 25,2 30,1 31,7
DPS 1,4 1,5 1,7 2,0 2,3 2,5 2,8
Price/Earnings 18,5 17,3 12,1 15,6 23,1
Price/Book Value 2,4 2,4 3,1 2,8 3,2
EV/EBIT 47,9 49,4 62,2 58,1 62,6
Dividend Yield (%) 3,2 % 3,0 % 2,2 % 2,3 % 2,2 % 2,2 % 2,5 %
Latour AB Investment Class BIndustrials
/Industrial Conglomerates
Price currency
Reporting currency
FX rate (NOK)
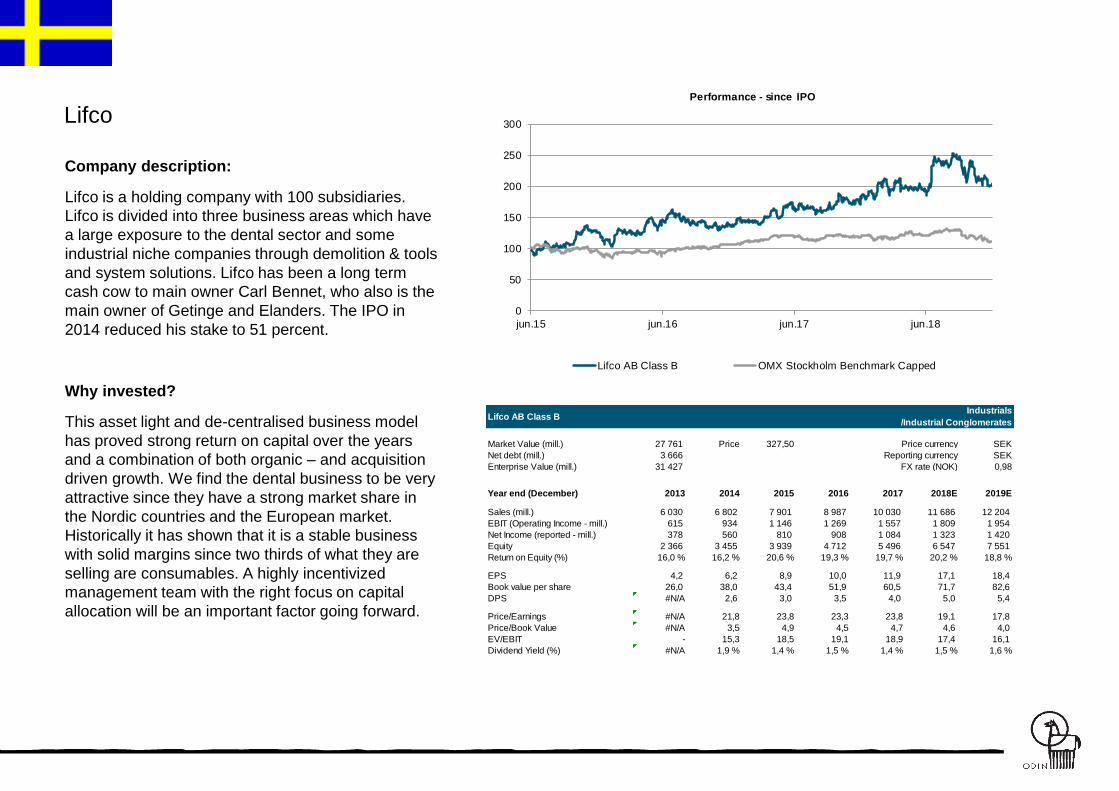
Lifco
Company description:
Lifco is a holding company with 100 subsidiaries.
Lifco is divided into three business areas which have
a large exposure to the dental sector and some
industrial niche companies through demolition & tools
and system solutions. Lifco has been a long term
cash cow to main owner Carl Bennet, who also is the
main owner of Getinge and Elanders. The IPO in
2014 reduced his stake to 51 percent.
Why invested?
This asset light and de-centralised business model
has proved strong return on capital over the years
and a combination of both organic – and acquisition
driven growth. We find the dental business to be very
attractive since they have a strong market share in
the Nordic countries and the European market.
Historically it has shown that it is a stable business
with solid margins since two thirds of what they are
selling are consumables. A highly incentivized
management team with the right focus on capital
allocation will be an important factor going forward.
Market Value (mill.) 27 761 Price 327,50 SEK
Net debt (mill.) 3 666 SEK
Enterprise Value (mill.) 31 427 0,98
Year end (December) 2013 2014 2015 2016 2017 2018E 2019E
Sales (mill.) 6 030 6 802 7 901 8 987 10 030 11 686 12 204
EBIT (Operating Income - mill.) 615 934 1 146 1 269 1 557 1 809 1 954
Net Income (reported - mill.) 378 560 810 908 1 084 1 323 1 420
Equity 2 366 3 455 3 939 4 712 5 496 6 547 7 551
Return on Equity (%) 16,0 % 16,2 % 20,6 % 19,3 % 19,7 % 20,2 % 18,8 %
EPS 4,2 6,2 8,9 10,0 11,9 17,1 18,4
Book value per share 26,0 38,0 43,4 51,9 60,5 71,7 82,6
DPS #N/A 2,6 3,0 3,5 4,0 5,0 5,4
Price/Earnings #N/A 21,8 23,8 23,3 23,8 19,1 17,8
Price/Book Value #N/A 3,5 4,9 4,5 4,7 4,6 4,0
EV/EBIT - 15,3 18,5 19,1 18,9 17,4 16,1
Dividend Yield (%) #N/A 1,9 % 1,4 % 1,5 % 1,4 % 1,5 % 1,6 %
Lifco AB Class BIndustrials
/Industrial Conglomerates
Price currency
Reporting currency
FX rate (NOK)
0
50
100
150
200
250
300
jun.15 jun.16 jun.17 jun.18
Performance - since IPO
Lifco AB Class B OMX Stockholm Benchmark Capped

NCC
Company description:
NCC was founded in 1875 as a civil engineering
company. The company grew rapidly during the
1990s through M&A. Following the spin-off of the its
property development company, Bonava, in 2016,
100% of its current operations are in the Nordic
region. NCC is the second largest construction
company in the Nordic region in terms of volumes.
Today the company operates through four sub-
divisions throughout the Nordics.
Why invested?
In May, Tomas Carlsson joined the company as its
new CEO. He previously held the position as CEO of
Sweco (2012-2018) and worked for more than 20
years in NCC before that. We believe Carlsson is the
right man for the job and will manage to lift operating
margins towards old heights. The stock market does
not seem to discount this today, which in our view
offers an attractive investment opportunity for those
who have the patience to sit through the recovery
phase.
Market Value (mill.) 14 945 Price 137,80 SEK
Net debt (mill.) 2 606 SEK
Enterprise Value (mill.) 17 551 0,98
Year end (December) 2013 2014 2015 2016 2017 2018E 2019E
Sales (mill.) 57 823 56 867 62 495 52 934 54 608 57 304 59 897
EBIT (Operating Income - mill.) 2 690 2 577 3 239 1 538 1 215 -494 1 710
Net Income (reported - mill.) 1 986 1 835 2 113 1 113 1 004 -507 1 314
Equity 8 658 8 847 4 962 5 553 5 516 3 786 4 284
Return on Equity (%) 22,9 % 20,7 % 42,6 % 20,0 % 18,2 % -13,4 % 30,7 %
EPS 18,4 17,0 19,6 11,6 9,3 -4,6 12,1
Book value per share 80,3 82,0 46,0 51,4 51,0 34,9 36,8
DPS 12,0 12,0 3,0 114,5 8,0 8,0 8,4
Price/Earnings 11,4 14,5 13,4 19,4 16,9 - 11,4
Price/Book Value 2,6 3,0 5,7 4,4 3,1 3,9 3,7
EV/EBIT 10,6 12,9 10,2 15,7 13,6 - 10,3
Dividend Yield (%) 5,7 % 4,9 % 1,1 % 50,8 % 5,1 % 5,8 % 6,1 %
NCC AB Class BIndustrials
/Construction & Engineering
Price currency
Reporting currency
FX rate (NOK)
0
50
100
150
200
250
jan.14 jan.15 jan.16 jan.17 jan.18 jan.19
Performance - last 5 years
NCC AB Class B OMX Stockholm Benchmark Capped
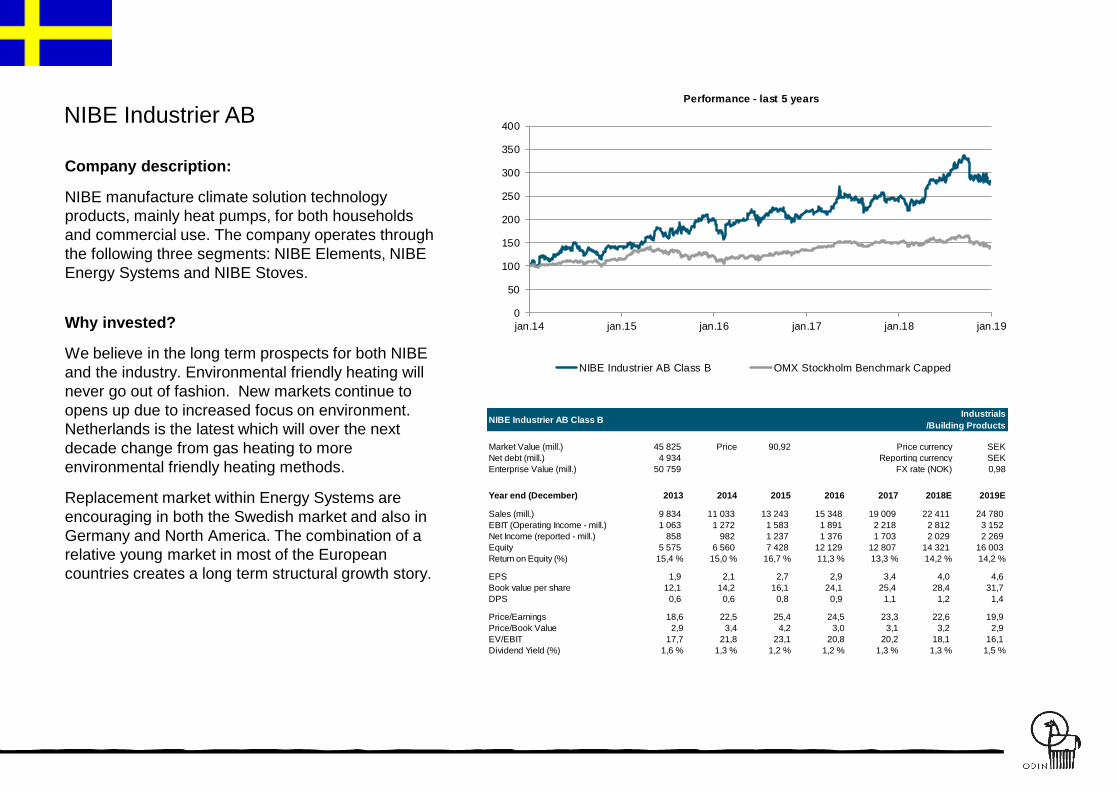
NIBE Industrier AB
Company description:
NIBE manufacture climate solution technology
products, mainly heat pumps, for both households
and commercial use. The company operates through
the following three segments: NIBE Elements, NIBE
Energy Systems and NIBE Stoves.
Why invested?
We believe in the long term prospects for both NIBE
and the industry. Environmental friendly heating will
never go out of fashion. New markets continue to
opens up due to increased focus on environment.
Netherlands is the latest which will over the next
decade change from gas heating to more
environmental friendly heating methods.
Replacement market within Energy Systems are
encouraging in both the Swedish market and also in
Germany and North America. The combination of a
relative young market in most of the European
countries creates a long term structural growth story.
Market Value (mill.) 45 825 Price 90,92 SEK
Net debt (mill.) 4 934 SEK
Enterprise Value (mill.) 50 759 0,98
Year end (December) 2013 2014 2015 2016 2017 2018E 2019E
Sales (mill.) 9 834 11 033 13 243 15 348 19 009 22 411 24 780
EBIT (Operating Income - mill.) 1 063 1 272 1 583 1 891 2 218 2 812 3 152
Net Income (reported - mill.) 858 982 1 237 1 376 1 703 2 029 2 269
Equity 5 575 6 560 7 428 12 129 12 807 14 321 16 003
Return on Equity (%) 15,4 % 15,0 % 16,7 % 11,3 % 13,3 % 14,2 % 14,2 %
EPS 1,9 2,1 2,7 2,9 3,4 4,0 4,6
Book value per share 12,1 14,2 16,1 24,1 25,4 28,4 31,7
DPS 0,6 0,6 0,8 0,9 1,1 1,2 1,4
Price/Earnings 18,6 22,5 25,4 24,5 23,3 22,6 19,9
Price/Book Value 2,9 3,4 4,2 3,0 3,1 3,2 2,9
EV/EBIT 17,7 21,8 23,1 20,8 20,2 18,1 16,1
Dividend Yield (%) 1,6 % 1,3 % 1,2 % 1,2 % 1,3 % 1,3 % 1,5 %
NIBE Industrier AB Class BIndustrials
/Building Products
Price currency
Reporting currency
FX rate (NOK)
0
50
100
150
200
250
300
350
400
jan.14 jan.15 jan.16 jan.17 jan.18 jan.19
Performance - last 5 years
NIBE Industrier AB Class B OMX Stockholm Benchmark Capped
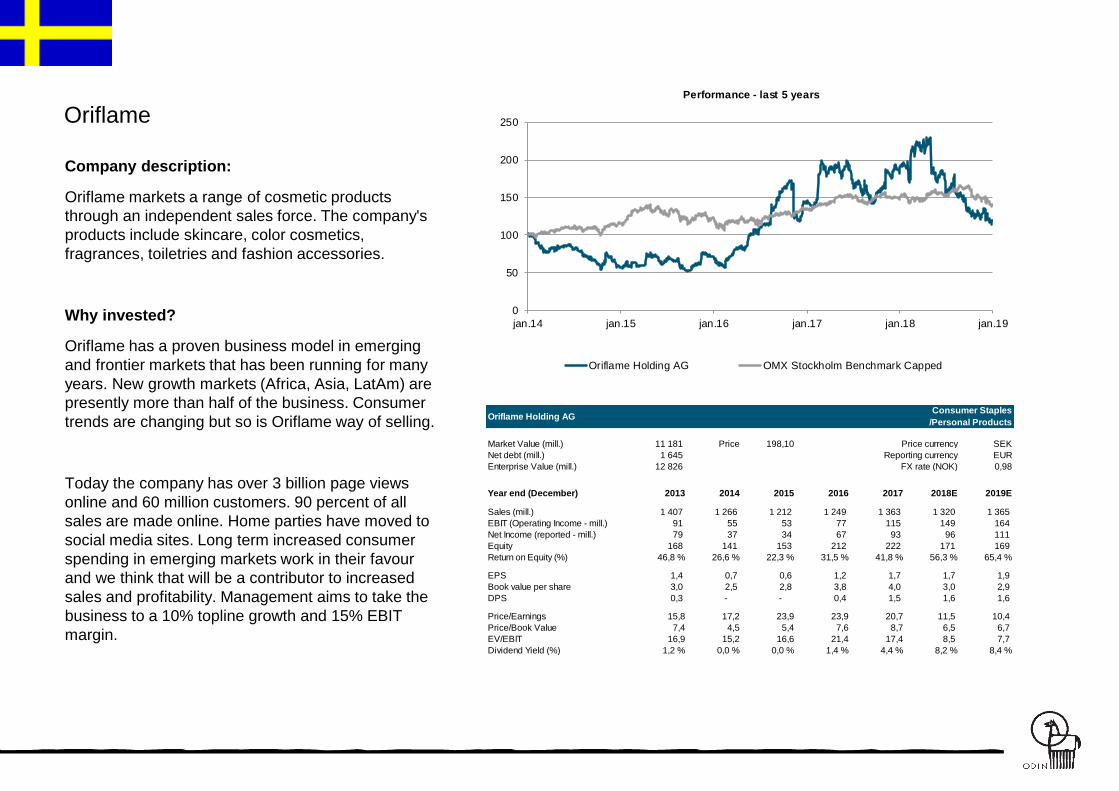
Oriflame
Company description:
Oriflame markets a range of cosmetic products
through an independent sales force. The company's
products include skincare, color cosmetics,
fragrances, toiletries and fashion accessories.
Why invested?
Oriflame has a proven business model in emerging
and frontier markets that has been running for many
years. New growth markets (Africa, Asia, LatAm) are
presently more than half of the business. Consumer
trends are changing but so is Oriflame way of selling.
Today the company has over 3 billion page views
online and 60 million customers. 90 percent of all
sales are made online. Home parties have moved to
social media sites. Long term increased consumer
spending in emerging markets work in their favour
and we think that will be a contributor to increased
sales and profitability. Management aims to take the
business to a 10% topline growth and 15% EBIT
margin.
Market Value (mill.) 11 181 Price 198,10 SEK
Net debt (mill.) 1 645 EUR
Enterprise Value (mill.) 12 826 0,98
Year end (December) 2013 2014 2015 2016 2017 2018E 2019E
Sales (mill.) 1 407 1 266 1 212 1 249 1 363 1 320 1 365
EBIT (Operating Income - mill.) 91 55 53 77 115 149 164
Net Income (reported - mill.) 79 37 34 67 93 96 111
Equity 168 141 153 212 222 171 169
Return on Equity (%) 46,8 % 26,6 % 22,3 % 31,5 % 41,8 % 56,3 % 65,4 %
EPS 1,4 0,7 0,6 1,2 1,7 1,7 1,9
Book value per share 3,0 2,5 2,8 3,8 4,0 3,0 2,9
DPS 0,3 - - 0,4 1,5 1,6 1,6
Price/Earnings 15,8 17,2 23,9 23,9 20,7 11,5 10,4
Price/Book Value 7,4 4,5 5,4 7,6 8,7 6,5 6,7
EV/EBIT 16,9 15,2 16,6 21,4 17,4 8,5 7,7
Dividend Yield (%) 1,2 % 0,0 % 0,0 % 1,4 % 4,4 % 8,2 % 8,4 %
Oriflame Holding AGConsumer Staples
/Personal Products
Price currency
Reporting currency
FX rate (NOK)
0
50
100
150
200
250
jan.14 jan.15 jan.16 jan.17 jan.18 jan.19
Performance - last 5 years
Oriflame Holding AG OMX Stockholm Benchmark Capped
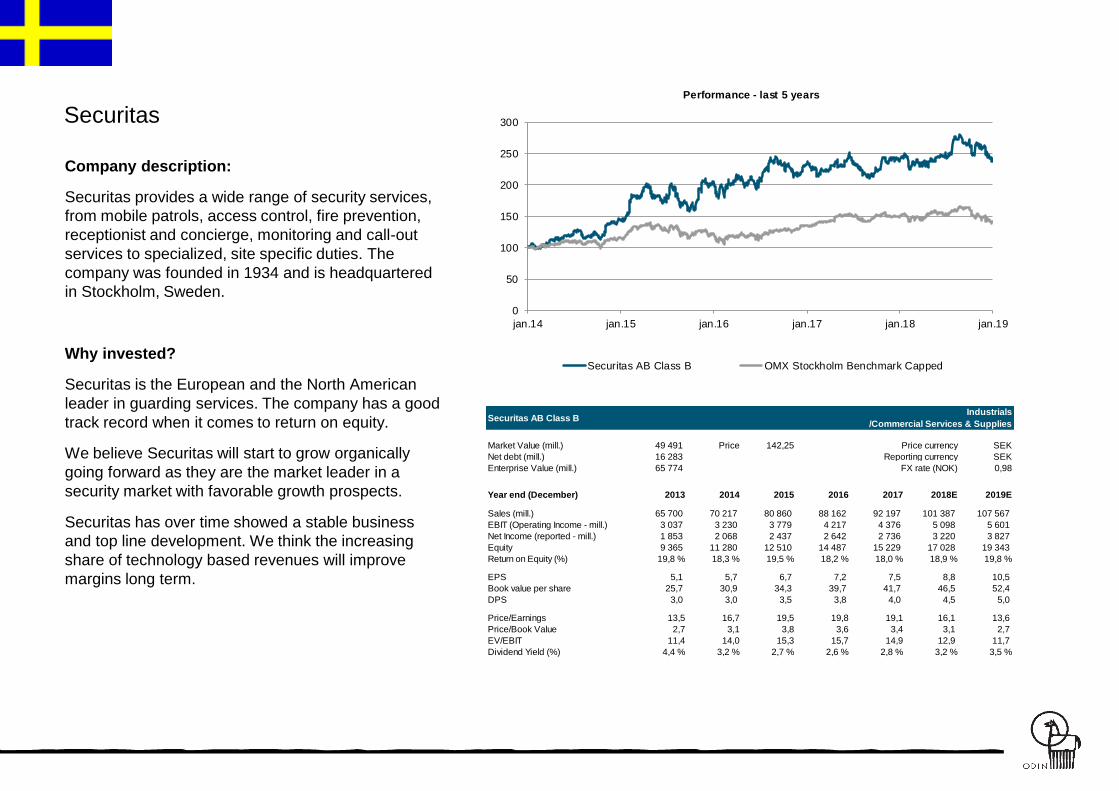
Securitas
Company description:
Securitas provides a wide range of security services,
from mobile patrols, access control, fire prevention,
receptionist and concierge, monitoring and call-out
services to specialized, site specific duties. The
company was founded in 1934 and is headquartered
in Stockholm, Sweden.
Why invested?
Securitas is the European and the North American
leader in guarding services. The company has a good
track record when it comes to return on equity.
We believe Securitas will start to grow organically
going forward as they are the market leader in a
security market with favorable growth prospects.
Securitas has over time showed a stable business
and top line development. We think the increasing
share of technology based revenues will improve
margins long term.
Market Value (mill.) 49 491 Price 142,25 SEK
Net debt (mill.) 16 283 SEK
Enterprise Value (mill.) 65 774 0,98
Year end (December) 2013 2014 2015 2016 2017 2018E 2019E
Sales (mill.) 65 700 70 217 80 860 88 162 92 197 101 387 107 567
EBIT (Operating Income - mill.) 3 037 3 230 3 779 4 217 4 376 5 098 5 601
Net Income (reported - mill.) 1 853 2 068 2 437 2 642 2 736 3 220 3 827
Equity 9 365 11 280 12 510 14 487 15 229 17 028 19 343
Return on Equity (%) 19,8 % 18,3 % 19,5 % 18,2 % 18,0 % 18,9 % 19,8 %
EPS 5,1 5,7 6,7 7,2 7,5 8,8 10,5
Book value per share 25,7 30,9 34,3 39,7 41,7 46,5 52,4
DPS 3,0 3,0 3,5 3,8 4,0 4,5 5,0
Price/Earnings 13,5 16,7 19,5 19,8 19,1 16,1 13,6
Price/Book Value 2,7 3,1 3,8 3,6 3,4 3,1 2,7
EV/EBIT 11,4 14,0 15,3 15,7 14,9 12,9 11,7
Dividend Yield (%) 4,4 % 3,2 % 2,7 % 2,6 % 2,8 % 3,2 % 3,5 %
Securitas AB Class BIndustrials
/Commercial Services & Supplies
Price currency
Reporting currency
FX rate (NOK)
0
50
100
150
200
250
300
jan.14 jan.15 jan.16 jan.17 jan.18 jan.19
Performance - last 5 years
Securitas AB Class B OMX Stockholm Benchmark Capped
Svenska Handelsbanken AB
Company description:
Svenska Handelsbanken attracts deposits and offers
commercial banking services. The Bank offers
corporate finance, securities brokerage, commodity
trading, structured products, custody services, and
institutional asset management services.
Why invested?
No Nordic banks can show the same history of
almost zero loan losses as Handelsbanken. We are
impressed by the de-centralized banking model.
All employees are major shareholders due to the
pension system «Oktogonen». We think this gives the
bank an edge on culture and incentives. Digitalization
trends is a big question mark. Low short term rates
are negative for net interest margins. Falling real
estate prices could hit banks down the road but we
think Handelsbanken is the most robust retail bank.
Higher amortization could put pressure on loan
growth going forward.
Overall Handelsbanken is able to grow in the years to
come. The growth will come from UK and
Netherlands. UK could long term be as big as the
Swedish corporation and we think that represent an
important earnings driver for the business going
forward.
0
20
40
60
80
100
120
140
160
180
jan.14 jan.15 jan.16 jan.17 jan.18 jan.19
Performance - last 5 years
Svenska Handelsbanken AB Class B OMX Stockholm Benchmark Capped
Market Value (mill.) 191 214 Price 98,30 SEK
Net debt (mill.) 1 290 106 SEK
Enterprise Value (mill.) 1 481 320 0,98
2013 2014 2015 2016 2017
Year end (December) 2013 2014 2015 2016 2017 2018E 2019E
Total Income 36 327 38 314 40 336 40 763 41 674 43 565 44 794
Net Interest Income 26 669 27 244 27 740 27 943 29 766 31 394 32 750
Net Result 14 173 15 142 16 197 16 231 16 099 17 288 16 951
Equity 111 337 126 824 128 264 136 375 141 593 145 147 149 384
Return on Equity (%) 12,7 % 11,9 % 12,6 % 11,9 % 11,4 % 11,9 % 11,3 %
EPS 7,5 8,0 8,6 8,4 8,3 8,4 8,6
Book value per share 58,4 66,5 67,3 70,1 72,8 73,5 75,9
DPS 5,5 5,8 6,0 5,0 7,5 6,5 6,8
Price/Earnings 14,0 15,4 13,2 15,0 13,6 11,8 11,4
Price/Book Value 1,8 1,8 1,7 1,8 1,5 1,3 1,3
Dividend Yield (%) 5,2 % 4,8 % 5,3 % 3,9 % 6,7 % 6,6 % 6,9 %
Svenska Handelsbanken AB Class AFinancials
/Banks
Price currency
Reporting currency
FX rate (NOK)
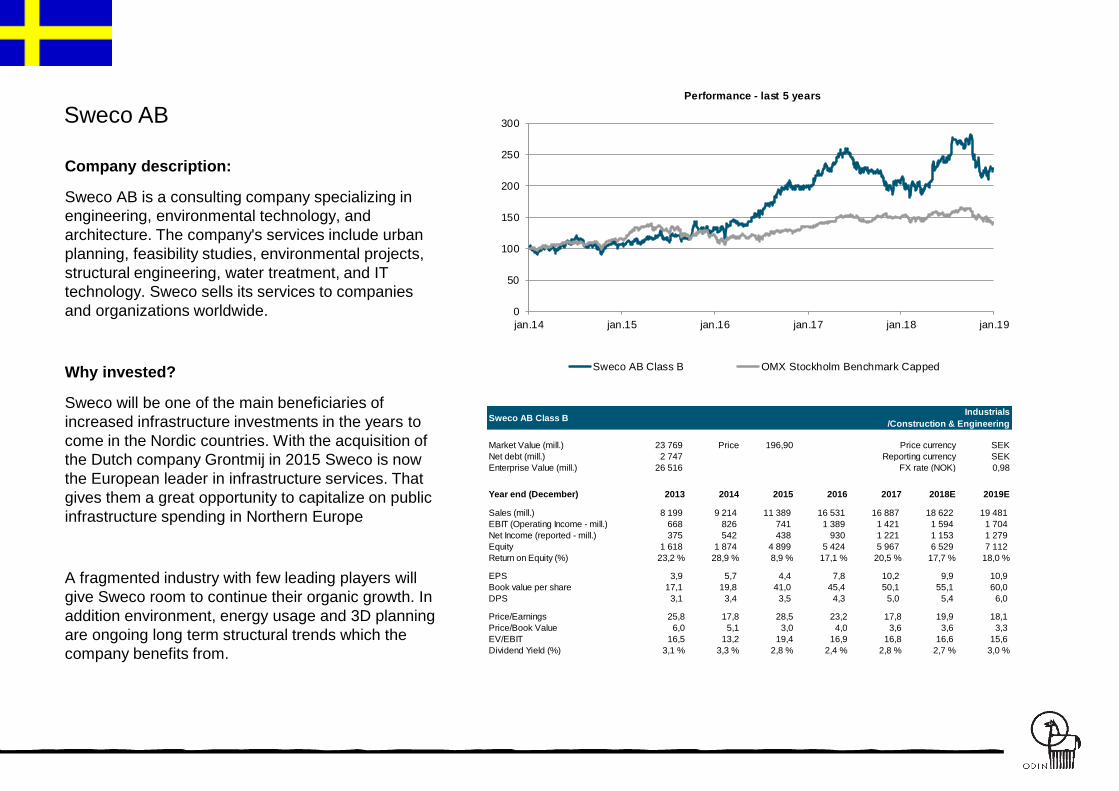
Sweco AB
Company description:
Sweco AB is a consulting company specializing in
engineering, environmental technology, and
architecture. The company's services include urban
planning, feasibility studies, environmental projects,
structural engineering, water treatment, and IT
technology. Sweco sells its services to companies
and organizations worldwide.
Why invested?
Sweco will be one of the main beneficiaries of
increased infrastructure investments in the years to
come in the Nordic countries. With the acquisition of
the Dutch company Grontmij in 2015 Sweco is now
the European leader in infrastructure services. That
gives them a great opportunity to capitalize on public
infrastructure spending in Northern Europe
A fragmented industry with few leading players will
give Sweco room to continue their organic growth. In
addition environment, energy usage and 3D planning
are ongoing long term structural trends which the
company benefits from.
Market Value (mill.) 23 769 Price 196,90 SEK
Net debt (mill.) 2 747 SEK
Enterprise Value (mill.) 26 516 0,98
Year end (December) 2013 2014 2015 2016 2017 2018E 2019E
Sales (mill.) 8 199 9 214 11 389 16 531 16 887 18 622 19 481
EBIT (Operating Income - mill.) 668 826 741 1 389 1 421 1 594 1 704
Net Income (reported - mill.) 375 542 438 930 1 221 1 153 1 279
Equity 1 618 1 874 4 899 5 424 5 967 6 529 7 112
Return on Equity (%) 23,2 % 28,9 % 8,9 % 17,1 % 20,5 % 17,7 % 18,0 %
EPS 3,9 5,7 4,4 7,8 10,2 9,9 10,9
Book value per share 17,1 19,8 41,0 45,4 50,1 55,1 60,0
DPS 3,1 3,4 3,5 4,3 5,0 5,4 6,0
Price/Earnings 25,8 17,8 28,5 23,2 17,8 19,9 18,1
Price/Book Value 6,0 5,1 3,0 4,0 3,6 3,6 3,3
EV/EBIT 16,5 13,2 19,4 16,9 16,8 16,6 15,6
Dividend Yield (%) 3,1 % 3,3 % 2,8 % 2,4 % 2,8 % 2,7 % 3,0 %
Sweco AB Class BIndustrials
/Construction & Engineering
Price currency
Reporting currency
FX rate (NOK)
0
50
100
150
200
250
300
jan.14 jan.15 jan.16 jan.17 jan.18 jan.19
Performance - last 5 years
Sweco AB Class B OMX Stockholm Benchmark Capped

Thule Group AB
Company description:
Thule is a global consumer brand which promotes an
active life. Thule is building their brand around the
concept of “bring your life”. With over 50 percent
global market share in the Sports & Cargo segment,
they are over five times larger than the number two
player globally. Their dominant position enables them
to generate superior returns in this segment together
with much bigger resources on product innovation.
We think this will enable them to grow into other
consumer segments as outdoor and bags together
with kids categories.
Why invested?
A strong cash flow, reduced debt position and strong
return on capital give support to the current valuation
of the company. The company will intensify product
development in the kids stroller market and the
luggage market. Both markets represent USD 30 bn
market where Thule could start to penetrate with their
new products.
Market Value (mill.) 16 730 Price 162,10 SEK
Net debt (mill.) 1 571 SEK
Enterprise Value (mill.) 18 301 0,98
Year end (December) 2013 2014 2015 2016 2017 2018E 2019E
Sales (mill.) 4 331 4 693 5 320 5 611 5 872 6 427 6 874
EBIT (Operating Income - mill.) 515 667 840 957 1 067 1 169 1 287
Net Income (reported - mill.) 298 199 587 676 690 837 958
Equity 1 797 2 966 3 228 3 826 3 468 3 825 4 112
Return on Equity (%) 16,6 % 6,7 % 18,2 % 17,7 % 19,9 % 21,9 % 23,3 %
EPS 0,1 -1,6 5,7 6,7 6,7 8,2 9,3
Book value per share 18,0 29,7 32,3 37,9 34,0 37,1 39,9
DPS #N/A 2,0 2,5 10,9 6,0 6,5 7,0
Price/Earnings #N/A -54,6 20,2 21,3 27,5 19,9 17,5
Price/Book Value #N/A 3,0 3,6 3,8 5,4 4,4 4,1
EV/EBIT - 15,4 16,4 17,0 19,4 15,7 14,2
Dividend Yield (%) #N/A 2,2 % 2,2 % 7,6 % 3,2 % 4,0 % 4,3 %
Thule Group ABConsumer Discretionary
/Leisure Products
Price currency
Reporting currency
FX rate (NOK)
0
50
100
150
200
250
300
jul.15 jul.16 jul.17 jul.18
Performance - since IPO
Thule Group AB OMX Stockholm Benchmark Capped
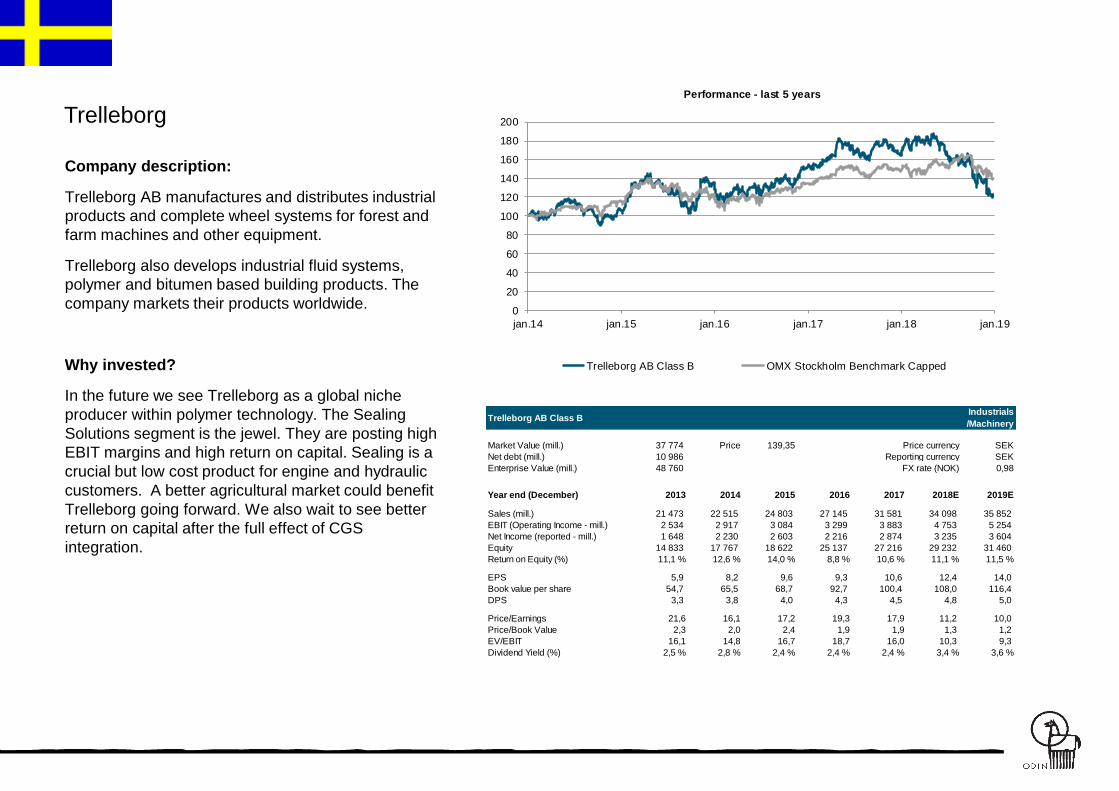
Trelleborg
Company description:
Trelleborg AB manufactures and distributes industrial
products and complete wheel systems for forest and
farm machines and other equipment.
Trelleborg also develops industrial fluid systems,
polymer and bitumen based building products. The
company markets their products worldwide.
Why invested?
In the future we see Trelleborg as a global niche
producer within polymer technology. The Sealing
Solutions segment is the jewel. They are posting high
EBIT margins and high return on capital. Sealing is a
crucial but low cost product for engine and hydraulic
customers. A better agricultural market could benefit
Trelleborg going forward. We also wait to see better
return on capital after the full effect of CGS
integration.
Market Value (mill.) 37 774 Price 139,35 SEK
Net debt (mill.) 10 986 SEK
Enterprise Value (mill.) 48 760 0,98
Year end (December) 2013 2014 2015 2016 2017 2018E 2019E
Sales (mill.) 21 473 22 515 24 803 27 145 31 581 34 098 35 852
EBIT (Operating Income - mill.) 2 534 2 917 3 084 3 299 3 883 4 753 5 254
Net Income (reported - mill.) 1 648 2 230 2 603 2 216 2 874 3 235 3 604
Equity 14 833 17 767 18 622 25 137 27 216 29 232 31 460
Return on Equity (%) 11,1 % 12,6 % 14,0 % 8,8 % 10,6 % 11,1 % 11,5 %
EPS 5,9 8,2 9,6 9,3 10,6 12,4 14,0
Book value per share 54,7 65,5 68,7 92,7 100,4 108,0 116,4
DPS 3,3 3,8 4,0 4,3 4,5 4,8 5,0
Price/Earnings 21,6 16,1 17,2 19,3 17,9 11,2 10,0
Price/Book Value 2,3 2,0 2,4 1,9 1,9 1,3 1,2
EV/EBIT 16,1 14,8 16,7 18,7 16,0 10,3 9,3
Dividend Yield (%) 2,5 % 2,8 % 2,4 % 2,4 % 2,4 % 3,4 % 3,6 %
Trelleborg AB Class BIndustrials
/Machinery
Price currency
Reporting currency
FX rate (NOK)
0
20
40
60
80
100
120
140
160
180
200
jan.14 jan.15 jan.16 jan.17 jan.18 jan.19
Performance - last 5 years
Trelleborg AB Class B OMX Stockholm Benchmark Capped
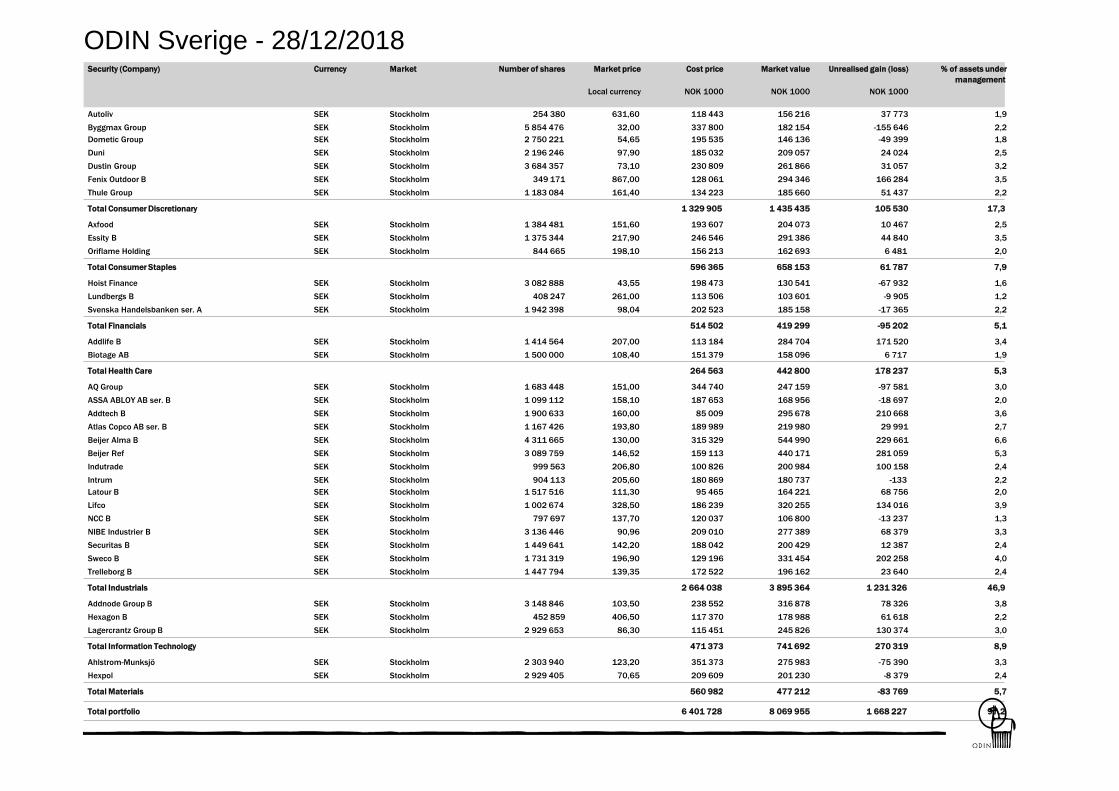
ODIN Sverige - 28/12/2018Security (Company) Currency Market Number of shares Market price Cost price Market value Unrealised gain (loss) % of assets under
management
Local currency NOK 1000 NOK 1000 NOK 1000
Autoliv SEK Stockholm 254 380 631,60 118 443 156 216 37 773 1,9
Byggmax Group SEK Stockholm 5 854 476 32,00 337 800 182 154 -155 646 2,2
Dometic Group SEK Stockholm 2 750 221 54,65 195 535 146 136 -49 399 1,8
Duni SEK Stockholm 2 196 246 97,90 185 032 209 057 24 024 2,5
Dustin Group SEK Stockholm 3 684 357 73,10 230 809 261 866 31 057 3,2
Fenix Outdoor B SEK Stockholm 349 171 867,00 128 061 294 346 166 284 3,5
Thule Group SEK Stockholm 1 183 084 161,40 134 223 185 660 51 437 2,2
Total Consumer Discretionary 1 329 905 1 435 435 105 530 17,3
Axfood SEK Stockholm 1 384 481 151,60 193 607 204 073 10 467 2,5
Essity B SEK Stockholm 1 375 344 217,90 246 546 291 386 44 840 3,5
Oriflame Holding SEK Stockholm 844 665 198,10 156 213 162 693 6 481 2,0
Total Consumer Staples 596 365 658 153 61 787 7,9
Hoist Finance SEK Stockholm 3 082 888 43,55 198 473 130 541 -67 932 1,6
Lundbergs B SEK Stockholm 408 247 261,00 113 506 103 601 -9 905 1,2
Svenska Handelsbanken ser. A SEK Stockholm 1 942 398 98,04 202 523 185 158 -17 365 2,2
Total Financials 514 502 419 299 -95 202 5,1
Addlife B SEK Stockholm 1 414 564 207,00 113 184 284 704 171 520 3,4
Biotage AB SEK Stockholm 1 500 000 108,40 151 379 158 096 6 717 1,9
Total Health Care 264 563 442 800 178 237 5,3
AQ Group SEK Stockholm 1 683 448 151,00 344 740 247 159 -97 581 3,0
ASSA ABLOY AB ser. B SEK Stockholm 1 099 112 158,10 187 653 168 956 -18 697 2,0
Addtech B SEK Stockholm 1 900 633 160,00 85 009 295 678 210 668 3,6
Atlas Copco AB ser. B SEK Stockholm 1 167 426 193,80 189 989 219 980 29 991 2,7
Beijer Alma B SEK Stockholm 4 311 665 130,00 315 329 544 990 229 661 6,6
Beijer Ref SEK Stockholm 3 089 759 146,52 159 113 440 171 281 059 5,3
Indutrade SEK Stockholm 999 563 206,80 100 826 200 984 100 158 2,4
Intrum SEK Stockholm 904 113 205,60 180 869 180 737 -133 2,2
Latour B SEK Stockholm 1 517 516 111,30 95 465 164 221 68 756 2,0
Lifco SEK Stockholm 1 002 674 328,50 186 239 320 255 134 016 3,9
NCC B SEK Stockholm 797 697 137,70 120 037 106 800 -13 237 1,3
NIBE Industrier B SEK Stockholm 3 136 446 90,96 209 010 277 389 68 379 3,3
Securitas B SEK Stockholm 1 449 641 142,20 188 042 200 429 12 387 2,4
Sweco B SEK Stockholm 1 731 319 196,90 129 196 331 454 202 258 4,0
Trelleborg B SEK Stockholm 1 447 794 139,35 172 522 196 162 23 640 2,4
Total Industrials 2 664 038 3 895 364 1 231 326 46,9
Addnode Group B SEK Stockholm 3 148 846 103,50 238 552 316 878 78 326 3,8
Hexagon B SEK Stockholm 452 859 406,50 117 370 178 988 61 618 2,2
Lagercrantz Group B SEK Stockholm 2 929 653 86,30 115 451 245 826 130 374 3,0
Total Information Technology 471 373 741 692 270 319 8,9
Ahlstrom-Munksjö SEK Stockholm 2 303 940 123,20 351 373 275 983 -75 390 3,3
Hexpol SEK Stockholm 2 929 405 70,65 209 609 201 230 -8 379 2,4
Total Materials 560 982 477 212 -83 769 5,7
Total portfolio 6 401 728 8 069 955 1 668 227 97,2
About ODIN
Investment ObjectiveLong term value creation
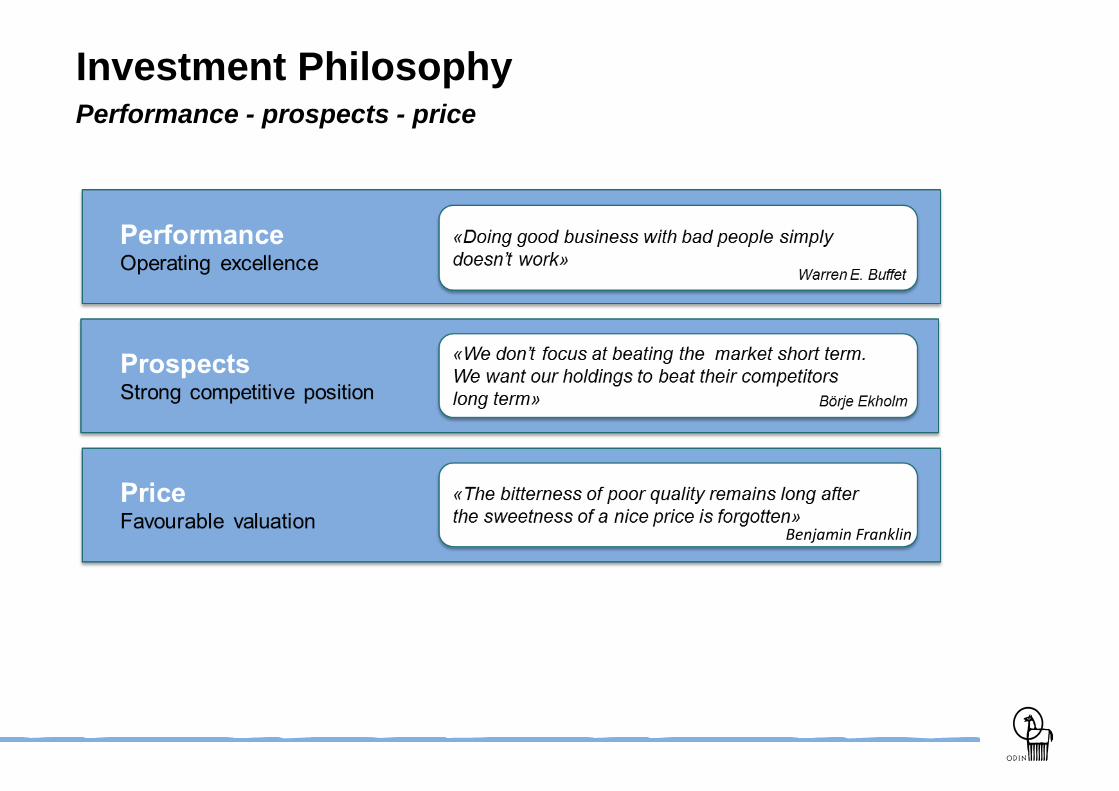
Investment PhilosophyPerformance - prospects - price
Benjamin Franklin

Om ODIN Sverige C
ODIN Sverige är en aktivt förvaltad aktiefond som
investerar i den svenska aktiemarknaden.
Fondens långsiktiga mål är att ge högre avkastning
än den svenska aktiemarknaden, mätt enligt
fondens referensindex.
Fakta om fonden
Ansvarig förvaltare Vegard Søraunet
Förvaltare sedan Januari 2013
Referensindex OMX Stockholm Benchmark
Basvaluta NOK
Förvaltningsavgift 1,20 %
Tecknings-/inlösenavgift 0 %
Minsta teckningsbelopp 100 SEK
Om förvaltaren
Förvaltare/CIO Vegard Søraunet har arbetat på ODIN sedan maj
2006. Vegard är civilekonom från Handelshögskolan BI, med
inriktning mot finans. Han har dessutom en master i redovisning
och har tidigare arbetat med revision.
Vegard är sedan januari 2013 ansvarig förvaltare för ODIN Sverige
och sedan juni 2014 förvaltar han även ODIN Norden tillsammans
med Truls Haugen. Sedan 1 november 2017 är han även
investeringsdirektör för ODIN.
Sedan Vegard kom till ODIN har han spelat en central roll i
uppbyggnaden av ODINs globala förvaltning och uppnått mycket
goda resultat. Han har också gjort viktiga insatser i utformningen av
ODINs investeringsprocess och analysapparat.
Under några år förvaltade han även ODIN Emerging markets och
ODIN Global, men har nu sitt fokus på Sverige och Norden.
Välkommen att använda våra tjänster
Sätt dina pengar i arbete
Teckna andelar i våra fonder
på nätet med BankID
Håll dig
uppdaterad
Anmäl dig till
vårt nyhetsbrev
Fråga oss08 407 14 00
Kontrollera innehav,
avkastning m.m.Logga in på dina fondsidor
hos ODIN Online
Värt att tänka på
Historisk avkastning är ingen garanti för framtida avkastning, som bland annat beror på
marknadsutvecklingen, förvaltarens skicklighet, fondens risk samt kostnader för förvaltning. Avkastningen
kan bli negativ om aktiekurserna faller.
Uttalandena i denna rapport speglar ODINs syn på marknaden vid den tidpunkt då rapporten utarbetats. Vi
har använt källor som bedöms vara pålitliga, men vi kan inte garantera att uppgifterna från dessa källor är
korrekta eller fullständiga.
Anställda hos ODIN Forvaltning AS får handla för egen räkning med flera slags finansiella instrument. Det
innebär att anställda hos ODIN Forvaltning AS kan äga värdepapper i företag som omnämns i den här
rapporten, liksom andelar i ODINs fonder. Anställdas egenhandel ska följa ODIN Forvaltning AS interna
riktlinjer för anställdas egenhandel, som har utarbetats i enlighet med den norska lagen om handel med
värdepapper ("verdipapirhandelloven") och Verdipapirfondenes forenings branschstandard.
Faktablad och informationsbroschyr för fonden hittar du på hemsidan under http://odinfonder.se/vara-
fonder/aktiefonder/odin-sverige/