Embed Size (px)
Citation preview


NORGES OFFISIELLE STATISTIKK XII 233
FOLKEMENGDENS BEVEGELSE1966
VITAL STATISTICS AND MIGRATION STATISTICS1966
STATISTISK SENTRALBYRÅCENTRAL BUREAU OF STATISTICS OF NORWAY
OSLO 1968

Tidligere utkommet
Oversikt over de viktigste resultater av statistikken vedkommende folke-mengdens bevegelse i tidsrommet 1866-1885 se rekke III, 106; FolkemængdensBevægelse 1886-1900, Hovedoversigt, se rekke V, 25, Folkemængdens Bevægelse1901-1910, Hovedoversigt, se rekke VI, 55, Folkemængdens bevegelse 1911-1920, Hovedoversigt, se rekke VIII, 6 og Folkemengden.s bevegelse 1921-1932,se rekke IX, 70.
For årene 1883-1895 se Norges Offisielle Statistikk, rekke III, for 1896-1900,rekke IV.
Folkemengdens bevegelse 1901-1902 V 2, 1903-1904 V 34, 1905 V 70,1906-1907 V 136, 1908-1909 V 187, 1910 V 209, 1911 VI 17, 1912 VI 51, 1913VI 66, 1914 VI 83, 1915 VI 111, 1916 VI 163, 1917 VII 2, 1918 VII 31, 1919 VII 72,1920 VII 92, 1921 VII 121, 1922 VII 158, 1923 VII 200, 1924 VIII 22, 1925 VIII 47,1926 VIII 70, 1933 IX 83, 1934 IX 94, 1935 IX 122, 1936 IX 148, 1937 IX 171,1938 IX 192, 1939 X 18, 1940 X 58, 1941 X 95, 1942-1945 X 172, 1946 X 194,1947 XI 17, 1948 XI 34, 1949 XI 89, 1950 XI 112, 1951 XI 148, 1952 XI 191,1953 XI 233, 1954 XI 254, 1955 XI 282, 1956 XI 316, 1957 XI 345, 1958 XII 23,1959 XII 49, 1960 XII 97, 1961 XII 112, 1962 XII 146, 1963 XII 171, 1964XII 194, 1965 XII 220.
REKLAMETRYKK A.S - BERGEN

Forord
Denne publikasjonen inneholder forholdsvis detaljerte tabeller over folke-mengdens bevegelse i 1966. I tillegg til resultatene som publiseres i dette heftet,har Byrået i manuskript tabeller som ikke vil bli trykt. En oversikt over dissetabellene er gitt på side 49.
Førstesekretær Birgit Skaanes har stått for utarbeidingen av publikasjonen.
Statistisk Sentralbyrå, Oslo, 4. april 1968.
Petter Jakob Bjerve
Gisle Skancke

Preface
This publication contains relatively detailed tables on vital and migrationstatistics in 1966. In addition to the tables published in this volume, the Bureauhas prepared some tables which only exist in manuscript. A list of these tables isgiven on page 50.
The publication has been prepared by Mrs. Birgit Skaanes.
Central Bureau of Statistics, Oslo, 4 April 1968.
Petter Jakob Bjerve
Gisle Skancke

InnholdTabeller Side
1. Folkemengden etter alder 72. Bevegelsen i den hjemmehørende folkemengde etter fylke 83. Folkemengde og folketilvekst etter fylke 94. Vigde etter kjønn, alder og ekteskapelig status 105. Inngåtte ekteskap etter brudens og brudgommens alder 146. Skilsmisser etter ektefellenes alder 157. Skilsmisser etter ekteskapets varighet og barnetallet 158. Fødsler og fødte barn etter fylke 169. Levendefødte etter morens alder og ekteskapets varighet 18
10. Levendefødte i ekteskap etter barnets nummer og ekteskapets varighet 2011. Levendefødte i ekteskap etter morens alder og barnets nummer 2212. Levendefødte etter farens alder 2313. Fødte etter morens alder 2314. Fødte etter måned 2415. Flerfødsler 2516. Døde etter kjønn, alder og fylke 2617. Døde etter kjønn, alder og ekteskapelig status 3018. Døde i de to første leveår 3119. Døde etter alder og dødsmåned 3220. Flyttore innenlands etter kjønn og alder 3321. Nettoflytting mellom landsdelene 3322. Flyttere mellom bykommuner og herredskommuner etter landsdel 3423. Nettoflytting mellom bykommuner og herredskommuner etter landsdel 3624. Flyttere innen og mellom fylkene etter kjønn, by- og herredskommuner 3825. Flyttere fra og til utlandet etter kjønn, ekteskapelig status og land. . ...... . . . • • 4626. Flyttere fra og til utlandet etter kjønn og alder 4827. Flyttere fra og til utlandet etter fraflyttings-/ tilflyttingsland og statsborgerskap . 48
Utrykte tabeller 49
VedleggPublikasjoner sendt ut fra Statistisk Sentralbyrå siden 1. januar 1967 . . . .. . .. 51
Standardtegn• Tall kan ikke forekomme
- Null

Contents
Tables Page
1. Population by age 72. Movements of resident population by county 83. Population and increase of population by county 94. Married persons by sex, age and marital status 105. Marriages by age of bride and bridegroom 146. Divorces by age of husband and wife 157. Divorces by duration of marriage and number of children 158. Births by county 169. Live births by age of mother and duration of marriage 18
10. Live births by birth order and duration of marriage 2011. Legitimate live births by age of mother and birth order 2212. Live births by age of father 2313. Births by age of mother 2314. Births by month 2415. Confinements of multiple births 2516. Deaths by sex, age and county 2617. Deaths by sex, age and marital status 3018. Deaths under 2 years of age 3119. Deaths by age and month of death 3220. Migrants by sex and age 3321. Net migration between regions 3322. Migration movements in urban and rural municipalities by region 3423. Net migration movements in urban and rural municipalities by region 3624. Migrants by sex cross-classified by county. Urban and rural municipalities 3825. Immigrants and emigrants by sex, marital status and country 4626. Immigrants and emigrants by sex and age 48
27. Immigrants and emigrants by country and citizenship 48
Unprinted tables 50
AppendixPublications issued by the Central Bureau of Statistics since 1 January 1967. • . • • • 51
Explanation of Symbols. Category not applicable
- Nil

7
Tabell 1. Folkemengden etter alder.Population by age.
AlderAge
MiddelfolkemengdeMean population
Folkemengde ved utgangenav året
Population at the end of theyear
I altTotal
MennMales
KvinnerFemales
I altTotal
MennMales
KvinnerFemales
Under 1 år year 65 745 33 943 31 802 66 180 34 159 32 0211— 4 » years 250 728 128 880 121 848 252 646 129 884 122 7625— 9 » » 306 382 156 850 149 532 305 701 156 661 149 041
10-14 » » 304 602 155 977 148 625 306 678 156 854 149 82415-19 » » 310 547 159 594 150 953 305 757 157 246 148 51120-24 » » 275 927 142 019 133 908 288 042 148 421 139 62125-29 » » 209 437 106 675 102 762 210 835 107 369 103 46630-34 » » 195 119 98 911 96 208 193 728 98 269 95 45935-39 » » 218 508 110 808 107 700 215 681 109 300 106 38140-44 » » 249 564 126 028 123 536 246 378 124 575 121 80345-49 » » 256 589 128 029 128 560 258 345 128 924 129 42150-54 » » 239 174 118 991 120 183 239 565 119 030 120 53555-59 » » 219 663 107 582 112 081 221 417 108 641 112 77660-64 » » . . . . . . . . 194 115 91 864 102 251 194 880 92 210 102 67065-69 » » 167 258 77 000 90 258 168 522 77 513 91 00970-74 » » 127 582 57 852 69 730 129 658 58 671 70 98775-79 » » 84 801 36 805 47 996 85 959 37 291 48 66880 år og over and over . . . 77 008 32 023 44 985 77 830 32 307 45 522
—3 752 749 1 869 831 1 882 918 3 767 802 1 877 325 1 890 477I alt Total
0— 6 år years 438 025 225 138 212 887 440 296 226 349 213 9477-14 » » 489 432 250 512 238 920 490 910 251 209 239 701
15-17 » # 181 103 93 127 87 976 178 815 91 932 86 88318-64 » » - 2 187 540 1 097 374 1 090 166 2 195 813 1 102 053 1 093 76065 år og over and over . . . 456 649 203 680 252 969 461 968 205 782 256 186

8
Tabell 2. Bevegelsen i den hjemmehørende folkemengde etter fylke.Movement of resident population by county.
FylkeCounty
Inngåtteekte-skap'
Marri-ages
Levende-fødteLivebirths
Av dissefødt
utenforekteskapOf whichillegiti-mate
Død-fødteStill-births
Av dissefødt
utenforekteskapOf whichillegiti-
mate
DødeDeaths
Over-skott av
fødteExcess
of birthsover
deaths
Hele landet The whole country . . . 27 680 67 061 3 286 812 49 36 010 31 051Bykommuner Urban municipa-lities 13 375 26 168 1 366 298 19 15 610 10 558Herredskommuner Rural muni-cipalities 14 305 40 893 1 920 514 30 20 400 20 493
Bykommuner fylkesvisUrban municipalities by county
Østfold 544 1 173 47 15 848 325Oslo 4 787 6 899 404 83 7 5 448 1 451Hedmark 188 402 12 6 303 99Oppland 286 778 45 10 371 407Buskerud 772 1 520 51 16 1 944 576Vestfold 443 757 26 6 634 123Telemark 702 1 529 53 14 816 713Aust-Agder 147 290 6 2 245 45Vest-Agder 598 1 516 48 9 1 704 812Rogaland 1 142 2 726 80 26 1 353 1 373Bergen 1 117 2 061 127 36 4 1 213 848Sogn og Fjordane 47 144 3 2 67 77Møre og Romsdal 442 946 49 9 1 515 431Sør-Trøndelag 1 077 2 485 148 29 1 1 088 1 397Nord-Trøndelag 211 632 23 7 3 293 339Nordland 265 567 56 3 172 395Troms 461 1 312 132 19 1 458 854Finnmark 146 431 56 6 138 293
I alt Total 13 375 26 168 1 366 298 19 15 610 10 558
Herredskommuner fylkesvisRural municipalities by county
Østfold 909 2 286 69 33 1 274 1 012Akershus 2 021 5 528 168 64 3 1 960 3 568Hedmark 843 2 344 118 24 1 1 442 902Oppland 708 2 011 94 29 3 1 259 752Buskerud 661 1 497 64 15 1 928 569Vestfold 745 2 031 57 17 1 1 045 986Telemark 394 1 026 48 15 728 298Aust-Agder 331 879 22 16 650 229Vest-Agder 249 723 10 6 406 317Rogaland 746 2 403 30 38 1 876 1 527Hordaland 1 555 4 884 129 52 2 014 2 870Sogn og Fjordane 500 1 574 41 15 1 1 002 572Møre og Romsdal 1 056 3 018 89 37 3 1 480 1 538Sør-Trøndelag 650 1 833 100 23 1 1 130 703Nord-Trøndelag 553 1 620 82 32 4 886 734Nordland 1 406 4 201 402 65 6 2 033 2 168Troms 564 1 577 190 14 4 781 796Finnmark 414 1 458 207 19 1 506 952
I alt Total 14 305 40 893 1 920 514 30 20 400 20 493
Note : Ikke medregnet 312 ekteskap hvor brudgommen var bosatt i utlandet.Note: 1 Not including 312 marriages with bridegroom resident abroad.

9
_rga)
, ,0,,,
,)rz.,•,'
' d ,..?:, P, z
.-.) t
• , o-, ..,
• .-".,
00 CD CA CA 10 10 CC t- CA CC , ..0 10 ,-. C
A t- CA CA CA 00 Ca
C27 Vi ' C: 7 (5' c:7 c:7 c:7 c:7 c:7 ,-,:' 7-4' ,-, 1' c:7 c:7 c:;' ,.; c:7 c:7 c:7 a:7
1
C)CC
. 'C
g
. .
CDn g
l'')
0
r:l.,,--.4
;-,C4
Isi'''Z N
..
cc Ço
CA t- 'CC
,, ,t C.0 CC VC IC c..S C.: ,
C.0 t- . CC CC CC C.0
cc CD GO c.0 TC r- m m vz ,i
, ,,o r- c:, co et
, cl ,, a:, c) cc
,, cc CA CA
',1t --
't
VD
.. ,..0 C
A CD ,
1 .' C) C) OC ,..0 C7, 00 V
I,..0 C) 00 t° CC 10 ,t t- Ca GC 00 CD CA C, CC CA t- 00 ,., CC
CD ,t 10 00 0C CC 00 t- CC 10 CA CA cc ,t CD ,. 10 ,-1 cc CC
,, ,, cc irri r.
fr. r
r. r.
t-r-CDC,
C.0
g
cic
CDt.,,
lc,. CA () Q) .0 cc cc 7? ,fC', CA ,f QC t- ,, C, CD CA CD
OC t- CC cc N
M 1
C'
00 .7i-, c
c G
Y`Z
X ,, G
1L
--. G
M
..d., C`,`D
GO,, G
7? 4C C.0 CZ ,t QC ,-I at
, oo CA CC QC CC .0 GO ,, 7? CC
QS CA ,f C) .0 .0 CC GC CZ CC C- -
CC 7? ,-.1 C) ,
-I CZ .7) DO CZ
(::::) -,•t N
c., c
c Ca 00 t- CC t0 CA CI 10 10 .-, ,-. 10 cc c.,0 M
N
,-, ,,,
,, ,,
,,
10
C,1CC
t--
00
,.
..i..
c3 "8
ea 00 CI cc CD ,t t- CD t- c.0 et 00 ,t CA 7? CA Cq CC ICC CS)
.0 it-
,, t- Cr; C) 00 C9 t- C) C) .0 C) ,CC CA 00 .0 C) CC ,,
eC QS t--. 1--
- () t- GO C) cl vc ,-I CC ei.,
t- ,t CC et .-, C
A =,
CA CA CA t- Cr, ,. C- c.ID GO t- cc CC IL - -
CD Cc et c- -t et uc
,, CC 00 t- CS) CZ c.0 .0 t-- p•-i trz ,t, ,, C ,-4 CA r•-•1 •°°. C
C t--
C,1 CA 7? p-, r., -- r-, ,-, N N
,-,
,-.1
N N
- N
,--,
CA()GC
t--Q0
N„,
M
---
,,,,..---,
----- • F.,
.1
'-•48
,g.........,_
,..
,..- ,,,,„,
, . ,... ,
tt4-, 7: 4.,
tg
-4. .,
''.','
,...,•.-,
,...,,)
0
S-1
. 5t,--,
K....,k.,,,--,
M.---,::3
CC I-- C) CA CA CO V- C, V- t- CA 10 C- C- CD et 10 Cr,
lc- 10 CC cc G
NN
NC
5aN
G1r.,
00
©0
0't G
CN
N,,M
MN
,,
N ,-
11.0
MM
NN
N'r
t C
7,-
,1.1
N
cc-
I I
11
H
MI
et
'71,
N'
I,..,
,,-,(1)
t
t.- 7? t-- CZ C) t- C) ,C QC 00 CC CC 00 CZ CC 7f CS)
,,
c...0 p-
CD CA ,C CC CC et GC CC CA CA ,. CC CC cZ
, c.0 1, -- cc ,-i CA ,..0
cl m ,, cc
,, ,.cc co m cc cc
cc , t
, ,.. CA CA
cc
.,
,.
1
H
II
II
1111
,, .CD .
CAI
r44
.
.,....,
4)
-1-', •CZ,--1
,...,
,,,,
7i
I,
C)
0
CD ,,,,
0
,°3.
'.3
c,.,.5•
,1.,
g 'Z't
m.7
,, cf., .,
'ccC-. t- CC Irs-- ,C OC C.0 CS) .0 CZ ,, 00 CA CC ,, Q) CC ,, CA ,,
,ic--. L-. C.C, 7? .0 IC .0 'C ,-.1 I
C IC)
'-. ,f CC CD
ICC CC 00 cc
©
,...,r. r
...-4
r.r.
MQ0
00
'Cr..
c'Z
,-..,0 t
,,
•-.1
',7N
C", N
*r
, G •
ri, N
G .,t 't I
CZ
N M
N 0
0 G
G N
'et, GQD 00 10 CA CD cc ,t ,t CA CC GC Gs3 C
A ,-, "CC ,
f CC 7? CA CA
10 c- t- uc c..0 vc uC efg ,, ,C CC CC ,t CC C, CD 10 CA 00 ,...0
,.
,. ,.
,.
,.
00OC
re,10
r.
C'Dcc 'C
i-d.4..,
0 tQ.,
(1 +
:• .4
,)4-I
CJI7
-.).C. D
CD
G,D
r.G
qir
DN
',1,
C,C
r...
7hr
-"C'D
C,D
)1,C
Cr.
CZ .0 CZ CZ ,f .0 C-.. C) CC ,, cc r
- ,SD 00 CC CC t° = CC cc
00 00 ,..0 t- 1L --
GO t- t- 7? IC C) GC .0 7? CC CD ,C Cc 10 CA
Cq
r.
r.
CD
CA.0
C..Sr.
0 t
,.. Z l'CC cc CC 10 C- ,, t- CA CD CC 10 c.0 cc 10 GC vC C, cc ,
-1 mcc (:) to
"CC 00 CA C) ,f CS) C
C CD CC ,t GC 10 00 CD Ct CD 00
cc ,. c- C, 00 CD CC GC ,t uC CA ,, cc .0 CD ,. CO CA IL--
CC
,, .-, CA ,, ,. .-. ,. ,. ,,
(:::,Ca et
Ca
.-.
0,..,,,-d rz)0
.±..,4,
,...0 • ,
,cl gz,
g
,,0 ..
'''0
,e4
.-+,,,
0
,,g
r-8
.5,,
cc co ca r- co G
, 1 ca r- ez cc
CC QD Cq QD 00 CC L-- CC ,t CD
t- cc 00 ,.,
Ca CC CC cc 00 ,-I CC ,..0 C
C ,. eig cc
p cc ,„0 00
cc ,,c, ayz
cc cc ,t an cc
uC .--1 10 CC CC 00 C, CD e. CA CC DO
,. CA CC ,, . ,, ,, ,,
,, CA CA
F. cl .-. cc
,..
CC
00CC
CACC
g
c,',.?g ^-,
0cc
t- CA © CC cc 10 C, GO .,, t- C, o0 CC CA cr.,
10 10 10 10 CC
GO C, ,, ts- C7, GO 7, 00 00 CA CC ,. c.0 CD ,-.1 C
A ,t GO CA CD
t- 00 10 ,t ,t 10 ,t CA .0 ,, 10 ,C CD CC CD CA e. ,t ,°C C
D
cc cc .-. ,. .-. ,-, r.
r•-g cl N p•-•1CA CA ,--1 C
A ,--t r.
00t-
,..SD
eticc
CDrtbl)
g ,,..
g
.. t
CI,„:1Z-.3'.
CD P., t
r- C)
'--ZO
RI, ,,
;..,c,
Q .
g
'..-80• ,.,
,,,,,,,
kg
aq r- NN cl Go
1,.... 1,, () ,, CC ,, 1--- CZ CC 7f Q) ,, CA C.0
CA t- CA ,CC ,? CS) ,
f CZ 00 C- -
OC CC 7? IC CA ,, c-- ,f C) cr,
N 7
i, C., C
:::, C::, r, G
N C
> G
C ...-i N
,t, C
T, M
IrJ -n
4 G
-,-1, 00
4C QC 00 t- CC ,C CC QC CZ t- CS)
OC CI OC 00 ,, IL-.. 00 ,f I,C
C) CC ,C 00 00 CZ 00 t- CC .0 CA ,-, c...
7? C) ,, IC)
,--, ,1C CC
--cc CA
,, ,.
,, ,.
,.
GO10
Mt-
,,,,
.-.
5. _Z:',
ci.),....it
,..0 c, p ,.... c-, ez, ,.., eC
cc Ca ,, t- CC 00 GO t- Ca et 7
t4 r.
,, MC CC 00 C) ,, CC CD et , ,t.,
,..0 CC ,, GC ,f CC C) CC CA
,t C", GO CA ,, .0 t- CA C) C) 00 .0 t
.- QC 7? CA
1C--- C) GC C)
uC c- et CD 10 4C CA GC CZ OC ,C ,, 7f ,, CC C) CC 'CC it- CZ
(:) CC CA CZ GC CZ GC t-- CC .0 CA CA .0 .0 C) .1 ,C CA C.0 CC
,
.
00CC
CC
CA0,
••
•'
• bf) •
'71t
•cI
••
•
ct, • -t
„c4) • :
.-k
7:
g
. a, I
.•
;--1 tC
ta
t 0 c
t,bf,
gc-, 3'
•t '74 t;
to
*;,
ct ci) E„ E-q
7,50.) 0 7:5
cp w 7-,
cn (1) C:2
-■ci)
c.) o
0 c,) o
c 0 0
CDc)
CDE,
P4;4
Dr)
E,cc m ,tic
cc t- oc
m ,t ea ,z t-
cc cc CD
cc ©
r.
a.)

10
Tabell 4. Vigde etter kjønn,Married persons by sex,
AlderAge
Hele landetThe whole country
By-Urban
Menn Males Kvinner Females Menn Males
Enke-SkilteUng-
mennkarer Di-
Widow-Bachelors .vorceders
PikerSpinsters
EnkerWidows
SkilteDi-
vorced
Ung-karer
Bachelors
Enke-menn
Widow-ers
SkilteDi-
vorced
15 år years _.. 1416» » 8 201 417 » 65 880 2818 » » 398 2 313 20919 » » 1 221 3 291 3 54920 » » . 2 016 1 3 959 16 946 121 » 2 736 15 3 815 1 36 1 329 1022 » » 3 241 19 3 171 5 62 1 600 1023 » » 3 038 21 2 282 5 64 1 518 1124 » » 2 412 34 1 567 6 66 1 137 2125 » » 1 998 4 47 1 013 8 63 943 2 2526 » » 1 666 3 62 792 6 82 814 2 3727 » » 1 352 4 70 547 7 60 606 2 4528 » » 993 6 69 399 3 68 478 3 4429 » » 761 77 281 6 76 344 4930 » » 628 4 70 173 6 52 277 3 4931 » » 457 2 56 176 6 44 178 3332 » » 346 4 49 129 6 57 135 2 3633 » » 309 1 56 121 5 50 133 3934 » » 269 3 61 114 10 45 114 1 4635 » » 223 3 58 93 11 47 91 - 3636 » » 176 3 61 65 7 34 77 2 4237 » » 188 9 46 72 12 33 73 3 3138 » » 145 4 46 53 12 34 61 4 2839 » » 122 3 51 64 8 29 57 1 3440 » » 117 7 37 62 17 24 43 5 2541 » » 96 9 47 40 8 39 47 5 3742 » » 98 11 39 44 10 42 42 3 2343 » » 85 10 50 42 11 25 38 5 3744 » » 66 12 42 31 10 33 32 5 3145 » » 60 13 27 34 14 27 14 6 1746 » » 54 18 33 45 11 29 16 8 2447 » » 31 10 34 22 16 22 13 8 2748 » » 35 15 29 32 12 28 12 7 1849 » » 28 13 35 28 4 24 11 7 2550 » » 27 16 22 13 14 28 8 8 1551 » » 20 11 20 21 11 15 5 6 1452 » » 26 15 20 13 9 11 10 8 1453 » » 11 12 20 20 8 8 8 7 1354 » » 19 18 15 16 20 9 8 10 1055 » » 15 16 12 13 14 7 6 11 1056 » » 13 16 13 15 9 5 5 9 757 » » 18 10 13 8 14 7 9 6 1358» » 7 10 12 5 5 4 2 6 1159 » » 8 16 9 9 8 4 6 9 660 » » 4 18 8 7 4 2 2 13 461» » 4 13 1 4 6 5 2 1062 » » 5 17 6 4 8 3 2 10 663» » 3 7 2 5 8 6 264» » 2 22 5 9 2 5 1 18 465» » 5 12 4 4 3 1 2 4 4

11
alder og ekteskapelig status.age and marital status.
kommunermunicipalities
HerredskommunerRural municipalities
Kvinner Females Menu Males Kvinner Females
PikerSpinsters
EnkerWidows
SkilteDivorced
UngkarerBachelors
EnkemennWidowers
SkilteDivorced
PikerSpinsters
EnkerWidows
SkilteDivorced
6 - - - - 8 - -82 - 4 - 119 - -
354 - - 37 - 526 - -975 _____ - 189 ____ 1 338 _____ -
1 496 1 672 - - 1 795 - 21 873 - 12 1 070 - 2 086 - 41 937 22 1 407 5 1 878 1 141 673 3 38 1 641 9 1 498 2 241 233 2 39 1 520 - 10 1 049 3 25
860 3 43 1 275 - 13 707 3 23525 1 39 1 055 2 22 488 7 24420 2 46 852 1 25 372 4 36294 4 39 746 2 25 253 3 21226 2 49 515 3 25 173 1 19150 2 49 417 28 131 4 2794 3 35 351 1 21 79 3 1791 3 28 279 2 23 85 3 1658 4 30 211 2 13 71 2 2754 3 32 176 1 17 67 2 1859 5 28 155 2 15 55 5 1744 6 27 132 3 22 49 5 2031 1 17 99 1 19 34 6 1741 4 18 115 6 15 31 8 1524 7 24 84 18 29 5 1034 6 18 65 2 17 30 2 1131 9 15 74 2 12 31 8 923 4 27 49 4 10 17 4 1222 7 28 56 8 16 22 3 1417 3 19 47 5 13 25 8 618 6 20 34 7 11 13 4 1318 8 15 46 7 10 16 6 1225 5 21 38 10 9 20 6 814 8 12 18 2 7 8 8 1019 6 21 23 8 11 13 6 718 2 18 17 6 10 10 2 6
4 6 23 19 8 7 9 8 511 7 14 15 5 6 10 4 1
6 5 7 16 7 6 7 4 413 6 6 3 5 7 7 2 210 12 5 11 8 5 6 8 4
8 7 6 9 5 2 5 7 19 7 3 8 7 6 6 2 24 7 4 9 4 - 4 7 33 2 3 5 4 1 2 3 16 4 3 2 7 3 3 4 15 2 2 5 4 2 2 21 4 4 2 3 1 3 2 13 5 2 3 7 - 1 3 14 7 - 3 1 - 1 1 -6 1 5 1 4 1 3 1 -2 2 1 3 8 - 2 1 -

12
Tabell 4 (forts.). Vigde etter kjønn,
AlderAge
Menn Males
Enke-Un,-- menn
karer 1Widow-
Bachelors 1ers
Hele landetThe whole country
By-Urban
SkilteDi-
vorced
Kvinner Females Menn Males
, PkerSpinsters
EnkerWi,dows
SkilteDi-
vorced
-Ling-karer
Bachelors
Enke-menn
Widow-ers
SkilteDi-
vorced
66 ar year, 1 13 3 6 1 5 167» » 3 9 5 4 2 2 6 568 » » 2 11 1 2 2 1 2 4 169» » 1. 7 1 1 — 1 1 4 —70 » » 3 7 1 — 4 1 3 5 171» 13 1 1 1 9 —72»» 6 2 — 2 273 » * -- 6 — 3 4 574» » 2 7 2 1 3 1 675»» 1 4 — 2 1 1 4 —76» 2 — 1 2 177» 1 4 1 278» * 1 2 — 1 1 1 —79» » 1 1 1 1 1 1 180» » • • • . • _____ — — —81» » 1 2 — 182» » 1 1 183» » — 1 1
I alt Total . . . . . 25 643 496 1 541 26 148 413 1 431 12 059 283 1 033
Sammendrag:Summary:15-19 år years .. 1 692 — 6 699 — 3 790 —20-24 » »• • 13 443 90 14 794 17 244 6 530 5325-29 » »• • 6 770 17 325 3 032 30 349 3 185 9 20030-34 » » .. 2 009 14 292 713 33 248 837 6 20335-39 » »• • 854 22 262 347 50 177 359 10 17140-44 » » .. 462 49 215 219 56 163 202 23 15345-49 » » . . 208 69 158 161 57 130 66 36 11150-54 » » .. 103 72 97 83 62 71 39 39 6655-59 » » .. 61 68 59 50 50 27 28 41 4760-64 » » .. 18 77 22 29 28 15 7 57 1665-69 » » .. 12 52 14 11 13 3 8 23 1170-74 » » . . 5 39 6 5 14 1 4 27 175 år og over
years and over 6 17 1 5 3 4 12 1
I alt Total 25 643 496 1 541 26 148 413 1 431 12 059 283 1 033

13
alder og ekteskapelig status.
kommunermunicipalities
HerredskommunerRural municipalities
Kvinner Females Menn Males Kvinner Females
PikerSpinsters
EnkerWidows
SkilteDivorced
UngkarerBachelors
EnkemennWidowers
SkilteDivorced
PikerSpinsters
EnkerWidows
SkilteDivorced
4 8 2 2 -3 1 1 3 1 1 -1 2 1 7 1 -
- 1 3 1 1 -2 1 2 - -
1 - 4 1 1 -- 2 4 2 -
3 2 I. - 2 -1 2 1 1 2 1 -2 1 -1 1 2 -
2 -1 1 -1 -
-- -- 1 1 -- 1 -
12 948 219 919 13 584 213 508 13 200 194 512
2 913 - 1 902 3 786 27 576 1 8 154 6 913 37 7 218 9 901 615 11 222 3 585 8 125 1 417 19 127
356 18 153 1 172 8 89 357 15 95174 24 104 495 12 91 173 26 73111 29 109 260 26 62 108 27 5494 29 87 142 33 47 67 28 4344 36 55 64 33 31 39 26 1630 27 19 33 27 12 20 23 819 19 11 11 20 6 10 9 4
6 9 3 4 29 3 5 4 --5 8 1 1 12 5 6
5 1 2 5 „ 2 - ---
12 948 219 919 13 584 213 508 13 200 194 512

14
Tabell 5. Inngåtte ekteskap etter brudens og brudgommens alder.Marriages by age of bride and bridegroom.
Brudens alder Age of bride
I altTotal
15—19 år
20—24 år
25—29 år
30—34 år
35--39år
40—44 år
45—49 år
50—54 år
55—59 år
60—64 år
65—69 år
70 årog
over
['opp--gittUn-
known
1 692 1 268 408 16
Alle ekteskap Total marriages
13533 4 358 8 527 604 36 77 112 829 4 560 1 487 183 40 10 22 315 139 975 765 294 97 29 13 2 11 138 28 257 350 263 149 59 23 9
726 10 88 111 133 161 139 62 16 5 1435 3 25 37 57 75 111 87 32 6 1 1272 1 5 7 16 34 51 80 52 20 6188 1 6 4 11 20 47 56 31 10 1117 5 2 7 21 29 27 21 5
78 2 5 6 15 22 17 8
74 1 2 5 4 13 15 11 23
27680 6 636 14846 3 383 992 578 433 346 215 125 71 26 27 2
Ekteskap mellom ugifte Marriages between single persons
1 680 1 268 398 1413249 4 321 8 371 532 21 36 526 789 4 281 1 308 124 21 21 830 118 848 600 193 57 12 1 1
706 25 173 233 166 77 24 7 1356 8 45 61 85 79 56 18 3 1138 2 13 15 19 20 34 27 6 1 1
66 2 4 6 9 13 18 8 2 442 1 1 1 2 5 13 10 7 2
7 2 1 2 29 4 3 1 1
8 1 1 1 3 1 1
24617 6 531 14132 2 768 615 268 146 87 34 18 13 2 1 2
Brudgommensalder
Age ofbridegroom
15-19 år years20-24 »25--29 »30-34 »35-39 » »40-44 » »45-49 »50-54 » »55-59 »60-64 »65-69 » »70 år og over
years and overUoppgitt
Unknown . .
I alt Total
15-19 år years20-24 » »25-29 »30-34 » »35-39 »40-44 » »45-49 »50-54»55-59» »60-64» »65-69» »70 år og over
years and overTJoppgitt
Unknown . . .
I alt Total . . . .
15
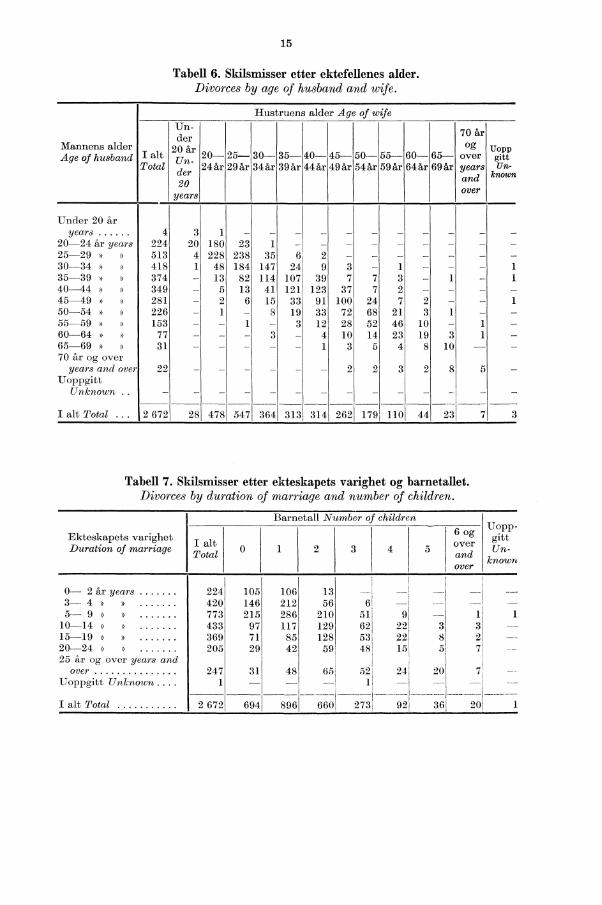
Tabell 6. Skilsmisser etter ektefellenes alder.Divorces by age of husband and wife.
Hustruens alder Age of wife
Mannens alderAge of husband I alt
Total
Un.der
20 hr
der20
years
2024år24år
2529år
3034år
3539år
4044år
4549år
5054år
5559år
6064år
6569år
70 år
°goveryearsandover
UoppgittUn-
known
4 3 1 - _224 20 180 23 1 -513 4 228 238 35 6 2 _418 1 48 184 147 24 9 3 1 1374 13 82 114 107 39 7 7 3 1349 5 13 41 121 123 37 7 2 -281 2 6 15 33 91 100 24 7 1226 1 - 8 19 33 72 68 21 3 -153 - 3 12 28 52 46 10 - i -
77 3 4 10 14 23 19 3 -31 1 3 5 4 810 -
22 ------ 2 2 3 2 8 5 -
- - - - - - -
2 672 28 478 547 364 313 314 262 179 110 44 23 7 2
Under 20 åryears
20-24 hi. years25-29 »30-34 »35-39 »40-44 »45-49 »50-54 »55-59 »60-64 »65-69 »70 år og over
years and overUoppgitt
Unknown .
I alt Total . . .
Tabell 7. Skilsmisser etter ekteskapets varighet og barnetallet.Divorces by duration of marriage and number of children.
Ekteskapets varighetDuration of marriage
Barnetall Number of childrenUopp-gittUn-
known
I altTotal 0 1 2 3 4 5
6 ogoverandover
0— 2 Air years 224 105 106 133-4 » 420 146 212 56 6 --5-9 » 773 215 286 210 51 9, 1 1
10-14 » 433 97 117 129 62, 22! 3 315-19 » 369 71 85 128 53 22 8 2120-24 » » 205 29 42 59 48! 151 51 725 år og over years and ,
over 247 31 48 65' 52 2 4 20,Uoppgitt Unknown . . . 1 — 1 1
,i2 672 694 896 273I alt Total 660 92i 36 201

16
Tabell 8. Fødsler og fødteBirths by
Nr.Fylke
Co on ty
Fods-ler
Con-fine-ments
Levendefødte barnLive births
I altTotal
Født i ekteskapLegitimate
Født utenfor ekteskapIllegitimate
altTotal
MennMales
KvinnerFemales
I altTotal
M.M.
K.F.
I altTotal
M.M.
K.F.
Hele landet The wholecountry 67 184 67 061 34 678 32 383 63 775 32 975 30 800 3 286 1 703 1 583
BykommunerUrban municipalities 26 208 26 168 13 458 12 710 24 802 12 747 12 055 1 366 711 655HerredskommunerRural municipalities 40 976 40 893 21 220 19 673 38 973 20 228 18 745 1 920 992 928
Bykommuner fylkesvisUrban municipalitiesby county
01 Østfold 1 172 1 173 614 559 1 126 590 536 47 24 2303 Oslo 6 920 6 899 3 510 3 389 6 495 3 296 3 199 404 214 19004 Hedmark 405 402 213 189 390 206 184 12 7 505 Oppland 782 778 395 383 733 370 363 45 25 2006 Buskerud 1 524 1 520 786 734 1 469 759 710 51 27 2407 Vestfold 750 757 395 362 731 380 351 26 15 1108 Telemark 1 527 1 529 797 732 1 476 769 707 53 28 2509 Aust-Agder 289 290 144 146 284 142 142 6 2 410 Vest-Agder 1 503 1 516 761 755 1 468 733 735 48 28 2011 Rogaland 2 730 2 726 1 374 1 352 2 646 1 339 1 307 80 35 4513 Bergen 2 072 2 061 1 069 992 1 934 1 010 924 127 59 6814 Sogn og Fjordane 146 144 80 64 141 80 61 3 315 Møre og Romsdal 949 946 514 432 897 490 407 49 24 2516 Sør-Trøndelag 2 489 2 485 1 289 1 196 2 337 1 209 1 128 148 80 6817 Nord-Trøndelag 633 632 294 338 609 286 323 23 8 1518 Nordland 567 567 281 286 511 253 258 56 28 2819 Troms 1 317 1 312 705 607 1 180 632 548 132 73 5920 Finnmark 433 431 237 194 375 203 172 56 34 22
I alt Total 26 2081 26 168 13 458 12 7101 24 802 12 747 12 0551 1 3661 7111 655
Herredskommuner fyl-kesvis Rural municipali-ties by county
01 Østfold 2 295 2 286 1 173 1 113 2 217 1 140 1 077 69 33 3602 Akershus 5 538 5 528 2 892 2 636 5 360 2 812 2 548 168 80 8804 Hedmark 2 338 9 344 1 266 1 078 2 226 1 189 1 037 118 77 4105 Oppland 2 012 2 011 1 098 913 1 917 1 049 868 94 49 4506 Buskerud 1 499 1 497 799 698 1 433 766 667 64 33 3107 Vestfold 2 023 2 031 1 054 977 1 974 1 026 948 57 28 2908 Telemark 1 036 1 026 491 535 978 473 505 48 18 3009 Aust-Agder 885 879 440 439 857 426 431 22 14 810 Vest-Agder 722 723 366 357 713 361 352 10 5 511 Rogaland 2 413 2 403 1 216 1 187 2 373 1 203 1 170 30 13 1712 Hordaland 4 889 4 884 2 518 2 366 4 755 2 449 2 306 129 69 6014 Sogn og Fjordane 1 572 1 574 822 752 1 533 801 732 41 21 2015 Møre og Romsdal 3 028 3 018 1 502 1 516 2 929 1 457 1 472 89 45 4416 Sør-Trøndelag 1 840 1 833 936 897 1 733 885 848 100 51 4917 Nord-Trøndelag 1 640 1 620 851 769 1 538 798 740 82 53 2918 Nordland 4 220 4 201 2 204 1 997 3 799 2 001 1 798 402 203 19919 Troms 1 569 1 577 820 757 1 387 726 661 190 94 9620 Finnmark 1 457 1 458 772 686 1 251 666 585 207 106 101
I alt Total 40 976 40 893 21 220 19 673 38 9731 20 2281 18 745 1 9201 9921 928
Note : i Medregnet fødsler i 1966, registrert i 1967.

17
barn etter fylke.'county
Dødfødte barnStillbirths
______
Av disse: Of which:
TvillingerTwins
TrillingerTriplets
I altTotal
Født i ekteskapLegitimate
Født utenfor ekte.skap Illegitimate
Lev.fødteLive births
DødfødteStillbirths
Lev.fødteLive births
DødfødteStillbirths
I alt 1 M. K. I alt M. K. I alt M. K M. K. M. K. M. K. M. K.Totall M. F. Total M. F. Total M. F. M. F. M. F. M. F. M. F.
812 432 380 763 398 365 49 34 15 642 663 26 19 13
298 150 148 2791 137 142 191 13 C 236 248 11 5 83
514
15
282
7
232
8
484 261
15 7
223
8
30,1■
21 9 406
16
415
13
15 14 5
83 43 40 76 36 40 59 496 4 2 6 4 2 1 5 -----
10 6 4 10 6 4 5 7 ------16 8 8 15 8 7 13 10
6 4, 2 6 4 2 13 1214 6 8 14 6 8 14 14
2 1 1 2 1 1 -I 2 4 ------9 6 3 8 5 3 21 23
26 10 16 26 10 16 - 16 28 ------36 18 18 32 17 15 4 1 3 23 23
2 1 1 2 1 1 - --- ------9 5 4 8 5 3 8 4 ------
29 14 15 28 14 14 1 18 30 2-----7 6 1 4 3 1 ` 5 7 ------3 1 2 3 1 2 - - 5 1
19 7 12 18 6 12 11 17 ------6 3 3 6 3 3 6 1 1 -----
298 150 148 279 137 142 19 13 6 236 248 11
33 18 15 33 18 15 17 30 164 22 42 61 21 40 3 1 -, 39 62 3 324 10 14 23 9 14 1 1 31 24 129 18 11 26 15 11 3 3 28 28 -15 9 6 14 8 6 1 1 17 9 -17 7 10 16 6 10 1 1 30 19 -15 7 8 15 7 8 4 4 2-16 13 3 16 13 3 9 10 -
6 5 1 6 5 1 6 8 ------38 26 12 37 25 12 26 30 -52 27 25 52 27 25 - - 51 41 115 9 6 1 . 6 12 18 237 20 17 34 19 15 3 1 2 26 27 1 -23 12 11 22 11 11 1 1 -- 21 9 232 19 13 28 16 12 4 3 1 7 11 165 42 23 59 38 21 6 4 2 41 43 514 8 6 10 6 4 4 2 2 23 20 1 -----19 10 9 18 9 9 1 1 18 22
514 282 232 484 261 223 30 21 9 406 415 15 14
Nr.
010304050607080910111314151617181920
010204050607080910111214151617181920
Note:' Including births in 1966, registered in 1967.

0 hr 3 0721 » 5 0982 » 2 8943 .... 2 3794 » 2 0405 » 1 699
.. .. . 1 4281 131
9297576765584961399340228190,,
142124
96492421
99611
6,15 4835 9442 469
780112
8
Født i ekteskapi alt 24 802
Født utenforekteskap i alt 1 366
alt 26 168
78» 9 »
10 » 11 » 12 » 13 » 14 » 15 » 16 » 17 » 18 » 19 » 20 » .. .. ..21 » 22 »23 » 24 » 25 » 26 » 27 » 28 » 29 » 30 » 31 »32 » Uoppgitt 0— 4 år 5— 9 »
10-14 » 15--19 20-24 » 25 år og overTJoppgitt
Tabell 9. Levendefodte etter morensLive births by aye qf mother and
18
Her- ; Her-Her-, - I Her-By- reds- By- reds- By- reds- By- reds-kom- kom- 1 kom- korn- kom- kom- korn- ' kom-
muner 'rimier ; muner muner muner muner muner munerUrban Rural Urban Rural Urban ' Rural Urban Ruralmuni- muni- na, Un i- nouni- muni- ' muni- muni- muni-cipal- cipal- cipal- cipal- ci pal- ; cipal- cipal- cipal-ities ities ities ities 1 ities ; ities ities ities
Her-By- reds-.
kom- - kom-muner munerUrban I Ruralmuni- muni-cipal- cipal-ities ities
Ekteskapetsvarighet'
I alt Morons alder
Total
15-19 år years
20-24 år 25-29 år
30-34 år
464
119600154
919 1952 2 1177
3 782 4913 250 3!2 644 1
2 4281 8841 7321 4131 2191 092
97377068854947434026720814989563620,21
22
621 905 2 100 2 310 101
4 7421 838
35031
38 973 2 100 2 3
1 920 3486
40 893 3 2 586 4 3
87240213298337381458507624645613630563350250124
5820
11 1752 6152 406
202
112
112
3793
427315296
68'
1 7223 0171 7391 255
820405189
5591
905 9 767
28 553
659
2
9 214
553
11 1
13 382 6 958 10 805 3 780 6 399
795 191 202 74 61
14 177 7 149 11 007 3 854 6 460
9
12 1321 248
2 1613 8932 5652 1311 382
72236412828
302830713826947931863623433262144
5425
22
13 6183 112
227
1 1
4 935 811
5 328 1 637
540 1 233
1 98
3871 031
9721 146I 399I 4131 4261 071
89452431816847
7
1
781971661731972732793553673633703132591811105928
722
Noter : a: Differansen mellom barnets fødselsår og vigselsåret. 2 Av disse 1 på 14 år. 3 Av disse 3 på 14 år.4 Av disse 4 på 14 år.
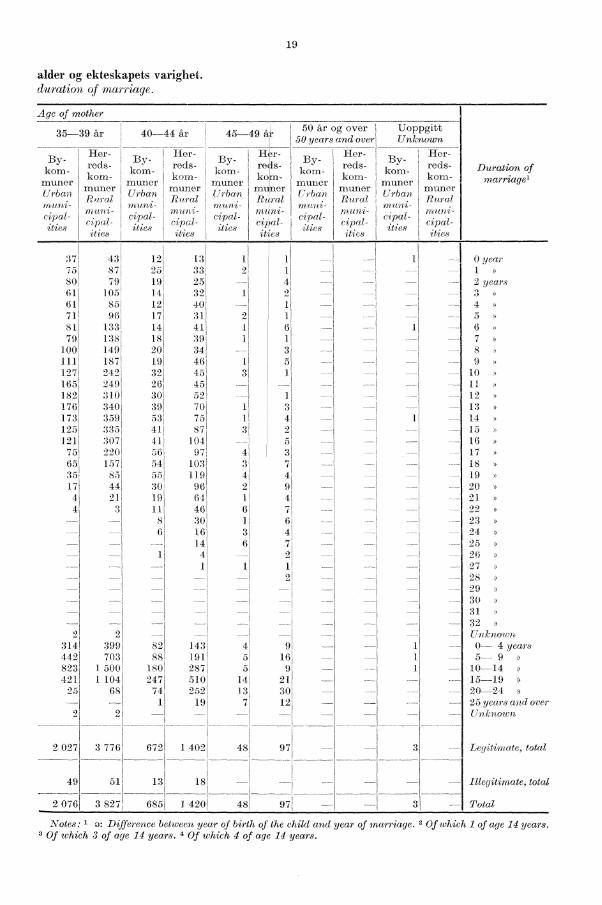
19
alder og ekteskapets varighet.duration of marriage.
Age of mother
35-39 år 40-44 år 45-49 år1
50 år og over50 years and over
UoppgittUnknown
Her- Her- Her- ` Her- Her-By -
kom-munerUrbanmuni-cipal-
reds-korn-manerRuralmuni-
.
BY-korn-
munerUrban
,.»enn» -cipal-
reds- , BY -korn-
kom-muner al e
UrbanRural .mum;-
much-. cipal- . cipal-.
reds-kom-munerRuralinne-i-
BY-kom-
munerU Than
.mumcipal-
reds- BY-kom-
korn-MUD er
muner U rbanRural ,.muni- Tn Un f' -
reds-kom-
manorR uralnice 's -
.sties "Pal-
itiessties "P c' l- sties
stiescapal-ities
itscipal-ities
itiesclpat-sties
1I37 43 12 13 1 1 1
75 87 25! 33 2' 1SO 79 191 25 461 105 14 39 1 2161 85 12 40 171 96 17 31 2 181 133 14 41 1 6 179 138 18 39 1 1
100 149 20 34 3111 187 19 46 t 5127 242 32 45 3 1165 249 26 45182 310 30 52, 1176 340 39 70 11 3173 359 53 75 i 4 1125 335 41 87 3 2121 307 41 104 5
75 220 56 97, 4 365 157 54 103 3 735 85 55 119 4 417 44 30 96 2 9
4 21 19 64 1 44 ,) 11 46 6 7
8 301 1 6
6 16 3 414 1 6 7
1 4' 21 1 1
,1
I
2
11
1 ■2 2
314 399 82 143 4' 9442 703 8 8 191 5 16 1823 1 500 180 287 5 9421 1 104 247 510 14 21
25 68 74 252 13 301 19 7 12
2 2 ----
12027 3 7761 672 1 402 48 97
49 51 13 18
._ 2 076 3 827 685 1 420 48 97
Duration ofmarriage'
o year>1
2 years3 »4 »5 »6789
10 :»11 »12 »1314151617 »18 »19 »20 »212223 »242526 »27 »28 »29 »303132 »Unknown0 4 years5 9 »
10-14 »15-19 »20-2425 years and overUnknown
Legitimate, total
illegitimate, total
Total
Notes: 1. o: Difference between year of birth of the child and year of marriage. 2 Of which 1 of age 14 years.3 Of which 3 of aye 14 years. 4 Of which 4 of age 14 years.

20
Tabell 10. Levendefødte i ekteskap etter barnetsLive births by birth order
Ekteskapets varighet1 TioataltlBarnets fødselsnummer
1 2 3 4 5 6 7
10 år 7 191 7 188 31 » 11 698 10 468 1 217 122 » 7 048 2 605 4 215 220 53 » 6 161 1 116 4 098 8991 45 24 » 5 290 616 3 026 1 459 1 180 9
5 » 4 343 345 2 132 1 4371 389 40 -6 » 3 856 229 1 432 1 5391 524 114 187 » 3 015 161 905 1 278 515 133 19 38 » 2 661 112 564 1 158 560 196 55 139 » 2 170 72 371 910i 531 197 58 24
10 » 1 895 1 49 287 750 498 2151 78 1411 » 1 650 38 208 621 444 211 87 2512 » 1 469, 35 143 518 445 192 90 3313 » 1 169 22 114 338 3581 194 86 3614 » 1 028 23 79 2801 317 192 77 33
115 » 7771 5 57 199 217 145 78 4316 » 6641 6 33 1591 191 136 71 3817 » 482 2 25 98 139 105 53 3118 » 391 5 18 74 105 89 55 1919 » 304 5 10 53 75 74 43 19
20 » 198 1 8 281 53 40 29 1321 » 113 1 5 151 28 16 19 1422 » 77 1 2 10 15 23 10 623 » 45 1 9 12 12 324 » 29, -1 2 6 8 4 2
25 » 27 4 21 4 6 326 » 7 1 227 » 3 --11 228 » 21 11 129 » -
30 » - - -31 » - -32 » - - - - -[Toppgitt 12 3 2 2 1 1 -
[ alt 63 775 23 107 18 955 12 065 5 652 2 350 949 374
Bykommuner 24 802 10 325 7 663 4 204 1 685 574 214 77lerredskommuner 38 973 12 782 11 292 7 861 3 967 1 776 735 297
Note: Se note 1, tabell 8.
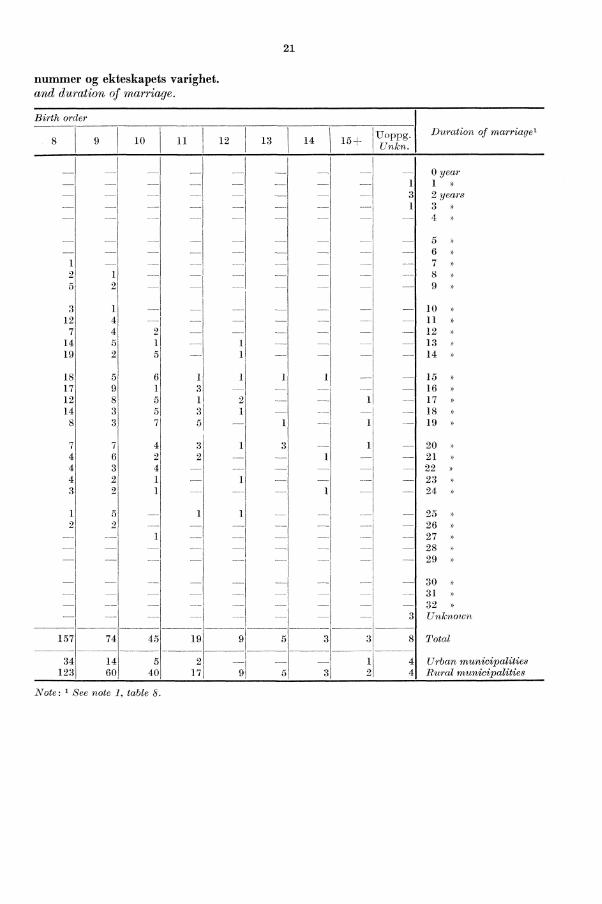
21
nummer og ekteskapets varighet.and duration of marriage.
Birth order
8 9 10 11 112 1 13,1
14 15 +u opp g .
unkn.
Duration of marriage'
— 0 year1 »
3 2 years3 »4 »
5— 6
1 7 » 2 1 8 » 5 2 9 »
3 1 — 10 » 12 4 — 11 »
714
45
21 --
12 »13 »
19 2 14
18 5 6 1 i i 1 --15»17 9 1 3 —16»12 8 5 1 * 1 --17»14 3 5 3 1 — -- 18 »
8 3 7 5 1, -- 19 »
7 , 4 3 1 1 — 204 6 2 2 21 »4 3 4 --22»
- 4 2 1 1 --- 23 » 3 2 — 24
1 5 1 1 — 252 2 -- — 26 »
— — 27 »— 28
29 »
— 30 »31 »
— 32 »(inknown
157 74 45 19 9 5 3 3 8 Total
4 Urban municipalities34 14 5 2 1123 60 40 17 9 5 3 2 4 Rural municipalities
Note: 1 See note 1, table 8.

Barnets nummerBirth order
Hele landet The wholecountry
1. barn child 2. » ...... .3.4.5. » »6.7. »8. » »9. »
10. » og over and overroppgitt Unknown
alt Total
BykommunerUrban municipalities
1. barn child 2.3. »4.5.6.7.8. »9. »
10. » »og over and overIToppgitt Unknown
alt Total
HerredskommunerRural municipalities
1. barn child 2. 3. »4. »5. » »6.7.8. »9.
10. » » og over and overtroppgitt Unknown
alt Total
22
Tabell 11. Levendefødte i ekteskap etter morens alder og barnets nummer.Legitimate live births by age of mother and birth order.
Morens alder Age of mother
I altTotal
15-19hr
years
20-24år
25-29år
30-34år år
35-3940-----44 45-49år
50 årog
overandover
UoppgittUn-
knownår
11,
11
123 107 1 4 447 12 129 4 495 1 266 5601 192! 17 ---- 118 955 729 7 689 6 555 2 634 1 0331 3001 1512 065 , 33 2 242 4 458 3 222 1 6171 471; 21 - 1
5 652 21 453 1 581 1 830 1 3151 443 11 27 --- 12 350 73 471 770 6971 3151 24 --- --
949 6 155 285 3151 168 20 --- --374 --- - 33 107 1431 831 8 -157 -1 -- 14 39 57 45 21 -
74 i - 1 14 301 241 5 -84 --- - - 11 341 331 6
8 1 4 1 21 -H ---
63 775 1 5 212 22 596 17 763 10 179 5 803 2 074 145 3! !
1 l'1
;1
10 395 1 815 5 465 2 089 598 272 79 6 -- 17 663 1 275 2 903 2 775 1 129 462 1161 34 204 1 10 721 1 518 1 164 617 1641 9 11 16851 -- 104 426 591 396 1561 11 1
-- 18 102 1895741 174 841 72141 --- 1 35 75 59 381 6
771 -- - 8 25 26 151 334 11141
---- 5 62
98
14!3
-1 -
81 3 3 9
4 2 - .1 1 -- -
--- 19 214 48 -24 802 2 100 6 958 3 780 2 027. 672 3
11 1
1 1 111
11 1
1;
1
12 782 '2 632 6 664' 2 406 668 2881 113 1 11 --- --11 2921 454 4 786 3 780 1 505 571 184 12
7 861 1 23 1 521 2 940 2 058 1 000 3071 12 --3 96711 2 349 1 155 1 239 919 287 161 7761 55 369 581 523 2311 17 -
735 ------ 5 120 210 256 130, 14 1297' -- -- 25 82 117 68• 5 --123 -- - 9 33 48 31 2 -
60 -- - 1 12 22 21 4 -76 - - 11 31 30 4 - - -
4 1 2 - 1
38 973 1 3 112 13 382 10 805 6 399 3 776 1 402 971
Note: 1- Av disse 1 pa 14 år.Note: Of which I of age 14 years.

6231810
52
67
491944156314903105145
3
2 5221710
52
212596763179803074145
3
2 41241
447129495266560192
17
1
6923718814911152
6
5621118314610952
6—
53115
723924
9———
061 63 775 23 107 812 763 312
15-19 år years20-24 »25-2930-3435-3940-44 .» • • • • ...... • •45-4950 år og over years and over . IToppgitt Unknown
I alt Total
23
Tabell 12. Levendefødte etter farens alder.Live births by age of father.
Farens alderA ge of father
Hele landetThe whole country
BykommunerUrban municipalities
HerredskommunerRural municipalities
Født iekteskap
Legitimate
Fodtutenfor
ekteskap
Fodt i.ekteskap
LegitimateIllegitimate
Fødtutenfor
ekteskapIllegitimate
Født i.ekteskap
Legitimate
Fødtutenfor
ekteskapIllegitimate
15-19 år years 600 215 272 96 328 11920-24 , , 13 095 915I 5 695 369 7 400 54625--29 , » 18 740 514 7 663 235 11 077 27930-34 » ....... . • • • . 14 068 214 5 366 100 8 702 11435-39 » 9 281 115 3 257 57 6 024 5840-44 » 5 218 76 1 689 35 3 529 4145-49 , » 2 051 46 642 23 1 409 2350-54 4 507 14 144 6 363 855-59 » 152 7 49 5 103 260-64 „ 44 2 17 1 27 165-69 » » 11 1 5 6 170 Ar og over years and over . . 3 — 1 2 —Uoppgitt Unknown 5 1 167 2 439 3 728
I alt Total 63 775 3 286 24 802 1 366 38 973 1 920
Tabell 13. Fødte etter morens alder.Births by age of mother.
LevendefødteLive births
DødfødteStillbirths
Morens alder Fodt i ekteskap Født i ekteskapAge of mother I alt Legitimate I alt Legitimate
Total I alt Førstefødte Total I alt FørstefødteTotal First-born Total First-born
Noter : i Av disse 7 på 14 år. 2 Av disse 1 på 14 årNotes: 1 Of which 7 of age 14 years. 2 Of which 1 of age 14 years.

24
Tabell 14. Fødte etter måned.Births by month.
LevendefodteLive births
DodfødteStillbirths
KvinnerFemales
MånedMonth Menn
Kvinner
Males
FemalesMennMales
223322222222
32
19
12
111111111111
1
11111111
1
Hele landetThe whole country
Januar 2 951Februar 2 697Mars 3 162April 3 312Mai 3 217Juni 2 858Juli 2 776August 2 752September 2 989Oktober 2 797November 2 468Desember 2 699
I alt Total 34 678
BykommunerUrban municipalities
Januar 1 146Februar 1 057Mars 1 225April 1 308Mai 1 262Juni 1 123Juli 1 057August I 038September 1 135Oktober 1 090November 938Desember 1 079
I alt Total 13 458
HerredskommunerRural municipalities
Januar 1 805Februar 1 640Mars 1 937April 2 004Mai 1 955Juni 1 735Juli 1 719August 1 714September 1 854Oktober 1 707November 1 530Desember 1 620
I alt Total 21 220
682 38 43350 28 26045 31 42078 41 34893 41 26711 34 30637 34 29590 44 32745 31 34728 43 33373 28 26551 39 25
383 432 380
079 18 14901 11 13165 9 21178 15 11133 19 13074 11 8001 10 16024 22 10096 12 10097 8 14926 7036 8 10
710 150 148
603 20 29449 17 13880 22 21900 26 23760 22 13637 23 22636 24 13566 22 22649 19 24631 35 19447 21 18515 31 15
673 282 232

25
Tabell 15. Flerfødsler.Confinements of multiple births.
-UI alt
ekteskapekteskapBarnas kjønn Sex of childrenTotal
Legitimate Illegitimate
Tvillingfødsler Twinsa) 2 gutter: 2 boys:
2 levendefødte live births 2 dødfødte stillbirths 1 if. 4- 1 df
b) 2 piker: 2 girls:2 levendefødte 2 dødfødte 1 if. + 1 df
c) 1 gutt og 1 pike: 1 boy and 1 girl:1 if. gutt + 1 if. pike 1 if. gutt -1- 1 df. pike 1 df. gutt + 1 if. pike 1 df. gutt -1- 1 df. pike
alt Total
Trillingfødsler Tripletsa) 3 gutter: 3 boys:
3 levendefødte 3 dødfødte 2 if. + 1 df 1 if. -I- 2 di
b) 3 piker: 3 girls:3 levendefødte 3 dødfødte 2 if. + 1 df. 1 if. -I- 2 df
c) 2 gutter og 1 pike: 2 boys and 1 girl:2 if. gutter -I- 1 if. pike 2 if. gutter 1 df. pike 2 df. gutter + 1 if. pike 2 df. gutter + 1 df. pike 1 if. gutt + 1 df. gutt 1 if. pike 1 if. gutt + 1 df. gutt + 1 df. pike
d) 2 piker og i gutt: 2 girls and 1 boy:2 if. piker + 1 if. gutt 2 if. piker 1 df. gutt 2 df. piker + 1 if. gutt 2 df. piker + 1 df. gutt 1 if. pike + 1 df. pike + 1 if. gutt 1 if. pike H- 1 df. pike + 1 df. gutt
I alt Total
2084
12
2162
11
213351
1984
11
2092
11
20735
10
1
7
6
675 651 24
4
1
1
4
7 7
26
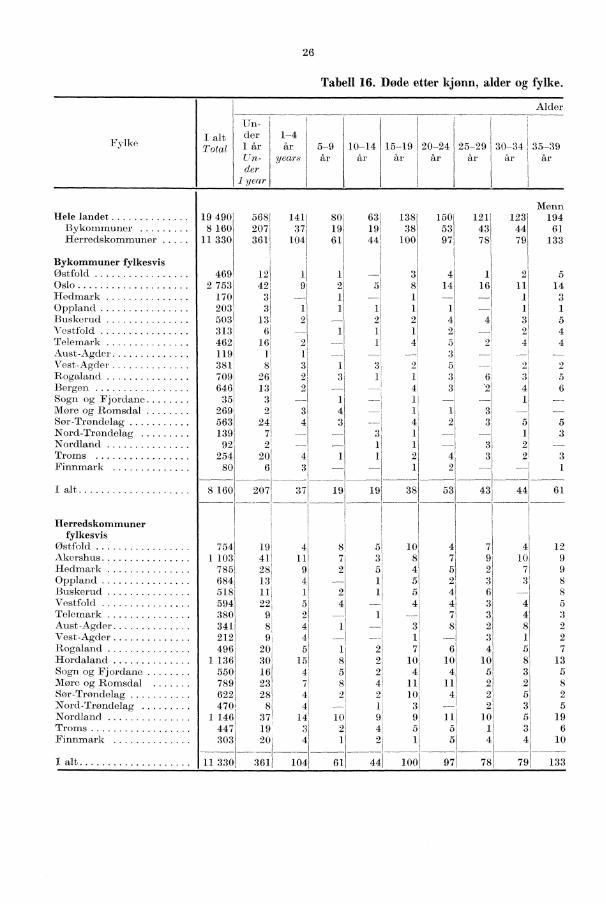
Tabell 16. Døde etter kjønn, alder og fylke.
Fylke I altTotal
Alder
Un-der1 ar
n _der
1 year
1-4år
years5-9år
10-14år
15-19år
20-24år
25-29år
30-34år
35-39år
MennHele landet 19 490 5681 141 80 63 138 150 121' 123 194
Bykommuner 8 160 2071 37 19 19 38 53 43 44 61Herredskommuner 11 330 3611 104 61 44 100 97 78 79 133
Bykommuner fylkesvisØstfold 469 12 1 3 4 1 2 5Oslo 2 753 42 9 2 5 8 14 16 11 14Hedmark 170 3 1 3Oppland 203 3 1 1 1Buskerud 503 13 2 2 2 4 4 3 5Vestfold 313 6 1 1 2 2 4Telemark 462 16 2 1 4 5 9 4 4Aust-Agder 119 1 1 3Vest-Agder 381 8 3 3 2 5 2 2Rogaland 709 26 2 3 1 1 3 6 3 5Bergen 646 13 2 4 3 4 6Sogn og Fjordane 35 3 1 1 1More og Romsdal 269 2 31 4 1Sør-Trøndelag 563 24 4 3 4 2 5 5Nord-Trøndelag 139 7 3 1 -- 1 3Nordland 92 2 1 1 3 2Troms 254 20 4 1 1 2 4 3 1 2 3Finnmark 80 6 3 2
I alt 8 160 207 37 19 19 38 53 43' 44 61
Herredskommunerfylkesvis
Østfold 754 19 4 8 5 10 4 7 4 12Akershus 1 103 41 11 7 3 8 7 9 10 9Hedmark 785 289 2 5 4 5 2 9Oppland 684 13 4 1 5 2 3 3Buskerud 518 111 2 1 5 4 6 8Vestfold 594 22 5 4 4 4 3 4 5Telemark 380 9 2 - 7 3 4 3Aust-Agder 341 8 4 1 - 3' 8 2 8 2Vest-Agder 212 9 4 1 3 1 2Rogaland 496 20 5 1 21 7 6 4 5 7Hordaland 1 136 30 15 8 21 10 10 10 8 13Sogn og Fjordane 550 16 4 5 2 1 4 4 5 3 5More og Romsdal 789 23 7 8 4 11 11 2 2 8Sør-Trøndelag 622 28 4 2 21 10 4 2 5 2Nord-Trøndelag 470 8 4 -- 1 11 3 2 3 5Nordland 1 146 37 14 10 91 9 11 10 5 19Troms 447 19 3 2 41 5 5 3 6Finnmark 303 20 4 1 2 1 5 4 4 10
I alt 11 330 361 104 61 44 100 97 78 79 133

27
Deaths by sex, age and county.
County45-49år
50-54år
55-591 60-64år år
65-69år
70-74år år 1
75-79180-84år
85-89år
90 årog
overyearsandover
5781 819 1 309 1 750 2 396 1 2 852 2 796 2 519 1 662' 910 The whole country2801 392 609, 814 1 116 1 299 1 171 985 589' 251 Urb. municipalities2981 427 7001 936 1 280 1 553 1 625 1 534 1 0731 659 Rural »
,,,,
Urban municipali-ties by county
26 21 27 44 63 82 62 67 32 15 østfold84J 130 235 326 444 472 388 289 1461 73 Oslo
5 6 7 21 20 25 28 191 161 9 Hedmark5H
12161231
1238
1746
2758
3189
3473
25' 151 8
1 16
671 3f1)OpplandBuskerud
9; 13, 23 30 42 31 64 451 26 10 Vestfold181 16' 35, 43 68 62 68 651 34 13 Telemark
31 8 6 16 9 17 23 161 111 4 Aust-Agder131 18 26 31 34, 55 61 551 371 15 Vest-Agder301 40 54' 52 931 109 98 821 58 24 Rogaland25H 25 55 63 901 117 93 1 821 421 13 Bergen
1' 2 4 2i 5 3 6 4 2 Sogn og Fjordane
12H 19 17 25 311 36 33 37 30 12 More og Romsdal221 24 39 45 611 99 67 66. 60 18 Sør-Trøndelag
4 6 7 14 151 17 17 17 13 9 Nord-Trøndelag,,-,) 5 8 11 141 12 17 10 1 1 Nordland81 18 12 18 361 34 27 29 22 6 Troms11 4 6 8 9 1 6 15 8 Finnmark
1
280 1 392 609 814 1 116 1 299 1 171 985 589 251 Total
Rural municipali-ties by county
19, 30 52 69 86 119 126 81 54 34 østfold34 53, 72 97 152 168 142 127 86 41 Akershus15' 26 47 66 82 102 111 121 95 35 Hedmark25 24 28 45 72 100 103 105 89 46 Oppland22 10 26 42 62 78 83 68 43 37 Buskerud14, 17 40 56 70 76 90 77 60 28 Vestfold
8, 14 23 31 35 60 57 541 38 26 Telemark9 12 19 21 34 33 54 52 40 26 Aust-Agder
5 9 14 19 26 29 35 31 13 Vest-Agder13 15 31 45 61 69 82 63 40 13 Rogaland291 511 74 97 123 163 153 166 98 62 Hordaland13' 181 21 43 49 72 85 86 58' 43 Sogn og Fjordane13 251 52 66 101 111 100 98 78 58 More og Romsdal
231 36 49 70 79 80 99 59 52 Sør-Trøndelag8' 161 29 39 39 60 80 75 46 43 Nord-Trøndelag
9.1,8 51: 82 81 140 148 154 163 93' 66 Nordland141 211 32 37 50 60 65 42 44 27 Troms17; 161 27 38 35 29 31 22 21 9 Finnmark
2981
4271 700 936 1 280 1 553 1 625 1 534 I 0731 659 Total
Age
40-44år
Males321133188
145
537321
10119
7!
—131
1215
4'
13311
112614
89
155537
141411
79
16
7
188

28
Tabell 16 (forts.). Døde etter
Fylke I altTotal
Alder
-Under1 Aryear
1-4år
years
5-9år
10-14år
15-19år
20-24år
25-29år
30-34 35-39år Ar
KvinnerHele landet 16 520 408' 91 52 32' 55 48 451 55 103
Bykommuner 7 450 153 29 27 9 20 20 16' 13 52Herredskommuner 9 070 255 62 25 23 35 28 29 42 51
Bykommuner fylkesvisØstfold 379 7 — 1 — 3 1 1Oslo 2 695 40 10 5 4 3 6 7 10 21Hedmark 133 2 1 -- 1 1 — — — 1Oppland 168 7 1 11 - 1 1Buskerud 441 3 2 11 2 2 — 6Vestfold 321 7 -- 1 1 — 1Telemark 354 8 4 2 1 1 — -- 2Aust-Agder 126 3 — — 1 — — 1Vest-Agder 323 9 3 I — 2 1 ---- — 1Rogaland 644 23 2 4 1 3 1 3 1 3Bergen 567 8 7 1 1 1 3 — 5Sogn og Fjordane 32 — 1 — — —More og Romsdal 246 5 1 — 1 1Sør-Trøndelag 525 131 3 1 1 3 --Nord-Trøndelag 154 4 1 1 — 1 —Nordland 80 2 1 —Troms 204 8 1 1 — 1Finnmark 58 4 — —
I alt 7 450 153 29 279 20 20 16 13 521
Herredskommunerfylkesvis
Østfold 520 13 2 32 6 2 4 2 1Akershus 857 30 7 2 3 1 4 5Hedmark 657 14 2 — 1 4 — 5 4Oppland 575 16 3 12 3 2 1 3 5Buskerud 410 8 — — — 4 5 3Vestfold 451 18 2 1 1 — 1 1Telemark 348 4 1 1 2 1Aust-Agder 309 6 3 1 — — 1 3 2Vest-Agder 194 6 3 1 1Rogaland 380 18 3 5 3 1 1 2 1 2Hordaland 878 22 7 4 2 6 3 4 3 7Sogn og Fjordane 452 12 1 1 2 1 1 1 1 4More og Romsdal 691 17 4 2 2 1 3 1 2 3Sør-Trøndelag 508 9 3 — 1 2 3 1 — 3Nord-Trøndelag 416 9 5 2 2 1 3 2 2 —Nordland 887 34 7 1 1 3 2 3 5 5Troms 334 11 3 — 4 3 — 2 1 2Finnmark 203 8 6 — 1 I — 2 2 2
I alt 9 070 255 62 25 23 35 28 29 42 51

29
kjønn, alder og fylke.
Aye
40-44hr
45-49hr
50-54år
55-59hr
60-64år
65-69hr
70-74hr
75- 79hr
80-84hr
85-89hr
90 hrog
overyearsandover
County
Females193 318 443 649 1 023 1 589 2 243 2 748 2 899 2 213 1 313 The whole country
80 148 196 320 512 808 1 057 1 222 1 294 961 513 Urb. municipalities113 170 247 329 511 781 1 186 1 526 1 605 1 252 800 Rural »
Urban municipali-ties by county
1 9 12 16 24 42 40 67 73 57 25 østfold28 58 67 125 204 322 404 432 451 315 183 Oslo
1 3 6 8 20 13 27 17 28 4 Hedmark4 3 3 7 12 18 26 21 32 20 11 Oppland6 6 9 26 31 42 56 86 66 68 28 Buskerud1 6 10 15 24 31 45 55 63 38 22 Vestfold4 7 16 11 19 34 41 76 65 44 19 Telemark1 3 3 6 4 7 19 15 21 27 15 Aust-Agder5 7 11 12 20 24 55 45 57 44 26 Vest-Agder
11 11 18 29 45 71 103 91 114 72 38 Rogaland6 12 13 21 36 60 83 72 114 82 42 Bergen- - 1 2 3 6 2 7 4 4 2 Sogn og Fjordane
2 3 5 5 16 22 32 53 49 34 17 More og Romsdal6 13 10 19 33 59 71 78 87 74 46 Sør-Trøndelag
1 3 4 11 12 30 22 34 18 12 Nord-Trøndelag1 1 3 3 6 10 7 17 12 9 7 Nordland4 4 7 10 12 21 23 44 29 23 13 Troms
3 2 3 4 7 7 14 6 4 3 Finnmark1 ----
80 148 320 512 808 1 057 1 294 961 513196 1 222 Total
Rural munici-palities by county
5 10 13 23 29 46 81 81 89 66 42 østfold11 16 31 49 62 84 118 148 136 98 52 Akershus11 20 13 21 35 61 93 117 112 95 49 Hedmark
7 9 12 13 26 53 82 110 109 75 43 Oppland4 7 13 9 28 50 57 67 77 45 31 Buskerud7 7 17 15 26 50 65 71 77 58 33 Vestfold3 6 4 12 17 27 41 66 71 58 31 Telemark3 7 9 4 15 25 31 55 59 53 32 Aust-Agder2 4 7 6 11 15 26 33 40 21 17 Vest-Agder5 15 14 13 20 22 42 61 67 53 32 Rogaland9 23 22 30 42 75 106 134 163 133 83 Hordaland5 4 9 13 24 32 43 92 85 66 55 Sogn og Fjordane7 13 15 22 40 46 86 111 108 122 86 More og Romsdal
10 3 17 20 30 47 67 79 85 70 58 Sør-Trøndelag4 1 13 20 21 31 51 58 82 68 41 Nord-Trøndelag
11 17 24 33 46 84 109 162 147 111 82 Nordland6 2 8 15 24 18 56 50 70 36 23 Troms3 6 6 11 15 15 32 31 28 24 l0 Finnmark
113 170 247 329 511 781 1 186 1 526 1 605 1 252 800 Total

4 329511781
1 1 1862 1 5262 1 6051 1 252
622162
ii
511112314999 i
2171458 1755 1986 1888 2502126
153 1531
101 101
11' 11
2 2
6 6
27 27
9 9
20 18 2
20 11 9
16 4 11
13 3 6
52 11 35
80 10 53
148 25 105
196 37 129320 59 204512 117 248808 199 333
1 057 225 3431 222 269 2581 294 279 179961 198 64
418 86 13
91 15
30
Tabell 17. Wide etter kjønn, alder og ekteskapelig status.Deaths by sex, age and marital status.
Hele landet The whole country BykommunerUrban municipalities
HerredskommunerRural municipalities
G ifteI aft gifte Mar-Total vied
le
Forgifte
U-
.bivor- 0131) -ced,mid- '-knownowed
For-15-
Gifte gifteDivor-
opp-Mar- gitt
cedried Un-
reid-known
For1 -
LT- gifteLI -
Gifte oup-, ifte Dirvo-i -
Mar- i gitt• ced,
vied ?Did-le
owed I known
I altTo-tal
owed
13 -I alt gifteTotal Sing-
le
AlderAge
Alermil/a/esUnder 1 år 5681 år year . 502 » years. 343» 294» 285- 9 år 80
10-14 » 6315-19 » 13820-24 » 15025-29 » 12130-34 » 12335-39 » 19440-44 » 32145-49 » 57850-54 » 81955-59 » 1 30960-64 » 1 75065-69 » 2 39670-74 » 2 85275-7.9 » 2 79680-84 » • 2 51985-89 . 1 66290-94 »
•
75495-99 » 140100 år ogover
I. alt Total
Kv. .Fem Under 1 år 4081 år 272)> 323» 134» 195- 9år 52
10-14 » 3215-19 » 5520-24 » 4825-29 »
•
4530-34 »
•
5535-39 »
•
10340-44 »
▪
19345-49 »
•
31850-54 »
•
44355-59 »
▪
64960-64 » . 1 02365-69 » . 1 58970-74 » • 2 24375-79 » 2 74880-84 » . 2 89985-89 » . 2 21390-94 » . 1 04095-99 » . 253100 år ogover
568503429288063
13513360
31658
52 6562 12176 223
127 419151 602208 1 006256 1 311344 1 711409 1 852376 1 590319 1 146164 53575 149
4 15
2 12
10824 4 826
40827321319523248 729 1913 3112 3821 7627 14446 24381 309
111 432209 568358 1 738471 825580 717593 483440 184181 3845 6
361 361
361 36
261 26
19 19
23 23
61 61
441 441
100 97
971 8941
79; 34
133! 43
188 48
2981 64
4271 89470() 1292936 1494
1 280 '41 553 24171 625 257
11 1 534
215
11 1 0731
11511 5431
581
103j
4
13,
9
29 113301 2 456 1
255255
171
17
21'
211111131325252323303518281 9
29942
1051JI 113
1721.- 170441 2475292
159246311314242
9530
3673421 3
.1 08" ,73
,
72 2 4 11
3141 24
535' 36,1
1091 78
921 148i
1 011 300
9231 444;
6861 6321 1
351 6071
1101 3751
111 SS
2 19;
6 105 2 7631 6
26
1021316293
179337583826
1 052962529121
35 1 349
156
212952
102245492946
1 4481 8201 586
821202
15
7 791
4
333
418 7 450 1 786 1 992 3 658 14 9 070 2 067 2 866 4 133I alt Total 1 165201 3 8531 4 858
51020324191
13818022832040548245930412025
6
922, 123 1 334 890 14
195 22288 384711 57602 101790 189841 283667 !
460 1 420184 355
391 15441 33
- 1
3
47i9 206
3
S 160
207 207
14 14
8 8
10 10
5 5
19 19
19 19
38 381 53 441 43 19
44 181 61 191 133 98
1 280 63
4 392 62
2 609 79
4 814 1074 1 116 1338 1 299 1684 1 171 1192 985 1041 589 491 211, 17
37 1
1116 2
194901 3 805
201 5
46
16182953
146275488693834698319
76
41 2
-
2 161 31 1 13

Under 24 timer Under 24hours
0 dager days1 » » 23456 ...... . • • •
7 .......
8 »9 S
10111213
0 uker weeks1 »2 »3
Under 4 uker Under 4 weeks1 måned month 2 »3456789
1011
0— 2 måneder months . .3—S »6-89-11
12-14 »15-17 »18-20 »21-23
0 år year 1 » »
31
Tabell 18. Døde i de to første leveår.Deaths under 2 years of aye.
Alder --- differansen mellomdødsdag og fødselsdag
Age difference between dayof death and day of birth
1956-1960 1961-1965 1966
Født iekteskap
, Legitimate
Født uten-for
ekteskapillegitimate
Født iekteskapLegitimate
Født uten-for
ekteskapIllegitimate
Født iekteskap
Legitimate
Født uten-for
ekteskapIllegitimate
1Kvin-Menn1 ner M. K. M. K. M. K. M. K. M. K.Males 1 Fe- M. F. M. F. M. I F. M. F. M. F.
males 1 ,
1I 1
1 010 680 66 62 1 009 687 70 57 192, 108' 12 141
680 494 45 48 654 447 44 43 122 771 lOt 10556 294 39 27 597 411 43 25 122 , 61 6 9264 190 20 22 262 166 25 9 43, 391 4142
7910352
7 87 5
14482
8962
75
94
326
121111
23
3--
57 36 21 7 43 34 9 4 8 13 --53 39 5 2 28 26 2 1 5 3
44 25 a 5 42 28 2 3 41 41 13 9 92 2 1 26 10 4 2 41 I ! --- —23 16 1 3 25 181 3 — i i —22 16 — 2 21 18 3 —, 5 2127 95 1 1 18 6 — 2 11 1 --- --13 14 1 — 11 14 1 2 - -- 3 i 112 11 2 16 13 — 3 91 -- --
1 831 1 208 125 119 1 810 1 235 135 951 338 216 25 22173 129 12 12 159 107 13 9 23 141 1 3
94 73 4 7 79 89 2 3 13 8 , --70 50 3 2 54 45 2 3 5 141 lj 1
1 i
2 168 1 460 144 140 2 102 1 476 1521101 379 252 1 28 26224 207 18 8 192 118 141 9 40 30 4 1206 157 9 19 163 132 7 6 21 20 2 1175 115 10 8 96 83 8 4 19 12 -- 1124 93 12 8 89 58 8, 3 17 6 1 --
1 105 71 6 6 67 53 21 4 15 i ----1 104 94 5 7 69 60 4 1 6 14
63 75 4 1 55 48 3 2 10 11 2 ---77 50 -- 3 34 48 1 2 81 1060 56 3 1 44 38 2 1 9 4 -- ---39 33 3 1 30 37 3 — 6 11 -- --45 37 1 1 21 20 -- 1 1 2 -- ---
2 598 1 824 171 167 2 457 1 726 173 125 440 302 34 28404 279 28 22 252 194 18 11 51 25 1 1244 219 9 11 158 156 8 5 24 35 21 —144 126 7 3 95 95 5 2 16 17 — —
67 62 1 3 79 51 3 1 16 8 i --68 50 4 2 71 44 2 3 14 8 — 160 35 4 — 54 40 — 1 7 7 2 --54 47 2 3 48 33 1 10 3
3 390 2 448 215 203 2 962 2 171 204 143 531 379 37 29249, 194 11 8 252 168 61 5 47 26 3 1

,3•
ECDCD
rtZcd'(3
cl)
, c3(t),
f:Z7.)”imE-4
3 2
,ZC)
i't--- -
100t-00M
,f't-
et,G
Ct-
CMN
C)NM
C%CI.CCI,f6",.
.NC
MC).
N
,-,et,
et,et,.
et,,f10,7,M
10
M10.
C
MM
t-
.
.
•
0
.00
Zi
0=
0.00.00'M
.
10M
0
C)
C,--,IC%
CA
i
al,
0NN,-.CICCCA,/,
.1 00 GONO0
cs)CA
.N.1
C-10=ef,Cel,
et,CA
MMN,_,
t-XC.
•-,-,-Z--,,..,
03C-A,0CCNNC
CI10C,00,,t
CON
GCC%
N
-.-
M10, C
A C
A C
A ,--, ,-,
.1N
CM
0(1
)
,l'iC%
M
,,,t,N.
(Z,C,t0.40
,_,eh t
-N
MN-
.t-r.
•;14CDW
C)
GOC
)
,t C) t- ,f
CAt-
CA ,.., ,, ,f
C
1C)
C.0 CC,00
PriC \I
GOCA
CA t- ef C%
C) C%
r.
r. C) 00
CC 00
C%
CIIrD
it!.CA.
1
1
00 t- CC) 0
0 ,t ,
MCA
"f C)
VD r.
Pri
GOrt410
.
i),-,
CA
5 t- CA
C)
rr r. r.
CC, r
. C)
(7,C
C)
t-
CA
CA
CACAet', C
CA
N CA C%
CA 1E--
et,
CA 00
t.-t-.4.1
,t,tcit C) C) 00
'CZ
CYZ.1 .1 . M
et , 10
M ,i,r.
Ct
.1CS)r.
,
—i
r.
t-ir'Z
C%
, CC V
.: C
7, t-
p--1,f 00 C%C0N
CACCCD%N
DONt-
11 C% IC
,f
Mi
N.
XMCICA.
Citet,
00 C% GO et
, ef Ct
MC00
Mi—I.1
C%et,CO.
,-.,.t-
.C%
,ti—
iM
0,0..
1.0MM
,t,NM
00.7
1,1
0N
0.,/
,NC,t-
10C)
.1,,C,C5,t-,71,N.0
Mt-10
M''fZ
C.
C%NO0
NMN
t-
1-,ii
.8
,.
C)so
M CA C%
C) G% CO
i 0
c7.1 .110 C CA
i,i:)
CMI.
N1M
1
I_
C'if ,f.1 CA
10i CA 0
M0.
c.,,0C%M.
10,i,C
% O
C
'et, C%
t- ,,
M.,-,
N,t4CI
L--
MM
t-
.
.
r-1P.4.,
C(7,00 e
t, t- C
O 0
0 M
CA rri
VD tr tr.Q)CACI
C%
CA...
CC
cr)CC
00 ),0 GC
,-, i- , 10
,r. r.MC
I
C%
t-1CCC,
r.
C) C% et
, 10 r- up
'C'lCA,r)00
MCAltr
li
r.
4'
73
VZ
c7,1," M
GO 40 ,., C
cq ,..,f
,0 et
,C
,..,
N
,,00C%N
---.M
t- ,f
i t- CO
t-.ic) .
MC
CAGON.
CA,...0GO C%
00 00 u0 C%
C%
Net,N
C%MNIC
1-
1r.
•4)
,...C
C=
P-r
C 1
0
C:,
..M00
-ifCN
C%
,t,N
et,,tNet,Meti
.CC
NC%
101
t-01
CM
Ct-_010CAM
10
N,-,et,
MMN
C
CL)P.,q
N
•'
Z.
ctI—D
000.
C",00e0M00C
MOOC%
CMN
C10NC0
10M
,fM.MMM
.MCMOr
.
N10'eti1.
Mt-1010M
010M
i-,01
10M
MM...I
,r1(000r.
8
H01
C.C)t-C%
01
01
CID
C)
MM
C%
1N.
1000i--,
C-CCD
CA
C::::,--,C>CM
C)
COM
CC000,1,C
CeONC,10C
.CCI
M..
C).1C10.
C.C.0
CO31) t
LCOOCCNt-
,-,MCI0,0
efet,.
C)
C)C)
01
i
115,)
*TF1
•°s;,
:•
0
•c.)
..
•,....,
.Z).
,--C,,,
.,-o
Esi
-4- ,._. P
. r t7 g
..,
c,3co.
75 —4ICD
•.
,.!,•
•i•-•.z
••
t••
. .,,,',:2
0
't
••
t
p•O•
t
z..
t
Q.,
•
S.
cl *
''::'.
--,....,
-,,,-.:-..-
,
•:
,,,C)
Z
w 0 ,-,
Z
No
6
-r1.1(no
E..,a
,...,cq,z,
,..,,,,_,,
II
11
't
i
r:11'..Zt.100100
10
..MC
i.--i
..•••.u,C:'
r-t.5,
.
10
cl.,
..
..
..
••
t
0
;,.•
•
Nt
g'..
t
;..,
.W
,...
g
.„
t
•g
.,..,*
.i
qs,--,..
.,,,,,-,.
---,--,
°.
''.,CD
•0
rs8 -wc
otw,,,,°
Z
41,s
bp
6
c),..,,t,c:50
E.„
;.'1.-.?,.. N C,
s.,-,....,WP..,
1I
11H
t
.''1
ct.
c.)
P..10010010
0
..MC
H
0
..
..
't
t
"t.
oto
,Hc...,1,0
E..4NCS:) ,
11111't
,,,10010010
..Mc.0

83
Tabell 20. Flyttere innenlands etter kjønn og alder.Migrants by sex and age.
AlderAge
Tallet på flyttereMigrants
....■111.1010
Pr. 1 000 innbyggerePer 1 000 population
I altToatl
MennMales
KvinnerFemales
I altTotal
MennMales
KvinnerFemales
0- 4 år years 20 529 10 678 9 851 64,9 65,6 64,15- 9 » » 9 472 4 844 4 628 30,9 30,9 30,9
10-14 » 5 918 2 954 2 964 19,4 18,9 19,915-19 » 30 558 8 735 21 823 98,4 54,7 144,620-24 » 43 118 18 964 24 154 156,3 133,5 180,425-29 » 22 656 12 701 9 955 108,2 119,1 96,930-34 » 10 852 6 203 4 649 55,6 62,7 48,335-39 » 7 490 4 314 3 176 34,3 38,9 29,540-44 » 5 635 3 071 2 564 22,6 24,4 20,845-49 » » 4 289 2 208 2 081 16,7 17,2 16,250-54 » » 3 228 1 608 1 620 13,5 13,5 13,555-59 » 2 330 1 042 1 288 10,6 9,7 11,560-64 » 1 817 791 1 026 9,4 8,6 10,065--69 » 1 441 629 812 8,6 8,2 9,070 år og over years and over 4 512 2 113 2 399 15,6 16,7 14,7
I alt Total 173 845 80 855 92 990 46,3 43,2 49,4
Tabell 21. Nettoflytting mellom landsdelene.Net migration between regions.
Til: To:
Fra: From:
I altTotal
Oslo-området
Hed-
mark-Oppland
Buske-rud og
Telemark
Sol--landet
Vest-landet
Tronde-lag
Nord-Norge
Oslo-området - . -Hedmark-Oppland 1 172 1 172 . -Buskerud og Telemark 690 505 111 . 74 -Sørlandet 206 84 19 103 -Vestlandet 615 506 90 19 . -Trøndelag 654 320 118 124 8 84 -Nord-Norge 3 030 1 218 85 466 125 599 537 .
I alt Total 6 367 3 805 423 609 207 786 537 -
Nettoflytting i altNet migration, total - 3 805 -749 -81 1 171 -117 - 3 030

84
Tabell 22. Flyttere mellomMigration movements in
Flyttet tilIn-movements
Flyttet fraI altTotal
Oslo-områdetHedmark-
OpplandBuskerud og
Telemark
By-kom-munerUrban,muni-cipa-lities
Her-reds-kom-munerRuralmuni-cipa-lities
Oslo
Andreby-
kom-munerOtherurban'muni-
cip.
Her-reds-kom-mune
By-kom-muner
Her-reds-kom-muner
By-kom-muner
Her-reds-kom-muner
Bykommuner Urban municipalities MennOslo 2 118 5 743 318 2 809 271 1 033 401 332Oslo-området ellers 1 081 2 469 306 234 1 871 46 123 178 84Hedmark-Oppland 488 1 032 216 41 216 88 585 46 27Buskerud og Telemark 1 535 2 220 387 124 462 34 144 678 895Sørlandet 722 1 325 144 43 143 10 29 79 62Stavanger 490 677 122 27 79 8 23 45 19Bergen 483 1 882 154 56 97 4 23 41 22Vestlandet ellers 765 1 683 158 52 125 14 34 41 49Trondheim 637 1 769 214 35 204 24 56 42 27Trøndelag ellers 160 395 28 13 42 3 10 20 3Nord-Norge 783 1 976 209 48 175 35 50 57 31
I alt Total 9 262 21 171 1 938 991 6 223 537 2 110 1 628 1 551
Herredskommuner Ruralmunicipalities
Oslo-området 8 568 8 278 4 707 2 011 5 305 264 857 553 528Hedmark-Oppland 1 759 2 907 750 86 723 525 1 444 190 178Buskerud og Telemark 1 399 1 752 307 68 491 27 147 780 655Sørlandet 891 984 76 18 100 3 16 51 75Vestlandet 5 050 7 763 461 151 576 69 177 159 236Trøndelag 1 284 2 113 146 53 212 35 103 76 63Nord-Norge 2 553 5 121 483 125 424 58 180 169 125
I alt Total 21 504 28 918 6 930 2 512 7 831 981 2 924 1 978 1 860
Hele landet The whole country. 30 766 50 089 8 868 3 503 14 054 1 518 5 034 3 606 3 411
Bykommuner KvinnerOslo 2 475 6 555 326 3 177 321 1 108 456 467Oslo-området ellers 1 167 2 483 317 277 1 929 57 93 193 111Hedmark-Oppland 629 1 389 273 41 236 122 854 47 33Buskerud og Telemark 1 640 2 297 452 120 523 36 162 674 998Sørlandet 829 1 479 212 31 148 17 33 89 68Stavanger 550 811 141 29 88 8 21 42 22Bergen 628 2 363 192 39 106 15 16 40 21Vestlandet ellers 1 120 2 260 213 35 141 21 39 52 40Trondheim 654 2 016 231 42 218 33 69 33 26Trøndelag ellers 158 494 47 5 51 2 12 13 4Nord-Norge 907 2 379 245 48 173 39 53 66 24
I alt 10 757 24 526 2 323 993 6 790 671 2 460 1 705 1 814
HerredskommunerOslo-området 9 076 8 678 4 983 2 170 5 428 254 963 522 610Hedmark-Oppland 2 077 3 470 804 85 747 772 1 906 171 154Buskerud og Telemark 1 554 2 078 375 79 542 36 149 839 882Sørlandet 1 086 1 142 112 16 118 4 17 48 70Vestlandet 6 267 9 424 627 129 589 99 186 150 218Trøndelag 1 622 2 596 194 35 221 45 137 69 59Nord-Norge 3 010 5 627 551 112 438 65 184 128 100
I alt 24 692 33 015 7 646 2 626 8 083 1 275 3 542 1 927 2 093
Hele landet 35 449 57 541 9 969 3 619 14 873 1 946 6 002 3 632 3 907

35
by-kommuner og herredskommuner etter landsdel.urban and rural municipalities by region.
Out-movements
Sørlandet Vestlandet Trøndelag Nord-Norge
B v-'
kom-muner
Her-reds-kom-
muner
Sta-vanger
Bergen
Andreby-
kom-muner
Her-reds-kom-
mu.ner
Trond-hei m
Andreby-
kom-muner
Her-reds-kom-
muner
BBy-korn-
m.uner
Her-reds-kom-muner
Males136 106 115 167 193 595 239 47 195 231 67347 13 22 31 75 120 52 21 75 69 183
9 10 9 10 10 79 25 6 29 28 8654 48 19 44 34 203 65 32 103 64 365
240 795 38 31 60 151 30 5 11 42 13444 16 37 162 472 19 — 15 26 5323 10 47 74 1 620 30 7 18 47 9279 27 170 44 79 1 283 46 14 45 68 12037 8 8 42 69 196 91 1 034 75 244
3 1 8 2 7 20 46 16 213 14 10624 12 14 48 38 124 65 11 41 234 1 543
696 1 046 450 456 801 4 863 617 250 1 779 898 3 599
142 111 88 136 167 610 186 74 239 240 62826 26 10 16 31 211 51 27 130 47 19562 57 14 28 35 220 20 6 63 52 119
661 559 17 11 27 139 12 1 24 14 71193 120 486 1 908 1 287 5 793 149 54 291 133 570
10 23 9 13 44 212 616 216 1 170 66 33082 68 47 68 88 385 137 63 247 1 233 3 692
—1 176 671 2 180 1 679 7 570 1 171 441 2 164 5 605964 1 785
1 872 2 010 1 121 2 636 2 480 12 433 1 788 691 3 943 2 683 9 204. ------
Females194 135 103 206 262 672 247 58 230 302 766
51 19 23 52 74 124 47 21 51 55 15614 8 12 17 21 99 32 12 57 38 10258 57 23 48 55 185 56 39 71 79 301
246 962 65 35 74 151 29 3 12 28 10563 31 55 162 583 20 1 17 29 4939 17 63 117 2 030 49 10 27 64 146
102 34 260 96 187 1 807 61 13 59 80 14025 8 12 47 74 215 81 1 199 76 281
4 1 4 8 9 29 33 22 290 11 10723 8 19 68 55 128 53 15 57 276 1 936
819 1 280 584 632 1 090 6 023 627 275 2 070 1 038 4 089------- --_______
164 127 99 149 169 641 214 69 246 283 66327 28 8 19 41 254 62 27 189 61 19260 72 9 29 33 237 24 21 59 49 137
800 678 26 12 36 164 13 2 29 17 66210 132 618 2 306 1 719 7 370 183 61 311 165 618
15 28 19 32 62 275 803 286 15 11 62 36584 51 42 118 134 425 163 73 275 1 540 4 154
1 360 1 116 821 2 665 2 194 9 366 1 462 539 2 620 2 177 6 195
2 179 2 396 1 405 3 297 3 284 15 389 2 089 814 4 690 3 215 10 284

36
Tabell 23. Nettoflytting mellomNet migration movements
Nettoflytting til (— foran talletbetyr nettoutflytting)
Net migration to
Nebtoflytting fra (—I altTotal Oslo-området
Hedmark—Oppland
Buskerud ogTelemark
By-kom-munerUrbanmuni-
cip.
Her-reds-.kom-munerRuralmuni-
cip.
Oslo
Andreby-
kom-munermunerOtherurban,muni-
cip.
Her-reds-kom-muner
By-kom-muner
Her-reds-kom-muner
By-kom-muner
Her-reds-.kom-muner
Bykommuner Urban municipalities MennOslo 180 —1187 12 —1898 55 283 14 25Oslo-området ellers 90 — 43 12 —140 5 37 54 16Hedmark—Oppland 49 51 55 5 48 60 12Buskerud og Telemark 93 242 14 54 91 -- 12 46 115Sørlandet 26 149 8 4 1 1 3 25Stavanger 40 6 7 5 9 1 13 26 5Bergen 27 — 298 13 25 39 6 7 3 6Vestlandet ellers 36 4 35 23 42 4 3 7 14Trondheim 20 598 25 17 18 1 5 23 7Trøndelag ellers 90 — 46 19 8 32 3 17 12 3Nord-Norge 115 191 22 21 65 7 3 — 7 21
I alt Total — 333 — 180— 90-2345 49 351 93 152
Herredskommuner Ruralmunicipalities
Oslo-området 2 345 447 1 898 140 48 134 91 37Hedmark—Oppland — 351 — 17 — 283 37 —134— 60 46 31Buskerud og Telemark -- 152 — 108 -- 25 16 37 — 31 — 115Sørlandet — 155 20 — 30 5 — 11— 7— 10 3 18Vestlandet 187 193 -- 134 31 — 34— 10— 34 — 44 16Trøndelag — 495 — 51 — 49 22 — 276— 27 — 27Nord-Norge —1046 — 484 — 190 58 — 204 — 28— 15 — 196 6
I alt Total 333 1 187 43 — 447 — 51 17 — 242 108
Hele landet The whole country. . • • 333 — 333 1 007 — 47 —2792 2 368 -- 149 260
Bykommuner KvinnerOslo 152 —1091 9 —1806 48 304 4 92Oslo-området ellers 174 — 143 9 —241 16 8 73 32Hedmark—Oppland 42 114 48- 16 — 18 82 11— 3Buskerud og Telemark 65 370 4 73 1— 11 9 159Sørlandet 10 119 18 20 16 3 6 31 8Stavanger 34 -- 10 38 6 11 4 13 19 13Bergen 4 — 302 14 13 43 2 3 8— 8Vestlandet ellers 30 66 49 39 28 2 3 7Trondheim 27 554 16 5 4 1 7 23 2Trøndelag ellers 117 — 45 11 16 18 10— 15 26— 17Nord-Norge 131 202 57 7 —110 1— 8 — 13— 25
I alt — 166 — 152 — 174 —2286 42 383 65 260
HerredskommunerOslo-området 2 286 595 1 806 241 18 216 — 1 68Hedmark—Oppland — 383 72 — 304 —8 —216— 82 9 5Buskerud og Telemark — 260 15 — 92 32 — 68 3 5 --159Sørlandet — 194 26 — 23 3 — 9— 4— 11 —9— 2Vestlandet 244 58 — 45 5 — 52 68 — 35— 19Trøndelag — 448 24 — 36 16 — 25— 12— 52 —2Nord-Norge —1079 568 --- 215 44 — 225— 37— 8 — 173 37
I alt 166 1 091 143 — 595 — 114 72 — 370 15
Hele landet 166 — 166 939 31 —2881 72 455 — 305 275

37
bykommuner og herredskommuner etter landsdel.in urban and rural municipalities by region.
nettoinnflytting) Net migration from
Sørlandet Vestlandet Trøndelag Nord-Norge
Bv--kom-
muner
Her-reds-kom-
muner
Sta-vanger
Bergen
Andre Her-by- reds-
kom- korn-muner muner
AndreTrond- by-heim kom-
muner
Her-reds-kom-muner
komBy-
-muner
Her-reds-kom-muner
Males8 30— 7 13 35 134 25 19 49 22 1904— 5 -- 5— 2523— 31 17 8 22 21 581 7 1 6--- 4 10 13--- 6— 7 28
—25— 3-- 26 3— 7 44 23 12 27 7 196134— 6 8— 19— 42— 7 2 1 18 52
6— 1 --- 10— 8— 14 11— 8 6 12 6— 8 1 10 30— 288— 12 55— 1 24
19 - 8-- 30 4— 23 7 1 30 327— 4— 11 12 23 47 45 418 10 107
— 2 8— 5— 7— 34— 45 -- 3 3 43—18— 2— 12 1— 30— 9— 10— 3— 25 310
— 26 155— 40— 2736— 187— 20 90 495 115 1 046
— 1 11 9 39 42 34— 18 32 27 65 204— 3 10— 13— 7— 3 34— 5 1727— 3 15
18— 5 6— 14— 16-- 7 3 21— 6— 134 1. 1 19 4 1 2 3
42— 19 14 288 4 -- 47 34 79 9 185—1— 1— 6— 5— 1— 79— 418 3 - 25 83—52— 3— 6-- 24— 32— 185— 107— 43— 83— 310
—149— 20— 6 298— 4— 193-- 598 46 51— 191 484-----------— —
— 175 135— 46 27132— 380— 618 136 546— 1 53076
Females— 1823— 38 14 49 45 16 11 36 57 215
203— 6 13 39— 5 o 16 16 7 44— 3 4 4 2 1 10 12— 1 37— 319— 19 8 3 35 23 26 2 13 173
162 2-- 4— 28— 59 4— 1— 3 5 212 5 8— 98— 35 8— 3— 2 10 74 5 8 - 21— 276 2 2— 5— 4 28
28-- 2 98— 21 88— 13 4— 3 25 6—4— 5— 8— 2 13 32 48 396 23 118
1— 1 3-- 2— 4— 32— 48 - 4— 4 345— 9— 10 4-- 25— 37— 23 4-- 5 396
— 10 194 34 4— 30— 244— 27--
117--
448--
131 1 079
16 9 11 43 28 52— 4 18 25 110 225— 611— 13 3 2 68— 7 15 52 8 8
82— 13 8— 7 19— 2 17 25 37— 162 5— 5 2 32 5 1 1 9 15
59— 32 35 276— 88 -- 32 32 36 37 1933— 1 2 5 3— 36— 396— 4 5 90
—21— 15— 7— 28— 6— 193— 118— 34— 90— 396
—119— 26 10 302— 66— 58-- 554 45 24— 202 568
— 129 168 44 306 — 96 — 302 -- 581 162 472 — 71 1 647

Menn
1 373 92 822 174 193 7 53
1 741 910 993 277 263 11 58
4 957 126 322 2 429 4 253 93 384
5 743 175 285 2 321 . 147 564
468 10 16 85 123 4 254
1 518 29 29 346 372 222 639
'564 5 5 92 93 18 75
1 389 26 45 246 378 15 138
1 180 22 27 130 240 3 32
1 228 14 42 263 228 6 53
1 096 17 25 71 113 12 26
1 580 21 57 162 191 12 32
1 040 27 39 79 147 4 24
524 10 23 57 79 3 9
348 8 15 42 5
632 8 12 42 59 2 4
977 19 17 63 102 4 17
352 6 6 14 17 1 4
1 431 19 14 81 185 1 10
1 313 10 10 68 73 4 17
3 102 35 33 155 184 11 12
1 882 22 14 62 154 2 17
112 8 2 6 4
1 250 5 17 53 71 3 17
817 23 13 57 91 11
2 098 21 18 128 133 8 22
1 769 20 35 149 214 5 37
1 127 12 6 83 79 1 37
395 12 3 35 28 6
986 12 17 75 67 4 21
693 9 13 42 64 2 9
3 167 31 37 165 261 10 53
968 10 6 60 107 15 15
1 016 16 18 75 122 5 58
315 5 4 18 38 2 3
938 11 15 55 100 6 16
50 089 1 806 3 040 8 233 8 868 643 2 732
38
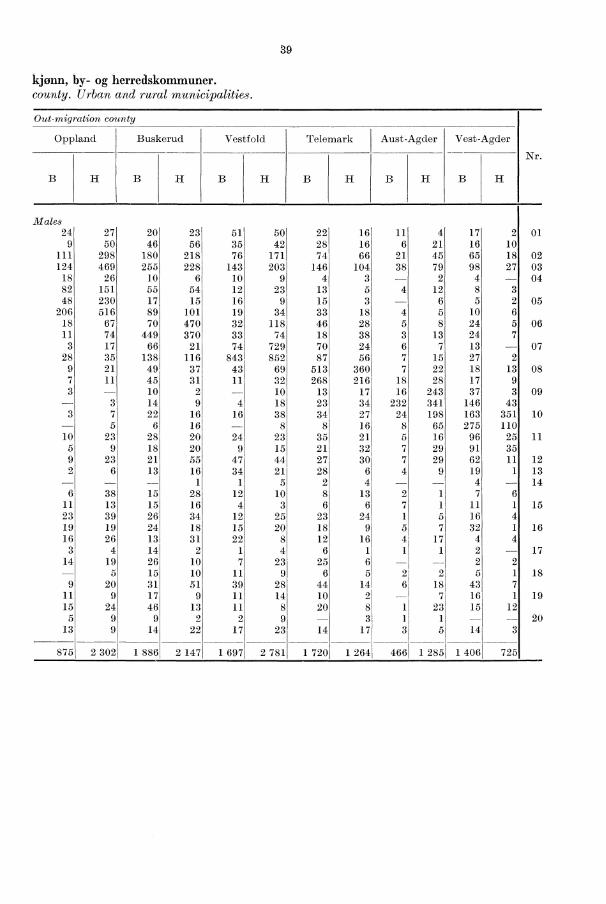
Tabell 24. Flyttere innen og mellom fylkene etterMigrants by sex cross-classified by
Fraflyttingsfylke
HedmarkOslo
Akers-hus
Østfold
Nr. Herreds-komm.Rural?nun.
TilflyttingsfylkeIn-migration col! nty
B HB Halt
Total
By-komm.Urbanmun.
I altTotal
01
020304
05
06
07
08
09
10
11
121314
15
16
17
18
19
20
Østfold 1 939 566H 3 148 1 407
Akershus 10 625 5 668Oslo 7 861 2 118Hedmark B 691 223
H 2 409 891Oppland 829 265
H 2 257 868Buskerud 1 758 578
H 2 125 897Vestfold B 1 611 515
3 073 1 493Telemark B 1 997 957
H 1 026 502Aust-Agder B 503 155
H 1 169 537Vest-Agder B 1 544 567
H 706 354Rogaland B 2 342 911
H 2 463 1 150Hordaland 5 641 2 539Bergen 2 365 483Sogn og Fjordane B 161 49
H 1 614 364Møre og Romsdal B 1 112 295
3 095 997Sør-Trøndelag . B 2 406 637
H 1 831 704Nord-Trøndelag B 555 160
H 1 566 580Nordland B 928 235
H 4 599 1 432Troms B 1 364 396
H 1 657 641Finnmark B 467 152
H 1 418 480
I alt Total 80 855 30 766
89
kjønn, by- og herredskommuner.county. Urban and rural municipalities.
Out-migration county
Oppland Buskerud Vestfold Telemark Aust-Agder I Vest-Agder
Nr.
H B H
20 23 51 5046 56 35 42
180 218 76 171255 228 143 203
10 6 10 955 54 12 2317 15 16 989 101 19 3470 470 32 118
449 370 33 7466 21 74 729
138 116 843 85249 37 43 6945 31 11 3210 2 1014 9 4 1822 16 16 38
6 16 828 20 24 2318 20 9 1521 55 47 4413 16 34 21
1 1 515 28 12 1015 16 4 326 34 12 2524 18 15 2013 31 22 814 2 1 426 10 7 2315 10 11 931 51 39 2817 9 11 1446 13 11 8
9 2 2 914 22 17 23
8861 2 1471 1 697 2 781
22 16 11 4 17 2 01
28 16 6 21 16 10
74 66 21 45 65 18 02
146 104 38 79 98 27 03
4 3 2 4 04
13 5 4 12 8 3
15 3 6 5 2 05
33 18 4 5 10 6
46 28 5 8 24 5 06
18 38 3 13 24 7
70 24 6 7 13 07
87 56 7 15 27 2
513 360 7 22 18 13 08
268 216 18 28 17 9
13 17 16 243 37 3 09
23 34 232 341 146 43
34 27 24 198 163 351 10
8 16 8 65 275 110
35 21 5 16 96 25 11
21 32 7 29 91 35
27 30 7 29 62 11 12
28 6 4 9 19 1 13
2 4 — 4 14
8 13 2 1 7 6
6 6 7 1 11115
23 24 1 5 16 4
18 9 5 7 32 1 16
12 16 4 17 4 4
6 1 1 1 2 —17
25 6 2 2
6 5 2 2 5 118
44 14 6 18 43 7
10 2 7 16 1 19
20 8 1 23 15 123 1 1 — 20
14 171 3 5 14 3
1 720 1 2641 466 1 2851 1 406 725
H B I H I B FTB H I B
Males24 27
9 50
111 298
124 469
18 26
82 151
48 230
206 516
18 67
11 74
3 17
28 35
9 21
7 113
3
3 7
— 5
10 23
5 9
9 23
2 6
6 38
11 13
23 39
19 19
16 26
3 4
14 195
9 20
11 9
15 24
5 9
13 9
875 2 3021 1

40
Tabell 24 (forts.). Flyttere innen og mellom fylkene
Nr.Tilflyttingsfylke
In-migration county
I altTotal
Fraflyttingsfylke
ØstfoldAkers-
husOslo Hedmark
I altTotal
By-komm.Urbanmun.
Herreds-komm.Ruralmun.
B H H B B H
Kvinner01 Østfold B 1 954 620 1 334 129 816 168 192 15 33
H 3 364 1 544 1 820 964 1 055 278 316 19 6402 Akershus H 11 140 5 947 5 193 166 320 2 436 4 446 97 44703 Oslo B 9 030 2 475 6 555 189 359 2 597 . 164 59304 Hedmark B 894 266 628 8 13 94 128 4 368
H 2 953 1 131 1 822 31 34 372 431 333 91305 Oppland B 1 124 363 761 11 10 96 145 25 95
H 2 594 946 1 648 27 49 251 373 24 13806 Buskerud B 1 943 642 1 301 13 29 151 274 5 36
H 2 380 992 1 388 18 35 290 273 12 5437 Vestfold B 1 696 547 1 149 22 23 55 125 7 13
II 3 250 1 585 1 665 24 41 182 221 12 4008 Telemark B 1 994 998 996 18 23 67 178 2 17
H 1 252 562 690 14 24 64 102 3 1303 Aust-Agder B 623 187 436 7 1 17 63 — 2
H 1 455 664 791 2 11 55 91 1 610 Vest-Agder B 1 685 642 1 043 11 24 66 149 1 24
H 773 422 351 5 9 17 21 1 211 Rogaland B 2 890 1 140 1 750 18 16 95 217 1 16
H 2 715 1 349 1 366 8 10 57 84 6 1312 Hordaland H 6 945 2 988 3 957 34 31 173 221 11 1513 Bergen B 2 991 628 2 363 19 21 60 192 5 914 Sogn og Fjordane B 206 58 148 1 2 7 6 —
H 1 971 488 1 483 10 17 56 108 6 1915 More og Romsdal. B 1 645 472 1 173 18 8 64 131 7 10
H 4 060 1 442 2 618 19 15 135 214 13 2716 Sør-Trøndelag . . . B 2 670 654 2 016 27 35 160 231 6 36
H 2 269 911 1 358 12 15 91 110 7 4017 Nord-Trøndelag . B 652 158 494 3 4 44 47 — 6
H 1 949 711 1 238 9 15 79 84 5 3118 Nordland B 1 111 243 868 9 8 48 71 1 9
H 5 275 1 754 3 521 40 36 180 330 13 5419 Troms B 1 537 457 1 080 13 4 59 121 10 16
H 1 829 721 1 108 10 13 67 113 4 4220 Finnmark B 638 207 431 8 4 22 53 2 7
H 1 533 535 998 7 20 55 108 8 23
I alt Total 92 990 35 449 57 541 1 924 3 150 8 708 9 969 830 3 231

41
etter kjønn, by- og herredskommuner.
Out-migration county
Oppland Buskerud Vestfold ' Telemark Aust-Agder Vest-Agder
B H B H B II B H B
Females291 36 20 31 51 36 271 22 9 3 19 6
8 1 52 52 53 30 43 24 27 3 18 28 5104 332 151 238 75 171 81 81 34! 60 73 26157 515 306 314 137 221 150 153 571 104 137 31
30 46 13 4 5 11 6 9 ____ 1 8 -120 139 53 45 14 18 11 11 2 10 10 3
63 345 20 24 17 12 8 3 ----- 5 6 2295 716 83 79 l.3 23 24 19 6 10 9 5
20 89 69 536 39 165 631 38 4 11 20 418 70 460 469 34 93 25 57 4 12 23 7
6 11 63 27 75 831 83 31 12 8 11 214 28 137 140 911 902 • 71 71 6 13 20 5
9 20 59 29 50 88 483 395 14 31 20 113 12 28 34 13 36 326 322 19 45 14 84 1 9 2 3 7 161 21 20 334 38 111 4 15 9 6 20 19 41 328 439 142 54
12 6 26 23 10 33 38 22 35 223 153 3941 5 8 9 3 6 6 11 7 62 323 123
11 16 28 20 26 28 28 21 14 21 132 405 8 19 26 8 18 10 30 8 34 91 37
14 27 24 53 36 52 26 32 13 27 62 1310 7 21 14 20 25 19 7 7 12 32 5- - 1 2 1 5 2 3 - 1 4 -13 29 15 27 7 7 9 7 6 3 7 410 18 20 8 4 15 8 5 2 10 1V 48 30 22 7 18 17 21 2 8 21 627 33 15 18 15 23 18 8 4 7 21 118 35 15 24 8 4 10 10 5 17 7 3
2 6 5 3 2 3 8 1 1 1 3 -15 31 22 19 6 17 22 6 1 3 2 5
2 6 13 5 6' 6 3 2 5 - 2 -22 36 30 40 30 35 33 14 8 13 34 621 11 22 7 10 11 13 4 - 6 14 -
8 16 22 11 11 12 10 6 2 20 15 103 4 13 1 2 11 2 5 1 - 1 2
10 13 18 17 14 20 15 12 10 2 15
1 116 2 771 1 905 2 383 1 695 3 015 1 727 1 524 652 1 566 1 527 830
Nr.
01
020304
05
06
07
08
09
10
11
121314
15
16
17
18
19
20

42
Tabell 24 (forts.). Flyttere innen og mellom fylkene
Nr. Tilflyttingsfylke
Fraflyttings-
Rogaland Horda-land
Bergen
B
Sogn ogFjordane
Møre ogRomsdal
By-komm.
Herreds-komm.
H B H B H
Menn01 Østfold B 15 7 26 11 1 4 22 22
H 14 15 36 16 1 14 4 3502 Akershus H 114 73 133 89 1 71 77 12603 Oslo B 187 57 212 167 6 131 115 19504 Hedmark • • • • B 5 5 8 3 8 4 10
H 8 4 31 8 1 23 10 1905 Oppland B 8 5 16 7 10 2 17
H 9 15 31 8 48 13 4006 Buskerud • • • • B 12 17 31 18 1 21 6 33
H 18 28 64 13 1 31 16 3607 Vestfold B 30 9 30 20 3 10 26 12
H 23 21 41 31 23 21 2208 Telemark • • • • B 23 14 36 26 23 11 28
H 10 18 18 15 1 13 3 1209 Aust-Agder . . . . B 7 4 12 1 4 2 1
H 15 28 27 9 1 11 8 910 Vest-Agder . B 71 37 56 30 17 17 20
H 18 28 20 2 8 2 811 Rogaland . . . . B 340 776 235 63 4 25 16 30
H 824 638 217 25 2 39 19 1912 Hordaland . • • H 196 158 1 977 1 741 29 277 34 7013 Bergen B 78 40 1 429 12 116 31 3514 Sogn og Fjord. B 6 5 23 8 55 6 7
H 19 26 183 114 44 629 28 11915 Møre og Romsd.B 13 11 20 10 31 26 537
H 11 12 79 28 5 170 562 1 18016 Sør-Trøndelag B 20 9 43 42 1 7 56 137
H 10 10 19 4 25 19 7917 Nord- TrøndelagB 11 1 6 2 4 13
H 7 11 18 9 19 17 3118 Nordland . . . B 13 10 16 18 2 6 12
H 55 30 97 39 1 28 22 8019 Troms B 11 8 29 20 1 8 12 12
H 28 13 30 13 10 8 2420 Finnmark . . . B 3 4 12 10 7 6 4
17 13 23 16 10 4 27
I alt 2 249 2 160 5 284 2 636 117 1 928 1 235 3 061
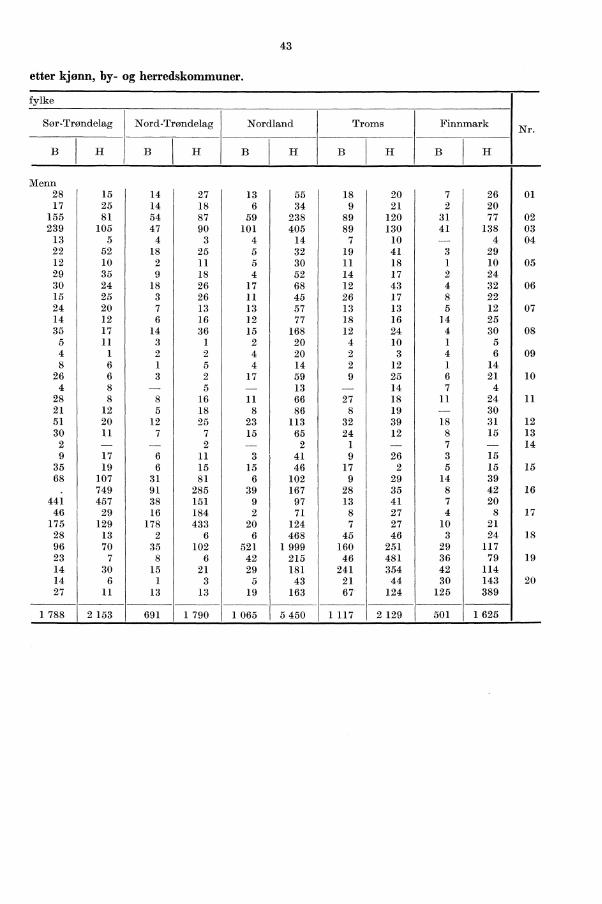
43
etter kjønn, by- og herredskommuner.
fylke
Sør-Trøndelag Nord-Trøndelag
H B
Menn
28 15 14 27
17 25 14 18
155 81 54 87
239 105 47 90
13 5 4 3
22 52 18 25
12 10 2 11
29 35 9 18
30 24 18 26
15 25 3 26
24 20 7 13
14 12 6 16
35 17 14 36
5 11 3 1
4 1 2 2
8 6 1 5
26 6 3 2
4 8 5
28 8 8 16
21 12 5 18
51 20 12 25
30 11 7 7
2 - 2
9 17 6 11
35 19 6 15
68 107 31 81
. 749 91 285
441 457 38 151
46 29 16 184
175 129 178 433
28 13 2 6
96 70 35 102
23 7 8 6
14 30 15 21
14 6 1 3
27 11 13 13
1 788 2 153 691 1 790
Nordland
B
Troms
HB H
13 55 18 206 34 9 21
59 238 89 120101 405 89 130
4 14 7 105 32 19 415 30 11 184 52 14 17
17 68 12 4311 45 26 1713 57 13 1312 77 18 1615 168 12 24
2 20 4 104 20 2 34 14 2 12
17 59 9 25- 13 1411 66 27 18
8 86 8 1923 113 32 3915 65 24 12- 2 1 -
3 41 9 2615 46 17 2
6 102 9 2939 167 28 35
9 97 13 412 71 8 27
20 124 7 276 468 45 46
521 1 999 160 25142 215 46 48129 181 241 354
5 43 21 4419 163 67 124
1 065 5 450 1 117 2 129
H I
J Finnmark Nr.
B H
7 26 01
2 20
31 77 02
41 138 034 04
3 29
1 10 05
2 24
4 32 06
8 22
5 12 07
14 25
4 30 08
1 5
4 6 09
1 14
6 21 10
7 4
11 24 1130
18 31 12
8 15 13
7 14
3 15
5 15 15
14 39
8 42 16
7 20
4 8 17
10 21
3 24 18
29 117
36 79 19
42 114
30 143 20
125 389
501 I 1 625

2335
149242
1629135132682936352213256119
307219
2 6751 725
18254
29802521
72614
11535341836
201995
2065
1212
7131832353511
51030
210448
2 063
1814829474715
81728773222
819
1614
2
64
3530
21
33315
20888
82
7663
316
1844
422
214
11 271 6
62 2
5
44
Tabell 24 (forts.). Flyttere innen og mellom fylkene
Fraflyttings-
Nr. Tilflyttinp. sfylke R ogaland Horda-land
Sogn og More ogBergen
Fjordane Romsdal
Herreds-komm.
By-komni.
B B HB H
01
020304
05
06
07
08
09
10
11
121314
15
16
17
18
19
20
Østfold B 24H 14
Akershus H 109Oslo ..... . . B 182
Hedmark .. B 118
Oppland . . B 5H 7
Buskerud 23H 20
Vestfold B 28
H 22Telemark
•
25H 4
Aust-Agder. .B 4
H 21Vest-Agder. . B 114
H 27
Rogaland . B 452H 1 012
Hordaland . H 253Bergen B 114Sogn og Fjord B 6
H 19More og R.omsd.B 22H 15
Sor-Trondelag B 21
H 24
Nord-TrondelagB 8H 7
NordlandB 14H 62
Troms B 21H 20
Finnmark . B 6H 9
I alt f 2 733 2 441 6 536 3 297
57
6071
26897
229
181428
3443929
96473417043
625
71310
9
44
311011
612
Kvinner2841
155250
183924633337
72623
9
1519103923855411
184855
1 595176123
1956
8981527
923
4 198
8
2
2
141272
1097
2011371633
9302518 4
1 3
185
87175
915
81819132327
164
2 214
173
14144851
529
103838
6130
520
75012171117
1 792

45
etter kjønn, by- og herredskommuner.
fylke
B
Sor-Trondelag Nord-Trøndelag Nordland
B
Troms
H
FinnmarkNr.
H B H B H
Kvinner26 14 12 16 6 54 11 13 10 16 0119 29 10 16 9 39 19 27 5 19
172 79 51 95 61 246 107 137 34 89 02247 138 58 92 101 467 144 141 57 158 03
16 13 5 , 3 4 17 12 10 2 3 0429 62 18 1 37 7 32 34 33 3 1916 17 7 1 24 3 45 13 22 4 5 0533 43 9 47 1 66 13 13 3 2925 23 19 13 16 61 10 35 9 1 22 0619 24 13 201 8 50 22 23 11 ),,,121 10 9 11 7 45 18 10 3 18 0723 7 8 20 12 73 24 10 12 2331 1 16 20 19 23 123 16 23 5 37 08
5 11 8 4 ii 15 4 11 3 148 1, 41 1. 10 2 5 21 3 097 8 2 8 4 11 4 1 11 2i 14
21 4 2 4 9 , 40 11 I 22 3 25 106 8 5 14 1 12 6 4
30 10 7 17 13 66 21 17 20 22 1111 7 3 7 s1 76 16 13 1 2463 22 101 22 25 139 46 51 18 37 1249 12 10 1 15 18 93 35 26 11 27 13
2 1 3 2 1 10 - 149 17 3 14 3 27 10 18 4 9
49 32 7 16 1 15 51 22 11 6 18 15100 148 45 74 13 149 10 39 14 36
879 81 320 32 213 33 33 11 35 16581 582 37 195 11 112 14 34 7 21
33 34 22 256 1 78 5 22 5 7 17222 158 249 576 14 152 9 25 7 21
20 8 4 12 7 662 50 50 1 25 18118 80 51 123 628 2 267 193 227 34 139
21 10 8 9 49 209 56 576 33 92 1915 22 17 27 50 208 345 443 40 13312 10 3 8 6 58 28 47 46 217 2030 10 5 13 19 158 73 145 158 434
2 089 2 547 814 2 143 I 1 182 6 129 1 433 2 336 600 1 819

46
Tabell 25. Flyttere fra og til utlandet etterImmigrants and emigrants by
Innflyttere Immigrants Ut-
Under15 år og over 15 years and over
I For gifteI alt 15 år I altTotal Under Ugifte Gifte Divorced Total
Land 15 years Single Married andwidowed
Kvin- I
MennMales
nerFe-
M. K. M. K. M. K. M. K. M. K.
males
Danmark 946 1 350 128 134 516 893 250 269 52 54 1 021 1 605Finland 73 118 5 8 47 87 17 18 4 5 93 106Island 49 90 11 9 14 59 24 21 - 1 77 110Sverige 1 459 1 137 276 282 660 348 448 446 75 61 1 971 1 455Belgia 41 44 11 13 11 10 18 18 1 3 38 30Irland 9 6 1 - 5 4 3 2 - - 4 5Frankrike 83 96 17 19 40 43 25 30 1 4 92 112Hellas 22 15 3 5 10 5 9 5 - - 10 16Italia 172 40 14 9 90 8 64 21 4 2 80 52Jugoslavia 50 24 2 6 25 9 21 8 2 1 38 18Nederland 142 111 25 21 75 50 41 40 1 - 125 140Polen 58 28 1 3 27 11 29 13 1 1 36 20Sovjetunionen 13 13 1 5 4 1 8 4 - 3 8 8Spania 86 43 11 6 40 13 33 22 2 2 75 40Storbritannia 433 653 72 82 223 382 132 166 6 23 417 736Sveits 113 108 19 13 60 65 33 29 1 1 86 135Tyskland 392 373 61 61 224 167 100 131 7 14 335 375Ungarn 20 12 3 - 5 3 11 5 1 4 11 9Østerrike 41 31 3 5 29 15 8 9 1 2 46 30Europa ellers 46 30 4 5 20 12 21 10 1 3 25 25Canada 111 126 23 33 42 39 42 42 4 12 245 240Mexico 3 1 - - 2 - 1 1 - - 4 2Sambandsstatene 1 268 1 374 330 271 344 412 533 567 61 124 984 1 299Argentina 6 11 1 1 2 5 3 4 - 1 11 6Brasil 21 24 10 12 4 1 7 9 2 11 16Venezuela 4 4 2 1 - 1 2 2 5 5Amerika ellers 46 26 9 11 17 4 18 11 39 34Egypt 10 7 1 - 5 - 4 7 - 2 1Etiopia 23 28 9 12 4 6 9 10 19 19Sor-Afrika-Samb 17 10 6 3 3 1 8 5 1 20 17Afrika ellers 107 92 24 24 42 34 37 31 4 3 123 128India 22 21 6 6 4 6 11 9 1 19 27Iran 10 9 1 5 6 2 2 2 9 9Israel 22 23 6 7 8 7 8 9 14 10Japan 42 45 12 15 11 4 19 25 50 37Tyrkia 15 7 2 2 9 2 3 3 1 - 9 6Asia ellers 102 99 33 39 23 16 43 43 3 1 58 49Austral-Sambandet 48 29 7 3 28 11 11 13 2 2 87 67New Zealand 6 8 3 - 1 3 2 5 10 14Oseania ellers 1 1 1 1 - - - - - -1Uoppgitt 34 13 3 1 23 8 7 3 1 1 60 11
I alt 6 166 6 280 1 157 1 133 2 703 2 747 2 065 2 068 241 332 6 367 7 024

47
kjønn, ekteskapelig status og land.sex, marital status and country.
flyttere EmigrantsInnfl.overskott
Utfl.overskott (-)Excess of
immigration,emigration (-) Country
Under15 årUnder
15 years
15 år og over 15 years and over
UgifteSingle
GifteMarried
For gifteDivorced
andwidowed
M. K. M. K. M. K. M. K. I alt M. K.
156 132 530 1 152 259 271 76 50- 330- 75- 255 Denmark6 3 57 78 26 20 4 5 - 8 - 20 12 Finland
14 17 31 64 29 27 3 2- 48- 28- 20 Iceland305 259 1 047 571 539 550 80 75- 830- 512- 318 Sweden
10 4 12 11 14 15 2 - 17 3 14, Belgium1 - 1 4 1 1 1 6 5 1 Ireland
19 14 42 49 27 43 4 6- 25- 9- 16 France- 5 5 7 5 4 - 11 12- 1 Greece
12 9 38 15 28 25 2 3 80 92- 12 Italy7 5 15 3 15 8 1 2 18 12 6 Yugoslavia
23 23 53 60 44 52 5 5- 12 17- 29 Netherlands1 2 15 7 20 8 - 3 30 22 8 /Poland3 4 - - 5 3 1 10 5 5 U.S.S.R.5 7 40 11 26 22 4 - 14 11 3 Spain
83 71 199 450 129 182 6 33- 67 16- 83 Great Britain11 14 42 81 31 38 2 2 - 27 - 27 Switzerland31 45 190 204 104 109 10 17 55 57- 2 Germany
1 - 2 - 7 3 1 6 12 9 3 Hungary4 4 33 15 7 9 2 2- 4- 5 1 Austria3 1 12 12 10 8 - 4 26 21 5 Other European countries
54 57 91 80 86 94 14 9- 248- 134- 114 Canada2 - 1 - 1 1 - 1- 2- 1- 1 Mexico
227 237 314 486 404 458 39 118 359 284 75 United States5 - - - 6 5 - 1 -- 5 5 Argentina7 ' 3 4 5 1 18 10 8 Brazil2 2 2 - 1 3 - 2- 1 - 1 Venezuela5 7 15 12 17 14 2 1 - 1 7 - 8 Unspecified America- - 1 - 1 1 14 8 6 Egypt7 5 1 2 11 12 13 4 9 Ethiopia5 4 6 4 9 9 - 10 - 3 - 7 Union of South Afrwa
33 44 33 32 57 51 - 52 - 16- 36 Unspecified Africa4 8 6 10 9 9 - 3 3- 6 India4 2 1 1 4 5 1 1 - Iran2 2 6 3 5 4 1 1 21 8 13 Israel
17 11 8 3 25 22 -- 8 8 Japan- 1 5 4 4 1 - 7 6 1 Turkey
14 10 17 21 25 17 2 1 94 44 50 Unspecified Asia20 13 30 19 31 32 6 3 - 77 - 39 - 38 Australia
1 3 4 5 4 5 1 1 - 10- 4 - 6 New Zealand- - - - - - - 2 1 1 Unspecified Oceania
41 3 16 6 3 2- 24- 26 2 Unknown
1 104 1 032 2 946 3 482 2 046 2 152 271 358 - 945 - 201 - 744 Total

48
Tabell 26. Flyttere fra og til utlandet etter kjønn og alder.Immigrants and emigrants by sex and age.
AlderAge
InnflyttereImmigrants
UtflyttereEmigrants
I altTotal
MennMales
KvinnerFemales
I altTotal
Menn KvinnerMales Females
0— 4 år war,' . 1 158 590 568 1 108 595 5135-- 9 725 361 364 654 322 332
10 14 407 206 201 374 187 18715 -19 » 1 178 432 746 1 335 391 94420-24 » 2 935 1 288 1 647 3 763 1 462 2 30125-29 » 2 119 1 077 1 042 2 523 1 296 1 22730-34 » 1 169 704 465 1 285 790 49535-39 » 816 470 346 744 463 28140-44 » » 523 310 213 478 305 17345-49 » 364 208 156 310 170 14050-54 » » 212 119 93 197 103 9455-59 » 186 92 169 86 8360-64 » 221 89 132 142 5565-69 » 206 101 105 151 63 8870 år og over years
and over 227 119 108 158 79 79
alt Total 12 446 6 166 6 280 13 391 6 367 7 024
Tabell 27. Flyttere fra og til utlandet etter fraflyttings-/tilflyttingsland og statsborgerskap.
Immigrants and emigrants by country and citizenship.
InnflyttereImmigrants
UtflyttereEmigrants
Fraflyttings-/tilflyttingslandFrom/to country
Statsborgerskap i: Citizenship of:
Fra-flyttings-
landetCountry ofmigration
Statsborgerskap Citizenship of:
TH.flyttings-
landetCountry ofmigration
NorgeNorway
Andreland"Other
countries
NorgeNorway
Andreland'Other
countries
Danmark DenmarkFinland Finland . .Sverige Sweden . . .Frankrike France Nederland
Netherlands Storbritannia
Great Britain . .Tyskland Germany.Sambandsstatene
United States . . Andre land Other
countries Uoppgitt Unknown
I alt Total
803 1 351 142 1 219 1 263 144
8 173 10 22 172 5
1 991 405 200 2 938 311 177
90 62 27 124 47 33
52 1 178 23 106 126 33
425 581 80 645 428 80
201 456 108 306 342 62
1 388 1 209 45 1 468 754 61
1 056 1 335 1 538 916
18 29 8 63
6 032 6 414 8 374 5 017
Note: Medregnet uoppgitt statsborgerskap og statslose.Note: Including citizenship unknown and persons without citizenship.

49
Utrykte tabeller.
tillegg til de tabeller som er trykt i dette hefte, har Byrået følgende tabelleri manuskriptInngåtte ekteskap.1. Inngåtte ekteskap etter brudens og brudgommens alder. Alle ekteskap,
ekteskap der begge er tidligere ugifte og ekteskap der en eller begge harvært gift før. Bykommuner. Herredskommuner.
2. Inngåtte ekteskap etter mannens bostedskommune.
Fodte.1. Levendefødte i ekteskap etter morens alder, ekteskapets varighet og barnets
nummer. Bykommuner. Herredskommuner.2. Levendefødte i og utenfor ekteskap etter måned og fylke.3. Dødfødte i og utenfor ekteskap etter måned. Bykommuner. Herredskom muner.4. Levendefødte og dødfødte i og utenfor ekteskap etter kommune.
Døde.1. Døde menn og kvinner etter enkelte aldersår og ekteskapelig status. By-
kommuner. Herredskommuner.2. Døde under 1 år etter alder i dager, uker og måneder, etter fødselsmåned.3. Døde under 1 år etter kommune.4. Nye enker og enkemenn etter vigselsår.5. Gjenlevende ektefellers fødselsår.
Flyttinger innenlands.1. Flyttere fra bykommuner til bykommuner og fra herredskommuner til her-
redskommuner, etter kjønn og alder.2. Flyttere mellom de enkelte kommunetyper, etter kjønn og alder (5-års klasser).3. Flyttere mellom kommunetyper etter kjønn og fylke.
Flyttinger til og fra utlandet.1. Inn- og utflyttere etter kjønn, alder og ekteskapelig status. Kommuner.2. Inn- og utflyttere etter fødselsår, kjønn og ekteskapelig status.3. Inn- og utflyttere etter land og statsborgerskap.
For oppgaver over levendefødte, døde, innflyttere og utflyttere etter kommune,se Folketallet i kommunene.

50
Unprinted tables.
In addition to the tables in this publication the following data are availablein unpublished tables :
Marriages.1. Marriages by age of bride and bridegroom. Total marriages, first marriages
and marriages in which one partner or both are previously married. Urbanmunicipalities. Rural municipalities.
2. Marriages by residental municipality of bridegroom.
Births.1. Legitimate births by age of mother, duration of marriage and birth order.
Urban municipalities. Rural municipalities.2. Live births, legitimate and illegitimate, by month and county.3. Stillbirths, legitimate and illegitimate, by month. Urban municipalities. Rural
municipalities.4. Live births and stillbirths, legitimate and illegitimate, by municipality.
Deaths.1. Deaths by sex, age in single years and marital status. Urban municipalities.
Rural municipalities.2. Deaths under 1 year of age in days, weeks and months, by month of birth.3. Deaths under 1 year by municipality.4. New widows and widowers by year of marriage.5. Surviving spouses by year of birth.
Internal migration.1. Migrants from and to urban municipalities and rural municipalities by sex
and age.2. Migrants to and from category of municipality by sex and age.3. Migrants from and to category of municipality by sex and county.
Immigration and emigration.1. Immigrants and emigrants by sex, age and marital status. Municipalities.2. Immigrants and emigrants by year of birth, sex and marital status.3. Immigrants and emigrants by country and citizenship.
For records on live births, deaths, in-migrants and out-migrants by munici-pality, see Population in Municipalities.

51
Vedlegg.
Publikasjoner sendt ut fra Statistisk Sentralbyrå siden 1. januar 1967.Publications issued by the Central Bureau of Statistics since 1 January 1967.
I serien Norges offisielle statistikk (NOS):
Rekke XII Boktrykk 1967
Nr. 210 Økonomisk utsyn over året 1966 Economic Survey Sidetall 158 Pris kr. 11,00211 Syketrygden 1965 National Health Insurance Sidetall 103 Pris kr. 8,00212 Skattestatistikk 1964 Tax Statistics Sidetall 73 Pris kr. 7,00213 Skogstatistikk 1965 Forestry Statistics Sidetall 113 Pris kr. 8,00214 Samferdselsstatistikk 1965 Transport and Communication Statistics Sidetall 137
Pris kr. 8,00215 Utenrikshandel 1966 I External Trade I Sidetall 263 Pris kr. 9,00216 Bedriftstelling 1963 II Varehandel Census of Establishments II Wholesale and Retail
Trade Sidetall 235 Pris kr. 9,00217 Psykiatriske sykehus 1965 Mental Hospitals Sidetall 54 Pris kr. 6,00218 Statistisk årbok 1967 Statistical Yearbook of Norway Sidetall 410 Pris kr. 11,00219 Helsestatistikk 1965 Health Statistics Sidetall 141 Pris kr. 8,00220 Folkemengdens bevegelse 1965 Vital Statistics and Migration Statistics Sidetall 99
Pris kr. 7,00221 Utenrikshandel 1966 II External Trade II Sidetall 240 Pris kr. 9,00222 Bedriftstelling 1963 III Bygge- og anleggsvirksomhet, finansinstitusjoner, sam-
ferdsel og tjenesteyting Census of Establishments III Construction, Banks etc.,Insurance, Transport etc. and Services Sidetall 115 Pris kr. 8,00
223 Kredittmarkedstatistikk 1965 Credit Market Statistics Sidetall 237 Pris kr. 9,00224 Jordbruksstatistikk 1966 Agricultural Statistics Sidetall 95 Pris kr. 8,00225 Fiskeristatistikk 1965 Fishery Statistics Sidetall 89 Pris kr. 7,00226 Skattestatistikk 1965 Tax Statistics Sidetall 79 Pris kr. 7,00227 Utenrikshandel 1966 III External Trade III Sidetall 285 Pris kr. 9,00
Rekke A Offsettrykk 1967
Nr. 182 Markedstall Bedriftstellingen 1963 II Varehandel Market Data. Census of Establish-ments II Wholesale and Retail Trade Sidetall 93 Pris kr. 4,50
183 Dødsårsaker 1965 Hovedtabeller Causes of Death Main Tables Sidetall 80 Priskr. 4,50
184 Aksjonærforhold og styresammensetning i aksjeselskaper 1963 Share Ownershipand Composition of the Boards of Directors in Joint-Stock Companies Sidetall 77Pris kr. 4,50
185 Lønnsstatistikk for sjøfolk på skip i innenriks rutefart November 1966 Wage Sta-tistics for Seamen on Ships in Scheduled Coasting Trade Sidetall 18 Pris kr. 3,00
186 Hotellstatistikk 1966 Hotel Statistics Sidetall 24 Pris kr. 3,00187 Folketallet i kommunene 1965-1967 Population in Municipalities Sidetall 29 Pris
kr. 4,00188 Barnevernsstatistikk 1965 Child Welfare Statistics Sidetall 34 Pris kr. 4,00

52
Rekke A Offsettrykk 1967 (forts.).
Nr. 189 Undervisningsstatistikk 1966-67 III Høgre allmennskoler Educational StatisticsIII Secondary Schools Sidetall 38 Pris kr. 4,00
190 tindervisningsstatistikk 1966-67 II Folkehogskolar Educational Statistics fl FolkHigh Schools Sidetall 22 Pris kr. 3,00
191 Daginstitusjoner for barn 1965 Nursery Schools and Day Nurseries Sidetall 22Pris kr. 3,00
192 Lønnsstatistikk for arbeidere i offentlig anleggsvirksomhet 3. kvartal 1966 WageStatistics for Workers in Public Construction Activity Sidetall 25 Pris kr. 4,00
193 Sykehusstatistikk 1965 Hospital Statistics Sidetall 25 Pris kr. 4,00194 Skogavvirking til salg og industriell produksjon 1965-66 Roundwood Cut for Sale
and Industrial Production Sidetall 37 Pris kr. 4,00195 Undervisningsstatistikk 1966-66 V Universiteter og høgskoler Educational Stati-
stics V Universities Sidetall 49 Pris kr. 4,50196 Jaktstatistikk 1266 Hunting Statistics Sidetall 38 Pris kr. 4,00197 Markedstall. Bedriftstellingen 1963 III Bygge- og anleggsvirksomhet, samferdsel og
tjenesteyting Market Data. Census of Establishments III Construction, Transport andServices Sidetall 71 Pris kr. 4,50
198 Lønnsstatistikk 1266 Wage Statistics Sidetall 58 Pris kr. 4,50199 Undervisningsstatistikk 1966-67 I Folke- og framhaldsskoler Educational Statistics
I Primary and Continuation Schools Sidetall 52 Pris kr. 4,50200 Nasjonalregnskap 1949-1965 National Accounts Sidetall 49 Pris kr. 4,50201 Veitrafikkulykker 1266 Road Traffic Accidents Sidetall 50 Pris kr. 4,50202 Skattestatistikk 1965 Kommuner og handelsdistrikter Tax Statistics. Municipalities
and Trade Districts Sidetall 105 Pris kr. 5,00203 Undervisningsstatistikk 1966-67 IV Fag- og yrkesskoler Educational Statistics i r
ocational Schools Sidetall 46 Pris kr. 4,50204 Sivilrettsstatistikk 1966 Civil Judicial Statistics Sidetall 22 Pris kr. 3,00205 Alkoholstatistikk 1966 Alcohol Statistics Sidetall 30 Pris kr. 4,00206 Lønnsstatistikk for kommunale arbeidstakere pr. I. januar 1967 Salaries of Local
Government Employees Sidetall 59 Pris kr. 4,50207 Finansinstitusjoner 1966 Financial institutions Sidetall 100 Pris kr. 5,00208 Rutebilstatistikk 1966 Scheduled Road Transport Sidetall 24 Pris kr. 3,00209 Elektrisitetsstatistikk 1966 Electricity Statistics Sidetall 38 Pris kr. 4,00210 Lønnsstatistikk for sjøfolk på skip i utenriksfart mars 1967 Wage Statistics for Sea-
men on Ships in Ocean Transport Sidetall 22 Pris kr. 3,00211 Lønnsstatistikk for ansatte i varehandel 1. mars 1967 Wage Statistics for Employees
in Wholesale and Retail Trade Sidetall 42 Pris kr. 4,00212 Formuesstatistikk 1962 Property Statistics Sidetall 27 Pris kr. 3,00213 Sosial hjemmehjelp 1966 Social . Home-Help Services . Sidetall 27 Pris kr. 4,00214 Kommunevalgene 1967 I Municipal Elections I Sidetall 57 Pris kr. 4,00215 Lønnsstatistikk for funksjonærer i bankvirksomhet 1. september 1967 Salaries of
Bank Employees Sidetall 23 Pris kr. 4,00216 Lønnsstatistikk for funksjonærer i forsikringsvirksomhet 1. september 1967 Wage
Statistics for Salaried Employees in Insurance Activity Sidetall 27 Pris kr. 4,00
Rekke XII Boktrykk 1968
Nr. 228 økonomisk utsyn over året 1967 Economic Survey Sidetall 158 Pris kr. 11,00229 Skogstatistikk 1966 Forestry Statistics Sidetall 90 Pris kr. 8,00230 Psykiatriske sykehus 1966 Mental Hospitals Sidetall 39 Pris kr. 7,00231 Utenrikshandel 1967 I External Trade I Sidetall 263 Pris kr. 11,00232 Samferdselsstatistikk 1966 Transport and Communication Statistics Sidetall 165
Pris kr. 9,00233 Folkemengdens bevegelse 1966 Vital Statistics and Migration Statistics Sidetall 53
Pris kr. 7,00

53
Rekke A Offsettrykk 1968
Nr. 217 industristatistikk 1966 Industrial Statistics Sidetall 154 Pris kr. 5,00218 Undervisningsstatistikk 1966-67 V Universiteter og høgskoler Educational
Statistics V Universities Sidetall 84 Pris kr. 4,50219 Sykehusstatistikk 1966 Hospital Statistics Sidetall 26 Pris kr. 4,00220 Nasjonalregnskap 1950-1966 National Accounts Sidetall 48 Pris kr. 5,00221 Lønnsstatistikk for ansatte i offentlige skoler 30. juni 1967 Wage Statistics for
Employees in Publicly Maintained Schools Sidetall 42 Pris kr. 4,50222 Folkemengden etter alder 31. desember 1965 Population by Age Sidetall 56 Pris
kr. 4,50223 Lønnsstatistikk for sjøfolk på skip i innenriks rutefart. November 1967 Wage
Statistics for Seamen on Ships in Scheduled Coasting Trade Sidetall 18 Pris kr. 3,50224 Hotellstatistikk 1967 Hotel Statistics Sidetall 24 Pris kr. 3,50225 Folketallet i kommunene 1966-1968 Population in Municipalities Sidetall 30
Pris kr. 4,50226 Dodsårsaker 1966 Causes of Death Sidetall 80 Pris kr. 5,00297 Kriminalstatistikk Forbrytelser etterforsket av politiet 1966 Criminal Statistics.
Crimes Investigated by the Police Sidetall 50 Pris kr. 5,00228 Bygge- og anleggsstatistikk 1966 Construction Statistics Sidetall 22 Pris kr. 3,50229 Laks- og sjoaurefiske 1963-1966 Salmon and Sea Trout Fisheries Sidetall 52 Pris
kr. 5,00230 Lønnsstatistikk for arbeidere i offentlig anleggsvirksomhet 3. kvartal 1967 Wage
Statistics for Workers in Public Construction Activity Sidetall 26 Pris kr. 4,50231 Skogavvirking 1966--67 Roundwood Cut Sidetall 36 Pris kr. 4,50232 Jaktstatistikk 1967 Hunting Statistics Sidetall 36 Pris kr. 4,50233 Barneomsorg 1966 Child Welfare Statistics Sidetall 40 Pris kr. 4,50
I serien Samfunnsøkonomiske studier (SOS):Nr. 18 Storbyutvikling og arbeidsreiser. En undersøkelse av pendling, befolkningsutvik-
ling, næringsliv og urbanisering i Oslo-området Metropolitan Growth, Commutingand Urbanization in the Oslo Area Sidetall 298 Pris kr. 12,00
19 Det norske kredittmarked siden 1900 The Norwegian Credit Market since 1900Sidetall 395 Pris kr. 11,00
I serien Artikler fra Statistisk Sentralbyrå (ART):Nr. 19 An Analysis of the Effects of Transitory Income on Expenditure of Norwegian House-
holds Sidetall 28 Pris kr. 5,00
Pris kr. 7,00
Publikasjonen utgis i kommisjon hos H. Aschehoug & Co., Oslo,og er til salgs hos alle bokhandlere.