Embed Size (px)
Citation preview

Breakthrough Process Improvement
Optimizing Lining Material inventory Lean Six Sigma Project
DMAIC Methodology

Introduction
Dubai Aluminium ("DUBAL") owns and operates one of the world's largest aluminium smelters
Vision: To be one of the best companies in the global Aluminium industry
Products and services:
– 330 individual products to 300 customers
– More than 1 million metric tonnes /50 countries
– 3800+ employees
– 34 nationalities
In line with the vision , continual improvements are
the driving factors for success in DUBAL

Potroom Operation & Supply in DUBAL
DUBAL OPERATION
SMELTER
CARBON POTROOMS
CAST
HOUSE
POWER PLANT
SUPPLY
WAREHOUSE PURCHASE
GREEN MILL,
BAKING KILN,
RODDING & DOCK
POTROOMS WAREHOUSE STRATEGIC
MATRIAL
PURCHASE

M A I C D Project
Beginning
Define
Measure
Analyze
Improve
Control

Focus on value addition through operational and service excellence
CORPORATE SOCIAL
RESPONSIBILITY
SECURE A
DIVERSIFIED ENERGY
SUPPLY
RECOGNITION AS EMPLOYER OF CHOICE
ACHIEVE OPERATIONAL
EXCELLENCE
VISION
To be one of the best companies in the global Aluminium industry
Driv
er
s
Ou
tco
mes
P2 P3
P1
MAXIMIZE LONG TERM SHAREHOLDER’s VALUE
MARKET & BUSINESS
DEVELOPMENT
P10
P8
P9
L1 L2 L3 L4
P4
CH
P7
P5
P6
EXCEED CUSTOMER EXPECTATIONS
C1 C2 C3
P11
P&D Smelter Support EHS
F1 F2 F3 Optimize
Working
Capital
F4
Improve Cash flow
Project was aligned to Corporate
Strategic objective
The Business Case: Project Selection
Reducing lining material inventory
variation and Optimize Inventory
Inventory Plays a Major Role in Aluminium Smelting

Define M A I C

Pot Lining and Electrolysis Cell
Adapted from: Relining Rationale.ppt, Morten Sorlie, Elkem
Electrolyte
Molten Aluminum
Cathode with Collector Bar
Frozen Bath
Dense
Refractory
Bottom Insulation
(Lining Material)
Strong Steel Support Structure
Carbon cathode block Carbon
anode
Each set of lining material cost’s approximately 0.6 mAED
Different Designs - D18 - CD20 - D20
- DX

Project Charter
Problem Statement:
In H1-2009, Lining materials inventory variation against the target (20 pot sets for each design), in warehouse was very high (parameter of
difference distribution mean=20.8, std. dev.29.5) and this variation was leading to Having variation between different materials in one BOM design
High inventory in some items
Very low inventory in other items
Generating expiry of some shelf life items
Define
-10
10
30
50
70
90
110
130
150
April
Min Inv
Variation in inventory
Large variation in inventory of lining materials against target.
High variations in
the lining inventory
against target

Define
Cell-lining PROCESS S
UP
PL
IER
S
CU
ST
OM
ER
S
Cathode Blocks
Collector Bars
Ref ractories
Pig Iron
Ramming Material
INPUTS PROCESS OUTPUTS
Requirement
Schedule from
Potline Ops &
Process Control
MRP by Warehouse
and PR to purchase
PO from purchase
to supplier
Lining material
supplies from
supplier to
warehouse
External Supplier
f or lining material
Purchase
Issue of Lining
Material and Inv entory
stock at warehouse
Cell Lining Inventory
Cell Lining
Project Charter -SIPOC
Material Request from
area Material Issue
Through SIPOC all stakeholders and areas related to the problem
identified
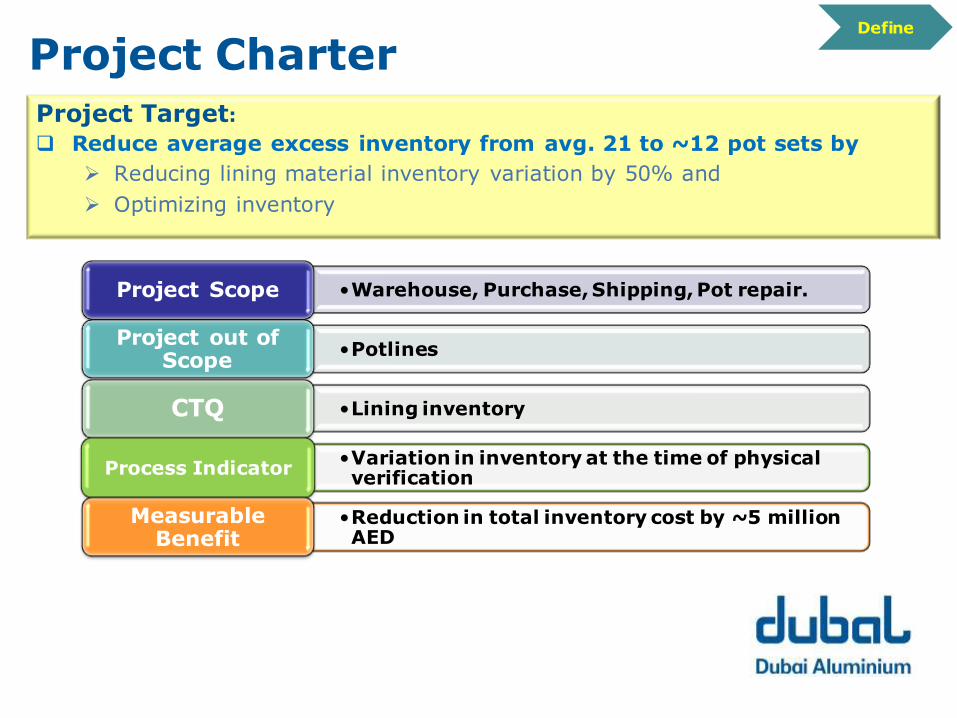
Project Charter
Project Target:
Reduce average excess inventory from avg. 21 to ~12 pot sets by
Reducing lining material inventory variation by 50% and
Optimizing inventory
Define
•Warehouse, Purchase, Shipping, Pot repair. Project Scope
•Potlines Project out of
Scope
•Lining inventory CTQ
•Variation in inventory at the time of physical verification
Process Indicator
•Reduction in total inventory cost by ~5 million AED
Measurable Benefit

Project Team
Team Members
Project Leader
Project Sponsor Dr Ali H.A.M. Al Zarouni
V.P. Smelter operations
Dr Maryam Mohamed AlJallaf
Snr Manager PCPR & PCCL
Define
Ibrahim Baggash Snr Manager Smelter Production Services
Najm Alawadhi Snr Manager Purchasing – Strategic Materials
Abdul wahid Al Madani Snr Manager Supply Chain
Abdulla .A Manager Cell Relining
Asim Hassan Manager Warehouse
Mohamed Tawfik Boraie HOD Process control Cell Lining
Haiedeh Marashy Warehouse
Saif Mohamed Snr Planner Smelter Reductions
Daniel Whitfield Snr Engineer Process Control Potrooms
Andries Louw Snr Engineer Process Control Potrooms
Narendra Singh Rana Plant Industrial Engineer
Team selected is a cross-functional team involving all areas
related to the project.
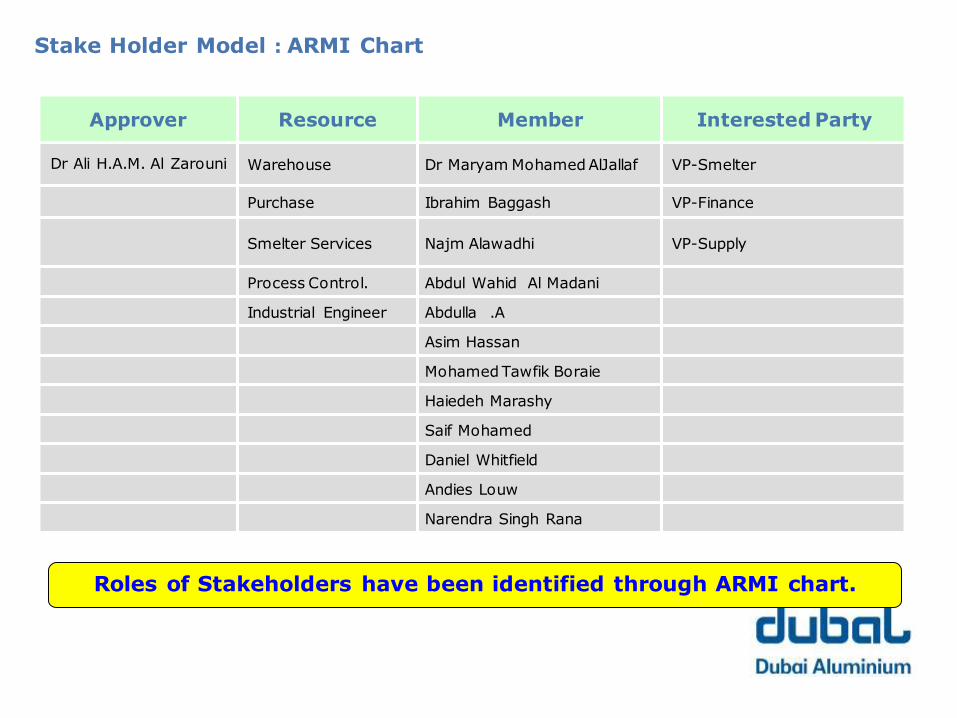
Stake Holder Model : ARMI Chart
Approver Resource Member Interested Party
Dr Ali H.A.M. Al Zarouni Warehouse Dr Maryam Mohamed AlJallaf VP-Smelter
Purchase Ibrahim Baggash VP-Finance
Smelter Services Najm Alawadhi VP-Supply
Process Control. Abdul Wahid Al Madani
Industrial Engineer Abdulla .A
Asim Hassan
Mohamed Tawfik Boraie
Haiedeh Marashy
Saif Mohamed
Daniel Whitfield
Andies Louw
Narendra Singh Rana
Roles of Stakeholders have been identified through ARMI chart.
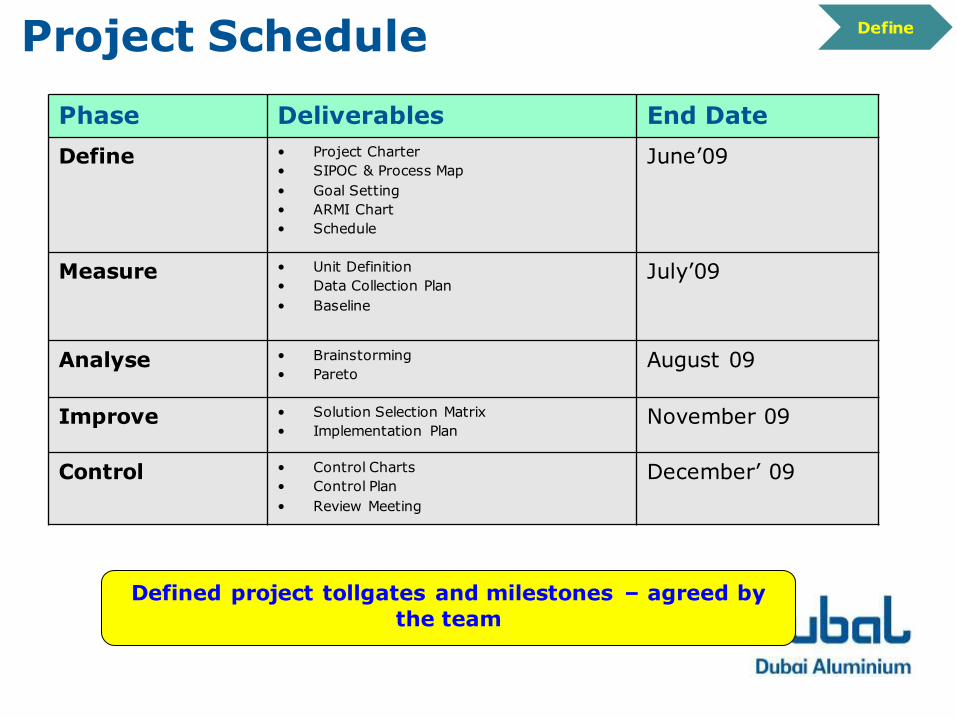
Project Schedule
Phase Deliverables End Date
Define • Project Charter
• SIPOC & Process Map
• Goal Setting
• ARMI Chart
• Schedule
June’09
Measure • Unit Definition
• Data Collection Plan
• Baseline
July’09
Analyse • Brainstorming
• Pareto August 09
Improve • Solution Selection Matrix
• Implementation Plan November 09
Control • Control Charts
• Control Plan
• Review Meeting
December’ 09
Define
Defined project tollgates and milestones – agreed by
the team

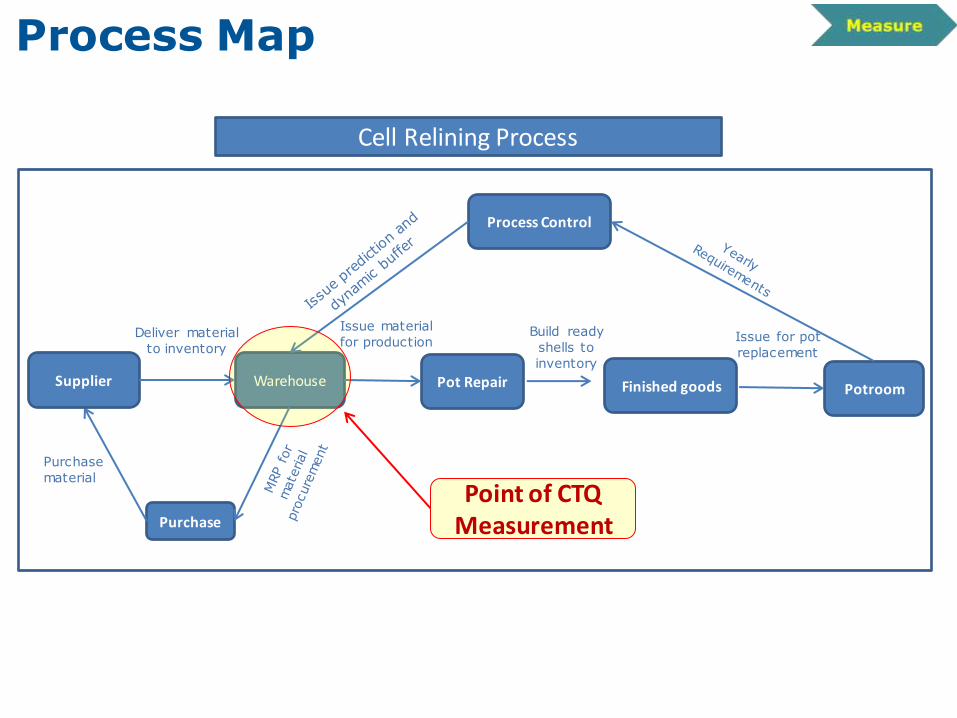
Potroom
Process Control
Warehouse
Purchase
Pot Repair Supplier
Purchase
material
Deliver material
to inventory
Issue material
for production
Finished goods
Build ready
shells to
inventory
Issue for pot
replacement
Process Map
Cell Relining Process
Point of CTQ Measurement

Data Collection Plan
Data Frequency Source Responsibility
Variation in inventory from target Monthly
PCCL Records Mohamed Tawfik
Measure
•Pot set (Quantity of lining materials available at end of the month)
Unit Definition
• (One month consumption + buffer) ± 40 sets (set by pot failure prediction) Specification
•Any data point out of specification (± 40 sets). Defect Definition
Data Collection Plan
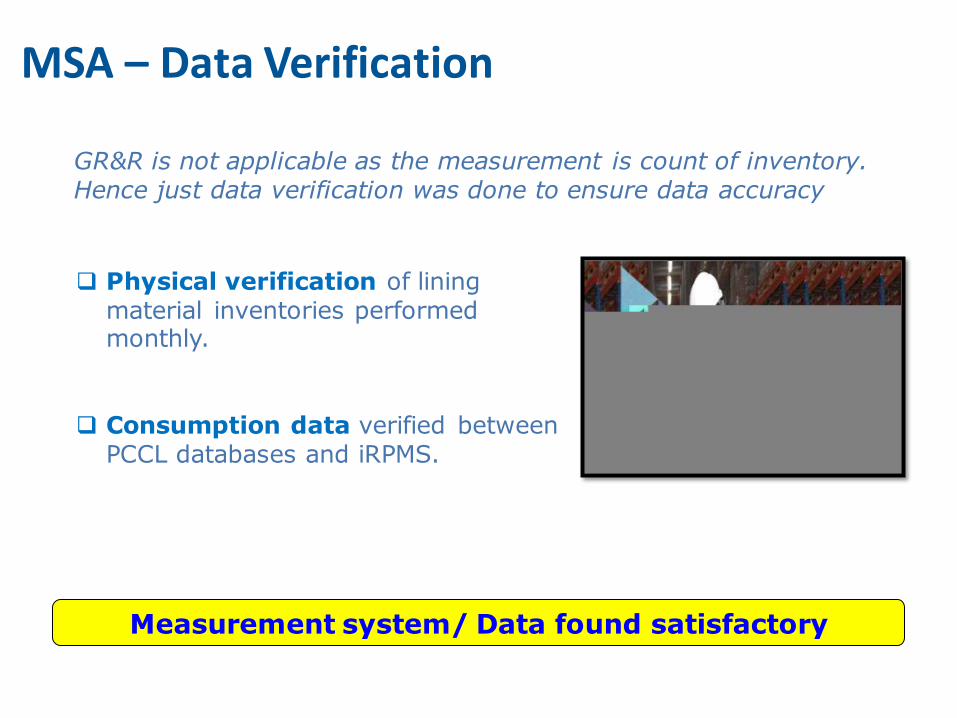
MSA – Data Verification
Physical verification of lining material inventories performed monthly.
Consumption data verified between PCCL databases and iRPMS.
GR&R is not applicable as the measurement is count of inventory. Hence just data verification was done to ensure data accuracy
Measurement system/ Data found satisfactory

Baseline
Cpk 0.27
PPM (Exp. Overall) 278,115
Very Low Cpk and High defect ppm – high number of
data points out of specifications


Identify Possible causes Analyze
Problem
• Variation in inventory & non-optimized inventory
Tool Used
• Brain Storming
Possible Causes
1.Prediction Model Error
2.Variation in delivery
3. Change in schedule for early delivery by procurement planning
4.Lead time
5.High Buffer level

Filtering the Root causes Analyze
Possible Causes 1.Prediction Model Error
2.Variation in delivery
3. Change in schedule for
early delivery by procurement planning
4.Lead time 5.High Buffer level
Tool Used 1. Process Capability
2. Why why & Histogram
3. Why why & VSM
4. Process Knowledge
5. Inventory Model &
Control chart
Why Used 1. To check Model is
capable of giving
desired accuracy
2. To identify root cause and validate
3. To identify root cause and validate
4. To study controllable or uncontrollable cause
5. To identify whether
buffer level acceptable or not
This summarises the tool used for filtration of root causes from
possible causes

Possible Cause 1: Prediction Model Error
(Process Capability of prediction)
Analyze
Conclusion:
As Capability analysis and Control chart suggest that prediction error is
within control, hence it is not a root cause..
Hence prediction error is well with in the tolerance of ± 10 pot sets. Expected error ppm is 4044, which is acceptable for the above process.

Possible Cause 2: Variation in Delivery
(Why-Why Analysis)
Analyze
Why • Why variation in delivery occurs?
• Due to variation in delivery date.
Why • Why variation in delivery date occurs?
• Due to poor commitment from supplier.
Variation in delivery (Delay) of lining material shipments Histogram
2008
0.0
5.0
10.0
15.0
20.0
25.0
30.0
35.0
-180 -150 -120 -90 -60 -30 0 30 60 90 120 150 180
Delay (Days)
% o
f s
hip
me
nts
Series1
Hence, Poor commitment from supplier is root cause for inventory variation.
Root cause Validation
High deviations in
delivery dates

Possible Cause 3: Change in schedule for
early delivery by procurement planning (Why-Why Analysis)
Analyze
Hence No visibility of Finished Goods and WIP inventory to procurement planning
is root cause for inventory variation .
Why • Why change in schedule occurs?
• Due to lower than planned inventory at warehouse.
Why • Why lower than planned inventory at warehouse?
• Due to no visibility of WIP and Finished Goods inventory
to procurement planning.
High WIP& F.G. inventory (VSM Analysis)
Root cause Validation

Possible Cause 3: Change in schedule for
early delivery by procurement planning (Why-Why Analysis)
Analyze
Hence No visibility of Finished Goods and WIP inventory to procurement planning
is root cause for inventory variation .
High WIP& F.G. inventory (VSM Analysis)
Root cause Validation

Possible Cause 4: High Lead Time
Analyze
Hence, lead time causes inventory variations but it is not a controllable root cause,
although some other actions like - Making some material as consignment stock, were proposed by the team.
Why • Why high lead time causes inventory variation?
• Due to high max to min difference between inventory levels
Why • Why high difference between inventory levels?
• Due to supplier delivering material in bulk and we need to cover for long lead time.
Why • Why supplier delivering material in bulk?
• Due to material being exclusive to us supplier produces material at certain quantity.
Lead Time Mostly 4-6 months

Possible Cause 5: High Buffer level
Analyze
Hence no scientific basis for buffer level setting is a root cause for high
inventory.
Variation in actual process +/- 10 sets
* Value depends on material type and its lead time.
Why • Why high buffer level?
• Due to wrong setting of buffer level
Wrong Setting
Root Cause Validation
Why • Why wrong setting of buffer level?
• Due to no scientific basis for buffer level setting
Actual pot failure variation is within +/- 10 pot sets and we are keeping a buffer of 20 pot sets

Filtering of Root causes Analyze
This summarises the filtration of root causes from possible causes
Variation in inventory and high
buffer level
1.Prediction Model Error
2.Variation in delivery
Poor commitment from supplier
3.Change in schedule for early
delivery by procurement
planning
No visibility of WIP and Finished Goods
inventory to procurement
planning
4.Lead Time
5.High Buffer level No scientific basis
for buffer level setting

Summary of final root causes
1. Poor Supplier Commitment
2. No visibility of Finished Goods & WIP
3. No scientific basis for buffer level setting


Brainstorming: List of Possible Solutions
Root Causes Counter-Measures/ Solutions
1.Poor commitment
from supplier
A. Agree with supplier at year beginning for full year delivery
schedule.
B. Follow up with supplier before each shipment.
C. Communicate to user about any expected variation.
D. Change packing standard.
2. No visibility of
Finished Goods and
WIP inventory
A. Change concept of inventory to overall process inventory,
considering: Raw material, WIP and Finished Goods.
B. Consignment stock from major lining material and to be paid
only when used.
3. No scientific basis
for buffer level setting
A. Dynamic buffer for each design to be calculated every year
based on past process variation.
Improve

Solution Selection Matrix Improve
Root Cause Solution Cost Difficulty in Implementa
tion
Rating (Cost x
Difficulty)
Poor commitment from supplier
Agree with supplier at for full year delivery
schedule.
5 3 15
Follow up before each shipment 4 4 16
Communicate to user about any expected variation
5 5 25
Change packing standard. 2 1 2
No visibility of Finished
Goods and WIP
inventory
Change concept of inventory to overall process inventory, considering: Raw material, WIP and Finished Goods.
5 3 15
Consignment stock from major lining material.
3 1 3
No scientific basis for buffer level setting
Dynamic buffer for each design to be calculated every year based on past process variation.
4 4 16
RATING SCALE COST
HIGH 1 2 3 4 5 LOW
DIFFICULT IMPLEMENTATION

Implementation Plan Improve
Actions were monitored and implemented as per the plan
No. Particular Action Points Responsibility Target Date
Completion Date
1 Poor commitment from supplier
Agree with supplier at for full year delivery schedule.
Najm AlWadahi Nov 2009 Dec 2009
Follow up before each shipment
Najm AlWadahi Jan 2010 Jan 2010 (Continuous )
Communicate to user about any expected variation
Najm AlWadahi Nov 2009 Nov 2009
2 No visibility of Finished Goods and WIP inventory
Change concept of inventory to overall process inventory, considering: Raw material,
WIP and Finished Goods.
All Jun 2009 Jun 2009
3 No scientific basis for buffer level setting
Dynamic buffer for each design to be calculated every year based on past process variation.
Maryam Mohamed Aljallaf
Oct 2009 Oct 2009

Process performance before and after implementation
BEFORE AFTER
Before After
Cpk 0.27 1.15
PPM (Exp. Overall) 278,115 4,326
Improve
Significant improvement in excess lining inventory variations

Supplier Commitment
Process performance before and after implementation
Lining Martial Physical inventory actual vs Target
Improve
Significant improvement in excess lining inventory variations


Control
Sharing of draft annual plan with all the stakeholders in year beginning.
Regular Bi-weekly meeting between stakeholders.
Department objective for controlling lining material inventory reported and reviewed through BSC.
MRP procedure modified for not reacting to common cause variations.
BPR Report with month by month objective vs actual performance on KPIs
To sustain the improved results following control methods were institutionalized in the system and being continuously monitored.
Modified MRP Procedure

Control Plan
Parameter Measurement
Method
Responsibility Actions: If Out Of Control
Buffer level Difference between Actual failure and predicted failure within control limit
Cell Lining Process Control, HOD
Plant Industrial Engineer, Smelter
Sr. Mgr., PC PR & CL
Re calibrate the level if some unexpected event happens.
Physical Inventory
Physical Inspection Cell Lining Process Control, HOD
- Inform all stakeholders and decide if changes are required in future delivery schedule
Control
OCAP and responsibilities identified in case of out-of-
control process

Stakeholders involvement in Control Phase
Stakeholders Area Role in control
Top mangement Reviewing performance.
Dr Maryam Mohamed AlJallaf Process Control potroom and Cell Relining
- Setting dynamic buffer. - physical stock taking, monitoring
and reporting.# - Monitoring and communicating
consumption.
Najm Alwadahi Purchase Strategic Materials Implementing MRP recommendation with supplier.
Asim Hassan Warehouse MRP control based on data from all sources.
Ibrahim Baggash Smelter services Reporting consumption in SAP.

Results Achieved & Financial Benefits
Working capital reduction by 11.3 million AED
audited by finance.
OTHER BENEFITS:
Reduced greatly fire fighting situations.
Reduced greatly expiry of shelf life items.
Improved storage space utilization.
Avg 20.8 excess
pot sets
Avg 2 excess
pot sets

Project Closure
• Learning from the project
– Enhanced understanding of the process through Value Stream Mapping.
– Lean and Six Sigma integrated project a unique case study.
– Cross functional team involvement.
• Horizontal deployment
– Learning from the project applied to other process materials.
• Further refinement
– Automated MRP project in SAP 2013.
• Team recognition
– Team was recognized monetarily through
performance enhancement project (PEP) program.
– Presented in quarterly review meeting and
appreciation from VP smelter operation.

Why this project is an excellent improvement example
• Impacted Dubal’s cash flow positively and reduced it by 11.3 mAED.
• Complex project involving multiple functions, having specialized and
customized high value materials (minimum 51Million AED at 2009).
• Achieved reduction in inventory in spite of limitation of 6 months lead
time.
• Transformation in inter department relationship and team work
(namely Smelter operation, warehouse and purchase).
• Great success story in service area (not only technical).
• This project is a live example of how lean application with six sigma can
provides a unique blend of results.


Q & A

Thank You

Lining Mat. inventory before power outage (Oct 2008)
0
10
20
30
40
50
60
70
80
90
100
Board
,insu
latin
g
232x
210x
20 c
alcium
silic
ate
Brick,
insu
latin
g 23
0 x 23
0 x 64
mm
Brick,
insu
latin
g 30
5 x 11
4 x 76
mm
Brick,
fire
230
x 11
4 x
64m
m
Brick,
fire
305
x 11
4 x
76m
m
Brick,
SIC 4
85 x
258
x 7
6mm
Car
bon
Sidew
all b
lock
, Gra
phitic
Insu
latio
n Boa
rd -
Multip
le
Ref
ract
ory
Brick -2
30x2
20x7
6
Car
bon
Sidew
all b
lock
, Gra
phitic
Insu
latio
n Boa
rd
Slab,
fire
250 x 5
00 x 7
6mm
Ref
ract
ory
Brick -1
20x2
10x1
00
Gra
phitiz
ed C
atho
de 3
150
Insu
latio
n bo
ard s
et
Gra
phitiz
ed C
atho
de 3
250
Col
lect
or B
ar,ro
und
4320
Slab,
fire
250 x 5
00 x 6
4mm
Brick,
fire
230
x 11
5 x
50m
m
Brick,
fire
232
x 21
0 x
100m
m
Brick,
fire
500
x 50
0 x
64m
m
Semigra
phitic
Cat
hode
315
0x440
mm
Col
lect
or B
ar,ro
und
Shape
d Ref
ract
ory
Brick -2
32
Ref
ract
ory
Brick -1
20x2
20x1
00
Slab,
fire
500 x 5
00 x 7
6mm
Brick,
fire,
HD, 2
30 x
115
x 6
0mm
Brick,
fire
195
x 11
5 x
60m
m
Brick,
SiC 3
80 x 27
3 x 76
mm
Sidew
all b
lock
,Gra
phitise
d
Oct
Min Inv
• High inventory Vs min Required
• High Variation (not usable)
• Not considering ready shells

Lining Mat. inventory after power outage (March-April 2009)
0
10
20
30
40
50
60
70
80
90
100
Boa
rd,in
sulatin
g
calcium silica
te (sh
ape
d)
Bric
k,insu
latin
g 23
0 x 64
mm
Bric
k,insu
latin
g 30
5 x 76
mm
Bric
k,fire 23
0 x 11
4 x 64
mm
Bric
k,fire 30
5 x 11
4 x 76
mm
Sem
igra
phitic Catho
de 3
100x
400
Insu
latio
n Boa
rd - M
ultip
le
Refra
ctory Bric
k 230
x76
Slab,fire 250
x 7
6mm
Refra
ctory Bric
k 120
x210x
100
Graphitiz
ed C
atho
de 315
0
Insu
latio
n bo
ard set
Graphitiz
ed C
atho
de 325
0
Collector B
ar,ro
und 43
20
Slab,fire 250
x 5
00 x 6
4mm
Bric
k,fire 23
0 x 11
5 x 50
mm
Bric
k,fire 23
2 x 21
0 x 10
0mm
Bric
k,fire 50
0 x 64
mm
Collector B
ar,ro
und
Sha
ped Refra
ctory Bric
k 232
x100
Refra
ctory Bric
k 120
x220x
100
Slab,fire 500
x 5
00 x 7
6mm
Bric
k,fire,HD, 2
30 x 115
x 60m
m
Bric
k,fire 19
5 x 11
5 x 60
mm
Bric
k,SiC
380 x 27
3 x 76
mm
Car
bon Sidew
all b
lock
,Graph
itise
d
March
April
Min Inv
NOT ONLY TO COMULATE INVENTORY TO COVER THE RISK, BUT LOWERING RISK BY IMPROVING DELIVERY CONTROLS.

Proc Cont. & Supply
P1
Cathode Casting
P2
shell Demolition & Repair
115 Cathode 6.05 pots
Lining material Supplier Material
Potrooms
P3
Cell Construction
D18
18 pots
CD20
18 pots
D20
14 pots
P4
Cell Change Over
846 Cathode
49.76 pots
320 Cathode
16.84 pots
21454
SiC 124.7 pots(22.5+50.3+51.8)
1412 Col Bars
78.4 pots (24.4+54)
521 Col Bars
27.42 pots
D18 CD20 D20
D20 76
4 pots
115 Cathode
6.05 pots
846 Cathode
49.76 pots
CD20
28 1.47 pots
D18 118
6.35 pots
D18 (Days) 0.7 NVA (days)
VA (days)
P rod. T ime= 9.9 days
Door to Door lead time
=590.7 days
POT LINING CURRENT STATE MAP
NVA (days)
VA (days)
P rod. T ime= 9.9 days
Door to Door lead time
=255.4 days
NVA (days)
VA (days)
P rod. T ime= 9 .9 days
Door to Door lead time
=231.7 days
CD20 (Days)
D20 (Days)
58 POT SETS
56 POT SETS
49 POT SETS
P1
C/T Day 1
C/O hr 12
Parts# No. N/A
UT % 85
#M No. 1
#O No. 7
#S No. 2 x 12h
WT min 660
BS set ~ 0.22
FTQ % 99
P2
C/T 5.3
C/O 1
Parts# N/A
UT 80
#M 1
#O 5
#S 2 x 12h
WT 660
BS 100%
FTQ 100
P4
C/T 0.7
C/O 3
Parts# 0.00%
UT 85
#M 1
#O 12
#S 2 x 12h
WT 660
BS 100%
FTQ 100
P3
C/T 2.9
C/O 2
Parts# 0.00%
UT 95
#M 3
#O 16
#S 2 x 12h
WT 660
BS 100%
FTQ 99.5
Raw Mat. 161 1.0 WIP. 6 5.3 +
2.9 FG. 78 0.7
P1 P2+P3 P4
Raw Mat.
141
1.0 WIP. 18 5.3 +
2.9 FG. 63 0.7
P1 P2+P3 P4
Raw Mat.
332
1.0 WIP. 69 5.3 +
2.9 FG. 180
P1 P2+P3 P4
C/O.
0.5
C/O.
0.1
C/O.
0.1
C/O.
0.5
C/O.
0.1
C/O.
0.1
C/O.
0.5
C/O.
0.1
C/O.
0.1

POT LINING FUTURE MAP
D18 (Days)
P1
NVA (days)
VA (days)
P rod. T ime= 9.9 days
Door to Door lead time
=105 days
NVA (days)
VA (days)
P rod. T ime= 9.9 days
Door to Door lead time
=84 days
NVA (days)
VA (days)
P rod. T ime= 9.9 days
Door to Door lead time
=79 days
CD20 (Days)
D20 (Days)
Proc Cont. & Supply
P3
Cell Construction
P4
Cell Change Over
P2 shell
Demolition & Repair
Cathode 20.6 pots
Lining
Supplier Material
Potrooms
P1
Cathode Casting
Cathode 14.8 pots
Cathode 11.7 pots
SiC 38.3 pots (14.8+20.6+11.7)
Col Bars 35.4 pots (14.8 +20.6)
Col Bars 11.7 pots
D1
8
CD2
0
D20
Supplier Development
Min 3
pot sets /design
2 pot
sets /design
OEE Improvement
Inventory Reduction
19.8 POT
SETS
25.6 POT
SETS
16.7 POT
SETS
P1
C/T Day 1
C/O hr 12
Parts# No. N/A
UT % 85
#M No. 1
#O No. 7
#S No. 2 x 12h
WT min 660
BS set ~ 0.22
FTQ % 99
P4
C/T 0.7
C/O 3
Parts# 0.00%
UT 85
#M 1
#O 12
#S 2 x 12h
WT 660
BS 100%
FTQ 100
P3
C/T 2.9
C/O 2
Parts# 0.00%
UT 95
#M 3
#O 16
#S 2 x 12h
WT 660
BS 100%
FTQ 99.5
0.7 Raw Mat. 71 1.0 WIP. 10 5.3 +
2.9 FG. 14
P1 P2+P3 P4
C/O.
0.5
C/O.
0.1
C/O.
0.1
0.7 Raw Mat. 60 1.0 WIP. 6 5.3 +
2.9 FG. 9
P1 P2+P3 P4
C/O.
0.5
C/O.
0.1
C/O.
0.1
0.7 Raw Mat. 48 1.0 WIP. 8 5.3 +
2.9 FG. 12
P1 P2+P3 P4
C/O.
0.5
C/O.
0.1
C/O.
0.1
P2
C/T 5.3
C/O 1
Parts# N/A
UT 83
#M 1
#O 5
#S 2 x 12h
WT 660
BS 100%
FTQ 100