Embed Size (px)
Citation preview
The Aarhus School of Business
May 2011
B.Sc. Thesis in Author: Simeon Bogomilov Kostov
Business Administration Academic Advisor: Camila Campos
Department of Economics
Outsourcing and FDI With focus on China and India

1 | P a g e
Table of Contents
1. PROBLEM STATEMENT .................................................................................... 4
1.1 Delimitations ............................................................................................................................. 4
2. THEORETICAL PART ....................................................................................... 5 2.1 What is foreign direct investment?......................................................................................... 5
2.2 Motives for foreign direct investment .................................................................................... 5
2.3 Horizontal FDI ......................................................................................................................... 6
2.4 Vertical FDI ............................................................................................................................ 10
2.4.1 Vertical FDI versus outsourcing ....................................................................................... 12
2.5 Implications of FDI- Technology spillover .......................................................................... 17
3. EMPIRICAL EVIDENCE .................................................................................. 18 3.1 FDI in China and India ......................................................................................................... 18
3.1.1. FDI implications .............................................................................................................. 25
3.2 FDI in China ........................................................................................................................... 25
3.2.1 FDI- Technology spillover in China ................................................................................. 30
3.3. FDI in India ........................................................................................................................... 30
3.3.1 Indian vertical FDI ............................................................................................................ 34
3.3.2 FDI- Technology spillover in India .................................................................................. 36
3.4 Consequences of FDI and Outsourcing ................................................................................ 37
3.4.1 Employment implications of material outsourcing ........................................................... 38
3.4.2 Employment implications of service outsourcing ............................................................. 42
3.4.3 Trade and GDP growth implications of FDI and outsourcing .......................................... 44
3.4.4 Income implications .......................................................................................................... 47
4. CONCLUSION................................................................................................. 53 References ..................................................................................................................................... 56

2 | P a g e
Abstract
Comparing China and India, China takes the leading position in terms of infrastructure thus being
appropriate for production outsourcing whereas India boasts not only with educated labor force but also
with financial and institutional infrastructure and experience and consequently attracting BPO and research
development investments.
Yet, India is not utilizing its labor force sufficiently compared to China hence it is not using its comparative
advantage, that is cheap workers, having an impact on the GDP per capita in those countries.
Moreover, the Chinese trade to GDP ratio was measured to have risen by 38 percent in the period 1990-
2005, valuing 70 percent in 2005, compared to India that had risen by 28 percent in the same period,
showing the greater effects of increasing FDI in China.
Despite the relative specialization of China and India in manufacturing and service sectors, India is behind
in terms of contribution of the sector in which it has a comparative advantage to its GDP and that finding
eliminates the myth of the Indian economy service activities specialization.
The ownership structure of the export oriented enterprises in China and India was found to be quite similar
since foreign investors held the major equities stakes in the companies. For example, Chinese foreign
financed enterprises were found to account for about 60 percent of total imports and exports whereas in
India foreign investors were responsible for half of the exported services (Li and Zhang 2008). And that
means that vertical FDI and outsourcing were important drivers for the exports of the two countries.
A surprising fact is that in 2005, an investment survey showed that the main motivation of the foreign
investor in China was not cheap labor rather than market size and growth, especially for the American firms,
whereas the efficiency seeking investments were carried out by the Asian export-oriented investors.
Considering the ownership structure of the FDI and its implications it was found that the Chinese companies
experienced positive technological spillover from joint ventures and negative from wholly-owned foreign
subsidiaries.
Looking at India, despite the small share of the world FDI flows that India has attracted its FDI flows have
increased in absolute terms by $22,713 or by 9,584 percent since 1990 which is undoubtedly a worth noting
fact.
The foreign multinationals increased the Indian industry productivity by involving in foreign direct
investment since they had the technology and the initiative (they were export-oriented) to greatly increase
their productivity due to the high international competition. They did so, by transferring technology and
production know how to their suppliers and subcontractors.
The employment implications of outsourcing could best be expressed by looking at the American labor
market where despite the negative employment growth in certain industries as a result of material
outsourcing the overall employment was not significantly affected due to growth in other industries.

3 | P a g e
Additionally, employment implication of material and service outsourcing is decreased employment in the
specific outsourced industries, more in the manufacturing than in the service sector, suggesting service
orientation of the developed economies and unemployment growth in the primary manufacturing sectors.
After 1994 the Chinese FDI started declining its contribution share to the GDP leaving greater share to the
trade as another important GDP contributor. In the same time the Indian FDI share has been increasing
ever since the reforms suggesting insufficient trade growth and increasing dependency on foreign investors.
Moreover, while FDI contributed to increasing international trade that was not enough to decrease the
Indian trade deficit and contribute to greater Indian GDP growth as was the case in China.
In the same time, China is experiencing relatively steady increase in its merchandise trade balance whereas
India owes most of its recent trade deficit to its merchandise trade balance. What it is interesting to find is
the current trend of increasing Chinese trade deficit in the service sector while India is experiencing stable
increase in its service trade balance.
In that way, the comparative advantages from a trade perspective of China and India can be confirmed as
being manufacturing activities for China and service activities for India.
In relation to the income inequality implications of outsourcing, India and China were much more affected
by the international demand for labor than the U.S. due to their higher export orientation. Therefore, the
rising income inequalities in the U.S. were related to productivity improvements and focus of the American
economy on high value-adding activities that required more qualified analytical professionals and that had
much greater wages than the lower-educated social stratum.
From the other hand, due to the Chinese export orientation, and according to the factor price equalization
assumption, the Chinese average wage rates have started steadily increasing after the reforms.
Moreover, the Indian and Chinese wage premiums of the skilled employees were also starting to increase but
the income inequalities between them and the lower-educated individuals were not as high as the American
ones in the late 1990s due to pre trade income similarities of the various income groups.
Additionally, it was observed that in the recent years, the gap between the earnings of employees with
secondary school and university degrees has widened and has reached 133 % in 2006 in wage terms,
suggesting the Chinese high labor availability and low wage premiums of the low-skilled groups.
In India after the trade reforms, the same trend was present and the wage premiums of the tertiary-
secondary gap have increased from 0.34 in 1983 to 0.50 in 2004 (measured in logarithmic scale).
Therefore, despite the fact that all working groups have benefited from the increasing international trade,
the high-skilled occupational groups have benefited much more than the others.
4 | P a g e
1. Problem statement
The purpose of this thesis is to point out the determinants and specificities of foreign direct
investment (FDI) and outsourcing in China and India.
What attracted the foreign investors and multinational enterprises in those two countries is beneficial to find
since the FDI and outsourcing are related to trade, international intra-firm trade and trade in intermediate
goods and services, therefore also related to the economic growth of the countries.
Moreover, the implications of the increased outsourcing and investment processes are going to be
researched, not only for the investment-receiving countries but for the investing countries as well.
The direct implications of the investing and outsourcing activities such as technology spillover and
employment issues are going to be analyzed first because they are mostly discussed by politicians and
showed by the media sometimes incompletely and speculatively.
Afterwards, in order to provide a thorough picture of the issue, the indirect implications of FDI and
outsourcing related to income inequality and GDP growth are also going to be provided and analyzed.
To summarize, the purpose of this paper is to analyze the factors that attracted FDI and outsourcing firms in
China and India and to give some recommendations to these countries’ officials how to attract multinationals
and better utilize the investments in order to boost their countries’ economic growth.
1.1 Delimitations
In order to show the advantages of China and India attracting the FDIs, Dunning’s eclectic theory is
going to be used.
In relation to this theory, the main motivators for the different types of investments are going to be explained
and related to the theory’s assumptions in the empirical part of the report.
Researching the vertical FDI and outsourcing a modification of the Heckscher–Ohlin (HO) trade model is
going to be used. This model, developed by Bhagwati et al. 2004, theoretically illustrates the implications of
free trade and worldwide factors of production tradability on countries’ economies.
And despite, the fact that the model provides information for the optimal choice of factors of production,
based on their relative wages, the primary focus of the analysis would not be merely the cost minimization
objectives of the multinational companies. Instead, a broader picture is going to be provided showing the
most important investment motivators of the foreign enterprises and the outsourcing companies.
Additionally, Bhagwati et al. 2004 model is preferred over the original HO-model since it provides
assumptions of outsourcing effects on the countries’ terms of trade.

5 | P a g e
And finally, the income implications of outsourcing could also have been explained with the Grossman-
Rossi-Hansberg paradigm. Yet, what made this paradigm inappropriate for the objectives of this report is the
exclusion of the assumption that certain parts and tasks of the value chain cannot be separated and
outsourced (Grossman and Hansberg 2008) which is inconsistent with the reality since in most of the
developed countries, and U.S in particular, high percentage of the labor force is occupied in the service
industries where the majority of services, i.e. mostly hotel and restaurant services but also surgeries and
educational activities, cannot be outsourced.
Therefore, a broader approach is chosen to tackle the issue of income implications of outsourcing in relation
to Bhagwati et al. 2004 model.
2. Theoretical part
2.1 What is foreign direct investment?
According to the Organization for Economic Cooperation and Development (OECD), which benchmark
is going to be used throughout this report, in order and investment to be considered foreign direct investment
rather than short-term equity investment it is essential that an enterprise has set up long-term relations with
foreign company, provides it with technical assistance and financing, and most importantly, possesses
control rights and equity stake (10% or more)1.
Consequently foreign investing could be considered in case of investing in associate company or taking part
in joint venture, setting up a subsidiary by means of mergers and acquisitions or simply building new
production facilities.
2.2 Motives for foreign direct investment Behrman (1972)2 identified four motives of companies involving in FDI: resource seeking, market
seeking, efficiency seeking and strategic asset or capability seeking.
The resource seeking investors are motivated by their need for cheap resources including human, physical,
technological or organizational resources (Panayides et al. 2002). These resource seeking investors would
utilize these resources for the purpose of increasing the profitability of their home company. Moreover,
multinationals purchase these resources from abroad, i.e. outsourcing, or involve in vertical FDI, that is
going to be discussed later in the thesis.
The market seeking investment is motivated solely by entering new markets and increasing company’s
profits. This type of investment is justified by large market size and purchasing power of the consumers.
1 OECD 1996 2 Quoted in Sung-Hoon Lim, February 2005, ” Foreign investment impact and incentive: a strategic approach to the relationship between the objectives of foreign investment policy and their promotion”, International Business Review, Volume 14, issue , pp.61- 76
6 | P a g e
What make it even more attractive than simple exporting are high transport costs, tariffs, required proximity
to the consumer, i.e. hotels, etc. It is related to horizontal FDI.
The efficiency seeking investment, as the name suggests is motivated by production process efficiencies
improvement. What can characterize this investment is that the investors are interested in forming
partnerships with suppliers or even competitors, i.e. using same distribution network, in in order to benefit
from economies of scale, economies of scope and shared ownership3, i.e. investment risk diversification.
And these types of business relations could easily be related to outsourcing despite the fact that outsourcing
is not related to significant investments.
The last motive for foreign direct investment called strategic asset or capability seeking is quite similar to
resource seeking investments, the main difference is, however, that the company wants to obtain certain
foreign resource not only to improve its efficiency but also to improve the quality of its offering, provide
new features to its product and significantly increase its market share.
In order to generalize, three main purposes of the foreign investment could be summarized- market,
efficiency and resource seeking. Market seeking investment is related to horizontal FDI whereas the resource
and strategic assets or capability seeking to vertical FDI and efficiency seeking to outsourcing.
The financial motivation for initiating market seeking investment is assessed by taking into account the
monetary and opportunity costs of setting up subsidiaries abroad by looking at market size and purchasing
power of the target segment (influenced by economic stability and growth and determined by country’s
income distribution measured by the Gini coefficient). And the objective of efficiency and strategic assets
seeking could be assessed by observing the financial benefits of taking control of cheaper factors of
production that would increase company’s profitability and optimize the production process. Yet, the
possession of factors of production with lower cost does not necessarily mean improved efficiency if there
are not economies of scale present or the productivity of the new plants does not exceed the home plants in a
sufficient amount.
2.3 Horizontal FDI First, looking for the causes of involving in foreign market expansion overseas could be not merely the
company’s profit maximization strategy but also the stagnant domestic demand resulting either from
economic slowdown, i.e. the building industry, or from final position in the product lifecycle curve (maturity
or decline) and new markets available to be entered, i.e. desire for western goods from the former communist
states, for instance.
And due to those motives a company chooses whether to start exporting to a particular country or involve in
foreign investment abroad- horizontal or vertical.
3 http://services.indiabizclub.com/info/types_of_service/foreign_direct_investment-definition of efficiency seeking FDI
7 | P a g e
Horizontal FDI main characteristics are that most of the output of foreign production affiliates is sold in the
foreign country (Markusen 1995), that is market seeking investment, and the company replicates its
productions practices in overseas markets. This option is likely to substitute exporting to the particular
country and avoiding paying high transport costs and bypass any tariffs or custom fees. In that way the
enterprise incurs additional plant fixed costs by giving up from the advantages of centralized production
(economies of scale) and decreases its variable transport costs which were defined as proximity-
concentration tradeoff (Helpman 2006). Nevertheless, companies should be aware of the variability of their
demand since the companies with high operating leverage, that is the ratio of fixed to variable costs, small
changes in sales volume result in large changes in net income (Horngren et al. 2009).
Horizontal investment was considered to be more relevant for industries producing generic products with
low level of research and development costs since the fixed expenses could not entirely be spread over
company’s domestic and foreign production and thereby taking advantage of economies of scale could not be
achieved (Markusen 1995).
Finally, most of the horizontal direct investment was found to occur among countries with similar per capita
incomes, similar relative factor endowments, and relatively low trade barriers (Markusen 1995) which means
that the vertical foreign investment is most likely to be predominant in China and India since they are
sufficiently differentiated economically from the developed countries that are the greatest world investors.
In case that the company’s objectives are to gain market share in foreign market and to avoid transport and
tariff costs it would be much less risky and capital intensively to license the production process to foreign
firms instead of involving in horizontal FDI. What are the circumstances that determine company’s
investment decisions?
An answer to this question could be given by using the Dunning’s eclectic theory. Presented in a Nobel
symposium it provides assumptions for multinational companies’ motivation to choose to involve in
investment abroad rather than choosing the less risky approach of licensing or franchising.
John Dunning presents those assumptions in his paradigm that looks from multinationals internal
perspective.
The hazard of the investment is justified by three major advantages of the market seeking company and the
value of keeping them intact inside the company.
The very benefits were defined to arise from the following: ownership, location and internalization
advantages.
8 | P a g e
The general characterization of the ownership advantage from macroeconomic perspective could be
expressed as the tangible or intangible resources present in a country and available to the industries that
contribute significantly to the companies’ competitive advantage.
An appropriate framework for assessing the ownership advantage of a firm in a selected country could be the
Porter’s diamond of national competitive advantage4 discussing the main determinants of country’s success
in certain type of industry.
According to Porter: “National prosperity is created not inherited. It does not grow out of a country’s
natural endowments, its labor pool, or its interest rates, or its currency value, as classical economists
insist.” Yet, in the real world FDI flows are mainly determine by those factors since they are elements that
differentiate one country from another. Especially, in the case of China, they provide temporary and even
midterm comparative advantage of the economy and the main reason is the Chinese government efforts to
keep the exchange and tax rate at favorable level.
What Porter implies is that economies can prosper if focusing on high value-adding activities. For instance,
if China’s government does not start developing industries focused on innovation it might face serious
budget deficits due to the aging labor force and loss the overall competitiveness of the industry because of
increasing wage rates triggered by limited birth rate and decreased labor supply.
In essence, the factor conditions that predetermine economic growth might change overtime that is why it is
crucial that a focus is put on promoting growing competitiveness of the domestic industries.
Porter concludes that countries’ economic prosperities depends mainly on their ability to innovate and this
process is reinforced by four major fundamentals- factor conditions, demand conditions, related and
supporting industries, firm strategy, structure and rivalry.
Here the factor conditions are not related to abundance of unskilled labor but to skilled employees and basic
and technological infrastructure.
In the Porter’s theory the demand conditions are related to the nature of the home demand however in
developing countries like India the domestic demand is not the element that can foster high-value industry
but the world demand and that becomes increasingly possible because of the information technologies.
The related and supporting industries’ definition provided is “the presence or absence in the nation of
supplier industries and other related industries that are internationally competitive.” Such industries might
be the result of investing activities in a particular country and might also be a motif for increasing such
investments.
The Diamond’s factor Firm strategy, structure and rivalry is meant to describe certain companies
characteristics such as the specificities of their tangible and intangible assets and how those assets are
4 Michael E. Porter (1990), “The competitive advantage of nations”, Harvard Business Review 90211
9 | P a g e
protected by the competition from the government legislations and institutions. There should also some
financial and legal intermediaries should be present in order to facilitate the investment decisions.
In general, the Porter’s perspective is focused on the internal conditions that predetermine domestic industry
international success, i.e. high rivalry in the home industry, however in this report it is assumed that the
framework might also be used in order to show the benefits of countries that have contributed to industries
prosperity that further attract foreign partners to invest in those industries and increase the overall world
intra-industry competitiveness.
The macroeconomic holistic description of ownership advantage, however, does not clearly illustrate in
firm’s perspective why some companies invest abroad whereas others prefer licensing.
By using the definition provided by Markusen (1995) one may grasp the precise characteristic of the
ownership advantage in narrower company’s viewpoint.
“A firm’s ownership advantage could be a product or a production process to which other firms do not have
access, such as patent, blueprint, or trade secret. It could be something intangible, like trademark or
reputation for quality. Whatever its form, the ownership advantage confers some valuable market power or
cost advantage of doing business abroad.”5
An emphasis could be put on companies intangible assets since the hazards of losing those in case of
licensing is greater than the tangible (factors of production resources) assets. In instance of licensing if
inadequate legislation is existing in the host country the licensee firm could jeopardize the brand by using the
licensed intangible process after the contract period and start exporting to the original home market
becoming competition to the former partner. Additionally the licensee might not have the technical
capabilities to carry out the process of developing, for instance, and the quality of the product and the overall
brand integrity can be compromised. It comes as no surprise that the huge IT development firms are involve
in direct investing activities instead of licensing, and this is not only because of quality and security (keeping
the knowhow and previous developments inside the company) but also due to the easy transfer of intangible
assets across the enterprise providing the advantages of economies of scale.
Finally, using intangible resources as a core business capability, for example in development and servicing
companies, does not require high levels of investment compared to setting a production plant abroad.
Location advantage could be explained as the advantage that makes it profitable to produce the good in a
foreign country rather than simply produce it at home and export it to the foreign market (Markusen 1995).
5 James R. Markusen (Spring 1995), “The boundaries of multinational enterprises and the theory of international trade” p.6, The Journal of Economic Perspectives, vol.9, No. 2, pp.169-189
10 | P a g e
The reasons for undertaking investment overseas, as already mentioned, could be avoiding tariffs, quotas or
decreasing transport costs of generic goods and proximity to markets.
However, these reasons might not be sufficient to explain choosing investment initiatives over licensing. The
third aspect of Dunning’s paradigm-internalization should be looked at.
The internalization aspect is observed when the company exploits its product or process internally within the
firm rather than at arm’s length through markets (Markusen 1995). The motivation to do that might arise in
cases of unprofitable licensing resulting from high transaction cost between the trading parties- licensor and
licensee.
The transaction costs are mainly determined by legislative environment and the specificity of the investment.
The host country government efforts to assure the minimization of the hazards of the licensor might
eliminate the opportunistic options of the licensee such as moral hazard-“licensee may divert selling effort to
competing products of other firms or simply shrink” (Markusen 1995) or hold up problem which is mostly
result of incomplete contracts and increased bargaining power of one of the parties. Moreover due to
asymmetric information (that is one of the parties has more or different information than the others prior to
contracting) in certain industries, usually the high-tech industry, might result in hidden characteristics of
production process and hidden actions or intentions of the licensee. In general, the information asymmetries
during contracting influence the transaction cost by affecting its main determinants- searching, contracting,
exchange coordination, monitoring and adaptation costs (Kotler et. al 2009).
An evidence for the companies’ desire to protect their intellectual property intact by keeping all operations
inside the company, even if that means to set up a subsidiary abroad, come the Pol Antrás’ findings for the
specificity of the American intra-firm trade.
The author uses data for 23 manufacturing countries in which the U.S firms have subsidiaries and finds that
“the share of intra-firm trade in total imports is significantly higher, the higher the capital intensity of the
production in the exporting industry”6. In order to explain the phenomenon of choosing to involve in costly
horizontal foreign direct investment instead of licensing Antrás focuses on the difficulties of signing
complete contracts.
2.4 Vertical FDI Vertical FDI is defined as fragmenting the production process geographically by stages of production
(Markusen 1995) and could be associated with international outsourcing. In that way the different stages are
transferred to the location where they are carried out most productively and where the factors of production,
i.e. raw materials and labor, are least expensive.
6Pol Antrás (2003), “Firms, contracts, and trade structure”,Quarterly Journal of Economics
11 | P a g e
The theory developed by Helpman (1984) outlines the conditions that predetermine multinationals to involve
in vertical direct investment. He states that if company allocates certain parts of its production processes
abroad it should have the following features: “((1) there are differentiated products, economies of scale, and
monopolistic competition; and (b) there exist input) that can serve product lines without being located in
their plants.”7
The common sense also brings to mind that if a company wants to maximize its profits and to take advantage
of economies of scale it is more appropriate to search the cheapest suppliers and subcontractors worldwide
and form some kind of long-term partnership with them instead of performing the task themselves and focus
on the task that have absolute advantage on.
Yet, researching the subject, some clarification should be provided.
According the OECD benchmark foreign direct investment is present in case of control rights possessed by
the investing party however the cross-country separation of the value chain, as it is in the multinational
enterprises, could be achieved in some cases by forming partnerships with local companies and suppliers
without involving in major investing activities although high transaction activities could appear. That is why
it is appropriate to point out the difference between international outsourcing and vertical foreign investment.
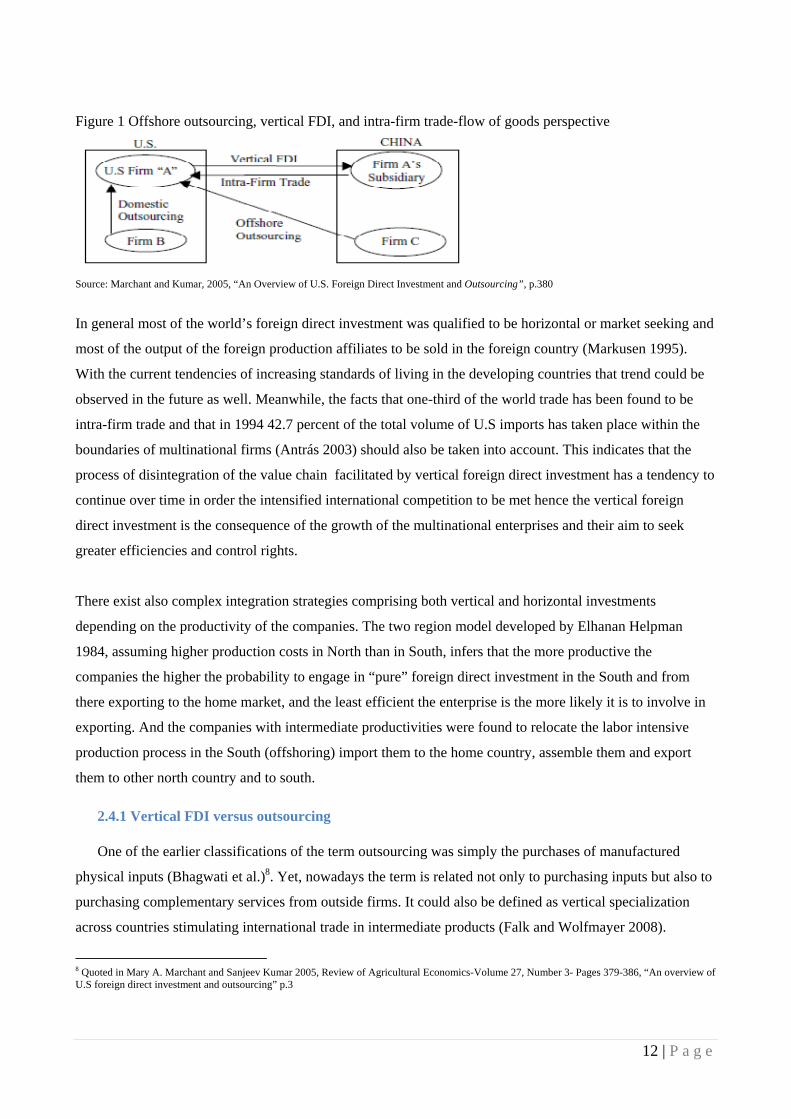
There were found two forms of international outsourcing-offshore outsourcing and vertical FDI (Marchant
and Kumar 2005). Despite that both kinds are aimed at fragmentation of the value chain and getting
advantage of cheap factors of production abroad, only FDI requires that some control rights are present, i.e. a
subsidiary is set up abroad producing some intermediate production parts. Thus it is clear that vertical FDI is
related to international intra-firm trade whereas offshoring to intra-industry trade of intermediate goods and
services. Furthermore, Bernard et al. (2006) quoted in Alfaro and Charlton 2007, using U.S. trade statistics
found that intra-firm trade is higher between rich countries than between rich and poor countries implying
that the activities transferred to China and India would be mostly vertical FDI rather than outsourcing.
This finding could be explained with the previously discussed Dunning’s theory and its internalization
aspect, in particular. What seems to be the case is that the international investors prefer keeping the control
over the entire production process due the risks that might occur in cases of outsourcing. And in order to
provide some quantitative effects of these risks they will be analyzed in the context of the transaction costs
delimitated in the subsequent section.
In the following figure 1 a summary of the offshoring options is provided by giving an example of
companies in two different countries.
7 Ehanan Helpman (Jun., 1984), “ A simple theory of international trade and multinational corporations”p.45, The Journal of Political Economy , Vol.92, No. 3, pp. 451-471
12 | P a g e
Figure 1 Offshore outsourcing, vertical FDI, and intra-firm trade-flow of goods perspective
Source: Marchant and Kumar, 2005, “An Overview of U.S. Foreign Direct Investment and Outsourcing”, p.380
In general most of the world’s foreign direct investment was qualified to be horizontal or market seeking and
most of the output of the foreign production affiliates to be sold in the foreign country (Markusen 1995).
With the current tendencies of increasing standards of living in the developing countries that trend could be
observed in the future as well. Meanwhile, the facts that one-third of the world trade has been found to be
intra-firm trade and that in 1994 42.7 percent of the total volume of U.S imports has taken place within the
boundaries of multinational firms (Antrás 2003) should also be taken into account. This indicates that the
process of disintegration of the value chain facilitated by vertical foreign direct investment has a tendency to
continue over time in order the intensified international competition to be met hence the vertical foreign
direct investment is the consequence of the growth of the multinational enterprises and their aim to seek
greater efficiencies and control rights.
There exist also complex integration strategies comprising both vertical and horizontal investments
depending on the productivity of the companies. The two region model developed by Elhanan Helpman
1984, assuming higher production costs in North than in South, infers that the more productive the
companies the higher the probability to engage in “pure” foreign direct investment in the South and from
there exporting to the home market, and the least efficient the enterprise is the more likely it is to involve in
exporting. And the companies with intermediate productivities were found to relocate the labor intensive
production process in the South (offshoring) import them to the home country, assemble them and export
them to other north country and to south.
2.4.1 Vertical FDI versus outsourcing One of the earlier classifications of the term outsourcing was simply the purchases of manufactured
physical inputs (Bhagwati et al.)8. Yet, nowadays the term is related not only to purchasing inputs but also to
purchasing complementary services from outside firms. It could also be defined as vertical specialization
across countries stimulating international trade in intermediate products (Falk and Wolfmayer 2008).
8 Quoted in Mary A. Marchant and Sanjeev Kumar 2005, Review of Agricultural Economics-Volume 27, Number 3- Pages 379-386, “An overview of U.S foreign direct investment and outsourcing” p.3

13 | P a g e
If we take a look at the Porter’s value chain and observe the ever emerging outsourcing companies we could
conclude that the current trends is towards decomposition of the value chain, both primary and supporting
activities i.e. outbound logistics and customer services. This disintegration is facilitated by the technology
development allowing not only production processes to be outsourced but also services. In that sense, the
definition of service outsourcing set up by the World Trade Organization (WTO) and provided by Bhagwati
et al. 2004 states that it is undertaken in arm’s-length principle where the buyer and the supplier stay in their
respective countries.
This means that companies could involve in backward or vertical integration in the value chain focusing on
the activities they have greatest efficiencies on and, most likely, disintegrate some activities to their suppliers
or subcontractors. It is also possible that companies integrate horizontally which means that they involve in
business relations with their competitors agreeing on common usage of resources or distribution networks,
for instance.
The motives for outsourcing could be summarized by the Agency and Transaction cost theories.
The Agency theory deals with the opportunistic risks coming from employees due to their conflicting
interests with company’s objectives. In order to eliminate such conflicting interests an outsourcing decision
might be taken to control for inefficiency by an outcome based contract (Olsen 2006).
According to the transaction cost theory the offshoring choice is preferred only if the incomplete contracts
and the attached to them searching, contracting, adapting and controlling costs (preventing from adverse
selection and moral hazard of the subcontractors) are lower than the expected cost advantage (Olsen 2006).
Material and service outsourcing The report’s central model that was established on the Heckscher–Ohlin (HO) model theoretically
clarifies the outsourcing implications and is based on the classical two- country, two-factor and two-country
models developed by Bhagwati et al. 1998 and redeveloped by Bhagwati et al. 2004.
Furthermore, the model assumes diminishing returns to factors of production and trade between two
countries (North and South) one of which is cheap labor abundant and the other is cheap labor scarce, and
one good or one industry.
The Bhagwati et al. 2004 modification of the HO- model includes international trade with two-good and
three-factor postulation which seems more realistic since in a country there is not only employees employed
in the labor and capital intensive industries but also in the service industries.
The Bhagwati et al. 2004 model’s assumptions are the following: free trade raises the overall income of each
nation over what it would have had under autarky- in this report this is going to be measured by GDP growth
rates; in the long run trade has no effect on the aggregate number of jobs- measured by employment
statistics; changes in income distribution allows factor prices readjustment to maintain full employment and
14 | P a g e
therefore trade can cause changes in income distribution- the implication of this model assumption is
witnessing of wage disparities between low and high skilled employees which is going to be measured by the
countries’ Gini coefficients.
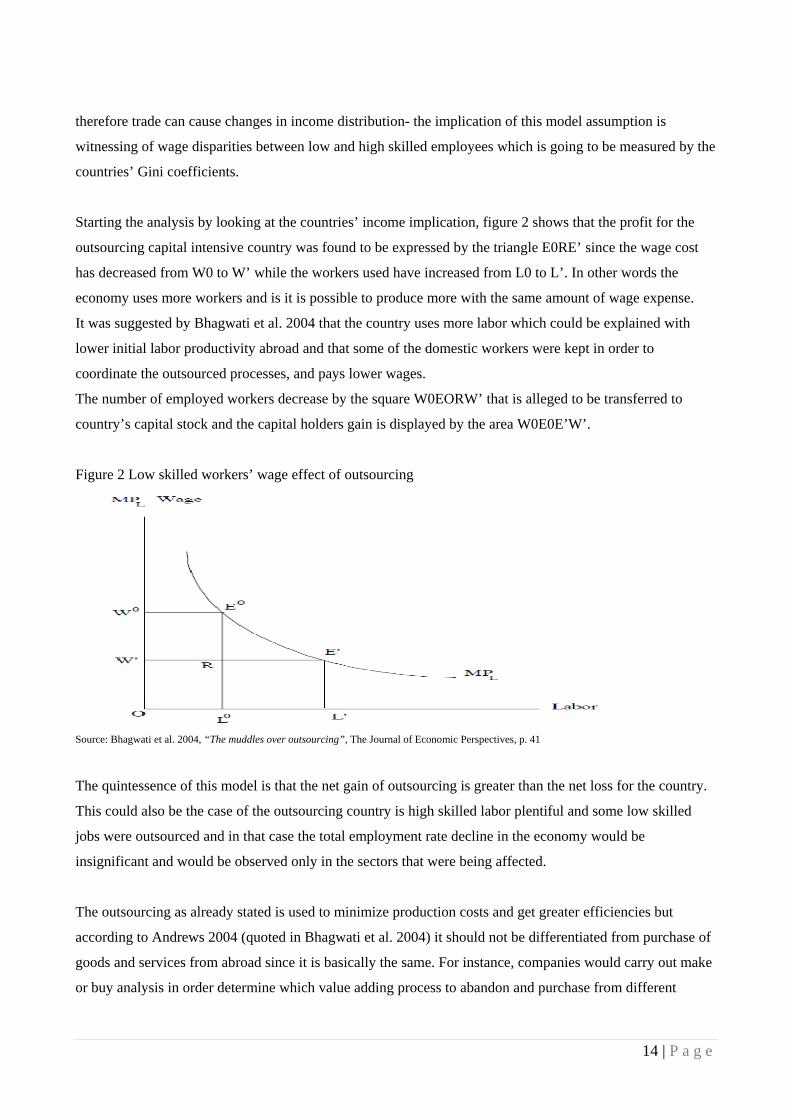
Starting the analysis by looking at the countries’ income implication, figure 2 shows that the profit for the
outsourcing capital intensive country was found to be expressed by the triangle E0RE’ since the wage cost
has decreased from W0 to W’ while the workers used have increased from L0 to L’. In other words the
economy uses more workers and is it is possible to produce more with the same amount of wage expense.
It was suggested by Bhagwati et al. 2004 that the country uses more labor which could be explained with
lower initial labor productivity abroad and that some of the domestic workers were kept in order to
coordinate the outsourced processes, and pays lower wages.
The number of employed workers decrease by the square W0EORW’ that is alleged to be transferred to
country’s capital stock and the capital holders gain is displayed by the area W0E0E’W’.
Figure 2 Low skilled workers’ wage effect of outsourcing
Source: Bhagwati et al. 2004, “The muddles over outsourcing”, The Journal of Economic Perspectives, p. 41
The quintessence of this model is that the net gain of outsourcing is greater than the net loss for the country.
This could also be the case of the outsourcing country is high skilled labor plentiful and some low skilled
jobs were outsourced and in that case the total employment rate decline in the economy would be
insignificant and would be observed only in the sectors that were being affected.
The outsourcing as already stated is used to minimize production costs and get greater efficiencies but
according to Andrews 2004 (quoted in Bhagwati et al. 2004) it should not be differentiated from purchase of
goods and services from abroad since it is basically the same. For instance, companies would carry out make
or buy analysis in order determine which value adding process to abandon and purchase from different
15 | P a g e
producers. The only difference might arise from the ownership of the outsourcing entity which determines
whether the enterprise has set foreign subsidiaries abroad or has directly purchased the intermediate products
from foreign producer. The question that naturally arises is why politicians do nowadays focus that much on
international outsourcing since from an economic point of view it is the same whether a service or a product
is going to be produced at home or oversees since the only thing that matters is the production
competitiveness of the industry which inevitably brings economic growth of the whole economy.
The main issue of outsourcing, though, is not that the different parties lose in the long run but that their gains
differ.
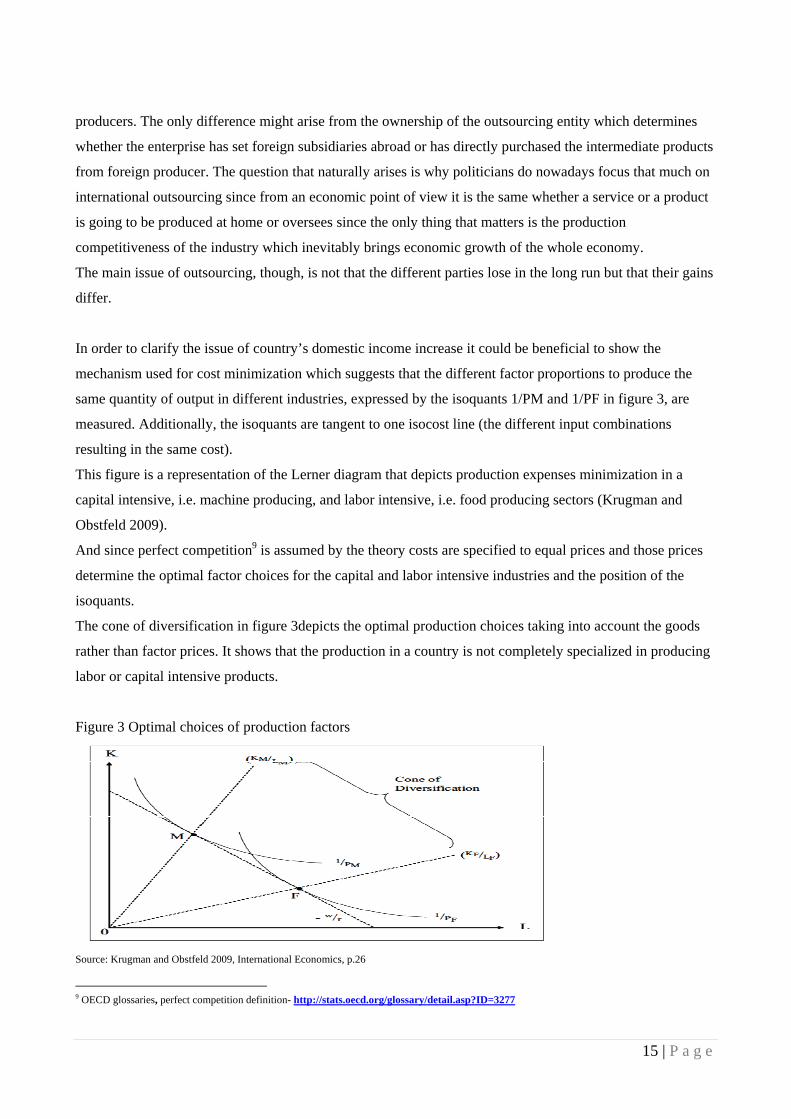
In order to clarify the issue of country’s domestic income increase it could be beneficial to show the
mechanism used for cost minimization which suggests that the different factor proportions to produce the
same quantity of output in different industries, expressed by the isoquants 1/PM and 1/PF in figure 3, are
measured. Additionally, the isoquants are tangent to one isocost line (the different input combinations
resulting in the same cost).
This figure is a representation of the Lerner diagram that depicts production expenses minimization in a
capital intensive, i.e. machine producing, and labor intensive, i.e. food producing sectors (Krugman and
Obstfeld 2009).
And since perfect competition9 is assumed by the theory costs are specified to equal prices and those prices
determine the optimal factor choices for the capital and labor intensive industries and the position of the
isoquants.
The cone of diversification in figure 3depicts the optimal production choices taking into account the goods
rather than factor prices. It shows that the production in a country is not completely specialized in producing
labor or capital intensive products.
Figure 3 Optimal choices of production factors
Source: Krugman and Obstfeld 2009, International Economics, p.26
9 OECD glossaries, perfect competition definition- http://stats.oecd.org/glossary/detail.asp?ID=3277

16 | P a g e
The reasoning for using the market price as an output determinant comes not only from the perfect
competition assumption of equal cost and price but also from the Stolper –Samuelson theorem which states
that in case of incomplete specialization in a country an increase of the market price of a product would
increase the return on the production factor, i.e. capital, relatively more used for the production of that good
and also decrease the return of the lowly-utilized factor (Krugman and Obstfeld 2009). In other words,
international trade reduces the real wage of the scarce factor expressed in terms of any good (McCulloch
2005).
Considering at the distribution of the countries increased GDP the model assumes that since the production
increases, the high skilled workers are more demanded, the high-skilled wage is higher so the low-skilled
wage decreases vis-à-vis the high-skilled wage, though it might increase in real terms.
However, if we assume that outsourcing country is large as it is stated by Bhagwati et al. 2004 that it could
influence the very terms of trade and suggest not necessarily positive results of the outsourcing process.
One major distortion outlined by Bhagwati et al. 2004 describes effect of outsourcing on increasing output.
Depending on the particular sector’s output that increased the outcomes of outsourcing could be different. In
case that the exporting sector output has risen the demand would decline accordingly. And from the supply-
demand relation it is also evident that the output price would decrease hence the country would have to
produce more in order to be able to afford to purchase the same amount of imports as it used to consume. In
that way, a large country would be worse off of increasing outsourcing benefiting solely its export sector.
Yet Bhagwati et al. 2004 also explains the effects of outsourcing on the domestically producing, import
competing sector. It is suggested that if outsourcing is used in order to minimize the production costs of the
domestic import competing sector the foreign imports would decrease and in that way not only is the
population going to experience greater purchasing power but also the trade balance would improve.
However, under those assumptions it is difficult to measure the exact effect on the outsourcing economy
since in most of the cases both export and domestically oriented sectors benefit from outsourcing.
Furthermore, looking at the major outsourcing country the U.S. it could be assumed that the outsourcing
processes benefited primary the export oriented sectors since its trade balance is negative (UNCTAD 2011)
implying that the domestic import substituting sectors have not benefited from the outsourcing processes
enough and the consumers preferred the foreign goods.
Most triggering attention implication of outsourcing expressed by Bhagwati et al. is that if one out of three
sector industries is entirely or partially outsourced abroad, i.e. the American textile industry, the factor prices
would remain relatively the same since they can by utilized to the other sector, i.e. the laid off fabric and
factory workers could be prequalified or employed in the service industry. After increasing the supply of
workers from the outsourced industries the minimal wage might slightly decrease in order full employment
to be sustained. In that way the production cost of the two remaining local industry would decrease they
17 | P a g e
would become more competitive and increase their production. In that way the consumers would benefit
from lower prices not just of the domestic industries but also from the outsourced industries and the overall
country’s productivity, competitiveness and production would increase leading to increased gross domestic
product.
Since the price of the outsourced sector decreases and its factor of production cost decreases relative to the
other two sectors factors of production the holders of those factors would experience increased purchasing
power.
Therefore, it is inferred that under the different model assumptions the overall income of the outsourcing
country is suggested to increase and also the country’s possessors of scarce resources or skills to benefit
more than the people in possession of widely available skills and resources which is line with the simple
supply and demand relationship. And finally, under the HO-model a country economy is going to use its
most available factors of production and in that way increase their return compared to the return in the
countries not specialized in these sectors.
2.5 Implications of FDI- Technology spillover
The vertical FDI is associated with multinational firms which are in possession of significant amount
of intangible assets (Markusen 1995), such as research and development firms, that are appropriate to be
used across borders and in that way minimize their total costs and not only achieve economies of scale but
potentially benefit the foreign industry they enter.
In order to start analyzing the microeconomic perspective, the specific implications of FDI for the local firms
should be examined. The most significant one was associated with the technology transfer resulting from the
interaction with the multinational enterprises entering their home market, yet not always found to be positive
for the domestic companies.
In general there were found two kinds of spillover consequences from multinationals foreign investments
either horizontal direct effect by means of acquisitions or partnerships or indirect vertical spillover (Banri et
al. 2010).
In Banry et al. 2010 it was stated that the vertical technology spillover resulted in a positive total factor
productivity growth in the developed countries while it led to decreased productivity in the developing
countries. This was augmented by the inability of the local companies to keep up with the increasing
technological spinoffs and their significantly high technological gap with the foreign market entrants
experienced declining sales and production efficiencies.

18 | P a g e
One way of the so called “technology spillover” to take place in a foreign country is by means of acquisition
of foreign companies by multinationals that facilitate reorganization of the production processes, provide the
plant with new technology and improve the overall total factor productivity of the industry. However, in this
way of technology transfer the domestic companies are not able to take direct advantage of this process.
Plausible ways that those domestic companies take advantage of the foreign technological edge could be
through vertical integration or by supplier-buyer relations or the so called vertical linkages, through
demonstration effect that stimulates the local firms to update their technologies by demonstrating its
advantages, or through the labor turnover effect where former employees of multinational companies bring
to their new employers their technology operation skills and know how (Saggi 2005).
3. Empirical evidence
3.1 FDI in China and India
Since in the theoretical part the Markusen’s statement was provided saying that the greater part of the
world’s FDI is horizontal in nature, it is relevant to show the importance of this type of investment for the
Chinese and Indian economy.
The market seeking FDI might be observed in the following table 1 which comes as a confirmation for its
quantitative significance over the efficiency seeking investment for the industrialized countries but not for
the developing countries.
Table 1 Regional FDI inflows in dollars
Source: Bartels and Lederer, 2009, “Outsourcing markets in services: International business trends, patterns and emerging issues, and the role of
China and India”, UNIDO, p. 5
As it is seen from the table the major part of the FDI flows were accepted by the developed countries which
implies that due to their factor endowments, legislation and disposable income similarities the type of FDI
was market rather than efficiency seeking.
19 | P a g e
Furthermore, since the Chinese and Indian consumers did not have high purchasing power the foreign
multinationals had greater incentive to focus on the vertical FDI and exporting the intermediate goods in
their home countries rather than initiating market seeking investment.
Another determinant that can explain the difference between horizontal FDI and offshoring in China and
Indian could be the risky environment in these countries. The so called “coherent business climate” was
stated by Bartels and Lederer 2009 as companies’ motivator to do business abroad and it covers not only the
political, economic and social volatility in a country but also the legislative environment setting and profit
repatriation regulations.
Yet, what is more important than the mere political willingness to stimulate FDI inflows is the already
developed physical infrastructure. For instance, according to The Global Competitiveness Report 200910 the
Indian quality of roads index was 3.1 (1 to 7 scale) compared to the Chinese one which was estimated to
value 4.2 for the same year. As it is known, the outsourcing of production processes necessitates high quality
roads in order the goods to be transported from A to B most efficiently. That is why it is not surprising that
the Chinese government has put emphasis on developing transportation system to connect the major
producing cities with the exporting ports.
According to the same report, China also takes the leading position compared to India in terms of quality of
electric supply ranking 5.0 as opposed to 3.2 for India.
The relatively uncomplicated procedures for starting a business in China compared to India are one of the
prerequisites for the higher amounts of labor intensive investments in China.
In order to determine what attracts companies to outsource production in certain countries a valuable tool is
going to be used- the offshore location attractiveness index developed by Kearney 2004.It measures the
countries’ characteristic based on their financial structure, business environment and people skills and
availability that attract different types of FDIs and foreign partners.
According to the above mentioned index the Indian outsourcing environment was much more preferable for
the investors compared with Chinese one. The index for financial structure was 3.72 for India and 3.32 for
China; the index for business environment was 1.31 for India and .93 for China and finally the index for
people skills and availability was 2.09 and 1.36 for China.
The leadership position of India is justified by its experience in business process outsourcing (BPO)
activities, its labor pool consisting 2 million English speaking graduates every year (Kearney 2004) and
legislative environment protecting the intangible assets. From the other hand, the red tape, the IP piracy and
the linguistic competencies of the labor force were among the factors stated as decreasing China’s
outsourcing attracting capabilities (Kearney 2004).
10 http://www.sourcingline.com/outsourcing-location/india/

20 | P a g e
The conclusion of the information provided so far is that China takes the leading position in terms of
infrastructure thus being appropriate for production outsourcing whereas India boasts not only with educated
labor force but also with financial and institutional infrastructure and experience and consequently attracting
BPO and research development investments.
The allowance of free movement of capital, as a symbol of the rising globalization processes, might have
adverse effects for countries with corrupted economic fundamental, i.e. the Asian crisis and the devaluation
of the East Asian currencies. Yet it also increases the productivity of the multinational enterprises since they
require fast transfer of capital from less efficient production facilities to more productive ones passing a
couple of borders in most cases.
This being said, the multinationals investing in the developing countries either invest in short term securities
or just want to take advantage of the less-restrictive labor and capital regulations there.
For instance, the strict labor laws, as a constituent part of the general country’s legislative setting, might
become obstacles for a country towards attracting FDI inflows since the investor would not be able to take
advantage of hiring and firing flexibility that is required to keep their competitive advantage. Likewise, the
World Bank rigidity of employment index11 for India (0-100 scale) was found to be higher -30.0 than the
Chinese one-31.0 in 2010.
And despite the fact that the U.S has the lowest rigidity of employment index the difference between the two
countries could have played an important role of drawing foreign investments into the primary and semi-
specialized industries into these countries where due to the high international competition the contribution
margins are low and every cost minimization option is appraised by the multinational enterprises.
Hence, the rigidity of employment was not an important factor as the low wage rates in those countries to
attracting FDI, but this index could be one of the reasons for the Chinese FDI attractiveness in comparison
with the India.
An explanation for the higher values of FDI in China compared to India could also come from the eased
procedures for setting up a business and the performance of the investments depending on the wage rates,
skills and availability of workers (Porter’s diamond -Firm, structure and rivalry).
Yet, because of the higher risk to do business in China resulting of the unfavorable legislative environment
most of the investors prefer wholly-owned enterprises in order to protect their intangible assets.
11 http://www.sourcingline.com/country-data/rigidity-of-employment/
21 | P a g e
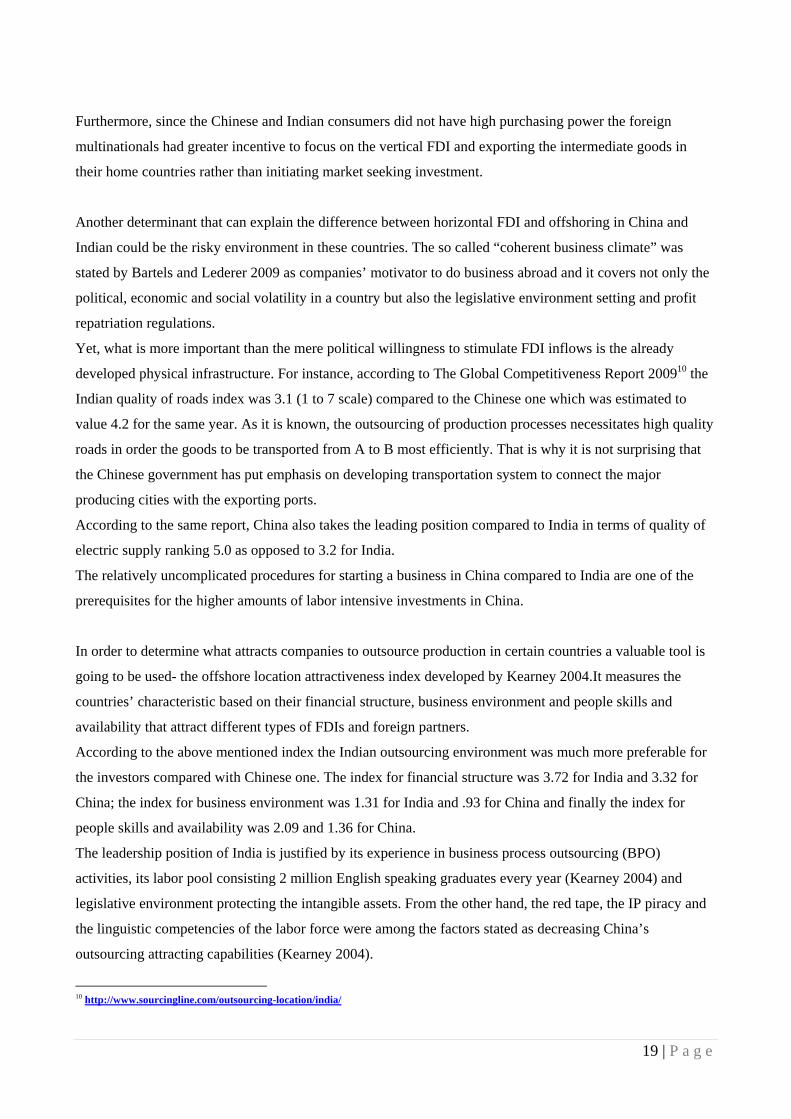
Table 2 Investors’ perception of risk in China and India
Source: Bartel and Lederer 2009, “Outsourcing markets in services: International business trends, patterns and emerging issues, and the role of
China and India”, UNIDO, p. 22
When comparing China and India in terms of their foreign investment objectives it was found by Lo and Liu
2009 that the countries do not differentiate in terms of the specificities of the FDI flows. Excluding the
efficiency seeking native Chinese investments, China’s FDI-GDP ratio was found not to exceed the Indian
one greatly suggesting similar market sizes of the countries. I.e. in the 1990 on average it was found to equal
2.0 percent versus 1.9 for India (Lo and Liu 2008).
That finding is quite reasonable since the population number of the two countries and its average purchasing
power were quite similar in the 1990s. Yet in the 2000 the similarity between the market sizes of the two
countries has started to disappear. The gross domestic product per capita of China in 2008 was reported to
surpass the Indian one by 2.2 (in PPP thousand dollars) despite their relative equality in the 1990s (Qureshi
and Wan 2008). And the reasons for this difference could be found in the structure of the production and
labor force participation.
In China larger part of population works for the industry and service sectors- 27.2 percent and 33.2 percent
respectively compared to India where in those sectors were still employed only 48 percent of the labor force-
14 percent in the industry and 34 percent in the service sectors (CIA 2011). Therefore the 52 percent of the
Indian labor force occupied in the low-income giving agricultural sector influences the overall Indian
purchasing power per capita and minimizes the foreign market seeking investment opportunities.
As stated above larger part of the Chinese labor force is employed in the industry, or in the manufacturing in
particular, that do not involve high skills whereas the processes outsourced to India- R&D processes, call and
service centers require a higher level of education hence lower utilization of the labor force. Moreover, in
2004 about 24 percent of the Indian age group 15-24 was illiterate while the Chinese illiteracy rate in the
same age range was 1 percent in 2006 (Rowthorn 2006) suggesting high wage disparities between the
different income groups and minimum contribution of the illiterate share of the population to the Indian
gross domestic product.
22 | P a g e
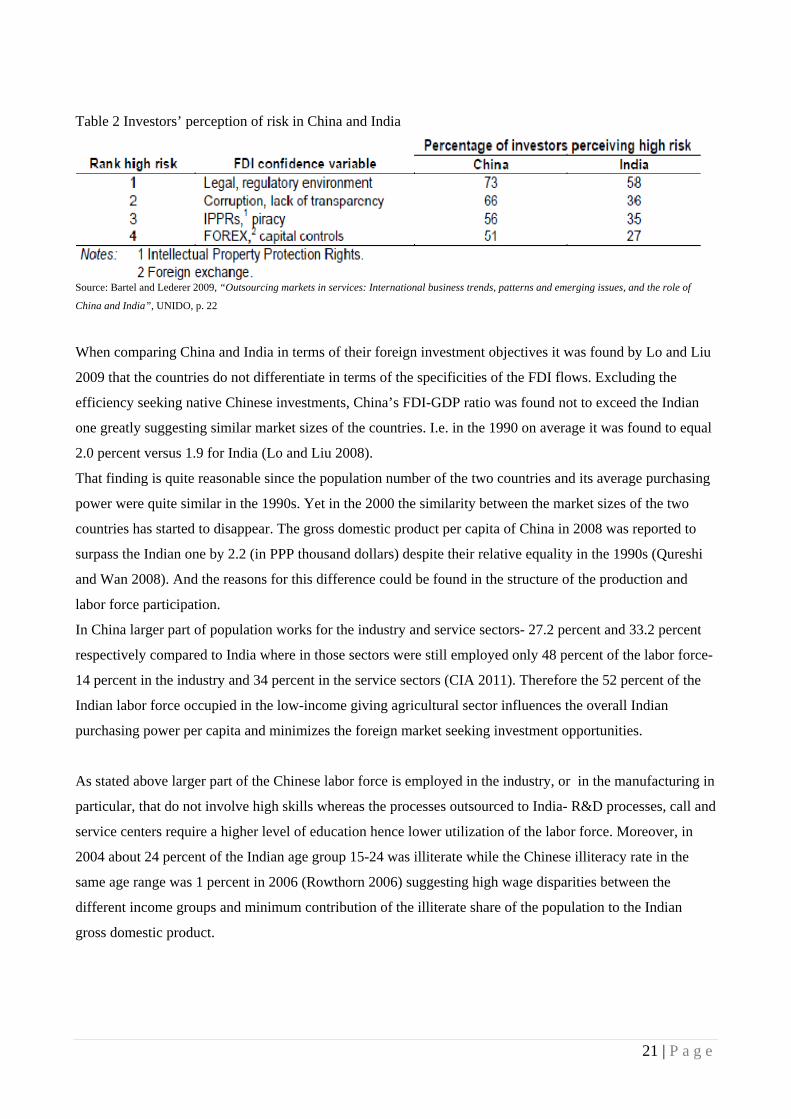
To summarize, it should be noted that India is not utilizing its labor force sufficiently compared to China
hence it is not using its comparative advantage, that is cheap workers, having an impact on the GDP per
capita in those countries as it could be seen in the following figure 4.
Figure 4 GDP per capita in US dollars at current prices and current exchange rate
Source: Author’s calculations and UNCTAD 2011 data
Comparing the countries from export orientation it could be observed that China is also taking the leadership
position. The Chinese trade to GDP ratio was measured to have risen by 38 percent in the period 1990-2005,
valuing 70 percent in 2005, compared to India that had risen by 28 percent in the same period (Qureshi and
Wan 2008). And these findings imply not only governmental efforts and reforms towards trade liberalization
but also an important implication for the countries themselves. Since China is more export oriented it might
also be more vulnerable to foreign demand contractions as observed in the current financial crisis. Yet, it is
also likely due to the high export orientation that China continues increasing its economy and surpasses the
American economy in the near future, according to some analysts.
Now focusing on the direction of the Chinese and Indian exports, a trend was observed in the 1990-2006
period indicating the different developing paths that those countries were undertaking.
The Chinese share of exports to the developed countries was found to have increased by 17 percent in the
period reaching 52 percent of all exports in 2006. In the same time the Indian export share to the developing
countries was found to have decreased in the period by 11 percent (Qureshi and Wan 2008).Moreover, since
the Chinese imports have also increased in the period 1991-1996 by 16 percent and from 2000 to 2006 by 26
percent (UNCTAD 2011) it could be confirmed that the China is becoming a world factory, as suggested by
Qureshi and Wan 2008, benefiting from its cheap factors of production, depreciated currency and favorable
legislative environment.
Since the data of the Chinese imports could be interpreted in several ways, it should be assumed that the
increased value is not triggered by domestic demand increase rather than raw materials and machines
0
500
1000
1500
2000
2500
3000
3500
4000
China
India
23 | P a g e
required for the exporting firm. For instance, in 2010 China was the third largest importing country of
American products with total value of 82 billion dollars12and computer accessories, parts, and peripherals
being the most imported items that were required for the production processes.
These data indicate the ongoing Chinese production specialization and the Indian primary industry overall
lack of competitiveness or general country focus on low value-adding activities.
This suggestion might seem puzzling taking into account the Indian IT specialization. However, since the IT
and BPO sectors constituted insignificant fraction in the Indian economy- 1.4 percent of Indian GDP in
200813, the overall specialization of the Indian economy is much lower compared to the Chinese one.
Shifting the focus to the export type of the two countries one can speculate on the objectives of the foreign
investments flows into the two countries since both countries were attracting mostly export oriented
investments. Therefore, the efficiency seeking vertical FDI and outsourcing activities were most important
for the two countries, as it is going to be shown later on. Yet, before that it is relevant to empirically show
the relative countries’ export specialization.
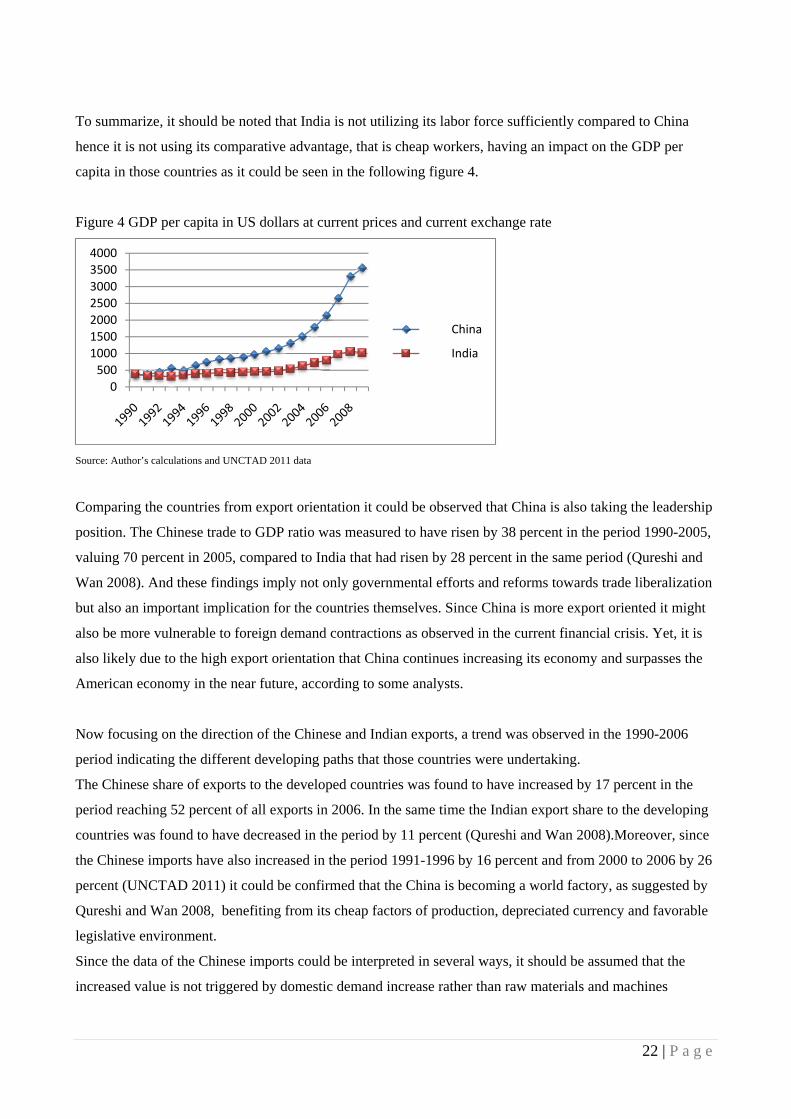
The specialization of India in providing outsourcing services compared to China can be observed from the
following figure 5 showing the export share of services relative to manufacturing exports.
Figure 5 Exports of services to goods ratios
Source: Author’s calculations and UNCTAD 2011 data
What can be inferred by the figure above is the Indian specialization of exporting services compared to
China. And that is due to the ever-increasing development of technologies that allow the value chain of the
multinationals to be separated and the professional capabilities of the Indian professionals to be utilized.
12 http://www.suite101.com/content/top-us-trade-partners-in-2010-a365363 13 http://timesofindia.indiatimes.com/
0
0,1
0,2
0,3
0,4
0,5
0,6
0,7
1990199219941996199820002002200420062008
China
India
24 | P a g e
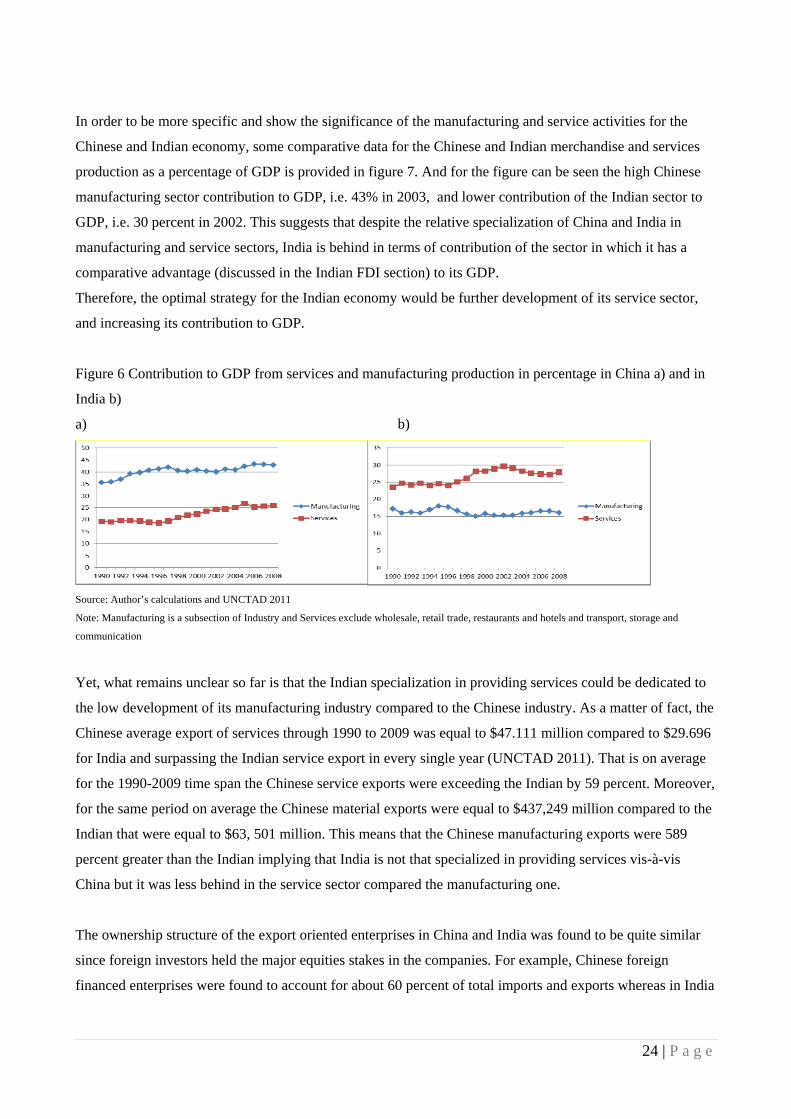
In order to be more specific and show the significance of the manufacturing and service activities for the
Chinese and Indian economy, some comparative data for the Chinese and Indian merchandise and services
production as a percentage of GDP is provided in figure 7. And for the figure can be seen the high Chinese
manufacturing sector contribution to GDP, i.e. 43% in 2003, and lower contribution of the Indian sector to
GDP, i.e. 30 percent in 2002. This suggests that despite the relative specialization of China and India in
manufacturing and service sectors, India is behind in terms of contribution of the sector in which it has a
comparative advantage (discussed in the Indian FDI section) to its GDP.
Therefore, the optimal strategy for the Indian economy would be further development of its service sector,
and increasing its contribution to GDP.
Figure 6 Contribution to GDP from services and manufacturing production in percentage in China a) and in
India b)
a) b)
Source: Author’s calculations and UNCTAD 2011
Note: Manufacturing is a subsection of Industry and Services exclude wholesale, retail trade, restaurants and hotels and transport, storage and
communication
Yet, what remains unclear so far is that the Indian specialization in providing services could be dedicated to
the low development of its manufacturing industry compared to the Chinese industry. As a matter of fact, the
Chinese average export of services through 1990 to 2009 was equal to $47.111 million compared to $29.696
for India and surpassing the Indian service export in every single year (UNCTAD 2011). That is on average
for the 1990-2009 time span the Chinese service exports were exceeding the Indian by 59 percent. Moreover,
for the same period on average the Chinese material exports were equal to $437,249 million compared to the
Indian that were equal to $63, 501 million. This means that the Chinese manufacturing exports were 589
percent greater than the Indian implying that India is not that specialized in providing services vis-à-vis
China but it was less behind in the service sector compared the manufacturing one.
The ownership structure of the export oriented enterprises in China and India was found to be quite similar
since foreign investors held the major equities stakes in the companies. For example, Chinese foreign
financed enterprises were found to account for about 60 percent of total imports and exports whereas in India

25 | P a g e
foreign investors were responsible for half of the exported services (Li and Zhang 2008). And that means
that vertical FDI and outsourcing were important drivers for the exports of the two countries.
3.1.1. FDI implications The greatest implication from FDI was the capital inflows that stimulated the growth of the industries.
This implication was most noteworthy for China since due to its central planning system and inefficient
allocation of capital the industries were not able to develop. Besides, foreign management ensured that the
production process was optimized and the redundant labor was laid off. Moreover, the productivity increase
of the industries was mostly influenced by the so called “technological spillover” or the technological
transfer from the foreign companies to their Chinese and Indian subsidiaries.
3.2 FDI in China The political deeds that allowed FDI were initiated in 1978 as part of market-oriented reforms (Prasad
and Wei 2005). The setting up of the so called special economic zones was the first driver for foreign
nationals to start investing in China. In these zones foreign investment was stimulated with tax incentive, i.e.
“tax vacations”, and some basic infrastructure was built. And due to those reforms the China’s share of the
world trade was reported to have increased tremendously, from one percent in the 1990s to six percent in
2004, compared to India which share have grown from 0.5 percent to 1 percent in the same period (Qureshi
and Wan 2008).
Looking at table 3 it could be seen that despite the Indian larger share of the world trade in the base year the
Chinese government efficient reforms have made the country outdo India by 4 percent in 2002.
Table 3 China and India’s share of world trade
Note: The base year for China is 1953 and for India it is 1948
Source: Lardy 2003, “Trade liberalization and its role in Chinese economic growth”, IMF p. 2
Before looking at the FDI origin countries it is important to remark that some portion of the measured FDI
does not originate from foreign investors but from local Chinese entrepreneurs taking advantage of the
foreign investors’ tax incentives by carrying their investments from abroad. The so called “round tripping”
problem (Prasad and Wei 2005) does not allow to precisely measure the flows of foreign investment in
China.
26 | P a g e
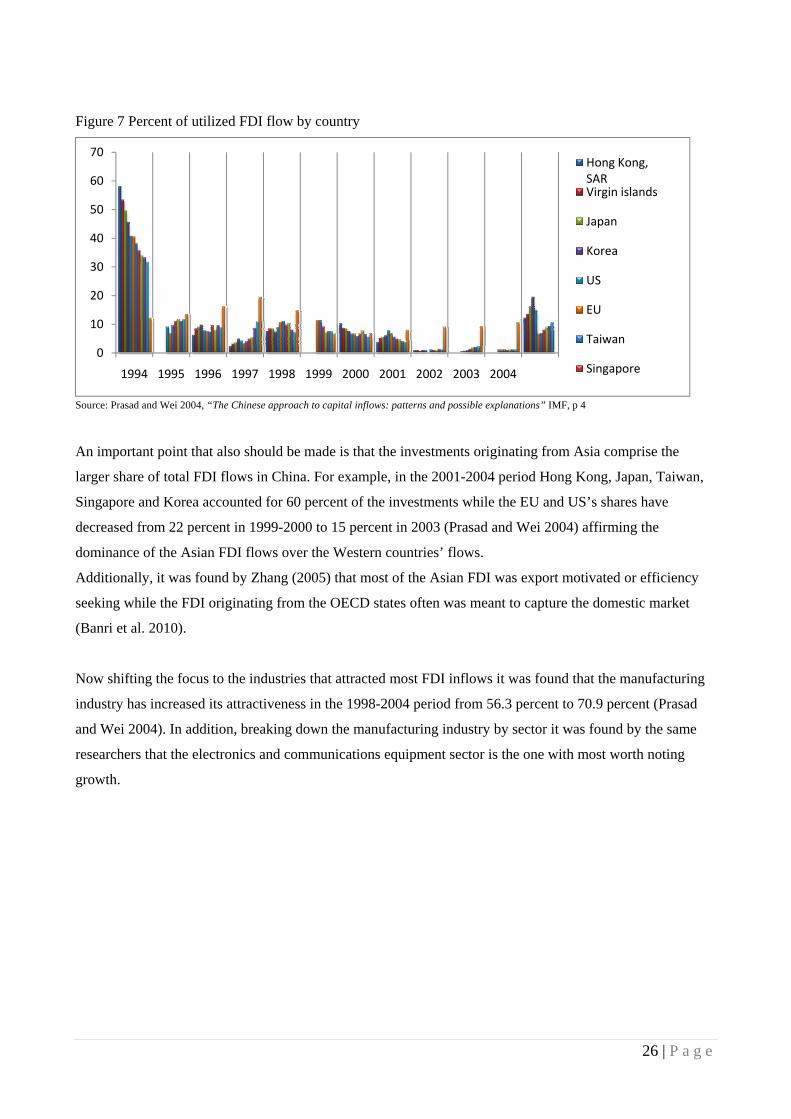
Figure 7 Percent of utilized FDI flow by country
Source: Prasad and Wei 2004, “The Chinese approach to capital inflows: patterns and possible explanations” IMF, p 4
An important point that also should be made is that the investments originating from Asia comprise the
larger share of total FDI flows in China. For example, in the 2001-2004 period Hong Kong, Japan, Taiwan,
Singapore and Korea accounted for 60 percent of the investments while the EU and US’s shares have
decreased from 22 percent in 1999-2000 to 15 percent in 2003 (Prasad and Wei 2004) affirming the
dominance of the Asian FDI flows over the Western countries’ flows.
Additionally, it was found by Zhang (2005) that most of the Asian FDI was export motivated or efficiency
seeking while the FDI originating from the OECD states often was meant to capture the domestic market
(Banri et al. 2010).
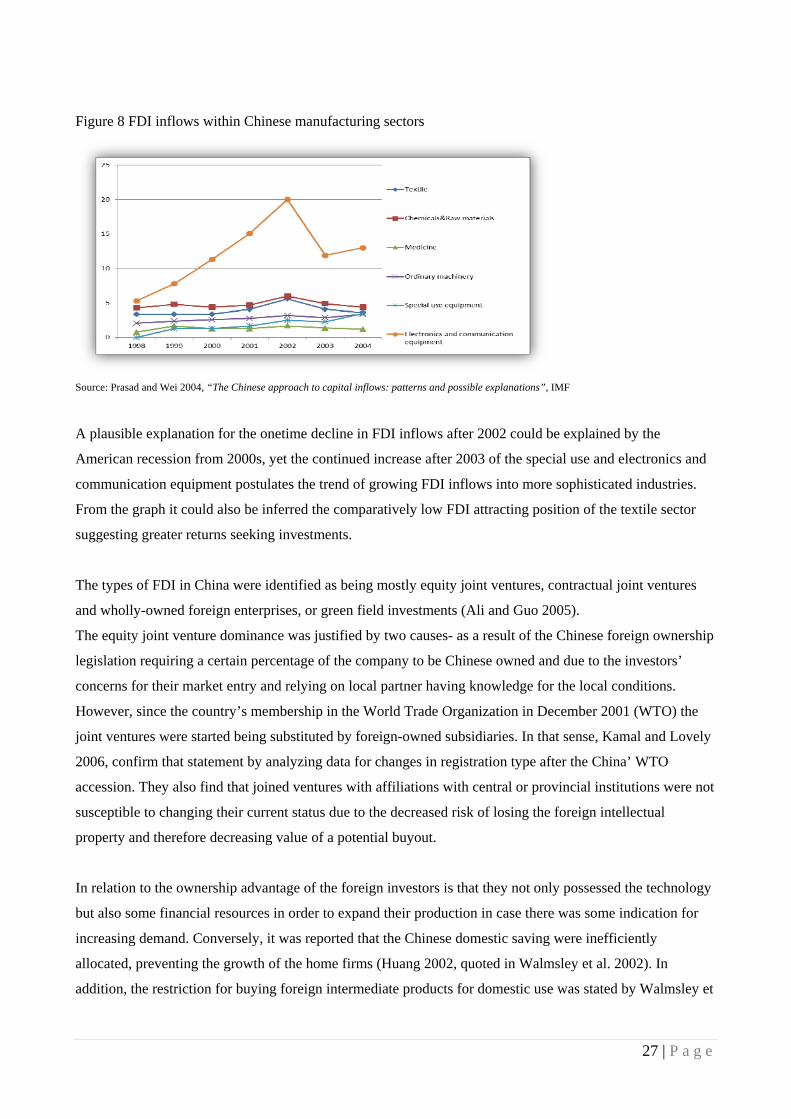
Now shifting the focus to the industries that attracted most FDI inflows it was found that the manufacturing
industry has increased its attractiveness in the 1998-2004 period from 56.3 percent to 70.9 percent (Prasad
and Wei 2004). In addition, breaking down the manufacturing industry by sector it was found by the same
researchers that the electronics and communications equipment sector is the one with most worth noting
growth.
0
10
20
30
40
50
60
70
1994 1995 1996 1997 1998 1999 2000 2001 2002 2003 2004
Hong Kong, SARVirgin islands
Japan
Korea
US
EU
Taiwan
Singapore
27 | P a g e
Figure 8 FDI inflows within Chinese manufacturing sectors
Source: Prasad and Wei 2004, “The Chinese approach to capital inflows: patterns and possible explanations”, IMF
A plausible explanation for the onetime decline in FDI inflows after 2002 could be explained by the
American recession from 2000s, yet the continued increase after 2003 of the special use and electronics and
communication equipment postulates the trend of growing FDI inflows into more sophisticated industries.
From the graph it could also be inferred the comparatively low FDI attracting position of the textile sector
suggesting greater returns seeking investments.
The types of FDI in China were identified as being mostly equity joint ventures, contractual joint ventures
and wholly-owned foreign enterprises, or green field investments (Ali and Guo 2005).
The equity joint venture dominance was justified by two causes- as a result of the Chinese foreign ownership
legislation requiring a certain percentage of the company to be Chinese owned and due to the investors’
concerns for their market entry and relying on local partner having knowledge for the local conditions.
However, since the country’s membership in the World Trade Organization in December 2001 (WTO) the
joint ventures were started being substituted by foreign-owned subsidiaries. In that sense, Kamal and Lovely
2006, confirm that statement by analyzing data for changes in registration type after the China’ WTO
accession. They also find that joined ventures with affiliations with central or provincial institutions were not
susceptible to changing their current status due to the decreased risk of losing the foreign intellectual
property and therefore decreasing value of a potential buyout.
In relation to the ownership advantage of the foreign investors is that they not only possessed the technology
but also some financial resources in order to expand their production in case there was some indication for
increasing demand. Conversely, it was reported that the Chinese domestic saving were inefficiently
allocated, preventing the growth of the home firms (Huang 2002, quoted in Walmsley et al. 2002). In
addition, the restriction for buying foreign intermediate products for domestic use was stated by Walmsley et
28 | P a g e
al. 2002 to have put the local automobile industry in an uncompetitive position relative to the foreign
affiliates located in China. In case that that policy was not present, one might speculate that foreign investors
would have chosen another mode of entry in the automotive industry such as subcontracting that could have
benefited them by economies of scale and low investment risk.
The, main focus of multinationals was the primary industries due to the cheap labor force abundance present
there. The areas that FDI was mostly carried out were in the eastern coastal provinces and that is explained
by the special economic zones set up there and the better infrastructure present.
In addition, due to the western objective of gaining market access it was evident that the most investments
were carried out in the big cities such as Shanghai, Beijing and Shenzhen (Ali and Guo 2005).
It was found that Chinese market growth of eight percent per year since 1980 has a relationship with market
seeking FDI. Liu et al. (1997), quoted in (Ali and Guo 2005) has concluded that in the period 1978-1992 the
economic growth was the fourth factor contributing to investment inflows into China.
Another determinant of the FDI inflows into China was found to be the cultural similarity and geographical
proximity between some of the investors and the locations they are investing in. For instance, the Taiwanese
investors were in investing in the neighboring Fujian province whereas the Hong Kong investors were
investing in Guangdong province (Ali and Guo 2005).
In Dunning’s paradigm context a survey was carried out by Shaukat Ali and Wei Guo investigating the
location advantages of China that attracted the foreign investors. The general finding of this survey was that
the market size and economic growth of the province attracted most foreign investors and this comes as no
surprise since horizontal foreign direct investment in most cases is market seeking whereas vertical FDI or
outsourcing is used to take advantage of cheap factors of production and in the case of China it is related to
forming partnerships with local producer rather than investments.
Additionally, it was stated that the market size was the most important factor, especially for the American
firms, whereas the efficiency seeking investments were carried out by the Asian export oriented investors.
The respondents were large and medium size companies, four American, four from Hong Kong, three from
Taiwan and Germany, two from Japan and Netherlands and one from France, Switzerland, Korea and
Poland.
29 | P a g e
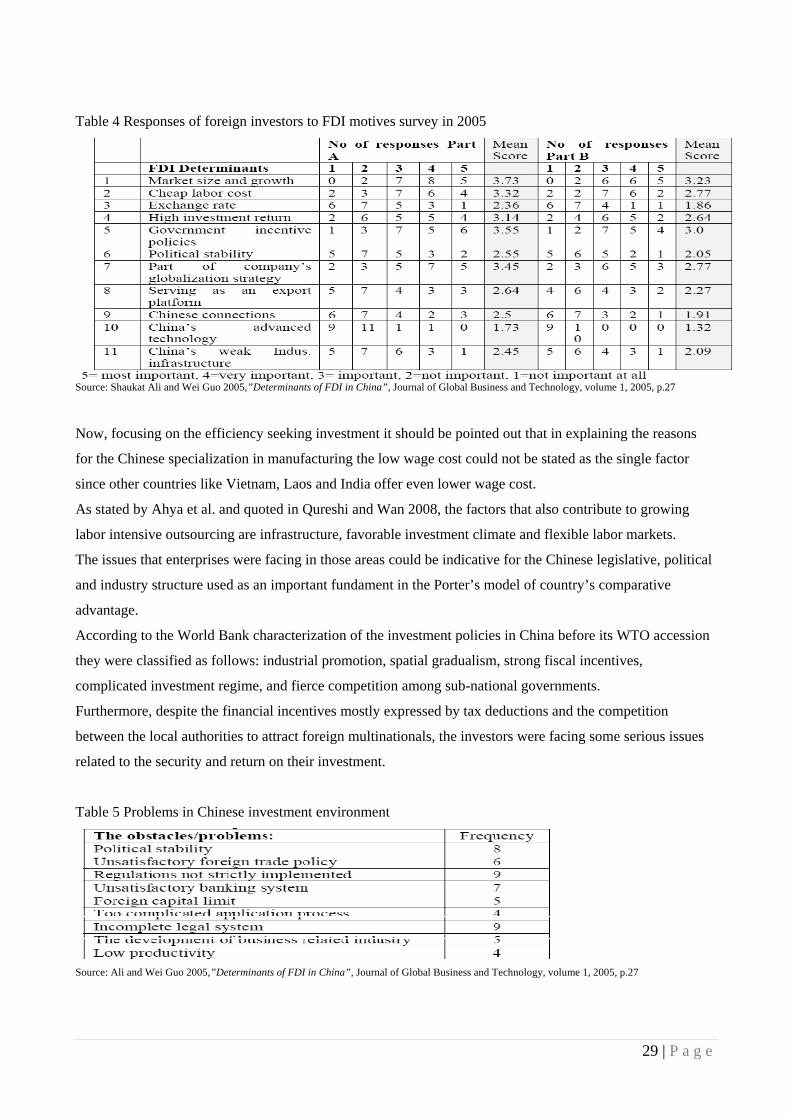
Table 4 Responses of foreign investors to FDI motives survey in 2005
Source: Shaukat Ali and Wei Guo 2005,”Determinants of FDI in China”, Journal of Global Business and Technology, volume 1, 2005, p.27
Now, focusing on the efficiency seeking investment it should be pointed out that in explaining the reasons
for the Chinese specialization in manufacturing the low wage cost could not be stated as the single factor
since other countries like Vietnam, Laos and India offer even lower wage cost.
As stated by Ahya et al. and quoted in Qureshi and Wan 2008, the factors that also contribute to growing
labor intensive outsourcing are infrastructure, favorable investment climate and flexible labor markets.
The issues that enterprises were facing in those areas could be indicative for the Chinese legislative, political
and industry structure used as an important fundament in the Porter’s model of country’s comparative
advantage.
According to the World Bank characterization of the investment policies in China before its WTO accession
they were classified as follows: industrial promotion, spatial gradualism, strong fiscal incentives,
complicated investment regime, and fierce competition among sub-national governments.
Furthermore, despite the financial incentives mostly expressed by tax deductions and the competition
between the local authorities to attract foreign multinationals, the investors were facing some serious issues
related to the security and return on their investment.
Table 5 Problems in Chinese investment environment
Source: Ali and Wei Guo 2005,”Determinants of FDI in China”, Journal of Global Business and Technology, volume 1, 2005, p.27
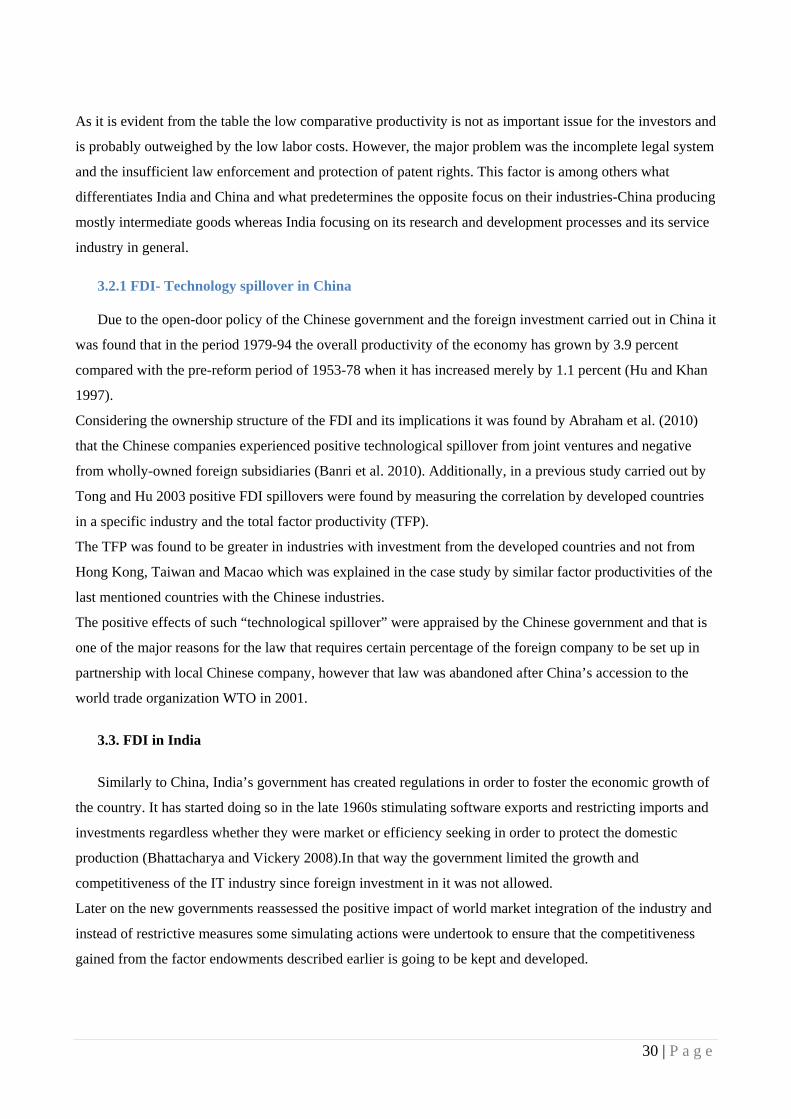
30 | P a g e
As it is evident from the table the low comparative productivity is not as important issue for the investors and
is probably outweighed by the low labor costs. However, the major problem was the incomplete legal system
and the insufficient law enforcement and protection of patent rights. This factor is among others what
differentiates India and China and what predetermines the opposite focus on their industries-China producing
mostly intermediate goods whereas India focusing on its research and development processes and its service
industry in general.
3.2.1 FDI- Technology spillover in China Due to the open-door policy of the Chinese government and the foreign investment carried out in China it
was found that in the period 1979-94 the overall productivity of the economy has grown by 3.9 percent
compared with the pre-reform period of 1953-78 when it has increased merely by 1.1 percent (Hu and Khan
1997).
Considering the ownership structure of the FDI and its implications it was found by Abraham et al. (2010)
that the Chinese companies experienced positive technological spillover from joint ventures and negative
from wholly-owned foreign subsidiaries (Banri et al. 2010). Additionally, in a previous study carried out by
Tong and Hu 2003 positive FDI spillovers were found by measuring the correlation by developed countries
in a specific industry and the total factor productivity (TFP).
The TFP was found to be greater in industries with investment from the developed countries and not from
Hong Kong, Taiwan and Macao which was explained in the case study by similar factor productivities of the
last mentioned countries with the Chinese industries.
The positive effects of such “technological spillover” were appraised by the Chinese government and that is
one of the major reasons for the law that requires certain percentage of the foreign company to be set up in
partnership with local Chinese company, however that law was abandoned after China’s accession to the
world trade organization WTO in 2001.
3.3. FDI in India
Similarly to China, India’s government has created regulations in order to foster the economic growth of
the country. It has started doing so in the late 1960s stimulating software exports and restricting imports and
investments regardless whether they were market or efficiency seeking in order to protect the domestic
production (Bhattacharya and Vickery 2008).In that way the government limited the growth and
competitiveness of the IT industry since foreign investment in it was not allowed.
Later on the new governments reassessed the positive impact of world market integration of the industry and
instead of restrictive measures some simulating actions were undertook to ensure that the competitiveness
gained from the factor endowments described earlier is going to be kept and developed.
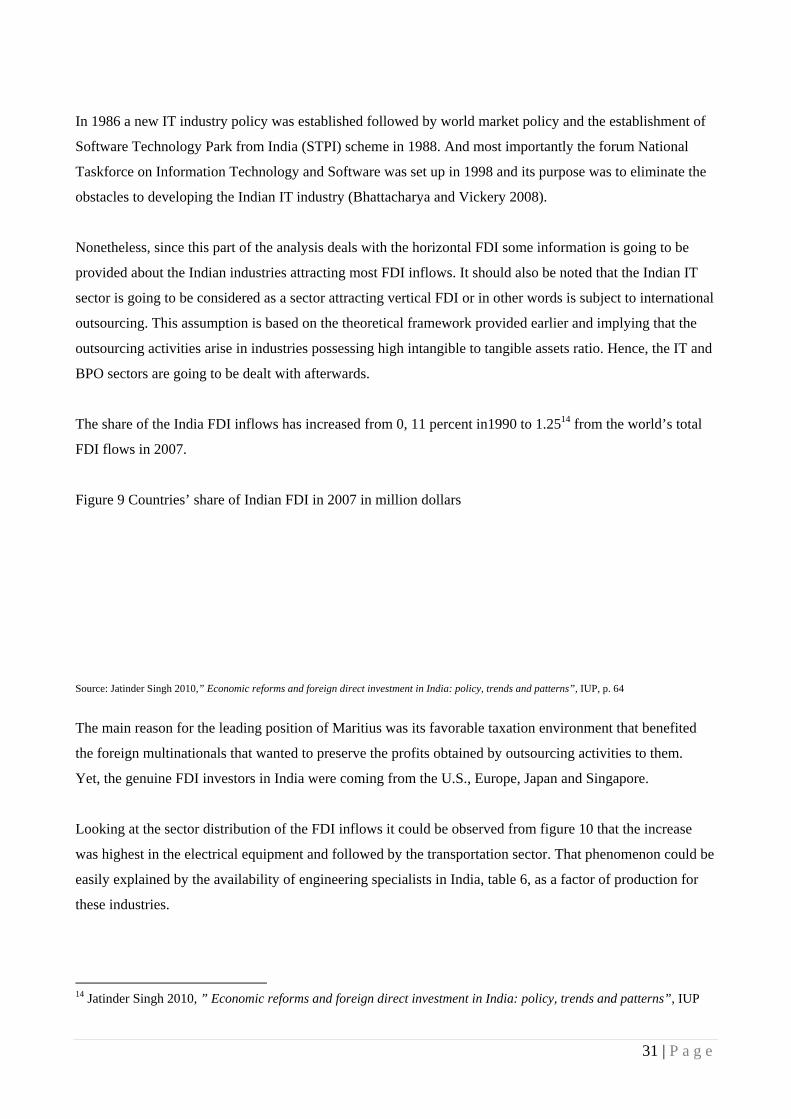
31 | P a g e
In 1986 a new IT industry policy was established followed by world market policy and the establishment of
Software Technology Park from India (STPI) scheme in 1988. And most importantly the forum National
Taskforce on Information Technology and Software was set up in 1998 and its purpose was to eliminate the
obstacles to developing the Indian IT industry (Bhattacharya and Vickery 2008).
Nonetheless, since this part of the analysis deals with the horizontal FDI some information is going to be
provided about the Indian industries attracting most FDI inflows. It should also be noted that the Indian IT
sector is going to be considered as a sector attracting vertical FDI or in other words is subject to international
outsourcing. This assumption is based on the theoretical framework provided earlier and implying that the
outsourcing activities arise in industries possessing high intangible to tangible assets ratio. Hence, the IT and
BPO sectors are going to be dealt with afterwards.
The share of the India FDI inflows has increased from 0, 11 percent in1990 to 1.2514 from the world’s total
FDI flows in 2007.
Figure 9 Countries’ share of Indian FDI in 2007 in million dollars
Source: Jatinder Singh 2010,” Economic reforms and foreign direct investment in India: policy, trends and patterns”, IUP, p. 64
The main reason for the leading position of Maritius was its favorable taxation environment that benefited
the foreign multinationals that wanted to preserve the profits obtained by outsourcing activities to them.
Yet, the genuine FDI investors in India were coming from the U.S., Europe, Japan and Singapore.
Looking at the sector distribution of the FDI inflows it could be observed from figure 10 that the increase
was highest in the electrical equipment and followed by the transportation sector. That phenomenon could be
easily explained by the availability of engineering specialists in India, table 6, as a factor of production for
these industries.
14 Jatinder Singh 2010, ” Economic reforms and foreign direct investment in India: policy, trends and patterns”, IUP
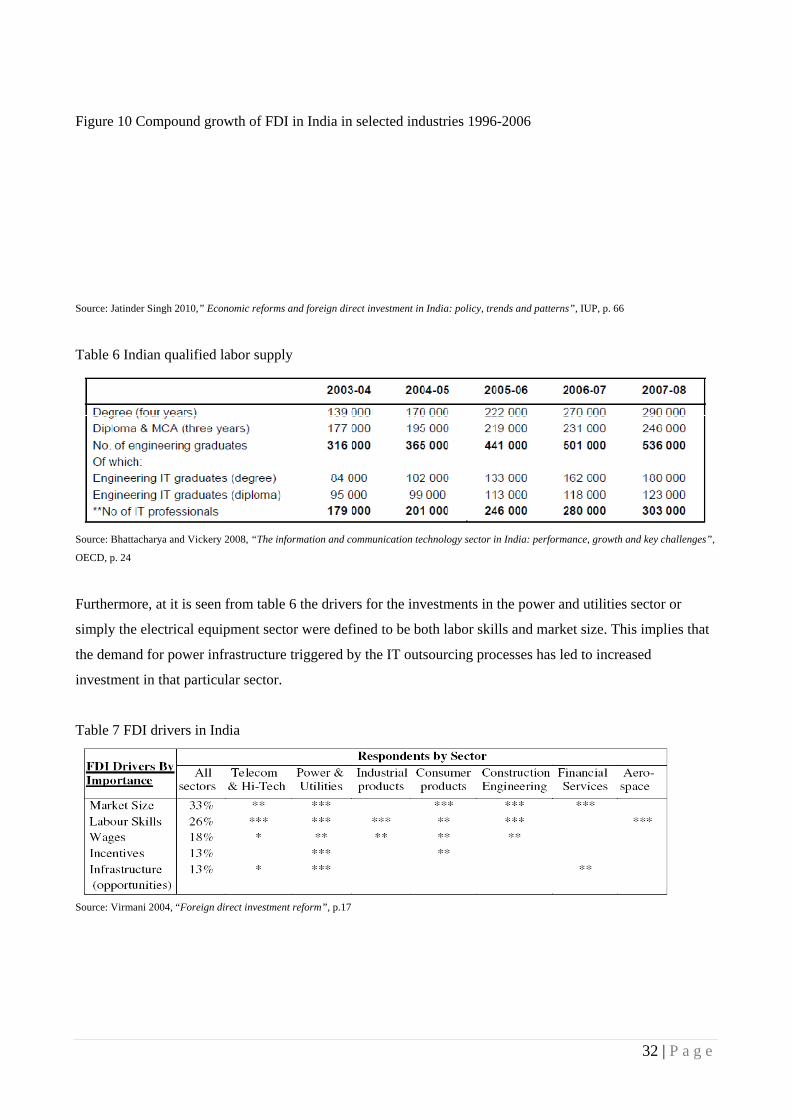
32 | P a g e
Figure 10 Compound growth of FDI in India in selected industries 1996-2006
Source: Jatinder Singh 2010,” Economic reforms and foreign direct investment in India: policy, trends and patterns”, IUP, p. 66
Table 6 Indian qualified labor supply
Source: Bhattacharya and Vickery 2008, “The information and communication technology sector in India: performance, growth and key challenges”,
OECD, p. 24
Furthermore, at it is seen from table 6 the drivers for the investments in the power and utilities sector or
simply the electrical equipment sector were defined to be both labor skills and market size. This implies that
the demand for power infrastructure triggered by the IT outsourcing processes has led to increased
investment in that particular sector.
Table 7 FDI drivers in India
Source: Virmani 2004, “Foreign direct investment reform”, p.17
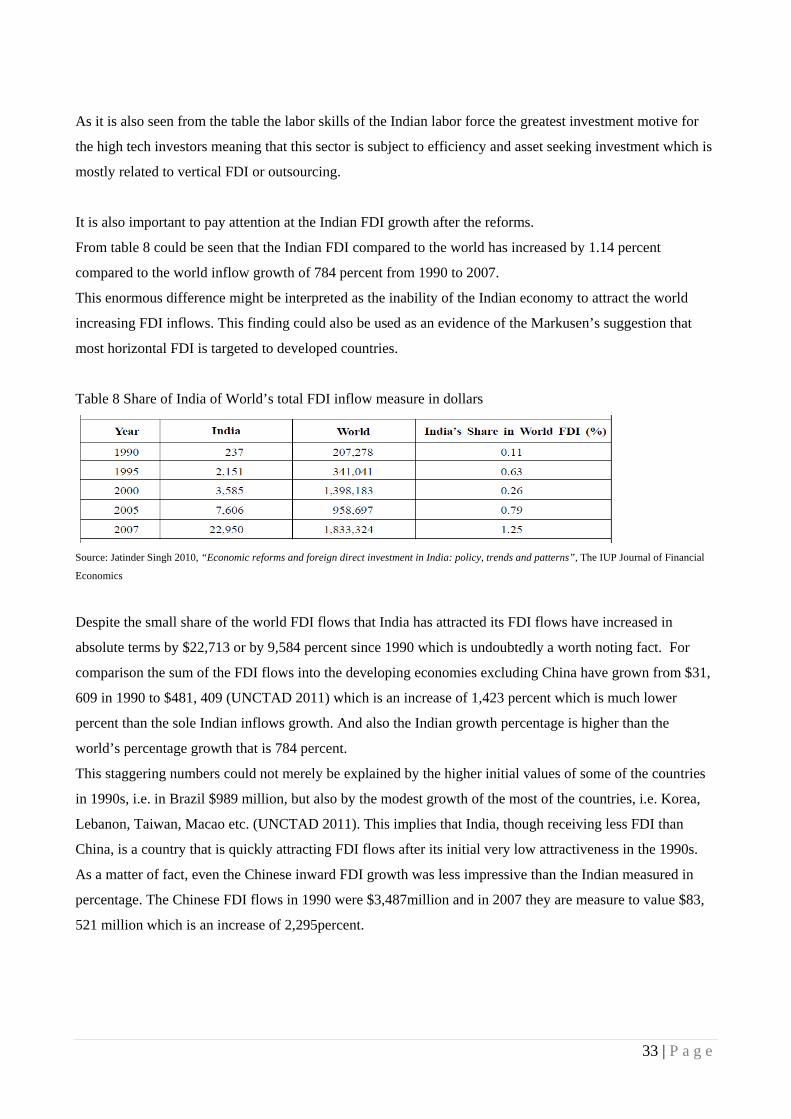
33 | P a g e
As it is also seen from the table the labor skills of the Indian labor force the greatest investment motive for
the high tech investors meaning that this sector is subject to efficiency and asset seeking investment which is
mostly related to vertical FDI or outsourcing.
It is also important to pay attention at the Indian FDI growth after the reforms.
From table 8 could be seen that the Indian FDI compared to the world has increased by 1.14 percent
compared to the world inflow growth of 784 percent from 1990 to 2007.
This enormous difference might be interpreted as the inability of the Indian economy to attract the world
increasing FDI inflows. This finding could also be used as an evidence of the Markusen’s suggestion that
most horizontal FDI is targeted to developed countries.
Table 8 Share of India of World’s total FDI inflow measure in dollars
Source: Jatinder Singh 2010, “Economic reforms and foreign direct investment in India: policy, trends and patterns”, The IUP Journal of Financial
Economics
Despite the small share of the world FDI flows that India has attracted its FDI flows have increased in
absolute terms by $22,713 or by 9,584 percent since 1990 which is undoubtedly a worth noting fact. For
comparison the sum of the FDI flows into the developing economies excluding China have grown from $31,
609 in 1990 to $481, 409 (UNCTAD 2011) which is an increase of 1,423 percent which is much lower
percent than the sole Indian inflows growth. And also the Indian growth percentage is higher than the
world’s percentage growth that is 784 percent.
This staggering numbers could not merely be explained by the higher initial values of some of the countries
in 1990s, i.e. in Brazil $989 million, but also by the modest growth of the most of the countries, i.e. Korea,
Lebanon, Taiwan, Macao etc. (UNCTAD 2011). This implies that India, though receiving less FDI than
China, is a country that is quickly attracting FDI flows after its initial very low attractiveness in the 1990s.
As a matter of fact, even the Chinese inward FDI growth was less impressive than the Indian measured in
percentage. The Chinese FDI flows in 1990 were $3,487million and in 2007 they are measure to value $83,
521 million which is an increase of 2,295percent.

34 | P a g e
And finally, what can be inferred by the table is that India has increased its share from the world FDI quite
substantially and the period when largest growth was observed was 2005-2007 when the FDI flows increased
by 202 percent.
In order to perceive the development of the inward FDI into India figure 11 could be observed.
Figure 11 FDI inflows to India
Source: Marin, Anabel and Sasidharan, Subash 2008, “The heterogeneity of the MNC' subsidiaries and technology spillovers: explaining positive and
negative effects in emerging economies”, UNU-MERIT, p.11
3.3.1 Indian vertical FDI The Indian vertical FDI can be observed mostly in the IT and BPO sector since those sectors were facing
insignificant domestic demand and horizontal FDI could not have been justified by any means. Instead, those
sectors owed their rapid development to the efficiency seeking and export oriented investments.
In order to show which Indian service sectors increased their exports in comparison to the Chinese, figure 12
can be observed. And from the figure it could be seen that the exports of Indian computer and information
services (mostly related to vertical FDI) and financial services (related to BPO) have increased significantly
in the 1997-2008 period. Yet, what it is even more intriguing is that the Chinese computer and information
services export growth. Moreover, in 2008 the Chinese computer and information service exports were
greater in amount than the Indian communication and financial service exports, which suggests that China is
slowly becoming an Indian competitor in the international service market.
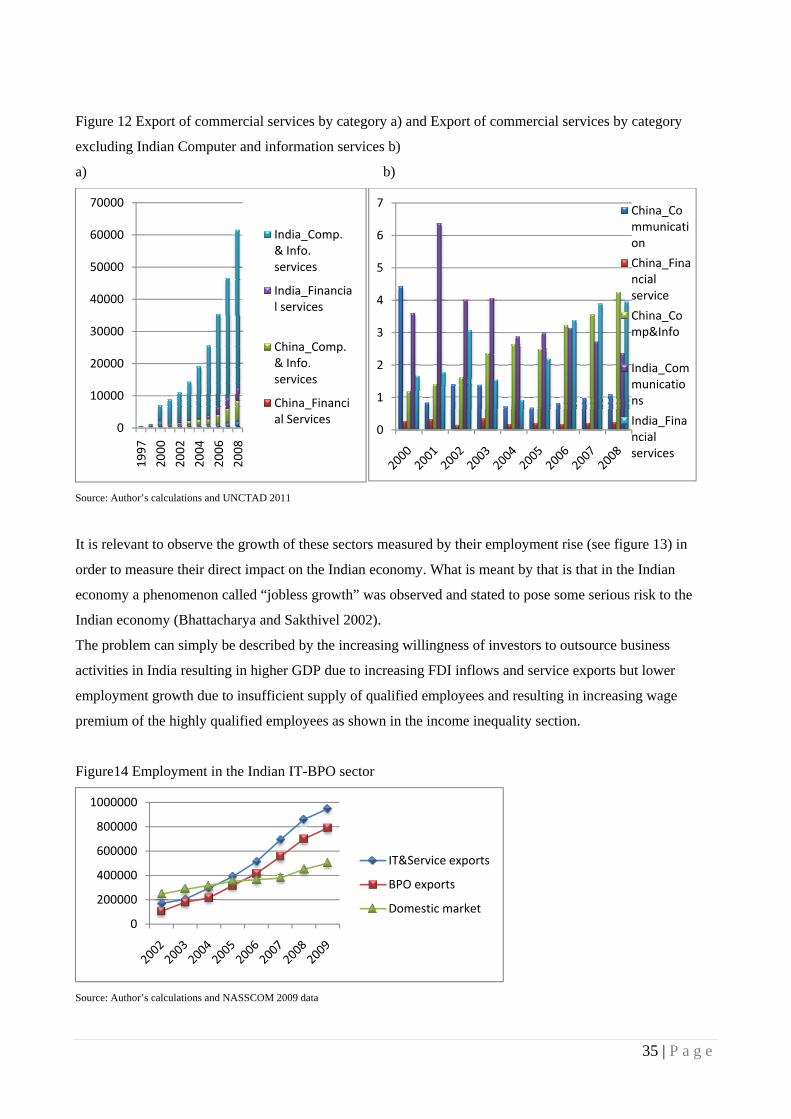
35 | P a g e
Figure 12 Export of commercial services by category a) and Export of commercial services by category
excluding Indian Computer and information services b)
a) b)
Source: Author’s calculations and UNCTAD 2011
It is relevant to observe the growth of these sectors measured by their employment rise (see figure 13) in
order to measure their direct impact on the Indian economy. What is meant by that is that in the Indian
economy a phenomenon called “jobless growth” was observed and stated to pose some serious risk to the
Indian economy (Bhattacharya and Sakthivel 2002).
The problem can simply be described by the increasing willingness of investors to outsource business
activities in India resulting in higher GDP due to increasing FDI inflows and service exports but lower
employment growth due to insufficient supply of qualified employees and resulting in increasing wage
premium of the highly qualified employees as shown in the income inequality section.
Figure14 Employment in the Indian IT-BPO sector
Source: Author’s calculations and NASSCOM 2009 data
0
10000
20000
30000
40000
50000
60000
70000
1997
2000
2002
2004
2006
2008
India_Comp. & Info. services
India_Financial services
China_Comp. & Info. services
China_Financial Services
0
1
2
3
4
5
6
7China_Communication
China_Financial service
China_Comp&Info
India_Communications
India_Financial services
0
200000
400000
600000
800000
1000000
IT&Service exports
BPO exports
Domestic market

36 | P a g e
What can be observed by figure 13 is the relative higher employment in the IT and service exports compared
to the business process outsourcing exports and also the emergence of domestic demand for business and IT
services.
What should be pointed out is that IT and service sectors are more prone to be foreign owned due to the risk
involved when dealing with intangible assets (discussed in the theoretical transaction cost section) compared
to the business process outsourcing where some back office operations like accounting are subcontracted to
local companies.
This means that from employment growth perspective the vertical FDI has increased more than the business
process outsourcing and has contributed more to the Indian service sector progress.
3.3.2 FDI- Technology spillover in India
In order to benefit from technology transfer in the 1980s a condition for allowing FDI inflow into the
country was set up requiring the foreign companies facilitate some degree of technological spillover (Pant
and Mondal 2010).
A case study of India by Pant and Mondal 2010 has found that the foreign firms facilitated greater
technological spillover due to their export orientation compared with local firms purchasing technology and
also that the degree of technology adoption depended on the competition level in the particular industry.
In order to measure the spillover Pant and Mondal 2010 used total factor productivity (TFP) as a proxy for
technology spillover and the decrease of the dispersion of this productivity was considered as technological
improvements in a particular industry. And the logic behind this formulation could be interpreted in the
following way- since TFP is the portion of output not explained by the amount of inputs used in production
(Comin 2006) the technology and production organization of the employees would enable a company to be
more productive, meaning to produce more cheaply than the competitors, hence if this efficiency is observed
in the entire industry including suppliers, subcontractors and competitors and not only in the foreign owned
companies than that would mean that the multinationals have transferred some of its technology and
production know how to the entire industry they operate in and technology spillover have occurred.
The industries investigated were the most prominent FDI receivers according to the researchers- industrial
machinery, electrical goods, transport equipment and chemical industry.
Without going into further detail into the model estimation and calculations the results obtained were the
following: the licensing to the Indian firms did not enable them to benefit from technology transfer while
foreign ventures provided the specific industries with technology spillover that was even greater than the
transfer resulting from mere purchase of foreign technology.
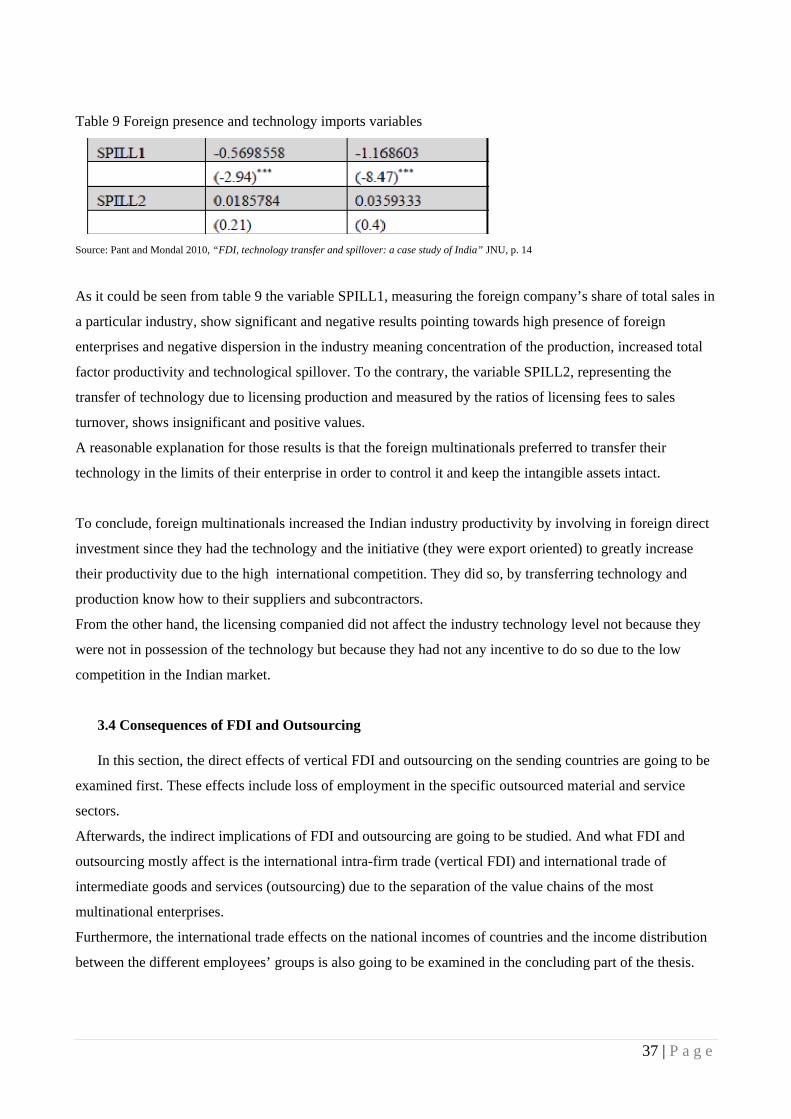
37 | P a g e
Table 9 Foreign presence and technology imports variables
Source: Pant and Mondal 2010, “FDI, technology transfer and spillover: a case study of India” JNU, p. 14
As it could be seen from table 9 the variable SPILL1, measuring the foreign company’s share of total sales in
a particular industry, show significant and negative results pointing towards high presence of foreign
enterprises and negative dispersion in the industry meaning concentration of the production, increased total
factor productivity and technological spillover. To the contrary, the variable SPILL2, representing the
transfer of technology due to licensing production and measured by the ratios of licensing fees to sales
turnover, shows insignificant and positive values.
A reasonable explanation for those results is that the foreign multinationals preferred to transfer their
technology in the limits of their enterprise in order to control it and keep the intangible assets intact.
To conclude, foreign multinationals increased the Indian industry productivity by involving in foreign direct
investment since they had the technology and the initiative (they were export oriented) to greatly increase
their productivity due to the high international competition. They did so, by transferring technology and
production know how to their suppliers and subcontractors.
From the other hand, the licensing companied did not affect the industry technology level not because they
were not in possession of the technology but because they had not any incentive to do so due to the low
competition in the Indian market.
3.4 Consequences of FDI and Outsourcing In this section, the direct effects of vertical FDI and outsourcing on the sending countries are going to be
examined first. These effects include loss of employment in the specific outsourced material and service
sectors.
Afterwards, the indirect implications of FDI and outsourcing are going to be studied. And what FDI and
outsourcing mostly affect is the international intra-firm trade (vertical FDI) and international trade of
intermediate goods and services (outsourcing) due to the separation of the value chains of the most
multinational enterprises.
Furthermore, the international trade effects on the national incomes of countries and the income distribution
between the different employees’ groups is also going to be examined in the concluding part of the thesis.

38 | P a g e
3.4.1 Employment implications of material outsourcing In the European Union outsourcing was measured as a ratio of imported materials for manufacturing
activities to the gross output of the industry and it was reported that it has increased from 7.7 percent to 8.8
percent and also that the outsourcing processes to the developing countries have reached 9 percent per year
in the 1995-2000 period (Falk and Wolfmayr 2005).
Some classification by industries was prepared in order not only the intensity of outsourcing in the different
industries to be presented but also the effect of outsourcing on the different industries to be in investigated.
Table 10 European countries outsourcing by industry 1995-2000
Source: Falk and Wolfmayer 2005, “Employment effects of trade in intermediate inputs with the EU member states and Asia”, Austrian Institute of
Economic Research WIFO p. 449
Note that the summarized data exhibits the patterns of intra-industry trade of intermediate products that were
used as proxy for identification of outsourced processes.
As it is evident from the table that the outsourcing to low wage countries is carried out in the leather, textile,
apparel and basic metal industries. Also some high skill intensive sectors were outsourced- office machinery
and communication equipment. From the other hand, offshoring to high-wage countries was carried out in
industries requiring great expertise as is predominant in the chemical, basic metal and the transport
equipment industries.
The countries investigated were the low wage EU member states and also China, Hong Kong, South Korea,
Malaysia, Singapore, Taiwan, Thailand, Philippines, Brunei, Myanmar, Vietnam, Laos, Cambodia, Indonesia
and India. The outsourcers or high wage countries were the EU 15 and the highly industrialized OECD
member states, i.e. Japan and USA.
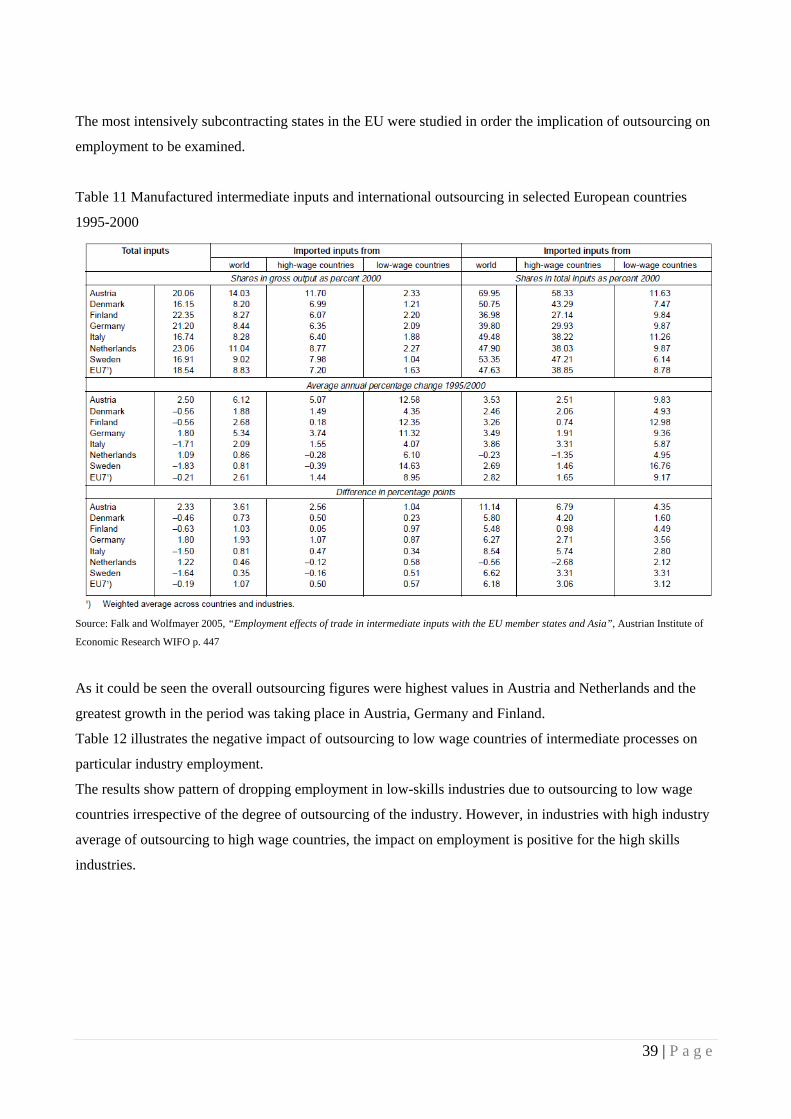
39 | P a g e
The most intensively subcontracting states in the EU were studied in order the implication of outsourcing on
employment to be examined.
Table 11 Manufactured intermediate inputs and international outsourcing in selected European countries
1995-2000
Source: Falk and Wolfmayer 2005, “Employment effects of trade in intermediate inputs with the EU member states and Asia”, Austrian Institute of
Economic Research WIFO p. 447
As it could be seen the overall outsourcing figures were highest values in Austria and Netherlands and the
greatest growth in the period was taking place in Austria, Germany and Finland.
Table 12 illustrates the negative impact of outsourcing to low wage countries of intermediate processes on
particular industry employment.
The results show pattern of dropping employment in low-skills industries due to outsourcing to low wage
countries irrespective of the degree of outsourcing of the industry. However, in industries with high industry
average of outsourcing to high wage countries, the impact on employment is positive for the high skills
industries.

40 | P a g e
Table 12 Outsourcing effect on employment
Source: Falk and Wolfmayer 2005, “Employment effects of trade in intermediate inputs with the EU member states and Asia”, Austrian Institute of
Economic Research WIFO p. 450
So far, it was found that in the period 1995-2005 the EU material outsourcing to the low wage countries
resulted in unemployment increase of 0.26 percent per year (Falk and Wolfmayer 2005).
However, in order to provide a more objective view of the problem a broader perspective should be
considered.
Looking at the American labor market, figure 14, one can see that despite the decrease in employment in the
industries subject to outsourcing, i.e. consumables and textiles manufacturing also shown to be subject to EU
outsourcing, the employment loss was more than outweighed by an increase in the service sector and most
prominently in the construction sector that increased by 4.5 percent in the 1994-2005 period.
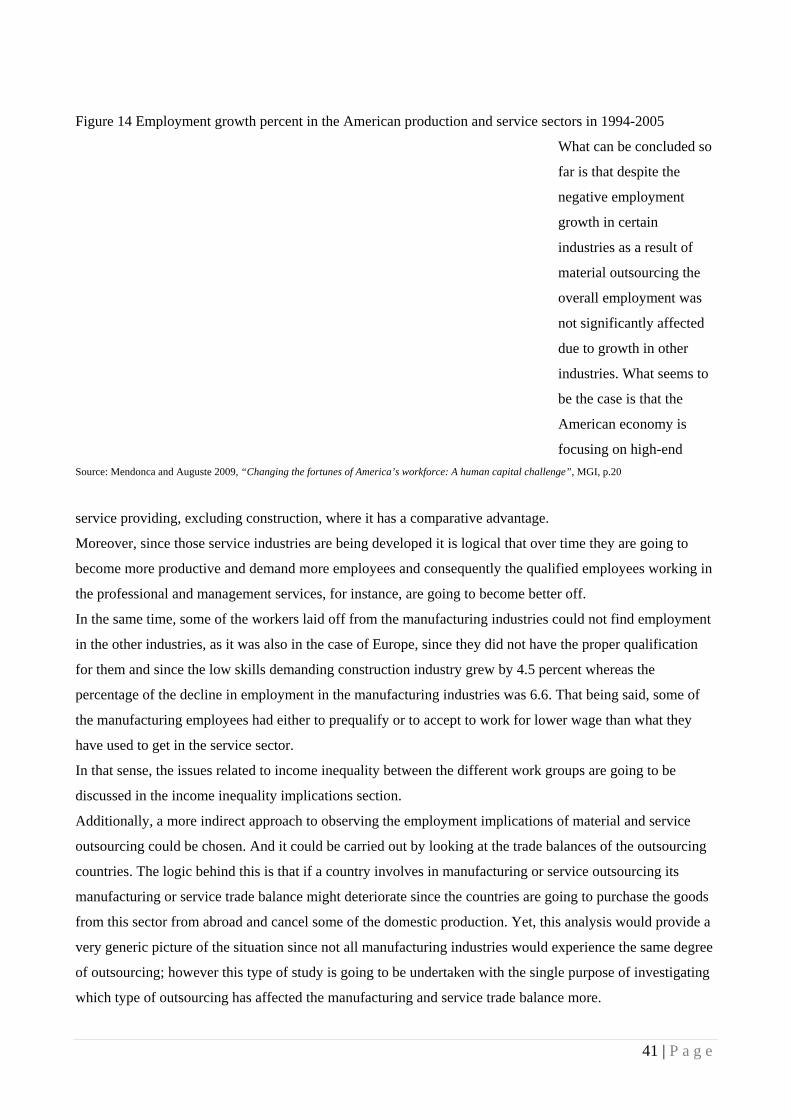
41 | P a g e
Figure 14 Employment growth percent in the American production and service sectors in 1994-2005
What can be concluded so
far is that despite the
negative employment
growth in certain
industries as a result of
material outsourcing the
overall employment was
not significantly affected
due to growth in other
industries. What seems to
be the case is that the
American economy is
focusing on high-end
Source: Mendonca and Auguste 2009, “Changing the fortunes of America’s workforce: A human capital challenge”, MGI, p.20
service providing, excluding construction, where it has a comparative advantage.
Moreover, since those service industries are being developed it is logical that over time they are going to
become more productive and demand more employees and consequently the qualified employees working in
the professional and management services, for instance, are going to become better off.
In the same time, some of the workers laid off from the manufacturing industries could not find employment
in the other industries, as it was also in the case of Europe, since they did not have the proper qualification
for them and since the low skills demanding construction industry grew by 4.5 percent whereas the
percentage of the decline in employment in the manufacturing industries was 6.6. That being said, some of
the manufacturing employees had either to prequalify or to accept to work for lower wage than what they
have used to get in the service sector.
In that sense, the issues related to income inequality between the different work groups are going to be
discussed in the income inequality implications section.
Additionally, a more indirect approach to observing the employment implications of material and service
outsourcing could be chosen. And it could be carried out by looking at the trade balances of the outsourcing
countries. The logic behind this is that if a country involves in manufacturing or service outsourcing its
manufacturing or service trade balance might deteriorate since the countries are going to purchase the goods
from this sector from abroad and cancel some of the domestic production. Yet, this analysis would provide a
very generic picture of the situation since not all manufacturing industries would experience the same degree
of outsourcing; however this type of study is going to be undertaken with the single purpose of investigating
which type of outsourcing has affected the manufacturing and service trade balance more.
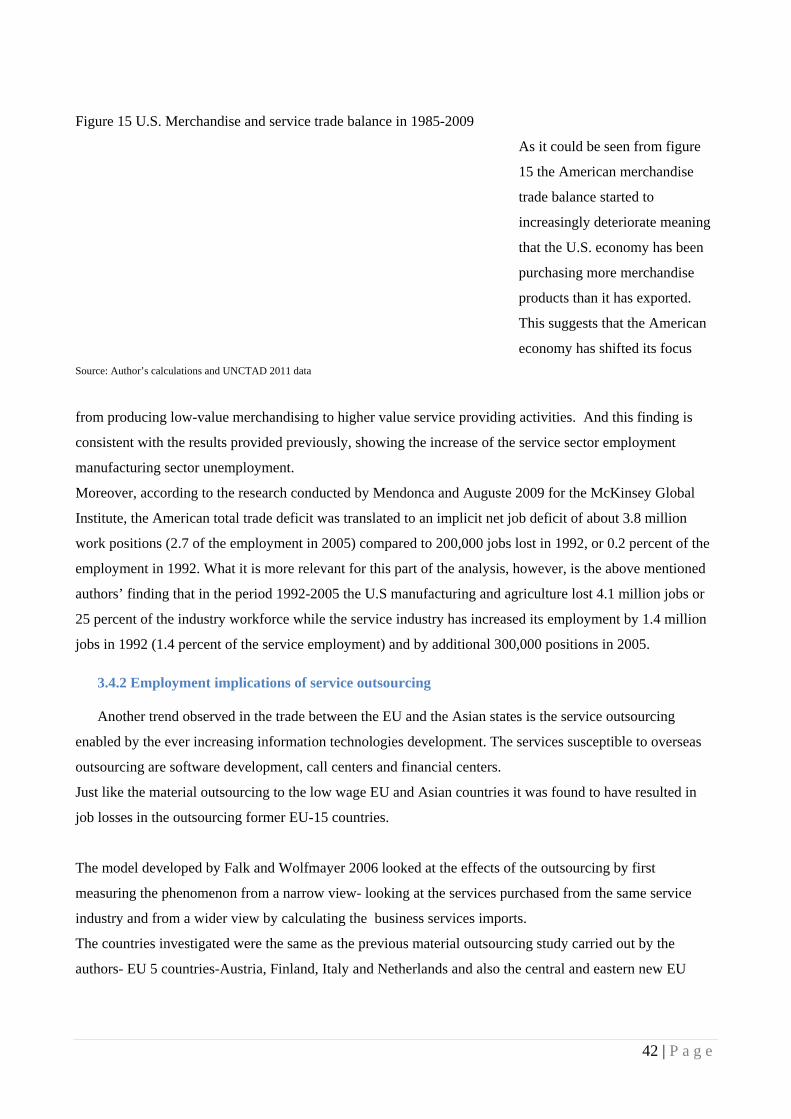
42 | P a g e
Figure 15 U.S. Merchandise and service trade balance in 1985-2009
As it could be seen from figure
15 the American merchandise
trade balance started to
increasingly deteriorate meaning
that the U.S. economy has been
purchasing more merchandise
products than it has exported.
This suggests that the American
economy has shifted its focus
Source: Author’s calculations and UNCTAD 2011 data
from producing low-value merchandising to higher value service providing activities. And this finding is
consistent with the results provided previously, showing the increase of the service sector employment
manufacturing sector unemployment.
Moreover, according to the research conducted by Mendonca and Auguste 2009 for the McKinsey Global
Institute, the American total trade deficit was translated to an implicit net job deficit of about 3.8 million
work positions (2.7 of the employment in 2005) compared to 200,000 jobs lost in 1992, or 0.2 percent of the
employment in 1992. What it is more relevant for this part of the analysis, however, is the above mentioned
authors’ finding that in the period 1992-2005 the U.S manufacturing and agriculture lost 4.1 million jobs or
25 percent of the industry workforce while the service industry has increased its employment by 1.4 million
jobs in 1992 (1.4 percent of the service employment) and by additional 300,000 positions in 2005.
3.4.2 Employment implications of service outsourcing Another trend observed in the trade between the EU and the Asian states is the service outsourcing
enabled by the ever increasing information technologies development. The services susceptible to overseas
outsourcing are software development, call centers and financial centers.
Just like the material outsourcing to the low wage EU and Asian countries it was found to have resulted in
job losses in the outsourcing former EU-15 countries.
The model developed by Falk and Wolfmayer 2006 looked at the effects of the outsourcing by first
measuring the phenomenon from a narrow view- looking at the services purchased from the same service
industry and from a wider view by calculating the business services imports.
The countries investigated were the same as the previous material outsourcing study carried out by the
authors- EU 5 countries-Austria, Finland, Italy and Netherlands and also the central and eastern new EU
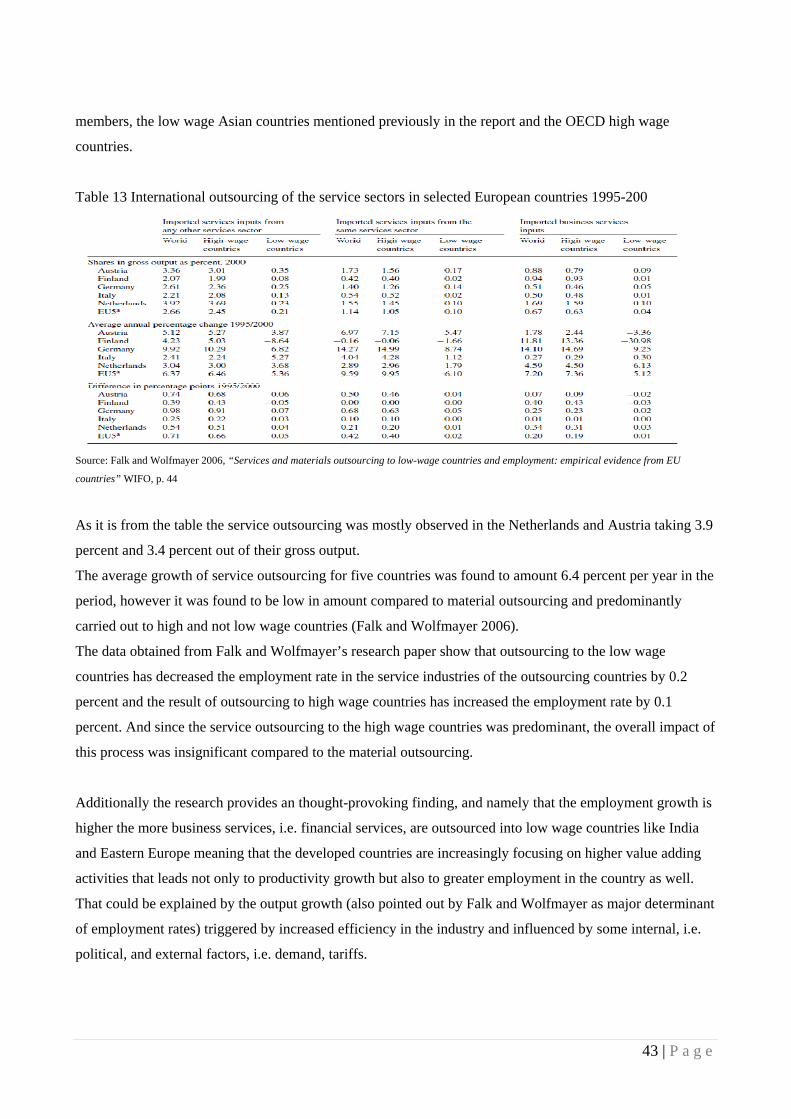
43 | P a g e
members, the low wage Asian countries mentioned previously in the report and the OECD high wage
countries.
Table 13 International outsourcing of the service sectors in selected European countries 1995-200
Source: Falk and Wolfmayer 2006, “Services and materials outsourcing to low-wage countries and employment: empirical evidence from EU
countries” WIFO, p. 44
As it is from the table the service outsourcing was mostly observed in the Netherlands and Austria taking 3.9
percent and 3.4 percent out of their gross output.
The average growth of service outsourcing for five countries was found to amount 6.4 percent per year in the
period, however it was found to be low in amount compared to material outsourcing and predominantly
carried out to high and not low wage countries (Falk and Wolfmayer 2006).
The data obtained from Falk and Wolfmayer’s research paper show that outsourcing to the low wage
countries has decreased the employment rate in the service industries of the outsourcing countries by 0.2
percent and the result of outsourcing to high wage countries has increased the employment rate by 0.1
percent. And since the service outsourcing to the high wage countries was predominant, the overall impact of
this process was insignificant compared to the material outsourcing.
Additionally the research provides an thought-provoking finding, and namely that the employment growth is
higher the more business services, i.e. financial services, are outsourced into low wage countries like India
and Eastern Europe meaning that the developed countries are increasingly focusing on higher value adding
activities that leads not only to productivity growth but also to greater employment in the country as well.
That could be explained by the output growth (also pointed out by Falk and Wolfmayer as major determinant
of employment rates) triggered by increased efficiency in the industry and influenced by some internal, i.e.
political, and external factors, i.e. demand, tariffs.
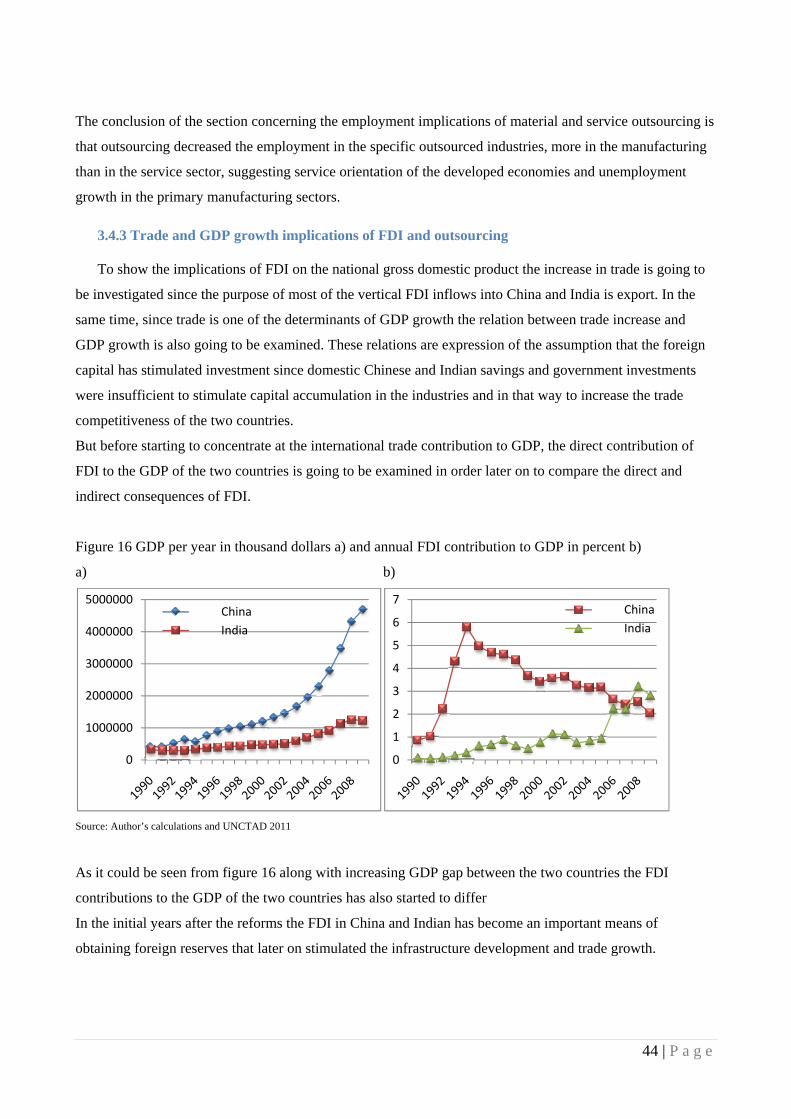
44 | P a g e
The conclusion of the section concerning the employment implications of material and service outsourcing is
that outsourcing decreased the employment in the specific outsourced industries, more in the manufacturing
than in the service sector, suggesting service orientation of the developed economies and unemployment
growth in the primary manufacturing sectors.
3.4.3 Trade and GDP growth implications of FDI and outsourcing To show the implications of FDI on the national gross domestic product the increase in trade is going to
be investigated since the purpose of most of the vertical FDI inflows into China and India is export. In the
same time, since trade is one of the determinants of GDP growth the relation between trade increase and
GDP growth is also going to be examined. These relations are expression of the assumption that the foreign
capital has stimulated investment since domestic Chinese and Indian savings and government investments
were insufficient to stimulate capital accumulation in the industries and in that way to increase the trade
competitiveness of the two countries.
But before starting to concentrate at the international trade contribution to GDP, the direct contribution of
FDI to the GDP of the two countries is going to be examined in order later on to compare the direct and
indirect consequences of FDI.
Figure 16 GDP per year in thousand dollars a) and annual FDI contribution to GDP in percent b)
a) b)
Source: Author’s calculations and UNCTAD 2011
As it could be seen from figure 16 along with increasing GDP gap between the two countries the FDI
contributions to the GDP of the two countries has also started to differ
In the initial years after the reforms the FDI in China and Indian has become an important means of
obtaining foreign reserves that later on stimulated the infrastructure development and trade growth.
0
1000000
2000000
3000000
4000000
5000000China
India
0
1
2
3
4
5
6
7China
India
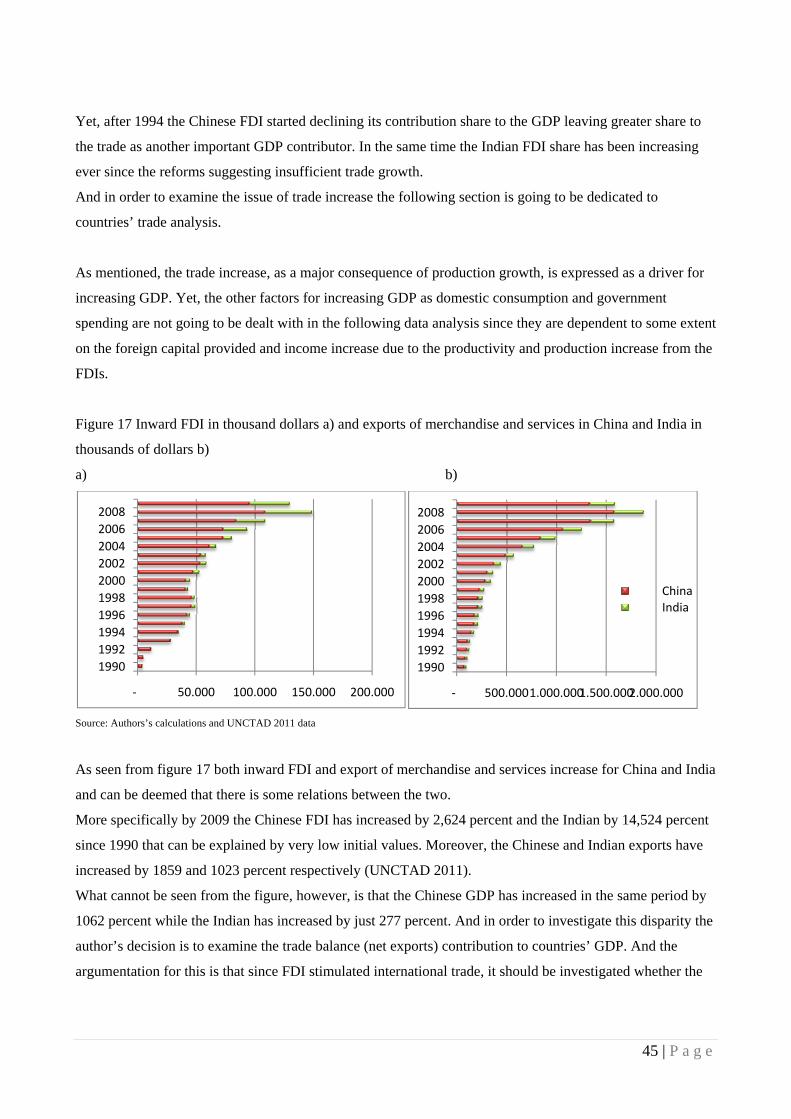
45 | P a g e
Yet, after 1994 the Chinese FDI started declining its contribution share to the GDP leaving greater share to
the trade as another important GDP contributor. In the same time the Indian FDI share has been increasing
ever since the reforms suggesting insufficient trade growth.
And in order to examine the issue of trade increase the following section is going to be dedicated to
countries’ trade analysis.
As mentioned, the trade increase, as a major consequence of production growth, is expressed as a driver for
increasing GDP. Yet, the other factors for increasing GDP as domestic consumption and government
spending are not going to be dealt with in the following data analysis since they are dependent to some extent
on the foreign capital provided and income increase due to the productivity and production increase from the
FDIs.
Figure 17 Inward FDI in thousand dollars a) and exports of merchandise and services in China and India in
thousands of dollars b)
a) b)
Source: Authors’s calculations and UNCTAD 2011 data
As seen from figure 17 both inward FDI and export of merchandise and services increase for China and India
and can be deemed that there is some relations between the two.
More specifically by 2009 the Chinese FDI has increased by 2,624 percent and the Indian by 14,524 percent
since 1990 that can be explained by very low initial values. Moreover, the Chinese and Indian exports have
increased by 1859 and 1023 percent respectively (UNCTAD 2011).
What cannot be seen from the figure, however, is that the Chinese GDP has increased in the same period by
1062 percent while the Indian has increased by just 277 percent. And in order to investigate this disparity the
author’s decision is to examine the trade balance (net exports) contribution to countries’ GDP. And the
argumentation for this is that since FDI stimulated international trade, it should be investigated whether the
‐ 50.000 100.000 150.000 200.000
1990
1992
1994
1996
1998
2000
2002
2004
2006
2008
‐ 500.000 1.000.000 1.500.000 2.000.000
1990
1992
1994
1996
1998
2000
2002
2004
2006
2008
ChinaIndia
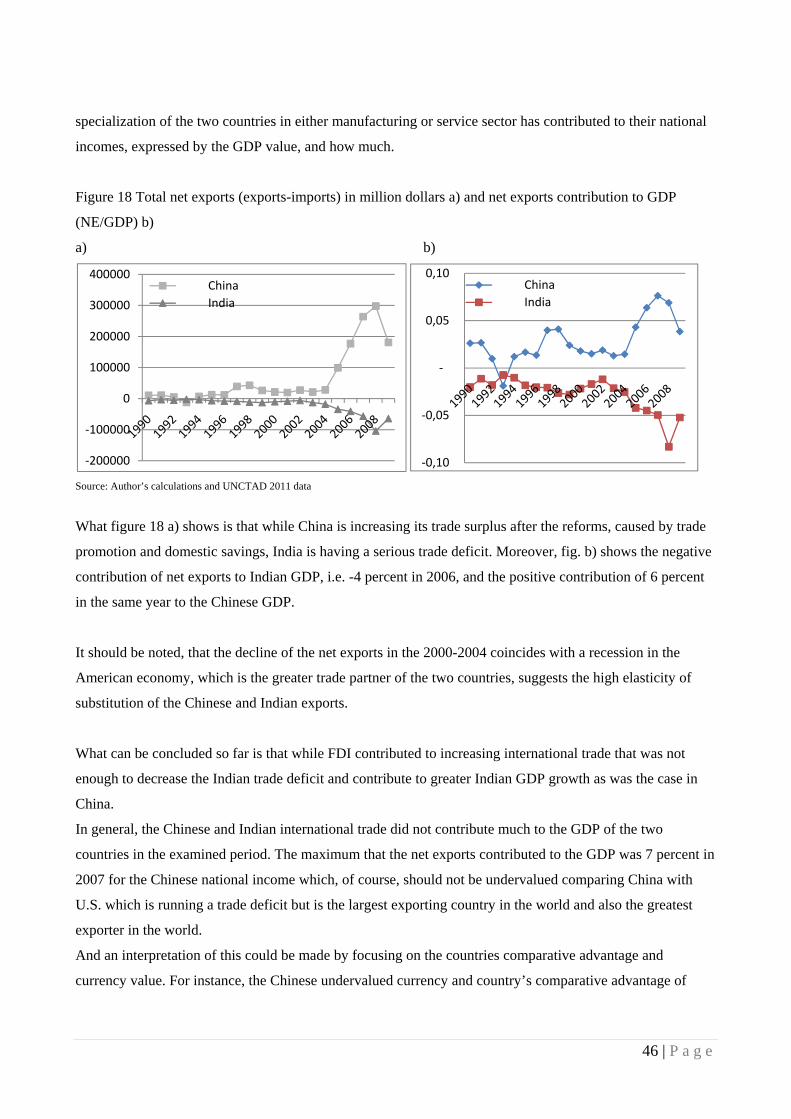
46 | P a g e
specialization of the two countries in either manufacturing or service sector has contributed to their national
incomes, expressed by the GDP value, and how much.
Figure 18 Total net exports (exports-imports) in million dollars a) and net exports contribution to GDP
(NE/GDP) b)
a) b)
Source: Author’s calculations and UNCTAD 2011 data
What figure 18 a) shows is that while China is increasing its trade surplus after the reforms, caused by trade
promotion and domestic savings, India is having a serious trade deficit. Moreover, fig. b) shows the negative
contribution of net exports to Indian GDP, i.e. -4 percent in 2006, and the positive contribution of 6 percent
in the same year to the Chinese GDP.
It should be noted, that the decline of the net exports in the 2000-2004 coincides with a recession in the
American economy, which is the greater trade partner of the two countries, suggests the high elasticity of
substitution of the Chinese and Indian exports.
What can be concluded so far is that while FDI contributed to increasing international trade that was not
enough to decrease the Indian trade deficit and contribute to greater Indian GDP growth as was the case in
China.
In general, the Chinese and Indian international trade did not contribute much to the GDP of the two
countries in the examined period. The maximum that the net exports contributed to the GDP was 7 percent in
2007 for the Chinese national income which, of course, should not be undervalued comparing China with
U.S. which is running a trade deficit but is the largest exporting country in the world and also the greatest
exporter in the world.
And an interpretation of this could be made by focusing on the countries comparative advantage and
currency value. For instance, the Chinese undervalued currency and country’s comparative advantage of
‐200000
‐100000
0
100000
200000
300000
400000China
India
‐0,10
‐0,05
‐
0,05
0,10 China
India

47 | P a g e
producing and assembling semi and fully manufactured goods cheaply could explain why U.S. is running a
trade deficit with China and China a trade surplus with U.S.
From, the other hand, by looking at the Indian case it can be observed that despite the low value of the Indian
rupee the country is still running in a trade deficit. Therefore, the Indian ineffective production cannot be
outweighed by its low valued currency and the Indian consumers prefer to purchase certain goods from
abroad. And in order to figure out where the countries’ deficit is mostly observed, in the manufacturing or
service sectors some data are going to be provided.
Figure 19 Merchandise a) and Service b) trade balance in thousand dollars at current prices and exchange
rate
a) b)
Source: Author’s calculations and UNCTAD 2011 data
What can be inferred by the figure is that China is experiencing relatively steady increase in its merchandise
trade balance whereas India owes most of its recent trade deficit to its merchandise trade balance. What it is
interesting to find is that the current trend of increasing Chinese trade deficit in the service sector while India
is having a stable increase in its service trade balance.
In that way, the comparative advantages from a trade perspective of China and India can be confirmed as
being manufacturing activities for China and service activities for India.
3.4.4 Income implications After showing the effects of increased international trade on countries’ national incomes it is appropriate
to examine which workers’ groups benefited most from it.
The factors that can be pointed out for income inequality increase over the last decades along with
outsourcing are free trade, technology development, immigration and decline of the unions (Mendonca and
Auguste 2009). And while free trade and technology development affect the demand for labor the
immigration and labor force growth affect the supply of labor, though their relative impact is difficult and
complex to estimate.
‐200000
‐100000
0
100000
200000
300000
400000
1990
1992
1994
1996
1998
2000
2002
2004
2006
2008
‐40000
‐30000
‐20000
‐10000
0
10000
20000
ChinaIndia

48 | P a g e
What can be estimated though are the income disparities between the different workers’ groups in the
sending and receiving outsourcing countries and the increasing return to their skill prerequisites.
This fact was explained theoretically by the modification of HO- model provided in the theoretical part of the
thesis and it can simply be clarified by the statement that the factors of production used most intensively in a
country, i.e. skilled labor, would increase their compensation compared with the factors used not that
intensively, i.e. workers in repetitive manufacturing sectors.
That is why, the motivation of the following analysis is to investigate how the relative demand for skilled
workers in USA, China and India and the employment implications of outsourcing, discussed earlier, have
affected the income disparities and wage premium in those three countries.
It should also be specified, that the wage premium statistics are not going to be considered as solely
dependent on the demand for specific type of workers but also as a function of workers’ productivity. For
example, even if there is a scarce supply of textile workers, as it is the case in some Chinese regions in the
recent years, the employers would be able to increase the wage rate up to certain point corresponding to the
employees’ productivity, implying higher elasticity of substitution for the low-skilled laborers compared to
the white-color employees.
In USA, that is the most active outsourcing countries, the income inequality measured by the Gini coefficient
has greatly increased especially after the launching of the open-door policies in China and India in 1980s.
Figure 20 Households income inequality change
Source: Jones Jr. and Weinber 2000, “The changing shape of the nation’s income distribution”, U.S. Census Bureau
Yet, what should be made clear is that the Unites States was not as dependent on international trade as India
and China were. What that means is that, since the American economy was more closed than the Indian and
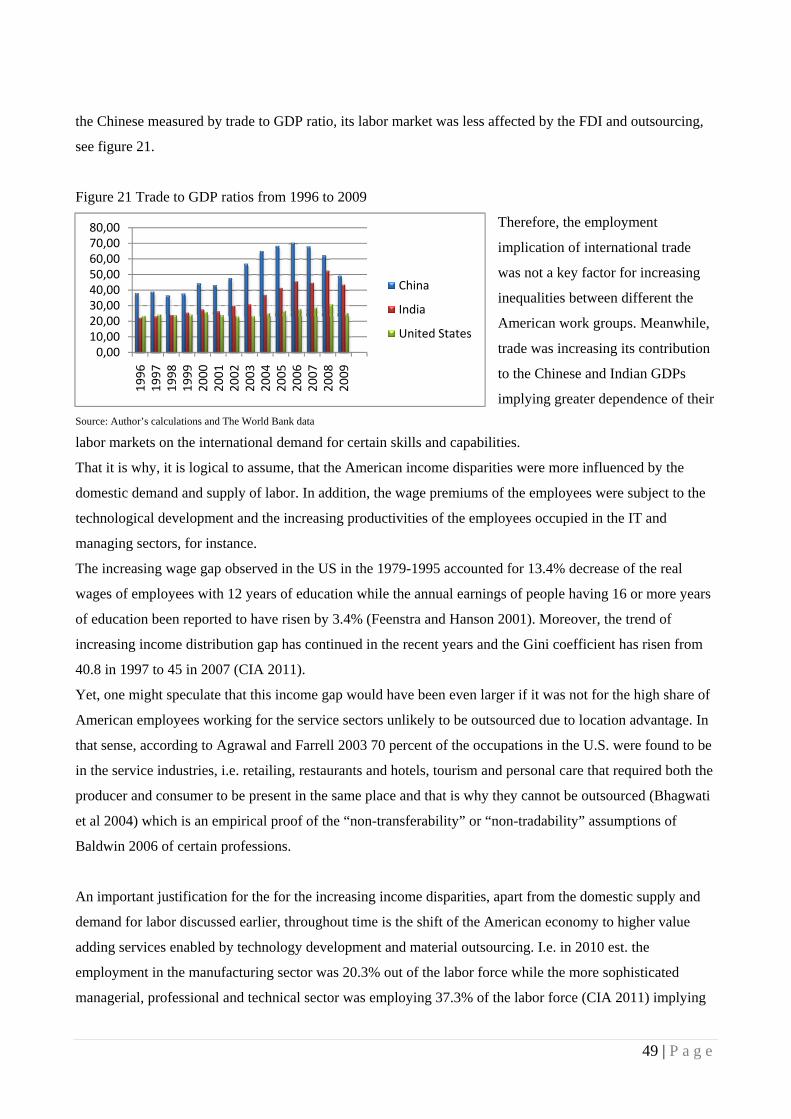
49 | P a g e
0,0010,0020,0030,0040,0050,0060,0070,0080,00
1996
1997
1998
1999
2000
2001
2002
2003
2004
2005
2006
2007
2008
2009
China
India
United States
the Chinese measured by trade to GDP ratio, its labor market was less affected by the FDI and outsourcing,
see figure 21.
Figure 21 Trade to GDP ratios from 1996 to 2009
Therefore, the employment
implication of international trade
was not a key factor for increasing
inequalities between different the
American work groups. Meanwhile,
trade was increasing its contribution
to the Chinese and Indian GDPs
implying greater dependence of their
Source: Author’s calculations and The World Bank data
labor markets on the international demand for certain skills and capabilities.
That it is why, it is logical to assume, that the American income disparities were more influenced by the
domestic demand and supply of labor. In addition, the wage premiums of the employees were subject to the
technological development and the increasing productivities of the employees occupied in the IT and
managing sectors, for instance.
The increasing wage gap observed in the US in the 1979-1995 accounted for 13.4% decrease of the real
wages of employees with 12 years of education while the annual earnings of people having 16 or more years
of education been reported to have risen by 3.4% (Feenstra and Hanson 2001). Moreover, the trend of
increasing income distribution gap has continued in the recent years and the Gini coefficient has risen from
40.8 in 1997 to 45 in 2007 (CIA 2011).
Yet, one might speculate that this income gap would have been even larger if it was not for the high share of
American employees working for the service sectors unlikely to be outsourced due to location advantage. In
that sense, according to Agrawal and Farrell 2003 70 percent of the occupations in the U.S. were found to be
in the service industries, i.e. retailing, restaurants and hotels, tourism and personal care that required both the
producer and consumer to be present in the same place and that is why they cannot be outsourced (Bhagwati
et al 2004) which is an empirical proof of the “non-transferability” or “non-tradability” assumptions of
Baldwin 2006 of certain professions.
An important justification for the for the increasing income disparities, apart from the domestic supply and
demand for labor discussed earlier, throughout time is the shift of the American economy to higher value
adding services enabled by technology development and material outsourcing. I.e. in 2010 est. the
employment in the manufacturing sector was 20.3% out of the labor force while the more sophisticated
managerial, professional and technical sector was employing 37.3% of the labor force (CIA 2011) implying
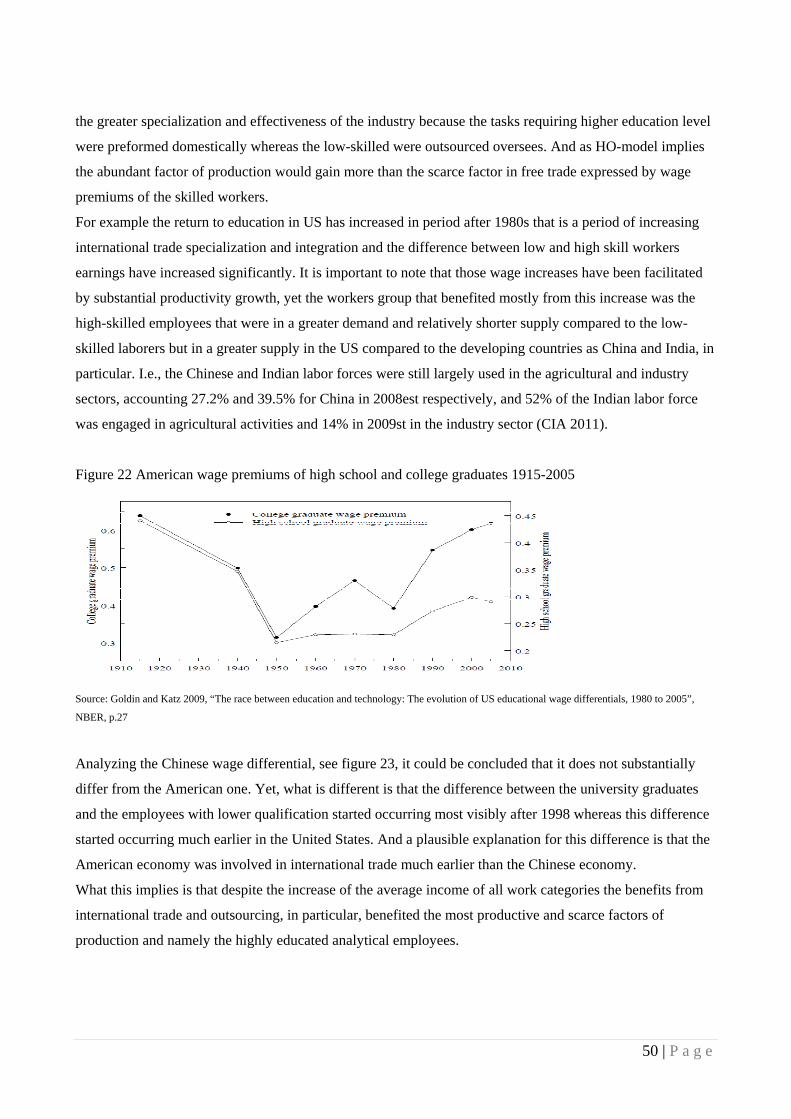
50 | P a g e
the greater specialization and effectiveness of the industry because the tasks requiring higher education level
were preformed domestically whereas the low-skilled were outsourced oversees. And as HO-model implies
the abundant factor of production would gain more than the scarce factor in free trade expressed by wage
premiums of the skilled workers.
For example the return to education in US has increased in period after 1980s that is a period of increasing
international trade specialization and integration and the difference between low and high skill workers
earnings have increased significantly. It is important to note that those wage increases have been facilitated
by substantial productivity growth, yet the workers group that benefited mostly from this increase was the
high-skilled employees that were in a greater demand and relatively shorter supply compared to the low-
skilled laborers but in a greater supply in the US compared to the developing countries as China and India, in
particular. I.e., the Chinese and Indian labor forces were still largely used in the agricultural and industry
sectors, accounting 27.2% and 39.5% for China in 2008est respectively, and 52% of the Indian labor force
was engaged in agricultural activities and 14% in 2009st in the industry sector (CIA 2011).
Figure 22 American wage premiums of high school and college graduates 1915-2005
Source: Goldin and Katz 2009, “The race between education and technology: The evolution of US educational wage differentials, 1980 to 2005”,
NBER, p.27
Analyzing the Chinese wage differential, see figure 23, it could be concluded that it does not substantially
differ from the American one. Yet, what is different is that the difference between the university graduates
and the employees with lower qualification started occurring most visibly after 1998 whereas this difference
started occurring much earlier in the United States. And a plausible explanation for this difference is that the
American economy was involved in international trade much earlier than the Chinese economy.
What this implies is that despite the increase of the average income of all work categories the benefits from
international trade and outsourcing, in particular, benefited the most productive and scarce factors of
production and namely the highly educated analytical employees.

51 | P a g e
Figure 23 Chinese wage differences for different workers groups
Source: Ge and Young 2008, “Accounting for rising wages in China”, p. 29
As a verification of the benefits of outsourcing and international trade in general comes the date exhibited in
figure 24 showing in the substantial increase in the average urban wage in China. It should be noted that in
the end of the 1970s there was not observed any significant increase but in the beginning of the 1990s along
with the increasing foreign investments and demand for labor the average wage started to increase in
noteworthy amount.
Figure 24 Average monthly wages of staff and workers 1978-2007
Source: China Statistical yearbook 200815
The situation for India does not much differ in terms of wage premiums, see figure 25, but the difference
there is that the increasing demand, expressed as increased employment growth in table 14, for educated
employees due to the emerging specialization of the Indian economy towards exporting services, i.e. BPO,
software development, requiring workers with higher education.
15 http://www.china-labour.org.hk/en/node/100206#part2
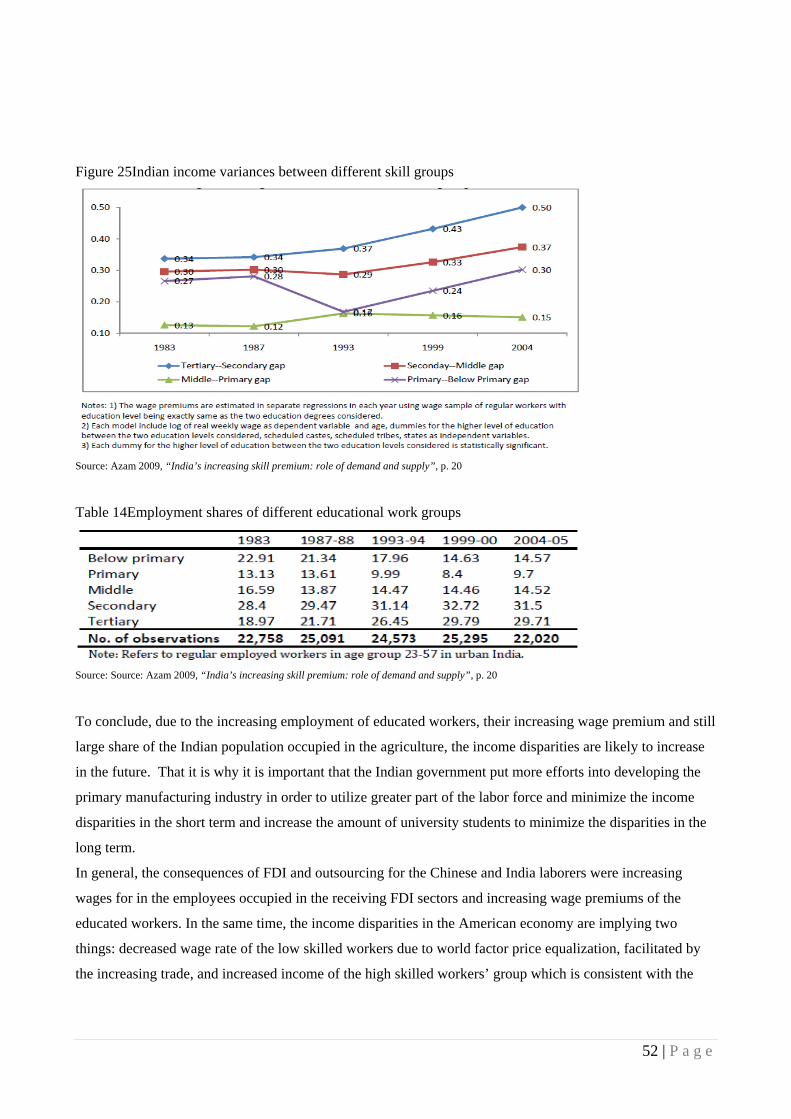
52 | P a g e
Figure 25Indian income variances between different skill groups
Source: Azam 2009, “India’s increasing skill premium: role of demand and supply”, p. 20
Table 14Employment shares of different educational work groups
Source: Source: Azam 2009, “India’s increasing skill premium: role of demand and supply”, p. 20
To conclude, due to the increasing employment of educated workers, their increasing wage premium and still
large share of the Indian population occupied in the agriculture, the income disparities are likely to increase
in the future. That it is why it is important that the Indian government put more efforts into developing the
primary manufacturing industry in order to utilize greater part of the labor force and minimize the income
disparities in the short term and increase the amount of university students to minimize the disparities in the
long term.
In general, the consequences of FDI and outsourcing for the Chinese and India laborers were increasing
wages for in the employees occupied in the receiving FDI sectors and increasing wage premiums of the
educated workers. In the same time, the income disparities in the American economy are implying two
things: decreased wage rate of the low skilled workers due to world factor price equalization, facilitated by
the increasing trade, and increased income of the high skilled workers’ group which is consistent with the

53 | P a g e
assumption for higher returns of the factor used mostly in an economy and it is also an implication of the
higher productivity and demand for the highly-qualified employees.
4. Conclusion
Using the Eclectic theory, it could be concluded that in relation to the companies’ ownership advantage,
the risky environment and low protection of the intellectual property the Chinese economy lost the
opportunity to attract research and development companies as India did. Moreover, due to the Indian
English- speaking and educated labor force the service industry attracted most efficiency and strategic
resource seeking foreign investors. As a matter of fact, the Indian trade was primary in services. Yet, despite
the benefits arising from international trade in services such as increasing of the high-value adding economy
and the salaries of the individuals occupied in the sector, a large percentage of the labor force was still
occupied in the agricultural sector where the productivity and average income were still very low. And due
to this finding, some recommendations to the Indian official are going to be given.
First, since large part of the population was still illiterate the government efforts should be focused on
providing widely-available professional education in order to provide the underdeveloped industry with
valuable factors of production. Additionally, efforts should be made towards modernizing the industry and
increasing its contribution to the gross domestic product. This is due the fact that it might be able to employ
greater part of the labor force and increase the average Indian annual earnings.
In order to make the industry growth, the government has a couple of options. First, it could provide tax
incentives to foreign investors, as China did, to invest in infrastructure. Second it could increase the
government spending in infrastructure. And due to its current account deficit, the government officials might
be eager to transfer some funds intended for developing of the service industry infrastructure, i.e.
telecommunication networks etc., to the less developed manufacturing sector.
Looking at location advantages, discussed by Dunning, it was found that the companies searching for
location advantage, such as proximity to consumers, have appreciated the Chinese market growth since in
2005 the main motive in an investors survey was not the cheap labor but the market size and growth. It
seems that the Chinese advantage of offering cheap labor has started to lose its attractiveness with the
increase of the minimum wage rate. What started attracting investors was the increasing purchasing power of
the Chinese consumers. Yet, some steps should be made in order to further increase this purchasing power.
And one of them is slowly shifting the focus on providing higher value-adding activities. In that sense, the
quality of the education provided in Chinese universities should be improved and the linguistic abilities of
the graduates should be enhanced.

54 | P a g e
Additionally, the Chinese officials could also change the focus of the economy towards domestic
consumption rather than export orientation. That would have made it more resistant to sudden fluctuations in
demand, as in the current financial crises, and dramatic increases in unemployment would be avoided.
In order to increase the domestic focus of the Chinese economy, one method suggested by the World Trade
Organization could be mentioned. The Chinese Yuan could be appreciated in order to reach its real value.
And despite the fact that the Chinese economy would lose some of its cost competitiveness, the Chinese
workers would be able to spend more money in factual terms and increase the overall purchasing power of
the Chinese people. This would lead to increasing role of the service industry and larger part of the
population would be employed in it instead in the low-income giving primary industry sectors.
And finally, in relation to the internalization advantages of the foreign investors, it was revealed that the two
countries did not differ in terms ownership of the export oriented investments. That means that the investors
have appreciated the arm’s length principle of the international trade in goods and services and have
preferred to keep the control over the entire value chain instead of subcontracting some of the activities to
foreign suppliers. Yet, an interesting trend was observed in India where the business process outsourcing was
carried out most notably. And this trend is setting up firms by foreigners in order to serve multinational
companies. And the beginning of these activities was given by international companies building their own
service centers in India. After a while, the economies of scales related to mass production (in this case to
mass service provision) have started being increasingly exploited.
In relation to the thesis’s model explaining the implications of vertical FDI and outsourcing, it could be
stated that its assumptions were found to hold true in the empirical part of the report.
The FDI influenced the international trade of the researched countries and indeed increased the countries
national incomes. What was found intriguing was that, due to the lower utilization of the Indian labor force
and lower investment flows, the Indian gross domestic product per capita was not increasing in the same
extent as the Chinese one.
Additionally it was found that in the short term the outsourcing activities resulted in loss of employment
especially in the manufacturing sectors. However, it was also shown that the American labor market was
unaffected by the outsourcing activities since the other, mostly service providing sectors grew during the
observed period. Hence, the full-employment assumption of the model was also fulfilled.
Yet, the observed increasing income disparities between the different American social strata could not be
entirely explained by the change of the occupation of the laid off manufacturing workers as the model
assumed. The factors that also contributed to the income inequalities were found to be more related to the
domestic demand for workers, due to the comparatively low openness of the American economy.

55 | P a g e
Likewise, since the highly-educated American workers were receiving higher wage premiums, it is logical
to assume that the productivity was the driving factor that increased their wages and since the workers with
lower professional qualification were also having lower productivity, hence the income disparities are
expected to rise in the future as well.
Additionally, due to the American economy focus on providing services (the U.S. service trade balance was
found positive), it could be assumed that the manufacturing labor market distortions would play lower role in
future and consequently affect the nation’s income inequalities less than it was speculate by the media.
And finally, what could be recommended to the U.S. government officials in relation to GDP growth and
income inequalities is to allow further outsourcing activities of the American multinationals in order the
competitiveness of the American industry to be sustained. Additionally, the domestic sectors should also take
advantage of outsourcing activities since in this way these sectors are going to be become more competitive
on the home market and consequently the trade balance is likely to improve.
Moreover, while trying to keep some manufacturing positions at home and bailing out the inefficient car
producing companies, the American officials are losing the possibility to transfer these funds towards higher
value-adding activities by promoting higher education and stimulating the growth of the IT and R&D
sectors.
In conclusion, the only way towards higher country income is through growth of the high-value adding
activities that a country has a comparative advantage on and removing the impediments of international trade
in goods and services.

56 | P a g e
References
Abraham, Philip, Josef Konings, Veerle Slootmaekers (2010), "FDI spillovers in the Chinese manufacturing sector", Economics of Transition,Volume 18, Issue 1, pages 143–182
Alfaro and Charlton (2007), "Intra-Industry Foreign Direct investment" Ali, Shaukat and Wei Guo (2005), "Determinents of FDI in China", Journal of Global Business and Technology, Volume 1, Number 2, Fall 2005 Antrás, Pol (2003), “Firms, contracts, and trade structure”,Quarterly Journal of Economics Azam, Mehtabul (2009), “India’s increasing skill premium: role of demand and supply", World Bank and Institute for the Study of Labor
Baldwin, R. (2006), "Globalization: the great unbundling(s)", Graduate Institute of International Studies, Geneva
Banri ITO, Yashiro Naomitsu, Xu Zhaoyuan, Chen Xiaohong and Wakasugi Ryunhei (2010), "How do Chinese industries benefit by from FDI spillovers", RIETI Discussion Paper Series 10-E-026 May 2010 Bartels and Lederer, 2009, “Outsourcing markets in services: International business trends, patterns and emerging issues, and the role of China and India”, UNIDO Bhagwati Jagdish,Arvind Panagariya and T.N. Srinivasan, (2004), "The muddles over outsourcing", Joumai of Economic Perspectives—Volume 18, Number 4—Eall 2004—Pages 93-114 Bhattacharya, B. and Sakthivel, S. (2002), "Economic reforms and jobless growth in India in the 1990s", The Institute of Economic Growth
Bhattacharya, M. and Vickery, G. (2008), "The information and communication technology sector in India: performance, growth and key challenges", OECD
Comin, Diego (2006), "Total factor productivity", NBER
Falk, M. and Falk R. (2005), “Employment effects of trade in intermediate inputs with the EU member states and Asia”, Austrian Institute of Economic Research WIFO
Falk, M. and Y. Wolfmayer (2008) "Services and Materials Outsourcing to low-wage countries and employment: Empirical evidence from EU countries" Structural Change and Economic Dynamics, Vol. 19, pp38-52
Feenstra, R. and Hanson, Gr. (2001) "Global Production Sharing and Rising Inequality: A Survey of Trade and Wages" NBER Working Papers 8372
Ge, Suqin and Young, Dennis Tao (2008), “Accounting for rising wages in China”, Virginia Tech and The Chinese University of Hong Kong
Goldin, Claudia and Katz, Lawrence (2009), “The race between education and technology: The evolution of US educational wage differentials, 1980 to 2005”, NBER
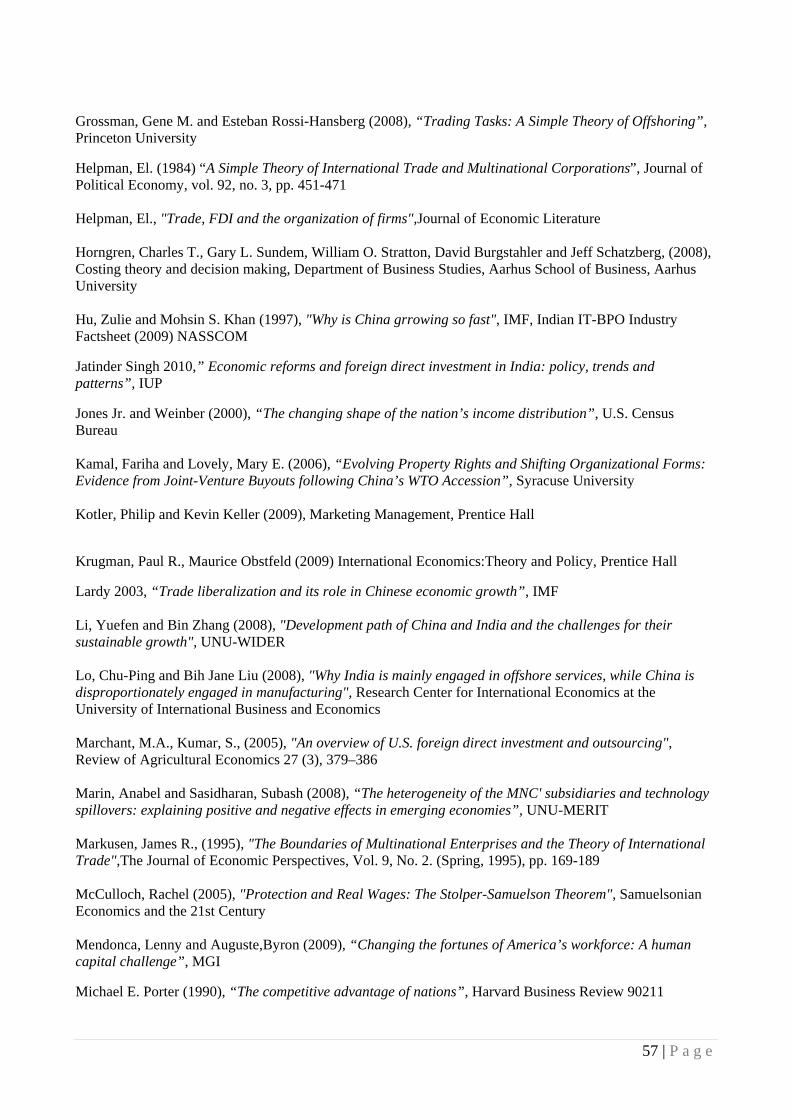
57 | P a g e
Grossman, Gene M. and Esteban Rossi-Hansberg (2008), “Trading Tasks: A Simple Theory of Offshoring”, Princeton University
Helpman, El. (1984) “A Simple Theory of International Trade and Multinational Corporations”, Journal of Political Economy, vol. 92, no. 3, pp. 451-471 Helpman, El., "Trade, FDI and the organization of firms",Journal of Economic Literature Horngren, Charles T., Gary L. Sundem, William O. Stratton, David Burgstahler and Jeff Schatzberg, (2008), Costing theory and decision making, Department of Business Studies, Aarhus School of Business, Aarhus University Hu, Zulie and Mohsin S. Khan (1997), "Why is China grrowing so fast", IMF, Indian IT-BPO Industry Factsheet (2009) NASSCOM
Jatinder Singh 2010,” Economic reforms and foreign direct investment in India: policy, trends and patterns”, IUP
Jones Jr. and Weinber (2000), “The changing shape of the nation’s income distribution”, U.S. Census Bureau Kamal, Fariha and Lovely, Mary E. (2006), “Evolving Property Rights and Shifting Organizational Forms: Evidence from Joint-Venture Buyouts following China’s WTO Accession”, Syracuse University Kotler, Philip and Kevin Keller (2009), Marketing Management, Prentice Hall
Krugman, Paul R., Maurice Obstfeld (2009) International Economics:Theory and Policy, Prentice Hall
Lardy 2003, “Trade liberalization and its role in Chinese economic growth”, IMF Li, Yuefen and Bin Zhang (2008), "Development path of China and India and the challenges for their sustainable growth", UNU-WIDER Lo, Chu-Ping and Bih Jane Liu (2008), "Why India is mainly engaged in offshore services, while China is disproportionately engaged in manufacturing", Research Center for International Economics at the University of International Business and Economics Marchant, M.A., Kumar, S., (2005), "An overview of U.S. foreign direct investment and outsourcing", Review of Agricultural Economics 27 (3), 379–386 Marin, Anabel and Sasidharan, Subash (2008), “The heterogeneity of the MNC' subsidiaries and technology spillovers: explaining positive and negative effects in emerging economies”, UNU-MERIT Markusen, James R., (1995), "The Boundaries of Multinational Enterprises and the Theory of International Trade",The Journal of Economic Perspectives, Vol. 9, No. 2. (Spring, 1995), pp. 169-189 McCulloch, Rachel (2005), "Protection and Real Wages: The Stolper-Samuelson Theorem", Samuelsonian Economics and the 21st Century Mendonca, Lenny and Auguste,Byron (2009), “Changing the fortunes of America’s workforce: A human capital challenge”, MGI
Michael E. Porter (1990), “The competitive advantage of nations”, Harvard Business Review 90211
58 | P a g e
OECD (1996) Benchmark definition of foreign direct investment, third edition
Olsen, Karsten Bjerring (2006), "Productivity impacts of offshoring and outsourcing: a review",OECD Directorate for Science, Technology and Industry (STI)
Pant, Manoj and Mondal, Sangeeta (2010), “FDI, technology transfer and spillover: a case study of India” JNU
Photis M. Panayides, Dong-Wook Song and Detlef Nielsen, 2002, "Foreign Direct Investment in China: The Case of Shipping and Logistics Corporations", IAME Panama (2002) Conference Proceedings Prasad, Easwar and Shang-Jin Wei (2005), "The Chinese approach to capital inflows:patterns and possible explanations", IMF Qureshi, Mahvash Saeed and Guanghua Wan (2008), "Trade expansion of China and India",UNU-WIDER Rowthorn, R. (2006) "The Renaissance of China and India: Implications for the Advanced Economies", UNCTAD Discussion Paper 182. Geneva: UNCTAD
Saggi (2005), "Technological transfer and the role of intelectual property rights", Presentation at the WTO
Singh J. (2010), "“Economic reforms and foreign direct investment in India: policy, trends and patterns”, The IUP Journal of Financial Economics
Sung-Hoon Lim, February (2005), ” Foreign investment impact and incentive: a strategic approach to the relationship between the objectives of foreign investment policy and their promotion”, International Business Review, Volume 14, issue , pp.61- 76
Virmani, A. (2004), “Foreign direct investment reform”, INDIAN COUNCIL FOR RESEARCH ON INTERNATIONAL ECONOMIC RELATIONS, Vol. XLIV, (September 2006), pp. 589–630
Walmsley, Terrie L., Thomas W. Hertel and Elena Ianchovichina (2002), "Assessing the impact of China's WTO accession on investment", The World Bank
Web sites http://services.indiabizclub.com/info/types_of_service/foreign_direct_investment http://timesofindia.indiatimes.com/ http://www.atkearney.com/ http://www.china-labour.org.hk/en/node/100206#part2
http://www.nasscom.in/upload/5216/IT_Industry_Factsheet-Mar_2009.pdf
http://www.sourcingline.com/
http://www.sourcingline.com/country-data/rigidity-of-employment/ http://www.suite101.com/content/top-us-trade-partners-in-2010-a365363 http://www.unctad.org http://www.worldbank.org/ https://www.cia.gov/library/publications/the-world-factbook/index.html