Embed Size (px)
Citation preview
10/17/2011
1
French Creek Training October 18, 2011
1
• Chemistry & Theory
• Putting French Creek to Work • WaterCycle
• DownHole SAT
• hyd-RO-dose
• WatSIM
• MineSAT
Overview
2
• Cooling Water
• Reverse Osmosis
• Municipal
• Oilfield
• Mining & Waste
Scale & Corrosion Software Sales & Service Tools
3
• Standard off the shelf
• Customized versions
• Windows Libraries
web applications
• Unix Libraries
controllers
Scale & Corrosion Software Sales & Service Tools
4
10/17/2011
2
Copyright 2011 French Creek Software
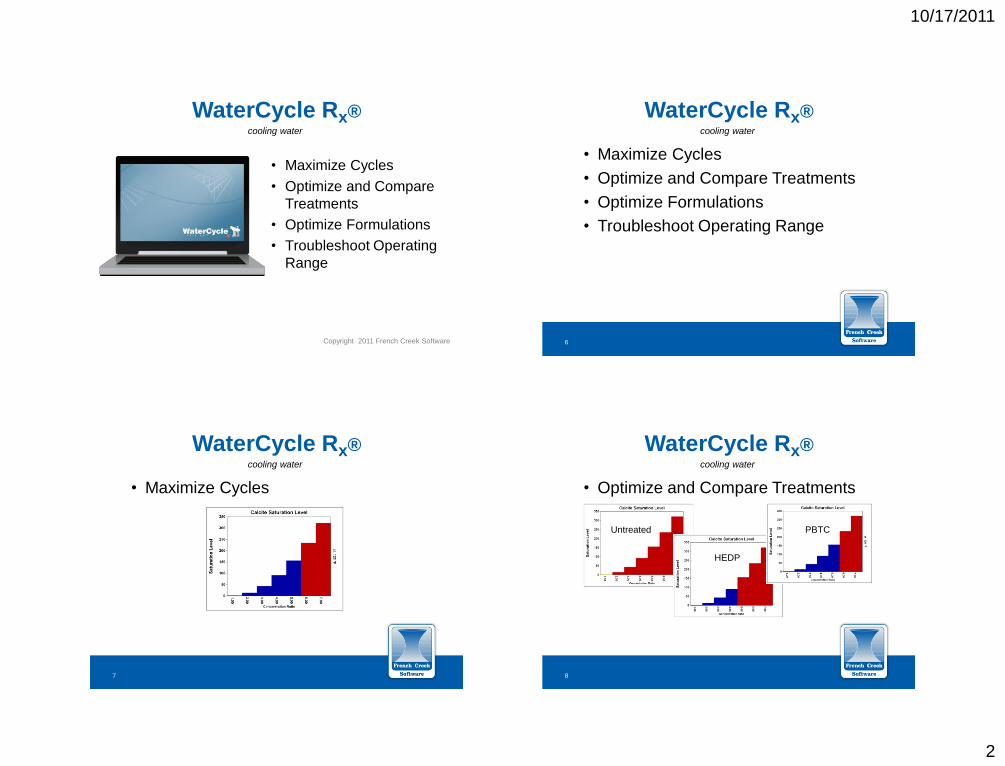
• Maximize Cycles
• Optimize and Compare
Treatments
• Optimize Formulations
• Troubleshoot Operating
Range
WaterCycle Rx® cooling water
5
• Maximize Cycles
• Optimize and Compare Treatments
• Optimize Formulations
• Troubleshoot Operating Range
WaterCycle Rx® cooling water
6
• Maximize Cycles
WaterCycle Rx® cooling water
7
• Optimize and Compare Treatments
WaterCycle Rx® cooling water
HEDP
PBTC Untreated
8
10/17/2011
3
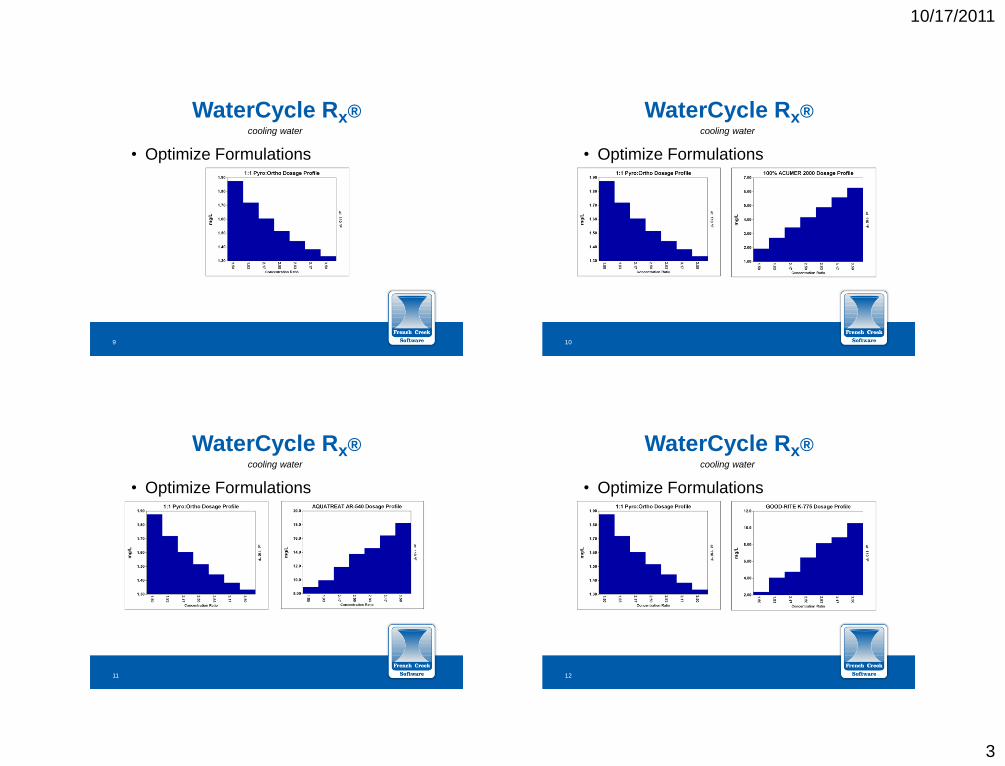
• Optimize Formulations
WaterCycle Rx® cooling water
9
• Optimize Formulations
WaterCycle Rx® cooling water
10
• Optimize Formulations
WaterCycle Rx® cooling water
11
• Optimize Formulations
WaterCycle Rx® cooling water
12
10/17/2011
4
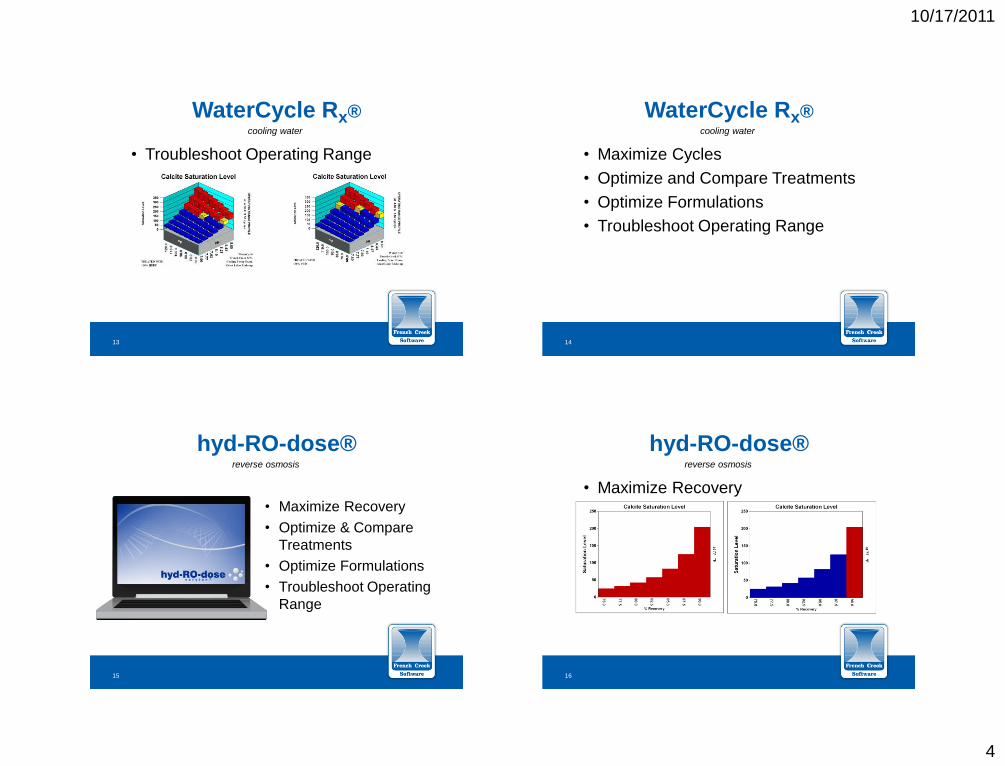
• Troubleshoot Operating Range
WaterCycle Rx® cooling water
13
• Maximize Cycles
• Optimize and Compare Treatments
• Optimize Formulations
• Troubleshoot Operating Range
WaterCycle Rx® cooling water
14
• Maximize Recovery
• Optimize & Compare
Treatments
• Optimize Formulations
• Troubleshoot Operating
Range
hyd-RO-dose® reverse osmosis
15
• Maximize Recovery
hyd-RO-dose® reverse osmosis
16
10/17/2011
5
• Troubleshoot Operating Range
hyd-RO-dose® reverse osmosis
17
• Lead and Copper Minimization
• Blend Waters
• Optimize & Compare Treatments
• Optimize Formulations
• Troubleshoot Operating Range
WatSIM™ potable/wastewater
18
• Lead and Copper Minimization
• Blend Waters
• Optimize & Compare Treatments
• Optimize Formulations
• Troubleshoot Operating Range
WatSIM™ potable/wastewater
19
• Lead and Copper Minimization
WatSIM™ potable/wastewater
20
10/17/2011
6
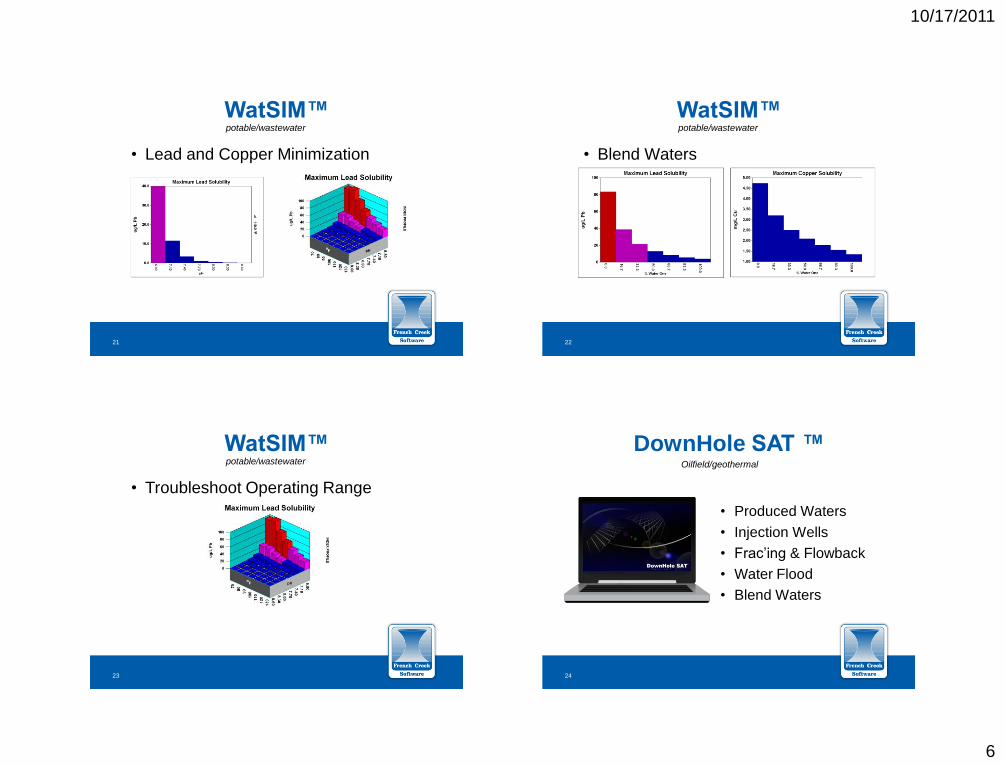
• Lead and Copper Minimization
WatSIM™ potable/wastewater
21
• Blend Waters
WatSIM™ potable/wastewater
22
• Troubleshoot Operating Range
WatSIM™ potable/wastewater
23
• Produced Waters
• Injection Wells
• Frac’ing & Flowback
• Water Flood
• Blend Waters
DownHole SAT ™ Oilfield/geothermal
24
10/17/2011
7
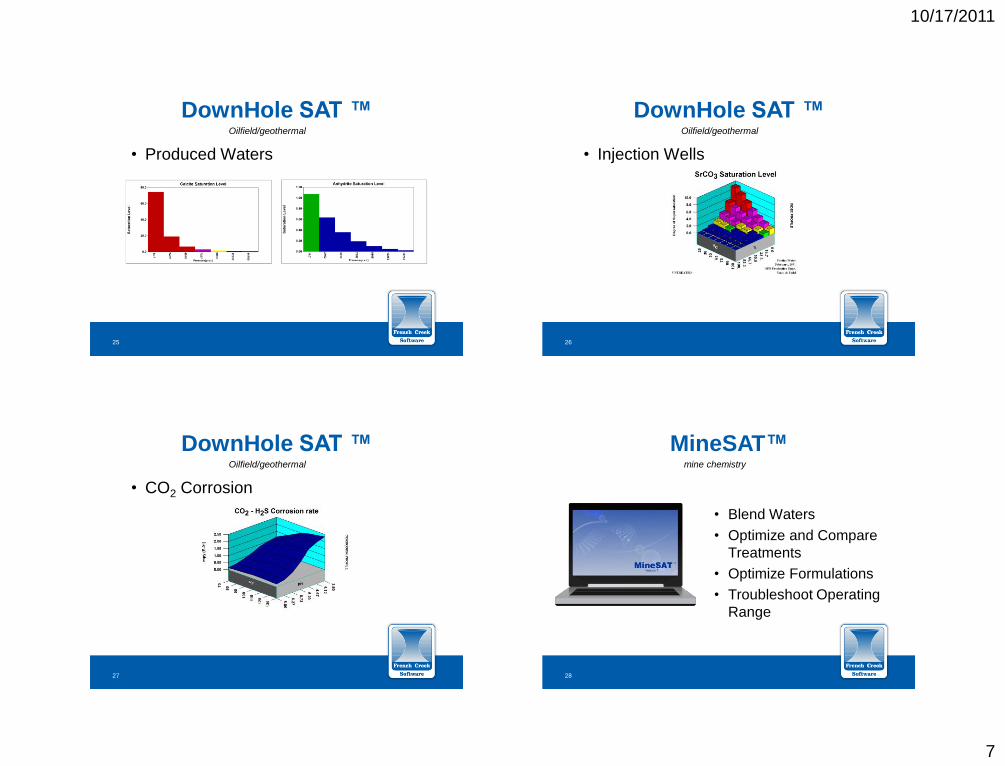
• Produced Waters
DownHole SAT ™ Oilfield/geothermal
25
• Injection Wells
DownHole SAT ™ Oilfield/geothermal
26
• CO2 Corrosion
DownHole SAT ™ Oilfield/geothermal
27
• Blend Waters
• Optimize and Compare
Treatments
• Optimize Formulations
• Troubleshoot Operating
Range
MineSAT™ mine chemistry
28
10/17/2011
8
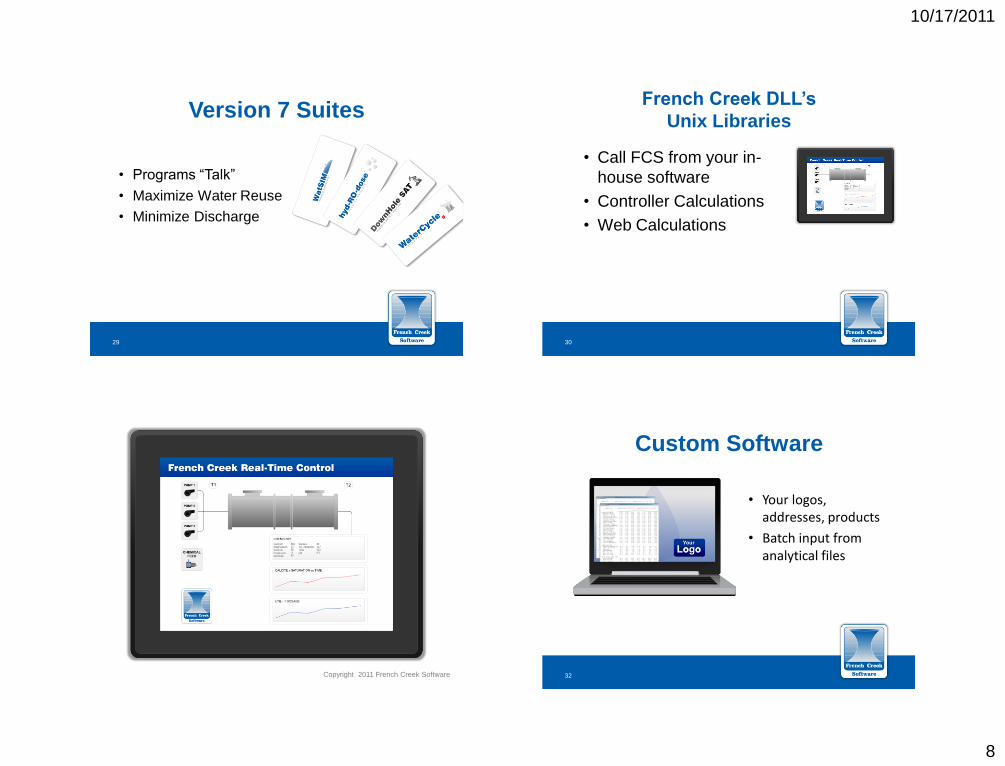
• Programs “Talk”
• Maximize Water Reuse
• Minimize Discharge
Version 7 Suites
29
• Call FCS from your in-
house software
• Controller Calculations
• Web Calculations
French Creek DLL’s
Unix Libraries
30
Copyright 2011 French Creek Software 31
• Your logos, addresses, products
• Batch input from analytical files
Custom Software
32
10/17/2011
9
Part 1 – Theory understanding the chemistry behind French Creek Software
33
• Solubility product
• Solubility relationships for common
scales
• Solubility and simple indices
• Thermodynamics versus kinetics (or when will it come out?)
The Concept of Saturation
34
• Solubility product
(Ca)(CO3) = Ksp
The Concept of Saturation
35
• Solubility product
(Ca)(CO3) = Ksp
The Concept of Saturation
Where:
•(Ca) is the calcium activity
•(CO3) is the carbonate activity
•Ksp is the solubility product for calcium
carbonate at the temperature under study.
36
10/17/2011
10
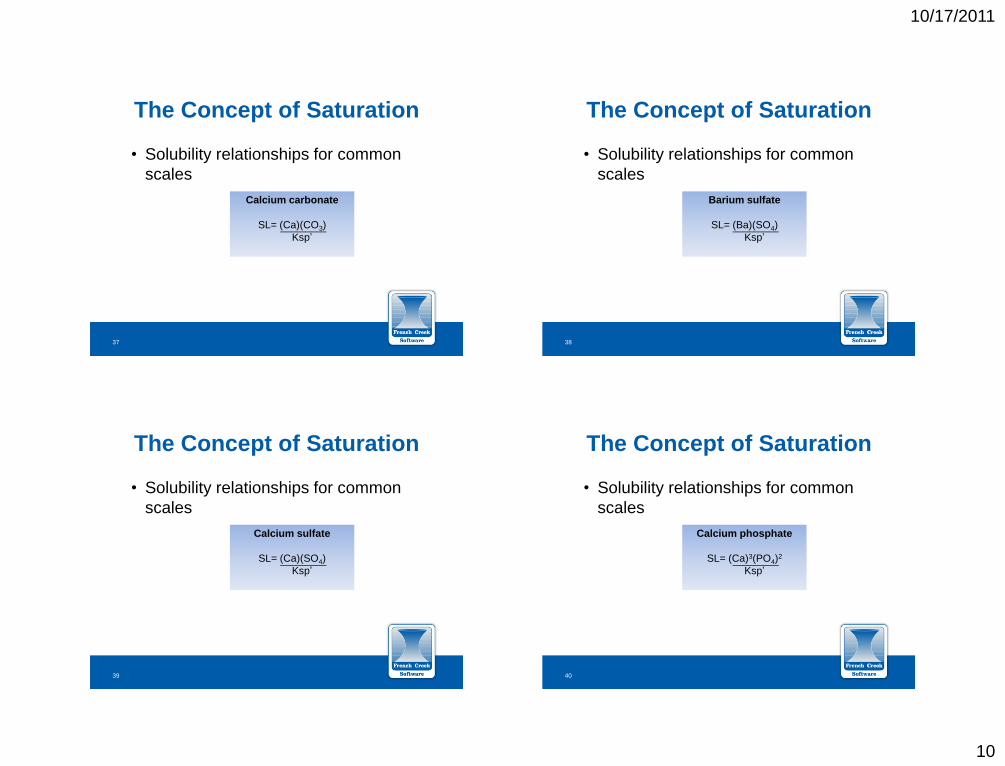
• Solubility relationships for common
scales
The Concept of Saturation
Calcium carbonate
SL= (Ca)(CO3)
Ksp’
_________
37
• Solubility relationships for common
scales
The Concept of Saturation
Barium sulfate
SL= (Ba)(SO4)
Ksp’
_________
38
• Solubility relationships for common
scales
The Concept of Saturation
Calcium sulfate
SL= (Ca)(SO4)
Ksp’
_________
39
• Solubility relationships for common
scales
The Concept of Saturation
Calcium phosphate
SL= (Ca)3(PO4)2
Ksp’
_________
40
10/17/2011
11
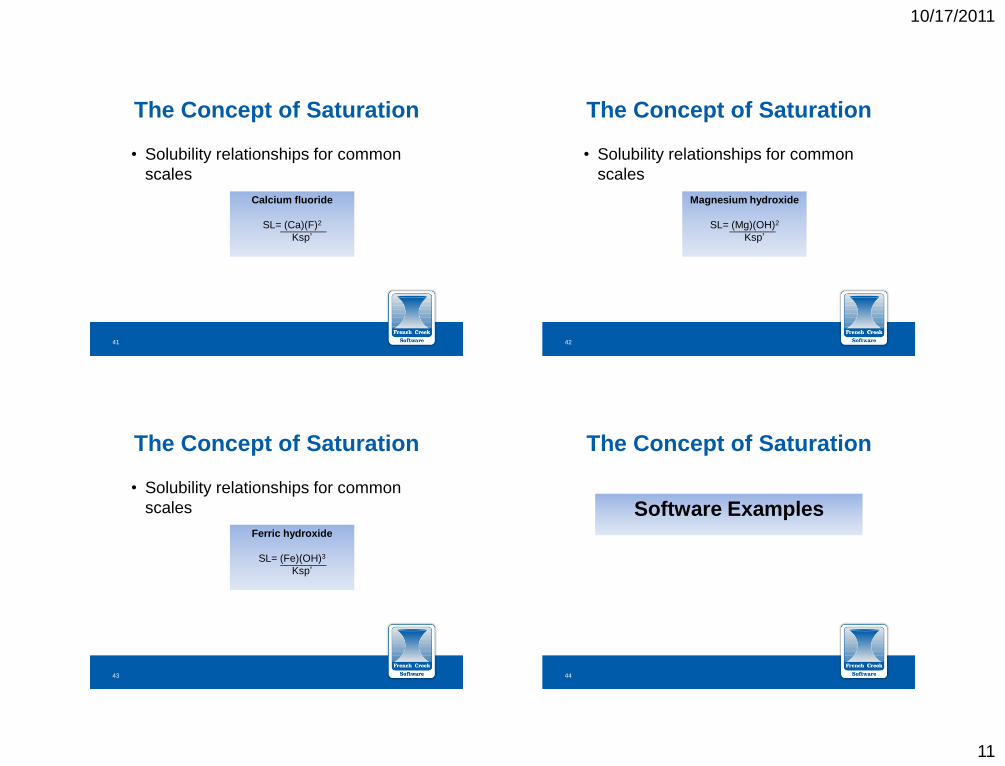
• Solubility relationships for common
scales
The Concept of Saturation
Calcium fluoride
SL= (Ca)(F)2
Ksp’
_________
41
• Solubility relationships for common
scales
The Concept of Saturation
Magnesium hydroxide
SL= (Mg)(OH)2
Ksp’
_________
42
• Solubility relationships for common
scales
The Concept of Saturation
Ferric hydroxide
SL= (Fe)(OH)3
Ksp’
_________
43
The Concept of Saturation
Software Examples
44
10/17/2011
12
Analytical Values or Free Ions?
• All ions are not free to form scale
• Analytical values are the total of
“free” and “bound” ions
The Concept of Saturation
45
Activity Coefficient Example
46
Activity Coefficient Example
47
Activity Coefficient Example
48
10/17/2011
13
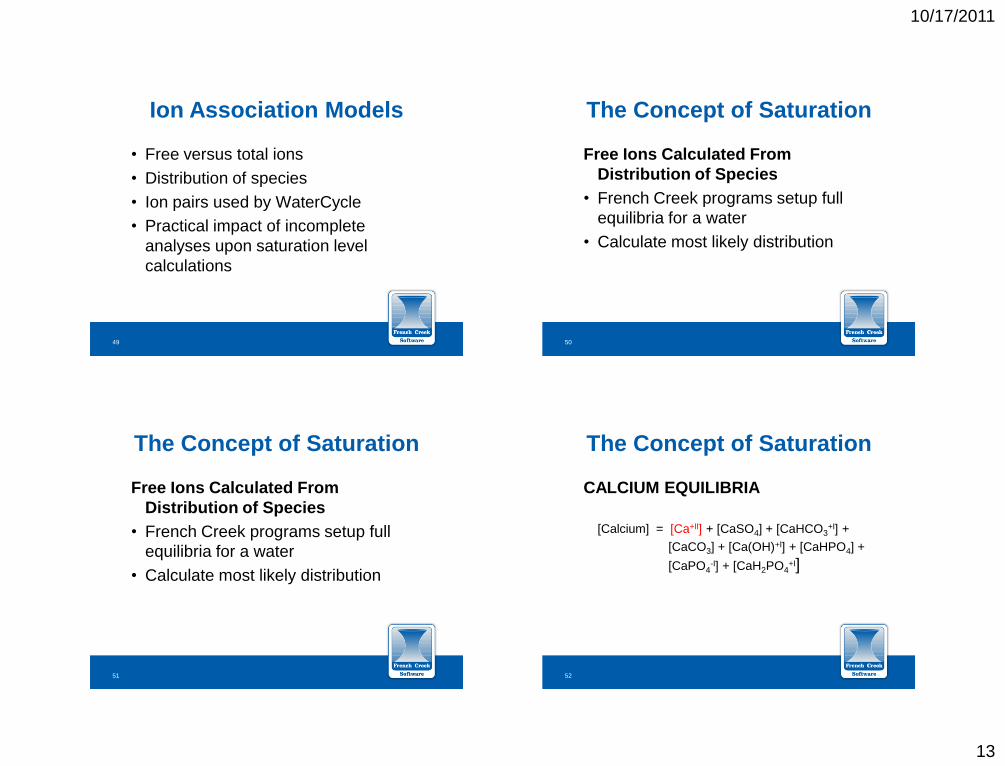
• Free versus total ions
• Distribution of species
• Ion pairs used by WaterCycle
• Practical impact of incomplete
analyses upon saturation level
calculations
Ion Association Models
49
Free Ions Calculated From
Distribution of Species
• French Creek programs setup full
equilibria for a water
• Calculate most likely distribution
The Concept of Saturation
50
Free Ions Calculated From
Distribution of Species
• French Creek programs setup full
equilibria for a water
• Calculate most likely distribution
The Concept of Saturation
51
CALCIUM EQUILIBRIA
[Calcium] = [Ca+II] + [CaSO4] + [CaHCO3
+I] +
[CaCO3] + [Ca(OH)+I] + [CaHPO4] +
[CaPO4-I] + [CaH2PO4
+I]
The Concept of Saturation
52
10/17/2011
14
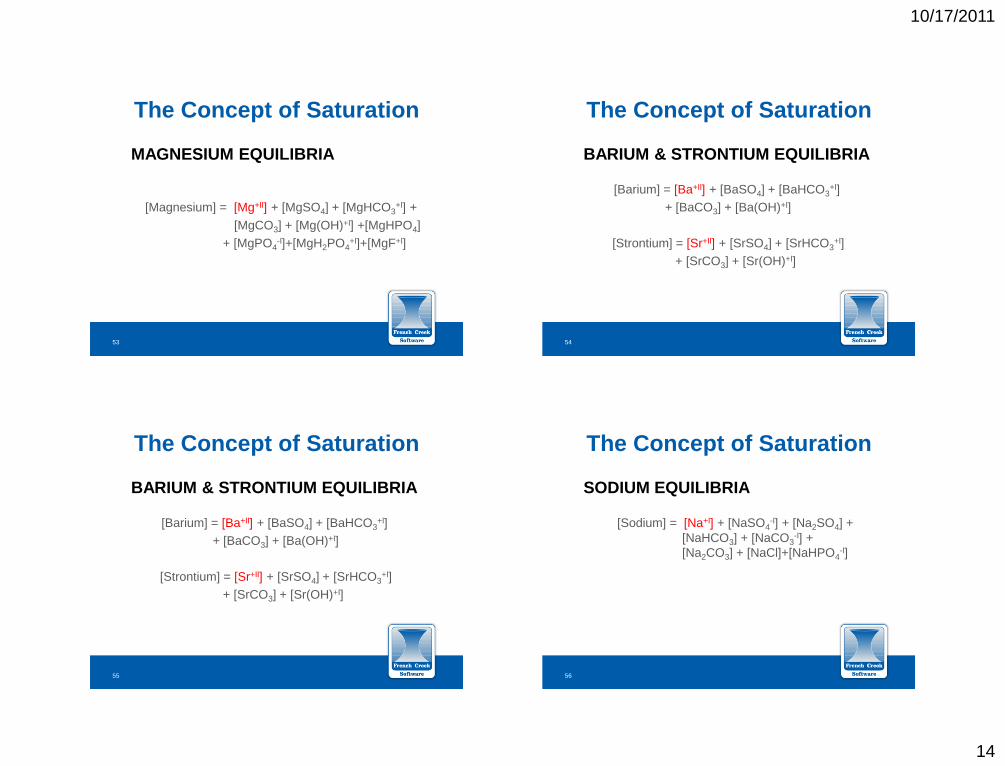
MAGNESIUM EQUILIBRIA
[Magnesium] = [Mg+II] + [MgSO4] + [MgHCO3+I] +
[MgCO3] + [Mg(OH)+I] +[MgHPO4]
+ [MgPO4-I]+[MgH2PO4
+I]+[MgF+I]
The Concept of Saturation
53
BARIUM & STRONTIUM EQUILIBRIA
[Barium] = [Ba+II] + [BaSO4] + [BaHCO3+I]
+ [BaCO3] + [Ba(OH)+I]
[Strontium] = [Sr+II] + [SrSO4] + [SrHCO3+I]
+ [SrCO3] + [Sr(OH)+I]
The Concept of Saturation
54
BARIUM & STRONTIUM EQUILIBRIA
[Barium] = [Ba+II] + [BaSO4] + [BaHCO3+I]
+ [BaCO3] + [Ba(OH)+I]
[Strontium] = [Sr+II] + [SrSO4] + [SrHCO3+I]
+ [SrCO3] + [Sr(OH)+I]
The Concept of Saturation
55
SODIUM EQUILIBRIA
[Sodium] = [Na+I] + [NaSO4-I] + [Na2SO4] +
[NaHCO3] + [NaCO3-I] +
[Na2CO3] + [NaCl]+[NaHPO4-I]
The Concept of Saturation
56
10/17/2011
15
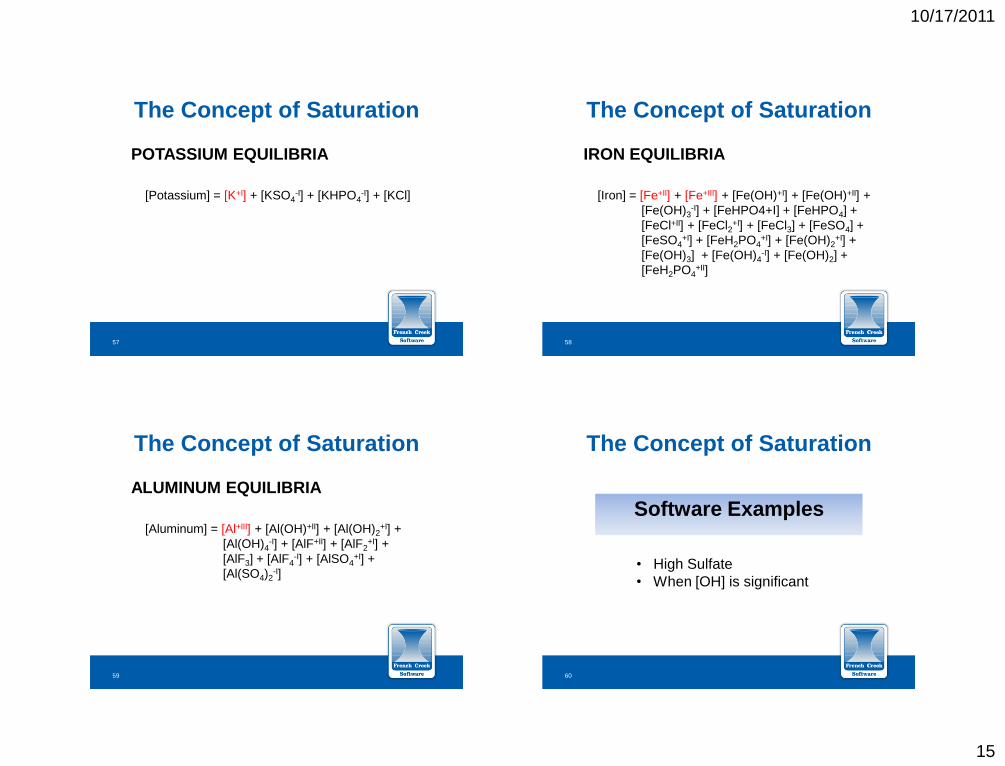
POTASSIUM EQUILIBRIA
[Potassium] = [K+I] + [KSO4
-I] + [KHPO4-I] + [KCl]
The Concept of Saturation
57
IRON EQUILIBRIA
[Iron] = [Fe+II] + [Fe+III] + [Fe(OH)+I] + [Fe(OH)+II] +
[Fe(OH)3-I] + [FeHPO4+I] + [FeHPO4] +
[FeCl+II] + [FeCl2+I] + [FeCl3] + [FeSO4] +
[FeSO4+I] + [FeH2PO4
+I] + [Fe(OH)2+I] +
[Fe(OH)3] + [Fe(OH)4-I] + [Fe(OH)2] +
[FeH2PO4+II]
The Concept of Saturation
58
ALUMINUM EQUILIBRIA
[Aluminum] = [Al+III] + [Al(OH)+II] + [Al(OH)2
+I] +
[Al(OH)4-I] + [AlF+II] + [AlF2
+I] +
[AlF3] + [AlF4-I] + [AlSO4
+I] +
[Al(SO4)2-I]
The Concept of Saturation
59
The Concept of Saturation
Software Examples
• High Sulfate
• When [OH] is significant
60
10/17/2011
16
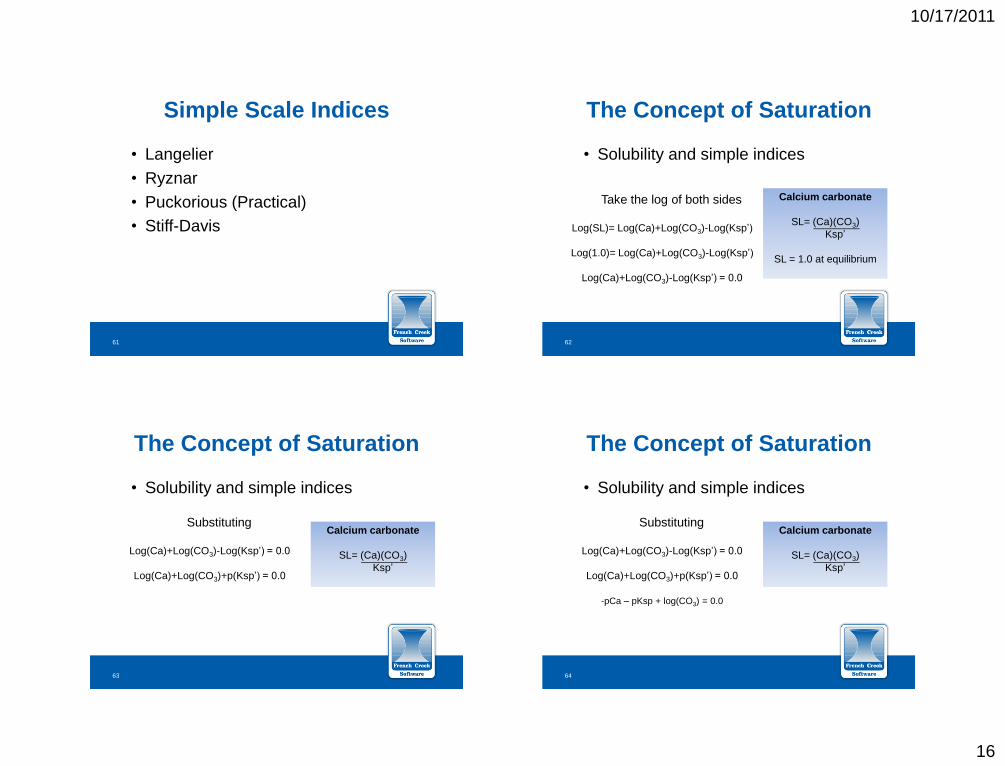
• Langelier
• Ryznar
• Puckorious (Practical)
• Stiff-Davis
Simple Scale Indices
61
• Solubility and simple indices
The Concept of Saturation
Calcium carbonate
SL= (Ca)(CO3)
Ksp’
SL = 1.0 at equilibrium
_________
Take the log of both sides
Log(SL)= Log(Ca)+Log(CO3)-Log(Ksp’)
Log(1.0)= Log(Ca)+Log(CO3)-Log(Ksp’)
Log(Ca)+Log(CO3)-Log(Ksp’) = 0.0
62
• Solubility and simple indices
The Concept of Saturation
Calcium carbonate
SL= (Ca)(CO3)
Ksp’
_________
Substituting
Log(Ca)+Log(CO3)-Log(Ksp’) = 0.0
Log(Ca)+Log(CO3)+p(Ksp’) = 0.0
63
• Solubility and simple indices
The Concept of Saturation
Calcium carbonate
SL= (Ca)(CO3)
Ksp’
_________
Substituting
Log(Ca)+Log(CO3)-Log(Ksp’) = 0.0
Log(Ca)+Log(CO3)+p(Ksp’) = 0.0
-pCa – pKsp + log(CO3) = 0.0
64
10/17/2011
17
• Solubility and simple indices
The Concept of Saturation
Calcium carbonate
SL= (Ca)(CO3)
Ksp’
_________
(H)(CO3)
(HCO3)
_______ K2 =
65
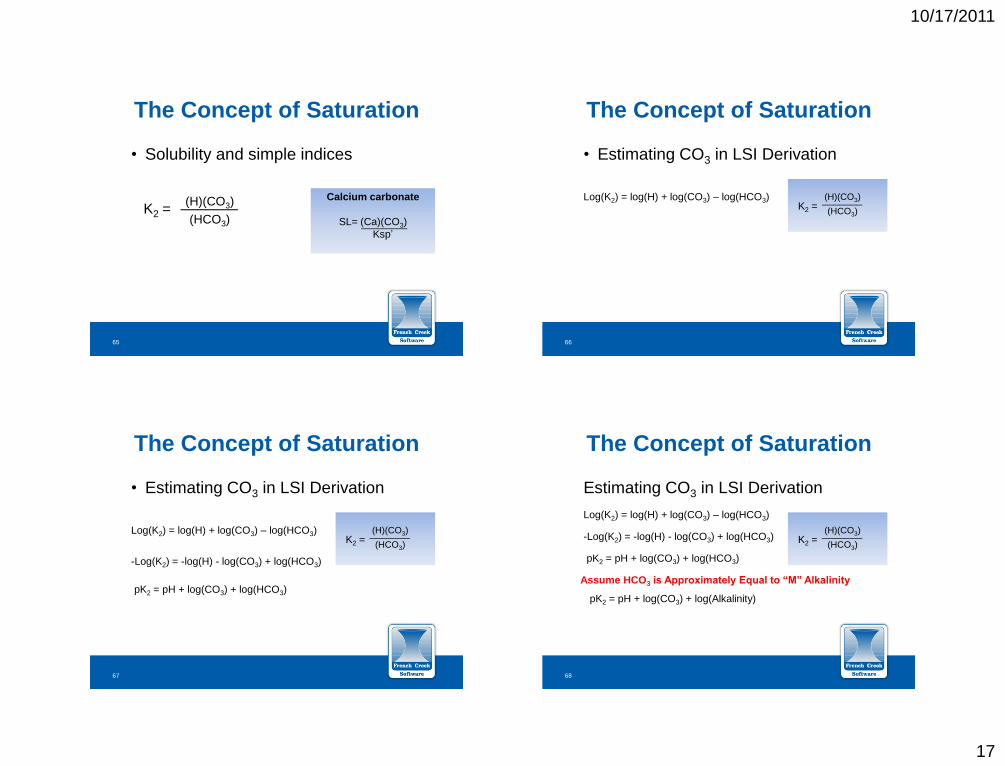
• Estimating CO3 in LSI Derivation
The Concept of Saturation
(H)(CO3)
(HCO3)
_______ K2 =
Log(K2) = log(H) + log(CO3) – log(HCO3)
66
• Estimating CO3 in LSI Derivation
The Concept of Saturation
(H)(CO3)
(HCO3) _______
K2 = Log(K2) = log(H) + log(CO3) – log(HCO3)
-Log(K2) = -log(H) - log(CO3) + log(HCO3)
pK2 = pH + log(CO3) + log(HCO3)
67
Estimating CO3 in LSI Derivation
The Concept of Saturation
(H)(CO3)
(HCO3) _______
K2 =
Log(K2) = log(H) + log(CO3) – log(HCO3)
-Log(K2) = -log(H) - log(CO3) + log(HCO3)
pK2 = pH + log(CO3) + log(HCO3)
Assume HCO3 is Approximately Equal to “M” Alkalinity
pK2 = pH + log(CO3) + log(Alkalinity)
68
10/17/2011
18
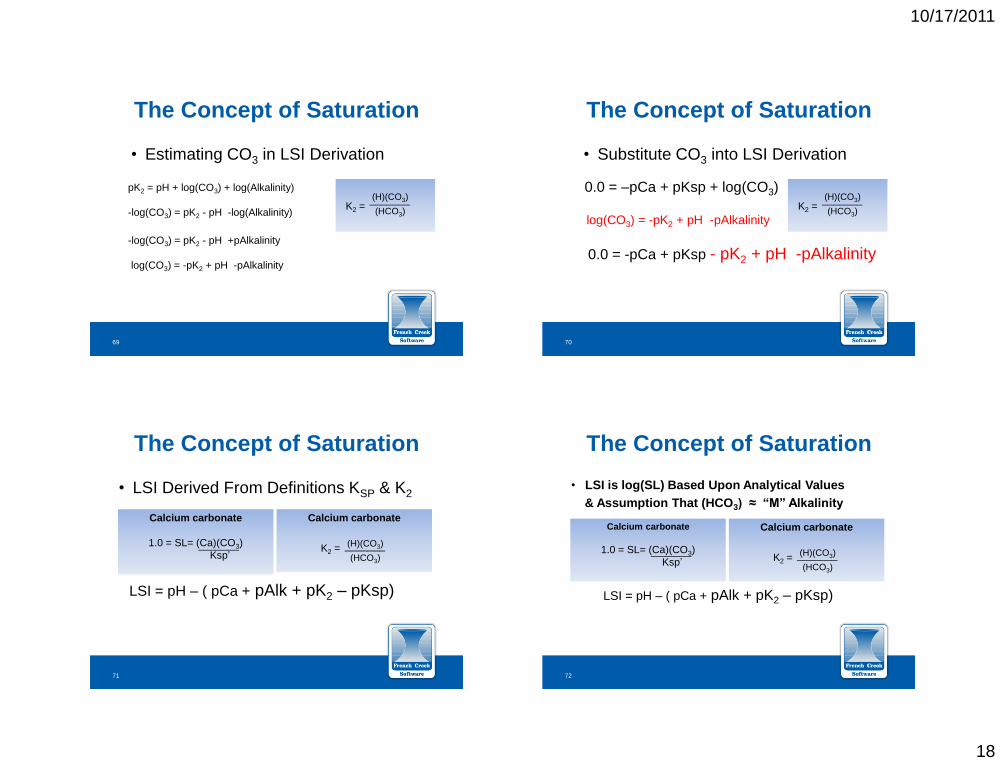
• Estimating CO3 in LSI Derivation
The Concept of Saturation
(H)(CO3)
(HCO3)
_______ K2 =
pK2 = pH + log(CO3) + log(Alkalinity)
-log(CO3) = pK2 - pH -log(Alkalinity)
-log(CO3) = pK2 - pH +pAlkalinity
log(CO3) = -pK2 + pH -pAlkalinity
69
• Substitute CO3 into LSI Derivation
The Concept of Saturation
(H)(CO3)
(HCO3)
_______ K2 =
log(CO3) = -pK2 + pH -pAlkalinity
0.0 = –pCa + pKsp + log(CO3)
0.0 = -pCa + pKsp - pK2 + pH -pAlkalinity
70
• LSI Derived From Definitions KSP & K2
The Concept of Saturation
LSI = pH – ( pCa + pAlk + pK2 – pKsp)
Calcium carbonate
1.0 = SL= (Ca)(CO3)
Ksp’
_______
Calcium carbonate
_______ K2 =
(H)(CO3)
(HCO3)
71
• LSI is log(SL) Based Upon Analytical Values
& Assumption That (HCO3) ≈ “M” Alkalinity
The Concept of Saturation
LSI = pH – ( pCa + pAlk + pK2 – pKsp)
Calcium carbonate
1.0 = SL= (Ca)(CO3)
Ksp’
_______
Calcium carbonate
_______ K2 =
(H)(CO3)
(HCO3)
72
10/17/2011
19
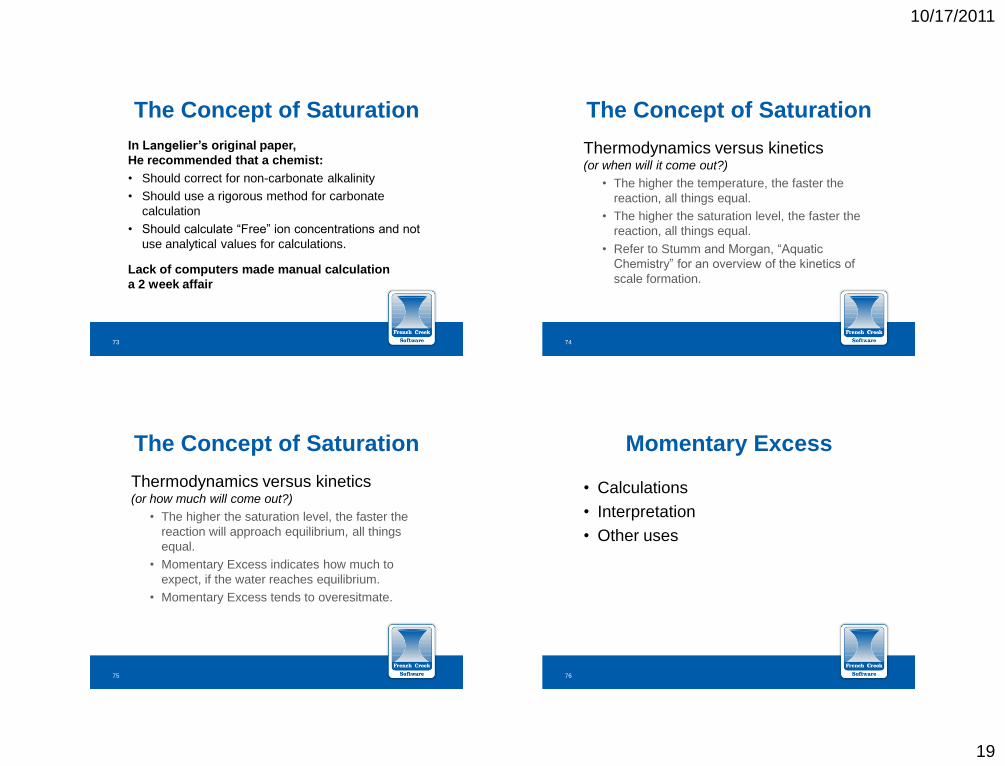
In Langelier’s original paper,
He recommended that a chemist:
• Should correct for non-carbonate alkalinity
• Should use a rigorous method for carbonate
calculation
• Should calculate “Free” ion concentrations and not
use analytical values for calculations.
Lack of computers made manual calculation
a 2 week affair
The Concept of Saturation
73
Thermodynamics versus kinetics
(or when will it come out?)
• The higher the temperature, the faster the
reaction, all things equal.
• The higher the saturation level, the faster the
reaction, all things equal.
• Refer to Stumm and Morgan, “Aquatic
Chemistry” for an overview of the kinetics of
scale formation.
The Concept of Saturation
74
Thermodynamics versus kinetics
(or how much will come out?)
• The higher the saturation level, the faster the
reaction will approach equilibrium, all things
equal.
• Momentary Excess indicates how much to
expect, if the water reaches equilibrium.
• Momentary Excess tends to overesitmate.
The Concept of Saturation
75
• Calculations
• Interpretation
• Other uses
Momentary Excess
76
10/17/2011
20
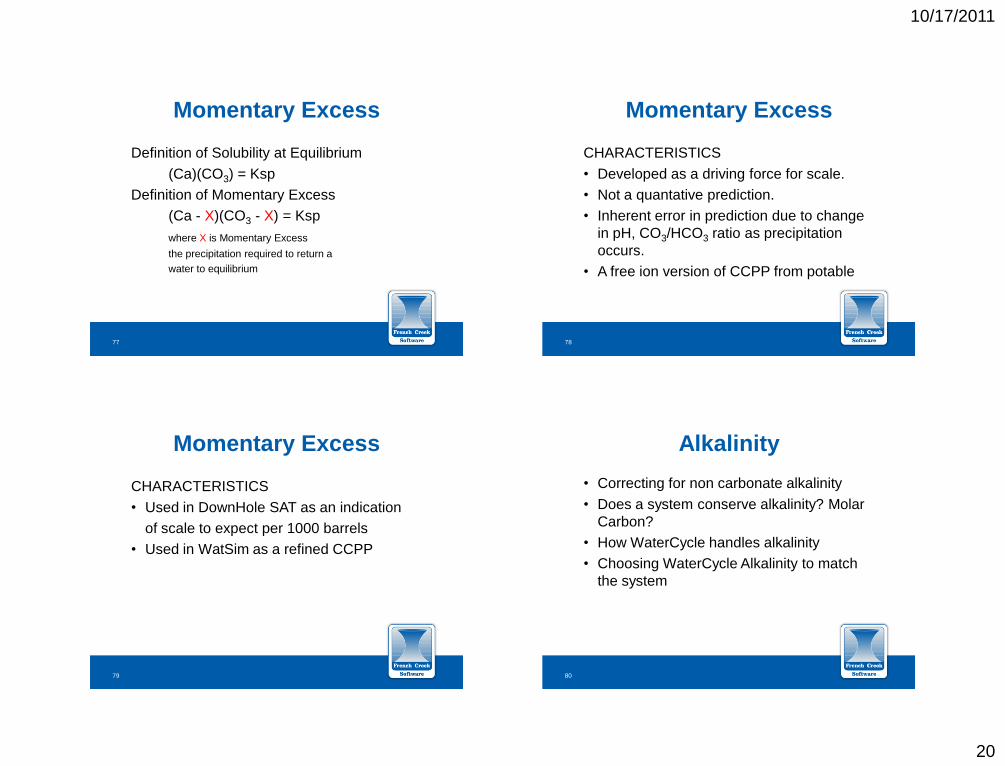
Definition of Solubility at Equilibrium
(Ca)(CO3) = Ksp
Definition of Momentary Excess
(Ca - X)(CO3 - X) = Ksp
where X is Momentary Excess
the precipitation required to return a
water to equilibrium
Momentary Excess
77
CHARACTERISTICS
• Developed as a driving force for scale.
• Not a quantative prediction.
• Inherent error in prediction due to change
in pH, CO3/HCO3 ratio as precipitation
occurs.
• A free ion version of CCPP from potable
Momentary Excess
78
CHARACTERISTICS
• Used in DownHole SAT as an indication
of scale to expect per 1000 barrels
• Used in WatSim as a refined CCPP
Momentary Excess
79
• Correcting for non carbonate alkalinity
• Does a system conserve alkalinity? Molar
Carbon?
• How WaterCycle handles alkalinity
• Choosing WaterCycle Alkalinity to match
the system
Alkalinity
80
10/17/2011
21
• Correcting for non carbonate
alkalinity
• The classic definition:
“M”=HCO3- + 2CO3
= + OH- - H+
Alkalinity
81
• Correcting for non carbonate
alkalinity
• The classic definition:
“M”=HCO3- + 2CO3
= + OH- - H+
• When other alkalis are present:
“M”=HCO3- + 2CO3
= + OH- - H+ +A-
Alkalinity
82
• Correcting for non carbonate
alkalinity
When other alkalis are present:
“M”=HCO3- + 2CO3
= + OH- - H+ +A-
Where A is the sum of phosphate alkalinity,
contribution, silicate contribution, and any other
alkalis that may be present
Alkalinity
83
• Correcting for non carbonate
alkalinity
HCO3- + 2CO3
= = “M”- OH- + H+ - A-
Alkalinity
84
10/17/2011
22
• Estimating carbonate
K2 = {H}{CO3}/{HCO3}
CO3=K2{HCO3}/{H}
HCO3- + 2CO3
= = “M”- OH- + H+ - A-
Alkalinity
85
• Does a system conserve alkalinity?
Molar Carbon?
Alkalinity
86
• Alkalinity
“M” = [HCO3] + 2 * [CO3]+ [OH] – [H]
• Molar Carbon
Ct = [H2CO3] + [HCO3] + [CO3]
Alkalinity
87
Alkalinity (OPEN SYSTEM)
• “M” = [HCO3] + 2 * [CO3]+ [OH] – [H]
• Free CO2 exchange with the atmosphere
• Cooling Tower is classic open system
• Recarbonation of Cold Lime Softened
Water
• Flashing of CO2 from Deep Well Water
Alkalinity versus Ct
88
10/17/2011
23
Molar Carbon (CLOSED SYSTEM)
• Ct = [H2CO3] + [HCO3] + [CO3]
• No CO2 exchange with atmosphere
• “Tight” unvented Reverse Osmosis Unit
Alkalinity versus Ct
89
How hyd-RO-dose handles alkalinity
CLOSED pH CALCULATION
Default Conserve Ct
VENTED pH CALCULATION
Conserve Alkalinity
Alkalinity and Ct
90
Carbonic acid Distribution of Species
Carbonic acid and dissolved CO2
Bicarbonate
Carbonate
91
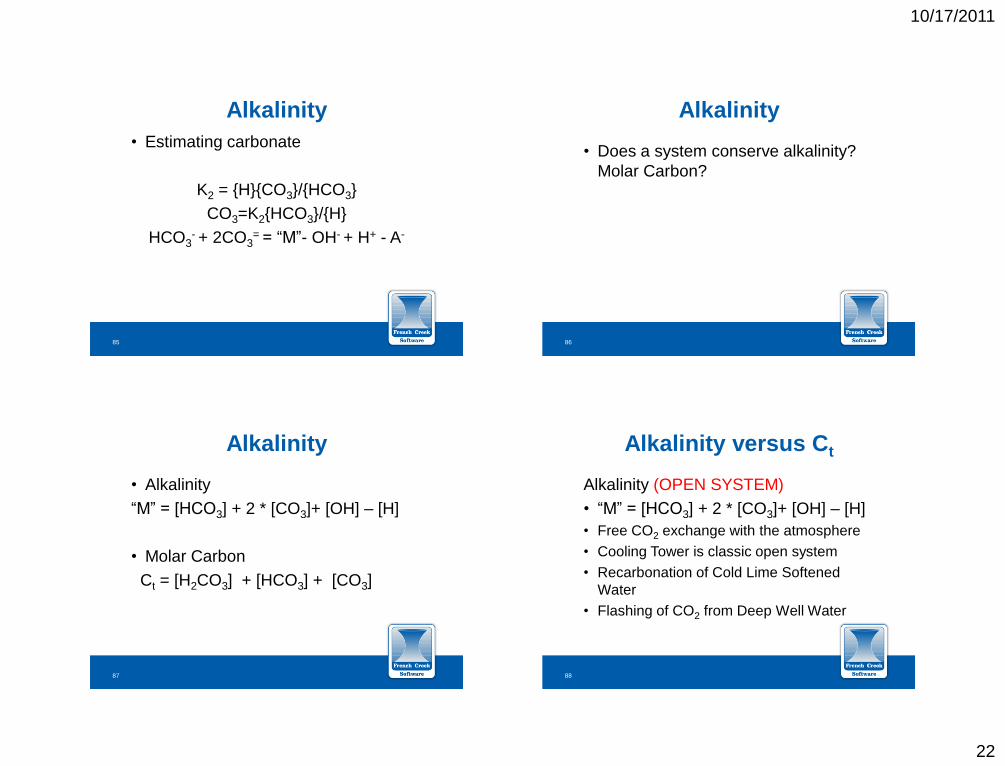
Closed System – Acid Added To Decrease pH
Carbonic acid and dissolved CO2
Bicarbonate
Carbonate
Equilibrium shifts toward CO2 – carbonic acid
Ct constant, alkalinity changes
92
10/17/2011
24
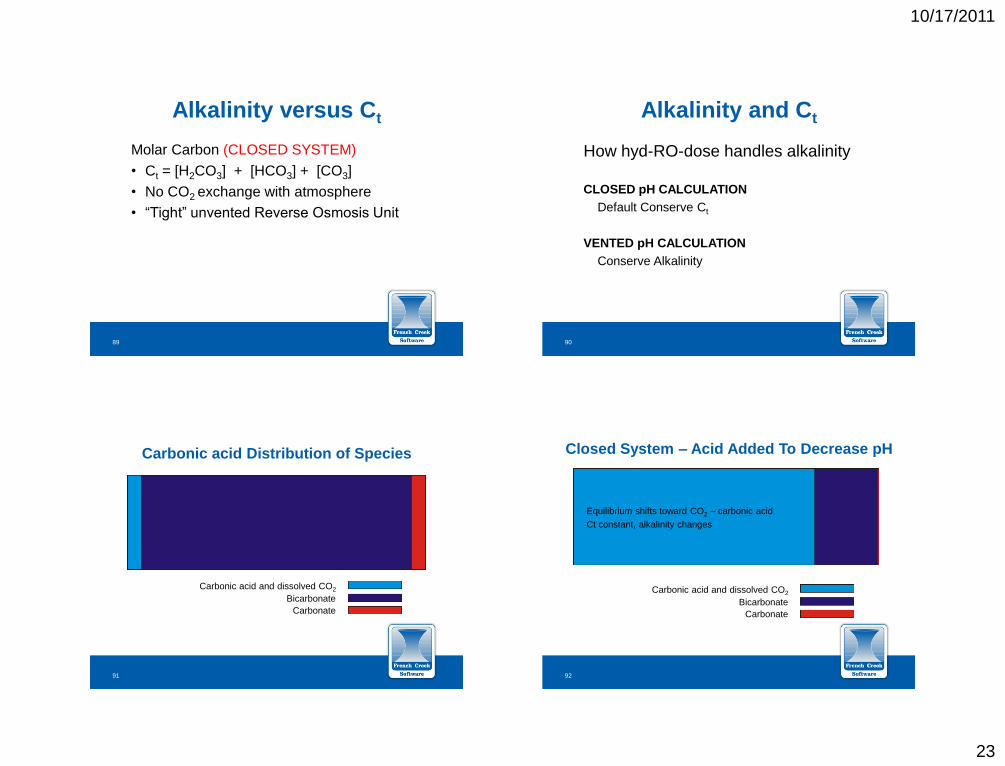
Open System – Acid Added To Decrease pH
Carbonic acid and dissolved CO2
Bicarbonate
Carbonate
Equilibrium shifts toward CO2 – carbonic acid
Ct decreases, alkalinity changes
93
The Concept of Saturation
Software Examples
hyd-RO-dose - Closed versus
Open pH prediction and control
94
• Choose the appropriate WaterCycle
carbonic acid calculation method to
match the system
“Closed” for once through
“Open” for cooling towers
Alkalinity and Ct
95
• Choose the appropriate MineSAT
carbonic acid calculation method to
match the system
“Closed” for unvented mixing,
once through systems
“Open” for mixing, pH adjustment
in vented systems
Alkalinity and Ct
96
10/17/2011
25
• Kunz Curve: pH versus Alkalinity for Great Lakes
Water
• Translate Source pH: Kunz curve slope with
source water as intercept
• Manufacturer’s Calculation: classic alteration to
CO3/HCO3 or HCO3/H2CO3 ratio based upon acid
addition
• User Defined Curve
Predicting pH
97
Predicting pH
Software Examples
How many points does it take
to define a line?
98
Predicting pH
How many points does it take
to define a line?
y = mx + b
y pH
m slope
x alkalinity
b intercept
99
We Digress…
Why is the pH at 1.0 cycle different than
the make-up water pH?
Two Examples:
Cold lime softened make-up pH 10+
recarbonates as it circulates. pH drops to
8 something.
100
10/17/2011
26
We Digress…
Why is the pH at 1.0 cycle different than
the make-up water pH?
Example 2:
Deep well water. High pCO2. pH mid 6’s.
CO2 flashes like a soda bottle. pH rises to
7’s.
101
• Free versus total ions
• Distribution of species
• Ion pairs used by WaterCycle
• Practical impact of incomplete
analyses upon saturation level
calculations
Ion Association Models
102
• Practical impact of incomplete
analyses upon saturation level
calculations
Ion Association Models
103
Untreated
> 1.0 Supersaturated
= 1.0 At Equilibrium
< 1.0 Undersaturated
Saturation Level Limits
104
10/17/2011
27
Zone of Supersaturation
A water can be supersaturated
for a finite period of time, with or
without treatment.
Saturation Level Limits
105
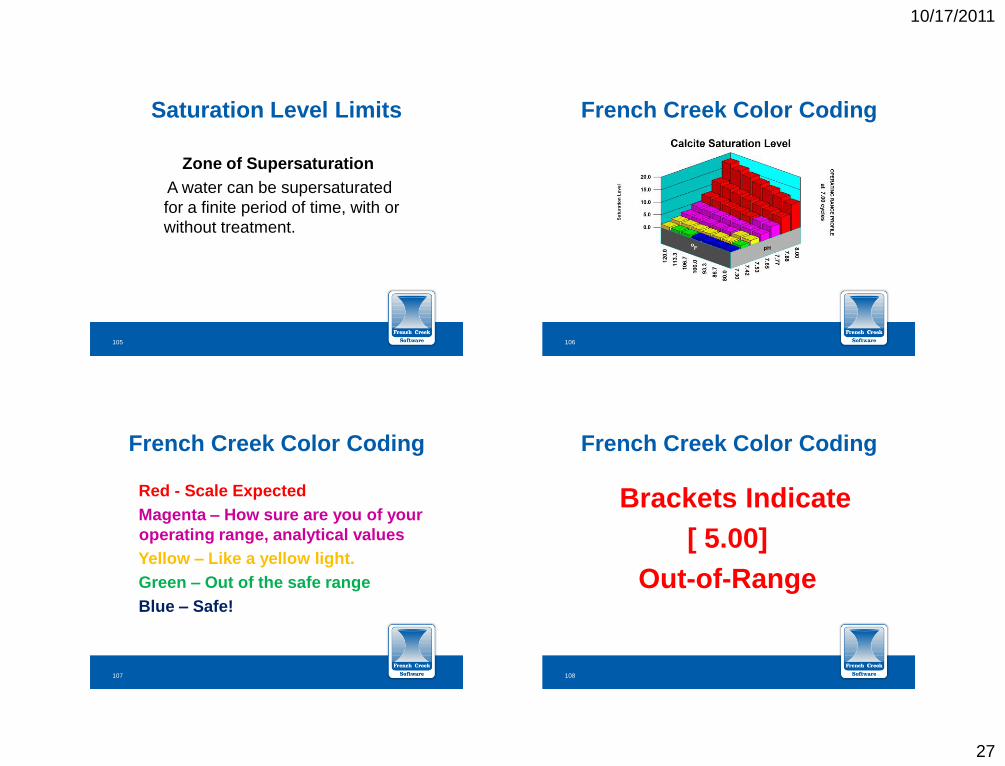
French Creek Color Coding
106
French Creek Color Coding
Red - Scale Expected
Magenta – How sure are you of your
operating range, analytical values
Yellow – Like a yellow light.
Green – Out of the safe range
Blue – Safe!
107
French Creek Color Coding
Brackets Indicate
[ 5.00]
Out-of-Range
108
10/17/2011
28
CaCO3
135 – 150 xSat HEDP, ATMP, PAA
200 – 225 xSat PBTC, Blends
Saturation Level Limits
109
Calcium sulfate. Gypsum? Anhydrite?
• CaSO4*2H2O Gypsum at lower
temperature
• CaSO4 Anhydrite at higher
temperature
Saturation Level Limits
110
Calcium sulfate
• 2.5 – 5.0 xSat HEDP, ATMP, PAA
• 5.0+ xSat PCA, Specialized
phosphonates
Very responsive to induction time extension
Saturation Level Limits
111
Calcium phosphate
Tricalcium phosphate? Hydroxyapatite?
Alkaline Phosphate Program 400 – 1200 xSat
Phosphate Scale Control 125,000 xSat
Saturation Level Limits
112
10/17/2011
29
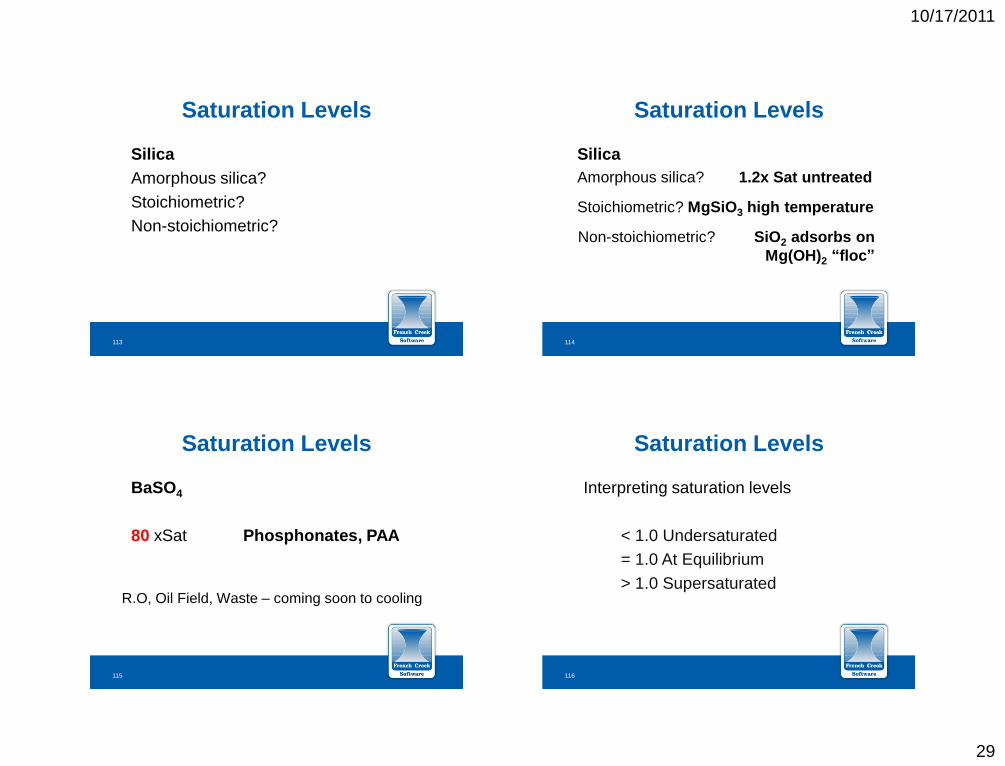
Silica
Amorphous silica?
Stoichiometric?
Non-stoichiometric?
Saturation Levels
113
Silica
Amorphous silica? 1.2x Sat untreated
Stoichiometric? MgSiO3 high temperature
Non-stoichiometric? SiO2 adsorbs on
Mg(OH)2 “floc”
Saturation Levels
114
BaSO4
80 xSat Phosphonates, PAA
Saturation Levels
R.O, Oil Field, Waste – coming soon to cooling
115
Interpreting saturation levels
< 1.0 Undersaturated
= 1.0 At Equilibrium
> 1.0 Supersaturated
Saturation Levels
116
10/17/2011
30
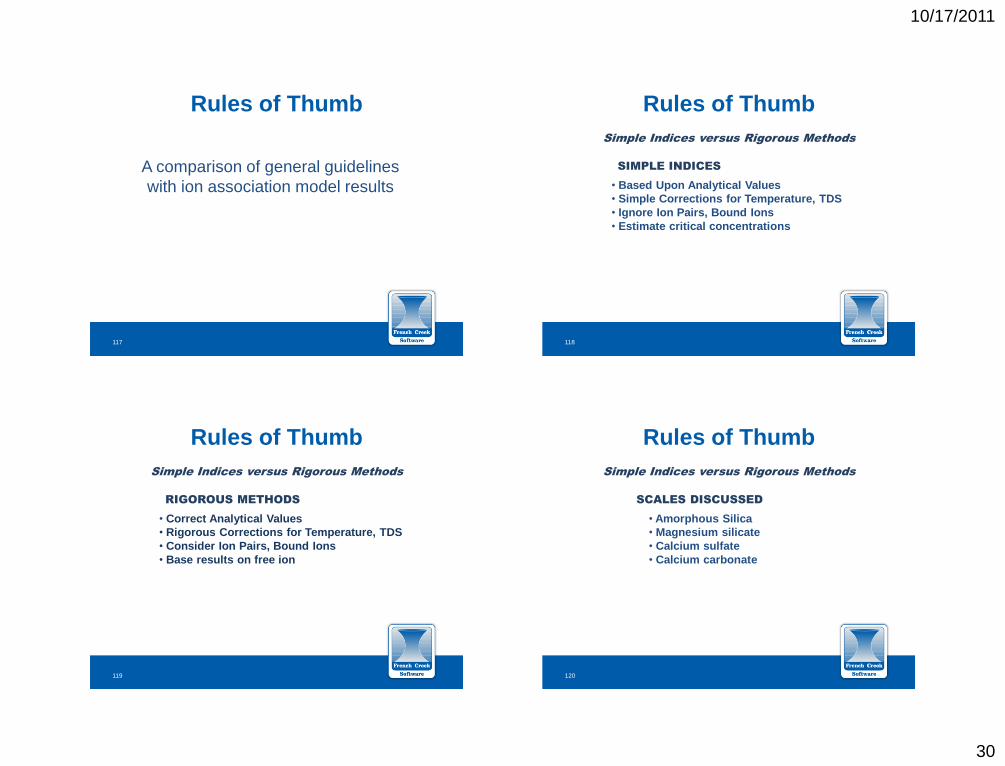
Rules of Thumb
A comparison of general guidelines
with ion association model results
117
SIMPLE INDICES
• Based Upon Analytical Values
• Simple Corrections for Temperature, TDS
• Ignore Ion Pairs, Bound Ions
• Estimate critical concentrations
Rules of Thumb
Simple Indices versus Rigorous Methods
118
RIGOROUS METHODS
• Correct Analytical Values
• Rigorous Corrections for Temperature, TDS
• Consider Ion Pairs, Bound Ions
• Base results on free ion
Rules of Thumb
Simple Indices versus Rigorous Methods
119
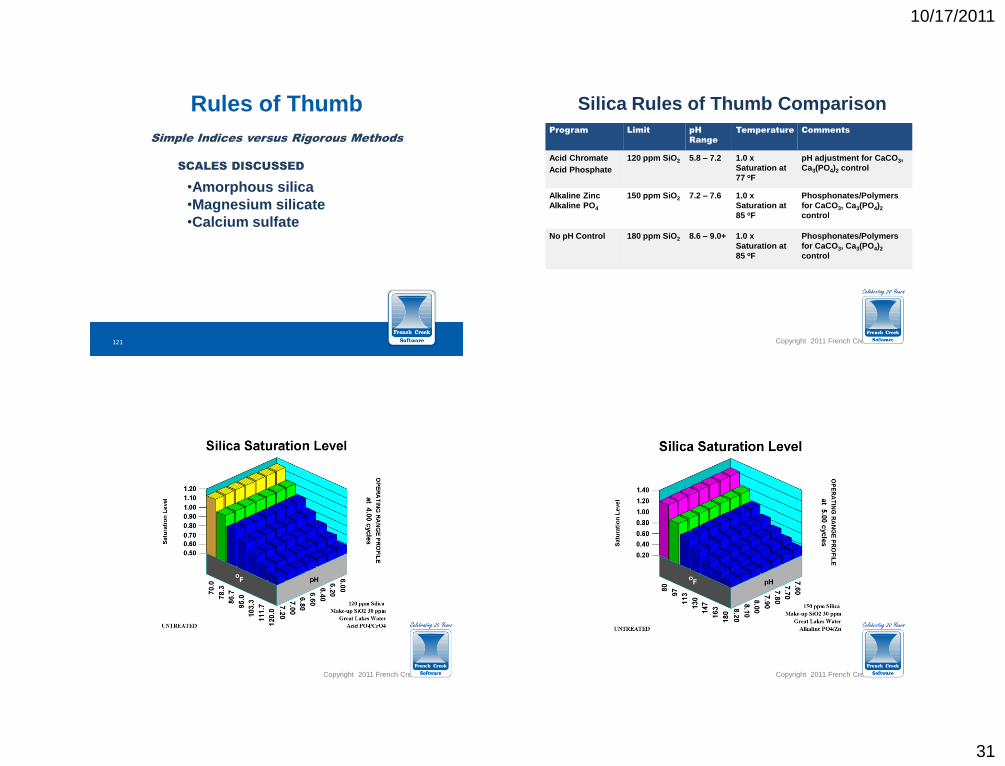
SCALES DISCUSSED
• Amorphous Silica
• Magnesium silicate
• Calcium sulfate
• Calcium carbonate
Rules of Thumb
Simple Indices versus Rigorous Methods
120
10/17/2011
31
SCALES DISCUSSED
•Amorphous silica
•Magnesium silicate
•Calcium sulfate
Rules of Thumb
Simple Indices versus Rigorous Methods
121 Copyright 2011 French Creek Software
Water Treatment Rules of Thumb
Program Limit pH
Range
Temperature Comments
Acid Chromate
Acid Phosphate
120 ppm SiO2
5.8 – 7.2
1.0 x
Saturation at
77 oF
pH adjustment for CaCO3,
Ca3(PO4)2 control
Alkaline Zinc
Alkaline PO4
150 ppm SiO2
7.2 – 7.6
1.0 x
Saturation at
85 oF
Phosphonates/Polymers
for CaCO3, Ca3(PO4)2
control
No pH Control 180 ppm SiO2
8.6 – 9.0+ 1.0 x
Saturation at
85 oF
Phosphonates/Polymers
for CaCO3, Ca3(PO4)2
control
Silica Rules of Thumb Comparison
122
Copyright 2011 French Creek Software 123 Copyright 2011 French Creek Software 124
10/17/2011
32
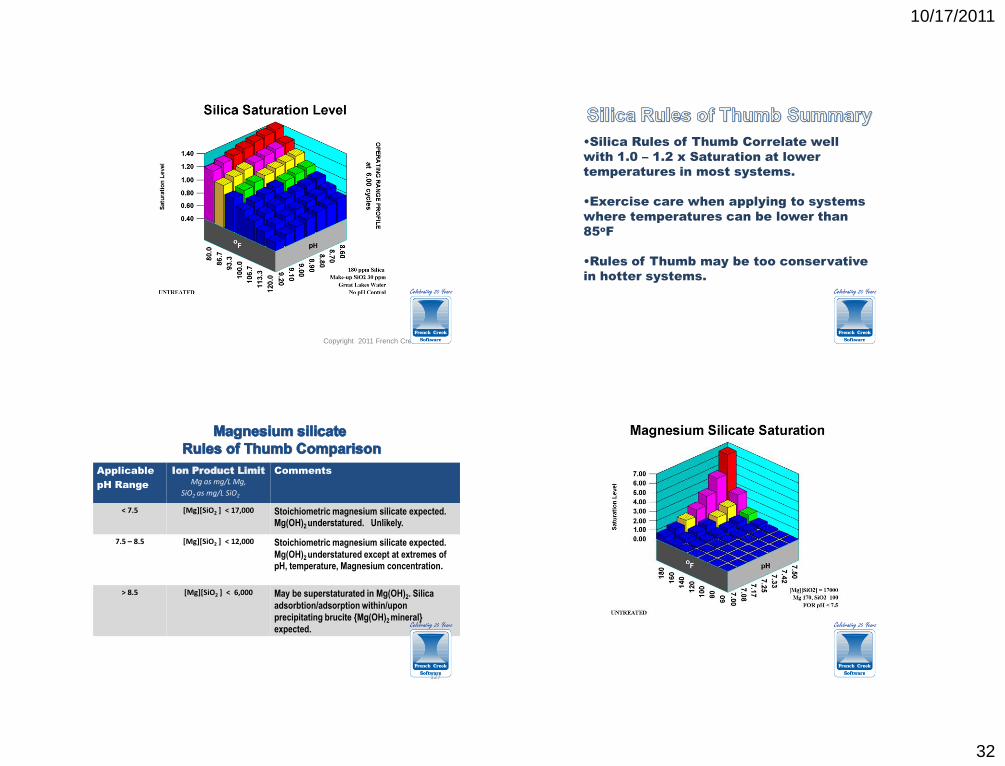
Copyright 2011 French Creek Software 125
•Silica Rules of Thumb Correlate well
with 1.0 – 1.2 x Saturation at lower
temperatures in most systems.
•Exercise care when applying to systems
where temperatures can be lower than
85oF
•Rules of Thumb may be too conservative
in hotter systems.
126
Applicable
pH Range
Ion Product Limit
Mg as mg/L Mg,
SiO2 as mg/L SiO2
Comments
< 7.5 [Mg][SiO2 ] < 17,000
Stoichiometric magnesium silicate expected. Mg(OH)2
understatured. Unlikely.
7.5 – 8.5 [Mg][SiO2 ] < 12,000
Stoichiometric magnesium silicate expected.
Mg(OH)2 understatured except at extremes of
pH, temperature, Magnesium concentration.
> 8.5 [Mg][SiO2 ] < 6,000 May be superstaturated in Mg(OH)2. Silica
adsorbtion/adsorption within/upon
precipitating brucite {Mg(OH)2 mineral}
expected.
127
128
10/17/2011
33
129
130
131
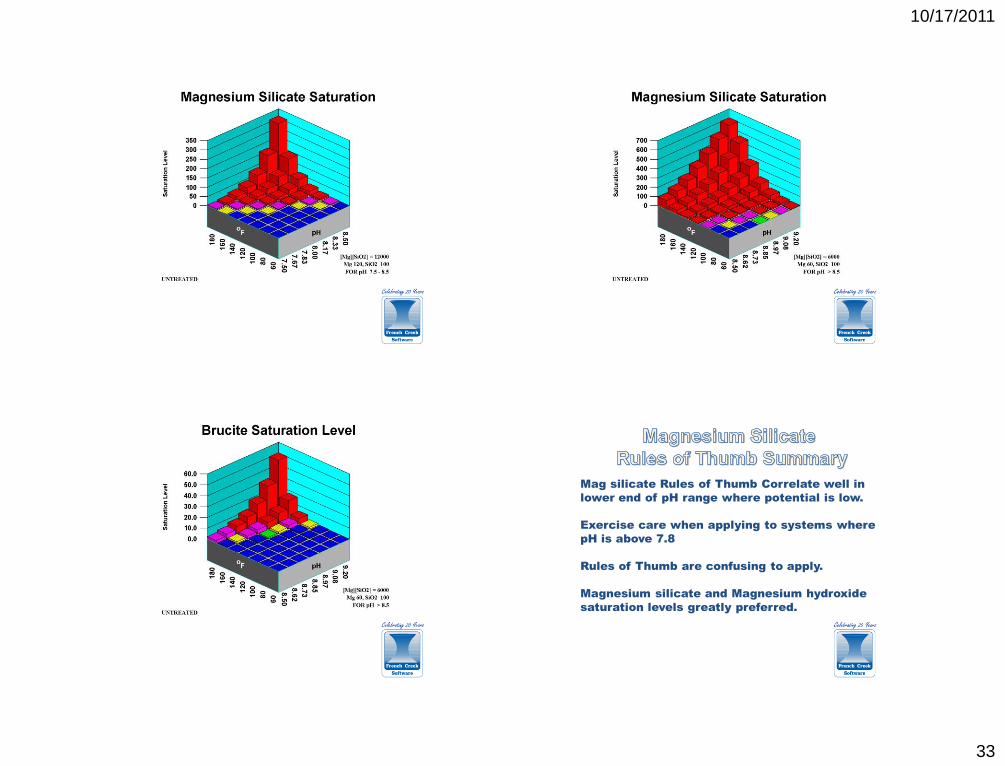
Mag silicate Rules of Thumb Correlate well in
lower end of pH range where potential is low.
Exercise care when applying to systems where
pH is above 7.8
Rules of Thumb are confusing to apply.
Magnesium silicate and Magnesium hydroxide
saturation levels greatly preferred.
132
10/17/2011
34
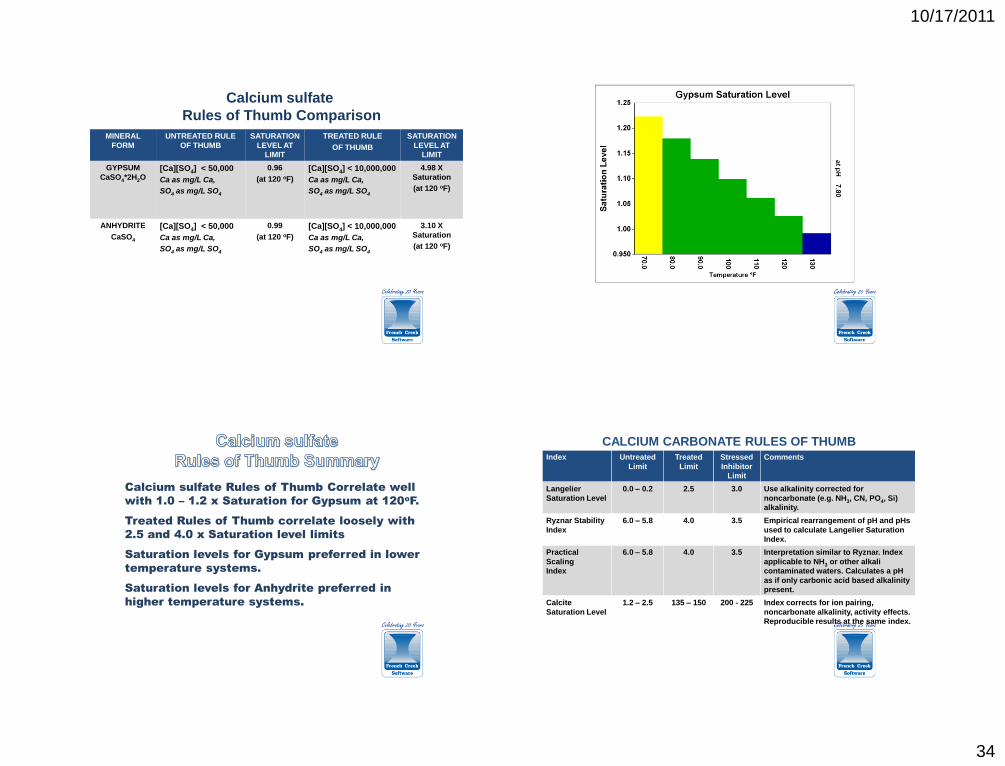
Calcium sulfate
Rules of Thumb Comparison
MINERAL
FORM
UNTREATED RULE
OF THUMB
SATURATION
LEVEL AT
LIMIT
TREATED RULE
OF THUMB
SATURATION
LEVEL AT
LIMIT
GYPSUM
CaSO4*2H2O [Ca][SO4] < 50,000
Ca as mg/L Ca,
SO4 as mg/L SO4
0.96
(at 120 oF)
[Ca][SO4] < 10,000,000
Ca as mg/L Ca,
SO4 as mg/L SO4
4.98 X
Saturation
(at 120 oF)
ANHYDRITE
CaSO4
[Ca][SO4] < 50,000
Ca as mg/L Ca,
SO4 as mg/L SO4
0.99
(at 120 oF)
[Ca][SO4] < 10,000,000
Ca as mg/L Ca,
SO4 as mg/L SO4
3.10 X
Saturation
(at 120 oF)
133
134
Calcium sulfate Rules of Thumb Correlate well
with 1.0 – 1.2 x Saturation for Gypsum at 120oF.
Treated Rules of Thumb correlate loosely with
2.5 and 4.0 x Saturation level limits
Saturation levels for Gypsum preferred in lower
temperature systems.
Saturation levels for Anhydrite preferred in
higher temperature systems.
135
CALCIUM CARBONATE RULES OF THUMB Index Untreated
Limit
Treated
Limit
Stressed
Inhibitor
Limit
Comments
Langelier
Saturation Level
0.0 – 0.2 2.5 3.0 Use alkalinity corrected for
noncarbonate (e.g. NH3, CN, PO4, Si)
alkalinity.
Ryznar Stability
Index
6.0 – 5.8 4.0 3.5 Empirical rearrangement of pH and pHs
used to calculate Langelier Saturation
Index.
Practical
Scaling
Index
6.0 – 5.8 4.0 3.5 Interpretation similar to Ryznar. Index
applicable to NH3 or other alkali
contaminated waters. Calculates a pH
as if only carbonic acid based alkalinity
present.
Calcite
Saturation Level
1.2 – 2.5 135 – 150 200 - 225 Index corrects for ion pairing,
noncarbonate alkalinity, activity effects.
Reproducible results at the same index.
136
10/17/2011
35
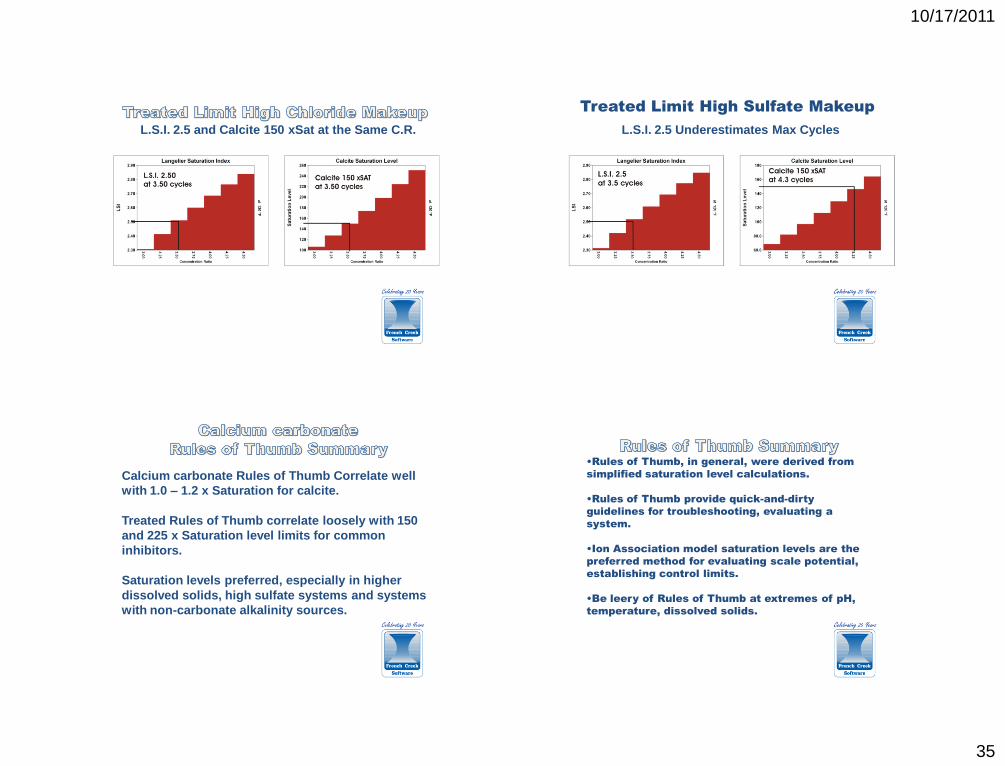
L.S.I. 2.5 and Calcite 150 xSat at the Same C.R.
137
Treated Limit High Sulfate Makeup
L.S.I. 2.5 Underestimates Max Cycles
138
Calcium carbonate Rules of Thumb Correlate well
with 1.0 – 1.2 x Saturation for calcite.
Treated Rules of Thumb correlate loosely with 150
and 225 x Saturation level limits for common
inhibitors.
Saturation levels preferred, especially in higher
dissolved solids, high sulfate systems and systems
with non-carbonate alkalinity sources.
139
•Rules of Thumb, in general, were derived from
simplified saturation level calculations.
•Rules of Thumb provide quick-and-dirty
guidelines for troubleshooting, evaluating a
system.
•Ion Association model saturation levels are the
preferred method for evaluating scale potential,
establishing control limits.
•Be leery of Rules of Thumb at extremes of pH,
temperature, dissolved solids.
140
10/17/2011
36
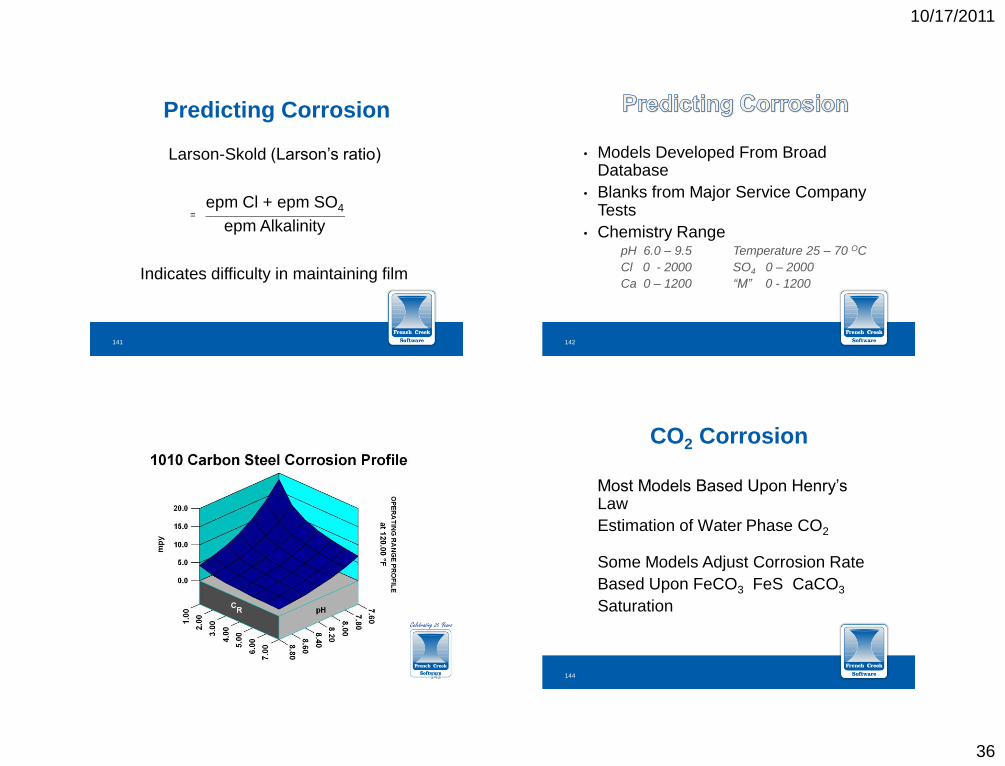
Larson-Skold (Larson’s ratio)
epm Cl + epm SO4
epm Alkalinity
Indicates difficulty in maintaining film
Predicting Corrosion
___________________________ =
141
• Models Developed From Broad Database
• Blanks from Major Service Company Tests
• Chemistry Range pH 6.0 – 9.5 Temperature 25 – 70 OC
Cl 0 - 2000 SO4 0 – 2000
Ca 0 – 1200 “M” 0 - 1200
142
143
Most Models Based Upon Henry’s Law
Estimation of Water Phase CO2
Some Models Adjust Corrosion Rate
Based Upon FeCO3 FeS CaCO3
Saturation
CO2 Corrosion
144
10/17/2011
37
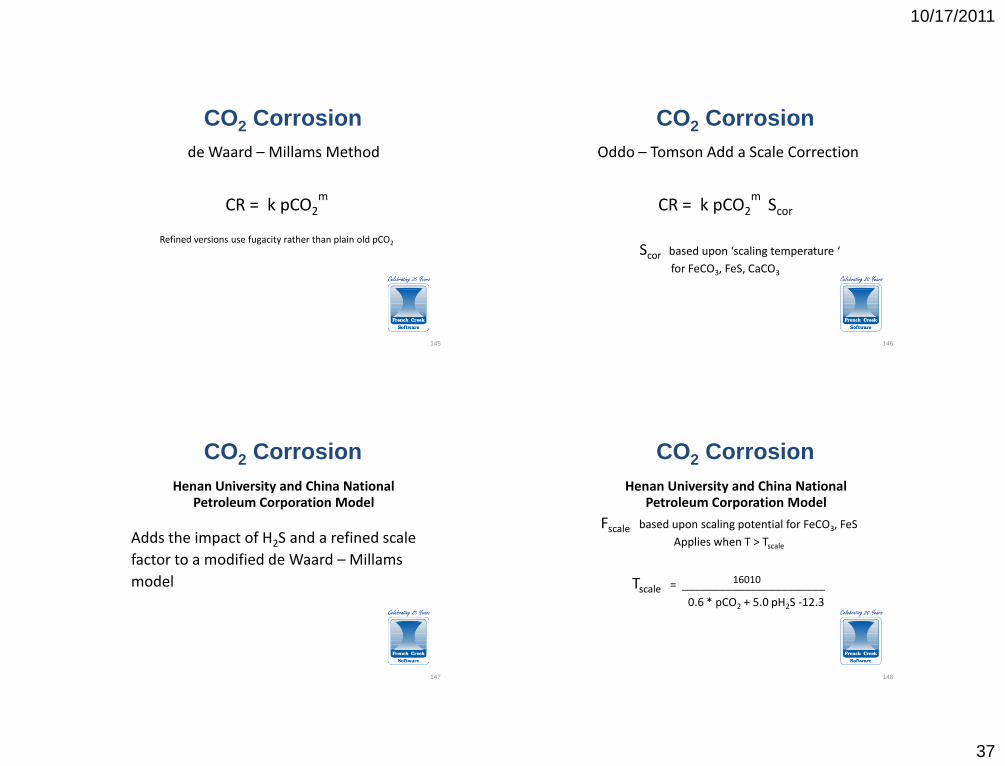
CO2 Corrosion
de Waard – Millams Method
CR = k pCO2m
Refined versions use fugacity rather than plain old pCO2
145
CO2 Corrosion
Oddo – Tomson Add a Scale Correction
CR = k pCO2m
Scor
Scor based upon ‘scaling temperature ‘
for FeCO3, FeS, CaCO3
146
CO2 Corrosion
Henan University and China National Petroleum Corporation Model
Adds the impact of H2S and a refined scale
factor to a modified de Waard – Millams
model
147
CO2 Corrosion
Henan University and China National Petroleum Corporation Model
Fscale based upon scaling potential for FeCO3, FeS
Applies when T > Tscale
16010 Tscale = _______________________
0.6 * pCO2 + 5.0 pH2S -12.3
148
10/17/2011
38
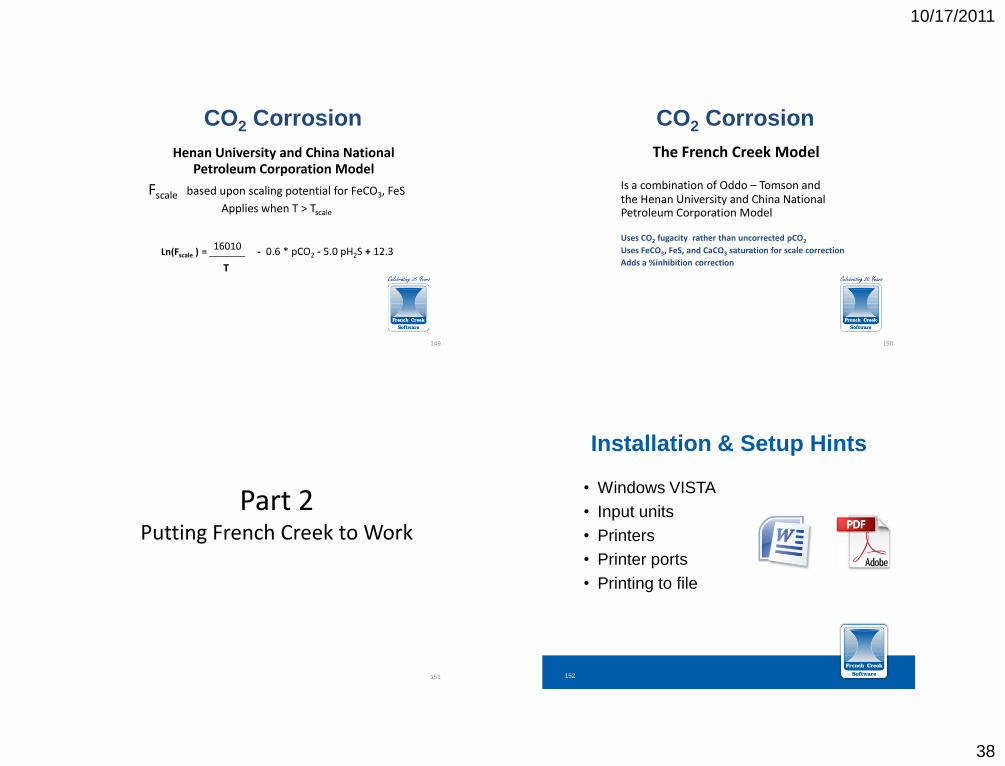
CO2 Corrosion
Henan University and China National Petroleum Corporation Model
Fscale based upon scaling potential for FeCO3, FeS
Applies when T > Tscale
16010 Ln(Fscale ) = _______ - 0.6 * pCO2 - 5.0 pH2S + 12.3
T
149
CO2 Corrosion
The French Creek Model Is a combination of Oddo – Tomson and the Henan University and China National Petroleum Corporation Model Uses CO2 fugacity rather than uncorrected pCO2
Uses FeCO3, FeS, and CaCO3 saturation for scale correction
Adds a %inhibition correction
150
Part 2 Putting French Creek to Work
151
• Windows VISTA
• Input units
• Printers
• Printer ports
• Printing to file
Installation & Setup Hints
152
10/17/2011
39
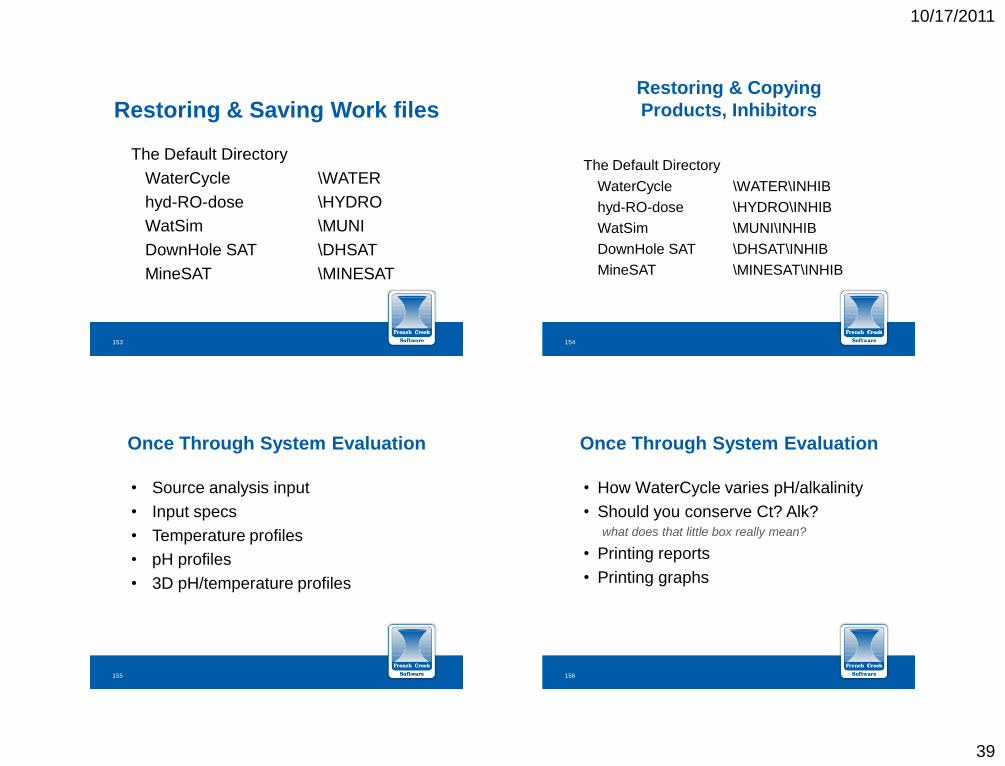
The Default Directory
WaterCycle \WATER
hyd-RO-dose \HYDRO
WatSim \MUNI
DownHole SAT \DHSAT
MineSAT \MINESAT
Restoring & Saving Work files
153
The Default Directory
WaterCycle \WATER\INHIB
hyd-RO-dose \HYDRO\INHIB
WatSim \MUNI\INHIB
DownHole SAT \DHSAT\INHIB
MineSAT \MINESAT\INHIB
Restoring & Copying
Products, Inhibitors
154
• Source analysis input
• Input specs
• Temperature profiles
• pH profiles
• 3D pH/temperature profiles
Once Through System Evaluation
155
Once Through System Evaluation
• How WaterCycle varies pH/alkalinity
• Should you conserve Ct? Alk? what does that little box really mean?
• Printing reports
• Printing graphs
156
10/17/2011
40
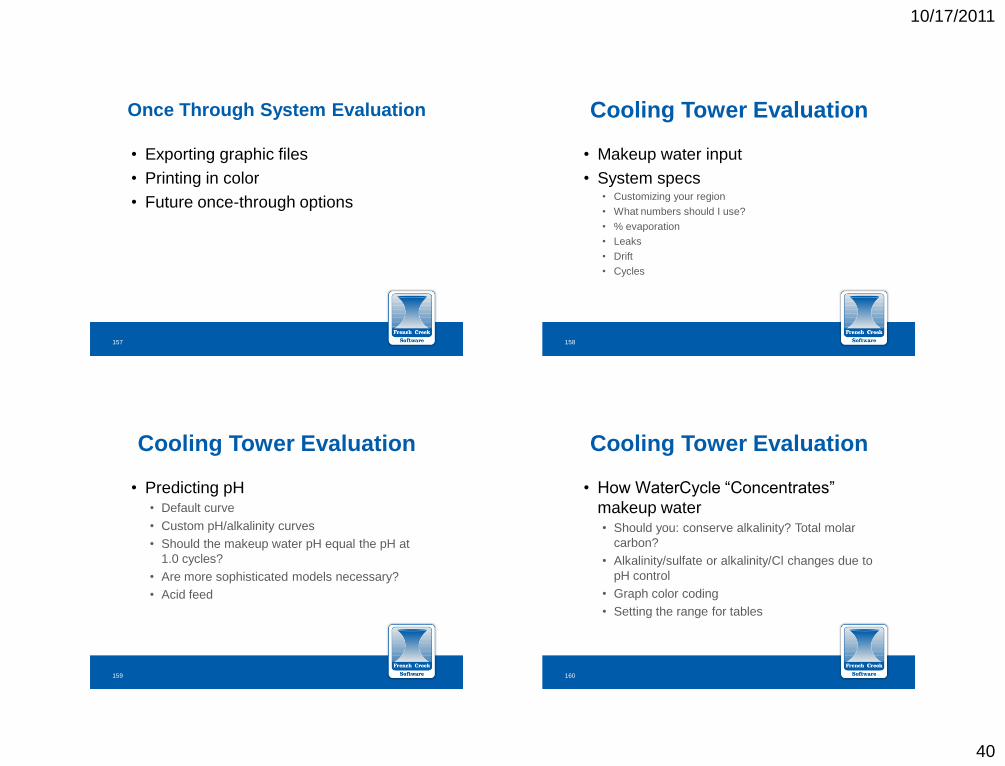
Once Through System Evaluation
• Exporting graphic files
• Printing in color
• Future once-through options
157
• Makeup water input
• System specs • Customizing your region
• What numbers should I use?
• % evaporation
• Leaks
• Drift
• Cycles
Cooling Tower Evaluation
158
• Predicting pH • Default curve
• Custom pH/alkalinity curves
• Should the makeup water pH equal the pH at
1.0 cycles?
• Are more sophisticated models necessary?
• Acid feed
Cooling Tower Evaluation
159
• How WaterCycle “Concentrates”
makeup water • Should you: conserve alkalinity? Total molar
carbon?
• Alkalinity/sulfate or alkalinity/Cl changes due to
pH control
• Graph color coding
• Setting the range for tables
Cooling Tower Evaluation
160
10/17/2011
41
• How WaterCycle “Concentrates”
makeup water • Should you: conserve alkalinity? Total molar
carbon?
• Alkalinity/sulfate or alkalinity/Cl changes due to
pH control
• Graph color coding
• Setting the range for tables
Cooling Tower Evaluation
161
• Interpreting Tables: • Water Chemistry
• Deposition Potential
Cooling Tower Evaluation
162
• Calcite saturation level • Calcite saturation 150 warning/action point
• Calcite saturation 200 warning/action point
• How high can you go?
Cooling Tower Evaluation
163
• Tricalcium phosphate • What’s significant?
• Where do typical orthophosphate corrosion
inhibitor programs run?
• How high a saturation level can copolymers
handle?
• Why are Ca3(PO4)2 momentary excess values
so small?
Cooling Tower Evaluation
164
10/17/2011
42
• Silica • Modeling pH/temperature effects upon silica
solubility
• Warning zones for Mg(OH)2: SiO2
• Do silica inhibitors work?
• Calcium sulfate saturation levels
– Gypsum?
– Anhydrite?
Cooling Tower Evaluation
165
• 3D Profiles • Setting specs for the profiles
• Printing in black and white
• Color printing
• Exporting as a PCX file
• Showing the impact of SPC control limits
• Exporting the Data Points to an ASCII
Cooling Tower Evaluation
166
• Bringing graphs and data into other
programs • Printing PCX files from Windows Paintbrush
Accessory
• Creating and printing multi graph pages in
CorelDraw
• Microsoft Word
Cooling Tower Evaluation
167
Part 5 – Modeling Scale Inhibitors
168
10/17/2011
43
• The Concept of Induction Time • The Molecular waiting room
• Kinetics vs. thermodynamics
• The impact of phosphonates upon induction
time
• The impact of saturation level upon induction
time
• The impact of temperature upon induction time
Modeling Scale Inhibitors
169
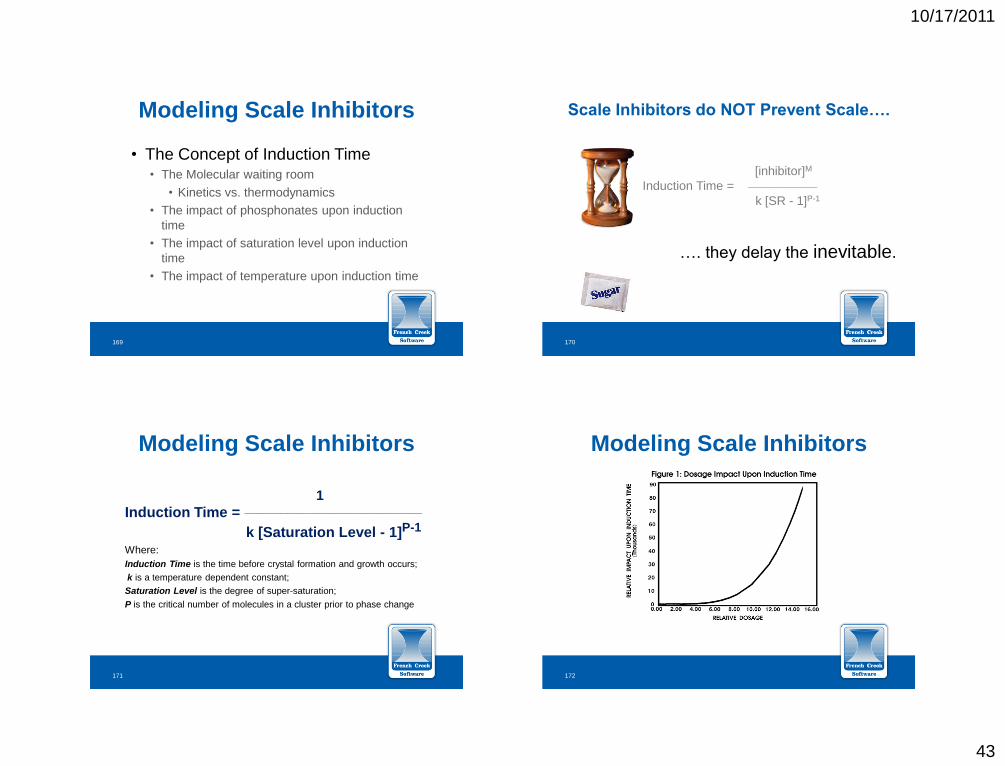
…. they delay the inevitable.
Scale Inhibitors do NOT Prevent Scale….
[inhibitor]M
Induction Time = _______________
k [SR - 1]P-1
170
1
Induction Time = _____________________________
k [Saturation Level - 1]P-1
Where:
Induction Time is the time before crystal formation and growth occurs;
k is a temperature dependent constant;
Saturation Level is the degree of super-saturation;
P is the critical number of molecules in a cluster prior to phase change
Modeling Scale Inhibitors
171
Modeling Scale Inhibitors
172
10/17/2011
44
Modeling Scale Inhibitors
173
Modeling Scale Inhibitors
174
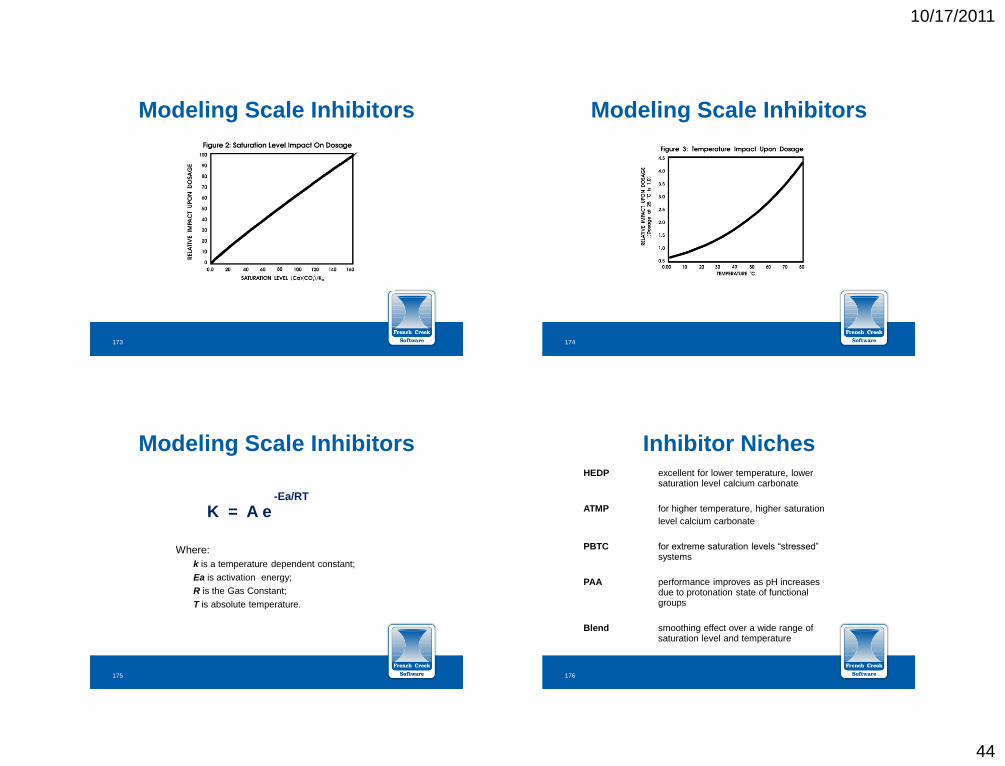
-Ea/RT
K = A e
Where:
k is a temperature dependent constant;
Ea is activation energy;
R is the Gas Constant;
T is absolute temperature.
Modeling Scale Inhibitors
175
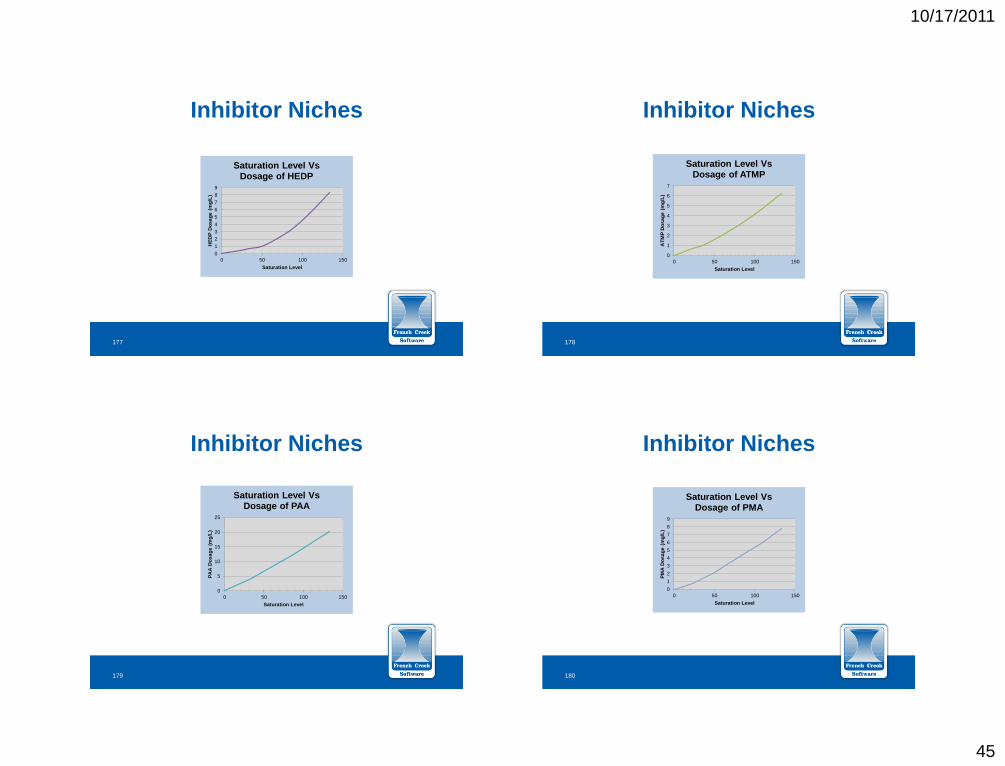
HEDP excellent for lower temperature, lower saturation level calcium carbonate
ATMP for higher temperature, higher saturation
level calcium carbonate
PBTC for extreme saturation levels “stressed” systems
PAA performance improves as pH increases due to protonation state of functional groups
Blend smoothing effect over a wide range of saturation level and temperature
Inhibitor Niches
176
10/17/2011
45
Inhibitor Niches
0
1
2
3
4
5
6
7
8
9
0 50 100 150
HE
DP
Do
sa
ge
(m
g/L
)
Saturation Level
Saturation Level Vs Dosage of HEDP
177
Inhibitor Niches
0
1
2
3
4
5
6
7
0 50 100 150
AT
MP
Do
sa
ge
(m
g/L
)
Saturation Level
Saturation Level Vs Dosage of ATMP
178
Inhibitor Niches
0
5
10
15
20
25
0 50 100 150
PA
A D
os
ag
e (
mg
/L)
Saturation Level
Saturation Level Vs Dosage of PAA
179
Inhibitor Niches
0
1
2
3
4
5
6
7
8
9
0 50 100 150
PM
A D
os
ag
e (
mg
/L)
Saturation Level
Saturation Level Vs Dosage of PMA
180
10/17/2011
46
Inhibitor Niches
0
0.5
1
1.5
2
2.5
3
3.5
4
0 50 100 150
PB
TC
Do
sa
ge
(m
g/L
)
Saturation Level
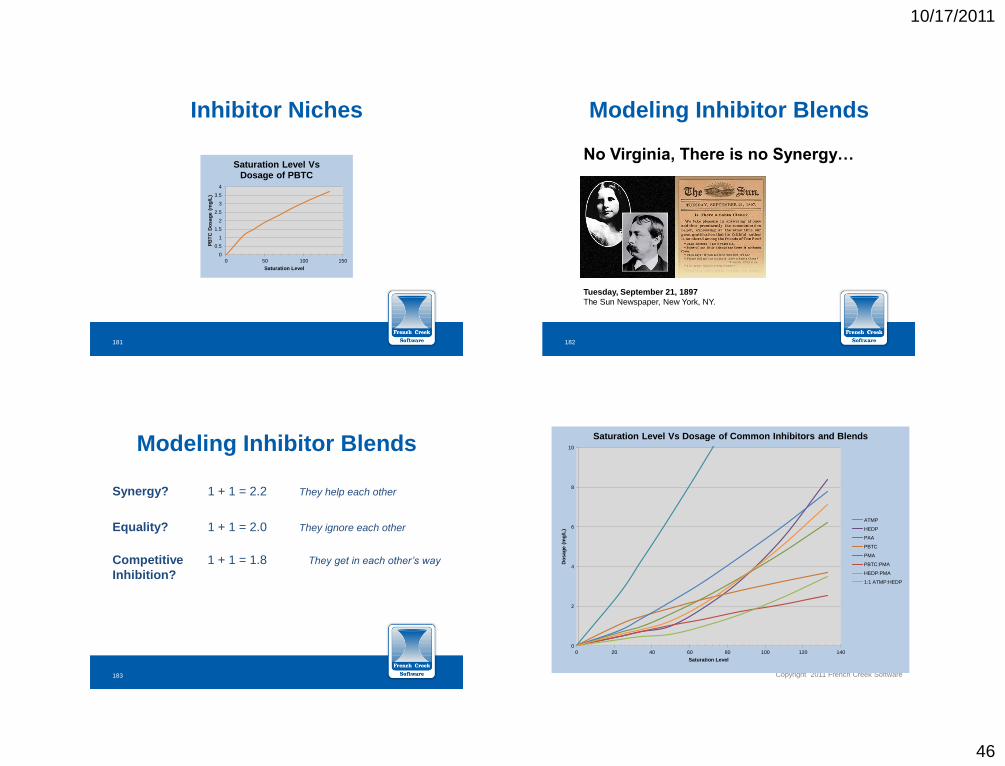
Saturation Level Vs Dosage of PBTC
181
No Virginia, There is no Synergy…
Modeling Inhibitor Blends
Tuesday, September 21, 1897
The Sun Newspaper, New York, NY.
182
Synergy? 1 + 1 = 2.2 They help each other
Equality? 1 + 1 = 2.0 They ignore each other
Competitive 1 + 1 = 1.8 They get in each other’s way
Inhibition?
Modeling Inhibitor Blends
183 Copyright 2011 French Creek Software
0
2
4
6
8
10
0 20 40 60 80 100 120 140
Do
sa
ge
(m
g/L
)
Saturation Level
Saturation Level Vs Dosage of Common Inhibitors and Blends
ATMP
HEDP
PAA
PBTC
PMA
PBTC:PMA
HEDP:PMA
1:1 ATMP:HEDP
184
10/17/2011
47
Copyright 2010 French Creek Software
0
1
2
3
4
5
6
7
8
9
0 50 100 150
PM
A D
os
ag
e (
mg
/L)
Saturation Level
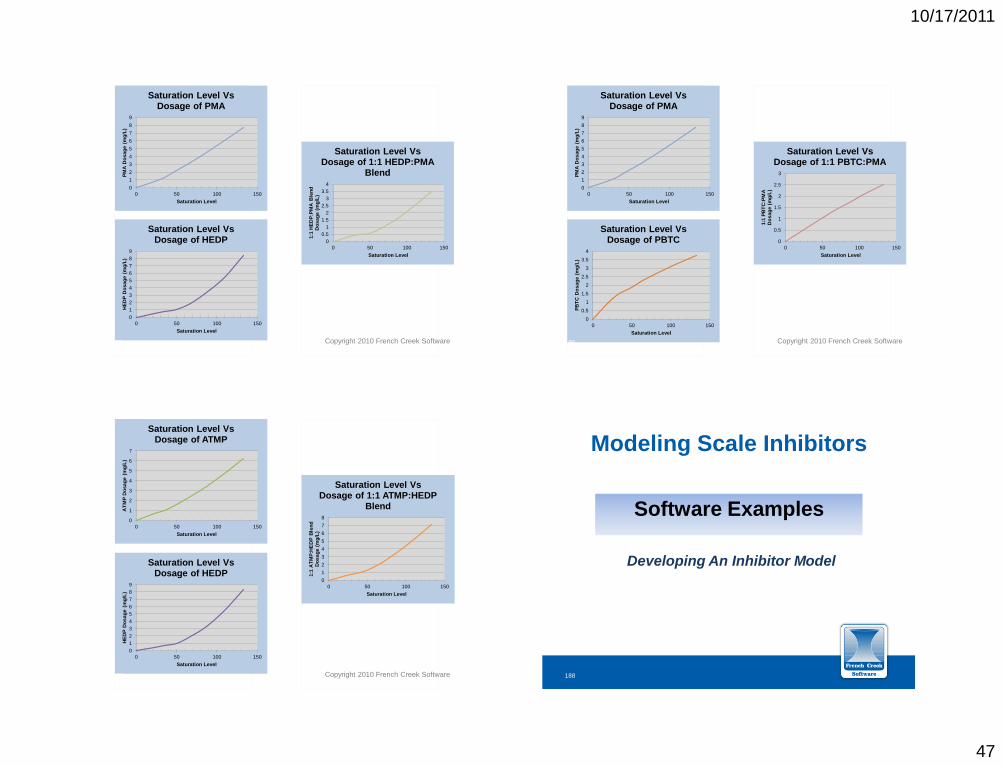
Saturation Level Vs Dosage of PMA
0
1
2
3
4
5
6
7
8
9
0 50 100 150
HE
DP
Do
sa
ge
(m
g/L
)
Saturation Level
Saturation Level Vs Dosage of HEDP 0
0.5
1
1.5
2
2.5
3
3.5
4
0 50 100 150
1:1
HE
DP
:PM
A B
len
d
Do
sa
ge
(m
g/L
)
Saturation Level
Saturation Level Vs Dosage of 1:1 HEDP:PMA
Blend
185 Copyright 2010 French Creek Software
0
1
2
3
4
5
6
7
8
9
0 50 100 150
PM
A D
os
ag
e (
mg
/L)
Saturation Level
Saturation Level Vs Dosage of PMA
0
0.5
1
1.5
2
2.5
3
0 50 100 150
1:1
PB
TC
:PM
A
Do
sa
ge
(m
g/L
)
Saturation Level
Saturation Level Vs Dosage of 1:1 PBTC:PMA
0
0.5
1
1.5
2
2.5
3
3.5
4
0 50 100 150
PB
TC
Do
sa
ge
(m
g/L
)
Saturation Level
Saturation Level Vs Dosage of PBTC
186
Copyright 2010 French Creek Software
0
1
2
3
4
5
6
7
8
0 50 100 150
1:1
AT
MP
:HE
DP
Ble
nd
Do
sa
ge
(m
g/L
)
Saturation Level
Saturation Level Vs Dosage of 1:1 ATMP:HEDP
Blend
0
1
2
3
4
5
6
7
8
9
0 50 100 150
HE
DP
Do
sa
ge
(m
g/L
)
Saturation Level
Saturation Level Vs Dosage of HEDP
0
1
2
3
4
5
6
7
0 50 100 150
AT
MP
Do
sa
ge
(m
g/L
)
Saturation Level
Saturation Level Vs Dosage of ATMP
187
Modeling Scale Inhibitors
Software Examples
Developing An Inhibitor Model
188
10/17/2011
48
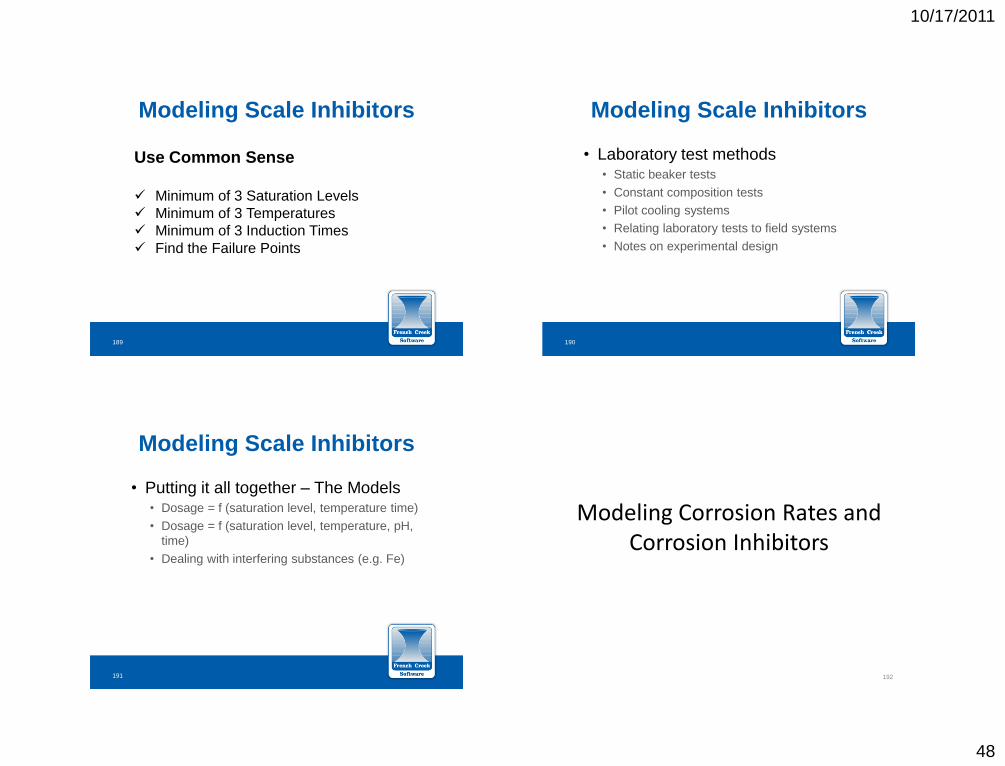
Modeling Scale Inhibitors
Use Common Sense
Minimum of 3 Saturation Levels
Minimum of 3 Temperatures
Minimum of 3 Induction Times
Find the Failure Points
189
• Laboratory test methods • Static beaker tests
• Constant composition tests
• Pilot cooling systems
• Relating laboratory tests to field systems
• Notes on experimental design
Modeling Scale Inhibitors
190
• Putting it all together – The Models • Dosage = f (saturation level, temperature time)
• Dosage = f (saturation level, temperature, pH,
time)
• Dealing with interfering substances (e.g. Fe)
Modeling Scale Inhibitors
191
Modeling Corrosion Rates and Corrosion Inhibitors
192
10/17/2011
49
• Prior art for corrosion rate prediction • Simple indices as indicator
• Larson Skold
• Do calcium carbonate indices apply?
• Psigan and Singley
• Davis
• Boffardi
Modeling Corrosion Rates
193
• The Zisson Data Model • Laboratory Method
• Parameter Selection
• The Model
Modeling Corrosion Rates
194
• Experience based data (the Water
Treatment Company Manuals)
• Laboratory data
• The models • Dosage = f (water chemistry, target corrosion
rate)
• Corrosion rate = f (waster chemistry, inhibitor
dosage)
Modeling Corrosion Inhibitors
195
Control Corrosion Calculate Dosage to Achieve Target
Corrosion Rate
Compare Costs for Various Levels of Control
Compare Inhibitors
Control Inhibitor Caused Scales
196
10/17/2011
50
197
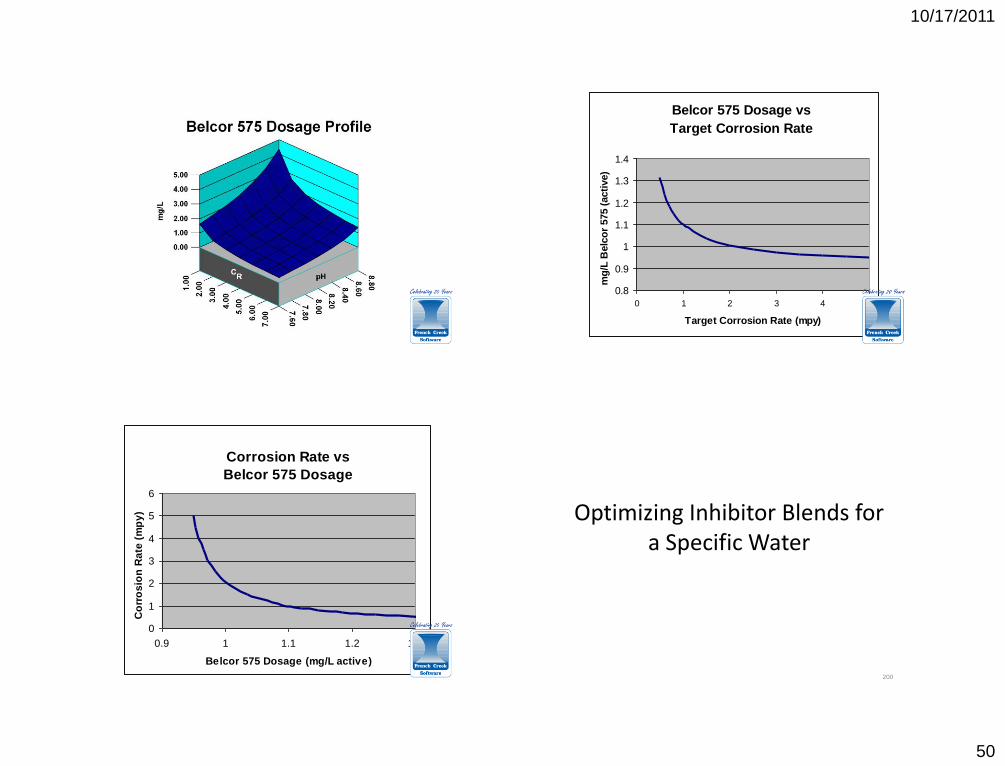
Belcor 575 Dosage vs
Target Corrosion Rate
0.8
0.9
1
1.1
1.2
1.3
1.4
0 1 2 3 4 5
Target Corrosion Rate (mpy)
mg
/L B
elc
or
575 (
acti
ve)
198
Corrosion Rate vs
Belcor 575 Dosage
0
1
2
3
4
5
6
0.9 1 1.1 1.2 1.3
Belcor 575 Dosage (mg/L active)
Co
rro
sio
n R
ate
(m
py
)
199
Optimizing Inhibitor Blends for a Specific Water
200
10/17/2011
51
• How WaterCycle evaluates a water • Corrosion inhibitor
• Problems caused by the inhibitor
• Other scale forming species
Modeling Corrosion Inhibitors
201
• Examples • The orthophosphate/copolymer/phosphonate
blend
Modeling Corrosion Inhibitors
202
Corrosion Inhibitor Dosages
• Solubility Controlled Dosage
• Performance Controlled Dosage
203
Dosage = f(water chemistry, temperature, corrosion target)
Corrosion Rate = f(water chemistry, temperature, inhibitor)
204
10/17/2011
52
205
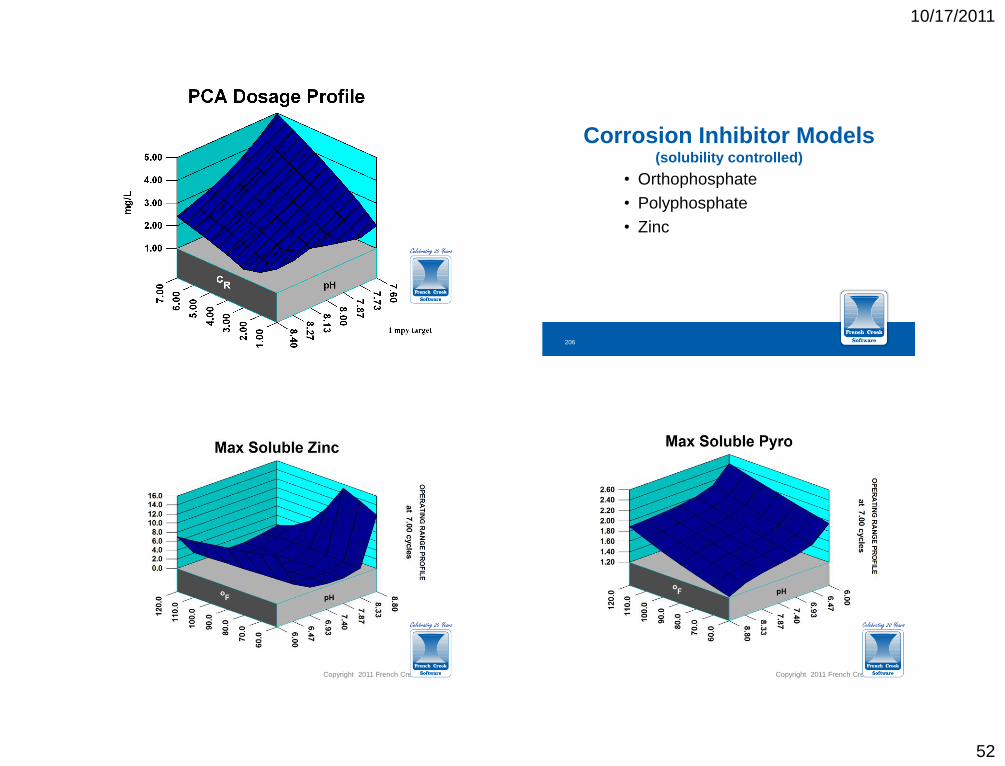
Corrosion Inhibitor Models (solubility controlled)
• Orthophosphate
• Polyphosphate
• Zinc
206
Copyright 2011 French Creek Software 207 Copyright 2011 French Creek Software 208
10/17/2011
53
Copyright 2011 French Creek Software 209 Copyright 2011 French Creek Software 210
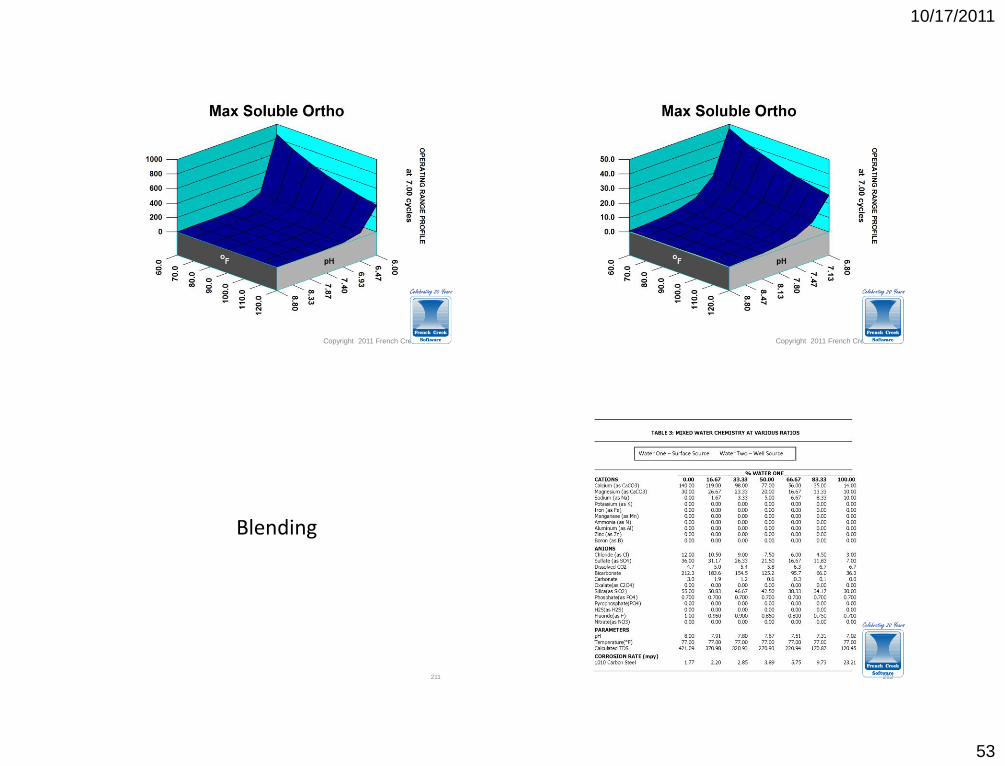
Blending
211 212
10/17/2011
54
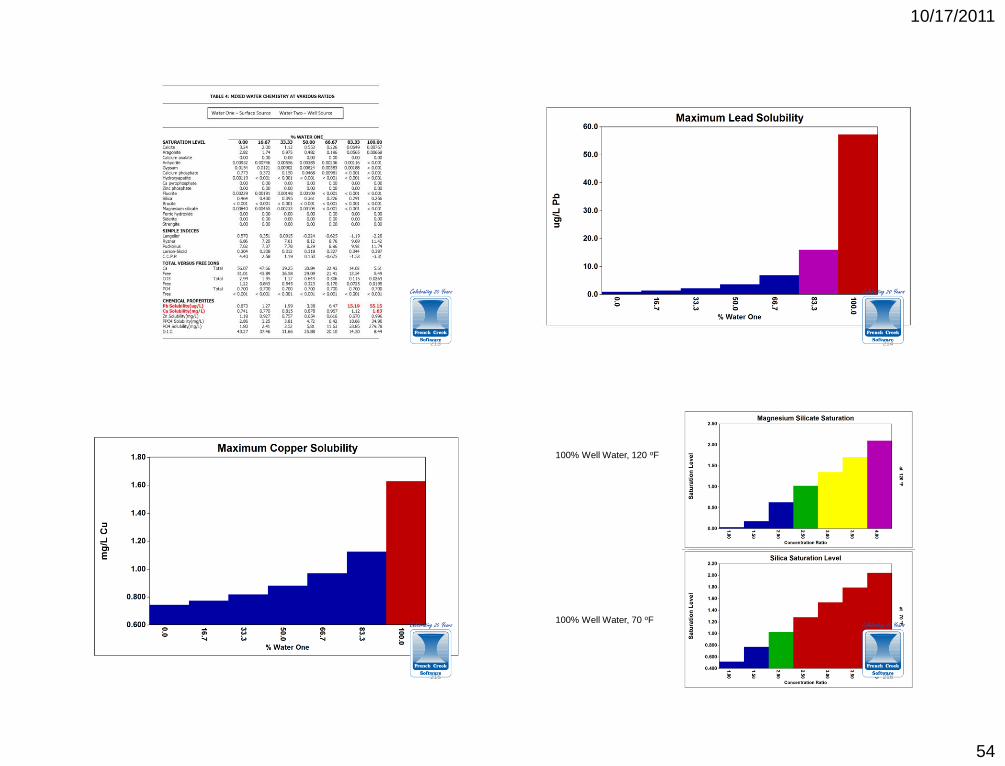
213 214
215
100% Well Water, 120 oF
100% Well Water, 70 oF
216
10/17/2011
55
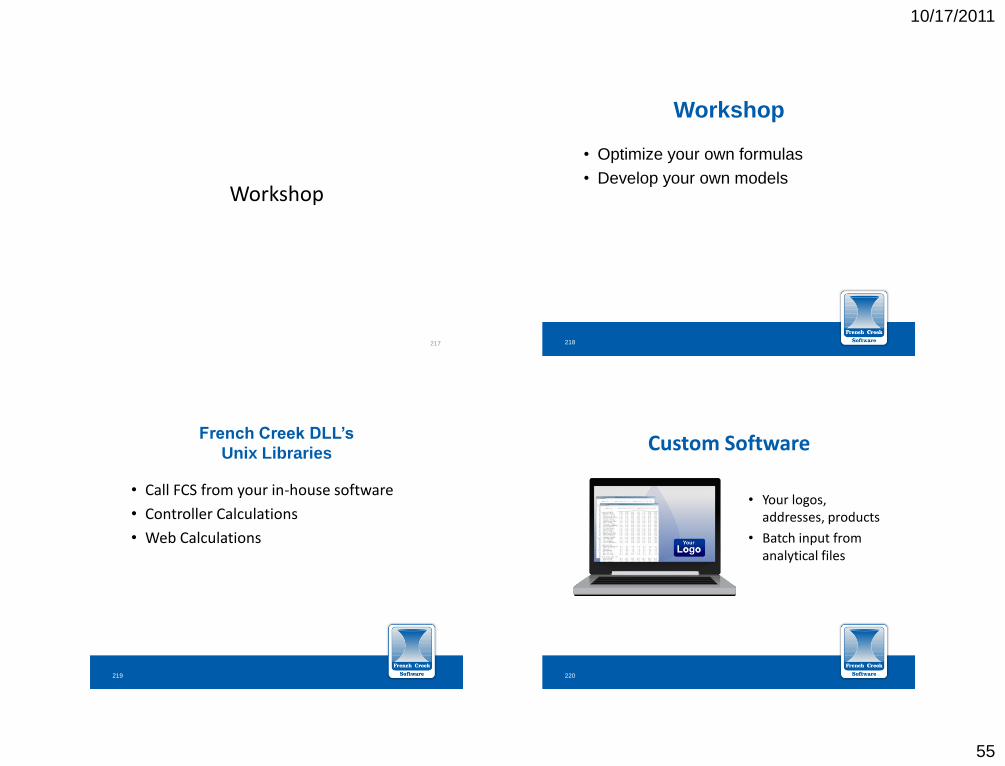
Workshop
217
• Optimize your own formulas
• Develop your own models
Workshop
218
• Call FCS from your in-house software
• Controller Calculations
• Web Calculations
French Creek DLL’s
Unix Libraries
219
• Your logos, addresses, products
• Batch input from analytical files
Custom Software
220


![Arbor Creek MJJ2010[1]](https://img.pdfslide.tips/doc/110x75/577d37e11a28ab3a6b969807/arbor-creek-mjj20101.jpg)