Embed Size (px)
Citation preview
645Copyright © The Oceanographic Society of Japan.
Journal of Oceanography, Vol. 55, pp. 645 to 653. 1999
Keywords:⋅ North Pacific,⋅ carbon cycle,⋅ biological pump,⋅ intermediate water,⋅ anthropogeniccarbon.
Overview of NOPACCS (Northwest Pacific CarbonCycle Study)
HIROYUKI TSUBOTA1,2,3, JOJI ISHIZAKA4,5, AKIRA NISHIMURA6 and YUTAKA W. WATANABE4
1Hiroshima University2Institute of Environmental Sciences, Shin-Nippon Meteorological and Oceanographical Consultant Co., Ltd., 1334-5 Riemon, Ooigawa-cho, Shida-gun, Shizuoka 421-0212, Japan3Kansai Environmental Engineering Center, Co., Ltd., 1-3-5 Azuchi-cho, Chuou-ku, Osaka 541-0052, Japan4National Institute for Resources and Environment, 16-3 Onogawa, Tsukuba, Ibaraki 305-8569, Japan5Faculty of Fisheries, Nagasaki University, 1-14 Bunkyo, Nagasaki, Nagasaki 852-8521, Japan6Geological Survey of Japan, Tsukuba, Ibaraki 305-8567, Japan
(Received 13 August 1999; in revised form 30 September 1999; accepted 7 October 1999)
The Northwest Pacific Carbon Cycle Study (NOPACCS) was a program aimed atinvestigating the carbon cycle of the North Pacific Ocean, which can be thought of asa large reservoir of carbon dioxide. NOPACCS was also aimed at estimating the NorthPacific’s capacity as a carbon sink. Project design, scientific results, and data avail-ability, and subsequent projects resulting from this project are also described in thisreview. Studies of the upper ocean processes focused on the latitudinal differences inthe fugacity of carbon dioxide; and on the detail of plankton community structures.Intermediate water was studied in relation to the formation of North Pacific Interme-diate Water and the amount of accumulated anthropogenic carbon. The sedimenta-tion process, past carbon cycle and coral reefs were also studied during the project. Apreliminary, overall view of the carbon cycle of the North Pacific was drawn from theresults of the project and compared to global values.
total carbon in the ocean is more than 50 times more thanit is in the atmosphere. Two major carbon flows are knownin the oceans: one is through formation of intermediateand deep water by physical circulation (solubility pump);and the second is conversion of inorganic carbon to or-ganic carbon by photosynthesis and then transport to in-termediate and deep waters and to the sediment (biologi-cal pump). In order to understand the carbon cycle in theocean, elucidation of both carbon flows is important.
The Northwest Pacific Carbon Cycle Study(NOPACCS) was a Japanese national project designed todeepen our understanding of the carbon cycle in the ocean.In this paper, a brief overview of the project is given. Theproject design is described in the next section. A briefsummary for the results for the following three main top-ics is described in subsequent sections: 1) upper oceanprocesses and biological carbon cycle, 2) intermediatewater and anthropogenic carbon, 3) sedimentation, pastcarbon cycle and coral reefs. In Section 6, a preliminaryand generalized view of the carbon cycle of the NorthPacific is given. Lastly, subsequent projects are introducedin Section 7.
1. IntroductionQuantification of the carbon cycle has been discussed
internationally since the increase of anthropogenic car-bon dioxide was recognized as an important factor in glo-bal climate change. Specifically, it is known as one of themost abundant global warming gases. Global annual emis-sions of carbon dioxide from fossil fuel combustion anddeforestation are estimated to be 5.5 and 1.6 PgC yr–1,respectively (Houghton et al., 1995), while accumulationin the atmosphere is only 3.4 PgC yr–1 according to di-rect measurements of atmospheric carbon dioxide(Keeling et al., 1989).
About 2 Pg of carbon is speculated to have been ab-sorbed by the ocean, however the fate of about half thatcarbon still remains uncertain, such that it has been calleda “missing sink” (Houghton et al., 1990). Over manyyears, there has been discussion about whether the oceansor terrestrial forests absorb more carbon than previouslythought and/or whether soil in the Northern hemisphereaccumulates organic carbon accumulates more than pre-viously speculated (Tans et al., 1990). Whichever the caseis, the ocean is one of the largest carbon reservoirs, and

646 H. Tsubota et al.
2. Project DesignThe New Energy and Industrial Technology Devel-
opment Organization (NEDO) launched the IndustrialTechnology Research and Development Project on Glo-bal Environment in the fiscal year 1990, with financialsupport and aid under the auspices of the Ministry of In-ternational Trade and Industry (MITI). As a part of thisproject, the Northwest Pacific Carbon Cycle Study(NOPACCS) was first planned by the Agency of Indus-trial Science and Technology (AIST) and commenced in1990 for a period of seven years. Survey and researchactivities were assigned by NEDO to the Kansai Envi-ronmental Engineering Center, Co., Ltd. (KEEC) to beconducted in collaboration with the cooperation of twoinstitutions of AIST: National Institute for Resources andEnvironment (NIRE) and Geological Survey of Japan(GSJ), and with scientists from universities.
For the quantitative evaluation of the carbon cyclein the ocean, a field survey was carried out to clarifyphysical circulation, biogeochemical processes and ac-cumulation of carbon on the seafloor. Meteorological,oceanographical and biogeochemical information wascollected from the western North Pacific, mainly from48°N to 15°S along 175°E, whilst onboard the R/VHakurei-Maru (1800 tons) which belongs to the MetalMining Agency of Japan. These survey areas were se-lected on the basis that they are far from continents andinclude different climatic and oceanic zones.
The oceanic surveys and research were planned,guided and controlled by the Executive Committee(chaired by H. Tsubota) and the following working groups:Soluble Materials Working Group (Leader: K. Harada),Settling Particles Working Group (Leader: H. Kawahata),Sediments Working Group (Leader: A. Nishimura), Biol-ogy Working Group (Leader: J. Ishizaka) and ModellingWorking Group (Leader: K. Nakata). Quality check ofthe final data was carried out by Data Quality ControlWorking Group (Leader: H. Tsubota).
3. Upper Ocean Processes and Biological Carbon Cy-cleUpper ocean processes are important because this is
the region where atmospheric CO2 dissolves into seawaterand where CO2 in the seawater is released to the atmos-phere. The partial pressures of carbon dioxide in the at-mosphere and sea surface water were continuously meas-ured along the survey tracks of each research cruise ofthe project. A description of the latitudinal distribution
of the fugacity of carbon dioxide ( fCO2) in the atmos-
phere and in the surface waters, along 175°E, from 1992through 1996, is given in detail by Watai et al. (1999).
One of the important carbon flows from the upperwater to the deep water is the biological pump. The up-per layer is important in the biological carbon cycle be-
cause it is where primary production and most of bio-logical activities occur. Studies of biological processesin NOPACCS concentrated mostly on the description ofthe structure of the plankton ecosystem and its functionin the carbon cycle along 175°E. Firstly, phytoplanktoncommunities were studied in detail along the lines of size-fractionation of chlorophyll-a , epifluorescencemicroscopy and HPLC pigment analysis (Ishizaka, 1994;Ishizaka et al., 1994; Suzuki et al., 1995, 1997). The studyindicated that concentrations of chlorophyll a at the sur-face were mostly very low at the southern end of theKuroshio front (40°N) and higher at the northern end witha peak between 42–46°N during summer; and that the highchlorophyll a region shifted to the south (to about 30°N)during spring. The size-fraction of chlorophyll a showedthat the phytoplankton community consisted mostly ofsmall plankton except at the northern peak.Epifluorescence microscopy and HPLC analyses indicatedthat Prochlorococcus largely dominated the subtropicalarea and microflagellates dominated the north. Thoseanalyses and absorption spectra studies clearly showedlatitudinal and vertical differences in the phytoplanktoncommunity (Harimoto et al., 1999).
Another major endeavor of the biological study ofNOPACCS was the integration of the whole planktoncommunity size and taxonomic structure. Since most pre-vious studies on plankton communities are limited to smallgroups and small size ranges, several different methodswere used to identify the plankton community includingbacteria, phytoplankton and zooplankton in the size rangeof 0.2 to 2000 µm diameter. A brief description of themethods and an example of the analysis for the equato-rial region were published by Kiyosawa et al. (1995) andIshizaka et al. (1997), respectively. Ishizaka et al. (1997)showed that the plankton-carbon biomass at the equator,175°E, was about 2000–3500 mgCm–2 in five visits inSeptember 1990–1993 and April 1994. The percentagesof the taxonomic groups in the biomass were 31–54, 15–26, and 29–54% for phytoplankton, zooplankton and bac-teria respectively, such that the hetetotrophic biomass wasmore abundant. Bacteria and Prochlorococcus were mostabundant in the picoplankton size range, flagellates wereabundant in the nanoplankton and copepods were abun-dant in the mesoplankton. They also estimated the car-bon biomass flow through the biological community us-ing that data set.
Furthermore, an extension to the studies on commu-nity structure focused on the non-dominant, large diatomsin the North Pacific (Takahashi, M. et al., 1999). Anotherstudy conducted by Goes et al. (1999) derived relation-ships between temperature, chlorophyll a and nitrate fromthe NOPACCS data, and used those relationships to esti-mate nitrate distribution in the North Pacific; and esti-mated new production using satellite ocean color and tem-perature data.

Overview of NOPACCS 647
4. Intermediate Water in the North Pacific and Up-take of Anthropogenic CarbonWhen considering the balance of anthropogenic car-
bon, it is necessary to clarify how much atmospheric an-thropogenic carbon the ocean absorbs and where it is ac-cumulated in the ocean at present. High latitudinal areasproducing intermediate and deep water masses wouldenhance oceanic absorption of atmospheric CO2 throughthe following mechanisms: active gas exchange due to arough sea surface; high solubility due to low tempera-tures in winter; and high biological productivity. Theseregions, therefore, would play an important role in theabsorption of anthropogenic CO2 released by human ac-tivities in the industrial era. In the North Pacific, inter-mediate water, called North Pacific Intermediate Water(NPIW), is produced in the subpolar region (Reid, 1965;Watanabe et al., 1994, 1995; Nishina and Fukasawa,1999). The North Pacific subpolar region, therefore, mayplay an important role in the absorption of excess CO2 inthe North Pacific (Tsunogai et al., 1993; Watanabe et al.,1996).
Although recently developed models have been usedto estimate the formation of NPIW and uptake of anthro-pogenic CO2, the spatial distribution of anthropogeniccarbon, such as its inventory and uptake rate, is signifi-cantly different between the models. Thus, it is difficultto know whether the results are reliable or not(Siegenthaler and Sarmiento, 1993). Therefore, theNOPACCS group tried to estimate the behavior of an-thropogenic carbon, such as its spatial distribution, in-ventory and uptake, using comparisons between obser-vational data and model calculations.
In the observational data-based approach, the
NOPACCS group measured fCO2, DIC, pH, alkalinity,
nutrients, dissolved oxygen and CFCs, mainly along175°E twice a year during the period of 1990 to 1996.The NOPACCS group estimated the spatial distributionof anthropogenic carbon using mainly the back calcula-tion method of Chen (1982) and by comparison of theNOPACCS and 1973–1974 GEOSECS data set (Watanabeet al., 1996, 1997). This estimate, however, has a signifi-cant problem in its assumptions. Chen (1982)’s approachhas not been appropriate generally and the uncertaintiesassociated with their estimates are regarded as being toolarge. Some of the problems include: mixing of differentwaters with unknown initial concentrations; the difficultyof choosing an appropriate concentration of preindustrialoceanic CO2; large uncertainties in the assumptions re-lating to the constant stochiometric ratio P:N:C:O; andthe use of AOU for determining the contribution of theremineralization of organic matter (Shiller, 1981, 1982).
Therefore, the NOPACCS group used new observa-tional data-based approaches such as the direct DIC com-parison method (Wallace and Johnson, 1994; Slansky et
al., 1997; Ono et al., 1998, 1999) and C-13 method (Quayet al., 1992) during any decadal intervals (Takahashi, Y.et al., 1999; Ono et al., 1999). Unfortunately, at present,because there are no sufficient oceanic carbonate speciesdata sets available, those approaches can not be used togive detailed spatial distribution of anthropogenic car-bon, although they may give a rough estimate.
Despite the lack of carbon data, many CFC data ex-ist for the North Pacific region (Watanabe et al., 1994,1997). Using CFC data without P:N:C:O, therefore,Watanabe et al. (1999) obtained some information suchas the change over time in the spatial distribution of theanthropogenic carbon accumulation rate, and the changeover time of the anthropogenic carbon uptake rate by in-tegrating the spatial distribution of the anthropogeniccarbon accumulation rate. They also compared those re-sults with those from the direct DIC comparison method(Ono et al., 1998, 1999), and found a good agreementbetween their method and the direct DIC comparisonmethod. The anthropogenic carbon uptake rate for thewhole North Pacific was estimated to be 0.50 ± 0.09 PgCyr–1 between 1988–1998, suggesting that the North Pa-cific region is significantly important for the oceanic up-take of anthropogenic carbon.
In addition, the NOPACCS modeling group tried toclarify the behavior of anthropogenic carbon using a 2 ×2 degree general circulation model (GCM) with someschemes using NOPACCS and climatological data(Levitus, 1982). Ishida et al. (1995) and Ishida et al.(1999) found that the GCM using the isopycnal diffusionscheme was the best way to reconstruct the distributionof NPIW.
They applied their model to the North Pacific to es-timate the spatial distribution of anthropogenic carbon inthe North Pacific. The uptake rate of anthropogenic car-bon in the North Pacific was 0.4 PgC yr–1, which almostagrees with the observational data-based estimate(Watanabe et al., 1999). However, the spatial distribu-tion of anthropogenic carbon between the observationaldata and their model is still significantly different. Espe-cially, at the western and southern boundaries, theNOPACCS group found significant differences in the in-ventories and penetration depths of CFCs and anthropo-genic carbon. In future, it will be necessary to develop aGCM model and use a sufficiently available data set likeWOCE or JGOFS to reconstruct a fine and precise spa-tial distribution of anthropogenic carbon.
5. Sedimentation, Past Carbon Cycle and Coral ReefsDuring NOPACCS, sediments were researched in-
tensively to better understand the carbon cycle in theocean. We collected and analyzed surface sediments froma large number of sites, reaching 150, in the western Pa-cific Ocean. In the latter stage of NOPACCS, the carbon

648 H. Tsubota et al.
budget of coral reefs was studied, mainly based on thepartial pressures of CO2 in surface seawater both insideand outside of reefs, to evaluate their contribution to rolein the carbon cycle.
Basic data on sediment features, such as sedimenttype, composition, texture, water content, sedimentationrates, magnetic susceptibility, and color characteristics,were determined regionally for the western Pacific Ocean.Systematic sampling of surface sediments in the westernPacific Ocean showed general distribution patterns ofspecified compositions, such as lipids with a terrestrialorigin (Ohkouchi et al., 1997), the strontium isotopiccomposition of the non-carbonate components ofsediments (Asahara et al., 1999), and magnetic particles(Yamazaki and Ioka, 1997). These fundamental data willlargely contribute to our understanding of the presenttransportation of particulate material and to reconstruct-ing the paleo-environment based on core sequences. Pri-mary production of the past several hundred thousandyears was reconstructed based mainly on carbon contentsof the sediments, and it was shown that it reflects pastand present oceanographic conditions. The values of, andvariation in those data are large in the marginal seas andhigh latitude areas, and small in the equatorial area andsubtropical gyre. Glacial and interglacial periods contrastgreatly in the former areas but much less so in the latterareas (Kawahata et al., 1996). The difference in primaryproduction between glacial and interglacial times has beendiscussed in relation to the contribution of oceans to thecarbon cycle. Atmospheric CO2 concentration in glacialtimes, which is ca. 80 ppmv lower than those in intergla-cial times, is thought to have been caused mainly by acti-vation of productivity in the oceans. Reconstruction ofprimary production in the western Pacific Ocean supportsthis hypothesis, but in specific areas, it is revealed thatshifts in high productivity zones have repeated betweenglacial and interglacial times. The synchronous latitudi-nal migration of the transitional zones between subtropi-cal and subarctic waters of the Northern and SouthernHemisphere was determined based on primary produc-tivity proxies, and carbon and opal fluxes in the core se-quences (Kawahata et al., 1999). Particulated materialsformed in the surface water sink in the water columnthrough decomposition and dissolution until they finallyreach the sea bottom. This process is called the biologi-cal pump. The sedimentation process, especially at thesea bottom, is important in changing sinking particles intosediment particles. Sedimentation was researched usingsediment traps. Planktonic foraminifers, one of the mostimportant microfossils in sediments of the open oceanenvironment, were analysed from the sediment trap sam-ples and it was clearly shown that the total number ofplanktonic foraminifers reflect seasonal and regionaloceanographic conditions (Eguchi et al., 1999). This sim-
plified proxy using planktonic foraminifers will be usedas a tool of oceanographic reconstruction.
Vertical transportation of Cadmium was determinedby analysis of the sediment trap samples (Noriki et al.,1999). It is very important to know the processes and fac-tors controlling cadmium content in the water column,because cadmium contents in the foraminiferal tests havebeen used as the most important proxy of nutrient con-tents of ambient seawater. Coral reefs are the highest pro-ductivity areas of the open ocean and are often called oasesof the Ocean. To evaluate the contribution of coral reefsto the carbon cycle, we must determine the ration of pro-duction of calcium carbonate to organic carbon. DuringNOPAACS, the R/V Hakurei-Maru visited Palau Barrier
Reef, Majuro Atoll, and the Great Barrier Reef. The fCO2
were measured in surface seawater both in and around
the coral reefs. All coral reefs had higher fCO2 inside the
reefs than outside of them, which suggests that oceaniccoral reefs have the potential to release CO2 into the at-
mosphere. The surface water fCO2 of the lagoons de-
pended on the water circulation pattern and speed in thereef system but generally they all had the potential to re-lease CO2 (Suzuki and Kawahata, 1999).
With the exception of the research mentioned in theabove, other important data on the geology, paleontology,and geophysics were also collected. Those data gave in-formation on the precise correlation between magneticsusceptibility and the sediment sequences for local areas(Ioka and Yamazaki, 1992), and it was possible to estab-lish the intensity of the magnetic field in the late Quater-nary (Yamazaki et al., 1995).
During the NOPACCS study, almost all sedimentsamples were taken from the open marine ocean environ-ment, and were used to reconstruct long-term environ-mental change, although with poor resolution. Therefore,a high resolution environmental study analyzing sedimentcore samples with high sedimentation rates, and a studyon sedimentary processes are required to establish a proxyof primary production.
6. Carbon Cycle of the North PacificThe North Pacific is one of the largest oceans on the
globe, encompassing more than 20% of the area and vol-ume of the global oceans. Thus, the North Pacific is oneof the important oceans in the global carbon cycle. Usingthe data and knowledge collected through NOPACCS, weattempt here to describe the carbon cycle in the NorthPacific.
In order to describe the carbon cycle, the area andreservoir of the carbon should be defined. Thus, we ex-cluded the marginal seas and defined the equator as thesouthern boundary. Three layers were separated vertically;surface (0–200 m), intermediate (200–1000 m) and deep
Overview of NOPACCS 649
(1000 m–bottom). The reservoirs of carbon are dissolvedinorganic carbon (DIC), dissolved organic carbon (DOC),and surface plankton biomass. Some of the fluxes betweenthose reservoirs, air-sea interaction, and sinking to thebottom were also estimated. Anthropogenic emissions ofcarbon were also considered.
Average data of DIC and DOC for 24 NOPACCS sta-tions were integrated over the North Pacific Ocean forthe surface, intermediate, and deep layers. Only the sur-face DIC data were integrated separately for the northand south of 40°N because the values were significantlydifferent. Surface plankton biomass was calculated fromthe data collected with 17 data during 1990–1994 fromfour stations of NOPACCS cruises and from data collectedin the English Channel and Bermuda as reported byHolligan et al. (1984) and Caron et al. (1995), respec-tively. Carbon biomass of bacteria, phytoplankton, andzooplankton was integrated by regression with surface
chlorophyll concentrations and Coastal Zone Color Scan-ner (CZCS, Feldman et al., 1989) satellite phytoplanktonpigment data.
Particle sinking fluxes of organic material and CaCO3were calculated for seven stations of NOPACCS. Thevalues were averaged for each layer and integrated overthe area. The sedimentation rate was calculated assum-ing 80% terrigeous and 10% organic materials with thesedimentation rate of terrigeous material at 0.2 gm–2y–1
(ref.). The accumulation rate of anthropogenic carbon wasestimated by a numerical model and field observations.The minimum and maximum values were estimated by anumerical model (Ishida et al., 1999) and by field data(Watanabe et al., 1996).
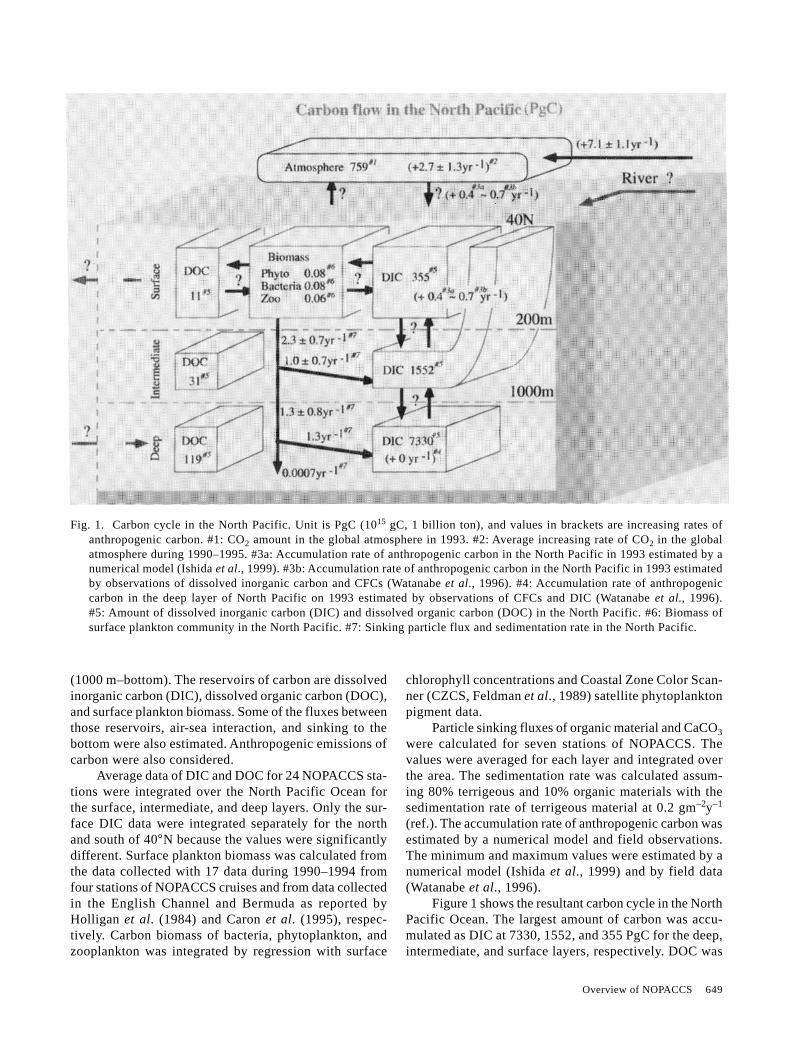
Figure 1 shows the resultant carbon cycle in the NorthPacific Ocean. The largest amount of carbon was accu-mulated as DIC at 7330, 1552, and 355 PgC for the deep,intermediate, and surface layers, respectively. DOC was
Fig. 1. Carbon cycle in the North Pacific. Unit is PgC (1015 gC, 1 billion ton), and values in brackets are increasing rates ofanthropogenic carbon. #1: CO2 amount in the global atmosphere in 1993. #2: Average increasing rate of CO2 in the globalatmosphere during 1990–1995. #3a: Accumulation rate of anthropogenic carbon in the North Pacific in 1993 estimated by anumerical model (Ishida et al., 1999). #3b: Accumulation rate of anthropogenic carbon in the North Pacific in 1993 estimatedby observations of dissolved inorganic carbon and CFCs (Watanabe et al., 1996). #4: Accumulation rate of anthropogeniccarbon in the deep layer of North Pacific on 1993 estimated by observations of CFCs and DIC (Watanabe et al., 1996).#5: Amount of dissolved inorganic carbon (DIC) and dissolved organic carbon (DOC) in the North Pacific. #6: Biomass ofsurface plankton community in the North Pacific. #7: Sinking particle flux and sedimentation rate in the North Pacific.
682 N. O. Eguchi et al.
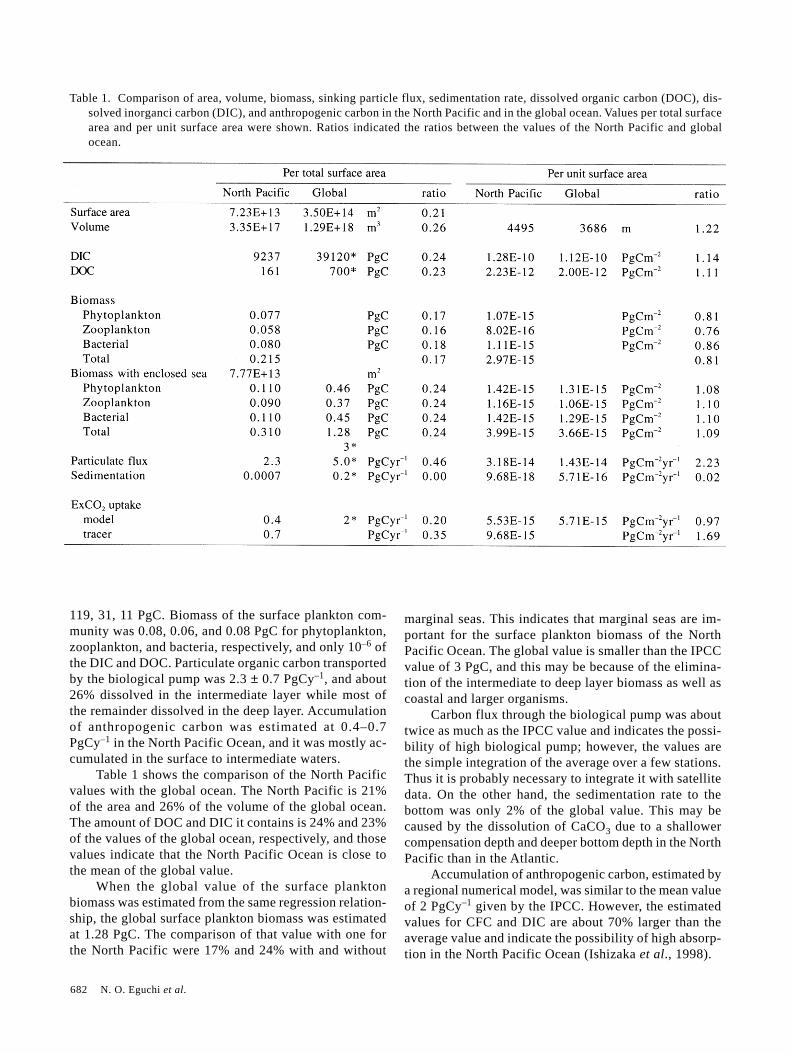
Table 1. Comparison of area, volume, biomass, sinking particle flux, sedimentation rate, dissolved organic carbon (DOC), dis-solved inorganci carbon (DIC), and anthropogenic carbon in the North Pacific and in the global ocean. Values per total surfacearea and per unit surface area were shown. Ratios indicated the ratios between the values of the North Pacific and globalocean.
119, 31, 11 PgC. Biomass of the surface plankton com-munity was 0.08, 0.06, and 0.08 PgC for phytoplankton,zooplankton, and bacteria, respectively, and only 10–6 ofthe DIC and DOC. Particulate organic carbon transportedby the biological pump was 2.3 ± 0.7 PgCy–1, and about26% dissolved in the intermediate layer while most ofthe remainder dissolved in the deep layer. Accumulationof anthropogenic carbon was estimated at 0.4–0.7PgCy–1 in the North Pacific Ocean, and it was mostly ac-cumulated in the surface to intermediate waters.
Table 1 shows the comparison of the North Pacificvalues with the global ocean. The North Pacific is 21%of the area and 26% of the volume of the global ocean.The amount of DOC and DIC it contains is 24% and 23%of the values of the global ocean, respectively, and thosevalues indicate that the North Pacific Ocean is close tothe mean of the global value.
When the global value of the surface planktonbiomass was estimated from the same regression relation-ship, the global surface plankton biomass was estimatedat 1.28 PgC. The comparison of that value with one forthe North Pacific were 17% and 24% with and without
marginal seas. This indicates that marginal seas are im-portant for the surface plankton biomass of the NorthPacific Ocean. The global value is smaller than the IPCCvalue of 3 PgC, and this may be because of the elimina-tion of the intermediate to deep layer biomass as well ascoastal and larger organisms.
Carbon flux through the biological pump was abouttwice as much as the IPCC value and indicates the possi-bility of high biological pump; however, the values arethe simple integration of the average over a few stations.Thus it is probably necessary to integrate it with satellitedata. On the other hand, the sedimentation rate to thebottom was only 2% of the global value. This may becaused by the dissolution of CaCO3 due to a shallowercompensation depth and deeper bottom depth in the NorthPacific than in the Atlantic.
Accumulation of anthropogenic carbon, estimated bya regional numerical model, was similar to the mean valueof 2 PgCy–1 given by the IPCC. However, the estimatedvalues for CFC and DIC are about 70% larger than theaverage value and indicate the possibility of high absorp-tion in the North Pacific Ocean (Ishizaka et al., 1998).

682 N. O. Eguchi et al.
7. Data AvailabilityData collected by NOPACCS is generally available
to the public (Tsubota et al., 1999). The present status ofaccuracy and precision of some of NOPACCS data, incomparison to the requirements of the WOCEHydrographic Program (WHP) and of the Scientific Com-mittee on Oceanic Research (SCOR), are given in Table2. Hydrographic data from 1992–1995 were quality con-trolled and collated in a CD-ROM which is available fromthe Japan Oceanographic Data Center (JODC). Some ofthe data is also available from the NOPACCS Homepage(http://www.aist.go.jp/RIODB/nopaccs/). Other data isalso in preparation for publication, and further informa-tion is available from the authors.
8. From NOPACCS to SEA-COSMIC and NPTTThe project, NOPACCS, continued over seven years
and finished in 1996. As described in this and other pa-pers, many new findings and data related to the carbon
cycle in the North Pacific have accumulated as a result ofthe project. Because the ocean is one of the largest reser-voirs of carbon, the possibility of sequestration of CO2into the intermediate layer of ocean has been discussed(Handa and Ohsumi, 1995). Thus, MITI and NEDO havestarted a new project, SEA-COSMIC (Study of Environ-mental Assessment for CO2 Ocean Sequestration for Miti-gation of Climate change) commencing in the fiscal yearof 1997 with a plan to continue for five years (http://www.seacosmic.org). The final goals of the oceanographicstudies of SEA-COSMIC are 1) the development of meth-ods to predict how much CO2 is sequestrated in the NorthPacific and 2) the development of methods for environ-mental assessment of CO2 ocean sequestration, which isdifferent from more basic study, NOPACCS, using morerefined techniques the those used in NOPACCS. How-ever, for those purposes, it is also necessary to under-stand the natural carbon cycle in the North Pacific so someof the studies conducted in NOPACCS are being contin-
Table 2. Accuracy and precision required in WOCE Hydrographic Program (WHP) for temperature, salinity, pressure, DO,nutrients and in Scientific Committee on Oceanic Research (SCOR) for pH, alkalinity, total inorganic carbon, partial pressureof CO2, and the present conditions of NOPACCS.

652 H. Tsubota et al.
ued. Joint Global Ocean Flux Study (JGOFS) also recentlyformed a North Pacific Task Team (NPTT) and started atime series observation of the carbon related materials inthe north-western sub-arctic Pacific (KNOT: Kyodo-Co-operation North pacific Ocean Time series) (Bychkow andSaino, 1998). SEA-COSMIC is collaborating with theNPTT and KNOT projects.
AcknowledgementsThe authors would like to express their thanks to the
captains, officers and crew of Hakurei-Maru for theirexcellent onboard work, and to hard working scientistsonboard. This research was supported by the NorthwestPacific Carbon Cycle Study assigned to the Kansai Envi-ronmental Engineering Center Co., Ltd. by the New En-ergy and Industrial Technology Development Organiza-tion.
ReferencesAsahara, Y., T. Tanaka, H. Kamioka, A. Nishimura and T.
Yamazaki (1999): Provenance of the North Pacificsediments and process of source material transport as de-rived from Rb-Sr isotopic systematics. Chem. Geol., 158,271–291.
Bychkow, A. and T. Saino (1998): JGOFS NPTT Meets to re-view plans for studies in North Pacific. U.S. JGOFS News,9, 11–12.
Caron, D. A., H. G. Dam, P. Kremer, E. J. Lessard, L. P. Madin,T. C. Malone, J. M. Nappe, E. R. Peele, M. R. Roman andM. J. Youngbluth (1995): The contribution of microorgan-isms to particulate carbon and nitrogen in surface waters ofthe Sargasso Sea near Bermuda. Deep-Sea Res. I, 42, 943–972.
Chen, C. T. A. (1982): Oceanic penetration of excess CO2 in across section between Alaska and Hawaii. Geophys. Res.Lett., 9, 117–119.
Eguchi, N. O., H. Kawahata and A. Taira (1999): Seasonal re-sponse of planktonic foraminifera to surface ocean condi-tion: Sediment trap results from the central North PacificOcean. J. Oceanogr., 55, this issue, 681–691.
Feldman, G., N. Kuring, C. Ng, W. Esaias, C. McClain, J. Elrod,N. Maynard, D. Endres, R. Evans, J. Brown, S. Walsh, M.Carle and G. Podesta (1989): Ocean color. Availability ofthe global data set. EOS, 70, 634–641.
Goes, J. I., T. Saino, H. Oaku, J. Ishizaka, C. S. Wang and Y.Nojiri (1999): Basin scale estimates of sea surface nitrateand new production from remotely sensed sea surface tem-perature and chlorophyll. Geophys. Res. Lett. (in press).
Handa, N. and T. Ohsumi (eds.) (1995): Direct Ocean Disposalof Carbon Dioxide. Terrapub, Tokyo, 274 pp.
Harimoto, T., J. Ishizaka and R. Tsuda (1999): Latitudinal andvertical distributions of phytoplankton absorption spectrain the central North Pacific during spring 1994. J.Oceanogr., 55, this issue, 667–679.
Holligan, P. M., R. P. Harris, R. C. Newell, D. S. Harbour, R.N. Head, E. A. S. Linley, M. I. Lucas, P. R. G. Tranter andC. M. Weekley (1984): Vertical distribution and partition-
ing of organic carbon in mixed, frontal and stratified wa-ters of the English Channel. Mar. Ecol. Prog. Ser., 14, 111–127.
Houghton, J. T., G. J. Jenkins and J. J. Epshraus (1990): Cli-mate Change: The IPCC Scientific Assessment. CambridgeUniversity Press, New York, 365 pp.
Houghton, J. T., L. G. M. Filho, B. A. Callender, N. Harris, A.Kattenberg and K. Maskell (1995): Climate Change 1995:The Science of Climate Change. Cambridge UniversityPress, New York, 572 pp.
Ioka, N. and T. Yamazaki (1992): Variations of magnetic sus-ceptibility and magnetic grain size induced by paleoclimaticchanges: A study on Late Pleistocene sediment cores fromthe West Caroline Basin, western equatorial Pacific. Bull.Geol. Surv. Japan, 43, 781–797.
Ishida, A., K. Nakata, S. Aoki, H. Kutsukake, M. Kishi and M.Kubota (1995): Numerical experiment of anthropogenic CO2in the North Pacific. J. Mar. Sci. Tec. Soc., 2, 49–62.
Ishida, A., K. Nakata, S. Aoki, H. Kutsukake, M. J. Kishi andM. Kubota (1999): Sensitivity of CFCs and anthropogenicCO2 uptake in a North Pacific GCM to mixingparameterization and surface forcing. J. Oceanogr. (sub-mitted).
Ishizaka, J. (1994): Interannual and seasonal variability of size-fractionated chlorophyll a along 175°E. Jap. JGOFAS NewsLetter, 1, 6–8.
Ishizaka, J., H. Kiyosawa, K. Ishida, K. Ishikawa and M.Takahashi (1994): Meridional distribution and carbonbiomass of autotrophic picoplankton in the Central NorthPacific Ocean during Late Northern Summer 1990. Deep-Sea Res. I, 41, 1745–1766.
Ishizaka, J., K. Harada, K. Ishikawa, H. Kiyosawa, H. Furusawa,Y. Watanabe, H. Ishida, K. Suzuki, N. Handa and M.Takahashi (1997): Size and taxonomic plankton commu-nity structure and carbon flow at the equator, 175°E during1990–1994. Deep-Sea Res. II, 44, 1927–1949.
Ishizaka, J., Y. W. Watanabe, A. Ishida, S. Aoki, K. Harada, K.Nakata and H. Tsubota (1998): Carbon cycle in the NorthPacific—Role in the global ocean. J. NIRE., 7, 105–111 (inJapanese with English abstract).
Kawahata, H., N. Eguchi and A. Suzuki (1996): Variation ofprimary productivity in the western Pacific Ocean in theLate Quaternary. Kaiyo Monthly, 28, 497–501 (in Japanese).
Kawahata, H., K. Ohkushi and Y. Hatakeyama (1999): Com-parative late Pleistocene paleoceanographic changes in themid latitude boreal and austral western Pacific. J. Oceanogr.,55, this issue, 747–761.
Keeling, C. D., R. B. Bacastow, A. F. Carter, S. C. Piper, T. P.Whorf, M. Heimann, M. G. Mook and H. Roeloffzen (1989):A three-dimensional model of atmospheric CO2 transportbased on observed winds, 1. Analysis of observational data.p. 165–236. In Aspects of Climate Variability in the Pacificand Western Americas, in Geophys. Monogr. Ser., ed. by D.H. Peterson, AGU, Washington, D.C.
Kiyosawa, H., J. Ishizaka, M. Takahashi and K. Ishikawa(1995): Methods of estimating biomass structure of pelagicplankton community-method for Northwest Pacific CarbonCycle Study. J. NIRE, 4, 87–103 (in Japanese with Englishabstract).

Overview of NOPACCS 653
Levitus, S. (1982): Climatological atlas of the world oceans.NOAA Professional Paper, 13, Rockville, Maryland, 173pp.
Nishina, A. and M. Fukasawa (1999): On the year to year vari-ation of the North Pacific intermediate salinity minimum.J. Oceanogr. (submitted).
Noriki, S., K. Hamahara and K. Harada (1999): Particulate fluxand Cd/P ratio of particulate material in the Pacific Ocean.J. Oceanogr., 55, this issue, 693–703.
Ohkouchi, N., K. Kawamura, H. Kawahata and A. Taira (1997):Latitudinal distributions of terrestrial biomarkers in thesediments from the Central Pacific. Geochem. Cosmochim.Acta, 61, 1911–1918.
Ono, T., S. Watanabe, K. Okuda and M. Fukasawa (1998): Dis-tribution of total carbonate and related properties in theNorth Pacific along 30°N. J. Geophys. Res., 103, 30873–30883.
Ono, T., S. Watanabe and Y. W. Watanabe (1999): Recent in-crease of total carbonate in the western North Pacific. Mar.Chem. (submitted).
Quay, P. D., B. Tilbrook and C. S. Wong (1992): Oceanic up-take of fossil fuel CO2: C-13 evidence. Science, 256, 74–79.
Reid J. L. (1965): Intermediate Waters of the Pacific Ocean.The Johns Hopkins Oceanographic Study, 2, 85 pp.
Shiller, A. M. (1981): Calculating the oceanic CO2 increase: Aneed for caution. J. Geophys. Res., 86, 11083–11088.
Shiller, A. M. (1982): Reply to comment by Chen et al., on“Calculating the oceanic CO2 increase: A need for caution”by A. M. Shiller. J. Geophys. Res., 87, 2086.
Siegenthaler, U. and J. L. Sarmiento (1993): Atmospheric car-bon dioxide and the ocean. Nature, 365, 119–125.
Slansky, C. M., R. A. Feely and R. Wanninkhof (1997): Thestepwise linear regression method for calculating anthro-pogenic CO2 invasion into the North Pacific Ocean. Pro-ceedings of International Marine Science Symposium onBiogeochemical Processes in the North Pacific, Japan, Ja-pan Marine Science Foundation.
Suzuki, A. and H. Kawahata (1999): Partial pressure of carbondioxide in coral reef lagoon waters: Comparative study ofatolls and barrier reefs in the Indo-Pacific Oceans. J.Oceanogr., 55, this issue, 731–745.
Suzuki, K., N. Handa, H. Kiyosawa and J. Ishizaka (1995):Distribution of the prochlorophyte Prochlorococus in thecentral Pacific Ocean as measured by HPLC. Limnol.Oceanogr., 40, 983–989.
Suzuki, K., N. Handa, H. Kiyosawa and J. Ishizaka (1997):Temporal and spatial patterns of phytoplankton pigmentsin the central Pacific Ocean along 175°E during the borealsummers of 1992 and 1993. J. Oceanogr., 53, 383–396.
Takahashi, M., H. Kanazawa, H. Kiyosawa and J. Ishizaka(1999): Distribution and non-dominancy of large diatoms
in planktonic algal communities in the central Pacific Oceanalong 175°E. In Dynamics and Characterization of MarineOrganic Matter, ed. by N. Handa, E. Tanoue and T. Hama,Terra Sci. Publ. Co., Tokyo (in press).
Takahashi, Y., E. Matsumoto and Y. W. Watanabe (1999): Im-proved method for calculating anthropogenic CO2 in theupper layer of the North Pacific subtropical gyre along175°E. J. Oceanogr., 55, this issue, 717–729.
Tans, P. P., I. Y. Fung and T. Takahashi (1990): Observationalconstraints on the global atmospheric CO2 budget. Science,247, 1431–1438.
Tsubota, H., K. Harada, K. Ishida, Y. W. Watanabe, Y. Watanabeand T. Sugimoto (1999): Hydrographic data of NOPACCS(Northwest Pacific Carbon Cycle Study). Proceedings forInternational Conference on Marine Environment, the Past,Present and Future, Kaohsiung, Taiwan, held on 26–28January, 1999 (in press).
Tsunogai, S., T. Ono and S. Watanabe (1993): Increase in totalcarbonate in the western North Pacific water and a hypoth-esis on the missing sink of anthropogenic carbon. J.Oceanogr., 49, 305–315.
Wallace, D. W. R. and K. M. Johnson (1994): Prediction oftotal dissolved inorganic carbon on basin scales by simplemultiple liner regression. EOS Trans. AGU, 75, 160.
Watai, T., K. Harada, K. Gotoh, S. Murayama and T. Nakazawa(1999): Latitudinal distribution of CO2 fugacity along 175°Ein the North Pacific in 1992–1996. J. Oceanogr., 55, thisissue, 655–665.
Watanabe, Y. W., K. Harada and K. Ishikawa (1994):Chlorofluorocarbons in the central North Pacific and south-ward spreading time of North Pacific Intermediate Water.J. Geophys. Res., 99, 25195–25213.
Watanabe, Y. W., K. Harada and K. Ishikawa (1995): Dilutionof North Pacific Intermediate Water studied withchlorofluorocarbons. J. Oceanogr., 51, 133–144.
Watanabe, Y. W., Y, Takahashi, T. Kitao and K. Harada (1996):Total amount of oceanic excess CO2 taken from the NorthPacific subpolar region. J. Oceanogr., 52, 301–312.
Watanabe, Y. W., A. Ishida, M. Tamaki, K. Okuda and M.Fukasawa (1997): Water column inventories of CFCs andproduction rate of intermediate water in the North Pacific.Deep-Sea Res. I, 44, 1091–1104.
Watanabe, Y. W., T. Ono and A. Shimamoto (1999): Total car-bonate increase in the western North Pacific using chemi-cal tracer’s age. Mar. Chem. (submitted).
Yamazaki, T. and N. Ioka (1997): Cautionary note on magneticgrain-size estimation using the ratio of ARM magnetic sus-ceptibility. Geophys. Res. Lett., 21, 751–754.
Yamazaki, T., N. Ioka and N. Eguchi (1995): Relativepaleointensity of the geomagnetic field during the BruhnesChron. Earth Planet. Sci. Lett., 128, 243–255.