Embed Size (px)
Citation preview

SDD: Total Productive Maintenance REV1: 2014 January 31
Page 1 of 21 Planned Maintenance Implementation Planned Maintenance Implementation
Step 1

SDD: Total Productive Maintenance REV1: 2014 January 31
Page 2 of 21 Planned Maintenance Implementation Planned Maintenance Implementation
Step 1
Contents
1. Introduction ............................................................................................................. 3
2. Planned maintenance benefits ............................................................................... 4
3. Planned maintenance responsibilities .................................................................... 5
3.1 The role of the production department .............................................................. 6
3.2 The role of the maintenance department .......................................................... 7
4. PM Step 1: Evaluate equipment failures and assess the current situation ............. 9
4.1 Data collection ................................................................................................. 10
4.2 Create an equipment ledger and negative map .............................................. 11
4.3 Evaluate and rank equipment .......................................................................... 14
4.4 Select equipment for planned maintenance .................................................... 16
4.4.1 Mean time between failures and Mean time to repair ............................... 17
4.5 Set goals for reducing breakdowns ................................................................. 19
4.6 Activity plan for eliminating breakdowns ......................................................... 20
Table of figures ......................................................................................................... 21

SDD: Total Productive Maintenance REV1: 2014 January 31
Page 3 of 21 Planned Maintenance Implementation Planned Maintenance Implementation
Step 1
1. Introduction Planned maintenance (PM) is the third pillar of Total Productive Maintenance (TPM).
Its purpose is to improve the effectiveness of operational equipment, in terms of
increasing its reliability, maintainability and performance and reducing maintenance
costs and equipment failures, through scheduled maintenance tasks. These tasks
are based on predicted and/or measured failure rates.
In order to implement planned maintenance successfully, support is required from
both Maintenance and Production personnel, in the execution of the planned
maintenance pillar. The benefits of introducing a planned maintenance system are
described in the section following, as an incentive to working together as a team in
its implementation.
A series of steps make up the planned maintenance pillar, with this module focusing
on step one – evaluating equipment failures and assessing the current situation.
Each step contributes to the reduction and prevention of unforeseen equipment
failures and breakdowns.
This module is aimed at describing the activities required for implementing step one
of planned maintenance.

SDD: Total Productive Maintenance REV1: 2014 January 31
Page 4 of 21 Planned Maintenance Implementation Planned Maintenance Implementation
Step 1
2. Planned maintenance benefits The benefits of planned maintenance are depicted below:
a) The quality of the part is maintained,
b) Increase in production up-time,
c) Reduced cost of operations,
d) Reduction in the number of machinery required,
e) Improving equipment capability and reliability – increasing the
mean-time-between-failures (MTBF),
f) Improving equipment maintainability by reducing sporadic
maintenance time – reduction in the mean-time-to repair (MTTR),
g) Establishing/improving predictive maintenance,
h) Reduced maintenance costs.

SDD: Total Productive Maintenance REV1: 2014 January 31
Page 5 of 21 Planned Maintenance Implementation Planned Maintenance Implementation
Step 1
Consequently, poor maintenance activities have a negative effect on operational
activities and are listed in figure 1 below:
Figure 1: The effect of poor maintenance activities
3. Planned maintenance responsibilities The implementation of planned maintenance activities requires the commitment and
support of both Production and Maintenance. Each play a role in ensuring the
planned maintenance activities are followed through, thereby improving the
reliability, maintainability and availability of equipment, as well as reducing costs as a
result of these improvements.
The crucial roles played by each of these parties, is described in the sections
following and summarised in the tables shown in figure 2 and 3.
SDD: Total Productive Maintenance REV1: 2014 January 31
Page 6 of 21 Planned Maintenance Implementation Planned Maintenance Implementation
Step 1
3.1 The role of the production department The role of production entails the support for steps 0 to 3 of autonomous
maintenance (this is known as planned maintenance step 0, as explained in the PM
step 0 module), segregated into three categories: preventing deterioration,
measuring deterioration and rectifying deterioration.
Preventing deterioration requires the up-keep of equipment through cleaning, oiling,
tightening and routine inspections of equipment conditions, to avoid forced
deterioration.
Measuring deterioration involves periodic inspection of the equipment, to ensure its
reliability and avoid unforeseen failures.
Rectifying deterioration includes minor maintenance on equipment to ensure its up-
time, as well as countermeasures for causes of forced deterioration on the
equipment.

SDD: Total Productive Maintenance REV1: 2014 January 31
Page 7 of 21 Planned Maintenance Implementation Planned Maintenance Implementation
Step 1
Summary – Roles of the production department tabled in figure 2:
Figure 2: The roles of the production department
3.2 The role of the maintenance department As is required of production, the role of maintenance includes the support for steps 0
to 3 of autonomous maintenance (AM), as well as support of planned maintenance
activities. The maintenance activities to be performed are segregated into three
categories: preventing deterioration, measuring deterioration and rectifying
deterioration.
Preventing deterioration by improving the service life of the equipment, reducing its
load or enhancing the material strength of the equipment, improves its reliability.
Maintenance Classification Preventing Deterioration
Measuring Deterioration
Rectifying Deterioration
Routine Maintenance
Periodic inspectionPeriodic Maintenance
Breakdown Maintenance
Corrective Maintenance (Maintainability)
Corrective Maintenance (Reliability)
Minor maintenance
Early Detection of situation and speedy
countermeasures
Enhancement of material strength
Reduction of load
Enhancement of accuracy
Development of condition monitoring
Oiling
Tightening
Cleaning and Countermeasures of
defects
Routine inspection of conditions of use and
deterioration
Roles of the Production Department
Normal OperationCorrect operation
Setup and adjustment
Maintenance Activities to be Performed
SDD: Total Productive Maintenance REV1: 2014 January 31
Page 8 of 21 Planned Maintenance Implementation Planned Maintenance Implementation
Step 1
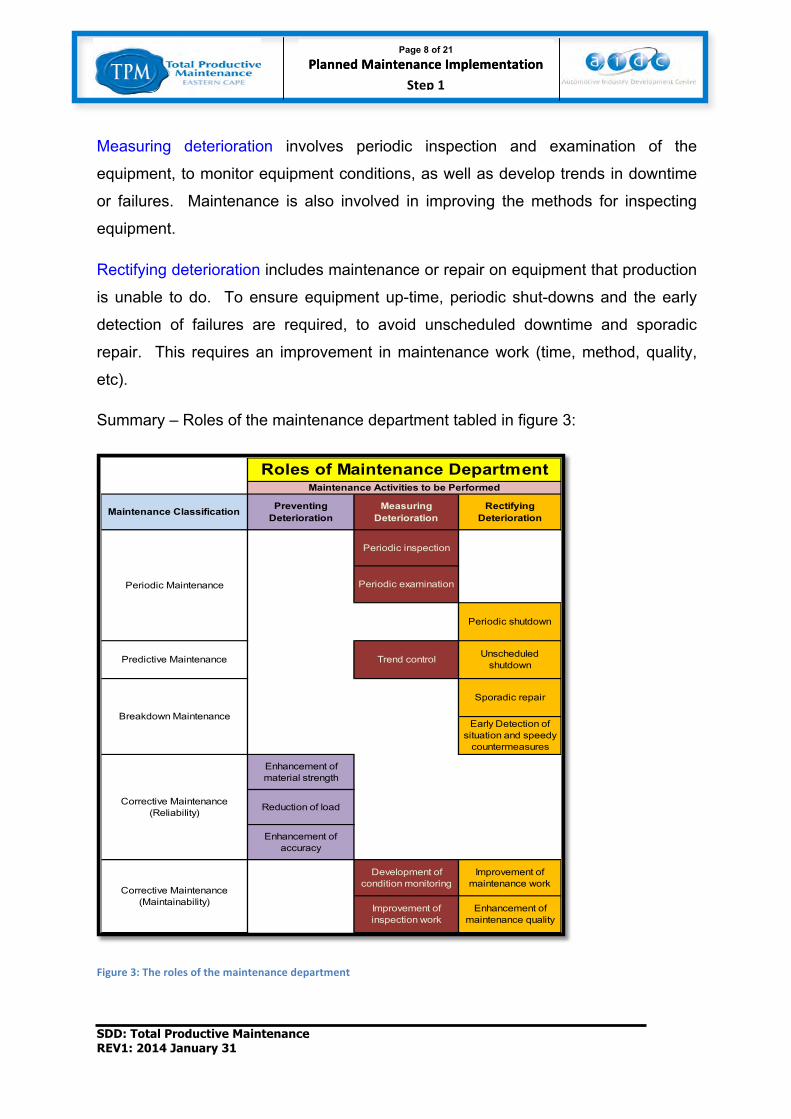
Measuring deterioration involves periodic inspection and examination of the
equipment, to monitor equipment conditions, as well as develop trends in downtime
or failures. Maintenance is also involved in improving the methods for inspecting
equipment.
Rectifying deterioration includes maintenance or repair on equipment that production
is unable to do. To ensure equipment up-time, periodic shut-downs and the early
detection of failures are required, to avoid unscheduled downtime and sporadic
repair. This requires an improvement in maintenance work (time, method, quality,
etc).
Summary – Roles of the maintenance department tabled in figure 3:
Figure 3: The roles of the maintenance department
Maintenance Classification Preventing Deterioration
Measuring Deterioration
Rectifying Deterioration
Sporadic repair
Improvement of inspection work
Corrective Maintenance (Maintainability)
Improvement of maintenance work
Enhancement of maintenance quality
Breakdown Maintenance
Development of condition monitoring
Periodic examination
Periodic shutdown
Periodic Maintenance
Trend control Unscheduled shutdownPredictive Maintenance
Periodic inspection
Early Detection of situation and speedy
countermeasures
Corrective Maintenance (Reliability)
Enhancement of material strength
Reduction of load
Enhancement of accuracy
Roles of Maintenance DepartmentMaintenance Activities to be Performed
SDD: Total Productive Maintenance REV1: 2014 January 31
Page 9 of 21 Planned Maintenance Implementation Planned Maintenance Implementation
Step 1
Once the roles between production and maintenance have been established and
support for AM steps 0 to 3 are in place (i.e. step 0 of planned maintenance), step 1
of planned maintenance can commence.
4. PM Step 1: Evaluate equipment failures and assess the current situation
Step 1 involves the evaluation of equipment failure/breakdown status and
understanding the current situation. This depicts the current state of the equipment
and provides a baseline for further information and future improvements.
A team for the planned maintenance pillar is required, as per the autonomous
maintenance and focused improvement (FI) pillars. The pillar head may be the
same for both the AM and PM pillars, while the supporting team should consist of
maintenance personnel who are willing to collect and record information on
equipment failures.
Although an entire plant or section of a plant may be used for the collection of data,
the model area chosen for TPM should receive focus in terms of goal planning and
equipment improvements, in order to pass the PM audits.
Figure 4 describes the process to be followed for PM step 1. These steps will be
explained in further detail in the sections following.
SDD: Total Productive Maintenance REV1: 2014 January 31
Page 10 of 21 Planned Maintenance Implementation
Step 1
Process for planned maintenance step 1:
Figure 4: Process for planned maintenance step 1
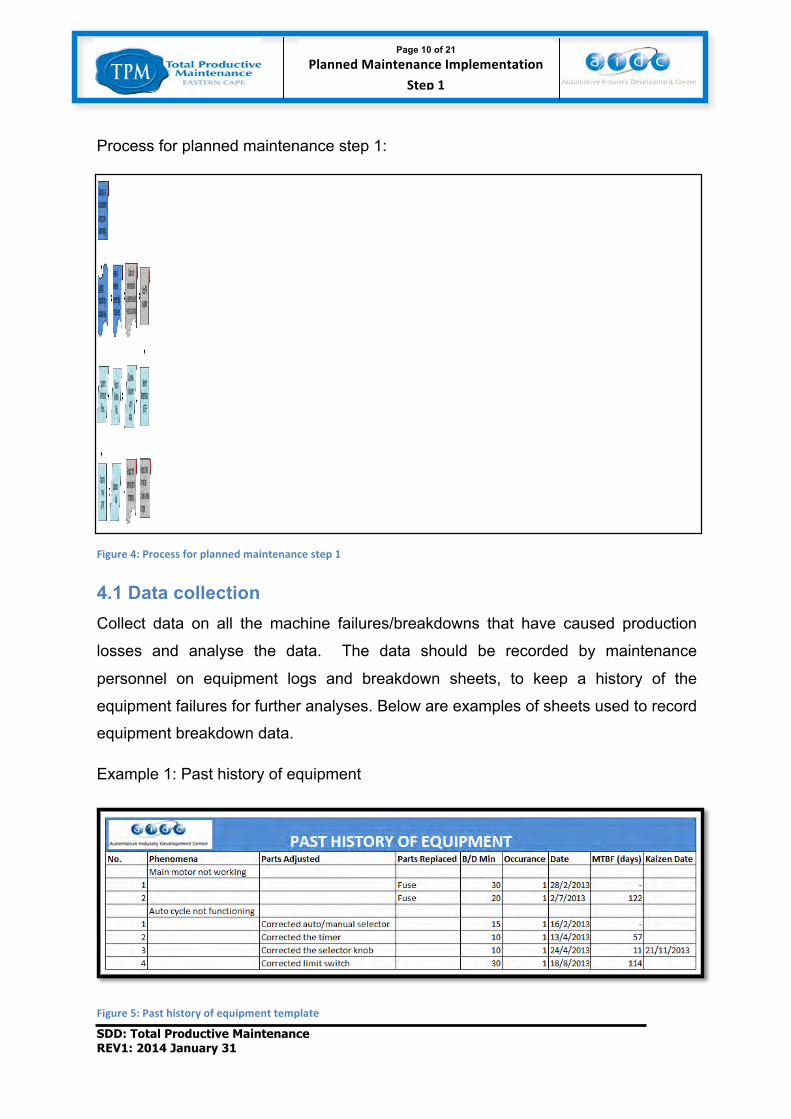
4.1 Data collection Collect data on all the machine failures/breakdowns that have caused production
losses and analyse the data. The data should be recorded by maintenance
personnel on equipment logs and breakdown sheets, to keep a history of the
equipment failures for further analyses. Below are examples of sheets used to record
equipment breakdown data.
Example 1: Past history of equipment
Figure 5: Past history of equipment template
SDD: Total Productive Maintenance REV1: 2014 January 31
Page 11 of 21 Planned Maintenance Implementation
Step 1
The data sheet shown in figure 5 is used to record data on a grinding machine for a
period of one year. The failure type has been documented, as well as the parts
changed/adjusted to correct the failure. The number of occurrences provides
information on whether the problem occurs frequently, possibly showing an
underlying issue, while the breakdown minutes records the time lost due to the
failure.
Recording the failure dates, allows the mean time between failures to be calculated
and later used for time-based maintenance planning. Any Kaizens developed for a
failure are also linked to the breakdown history data, to show improvements made to
the failures.
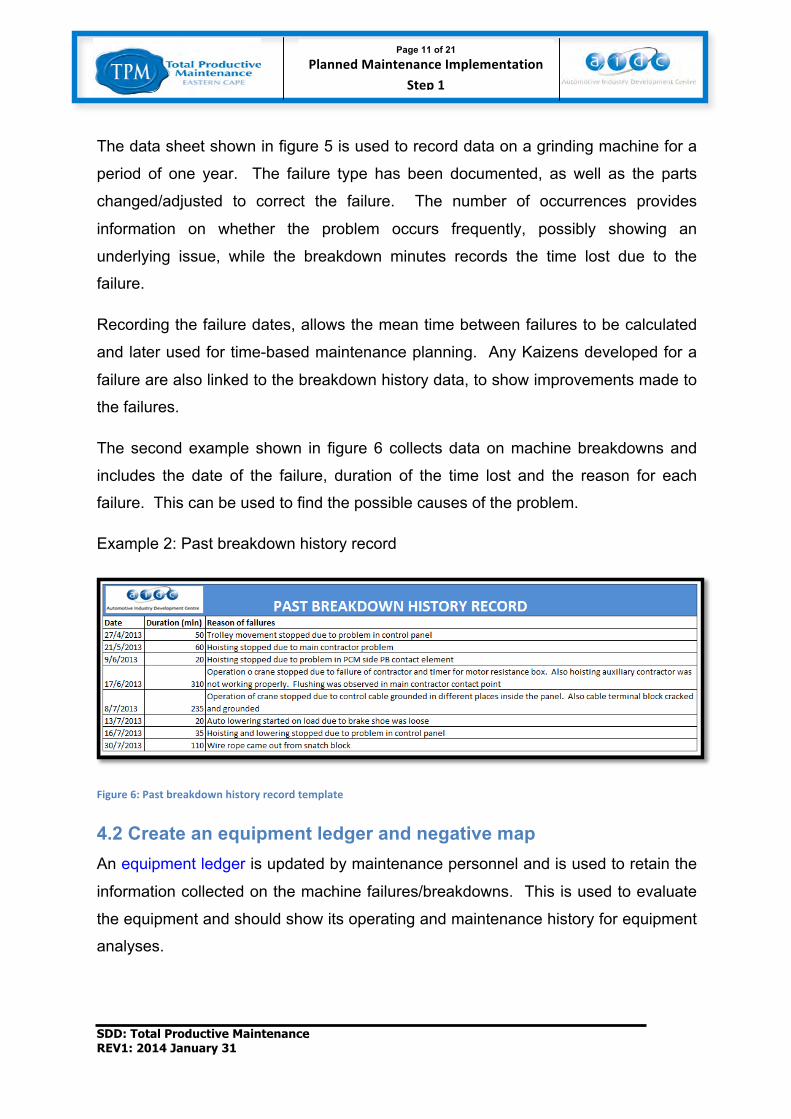
The second example shown in figure 6 collects data on machine breakdowns and
includes the date of the failure, duration of the time lost and the reason for each
failure. This can be used to find the possible causes of the problem.
Example 2: Past breakdown history record
Figure 6: Past breakdown history record template
4.2 Create an equipment ledger and negative map An equipment ledger is updated by maintenance personnel and is used to retain the
information collected on the machine failures/breakdowns. This is used to evaluate
the equipment and should show its operating and maintenance history for equipment
analyses.
SDD: Total Productive Maintenance REV1: 2014 January 31
Page 12 of 21 Planned Maintenance Implementation
Step 1
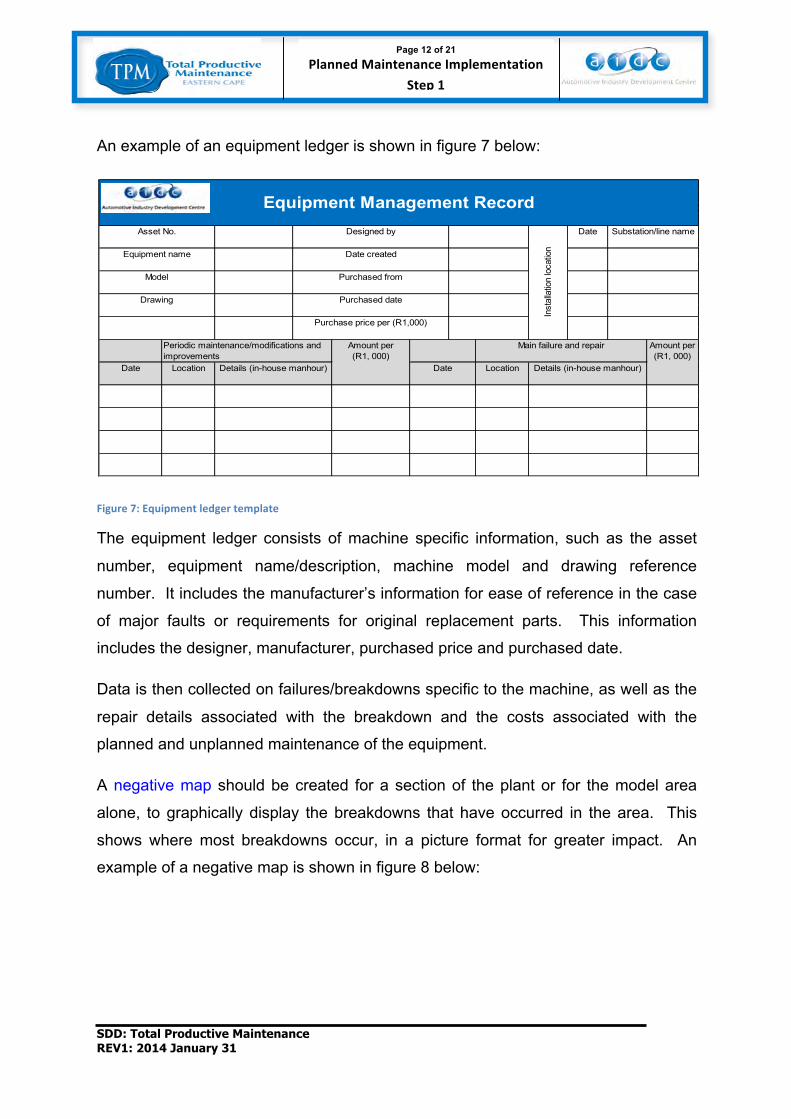
An example of an equipment ledger is shown in figure 7 below:
Figure 7: Equipment ledger template
The equipment ledger consists of machine specific information, such as the asset
number, equipment name/description, machine model and drawing reference
number. It includes the manufacturer’s information for ease of reference in the case
of major faults or requirements for original replacement parts. This information
includes the designer, manufacturer, purchased price and purchased date.
Data is then collected on failures/breakdowns specific to the machine, as well as the
repair details associated with the breakdown and the costs associated with the
planned and unplanned maintenance of the equipment.
A negative map should be created for a section of the plant or for the model area
alone, to graphically display the breakdowns that have occurred in the area. This
shows where most breakdowns occur, in a picture format for greater impact. An
example of a negative map is shown in figure 8 below:
Equipment Management RecordAsset No.
Equipment name
Model
Designed by
Date created
Purchased from
Inst
alla
tion
loca
tion
Purchased date
Purchase price per (R1,000)
Drawing
Substation/line nameDate
Periodic maintenance/modifications and improvements
Amount per (R1, 000)
Main failure and repair Amount per (R1, 000)
Date Location Details (in-house manhour)Date Location Details (in-house manhour)

SDD: Total Productive Maintenance REV1: 2014 January 31
Page 13 of 21 Planned Maintenance Implementation
Step 1
Figure 8: Negative map
A negative map is prepared in the following way:
Process for developing a negative map:
1) Obtain a layout of the area to be observed, eg: a section of the plant or
the model area. This should include drawings of the machines in the
area/cell,
2) As failures or breakdowns occur in the area, a red pin or dot is placed
on the layout, on the machine where the failure occurred,
3) This becomes the negative map and should be maintained for a
period of time,
4) The layout will demonstrate groups of red dots, indicating problem areas
or machines that have the highest number of breakdowns in a given
period,
5) The negative map is then used to help prioritise the areas/machines to
be focused on, for improvements in reducing the number of machine
failures.

SDD: Total Productive Maintenance REV1: 2014 January 31
Page 14 of 21 Planned Maintenance Implementation
Step 1
4.3 Evaluate and rank equipment To determine which equipment receives planned maintenance, criteria for evaluating
and ranking equipment is required. Each machine should be evaluated according to
its effect on safety, quality, operability and maintainability, as well as any other
critical aspects determined by the pillar committee.
The equipment can then be ranked from high to low, based on specific evaluation
criteria or the summation of points allocated per evaluation criterion. This is
explained in further detail, using the examples below:
Example 1: Equipment ranked using evaluation criteria
Figure 9: Evaluation criteria for ranking equipment (example)
In figure 9 above, equipment is ranked as A, B or C, based on the severity of the
failure and its effect on safety, quality, production and maintenance. An “A” machine
is most critical, causing safety risks or quality defects during a failure, while a “C”
machine will cause no major issues in the event of a breakdown.

SDD: Total Productive Maintenance REV1: 2014 January 31
Page 15 of 21 Planned Maintenance Implementation
Step 1
Example 2: Equipment ranked using evaluation points
Figure 10: Equipment ranking template (example)
In figure 10 above, equipment is assessed using points assigned to each evaluation
criterion. Once the points have been totalled, the equipment is ranked as S, A, B or
C, based on the number of points accumulated. An example of an equipment
classification is shown in figure 11 below:
Figure 11: Equipment ranking example
An “S” machine is most critical, while a “C” machine will cause no major issues in the
event of a breakdown.
Evaluation Chart for Ranking Equipment (Evaluation Table for Selecting Priority Equipment)
4 2
4 2 1
4 2 1
1
4 2 1
4 2 1
Safety (SM)
9 Risk of a failure causing injury
10 Risk of a failure causing pollution
5
5
5
Quality (Q)
7
8Cost (C)
Product fabrication process capability
Fabrication cost
Total repair cost
6
1
Frequency of failures 4 2 1
1Production
(PD)
Average level of operation 5 4 2
Impact of a failure on other equipment 5 4 2
2
3
4
5 Downtime for repairing failures 4 2
1 1
Availability of space machine or alternate machine, and the ease of switchover 4 2 1
Classification EvaluationEvaluation points
Equipment name

SDD: Total Productive Maintenance REV1: 2014 January 31
Page 16 of 21 Planned Maintenance Implementation
Step 1
Note: The tables above serve as examples of equipment classification and ranking.
Equipment should be classified based on the manufacturer’s recommendations and
maintenance’s experience in the criticality of certain parts/machinery.
4.4 Select equipment for planned maintenance The equipment selected for planned maintenance, should be based on the following
criteria listed in figure 12 below:
Figure 12: PM equipment selection criteria
The equipment logs, breakdown sheets, equipment ledgers, negative map and
equipment ranking sheets mentioned earlier, are all used in determining the
equipment requiring planned maintenance.
A breakdown occurrence list can be used to collect data on the failure numbers,
frequencies, MTBFs and MTTRs. An example of a breakdown occurrence list is
shown in figure 13 below:

SDD: Total Productive Maintenance REV1: 2014 January 31
Page 17 of 21 Planned Maintenance Implementation
Step 1
Figure 13: Breakdown occurrence list example
4.4.1 Mean time between failures and Mean time to repair The mean time between failures measures the reliability of the equipment, by
determining how long a machine runs for, before a breakdown or failure occurs. The
longer the period between failures, the longer the machine is running for. This
provides higher machine reliability and availability.
The formula for calculating MTBF is shown in figure 14:
Figure 14: MTBF formula
MTBF is calculated by adding the total operating time for a period and dividing it by
the total number of failures within that period. This provides the average time a
machine runs for, before a failure occurs.
The mean time to repair measures the average time taken to repair a
machine/component failure and is an indicator of the maintainability of the
equipment. The shorter the repair time, the smaller the machine down-time, thereby
providing higher machine availability.
The formula for calculating MTTR is shown in figure 15:

SDD: Total Productive Maintenance REV1: 2014 January 31
Page 18 of 21 Planned Maintenance Implementation
Step 1
Figure 15: MTTR formula
MTTR is calculated by adding the total repair time for a period and dividing it by the
total number of failures within that period. This provides the average time taken to
repair a machine/component failure.
An example of a MTBF and MTTR calculation is shown in figure 16.
Example of MTBF and MTTR:
Figure 16: MTBF and MTTR calculation example
The total operating time in green = 270min
The total repair time in red = 45min
The total number of failures = 3 (in red)
Therefore: MTBF = 270/3 = 90min of operating time before a failure occurs (average)
MTTR = 45/3 = 15min to repair a failure when it occurs (average)
Ideally, the MTBF should be as long as possible and the MTTR as short as possible,
to maintain the up-time of the machine. Evaluating equipment failures, ranking
equipment and prioritising the equipment for planned maintenance, forms part of
improving the reliability and availability of the machinery.
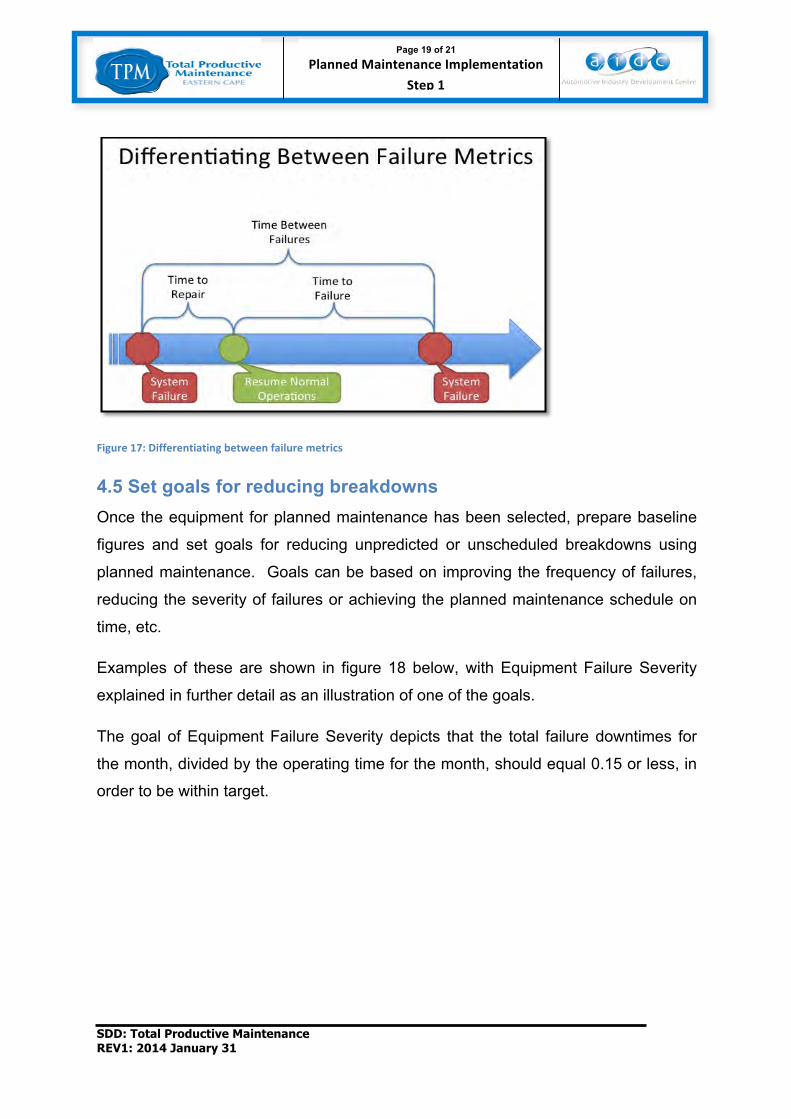
Figure 17 is used to distinguish between failure metrics:
SDD: Total Productive Maintenance REV1: 2014 January 31
Page 19 of 21 Planned Maintenance Implementation
Step 1
Figure 17: Differentiating between failure metrics
4.5 Set goals for reducing breakdowns Once the equipment for planned maintenance has been selected, prepare baseline
figures and set goals for reducing unpredicted or unscheduled breakdowns using
planned maintenance. Goals can be based on improving the frequency of failures,
reducing the severity of failures or achieving the planned maintenance schedule on
time, etc.
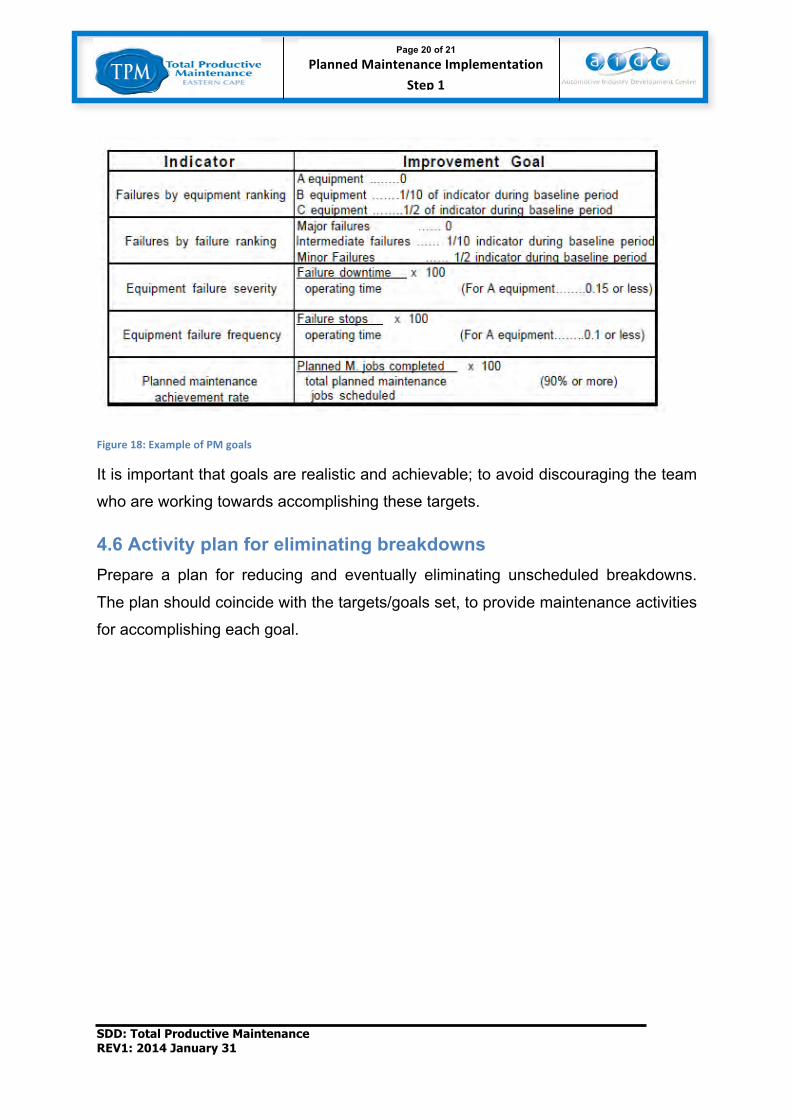
Examples of these are shown in figure 18 below, with Equipment Failure Severity
explained in further detail as an illustration of one of the goals.
The goal of Equipment Failure Severity depicts that the total failure downtimes for
the month, divided by the operating time for the month, should equal 0.15 or less, in
order to be within target.
SDD: Total Productive Maintenance REV1: 2014 January 31
Page 20 of 21 Planned Maintenance Implementation
Step 1
Figure 18: Example of PM goals
It is important that goals are realistic and achievable; to avoid discouraging the team
who are working towards accomplishing these targets.
4.6 Activity plan for eliminating breakdowns Prepare a plan for reducing and eventually eliminating unscheduled breakdowns.
The plan should coincide with the targets/goals set, to provide maintenance activities
for accomplishing each goal.
SDD: Total Productive Maintenance REV1: 2014 January 31
Page 21 of 21 Planned Maintenance Implementation
Step 1
Table of figures Figure 1: The effect of poor maintenance activities .................................................... 5
Figure 2: The roles of the production department ...................................................... 7
Figure 3: The roles of the maintenance department ................................................... 8
Figure 4: Process for planned maintenance step 1 .................................................. 10
Figure 5: Past history of equipment template ........................................................... 10
Figure 6: Past breakdown history record template ................................................... 11
Figure 7: Equipment ledger template ........................................................................ 12
Figure 8: Negative map ............................................................................................ 13
Figure 9: Evaluation criteria for ranking equipment (example) ................................. 14
Figure 10: Equipment ranking template (example) ................................................... 15
Figure 11: Equipment ranking example .................................................................... 15
Figure 12: PM equipment selection criteria .............................................................. 16
Figure 13: Breakdown occurrence list example ........................................................ 17
Figure 14: MTBF formula .......................................................................................... 17
Figure 15: MTTR formula .......................................................................................... 18
Figure 16: MTBF and MTTR calculation example .................................................... 18
Figure 17: Differentiating between failure metrics .................................................... 19
Figure 18: Example of PM goals ............................................................................... 20