Embed Size (px)
Citation preview

Instructions for use
Title Patch size determines the strength of edge effects on carabid beetle assemblages in urban remnant forests
Author(s) Soga, Masashi; Kanno, Nozomi; Yamaura, Yuichi; Koike, Shinsuke
Citation Journal of Insect Conservation, 17(2): 421-428
Issue Date 2013-04
Doc URL http://hdl.handle.net/2115/55282
Type article (author version)
File Information soga_et_al_2013_j_insect_conserv-1.pdf
Hokkaido University Collection of Scholarly and Academic Papers : HUSCAP

1
Patch size determines the strength of edge effects on carabid beetle assemblages
in urban remnant forests
Masashi SOGAa, Nozomi KANNOa, Yuichi YAMAURAb, Shinsuke KOIKEa
a Tokyo University of Agriculture and Technology, 3-5-8 Saiwai, Fuchu, Tokyo 183-8509,
Japan b Division of Environmental Resources, Graduate School of Agriculture, Hokkaido University,
Nishi 9, Kita 9, Kita-ku, Sapporo 080-8589, Japan
Corresponding author: Masashi Soga
Tokyo University of Agriculture and Technology, 3-5-8 Saiwai, Fuchu, Tokyo 183-8509,
Japan .
E-mail address: soga06154053(a)yahoo.co.jp
Tel: +81-42-367-5630; Fax: +81-42-364-7812

2
ABSTRACT
Habitat fragmentation due to urbanization is increasing rapidly worldwide. Although patch
area and edge effect are both important determinants of species diversity and the number of
individuals in fragmented landscapes, studies that tested interaction between two effects
were limited. Here we examined the interaction between area and edge effects on species
richness and the number of individuals of carabids in highly urbanized forests in Tokyo,
central Japan. We surveyed carabids in each of 26 forest patches (1.1–121.6 ha) using pitfall
traps set in both edge and interior zones. First, we correlated the edge-to-interior differences
of both species richness and the number of individuals with patch area. Second, we examined
the interaction between patch area and distance to the edge on species richness and the
number of individuals using generalized linear models. We found a significant decrease in
carabid species richness and the number of individuals in edge zones. The edge-to-interior
differences in both species richness and the number of individuals were positively correlated
with patch area. Model selection revealed the evident interaction effects between patch area
and distance to the edge: higher number of individuals was predicted in only large interior
zones. Our results indicated that carabid beetle assemblages were influenced by the
interaction between area and edge effects. Thus, in urban areas where small forest remnants
dominate, circularizing the shape of the forest patches to maximize the core areas may be the
most feasible and realistic means to preserve biodiversity.
Keywords: area effects, carabid beetles, edge effects, forest fragmentation, urban forests,
urbanization

3
INTRODUCTION
Today, more than half of the world's human inhabitants live in cities, and this
proportion will increase further in the next 50 years (Grimm et al. 2008), making this an
‘urban century’ (Gaston 2010). Global urbanization accelerates the mass production and
consumption of natural resources (Millennium Ecosystem Assessment 2005; Bagliani et al.
2008), causing many types of land-use changes (Kareiva et al. 2007; Gaston 2010). Therefore,
understanding the causes, processes, and ecological consequences of land-use and land-cover
changes, including urbanization, is considered as a critical topic in landscape ecology (Wu
and Hobbs 2002), and clarifying the effects of urbanization on regional biodiversity is crucial
for future biodiversity conservation (Dearborn and Kark 2009). Among the large-scale
landscape changes that may profoundly influence community dynamics, habitat
fragmentation is considered to be one of the greatest threats to global biodiversity loss
(Fahrig 2003) and consequently attracts much attention in landscape ecology and
conservation biology (Tscharntke and Brandl 2004; Ewers and Didham 2006).
In fragmented landscapes, patch area and shape complexity are important factors
determining species diversity within patches (Fahrig 2003; Fletcher et al. 2007; Yamaura et al.
2008). In particular, the positive relationship between patch area and species richness is one
of the most general laws in ecology (Lomolino 1990; Peay et al. 2007). Compared with small
patches, large patches are more likely to intercept potential colonists (‘target area effect’;
Lomolino 1990) and have lower extinction rates due to their greater population sizes (e.g.,
MacArthur and Wilson 1967; Russell et al. 2006). Moreover, large patches may have more
habitat heterogeneity and are more complex, consequently promoting an increase in the
number of species (e.g., Connor and McCoy 1979; Russell et al. 2006). Because patches with
complex shapes have much higher proportions of edge habitat relative to core habitat than
patches of the same size with simpler shapes (Laurance and Yensen 1991), the population
densities of core-dwelling species are likely to decrease in such patches due to edge effects
(Woodroffe et al. 1998; Ries et al. 2004; Yamaura et al. 2008).
Recently, the rates of species loss and population declines in small patches were
reported to accelerate as a result of synergistic effects between area loss and edge effects
(Ewers and Didham 2007; Ewers et al. 2007). Ewers et al. (2007) and Banks-Leite et al. (2010)
demonstrated that differences in species richness and community composition between edge
and core zones are distinct only in large patches; differences in small patches are obscured
because they have high perimeter/area ratios and their centers are consequently affected by
multiple edges (Malcolm 1994). Because all areas within small patches are subject to edge

4
effects, forest-dependent species would be expected to disappear. Ewers and Didham (2007)
also demonstrated that the effects of shape complexity on population density and size are
altered by patch size, indicating that area and edge effects interact. Because habitat
fragmentation and perimeter/area ratios simultaneously decrease as patch size increases
(Fahrig 2003; Ewers and Didham 2006; Laurance 2008), the interaction between patch area
and edge effects is considered to be universal in terrestrial landscapes and one of the most
important processes that degrade biodiversity (Fletcher et al. 2007).
From a conservation viewpoint, such an interaction suggests that the core zone is more
important for the diversity and the number of individuals of core-dwelling species than the
edge zone. Consequently, single large-circular reserves are most desirable (e.g. Diamond 1975).
However, especially in urban areas, preserving or restoring large reserve areas is often
difficult because of the high costs associated with their protection (Franklin 1993). Therefore,
urban planners and conservation agencies need to evaluate whether increasing the
circularization of patches can compensate for the inherent disadvantages of small urban
forests. Urban forests offer wildlife habitat and improve human health and well-being
(Gaston 2010), thus detecting interactions between patch area and shape and increasing
patch quality by circularizing small patches are crucial for habitat management and
restoration in fragmented landscapes (Ewers et al. 2007). If this interaction will degrade
biodiversity in small patches in urban areas, clarifying the mechanism of the interaction will
be crucial for conserving urban biodiversity in the future.
Here, we examined the relative importance of area and edge effects and their
interaction for carabid beetle assemblages in Tokyo, central Japan, a ‘hyper city’ or ‘megacity’ of
more than 20 million inhabitants (United Nations 2008). In western Tokyo, deciduous
forests were once maintained as part of the traditional agricultural system and were
widespread. However, since 1970, many of these deciduous forests have been entirely lost due
to one of the most drastic urbanizations in Japan, the ‘Tama Newtown Development’. The
remaining forest patches, which vary in size and shape, provide an excellent model system to
examine area and edge effects in an urban area (Appendix 1). In Japan, most carabid species
depend on forest environments for foraging, egg-laying, and hibernation (Sota 2002) and are
consequently sensitive to forest fragmentation (e.g., Rainio and Niemelä 2003; Fujita et al.
2008). In this study, we tested the prediction that edge effects would interact with patch
area such that the magnitude of edge-to-interior differences in species richness and the
number of individuals of carabid beetles would increase with patch size.

5
METHODS
Study area and sampling sites
The study site (approximately 150 km2) is located in the Tama area, southwestern
Tokyo, central Japan (Appendix 1). The western boundary of the study area was formed by a
mountain range dominated by Mount Takao (599 m a.s.l.). The forest patches were
dominated by deciduous forests of two oak species, Quercus serrata and Q. acutissima, with Pinus
densiflora, Abies firma, and the evergreen oaks Q. glauca and Q. acuta also present. In this region,
such deciduous forests were mostly maintained as part of the traditional agricultural system.
Past aerial photographs show that such deciduous forests were once widespread in the study
area until 1970. However, approximately from 1970 to 1980, many of these deciduous forests
have been lost and fragmented rapidly due to the Tama New Town Development. These data
suggest that the origin of forest patches in this region is the same, and they have relatively
similar fragmentation history. Now, the remaining forest patches are small and isolated
within a matrix of mainly residential areas, traffic roads, and office buildings. A total of 26
forest patches that ranged in area from 1.1 to 121.6 ha were selected for this study. We
classified the patches into three size categories: small (1–5 ha, n = 9), medium (5.1–10 ha, n = 8),
and large (>10.1 ha, n = 9) (Appendix 1). We defined the forest edge zone as a strip 20-m wide
extending from the border of each patch into the forest and the forest interior zone as the
remaining core area, because it is reported that woody plant species composition changes
drastically in the border of 15 – 30-m from the forest edge in Japanese lowland forests
(Iwasaki and Ishii 2005). Therefore, in this study, we sampled two habitat types (i.e. edge
and interior habitat) from sites of three different sizes: large-interior (LI), large-edge (LE),
medium-interior (MI), medium-edge (ME), small-interior (SI), and small-edge (SE) sites
(Appendix 1).
Other authors have stressed the strong influence of other patch factors such as shape
complexity (Laurence 1991) and connectivity (Vos and Stumpel 1995) on the number of
species in fragmented landscapes. For carabids, 3- dimensional patch factors (e.g. orientation
and slope) are also considered as important drivers determining the species distribution
(Sota 2002). Therefore, we measured the shape index (Laurence and Yensen 1991) and
connectivity (i.e. isolation index) (Hanski 1994) and average slope and orientation of each
forest patch using ArcGIS (ESRI, Redlands, CA) and a 10-m solution digital elevation model.
However, in this study, all these geographic factors had no significant effects on both species
richness and the number of individuals (Soga unpublished data), so we removed these five
factors from later analysis. Our main purpose is whether strength of edge effect on carabid

6
beetle assemblages can be explained by only patch size (Ewers et al. 2007).
Carabid beetles sampling
We sampled carabid beetles using pitfall traps. In each patch, trapping was conducted
in early summer (May–June) and autumn (September) of 2010. In both sampling seasons, we
placed 40 pitfall traps within each patch, with 20 traps in the interior zone and 20 traps in
the edge zone. The traps were 10 cm in diameter and 12 cm in depth and contained
approximately 100 mL of propylene glycol as a preservative (Lemieux and Lindgren 1999).
Traps were collected after two days. Individuals caught in each trap during the trapping
period were dried, mounted, and identified to species, and data were pooled (i.e. mixing
summer and autumn samples) for analyses. In this study, we classified all 23 carabid beetle
species that were observed in the field surveys as either ‘forest species’ or ‘non-forest species’
based on Lake Biwa Museum (2012) and unpublished field experiences of the first author (M.
Soga). Species that use woods or forests as their main habitat were classified as ‘forest
species’. On the other hand, species that usually inhabit openlands or grasslands and do not
need woody conditions were classified as non-forest species. In general, forest species are
more sensitive to habitat fragmentation (e.g. Bender and Fahrig 2005; Devictor et al. 2008).
Therefore, we excluded non-forest species (6 species and 6 individuals) and used only forest
species (17 species and 1497 individuals) in latter analyses.
Statistical analysis
Patch edge versus interior
We sampled carabid beetles in two habitat type from sites of three different sizes (i.e.,
LI, LE, MI, ME, SI, and SE sites). To estimate the strength of edge effects on carabid
assemblages in each patch, we calculated the differences in species richness and number of
individuals between the edge and interior zones (i.e. species richness and individuals of
interior zone minus species richness of edge zone). Then, we related these differences to log-
transformed patch area using correlation coefficients and simple regression models.
Interaction between area and edge effects
Second, we examined the effect of distance to the forest border on carabid species
richness and number of individuals. To examine the interactions between area and edge
effects, we used generalized linear models (GLMs) with a Poisson distribution and a log-link
function. The number of carabid species and the number of individuals in each sampling area
7
was used as a response variable, and patch area, distance to edge (in meters), and their
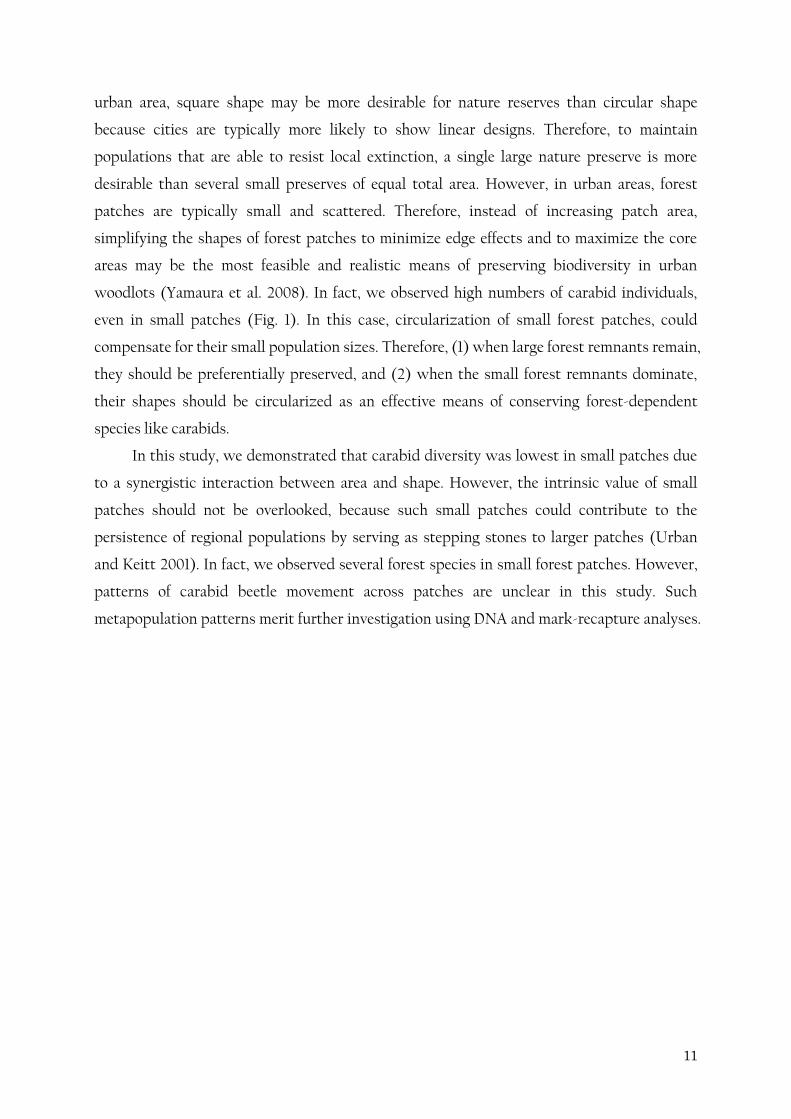
interaction (area effect × edge effect) were used as explanatory variables. To select the best of
the five possible combination models (i.e. full model, null model, model containing only patch
area, model containing only distance to edge and model containing both patch area and
distance to edge, see also Table 1), we used the small-sample corrected version of Akaike's
Information Criterion (AICc, Burnham and Anderson 2002). The AICc for each model
quantifies its parsimony (based on the trade-off between the model fit and the number of
parameters) relative to other models considered. All of the models were ranked by ΔAICc
(ΔAICci=AICci – AICcmin; where AICci and AICcmin represented the ith model and the best model
in the model subset, respectively), such that the model with the minimum AICc had a value of
0. Models for which ΔAICc ≤ 2 were considered to have substantial support (Burnham &
Anderson 2002). The plausibility of each model was quantified by its relative likelihood,
which was proportional to the exponent of −0.5×ΔAICc given our data. For each candidate
model, we divided this likelihood by sum of the all models, and compiled the Akaike weights
(wi). We conducted these analyses using the ‘dredge’ function in the ‘MuMIn’ package (ver. 1.
0. 0) (Barton 2009). All analyses were conducted using R software package (R Development
Core Team 2003).

8
RESULTS
Patch edge versus interior
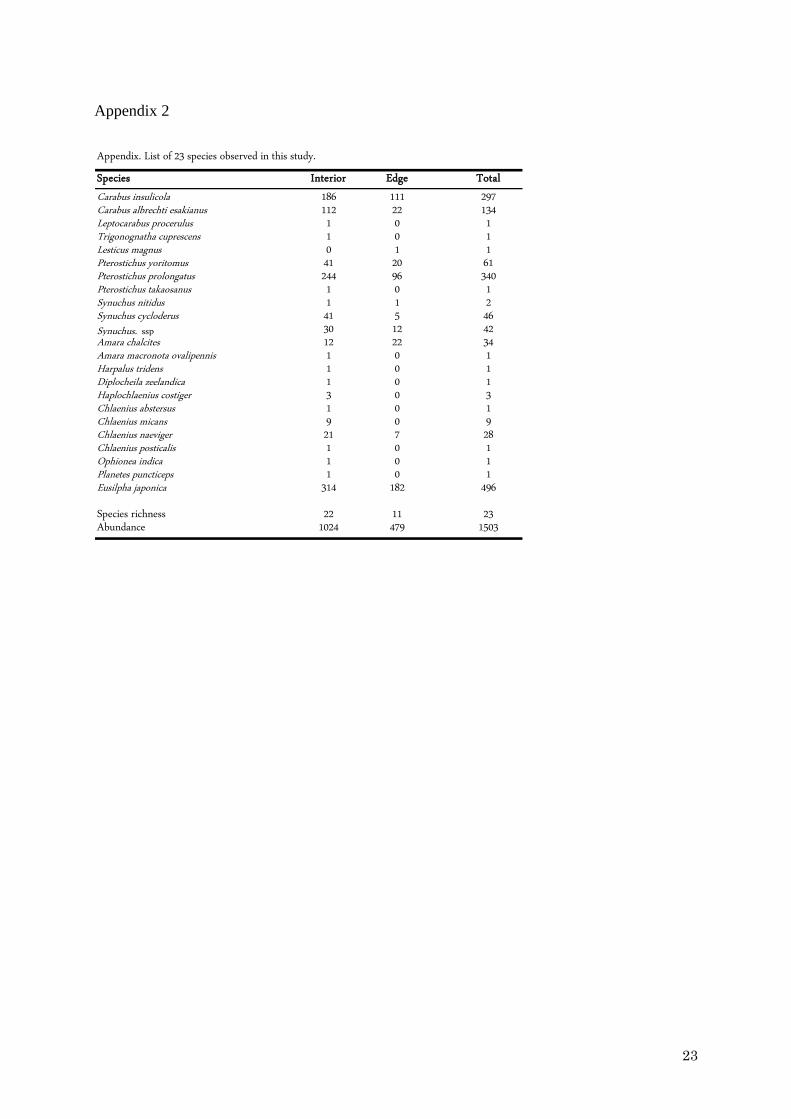
We recorded a total of 1,503 individuals belonging to 23 species in the 26 patches
(Appendix 2). The samples were numerically dominated by Eusilpha japonica (496 individuals),
Pterostichus prolongatus (340), Carabus insulicola (297), and Carabus albrechti esakianus (134). In
total, we captured 22 (95.6 %) species in the interior zones and 11 (47.8 %) in the edge zones.
Thirteen species were captured exclusively in interior zones, while only Lesticus magnus was
captured exclusively in edge zones (1 individual). We found a significant decrease in the
richness and the number of individuals of carabid species in edge zones (Mann-Whitney test,
n = 26, U = 184.5, p < 0.01).
Interaction between area and edge effects
The strength of edge effects on species richness and the number of individuals was
dependent on patch size: the edge-to-interior differences in species richness and the number
of individuals were larger in large patches than in small patches (Fig. 2). The differences in
species richness and the number of individuals between edge and interior zones were
positively correlated to patch area (species richness: r = 0.60, p = 0.001; the number of
individuals: r = 0.43, p = 0.03) (Fig. 2). By excluding one potential outlier in the number of
individuals analysis (Fig. 2), a strong positive correlation was found (r = 0.62, p < 0.001).
Model selection based on AICc showed that full models (containing all three
explanatory variables) were best supported for the number of individuals analyses (Tables 1,
2), suggesting that patch area and edge effect interacted. The full models (Tables 1, 2)
predicted that interior zones in large patches had the highest number of individuals (Fig. 3).
However, the interaction between patch area and edge effects was weak and model
containing distance to edge was best supported in the species-richness analysis (Tables 1, 2).

9
DISCUSSION
Relative importance of edge and core zones in urban remnant forests
In this study, we captured 22 (1024 individuals) of 23 total carabid species in the
interior zone, but only 11 species (479 individuals) in the edge zone (Appendix 2). These
results indicate that the forest interior zone provided many carabid species with habitat
indispensable to their persistence in our study area. In general, core areas are more stable,
both abiotically and biotically (e.g., Murcia 1995); core areas within patches have been
considered to be important determinants for forest-dependent species richness or the
number of individuals (e.g., Ewers and Didham 2007; Yamaura et al. 2008).
In contrast to our results, in forest-grassland transects, carabid species richness in edge
areas was typically highest, because edge areas harbored both forest-dependent and
grassland (i.e. non-forest) species (Báldi and Kisbenedek 1994; Magura et al. 2001; Magura
2002). Also, in woodland-arable field transects, Bedford and Usher (1994) examined the
distribution of carabids and reported that open habitats and forest edges had elevated species
richness. Unlike these previous studies, however, we did not obtain high richness or the
number of individuals of carabid species at the forest edges. One important difference
between these previous studies and ours was that the matrix environments surrounding our
patches were completely urbanized, whereas those in previous studies were mostly
grasslands. Urbanization has substantial negative effects on carabids via high ground
temperatures and low humidity (Magura et al. 2008). Traffic roads are also thought to have
negative effects on the ability of carabids to migrate between patches (Koivula and
Vermeulen 2005). Therefore, almost no species, including open-land species, would survive
outside the remnant forest patches in our urbanized study area; consequently, species
richness and the number of individuals of were both low in the edge zones. Although almost
all grasslands in the matrix have been lost due to urbanization in this region, several small
grasslands or openlands were left in forest patches. Therefore, in this study, 5 non-forest
carabid beetle species would be found in interior zones.
Patch area as the driver of edge effect strength
In this study, large interior (LI) sites had the highest species richness and number of
individuals, whereas those of other sites (i.e. LE, MI, ME, SI and SE) were low (Fig. 1).
Consequently, the edge-to-interior differences in species richness and the number of
individuals were especially clear in large patches, whereas those in small patches were not
evident (Fig. 2). In this study, we found a five-fold increase in the strength of edge effects (i.e.
10
edge-to-interior differences in the number of individuals) when patch size increased by a
factor of ten (e.g., a comparison between 100.5 ha and 101.5 ha) (Fig. 2). GLM analyses also
supported that large interior sites had the highest number of individuals, whereas those of
small patches were low even in the interior patches (Fig. 3). These results indicate that patch
area not only had direct effects on carabid assemblages, but also indirect effects through edge
effects (Ewers et al. 2007): i.e. there is an interaction between area and edge effects.
There are two main concepts of interactive effect between area and edge effects. First,
Malcolm (1994) suggested that the total strength of the edge effect within patches is the sum
of the edge effects from multiple edges (i.e., the ‘additive model’). Second, Ewers et al. (2007)
demonstrated that there is a synergistic interaction between area and edge effects and that
the strength of the edge effect increases exponentially with decreasing patch size (i.e.,
‘synergistic model’). In either case, the models based on our results indicated that species losses
and population declines associated with urbanization would be accelerated by both area and
edge effects. Another reason why edge-to-interior differences were not evident in small
patches may be that interior zones were not left in such small patches (i.e. small patches are
composed of only edge zones).
Conservation and management implications for urban fragmented forests
Interactions between area and edge effects revealed by this study have particular
relevance for the conservation and management of urban remnant forests. Based on our
results, large interior habitats are most valuable for conserving diversity and populations of
carabid species. In this study, we define the edge zone as a 20-m wide swath along the border
of the forest patch following to Iwasaki and Ishii (2005). Theoretically, in this case, if a 1 ha
circle were maintained, the edge area would not exceed the core area. This fact optimistically
suggests that the maintenance of the forest interior is comparatively easy. However, in our
study area, the edge area exceeded the core area even in 6 ha patches (Soga unpublished data)
because patches in actual landscapes are not circular. Core area is rapidly lost as patch shape
becomes increasingly irregular (Laurance and Yensen 1991). Furthermore, edge penetration
distance depends on the abiotic environments (e.g. Magura 2002), so we might
underestimate such distances in this study. From these reasons, species diversity in urban
landscape, where most patches have complex shapes, may be more seriously impacted than
formerly thought (Ewers and Didham 2008).
Based on these facts, the most effective strategy to conserve carabids in urbanized areas
would be to establish large forest remnants with compact shapes (i.e. more circular shape). In
11
urban area, square shape may be more desirable for nature reserves than circular shape
because cities are typically more likely to show linear designs. Therefore, to maintain
populations that are able to resist local extinction, a single large nature preserve is more
desirable than several small preserves of equal total area. However, in urban areas, forest
patches are typically small and scattered. Therefore, instead of increasing patch area,
simplifying the shapes of forest patches to minimize edge effects and to maximize the core
areas may be the most feasible and realistic means of preserving biodiversity in urban
woodlots (Yamaura et al. 2008). In fact, we observed high numbers of carabid individuals,
even in small patches (Fig. 1). In this case, circularization of small forest patches, could
compensate for their small population sizes. Therefore, (1) when large forest remnants remain,
they should be preferentially preserved, and (2) when the small forest remnants dominate,
their shapes should be circularized as an effective means of conserving forest-dependent
species like carabids.
In this study, we demonstrated that carabid diversity was lowest in small patches due
to a synergistic interaction between area and shape. However, the intrinsic value of small
patches should not be overlooked, because such small patches could contribute to the
persistence of regional populations by serving as stepping stones to larger patches (Urban
and Keitt 2001). In fact, we observed several forest species in small forest patches. However,
patterns of carabid beetle movement across patches are unclear in this study. Such
metapopulation patterns merit further investigation using DNA and mark-recapture analyses.

12
REFERENCES
Bagliani M, Galli A, Niccolucci V, Marchettini N (2008) Ecological footprint analysis applied
to a sub-national area: The case of the Province of Siena (Italy). J Environ Manag 86:
354-364
Báldi A, Kisbenedek T (1994) Comparative analysis of edge effect on bird and beetle
communities. Acta Zoologica 40: 1-14
Banks-Leite C, Ewers RM, Metzger JP (2010) Edge effects as the principal cause of area
effects on birds in fragmented secondary forest. Oikos 119: 918-926
Barton K (2009) MuMIn: multi-model inference. R package version 1. 0. 0.
Bedford S, Usher M (1994) Distribution of arthropod species across the margins of farm
woodlands. Agri Ecosyst Environ 48: 295-305
Bender DJ, Fahrig L (2005) Matrix structure obscures the relationship between interpatch
movement and patch size and isolation. Ecology 86: 1023–1033
Burnham KP, Anderson DR (2002) Model selection and inference: a practical information-
theoretic approach. Springer, New York
Connor EF, McCoy ED (1979) The statistics and biology of the species-area relationship.
Amer Nat 113: 791-833
Dearborn DC, Kark S (2009) Motivations for conserving urban biodiversity. Conserv Biol 24:
432-440
Devictor V, Julliard R, Jiguet F (2008) Distribution of specialist and generalist species along
spatial gradients of habitat disturbance and fragmentation. Oikos 117: 507-514.
Diamond JM (1975) The island dilemma: lessons of modern biogeographic studies for the
design of natural reserves. Biol Conserv 7: 129-146
ESRI. Inc., ArcView GIS ver. 3.2, ESRI Inc, Redlands, USA. (1999)
Ewers RM, Didham RK (2006) Confounding factors in the detection of species responses to
habitat fragmentation. Biol Rev 81: 117-142
Ewers RM, Didham RK (2007) The effect of fragment shape and species' sensitivity to
habitat edges on animal population size. Conserv Biol 21: 926-936
Ewers RM, Didham RK (2008) Pervasive impact of large-scale edge effects on a beetle
community. Proc Nat Acad Sci USA 105: 5426-5429
Ewers RM, Thorpe S, Didham RK (2007) Synergistic interactions between edge and area
effects in a heavily fragmented landscape. Ecology 88: 96-106
Fahrig L (2003) Effects of habitat fragmentation on biodiversity. Annu Rev Ecol Evol Syst 34:
487-515

13
Fletcher RJ, Ries L, Battin J, Chalfoun AD (2007) The role of habitat area and edge in
fragmented landscapes: definitively distinct or inevitably intertwined? Can J Zool 85:
1017-1030
Franklin JF (1993) Preserving biodiversity - species, ecosystems, or landscapes. Ecol Appl 3:
202-205
Fujita A, Maeto K, Kagawa Y, Ito N (2008) Effects of forest fragmentation on species richness
and composition of ground beetles (Coleoptera: Carabidae and Brachinidae) in urban
landscapes. Entomol Sci 11: 39-48
Gabriel D, Roschewitz I, Tscharntke T, Thies C (2006) Beta diversity at different spatial
scales: plant communities in organic and conventional agriculture. Ecol Appl 16: 2011-
2021
Gauston KJ (2010) Urban ecology. Cambridge University Press, Cambridge
Grimm NB, Faeth SH, Golubiewski NE, Redman CL, Wu JG, Bai XM, Briggs JM (2008)
Global change and the ecology of cities. Science 319: 756-760
Haila Y (2002) A conceptual genealogy of fragmentation research: From island biogeography
to landscape ecology. Ecol Appl 12: 321-334
Iwasaki A and Ishii H (2005) Vegetation structure of fragmented shrine/ temple forests in
Southeastern Hyogo Prefecture –estimation of edge-effect distance and minimum
conservation area–. Hum Nat 15: 29-41
Kareiva P, Watts S, McDonald R, Boucher T (2007) Domesticated nature: shaping landscapes
and ecosystems for human welfare. Science 316: 1866-1869
Koivula MJ, Vermeulen HJW (2005) Highways and forest fragmentation - effects on carabid
beetles (Coleoptera, Carabidae). Landscape Ecol 20: 911-926
Kurosawa R, Askins RA (2003) Effects of habitat fragmentation on birds in deciduous forests
in Japan. Conserv Biol 17: 695-707
Lake Biwa Museum (2012)
http://www.lbm.go.jp/emuseum/zukan/gomimushi/kamei_list.html. Accessed Mar. 22,
2012.
Laurance WF (1991) Edge effects in tropical forest fragments: application of a model for the
design of nature reserves. Biol Conserv 57: 205–219
Laurance WF (2008) Theory meets reality: how habitat fragmentation research has
transcended island biogeographic theory. Biol Conserv 141: 1731-1744
Laurance WF, Yensen E (1991) Predicting the impacts of edge effects in fragmented habitats.
Biol Conserv 55: 77-92

14
Lemieux J, Lindgren BS (1999) A pitfall trap for large-scale trapping of Carabidae:
Comparison against conventional design, using two different preservatives.
Pedobiologia 43: 245-253
Lomolino MV (1990) The target area hypothesis – the influence of island area on immigration
rates of non-volant mammals. Oikos 57: 297-300
MacArthur RH, Wilson EO (1967) The theory of island biogeography. Princeton University
Press, Princeton, New Jersey
Magura T, Tothmeresz B, Molnar T (2001) Forest edge and diversity: carabids along forest-
grassland transects. Biodivers Conserv 10: 287-300
Magura T (2002) Carabids and forest edge: spatial pattern and edge effect. For Ecol Manag
157: 23-37
Magura T, Tothmeresz B, Molnar T (2008) A species-level comparison of occurrence patterns
in carabids along an urbanisation gradient. Landscape Urban Plann 86: 134-140
Malcolm JR (1994) Edge effects in central Amazonian forest fragments. Ecology 75: 2438-
2445
Millennium Ecosystem Assessment (2005) Washington, DC, USA.
Murcia C (1995) Edge effects in fragmented forests: implications for conservation. Trends
Ecol Evol 10: 58-62
Peay KG, Bruns TD, Kennedy PG, Bergemann SE, Garbelotto M (2007) A strong species-area
relationship for eukaryotic soil microbes: island size matters for ectomycorrhizal
fungi. Ecol Lett 10: 470-480
Rainio J, Niemelä J (2003) Ground beetles (Coleoptera: Carabidae) as bioindicators.
Biodivers Conserv 12: 487-506
R Development Core Team (2003) R: a language and environment for statistical computing.
R Foundation for Statistical Computing, Vienna, http://www.R-project.org.
Ries L, Fletcher RJ, Battin J, Sisk TD (2004) Ecological responses to habitat edges:
Mechanisms, models, and variability explained. Annu Rev Ecol Evol Syst 35: 491-522
Russell GJ, Diamond JM, Reed TM, Pimm SL (2006) Breeding birds on small islands: island
biogeography or optimal foraging? J Anim Ecol 75: 324-339
Sota T (2002) The Four Seasons of Carabid Beetles: The Evolution of Life History and the
Species Diversity. Ecological Library 8. Kyoto University Press, Kyoto.
Tscharntke T, Brandl R (2004) Plant-insect interactions in fragmented landscapes. Annu Rev
Entomol 49: 405-430
United Nations (2008) World Urbanization Prospects. The 2007 Revision. New York:

15
United Nations
Urban D, Keitt T (2001) Landscape connectivity: a graph-theoretic perspective. Ecology 82:
1205-1218
Woodroffe R, Ginsberg JR (1998) Edge effects and the extinction of populations inside
protected areas. Science 280: 2126-2128
Wu JG, Hobbs R (2002) Key issues and research priorities in landscape ecology: An
idiosyncratic synthesis. Landscape Ecol 17: 355-365
Yamaura Y, Kawahara T, Iida S, Ozaki K (2008) Relative importance of the area and shape of
patches to the diversity of multiple taxa. Conserv Biol 22: 1513-1522
Vos CC, Stumpel HP (1995) Comparison of habitat isolation parameters in relation to
fragmented distribution patterns in the tree frog (Hylea arborea). Landscape Ecol 11:
203–214

16
FIGURE LEGENDS
Fig. 1
Carabid beetle species richness (left) and the number of individuals (right) in two habitat
types from sites of three difference sizes (Appendix. 1). The horizontal bar in the boxplot
indicates the median, the ends of the boxes indicate the interquartile range, and the whiskers
indicate the 10th and 90th quantiles.
Fig. 2
Relationships between patch area and edge to the difference in species richness (left) and the
number of individuals (right) between interior and edge habitats (i.e. species richness and
individuals of interior zone minus species richness of edge zone). Lines indicate the fitted
regression models. On the right, the white circle was a potential outlier that was not used to
calculate the regression.
Fig. 3
Relationships between patch area and distance to forest edge and the number of individuals
(right). Contour lines show carabid species richness predicted by the best model (full model)
in Table 1.
SUPPLEMENTARY INFORMATION
Appendix 1
Map of forest cover in 2010 (gray) and 26 sampling patches (black) in the Tama Newtown
Development, Tokyo, Japan, and depictions of two habitat types from sites of three different
sizes (SE, small-edge; SI, small-interior; ME-medium-edge; MI, medium-interior; LE, large-
edge; LI, large-interior).
Appendix 2
List of 23 carabid beetle species observed in this study.

17
Fig. 1
8
U2 80 Cちコてコ
CJ)
ω 'u 6
と 60てコ
。c
Q.. CJ)
、0伊・ 40 i4甲山 10-
白川市日目ω 4コe 20 中 コz
Z
。。SE SI ME MI LE LI SE SI ME MI LE LI

18
Fig. 2
• •
•
•
• -• ・.• •
102.0
。一一一,--
101.5 101.0
Patch area
100.5
、,.門U
広
onunu
=
くrp
//
|
」
一
一
」
jqノ-
n
u
n
u
n
u
n
u
n
U
6
4
2
2
6
26コ空〉一万三』O」①♀
EコC
』
oωocω」@』』一万
ωζト
• .・. • • •
.・• •
•
0-1・
• •
•
•• •
•
•
• •
•
r= 0.43 p = 0.03
•
6
4
2
ωωωC工O一」
ωω
一υω丘
ω
LFOωυcω』①』恥一万①工↑
• 0-
1020
•
101.5
.. 1010
Patch area
••
• 「
1005
•• •
-2 -

19
Fig. 3
OOF
。
20
Table 1
Table 1. Results of model selection based on Akaikes information criterion .
Rank Variable (s) K * Deviation AICc ⊿ AICc w i
Species richnessModel 1 Edge 2 -91.77 187.8 0.00 0.459Model 2 Area + Edge 3 -91.21 188.9 1.14 0.260Model 3 Area + Edge + Area×Edge 4 -90.15 189.2 1.38 0.230Model 4 Area 2 -94.40 193.0 5.26 0.033Model 5 null model 1 -96.04 194.2 6.38 0.019
Number of individualsModel 1 Area + Edge + Area×Edge 4 -442.47 893.8 0.00 0.969Model 2 Area + Edge 3 -447.10 900.7 6.90 0.031Model 3 Edge 2 -460.05 924.4 30.55 0.000Model 4 Area 2 -507.92 1020.1 126.27 0.000Model 5 null model 1 -545.51 1093.1 199.29 0.000
* Number of model parameters, ⊿ AICc : AICc differences, w: Akaike weights (wi).

21
Table 2
Table 2. Coefficients of best models (Model 1) in Table 1.
Coefficients Estimate SE z-value Pr(>|z|)
Species richness(intercept) 1.49 0.86 5.92 <0.0001Edge 0.01 0.004 3.00 0.003
Abundance(intercept) 2.77 0.13 20.99 <0.0001Area 0.03 0.11 0.31 0.76Edge 0.00 0.004 0.92 0.36Area×Edge 0.01 0.003 3.04 0.002

22
Appendix 1
~ (⑥ Small forests (n = 9) Medium forests (n = 8) Large forests (n = 9)
23
Appendix 2
Appendix. List of 23 species observed in this study.
Species Interior Edge Total
Carabus insulicola 186 111 297Carabus albrechti esakianus 112 22 134Leptocarabus procerulus 1 0 1Trigonognatha cuprescens 1 0 1Lesticus magnus 0 1 1Pterostichus yoritomus 41 20 61Pterostichus prolongatus 244 96 340Pterostichus takaosanus 1 0 1Synuchus nitidus 1 1 2Synuchus cycloderus 41 5 46Synuchus. ssp 30 12 42Amara chalcites 12 22 34Amara macronota ovalipennis 1 0 1Harpalus tridens 1 0 1Diplocheila zeelandica 1 0 1Haplochlaenius costiger 3 0 3Chlaenius abstersus 1 0 1Chlaenius micans 9 0 9Chlaenius naeviger 21 7 28Chlaenius posticalis 1 0 1Ophionea indica 1 0 1Planetes puncticeps 1 0 1Eusilpha japonica 314 182 496
Species richness 22 11 23Abundance 1024 479 1503


![Patch list - Roland Corporationcdn.roland.com/assets/media/pdf/JUNO-D_PA.pdf · Patch list [1] PIANO [2] KBD & ORG No. Name Cate-gory Patch Select GM2 Patch Select Voice Key Mode](https://img.pdfslide.tips/doc/110x75/5b379aa27f8b9a310e8c746d/patch-list-roland-patch-list-1-piano-2-kbd-org-no-name-cate-gory-patch.jpg)