Embed Size (px)
Citation preview

1
Hong Kong Exchanges and Clearing Limited and The Stock Exchange of Hong Kong Limited take no responsibility for the contents of this announcement, make no representation as to its accuracy or completeness and expressly disclaim any liability whatsoever for any loss howsoever arising from or in reliance upon the whole or any part of the contents of this announcement.
PAX Global Technology Limited百富環球科技有限公司 *(Incorporated in Bermuda with limited liability)
(Stock Code: 327)
RESULTS ANNOUNCEMENTFOR THE YEAR ENDED 31 DECEMBER 2017
FINANCIAL HIGHLIGHTS
2017 2016HK$’000 HK$’000 +/(-)
RESULTS
Revenue 3,591,080 2,914,842 +23.2%Gross profit 1,457,593 1,261,994 +15.5%Operating Profit 428,023 689,093 -37.9%Profit before income tax 424,540 678,299 -37.4%Profit for the year 336,566 603,434 -44.2%Profit attributable to the owners of
the Company 407,507 600,908 -32.2%
Profit for the year (excluding the impairment of assets) 513,037 603,434 -15.0%
Profit attributable to the owners of the Company (excluding the impairment of assets) 548,954 600,908 -8.6%
2017 2016 +/(-)HK$ HK$
Earnings per share– Basic 0.367 0.539 -31.9%– Diluted 0.367 0.535 -31.4%
Proposed final dividend per ordinary share 0.04 0.04 –
2017 2016HK$’000 HK$’000 +/(-)
KEY BALANCE SHEET ITEMS
Total current assets 4,839,173 4,220,419 +14.7%Total assets 5,232,216 4,433,063 +18.0%Net current assets 3,521,846 3,295,002 +6.9%Total equity 3,897,066 3,501,283 +11.3%
* For identification purpose only

2
The board of directors (the “Board”) of PAX Global Technology Limited (the “Company”
or “PAX”) is pleased to announce the audited consolidated results of the Company and
its subsidiaries (collectively, the “Group”) for the year ended 31 December 2017, with
comparative figures for the year ended 31 December 2016.
MANAGEMENT DISCUSSION AND ANALYSIS
OVERVIEW
The Group is an innovative global electronic payment point-of-sale terminals (“E-payment
Terminals”) solutions provider, engaging in the development and sales of E-payment
Terminals products and the provision of payment solutions services and maintenance and
installation services (collectively “E-payment Terminals solutions business”).
PAX is renowned in the international payment industry for its superior research and
development (“R&D”) capabilities, cutting edge production facilities and dedicated technical
support, offering best-in-class product quality and innovative product portfolio. Attributing
to a huge customer base spreading across 100 countries, an extensive sales network of local
offices, channel partners and payment system integrators, PAX has established a strong global
presence and achieved a leadership position.
Since 2010, the Group’s shipments of global E-payment Terminals have increased by at least
10% year-on-year. During this period, overseas sales grew rapidly which contributed 72% of
the Group’s total revenue in 2017, as compared to 22% in 2010.
The Group is confident and well-positioned to continue on leveraging our strong international
brand reputation, capturing ongoing growth opportunities arising from industry consolidation,
further expanding our global market share in the payment terminal market and strengthening
our payment solution technology and software services.
MARKET ANALYSIS AND INDUSTRY TRENDS
(i) Overseas Markets
In recent years, the rise of cashless societies has become a growing trend worldwide,
and non-cash payment becomes the main payment method for most overseas markets.
The demand for E-payment Terminals solutions will continue to flourish, owing to
strong promotion of cashless transactions by the governments, especially the number
of E-payment Terminals installed in emerging markets has grown substantially (for
example, India: from about 1.8 million units in 2016 to about 3 million units in 2017).

3
Over the years, PAX has steadily expanded its overseas sales network of channel
partners to around 90 reputable payment system integrators in over 100 countries
worldwide. PAX has also established subsidiaries in different regions and continues to
expand its footprint in the countries along the Silk Road Economic Belt such as Russia,
Germany and Italy, laying a solid foundation for the Group’s development by utilizing
the opportunities arising from global integration and the “Belt and Road” initiative.
Latin America and the Commonwealth of Independent States (“LACIS”)
In 2017, PAX continued to be the dominant leader in mobile payment terminals
(“mPOS”) market in Brazil. Since the successful launch of traditional payment terminals
in 2016, the shipment volume grew rapidly which contributed a substantial sales growth
in LACIS region, leading PAX to become one of the major terminals providers in the
region.
Sales in other parts of the Latin American region grew rapidly. Demand for PAX
payment solutions continues to rise in Argentina driven by the government launched
cashless payment initiatives. In Russia, PAX’s high quality products have been well
recognised by major acquiring banks. Strong demand of payment terminal is expected to
be driven by the preparation of the forthcoming 2018 World Cup.
Europe, Middle East and Africa (“EMEA”)
PAX continues to achieve solid results in the EMEA region, where more acquiring
banks, payment service providers and retail groups have chosen to use PAX’s innovative
solutions. Two major trends in this region are the growing market demand for Android
based E-payment Terminals solutions and increasing popularity of mPOS. In Europe,
PAX achieved significant sales growth in Germany, Poland and Belgium. In other
European countries such as France, Spain and the Nordics region, our channel partners
are conducting certification procedures for PAX solutions. PAX’s market share in the
Middle East region grew further, attributing to transition towards using PAX payment
solutions by the acquiring banks in the Gulf Cooperation Council (GCC) region. In
Africa, the Group has commenced market development in the West Africa, where
E-payment Terminals solutions are comparatively under-developed.

4
Asia Pacific Region (Except for Mainland China) (“APAC”)
In most of the Asia Pacific region, PAX continues to be a leading market player. At
the same time, PAX has established subsidiaries in Japan and India in order to capture
opportunities arising from the ongoing preparation of the Tokyo Olympics, the Europay,
MasterCard and Visa (“EMV”) migration in Japan and the promotion of non-cash
society by the Indian government. In November 2017, PAX further penetrated into
Korea’s payment market by acquiring a Korean payment terminal company, Kwang Woo
Information & Communication Co. Ltd (“Kwang Woo”), so as to further realise the
globalisation objective of PAX. It is expected that these strategic layouts will drive sales
in the Asia Pacific region and inject momentum into the Group’s future revenue growth.
United States of America and Canada Region (“USCA”)
PAX made excellent progress in the United States of America (“US”) market. In
addition to working with several large new customers to expand their business, the new
generation of smart electronic cash register, the E-Series, was successfully launched at
the end of 2017 and was well received by the customers. According to the Nilson Report,
an industry report, card payments contributed approximately 60% of the total consumer
payment in the US in 2016, compared with approximately 50% in 2011, reflecting an
increase of card usage and card related payment products stickiness in the US market.
Since the establishment of Pax Technology Inc, a subsidiary of PAX, in the US in 2008,
PAX has been striving to develop integrated payment solutions, streamline merchants’
payment processing procedures and reduce their operating costs. PAX’s comprehensive
product line and reputation for high product quality continue to be well received by
North American merchants, where PAX plans to introduce more diversified payment
products with excellent and professional services, in order to gain more market shares.
(ii) China Market
The development of cashless payment in China is leading around the world. With
increasing economic growth, the E-payment Terminals market in China offers lots of
opportunities and challenges. According to the Central Bank of China, the number of
E-Payment Terminals installed across China has rapidly increased from approximately
23 million units in 2015 to around 31 million units in 2017. During the same time,
the average number of bank cards held by a Chinese citizen has increased from 3.99
to 4.84. With the support of strong and powerful payment data, the payment terminal
market presents tremendous opportunities in China. Due to various market factors,
PAX has not taken part in the first round of bidding exercise of a renowned bank in
People’s Republic of China (“PRC”) in 2018. While this will put further pressure on
the forthcoming gross margin of our China business, we will continue to devote more
resources to strengthening our core value of high product quality so as to capture future
opportunities.
5
With the aim of building a regulated “cashless society”, the Chinese government has
continued to implement payment related regulations and standards. In the middle
of 2017, the People’s Bank of China announced that starting from the end of June
2018, all online payment would be handled through Nets Union Clearing Corporation
(“NUCC”), a centralised non-bank payment online clearing platform. This initiative will
strengthen the financial supervision, reduce the risk of non-compliance and improve
the transparency of operations of the third-party payment operators. In December
2017, the People’s Bank of China launched “Barcode Payment Business Regulation
No. 296”, a security standard regulating the use of QR code payment and its security.
These regulations and industry standards will bring huge benefits to the entire payment
environment by enhancing the payment terminals security and related product quality
requirements. In response to the changes towards high-reaching quality and security of
future payment products, PAX is well-prepared to launch comprehensive products with
accordingly compelling quality, such as QR55 for QR code payment and other smart
terminals that fully support QR code and other payment modes to cope with the needs of
various merchants.
MANAGEMENT STRATEGY
Transaction security for consumers and merchants is critical to the payment industry. By
upholding the corporate culture of continuous innovation and the pursuit of excellence, PAX
continues carrying out R&D and providing secure and user-friendly payment solutions.
The Group is committed to ongoing R&D investments, introducing new products and
maintaining a product portfolio of solutions that satisfy market expectations, in order to
maintain its strong competitive advantage. In 2017, we increased our investment in R&D to
focus on the development of the payment products tailored for the Chinese market and the
certifications in international markets, while at the same time expanding our Android-based
solutions products and related application development team and after-sales technical support
staff.
In terms of software, during 2017, PAX successfully launched two new payment services
solutions, PAXPAY and PAXSTORE, to further enhance customer loyalty to the PAX brand:
• PAXPAY: An omni-channel payment gateway system supporting access between new
forms of mobile payment and multiple acquiring channels.
• PAXSTORE: An innovative open platform software-as-a-service solution providing
customers appstore marketplace functionalities combined with advanced terminal
management system features.

6
In terms of hardware, PAX will introduce its comprehensive smart E-payment Terminals
product line globally, in order to further penetrate into different markets and cater the
market demand for the new generation of payment terminals. In order to strengthen the
Group’s payment terminals distribution, new products will be launched in the market from
time to time, more resources will be spending on increasing sales channels and distributors.
Meanwhile, in view of the emergence of a wave of cross-segment business consolidation
activities in the payment industry in recent years, PAX will grasp these opportunities by
offering incentive to potential customers in order to gain further market shares in certain
overseas markets.
Merger & Acquisition Activities and Latest Developments
PAX has remained proactive in seeking quality assets and distinct merger and acquisition
(“M&A”) opportunities. As of the date of this announcement, the Group has completed
a number of M&A projects, including fund investment, minority stake investment and
subsidiary acquisitions in 2017 and 2018. Through M&A, the Group further improved the
business by enhancing and diversifying the payment related products and services of the
Group’s hardware and software divisions.
Expansion of the Group’s sales channel into new markets:
• The Group acquired 51% equity stake in a Korean company, Kwang Woo, for an
aggregate consideration of US$4.08 million in November 2017. Kwang Woo is
principally engaged in the development, manufacturing and sales of E-Payment
Terminals in Korea.
• The Group established subsidiaries in Japan and India in 2017 and 2018 respectively,
with an aim to strengthen local sales capacity and to prepare for future opportunities in
the local payment markets.
Expansion of diversified solutions and services:
• The Group acquired and subscribed for an aggregate of 60% equity stake in an Italian
company, CSC Italia S.r.l. (“CSC Italia”), for an aggregate consideration of EUR3.0
million in April 2017. CSC Italia is one of the Italy’s leading installation and service
support companies for E-payment Terminals, personal computers, cash handling
equipment and automatic teller machines.
• The Group subscribed for a 20% equity stake in a Swedish company, Onslip AB
(“Onslip”), for a consideration of EUR2.1 million in April 2017. Onslip is principally
engaged in the development and marketing of a software-as-a-service platform for
managing payments and other value-added applications, deployed on merchant point-of-
sale solutions globally.

7
• The Group subscribed for a 20% equity stake in a Shanghai company, Shanghai Coshine
Software Co., Ltd. (“Shanghai Coshine”), for a consideration of RMB17.0 million in
September 2017. Shanghai Coshine is an advanced system and services provider in
payment infrastructure, electronic business software solution and outsourcing operation.
Exploration of innovative technologies:
• In September 2017, the Group has invested in a fund based in Beijing, with the total
investment of RMB51.0 million for the year. The objective is to further strengthen
PAX’s competitive and technological edge in the rapidly changing fintech environment
in China. This fund mainly invests in numbers of outstanding emerging technology
projects and startups.
Enhancement of the Group’s operational efficiency:
• Keeping up with the growth of our business and human resources, the Group, through its
subsidiary, acquired the land use right of a land at Pinghu, Longgang District, Shenzhen,
Guangdong Province with a total planning construction area of more than 25,000 square
meters (the “Land”), for a term of 20 years for a consideration of RMB73 million,
pursuant to an agreement entered into with the Urban Planning, Land and Resources
Commission of Shenzhen Municipality (Longgang Authority) in 2017. The Land will be
principally used as the China headquarters of the Group.

8
FINANCIAL REVIEW
The key financial figures for the year ended 31 December 2017 are extracted as follows:
For the year ended 31 December2017 2016
HK$’000 HK$’000 +/(-)
Revenue 3,591,080 2,914,842 +23.2%
Gross profit 1,457,593 1,261,994 +15.5%
Other income 75,054 71,593 +4.8%
Selling expenses (426,432) (297,396) +43.4%
Administrative expenses (501,721) (347,098) +44.5%
Impairment of assets (one-off in 2017) (176,471) – N/A
Profit before income tax 424,540 678,299 -37.4%
Income tax expense (87,974) (74,865) +17.5%
Profit for the year 336,566 603,434 -44.2%
Profit attributable to the owners of
the Company 407,507 600,908 -32.2%
Research and development costs
(included in administrative expenses) (287,230) (183,614) +56.4%
As at 31 December2017 2016
HK$’000 HK$’000 +/(-)
Total current assets 4,839,173 4,220,419 +14.7%
Total non-current assets 393,043 212,644 +84.8%
Total assets 5,232,216 4,433,063 +18.0%
Total current liabilities 1,317,327 925,417 +42.3%
Total non-current liabilities 17,823 6,363 +180.1%
Total liabilities 1,335,150 931,780 +43.3%
Net current assets 3,521,846 3,295,002 +6.9%
Total equity 3,897,066 3,501,283 +11.3%

9
For the year ended 31 December2017 2016 +/(-)
PER SHARE (IN HK$)Earnings per share for the profit
attributable to the owners of the Company
– Basic 0.367 0.539 -31.9%
– Diluted 0.367 0.535 -31.4%
For the year ended 31 December2017 2016
FINANCIAL RATIOSGross profit margin 40.6% 43.3%
Net profit margin 9.4% 20.7%
Net profit margin (excluding the impairment of assets) 14.3% 20.7%
Revenue
Turnover increased by 23.2% or HK$676.3 million to HK$3,591.1 million for the year ended
31 December 2017 from HK$2,914.8 million for the year ended 31 December 2016. Turnover
from overseas markets grew by HK$945.8 million to HK$2,602.5 million, representing a
growth of 57.1%. Turnover from the China Market decreased by 21.4% year-on-year or
HK$269.6 million to HK$988.6 million.
i) Sales by Geographical Region
For the year ended 31 December2017 2016
HK$’000 HK$’000 +/(-)
Overseas markets
– LACIS 1,479,993 689,902 +114.5%
– EMEA 609,284 553,990 +10.0%
– APAC 258,477 236,092 +9.5%
– USCA 254,723 176,669 +44.2%
2,602,477 1,656,653 +57.1%
China Market 988,603 1,258,189 -21.4%
3,591,080 2,914,842 +23.2%
Overseas markets and China Market turnover classification is according to locality of customers.

10
Turnover generated from overseas markets increased by 57.1% to HK$2,602.5 million
for the year ended 31 December 2017 from HK$1,656.7 million for the year ended 31
December 2016. Turnover generated from overseas markets accounted for 72% of total
revenue for the year ended 31 December 2017, growing from 57% for the year ended 31
December 2016. All overseas business units recorded growth, especially the LACIS and
USCA region. Brazil, the US and Italy have become PAX’s key overseas markets. As of
the end of 2017, we had over 90 overseas distributors and partners worldwide.
Turnover generated from the China Market decreased by 21.4% to HK$988.6 million
for the year ended 31 December 2017, from HK$1,258.2 million for the year ended 31
December 2016. Turnover generated from the China Market accounted for 28% of total
revenue for the year ended 31 December 2017 compared with 43% for the year ended
31 December 2016. The decrease was mainly due to the influence of the product mix
shifting and the continuously keen price competition.
ii) Sales by Revenue Category
For the year ended 31 December2017 2016
HK$’000 HK$’000 +/(-)
E-payment Terminals products 3,429,679 2,757,632 +24.4%
Services:
Payment solutions services 95,612 125,101 -23.6%
Maintenance and installation services 65,789 32,109 +104.9%
3,591,080 2,914,842 +23.2%
E-payment Terminals products
E-payment Terminals products include smart E-payment Terminals, traditional E-payment
Terminals (comprising countertop and wireless E-payment Terminals, pin pad devices and
multilane E-payment Terminals), mobile E-payment Terminals and other accessory items.
Turnover from the sales of E-payment Terminals products increased by 24.4% to HK$3,429.7
million for the year ended 31 December 2017 from HK$2,757.6 million for the year ended
31 December 2016. The growth is attributed to the increase in sales in the overseas markets
during the year.

11
Services
i) Payment Solutions Services
Turnover from the provision of payment solutions services decreased by 23.6% to
HK$95.6 million for the year ended 31 December 2017 from HK$125.1 million for the
year ended 31 December 2016. Payment solutions services income was mainly generated
from the provision of value-added solutions services in the China Market.
ii) Maintenance and Installation Services
Turnover from the provision of maintenance and installation services increased by
104.9% to HK$65.8 million for the year ended 31 December 2017 as compared to
HK$32.1 million for the year ended 31 December 2016. Maintenance and installation
services income was mainly generated in Hong Kong and Italy.
Gross Profit Margin
Gross profit margin for the year ended 31 December 2017 was 40.6%, representing a decrease
in 270 basis points as compared to 43.3% for the year ended 31 December 2016. The decrease
was mainly due to the keen price competition in China Market and the incentives given to
long-term customers in overseas markets.
Other Income
Other income comprised primarily of value-added tax refund, interest income from time
deposit and subsidy income. It increased by 4.8% to HK$75.1 million for the year ended 31
December 2017 from HK$71.6 million for the year ended 31 December 2016. The increase
was mainly due to the increase of interest income.
Selling Expenses
Selling expenses increased by 43.4% to HK$426.4 million for the year ended 31 December
2017, from HK$297.4 million for the year ended 31 December 2016. The increase was mainly
due to the significant increase of sales and after-sales service staff headcounts.
Administrative Expenses
Administrative expenses increased by 44.5% to HK$501.7 million for the year ended 31
December 2017 from HK$347.1 million for the year ended 31 December 2016. The increase
was mainly due to the expansion of R&D centres and teams, and additional headcounts.

12
Impairment of Assets
The Group has recognised a one-off impairment of assets of HK$176.5 million in total during
the year, consisting of impairment of HK$159.0 million and HK$17.5 million respectively in
respect of the operation of Shanghai New Kashuo Information Technology Company Limited
(“Shanghai Kashuo”) and its subsidiaries (collectively, the “Kashuo Group”) and Suzhou
Ieasy Information Technology Co. (“Suzhou Ieasy”), non-wholly-owned subsidiaries of the
Company. Detail is set out in note 9 in this announcement.
Profit for the year and Profit Attributable to the Owners of the Company
As a result of the foregoing, profit for the year was HK$336.6 million, representing a decrease
of 44.2% compared to HK$603.4 million in 2016. Profit for the year excluding the one-off
impairment of assets was HK$513.0 million, decreased by 15.0% or HK$90.4 million, as
compared to last year.
In 2017, profit for the year attributable to the owners of the Company was HK$407.5 million,
representing a decrease of 32.2% as compared to HK$600.9 million in 2016. Profit for the
year attributable to the owners of the Company excluding the one-off impairment of assets
was HK$549.0 million, decreased by 8.6% or HK$51.9 million as compared to last year.
Liquidity and Financial Resources
During the years of 2016 and 2017, the main source of funding to the Group was the proceeds
generated from operating activities in the usual course of business of the Company. Certain
financial data are summarised as follows:
As at 31 December2017 2016
HK$’000 HK$’000
Cash and cash equivalents 2,165,224 2,207,205
Net current assets 3,521,846 3,295,002
Net cash generated from operating activities 214,470 249,507
Net cash used in financing activities (130,913) (91,376)
As at 31 December2017 2016
Current ratio (times) 3.7 4.6
Quick ratio (times) 3.0 3.9

13
As at 31 December 2017, the Group had cash and cash equivalents and short-term bank
deposits of HK$2,165.2 million (2016: HK$2,207.2 million) and borrowings of HK$14.4
million (2016: Nil). As at 31 December 2017, the Group reported net current assets of
HK$3,521.8 million, as compared with HK$3,295.0 million as at 31 December 2016. For the
year ended 31 December 2017, net cash generated from operating activities was HK$214.5
million, as compared with HK$249.5 million for the year ended 31 December 2016. For the
year ended 31 December 2017, net cash used in financing activities was HK$130.9 million as
compared with HK$91.4 million for the year ended 31 December 2016.
Capital Structure and Details of Charges
As at 31 December 2017, the Group had borrowings of HK$14.4 million (2016: Nil) and
banking facilities of approximately HK$18.0 million (2016: Nil). The borrowings were
used in the operation in Korea and denominated in Korean Won (“WON”). The borrowings
of HK$10.7 million were secured by the land and buildings of a Korean subsidiary of the
Company. As at 31 December 2017, approximately HK$1,202.7 million, HK$516.0 million,
HK$396.7 million, HK$42.3 million, HK$7.2 million and HK$0.3 million (2016: HK$1,356.5
million, HK$721.5 million, HK$103.3 million, HK$25.3 million, HK$0.6 million and nil)
of the Group’s cash balances were denominated in Renminbi (“RMB”), Hong Kong dollar
(“HK$”), United States dollar (“US$”), European dollar (“EUR”), WON and other currency
respectively.
Significant Investment
Save as disclosed in this announcement, the Group held no significant investment as at 31
December 2017 (2016: Nil).
Material Acquisition and Disposal of Subsidiaries
Save as disclosed in this announcement, the Group did not have any material acquisition or
disposal of subsidiaries during the year ended 31 December 2017 (2016: Nil).

14
Use of Proceeds
The net proceeds raised from the global offering received by the Company were
approximately HK$805.9 million.
As at 31 December 2017, the planned and utilised amounts of usage of total net proceeds are
as follows:
Planned amount
Utilised amount
HK$ million HK$ million
Enhancing research and development effort 322.4 322.4
Expanding distribution network 120.8 120.8
Potential merger and acquisition 282.1 282.1
General working capital 80.6 80.6
805.9 805.9
Future Plans for Material Investments or Capital Assets
Save as disclosed in this announcement, there was no specific plan for material investments or
capital assets as at 31 December 2017 (2016: Nil).
Exchange Rates Exposure
The Group derives its turnover, makes purchases and incurs expenses denominated mainly in
RMB, HK$ and US$. The majority of assets and liabilities are denominated in RMB, HK$
and US$ and there are no significant assets and liabilities denominated in other currencies.
Currently, the Group has not entered into agreements or purchased instruments to hedge the
Group’s exchange rate risks. Any material fluctuation in the exchange rates of HK$ or RMB
may have an impact on the operating results of the Group.
The management considers that the foreign exchange risk with respect to US$ is not
significant as HK$ is pegged to US$ and transactions denominated in US$ are mainly carried
out by entities with the same functional currency. The exchange rate of RMB to HK$ is
subject to the rules and regulations of foreign exchange control promulgated by the PRC
government. The Group manages foreign currency risk by closely monitoring the movement of
the foreign currency rates.
Contingent Liabilities
The Group had no significant contingent liabilities as at 31 December 2017 (2016: Nil).

15
Human Resources and Remuneration Policies
The total number of employees of the Group as at 31 December 2017 was 1,514. The
following table shows a breakdown of employees of the Group by functions as at 31
December 2017:
Management 14
Sales and after-sales services and marketing 484
Research and development 826
Quality assurance 42
Administration and human resources 44
Accounting 25
Production, procurement and inventory control 79
1,514
The Group ensures that its remuneration packages are comprehensive and competitive
from time to time. Employees are remunerated with a fixed monthly income plus annual
performance related bonuses. Share options are granted to employees to reward their
contributions under the share option scheme of the Company, details of which are set out in
the Company’s 2017 annual report. The Group also sponsors selected employees to attend
external training courses that suit the needs of the Group’s business.
Disclaimer:
Non-GAAP measures
Certain non-GAAP (generally accepted accounting principles) measures are used for assessing the Group’s
performance. These non-GAAP measures are not expressly permitted measures under GAAP in Hong Kong and
may not be comparable to similarly titled measures for other companies. Accordingly, such non-GAAP measures
should not be considered as an alternative to operating income as an indicator of the operating performance
of the Group or as an alternative to cash flows from operating activities as a measure of liquidity. The use of
non-GAAP measures is provided solely to enhance the overall understanding of the Group current financial
performance. Additionally because the Group has historically reported certain non-GAAP results to investors, the
Group considers the inclusion of non-GAAP measures provides consistency in our financial reporting.

16
CONSOLIDATED INCOME STATEMENT
Year ended 31 December2017 2016
Notes HK$’000 HK$’000
Revenue 3 3,591,080 2,914,842
Cost of sales 5 (2,133,487) (1,652,848)
Gross profit 1,457,593 1,261,994
Other income 3 75,054 71,593
Selling expenses 5 (426,432) (297,396)
Administrative expenses 5 (501,721) (347,098)
Impairment of assets 5 (176,471) –
Operating profit 428,023 689,093
Finance costs (3,801) (10,794)
Share of result of an investment accounted for
using the equity method 318 –
Profit before income tax 424,540 678,299
Income tax expense 6 (87,974) (74,865)
Profit for the year 336,566 603,434
Profit/(loss) attributable to:
Owners of the Company 407,507 600,908
Non-controlling interests (70,941) 2,526
336,566 603,434
HK$ per share
HK$
per share
Earnings per share for the profit attributable to the owners of the Company:
– Basic 7(a) 0.367 0.539
– Diluted 7(b) 0.367 0.535

17
CONSOLIDATED STATEMENT OF COMPREHENSIVE INCOME
Year ended 31 December2017 2016
HK$’000 HK$’000
Profit for the year 336,566 603,434
Other comprehensive income/(loss), net of tax
Items that may be subsequently reclassified to
profit or loss
Exchange differences arising on translation of
the financial statements of foreign subsidiaries 168,423 (126,208)
Change in value of available-for-sale
financial assets (6,145) –
Item that will not be subsequently reclassified to
profit or loss
Remeasurement of post-employment
benefit obligation (141) –
Total comprehensive income for the year, net of tax 498,703 477,226
Total comprehensive income/(loss) attributable to:
Owners of the Company 572,058 475,534
Non-controlling interests (73,355) 1,692
498,703 477,226

18
CONSOLIDATED BALANCE SHEET
As at 31 December 2017 2016
Notes HK$’000 HK$’000
ASSETS
Non-current assets
Property, plant and equipment 51,558 67,919
Land use rights 84,473 186
Intangible assets 9 90,259 89,392
Available-for-sale financial assets 74,517 –
Investment accounted for using the
equity method 20,720 –
Other non-current assets 10 52,785 38,353
Deferred income tax assets 18,731 16,794
Total non-current assets 393,043 212,644
Current assets
Inventories 918,452 596,539
Trade and bills receivables 10 1,703,414 1,347,446
Deposits and other receivables 10 39,593 68,919
Restricted cash 12,490 310
Cash and cash equivalents 2,165,224 2,207,205
Total current assets 4,839,173 4,220,419
Total assets 5,232,216 4,433,063
EQUITY
Equity attributable to the owners of the Company
Share capital 110,019 110,787
Reserves 3,812,757 3,354,748
3,922,776 3,465,535
Non-controlling interests (25,710) 35,748
Total equity 3,897,066 3,501,283
19
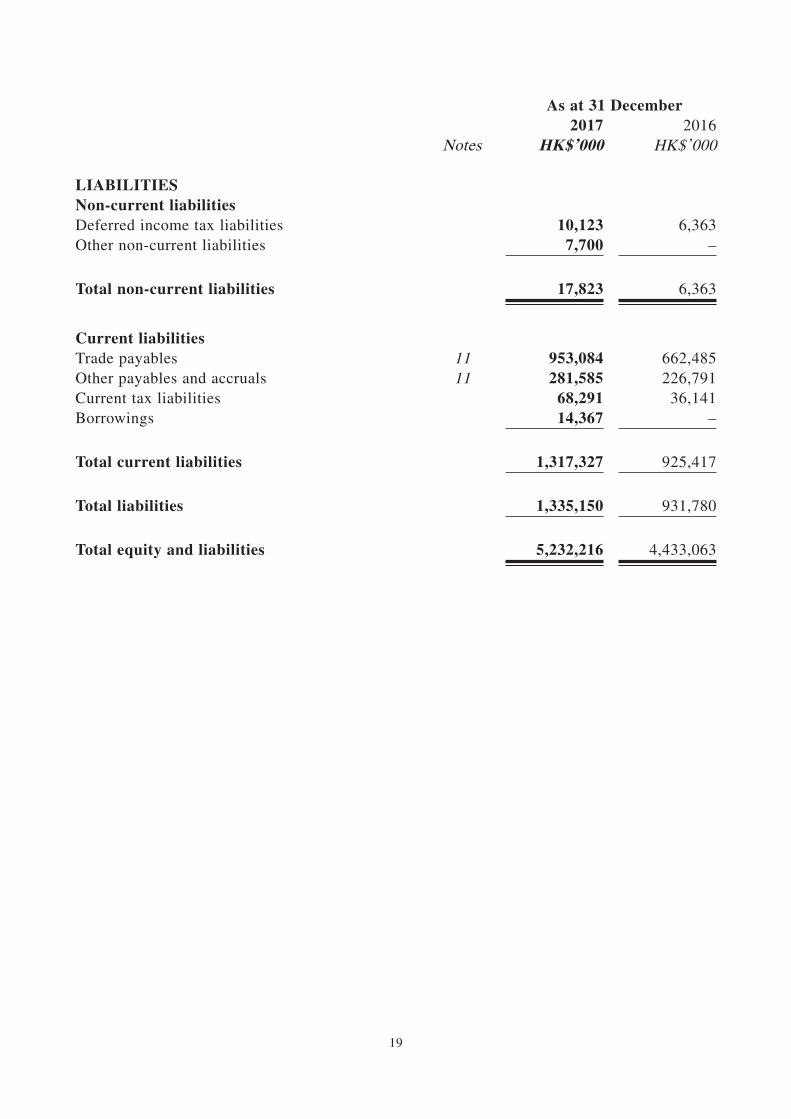
As at 31 December 2017 2016
Notes HK$’000 HK$’000
LIABILITIES
Non-current liabilities
Deferred income tax liabilities 10,123 6,363
Other non-current liabilities 7,700 –
Total non-current liabilities 17,823 6,363
Current liabilities
Trade payables 11 953,084 662,485
Other payables and accruals 11 281,585 226,791
Current tax liabilities 68,291 36,141
Borrowings 14,367 –
Total current liabilities 1,317,327 925,417
Total liabilities 1,335,150 931,780
Total equity and liabilities 5,232,216 4,433,063

20
NOTES TO THE CONSOLIDATED FINANCIAL STATEMENTS
1 GENERAL INFORMATION
PAX Global Technology Limited (the “Company”) is an investment holding company and together with
its subsidiaries (collectively referred to as the “Group”) are principally engaged in the development and
sales of electronic funds transfer point-of-sale (“E-payment Terminals”) products, provision of payment
solutions services and maintenance and installation services (collectively, the “E-payment Terminals
solutions business”).
The Company is a limited liability company incorporated in Bermuda. The address of its registered office
is Clarendon House, 2 Church Street, Hamilton HM 11, Bermuda.
The Company was listed on the Main Board of The Stock Exchange of Hong Kong Limited (the “Stock
Exchange”) on 20 December 2010.
These financial statements are presented in thousands of units of Hong Kong dollars (HK$’000), unless
otherwise stated.
2 SUMMARY OF SIGNIFICANT ACCOUNTING POLICIES
The principal accounting policies applied in the preparation of these consolidated financial statements are
set out below. These policies have been consistently applied to all the years presented, unless otherwise
stated.
2.1 Basis of preparation
The consolidated financial statements of the Company have been prepared in accordance with Hong
Kong Financial Reporting Standards (“HKFRSs”) and requirements of the Hong Kong Companies
Ordinance Cap. 622. The consolidated financial statements have been prepared under the historical
cost convention, except for the available-for-sale financial assets, contingent consideration payable
and post-employment benefit obligation which are measured at fair values.
The preparation of financial statements in conformity with HKFRSs requires the use of certain
critical accounting estimates. It also requires management to exercise its judgement in the process
of applying the Group’s accounting policies.

21
2.1.1 Changes in accounting policy and disclosures
(a) New and amended standards adopted by the Group
The following amendments to standards have been adopted by the Group for the first
time for the financial year beginning on or after 1 January 2017:
• Recognition of Deferred Tax Assets for Unrealised Loss – Amendments to
HKAS 12
• Annual improvements 2014-2016 cycle – Amendments to HKAS 12, and
• Disclosure Initiative – Amendments to HKAS 7
The adoption of these amendments did not have material impact on the financial
statements for the current year. The amendments to HKAS 7 require disclosure of
changes in liabilities arising from financing activities.
(b) New standards and interpretations not yet adopted
A number of new standards and amendments to standards and interpretations are
effective for annual periods beginning after 1 January 2017, and have not been applied
in preparing these consolidated financial statements. None of this is expected to have
a significant effect on the consolidated financial statements of the Group, except the
following set out below:
HKFRS 9, “Financial instruments”
HKFRS 9 addresses the classification, measurement and derecognition of financial
assets and financial liabilities, introduces new rules for hedge accounting and a new
impairment model for financial assets.
The Group has reviewed its financial assets and liabilities and is expecting the
following impact from the adoption of the new standard on 1 January 2018:
Equity instruments currently classified as available-for-sale (“AFS”) for which a fair
value through other comprehensive income (“FVOCI”) election is available and hence
there will be no change to the accounting for these assets.
Accordingly, the Group does not expect the new guidance to affect the classification
and measurement of these financial assets. However, gains or losses realised on the
sale of financial assets at FVOCI will no longer be transferred to profit or loss on sale,
but instead reclassified below the line from the FVOCI reserve to retained earnings.

22
There will be no impact on the Group’s accounting for financial liabilities, as the new
requirements only affect the accounting for financial liabilities that are designated at
fair value through profit or loss and the Group does not have any such liabilities.
The derecognition rules have been transferred from HKAS 39 “Financial Instruments:
Recognition and Measurement” and have not been changed.
The new impairment model requires the recognition of impairment provisions based
on expected credit losses (ECL) rather than only incurred credit losses as is the
case under HKAS 39. It applies to financial assets classified at amortised cost, debt
instruments measured at FVOCI, contract assets under HKFRS 15 “Revenue from
Contracts with Customers”, lease receivables, loan commitments and certain financial
guarantee contracts. Based on the assessments undertaken to date, the Group expects it
may result in earlier recognition of credit losses.
The new standard also introduces expanded disclosure requirements and changes
in presentation. These are expected to change the nature and extent of the Group’s
disclosures about its financial instruments particularly in the year of the adoption of
the new standard.
This new standard must be applied for financial years commencing on or after 1
January 2018. The Group will apply the new rules retrospectively from 1 January
2018, with the practical expedients permitted under the standard. Comparatives for
2017 will not be restated.
HKFRS 15, “Revenue from contracts with customers”
The Hong Kong Institute of Certified Public Accountants (“HKICPA”) has issued a
new standard for the recognition of revenue. This will replace HKAS 18 which covers
contracts for goods and services and HKAS 11 which covers construction contracts
and the related literature.
The new standard is based on the principle that revenue is recognised when control of
a good or service transfers to a customer.
The standard permits either a full retrospective or a modified retrospective approach
for the adoption.
Management is currently assessing the effects of applying the new standard on
the Group’s consolidated financial statements and has identified the application of
HKFRS 15 may result in the identification of separate performance obligations in
relation to sales of E-payment terminals products which could affect the timing of the
recognition of revenue going forward.
More detailed assessment will be carried out by the Group to estimate the impact of
the new rules on the Group’s consolidated financial statements.

23
This new standard is mandatory for financial years commencing on or after 1 January
2018. The Group intends to adopt the standard using the modified retrospective
approach which means that the cumulative impact of the adoption will be recognised
in retained earnings as of 1 January 2018 and that comparatives will not be restated.
HKFRS 16, “Leases”
HKFRS 16 was issued in January 2016. It will result in almost all leases being
recognised on the consolidated balance sheet, as the distinction between operating and
finance leases is removed. Under the new standard, an asset (the right to use the leased
item) and a financial liability to pay rentals are recognised. The only exceptions are
short-term and low-value leases.
The accounting for lessors will not significantly change.
The standard will affect primarily the accounting for the Group’s operating leases. As
at the reporting date, the Group has non-cancellable operating lease commitments of
HK$37,351,000.
The Group has not yet assessed the adjustments, if any, are necessary for example
because of the change in the definition of the lease term and the different treatment
of variable lease payments and of extension and termination options. It is therefore
not yet possible to estimate the amount of right-of-use assets and lease liabilities that
will have to be recognised on adoption of the new standard and how this may affect
the Group’s consolidated income statement and classification of cash flows going
forward.
This new standard is mandatory for financial years commencing on or after 1 January
2019. At this stage, the Group does not intend to adopt the standard before its effective
date. The Group intends to apply the simplified transition approach and will not
restate comparative amounts for the year prior to first adoption.
There are no other standards and interpretations that are not yet effective and that
would be expected to have a material impact on the entity in the current or future
reporting periods and on foreseeable future transactions.

24
3 REVENUE AND OTHER INCOME
The Group is principally engaged in the sales of E-payment Terminals products, the provision of payment
solutions services and maintenance and installation services. Revenue and other income recognised during
the year are as follows:
Year ended 31 December2017 2016
HK$’000 HK$’000
RevenueSales of E-payment Terminals products 3,429,679 2,757,632
Services:
Payment solutions services 95,612 125,101
Maintenance and installation services 65,789 32,109
3,591,080 2,914,842
Other incomeInterest income 20,847 15,005
Value-added tax refund (Note (i)) 35,182 44,840
Subsidy income 12,286 10,138
Others 6,739 1,610
75,054 71,593
Note (i) The amount represents the Group’s entitlement to value-added tax refund in relation to the sales
of self-developed software products in the People’s Republic of China (the “PRC”).
4 SEGMENT INFORMATION
The management reviews the Group’s internal reporting in order to assess performance and allocate
resources. The management has determined the operating segments based on the internal reports reviewed
by the Executive Directors to make strategic decisions. The Group is principally engaged in the E-payment
Terminals solutions business, and the management considers that the Group operates in one single
business segment.
The Group primarily operates in Hong Kong, the PRC (China excluding Hong Kong, Macau and Taiwan),
the United States of America (the “US”) and Italy. The management assesses the performance of the
Group from a geographic perspective based on the locations of the subsidiaries in which revenues are
generated.
The management assesses the performance of the operating segments based on a measurement of
segmental operating profit/(loss).

25
An analysis of the Group’s turnover and results during the year by segment is as follows:
Year ended 31 December 2017
PRC,other than
Hong Kong, Macau and
TaiwanHong Kongand others US Italy Elimination Total
HK$’000 HK$’000 HK$’000 HK$’000 HK$’000 HK$’000
Turnover from external customers 1,417,336 1,811,570 254,723 107,451 – 3,591,080Inter-segment turnover 1,368,869 130,505 – 123 (1,499,497) –
Total turnover 2,786,205 1,942,075 254,723 107,574 (1,499,497) 3,591,080
Segmental earnings before interest
expense, taxes, depreciation and
amortisation (“EBITDA”) 127,879 494,079 3,659 2,110 7,774 635,501Depreciation (note 5) (21,023) (567) (170) (1,066) – (22,826)Amortisation (note 5) (6,227) (500) – (1,454) – (8,181)Impairment of assets (note 5) (176,471) – – – – (176,471)
Segmental operating (loss)/profit (75,842) 493,012 3,489 (410) 7,774 428,023Finance costs (3,801)Share of result of an investment
accounted for using equity method 318
Profit before income tax 424,540Income tax expense (87,974)
Profit for the year 336,566
Year ended 31 December 2016
PRC,
other than
Hong Kong,
Macau and
Taiwan
Hong Kong
and others US Italy Elimination Total
HK$’000 HK$’000 HK$’000 HK$’000 HK$’000 HK$’000
Turnover from external customers 1,622,321 1,042,909 176,669 72,943 – 2,914,842
Inter-segment turnover 914,695 163,560 – – (1,078,255) –
Total turnover 2,537,016 1,206,469 176,669 72,943 (1,078,255) 2,914,842
Segmental EBITDA 438,711 249,023 5,055 3,065 3,623 699,477
Depreciation (note 5) (6,180) (253) (345) (377) – (7,155)
Amortisation (note 5) (2,352) – – (877) – (3,229)
Segmental operating profit 430,179 248,770 4,710 1,811 3,623 689,093
Finance costs (10,794)
Profit before income tax 678,299
Income tax expense (74,865)
Profit for the year 603,434

26
The segment assets and liabilities as at 31 December 2017 and additions to non-current assets for the year
ended 31 December 2017 are as follows:
As at 31 December 2017
PRC,other than
Hong Kong,Macau and
TaiwanHong Kongand others US Italy Elimination Total
HK$’000 HK$’000 HK$’000 HK$’000 HK$’000 HK$’000
Segment assets 3,728,617 1,877,835 193,693 99,475 (667,404) 5,232,216
Segment liabilities 1,484,612 319,254 230,166 50,835 (749,717) 1,335,150
Year ended 31 December 2017
PRC,other than
Hong Kong,Macau and
TaiwanHong Kongand others US Italy Elimination Total
HK$’000 HK$’000 HK$’000 HK$’000 HK$’000 HK$’000
Additions to non-current assets 112,194 66,981 608 33,888 – 213,671
The segment assets and liabilities at 31 December 2016 and additions to non-current assets for the year
ended 31 December 2016 were as follows:
As at 31 December 2016
PRC,
other than
Hong Kong,
Macau and
Taiwan
Hong Kong
and others US Italy Elimination Total
HK$’000 HK$’000 HK$’000 HK$’000 HK$’000 HK$’000
Segment assets 3,360,671 1,483,999 127,537 70,631 (609,775) 4,433,063
Segment liabilities 1,224,057 113,234 167,499 20,695 (593,705) 931,780
Year ended 31 December 2016
PRC,
other than
Hong Kong,
Macau and
Taiwan
Hong Kong
and others US Italy Elimination Total
HK$’000 HK$’000 HK$’000 HK$’000 HK$’000 HK$’000
Additions to non-current assets 179,980 122 170 887 – 181,159

27
Segmental EBITDA represents segmental operating profit/(loss) before finance costs, income tax expense,
depreciation of property, plant and equipment, amortisation of land use rights and intangible assets and
impairment of assets. Segment assets consist primarily of property, plant and equipment, land use rights,
intangible assets, available-for-sale financial assets, investment accounted for using the equity method,
other non-current assets, inventories, trade and bills receivables, deposits and other receivables, restricted
cash and cash and cash equivalents. Segment liabilities consist primarily of trade payables, other payables
and accruals, current tax liabilities and borrowings.
Additions to non-current assets mainly comprise additions to property, plant and equipment, land use
rights and intangible assets including additions resulting from acquisitions through business combinations.
In 2017, revenue of approximately HK$1,163,702,000 (2016: HK$529,405,000) is derived from the
largest customer, representing 32.4% (2016: 18.2%) of the total revenue, which is attributable to the
HK operating segment; HK$259,617,000 (2016: HK$263,550,000) is derived from the second largest
customer, representing 7.2% (2016: 9.0%) of the total revenue, which is attributable to the PRC operating
segment.
Information provided to the Executive Directors is measured in a manner consistent with that in the
consolidated financial statements.
The Group is mainly domiciled in Hong Kong, the PRC, the US and Italy.
The Group’s non-current assets by geographical location, which is determined by the geographical
location in which the asset is located, is as follows:
As at 31 December2017 2016
HK$’000 HK$’000
Non-current assetsPRC, other than Hong Kong, Macau and Taiwan 244,700 196,845
Hong Kong and others 96,718 626
US 562 125
Italy 51,063 15,048
393,043 212,644

28
5 EXPENSES BY NATURE
Expenses included in cost of sales, selling expenses, administrative expenses and impairment of assets are
analysed as follows:
Year ended 31 December2017 2016
HK$’000 HK$’000
Remuneration to the Company’s auditor
– Group’s annual audit services 1,770 1,620
– audit services for Kwang Woo Information &
Communication Co., Ltd. (“Kwang Woo”) 290 –
– non-audit services 1,209 480
Remuneration to other auditors 435 208
Depreciation of property, plant and equipment 22,826 7,155
Amortisation of land use rights 3,173 5
Amortisation of intangible assets 5,008 3,224
Employee benefit expenses
(including Directors’ emoluments) 482,845 308,140
Costs of inventories sold 2,098,181 1,620,895
Operating lease rentals in respect of buildings 32,429 25,066
Research and development costs 287,230 183,614
Sales commission 25,509 13,661
Provision for impairment of receivables, net (note 10(c)) 2,941 586
Loss on disposals of property, plant and equipment 30 117
Reversal of provision for obsolete inventories (1,824) (17,983)
Impairment of assets (Note a) 176,471 –
Note a : Impairment of assets (note 9) , consists of:
Year ended 31 December2017 2016
HK$’000 HK$’000
Shanghai New Kashuo Information Technology
Company Limited (“Shanghai Kashuo”) and
its subsidiaries (collectively, the “Kashuo Group”)
– Impairment of property, plant and equipment 37,723 –
– Impairment of goodwill and other intangible assets* 53,837 –
– Impairment of trade receivables 40,279 –
– Impairment of other assets 27,119 –
Suzhou Ieasy Information Technology Co. Ltd
(“Suzhou Ieasy”)
– Impairment of goodwill and other intangible assets* 17,513 –
176,471 –
* The amounts include the reversals of deferred tax liabilities recognised on the date of acquisition,
in connection with the intangible assets of Kashuo Group and Suzhou Ieasy with the amount of
HK$3,473,000 and HK$391,000 respectively.

29
6 INCOME TAX EXPENSE
Year ended 31 December2017 2016
HK$’000 HK$’000
Current income tax
– China corporate income tax 6,913 41,454
– Hong Kong profits tax 82,228 46,826
– Overseas profits tax 13 644
Over provision in prior year, net (1,147) (871)
Total current income tax 88,007 88,053
Deferred income tax (33) (13,188)
Income tax expense 87,974 74,865
Hong Kong profits tax has been provided for at the rate of 16.5% (2016: 16.5%) on the estimated
assessable profit for the year ended 31 December 2017.
Taxes on overseas profits have been calculated at the rates of tax prevailing in the jurisdictions in which
the Group operates, based on existing legislation, interpretations and practices in respect thereof.
Pursuant to the Corporate Income Tax Law of the PRC effective from 1 January 2008 (the “CIT Law”),
companies in the PRC are subject to income tax of 25% unless preferential rate is applicable.
• Pax Computer Technology (Shenzhen) Co., Ltd. (“Pax Computer Shenzhen”), a wholly owned
subsidiary of the Company, is located in the Shenzhen Special Economic Zone. Pursuant to Caishui
[2016] Circular 49 jointly released by the Ministry of Finance, the State Administration of Taxation,
the National Development and Reform Commission and the Ministry of Industry and Information
Technology of the PRC, management performed self-assessment on the eligibility for the tax
incentives. Management estimated that Pax Computer Shenzhen was qualified as a National Key
Software Enterprise and entitled to the preferential corporate income tax rate of 10% (2016: 10%)
for the year ended 31 December 2017.
• Wonder Pax Technology (Shenzhen) Co. Ltd. (“Wonder Pax”), a wholly owned subsidiary of the
Company, obtained the approval from the relevant applicable tax authorities in April 2015 for a
preferential tax treatment and is fully exempted from corporate income tax for two years, beginning
in 2014, followed by a 50% tax exemption for the ensuing three years. As such, the applicable
corporate income tax rate of Wonder Pax is 12.5% (2016: 12.5%) for the year ended 31 December
2017.

30
7 EARNINGS PER SHARE
(a) Basic
Basic earnings per share is calculated by dividing the profit for the year attributable to the owners
of the Company by the weighted average number of ordinary shares in issue during the year.
Year ended 31 December2017 2016
Profit attributable to the owners of the Company (HK$’000) 407,507 600,908
Weighted average number of ordinary shares in issue
(thousand shares) 1,109,277 1,114,457
Basic earnings per share (HK$ per share) 0.367 0.539
(b) Diluted
Diluted earnings per share is calculated by adjusting the weighted average number of ordinary
shares outstanding to assume conversion of all potentially dilutive ordinary shares. The Company
has one category of potentially dilutive ordinary shares: share options. For the share options, a
calculation is done to determine the number of shares that could have been acquired at fair value
(determined as the average market share price of the Company’s shares for the period) based on
the monetary value of the subscription rights attached to outstanding share option. The number
of shares calculated as above is compared with the number of shares that would have been issued
assuming the exercise of the share options.
Year ended 31 December2017 2016
Profit attributable to the owners of the Company (HK$’000) 407,507 600,908
Weighted average number of ordinary shares in issue
(thousand shares) 1,109,277 1,114,457
Adjustments for share options (thousand shares) 2,236 8,557
Weighted average number of ordinary shares
for diluted earnings per share (thousand shares) 1,111,513 1,123,014
Diluted earnings per share attributable to owners of
the Company (HK$ per share) 0.367 0.535
31
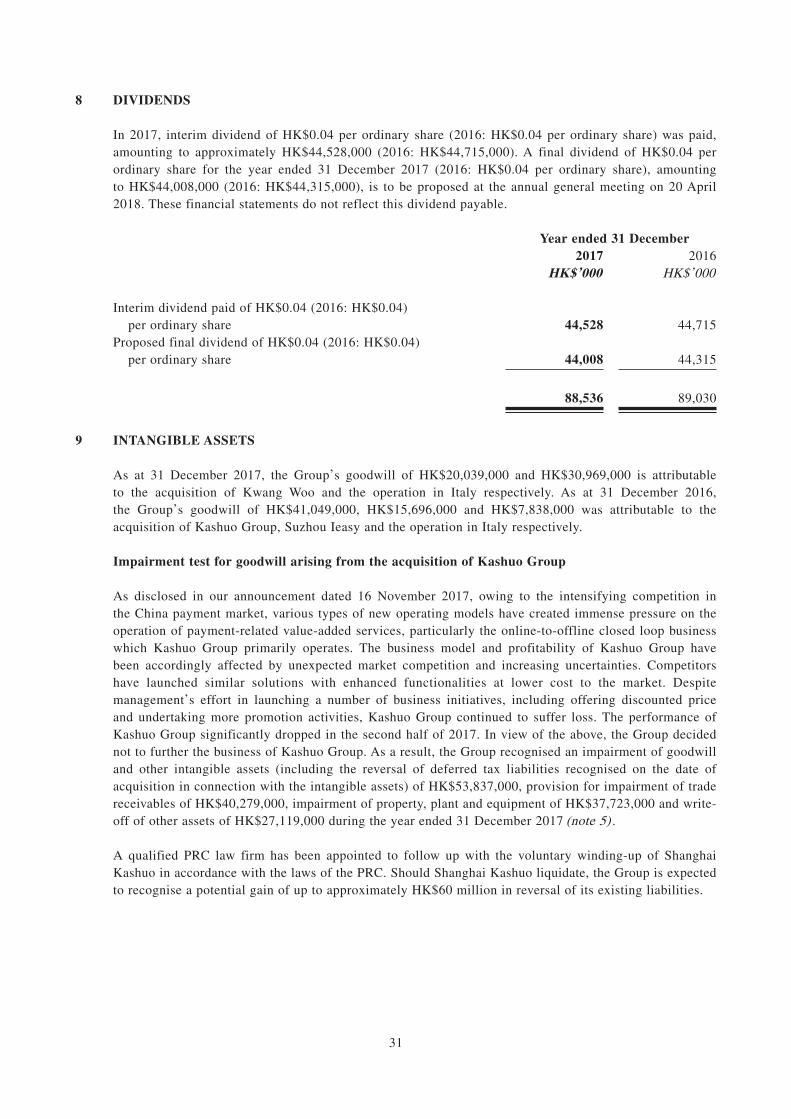
8 DIVIDENDS
In 2017, interim dividend of HK$0.04 per ordinary share (2016: HK$0.04 per ordinary share) was paid,
amounting to approximately HK$44,528,000 (2016: HK$44,715,000). A final dividend of HK$0.04 per
ordinary share for the year ended 31 December 2017 (2016: HK$0.04 per ordinary share), amounting
to HK$44,008,000 (2016: HK$44,315,000), is to be proposed at the annual general meeting on 20 April
2018. These financial statements do not reflect this dividend payable.
Year ended 31 December2017 2016
HK$’000 HK$’000
Interim dividend paid of HK$0.04 (2016: HK$0.04)
per ordinary share 44,528 44,715
Proposed final dividend of HK$0.04 (2016: HK$0.04)
per ordinary share 44,008 44,315
88,536 89,030
9 INTANGIBLE ASSETS
As at 31 December 2017, the Group’s goodwill of HK$20,039,000 and HK$30,969,000 is attributable
to the acquisition of Kwang Woo and the operation in Italy respectively. As at 31 December 2016,
the Group’s goodwill of HK$41,049,000, HK$15,696,000 and HK$7,838,000 was attributable to the
acquisition of Kashuo Group, Suzhou Ieasy and the operation in Italy respectively.
Impairment test for goodwill arising from the acquisition of Kashuo Group
As disclosed in our announcement dated 16 November 2017, owing to the intensifying competition in
the China payment market, various types of new operating models have created immense pressure on the
operation of payment-related value-added services, particularly the online-to-offline closed loop business
which Kashuo Group primarily operates. The business model and profitability of Kashuo Group have
been accordingly affected by unexpected market competition and increasing uncertainties. Competitors
have launched similar solutions with enhanced functionalities at lower cost to the market. Despite
management’s effort in launching a number of business initiatives, including offering discounted price
and undertaking more promotion activities, Kashuo Group continued to suffer loss. The performance of
Kashuo Group significantly dropped in the second half of 2017. In view of the above, the Group decided
not to further the business of Kashuo Group. As a result, the Group recognised an impairment of goodwill
and other intangible assets (including the reversal of deferred tax liabilities recognised on the date of
acquisition in connection with the intangible assets) of HK$53,837,000, provision for impairment of trade
receivables of HK$40,279,000, impairment of property, plant and equipment of HK$37,723,000 and write-
off of other assets of HK$27,119,000 during the year ended 31 December 2017 (note 5) .
A qualified PRC law firm has been appointed to follow up with the voluntary winding-up of Shanghai
Kashuo in accordance with the laws of the PRC. Should Shanghai Kashuo liquidate, the Group is expected
to recognise a potential gain of up to approximately HK$60 million in reversal of its existing liabilities.

32
Impairment test for goodwill arising from the acquisition of Suzhou Ieasy
Suzhou Ieasy is principally engaged in the development and sales of enterprise resource planning
management software in the PRC. During the year, the prospect of small-scale service providers such
as Suzhou Ieasy has been significantly challenged by the intensifying competition induced by the major
market players. Due to the continuous loss suffered by Suzhou Ieasy and the worsening market condition,
the Group decided to scale down its expansion plan.
For the purpose of the goodwill impairment assessment, the Group revised its cash flow forecasts of this
CGU. The management has assessed the recoverable amount of Suzhou Ieasy as at 31 December 2017
based on the fair-value less costs to sell calculation. The recoverable is considered insignificant which is
lower than the carrying amount of this CGU, this shortfall leads to full impairment of goodwill and other
intangible assets (including the reversal of deferred tax liabilities recognised on the date of acquisition in
connection with the intangible assets) of HK$17,513,000 during the year ended 31 December 2017 (note
5) .
10 TRADE AND BILLS RECEIVABLES, DEPOSITS AND OTHER RECEIVABLES
As at 31 December2017 2016
HK$’000 HK$’000
Current portionTrade receivables (Note (a)) 1,695,406 1,245,947
Amounts due from related parties (Note (a)) 32,453 65,196
Less: provision for impairment of receivables (Note (c)) (49,163) (4,067)
Trade receivables, net 1,678,696 1,307,076
Bills receivables (Note (b)) 24,718 40,370
Trade and bills receivables 1,703,414 1,347,446
Deposits and other receivables 39,593 68,919
Trade and bills receivables, deposits and other receivables 1,743,007 1,416,365
Non-current portionLease prepayment 43,077 24,672
Others 9,708 13,681
52,785 38,353

33
The fair values of trade and bills receivables, deposits and other receivables approximate their carrying
values as at 31 December 2016 and 2017.
Note
(a) Trade receivables
The Group’s credit terms to trade debtors range generally from 0 to 180 days. However, credit
terms of more than 180 days may be granted to customers on a case-by-case basis upon negotiation.
As at 31 December 2016 and 2017, the ageing analysis of the trade receivables and amounts due
from related parties based on invoice date is as follows:
As at 31 December2017 2016
HK$’000 HK$’000
Up to 90 days 1,213,758 846,807
91 to 180 days 242,795 277,772
181 to 365 days 128,667 58,915
Over 365 days 142,639 127,649
1,727,859 1,311,143
(b) Bills receivables
The balance represents bank acceptance notes with maturity periods of within six months. The
maturity profile of the bills receivables of the Group is as follows:
As at 31 December2017 2016
HK$’000 HK$’000
Up to 90 days 11,703 40,370
91 to 180 days 13,015 –
24,718 40,370

34
(c) Provision for impairment of trade receivables
The movement on the provision for impairment of trade receivables is as follows:
As at 31 December2017 2016
HK$’000 HK$’000
At beginning of the year 4,067 3,694
Provision for the year (note 5) 2,941 886
Impairment (note 5) 40,279 –
Reversal of provision (note 5) – (300)
Exchange realignment 1,876 (213)
At end of the year 49,163 4,067
11 TRADE PAYABLES, OTHER PAYABLES AND ACCRUALS
As at 31 December2017 2016
HK$’000 HK$’000
Trade payables 937,093 649,271
Amount due to a related party 15,991 13,214
953,084 662,485
Other payables and accruals
Receipt in advance from customers 70,519 89,327
Other tax payables 95,991 99,488
Other accrued expenses and payables 115,075 37,976
281,585 226,791
1,234,669 889,276
The ageing analysis of trade payables (including amount due to a related party of trading in nature) based
on invoice date is as follows:
As at 31 December2017 2016
HK$’000 HK$’000
Up to 90 days 808,948 567,613
91 to 180 days 137,140 92,649
181 to 365 days 4,175 –
Over 365 days 2,821 2,223
953,084 662,485
The average credit period granted by the Group’s suppliers ranges from 0 to 180 days.

35
PURCHASE, SALE OR REDEMPTION OF SECURITIES
During the year, the Company repurchased an aggregate of 13,000,000 ordinary shares for a
total consideration of HK$51,353,890 (excluding expenses) on The Stock Exchange of Hong
Kong Limited (the “Stock Exchange”) as follows:
Consideration per share
Month of RepurchaseNo. of shares repurchased Highest Lowest
Total Consideration
paidHK$ HK$ HK$
August 2017 5,000,000 4.34 4.18 21,392,190
August 2017 3,000,000 4.06 3.98 12,108,810
December 2017 5,000,000 3.60 3.49 17,852,890
Total 13,000,000 51,353,890
The Board believes that the share repurchases are in the best interests of the Company and
its shareholders and would lead to an enhancement of the net assets value per share and/or
earnings per share of the Company. The above repurchased shares were cancelled during the
year and the issued share capital of the Company was reduced by the nominal value of these
shares accordingly and the balance of consideration was charged against the share premium
account.
Save as disclosed above, neither the Company nor any of its subsidiaries purchased, sold or
redeemed any of the Company’s shares during the year.

36
DIVIDEND
An interim dividend of HK$0.04 per ordinary share amounting to approximately HK$44.5
million was paid to the shareholders of the Company during the year.
The Board has recommended a payment of final dividend of HK$0.04 per ordinary share for
the year ended 31 December 2017 (year ended 31 December 2016: HK$0.04 per ordinary
share) to shareholders of the Company whose names appear on the register of members of
the Company at the close of business on Tuesday, 15 May 2018, subject to the approval of
shareholders of the Company at the forthcoming annual general meeting of the Company
which will be held on Friday, 20 April 2018, and if passed, the final dividend will be paid
to the shareholders of the Company on Wednesday, 30 May 2018. For determining the
entitlement to the proposed final dividend, the register of members of the Company will be
closed from Friday, 11 May 2018 to Tuesday, 15 May 2018, both days inclusive, during which
period no transfer of shares will be registered. In order to qualify for the final dividend, all
transfer documents accompanied by the relevant share certificates must be lodged with the
Company’s branch share registrar and transfer office in Hong Kong, Tricor Investor Services
Limited at Level 22, Hopewell Centre, 183 Queen’s Road East, Hong Kong not later than 4:30
p.m. on Thursday, 10 May 2018. Together with the interim dividend of HK$0.04 per ordinary
share (six months ended 30 June 2016: HK$0.04 per ordinary share), the total dividend per
ordinary share for the year was HK$0.08 (2016: HK$0.08).
RECORD DATE FOR DETERMINING ELIGIBILITY TO ATTEND AND VOTE AT THE ANNUAL GENERAL MEETING
Record date (being the last date for registration of any share transfer given there will be no
book closure) for determining the entitlement of the shareholders of the Company to attend
and vote at the annual general meeting will be Friday, 13 April 2018. All transfer documents
accompanied by the relevant share certificates must be lodged with the Company’s branch
share registrar and transfer office in Hong Kong, Tricor Investor Services Limited at Level 22,
Hopewell Centre, 183 Queen’s Road East, Hong Kong for registration no later than 4:30 p.m.
on Friday, 13 April 2018.
COMPLIANCE WITH THE MODEL CODE FOR SECURITIES TRANSACTIONS
The Group has adopted a code regulating the securities transaction of Directors and executive
officers named in the Company’s 2017 annual report, on terms no less exacting than the
required standard set out in the Model Code as set out in Appendix 10 to the Rules Governing
the Listing of Securities on the Stock Exchange (the “Listing Rules”).
Specific enquiry has been made to all Directors and they have confirmed that they had
complied with the Model Code throughout the year and up to the date of this announcement.

37
The Company has also established written guidelines regulating the transactions of securities
of the Company by senior management and employees who are likely to be in possession of
any inside information of the Company.
COMPLIANCE WITH THE CORPORATE GOVERNANCE CODE
The Company’s corporate governance practices are based on the principles (the “Principles”)
and code provisions (the “Code Provisions”) in the Corporate Governance Code (the “CG
Code”) as set out in Appendix 14 to the Listing Rules.
In formulating its corporate governance practices, the Company has applied the Principles and
complied with all applicable Code Provisions for the year.
The Board periodically reviews and monitors the Company’s policies and practices on
corporate governance or compliance with legal and regulatory requirements. The Board also
reviews the Group’s employee handbook, training and continuous professional development
of the Directors and the senior management to ensure that operations are conducted in
accordance with the standards of the CG Code.
REVIEW OF CONSOLIDATED FINANCIAL STATEMENTS
The Company’s Audit Committee has reviewed the accounting policies adopted by the Group
and the audited consolidated financial statements for the year ended 31 December 2017.
Scope of Work of PricewaterhouseCoopers
The figures in respect of the Group’s consolidated balance sheet, consolidated income
statement, consolidated statement of comprehensive income and the related notes thereto
for the year ended 31 December 2017 as set out in the preliminary announcement have
been agreed by the Group’s auditor, PricewaterhouseCoopers, to the amounts set out in
the Group’s audited consolidated financial statements for the year. The work performed
by PricewaterhouseCoopers in this respect did not constitute an assurance engagement
in accordance with Hong Kong Standards on Auditing, Hong Kong Standard on Review
Engagements or Hong Kong Standards on Assurance Engagements issued by the Hong Kong
Institute of Certified Public Accountants and consequently no assurance has been expressed
by PricewaterhouseCoopers on the preliminary announcement.
SUFFICIENCY OF PUBLIC FLOAT
Based on the information that is publicly available to the Company and within the knowledge
of the Directors as at the date of this announcement, the Directors confirm that the Company
has maintained at all times during the year sufficient public float as prescribed by the Listing
Rules.
38
PUBLICATION OF RESULTS ANNOUNCEMENT AND ANNUAL REPORT
This announcement is published on the Company’s website at www.paxglobal.com.hk and
the website of the Stock Exchange at www.hkexnews.hk. The 2017 annual report will be
despatched to shareholders of the Company and available on the above websites in due course.
The 2017 annual financial information set out above does not constitute the Group’s statutory
financial statements for the financial year ended 31 December 2017. Instead, it has been
derived from the Group’s audited consolidated financial statements for the financial year
ended 31 December 2017, which will be included in the Company’s 2017 annual report.
By Order of the Board
PAX Global Technology LimitedLi Wenjin
Executive Director
Hong Kong, 7 March 2018
As at the date of this announcement, the Board comprises three Executive Directors, namely
Mr. Nie Guoming, Mr. Lu Jie and Mr. Li Wenjin and three Independent Non-Executive
Directors, namely Mr. Yip Wai Ming, Dr. Wu Min, Mr. Man Kwok Kuen, Charles.