Embed Size (px)
DESCRIPTION
Pdpii May2011_07 Group Report
Citation preview
CAB 4023
PLANT DESIGN PROJECT II
MAY SEMESTER (2011)
PRODUCTION OF
543,000 METRIC TONS PER YEAR AMMONIA
GROUP 07
ABU RAIHAN BIN MOHAMMAD 10593
AHMAD FAISAL BIN AHMAD SAZALI 10179
MOHD AZFAR BIN MD JAAFAR 10743
NOOR SYAHIDAH BINTI RAMLI 10906
RUFAIDAH BINTI MOKHTAR 10580
CHEMICAL ENGINEERING PROGRAMME
UNIVERSITI TEKNOLOGI PETRONAS
May 2011

ii
CAB 4023
PLANT DESIGN PROJECT II
MAY SEMESTER (2011)
PRODUCTION OF
543,000 METRIC TONS PER YEAR AMMONIA
GROUP 07
ABU RAIHAN BIN MOHAMMAD 10593
AHMAD FAISAL BIN AHMAD SAZALI 10179
MOHD AZFAR BIN MD JAAFAR 10743
NOOR SYAHIDAH BINTI RAMLI 10906
RUFAIDAH BINTI MOKHTAR 10580
APPROVED BY,
____________________
(AP DR. M. IBRAHIM ABDUL MUTALIB)
DATE:
CHEMICAL ENGINEERING PROGRAMME
UNIVERSITI TEKNOLOGI PETRONAS
May 2011

iii
ACKNOWLEDGEMENT
First and foremost, Alhamdulillah and thank you to Allah the Almighty for guiding us
throughout our journey in completing the Plant Desing Project (PDP). All members of Group 07
are to be credited for their utmost participation and dedication in performing each task assigned.
A token of appreciation also goes to our supervisor AP Dr Mohamed Ibrahim bin Abdul Mutalib
for his valuable guidance and advice throghout the progress of creating a feasible, running design
of an Ammonia plant. His willingness to spend his valuable time to guide us has contributed
greatly to our project, and not to forget the effort he has taken to assist us.
Besides that, we would also like to thank the Department of Chemical Engineering of Universiti
Teknologi PETRONAS for providing the necessary resources for us to complete the project. To
all lecturers involved in PDP, we express our gratitude in assisting us throghout the course this
semester.
Deepest gratitude to the examiners for the oral presentation of PDP for being supportive and
guiding us through our mistakes to make the project even better. Lastly, we would like to thank
everyone who has provided us with the information, assistance, support and advices for this
project. Thank you to Mr. M Faudzi M Isa and Ir. Dr Chan Tuck Leong for sharing their valuable
insight on plant design and costing.
Special thanks to our classmates who are willing to share their information and knowledge with
us and also to our family for their support in making this PDP a success.

iv
Table of Contents List of Tables ................................................................................................................................ vii
EXECUTIVE SUMMARY ........................................................................................................... ix
CHAPTER 1 ................................................................................................................................... 1
1.0 INTRODUCTION ............................................................................................................ 1
1.1 Background ................................................................................................................... 1
1.2 Problem Statement ........................................................................................................ 2
1.3 Objective ....................................................................................................................... 2
1.4 Scope of Work .............................................................................................................. 3
CHAPTER 2 ................................................................................................................................... 4
2.0 LITERATURE REVIEW ................................................................................................. 4
2.1 Ammonia ...................................................................................................................... 4
2.2 Ammonia Market .......................................................................................................... 5
2.3 Ammonia Plant in Malaysia ......................................................................................... 7
2.4 Properties of Feedstock and Product ............................................................................ 7
2.5 Technology Comparison............................................................................................. 14
2.6 Site Feasibility Study .................................................................................................. 19
CHAPTER 3 ................................................................................................................................. 27
3.0 CONCEPTUAL DESIGN AND SYNTHESIS ............................................................. 27
3.1 Hierarchial Decomposition Approach ........................................................................ 27
3.2 Level 1 – Continuous or Batch ................................................................................... 28
3.3 Level 2 – Input-Output Structure ................................................................................ 28
3.4 Level 3 - Reactor Design and Recycle Structure of Flowsheet .................................. 30
3.5 Level 4 - Separation System Synthesis....................................................................... 33
3.6 Level 5 – Heat Exchanger Network ........................................................................... 39
CHAPTER 4 ................................................................................................................................. 47
4.0 INSTRUMENTATION AND CONTROL .................................................................... 47
4.1 Introduction ................................................................................................................ 47
4.2 Basic Control Strategies ............................................................................................. 48
4.2 Reactor Control Strategy ............................................................................................ 50
4.4 Absorption Column Control Strategy ......................................................................... 52
4.5 Compressor Control Strategy ..................................................................................... 53
4.6 Stripper Control Strategy ............................................................................................ 55
4.7 Pump Control Strategy ............................................................................................... 57

v
4.8 Heat Exchanger Control Strategy ............................................................................... 58
4.9 Flash Vessel Control Strategy .................................................................................... 60
4.10 Conclusion ................................................................................................................... 61
CHAPTER 5 ................................................................................................................................. 62
5.0 SAFETY AND LOSS PREVENTION .......................................................................... 62
5.1 Hazard and Operability Studies (HAZOP) ................................................................. 62
5.2 Plant Layout ................................................................................................................ 72
CHAPTER 6 ................................................................................................................................. 78
6.0 WASTE TREATMENT ................................................................................................. 78
6.1 Introduction ................................................................................................................ 78
6.2 Laws and Regulations ................................................................................................. 79
6.3 Waste Identification .................................................................................................... 80
6.4 Waste Treatment/Disposal .......................................................................................... 83
CHAPTER 7 ................................................................................................................................. 92
7.0 PROCESS ECONOMICS AND COST ESTIMATION ................................................ 92
7.1 Introduction ................................................................................................................ 92
7.2 Capital Investment ...................................................................................................... 93
7.3 Operating Cost ............................................................................................................ 95
7.4 Economic Analysis ..................................................................................................... 96
CONCLUSION AND RECOMMENDATION .......................................................................... 101
REFERENCES ......................................................................................................................... 1014
APPENDICES ............................................................................................................................ 107
vi
List of Figures
Figure 2.1: Ammonia Structure . . . . . . . 4
Figure 2.2: World Ammonia Consumption . . . . . . 6
Figure 2.3: Gebeng Industrial Area Map . . . . . . 26
Figure 3.1: Input Output Structure . . . . . . . 29
Figure 3.2: Flash Drum Separator . . . . . . . 36
Figure 3.3: Sequencing of Separators . . . . . . . 37
Figure 3.4: Algorithm Table . . . . . . . . 43
Figure 3.5: Heat Cascade . . . . . . . . 44
Figure 3.6: Combined Composite Curve from Online Software . . . 45
Figure 3.7: Heat Exchanger Network . . . . . . . 46
Figure 4.1:Feedback Control . . . . . . . . 48
Figure 4.2: Feedforward control . . . . . . . 48
Figure 4.3: Cascade Control . . . . . . . . 49
Figure 4.4: Ratio Control . . . . . . . . 49
Figure 4.5: Reactor . . . . . . . . . 50
Figure 4.6: Absorbtion column . . . . . . . 52
Figure 4.7: Compressor . . . . . . . . 53
Figure 4.8: Stripper . . . . . . . . . 55
Figure 4.9: Pump . . . . . . . . . 57
Figure 4.10: Heat exchanger . . . . . . . . 58
Figure 4.11: Cooler . . . . . . . . . 59
Figure 4.12: Flash vessel . . . . . . . . 60
Figure 5.1: HAZOP Procedure . . . . . . . 63
Figure 5.2: System under study for HAZOP . . . . . . 65
Figure 6.1: Air Effluent Treatment Block Diagram . . . . . 85
Figure 6.2: Flare Gas System . . . . . . . . 86
Figure 6.3: Wastewater Treatment Block Diagram . . . . . 87
Figure 7.1: Graph of PV vs No of Years for Simple Payback Period . . 98
Figure 7.2: Graph of PV vs No of Years for Discounted Payback Period . . 100
vii
List of Tables
Table 2.1: Ammonia Plant in Malaysia . . . . . . 7
Table 2.2: Properties of Ammonia . . . . . . . 8
Table 2.3: Properties of Natural Gas . . . . . . . 9
Table 2.4: Properties of Hydrogen . . . . . . . 10
Table 2.5: Properties of Nitrogen . . . . . . . 11
Table 2.6: Properties of Carbon Dioxide . . . . . . 12
Table 2.7: Properties of MDEA . . . . . . . 13
Table 2.8: Technology Comparison . . . . . . . 14
Table 2.9: Technology Advantages and Disadvantages . . . . 17
Table 2.10: Weighted Table . . . . . . . . 18
Table 2.11: Comparison of Potential Industrial Area . . . . 22
Table 2.12: Weighted Marks and Explanation on the Plant Site Location Factors . 24
Table 2.13: Weighted Table Comparison . . . . . . 25
Table 3.1: Comparison between Batch and Continuous Flow . . . 28
Table 3.2: Input Output Condition . . . . . . . 29
Table 3.3: Comparison Between CSTR and PFR . . . . . 31
Table 3.4: Reactions for Each Reactor . . . . . . 32
Table 3.5: Stream Table . . . . . . . . 40
Table 3.6: Optimum Delta T min for Industrial Sector . . . . 41
Table 3.7: Shifted Temperature . . . . . . . 42
Table 4.1: Variable types . . . . . . . . 51
Table 4.2: Variable types . . . . . . . . 52
Table 4.3: Variable types . . . . . . . . 54
Table 4.4: Variable types . . . . . . . . 56
Table 4.5: Variable types . . . . . . . . 57
Table 4.6:Variable types . . . . . . . . 59
Table 4.7: Variable types . . . . . . . . 60
Table 5.1: List of Basic HAZOP Guide Words . . . . . 64
Table 6.1: Parameters for Standard A and B . . . . . . 79
viii
Table 6.2: Air Emissions Guidelines . . . . . . . 80
Table 6.3: Waste Identification . . . . . . . 82
Table 6.4: Comparison of Gaseous Pollutant Removal Systems . . . 84
Table 7.1: Installation Factor Table . . . . . . . 94
Table 7.2: Estimated Equipment Cost . . . . . . 95
Table 7.3: Non-Discounted Simple Payback Cashflow . . . . 97
Table 7.4: Discounted Payback Cashflow . . . . . . 99
ix
EXECUTIVE SUMMARY
The objective of this project is to design a petrochemical plant producing 543,000 metric tonnes
per year of Ammonia from nitrogen and hydrogen. The plant must be economically feasible with
a plant life of 20 years with 330 operating days per year. It is producing Ammonia with a 99.99%
purity according to specification to be sold both locally and also exported to other countries.
Ammonia is a very important raw material which is extensively used to manufacture fertilizers
and other nitrogen-containing chemicals such as nitric acid, nitrates and intermediates for dyes
and other pharmaceutical products. The market for Ammonia in the future is quite promising
with the increase in fertilizer demand worldwide following the growth in population.
The plant is to be located in Malaysia. After considering three different plant sites from many
different aspects, Gebeng Industrial Estate in Kuantan, Pahang is chosen as the most suitable
location for the plant. The criteria evaluated for the location include availability of raw material
in the area, reasonable land price, feasibility of transportation, wastewater management system
as well as government incentives provided in the area. The site is also equipped with centralized
tankage facilities, pipeline and pipe rack system connecting Gebeng to Kuantan Port along with
utilities such as water and steam supplied by Centralized Utilities Facilities (CUF) in Gebeng.
Before carrying out with the plant design, preliminary hazard analysis is conducted in order to
define safety related aspects that might influence the design. The analysis include information on
previous accidents in similar Ammonia plant in the world, identification of material and
chemical hazards in the process, study on reducing inventories at site and also identification of
any compliances or requirements by local safety regulations and design guidelines.
Extensive literature review is done to obtain the latest information on Ammonia price and market
that may lead to a more profitable design by evaluating the economic potential of the project. In
the context of conceptual design, several process routes for hydrogen production were evaluated
and the best alternative was chosen for the design. The feed for the steam-reforming process is
natural gas in order to produce hydrogen. This is then reacted in high and low shift temperature
converter in order to convert the excess carbon monoxide into carbon dioxide. The carbon
dioxide is removed in the CO2 removal unit before the unabsorbed carbon monoxide and carbon

x
dioxide is reacted to produce methane. The final reaction is Ammonia synthesis to produce the
final product.
The designing phase of this project is executed using manual engineering calculation and also
PETRONAS iCON software. iCON is used to generate the Process Flow Diagram (PFD) which
is needed for the implementation of basic mass balance and heat integration. The heat integration
study is done by applying the pinch technology method. This is necessary in order to optimize
the energy usage in the plant. The Piping and Instrumentation Diagram (P&ID) with all process
equipments, piping systems, control loops and applied heat integration proecss is also generated.
The summaries of important specifications of major and minor equipments in the plant are as
shown below:
Raw Material Capacity/Requirement (MTPA)
Natural Gas 254,000
Steam 1,070,100
Product Capacity/Requirement (MTPA)
Ammonia 543,000
By-Product Capacity/Requirement (MTPA)
Carbon Dioxide 9,908,000
Major Equipment Description Operationg Condition
Primary Reformer
Reactor (R-101)
Converts natural gas to hydrogen and carbon
dioxide through reaction with steam.
CH4 + H2O 3H2 + CO
C2H6 + 2H2O 5H2 + CO
C3H8 + 3H2O H2 + 3CO
Temperature: 502°C
Pressure: 39 bar
Conversion: 0.75
Secondary Reformer
Reactor (R-102)
Further reaction to form more hydrogen gas.
CH4 + 1.5O2 2H2O + CO
CH4 + H2O 3H2 + CO
H2O + CO H2 + CO2
Temperature: 529°C
Pressure: 39 bar
Conversion: 0.85
High Temperature Shift
Reactor (R-103)
Reaction to convert carbon monixode gas to
carbon dioxide over a high temperature.
Temperature: 367°C
Pressure: 37 bar
Conversion: 0.75

xi
H2O + CO H2 + CO2
Low Temperature Shift
Reactor (R-104)
Shift reaction to further convert unreacted
carbon monoxide to carbon dioxide over a
lower temperature range.
H2O + CO H2+ CO2
Temperature: 217°C
Pressure: 35 bar
Conversion: 0.90
Methanator Reactor
(R-105)
Unreaced carbon monoxide and carbon
dioxide is reacted with hydrogen to form
methane which is recycled back to the
reformer.
3H2 + CO H2O + CH4
4H2 + CO2 CH4 + 2H2O
Temperature: 300°C
Pressure: 24 bar
Conversion: 0.99
Ammonia Converter
Reactor (R-106)
Main reactor for ammonia synthesis from
hydrogen and nitrogen (from air)
3H2 + N2 2NH3
Temperature: 378°C
Pressure: 198 bar
Conversion: 0.31/per pass
CO2 Absorption
Column (C-101)
Absorption column to absorb carbon dioxide
produce during the process of converting
methane to hydrogen from the vapour outlet
of low temperature shift converter
Temperature: 35°C
Pressure: 25 bar
No of tray: 25
Minor Equipment Description
Compressor To increase the pressure of the vapour outlet stream from the reactors to achieve a
prescribed operating condition in subsequent reactors.
Separator Vessel To separate mixture to its individual components according to its density (usually to
separate between liquid and gas).
Cooler Additional cooling requirement besides heat exchangers used in the plant among
process streams.
Heater Additional heating requirement besides heat exchangers used in the plant among
process streams.
Heat Exchanger Used to optimize the heat dissipation from process streams in order to save cost.

xii
The parameter limits of effluents are according to the Standard B of Environmental Quality Act
(EQA) 1974 in the constitution of Malaysia. The waste treatments in this plant are mainly
focused on wastewater treatment and air effluent. Wastes in the plant are first reduced through
waste minimisation before it is subjected to waste treatment/disposal. Water effluent will be
treated on site at the wastewater treatment plant while the air effluent will be burned using a flare
system.
For the process economics and cost estimation, we estimated the capital costs, operating costs
and economic potential of the plant. The Detailed Factorial Method with approximately 25%
accuracy must be used for detailed economic evaluation and the plant lifetime is fixed at 20
years. The economic potential at level 1 and level 2 are calculated according to Douglas (1988).
From the economic analysis, the Total Capital Investment for this project has been determined to
be $ 286,242,893.59 with an IRR of 12.8%. Further economic analysis on the project has proven
that the project is economically justified, having a payback period of 9 years since the project
commences, which is equal to 6 years after plant start-up. The calculated Discounted Cash Flow
Rate Of Return (DCFRR) is larger than the assumed Minimum Attractive Rate of Return
(MARR), enabling this project to be worth invested.
In the report, process control and instrumentation are included for each stage of the process.
Preliminary hazards analysis, safety and loss prevention are also included in this report. For
safety and loss prevention, a hazard and operability study, (HAZOP) was carried out with the
selection of process nodes revolving around the secondary reformer (R-102).
Overall, the designe plant is technically and economically feasible from the study condcuted and
analysis performed.

1
CHAPTER 1
1.0 INTRODUCTION
1.1 Background
The objective of the project is to make a realizable plant which is profitable, safe and
environmentally friendly. The plant that is to be designed is an ammonia producing plant which
uses nitrogen and hydrogen as its raw material. There are 2 main parts to the plant, which
includes the hydrogen production section and the ammonia production section.
The design project will be split into 2 parts, which will be taken during the course of 2 semesters.
This report covers the first part of plant design project, they include the following:
1. Review of the technologies
2. Selection of the feedstock, appropriate technology and flow-sheet
3. Economically feasible production capacity
4. Plant location
5. Energy and material balances
6. Heat Integration
7. iCon simulation
In the initial stage of the project, a literature review will be conducted on several matters. The
purpose of the literature review is to learn and find data on the technologies available, safety,
environmental effects, cost data and so forth. The next step is the selection of the best route or
process of producing ammonia.
The plant normally is expensive to build and operate, and difficult to maintain within regulatory
requirements. The process technology that has the best balance out of the following characteristic
are preferred which includes cost, safety, impact to environment and ease of starting and
operation. The most expensive parts of a process that was discovered are engineering part and
extraordinary management attention and skills are required to keep the plants operating. Besides
that, improving the accuracy of the approximate-material and energy calculations is vital.
2
According to the design alternatives, the cost of each in terms of material balance is compared,
raw materials availability, environmental impact, new technology, economics, location, safety,
etc. The preliminary design work includes literature research, conceptual design, process flow
sheeting and heat integration as well as the pre-design economic evaluation. The detailed
equipment design and specification will be done at the middle stages of the design project, when
the process flow diagram is definite and finalized. Other task to be completed will follow up, that
is the instrumentation and control design, pipe and instrumentation diagram, economic
evaluation, HAZOP and safety considerations and waste treatment.
1.2 Problem Statement
Ammonia is one of the most widely produced substances around the world. It is mainly used for
the production of UREA which is a fertilizer, however there are also several other uses for
ammonia which include uses in medicine, explosives, a cleansing agent and so forth. The task
that was given to us is to design an ammonia plant which produced its own hydrogen and is
based on the costs of 2011. The scope of the project is for 20 years which has an interest rate
of10% per year.
1.3 Objective
The main objective of this project is to integrate the knowledge of Chemical Engineering over
the course of 3 years to solve design problems related to an industrial plant. Other objectives
include developing team work and leadership characteristics. The ammonia plant that is to be
designed has to have to following considerations:
i) The most suitable location in Malaysia for the plant
ii) Effect of the plant to the environment.
iii) Maximizing the recovery and recycling of the reactants and intermediates.
iv) Minimize energy consumption to the extent economically justified.
3
v) The plant should be designed as simple and safe to operate that follows the corporate
HSE guidelines in Malaysia.
1.4 Scope of Work
The scope of study in this project is narrowed down so that the project is feasible and could be
completed within the allocated time frame. The parts of scope of study are:
i) Identify, select and developing the best flow sheet of the plant production
ii) Integrating of knowledge in considering of economical feasible production capacity
iii) Developing and simulating of material and energy balance for selected process
iv) Designing the proper equipment in the process plant like reactor, separator, heat exchanger,
pumps, storage and etc.
v) Developing the best control strategy
vi) Considering the environment and safety in relation to plant operation
vii) Conducting research to select the best possible plant location
viii) Preparing the preliminary and interim report as per standard format and present about the
plant design in the oral presentation.

4
CHAPTER 2
2.0 LITERATURE REVIEW
2.1 Ammonia
Ammonia is a compound of nitrogen and hydrogen with the formula NH3. It is a colourless gas
with a characteristic pungent odour. Ammonia contributes significantly to the food and fertilizers
industry. Besides, ammonia is used in commercial cleaning products and other commercial
industry. Commercially, ammonia is known as anhydrous ammonia. This term shows that there
is absence of water in the material. Because NH3 boils at -33.34 °C (-28.012 °F), the liquid must
be stored under high pressure or at low temperature. The reaction of hydrogen and nitrogen to
form ammonia is: 3H2 + N2 2NH3.
Figure 2.1: Ammonia Structure
Ammonia is being use in many industry in the world. Examples of ammonia usages are :
1. Fertilizer industry
2. Used for Ammonium Salts
3. Industrial application for Nitric Acid
4. Laboratory Reagent
5. Cleansing Agent
6. Medicine
7. Source of hydrogen
8. Refrigerant
9. Sodium Carbonate
5
Ammonia is mainly used in fertlizer industry which contributes up to 85% from overall usage.
Ammonia is the basic building block of the world nitrogen industry and is the intermediate
product from which a wide variety of nitrogen-based fertilizers and industrial products are
produced. Ammonia is generally processed into a variety of fertilizer products before being
applied to the soil. These products include urea, ammonium nitrates, ammonium sulphate and
ammonium phosphates. Urea plants are integrated with ammonia production as they require the
carbon dioxide by-product from ammonia units.
As for that, ammonia market is being studied in order to have clear perspective of ammonia from
economic aspect.
2.2 Ammonia Market
Prices in the Asian ammonia market picked up momentum in the last couple of months of 2010,
driven by tight supply and healthy demand in the region. Robust conditions in the US and
Europe offered additional support to Asian pricing, and high numbers for other nitrogen products
also helped buoy ammonia levels. Prices rose from $445-475/tonne CFR (cost and freight) Asia
in mid-November to $465-500/tonne CFR Asia in early February 2011.
World apparent consumption of ammonia increased by 12.0% or 2.3% annually during 2005–
2010, although it slowed during the latter part of 2008 and 2009. Growth is forecast at 2.7%
annually during 2010–2015. There will be some regions that grow faster, in particular Africa, led
primarily by increased urea production.
6
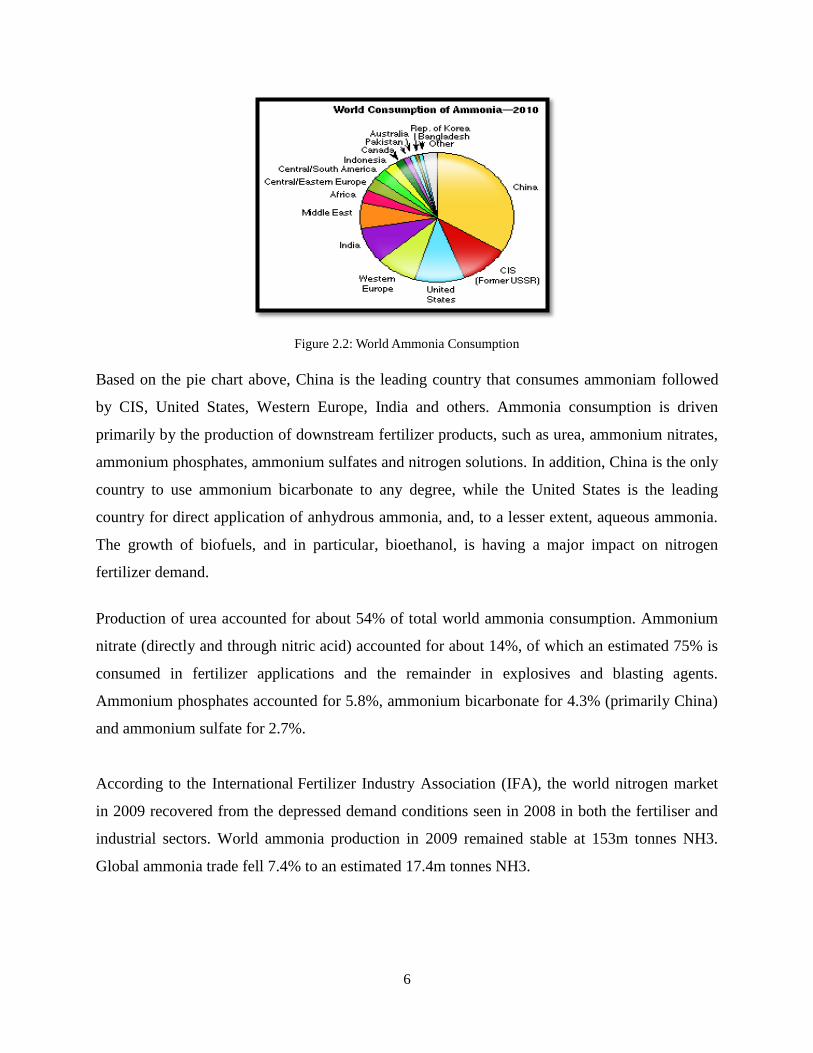
Figure 2.2: World Ammonia Consumption
Based on the pie chart above, China is the leading country that consumes ammoniam followed
by CIS, United States, Western Europe, India and others. Ammonia consumption is driven
primarily by the production of downstream fertilizer products, such as urea, ammonium nitrates,
ammonium phosphates, ammonium sulfates and nitrogen solutions. In addition, China is the only
country to use ammonium bicarbonate to any degree, while the United States is the leading
country for direct application of anhydrous ammonia, and, to a lesser extent, aqueous ammonia.
The growth of biofuels, and in particular, bioethanol, is having a major impact on nitrogen
fertilizer demand.
Production of urea accounted for about 54% of total world ammonia consumption. Ammonium
nitrate (directly and through nitric acid) accounted for about 14%, of which an estimated 75% is
consumed in fertilizer applications and the remainder in explosives and blasting agents.
Ammonium phosphates accounted for 5.8%, ammonium bicarbonate for 4.3% (primarily China)
and ammonium sulfate for 2.7%.
According to the International Fertilizer Industry Association (IFA), the world nitrogen market
in 2009 recovered from the depressed demand conditions seen in 2008 in both the fertiliser and
industrial sectors. World ammonia production in 2009 remained stable at 153m tonnes NH3.
Global ammonia trade fell 7.4% to an estimated 17.4m tonnes NH3.
7
Global ammonia capacity was 153m tonne/year NH3 in 2009, with the main additions occurring
in China, Trinidad, Indonesia, Oman, India and Egypt. The IFA noted that many projects that
were slated for commissioning in 2009 have been delayed by six months or more.
According to the IFA 2010 world capacity survey, global ammonia capacity will increase by
20% to 224m tonne/year NH3 by 2014. The bulk of the growth will be in China, Middle East,
Latin America and Africa. IFA estimated global seaborne ammonia availability will be close to
19m tonnes in 2014, a net increase of 1.7m tonnes over 2009
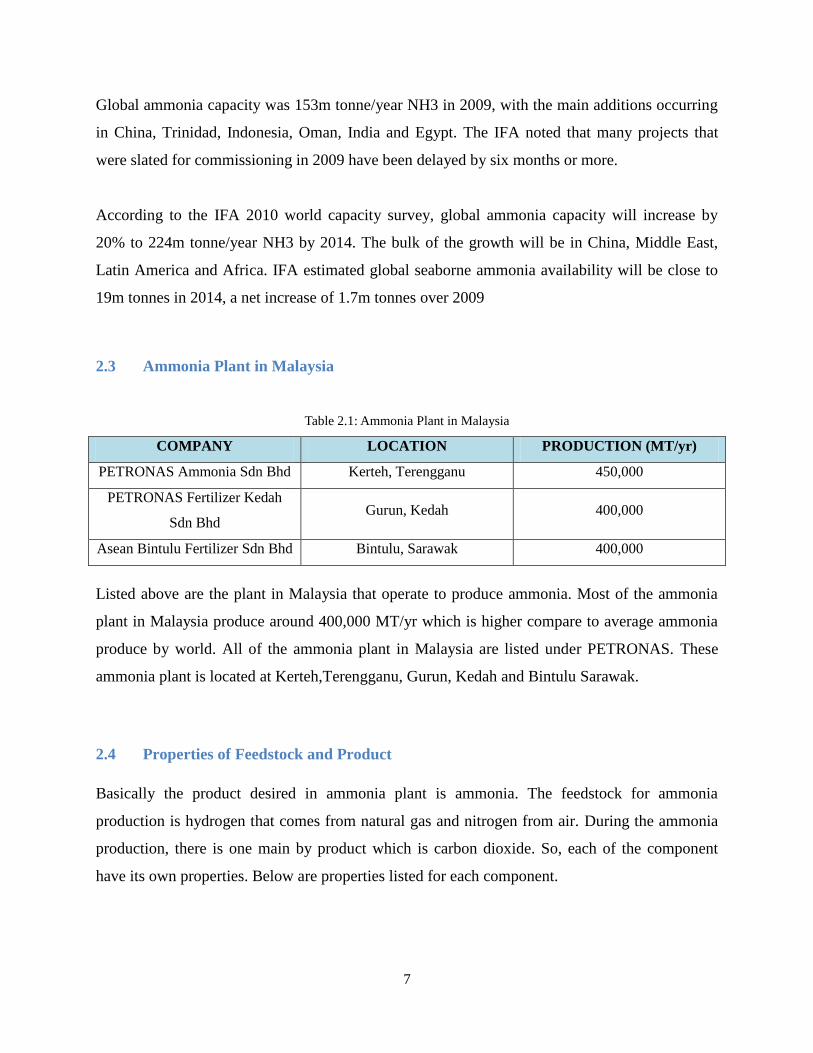
2.3 Ammonia Plant in Malaysia
Table 2.1: Ammonia Plant in Malaysia
COMPANY LOCATION PRODUCTION (MT/yr)
PETRONAS Ammonia Sdn Bhd Kerteh, Terengganu 450,000
PETRONAS Fertilizer Kedah
Sdn Bhd Gurun, Kedah 400,000
Asean Bintulu Fertilizer Sdn Bhd Bintulu, Sarawak 400,000
Listed above are the plant in Malaysia that operate to produce ammonia. Most of the ammonia
plant in Malaysia produce around 400,000 MT/yr which is higher compare to average ammonia
produce by world. All of the ammonia plant in Malaysia are listed under PETRONAS. These
ammonia plant is located at Kerteh,Terengganu, Gurun, Kedah and Bintulu Sarawak.
2.4 Properties of Feedstock and Product
Basically the product desired in ammonia plant is ammonia. The feedstock for ammonia
production is hydrogen that comes from natural gas and nitrogen from air. During the ammonia
production, there is one main by product which is carbon dioxide. So, each of the component
have its own properties. Below are properties listed for each component.

8
Table 2.2: Properties of Ammonia
PROPERTIES CHARACTERISTICS
Other names Ammonium hydrate, ammonia-aqueous solution
Molecular
Formula NH3
Molecular
Weight 35.06
State Liquid
Specific Gravity 0.9
Boiling Point Not available (stored at -330C in liquid form)
Flash Point Not available
Appearance Colourless alkaline liquid with strong pungent odour, mixes with water. Immiscible
with most organic solvents.
Stability FLAMMABILITY:
May form flammable/explosive vapour-air mixtures
CHEMICAL STABILITY:
Forms explosives mixtures with oxygen, chlorine, bromine, fluorine, iodine,
mercury, platinum and silver.
RISK:
- Toxic by inhalation
- Causes burns
- Risk of serious damage to eyes
- Very toxic to aquatic organisms
SAFETY:
- Keep locked up
- Avoid contact with eyes
- Wear suitable protective clothing
- Use only in well-ventilated areas
Hazard Rating

9
Table 2.3: Properties of Natural Gas
PROPERTIES CHARACTERISTICS
Other names Synthetic natural gas, natural gas C1-4
Molecular
Formula CH4 – main component
Molecular
Weight 16.04 as CH4
State Gas
Specific Gravity 0.58-0.63
Boiling Point -162°C as CH4
Flash Point -218°C
Appearance Invisible, highly flammable gas which readily forms explosive mixtures in air.
Supplied in bulk to consumers by pipeline at pressures up to 1000 kPa.
Stability FLAMMABILITY:
Extremely flammable – burns with a pale, luminous flame. Sudden release of
pressure or leakage will result in generation of a large volume of highly
flammable/explosive gas.
CHEMICAL STABILITY:
Reacts violently with oxidizing agents. Contact with chlorine dioxide causes
spontaneous explosion.
RISK:
- Risk of explosion if heated under confinement
- May be harmful to the foetus/embryo
- Vapours potentially cause drowsiness and dizziness
SAFETY:
- Keep away from sources of ignition
- Avoid exposure
Hazard Rating

10
Table 2.4: Properties of Hydrogen
PROPERTIES CHARACTERISTICS
Other names Industrial hydrogen, protium
Molecular
Formula H2
Molecular
Weight 2.106
State Non-Liquefied Gas
Specific Gravity Not applicable
Boiling Point -252.8°C
Flash Point 571°C (auto ignition temperature)
Appearance Colourless, odourless extremely flammable gas; slightly soluble in water.
Stability FLAMMABILITY:
Highly flammable – easily ignited by heat, sparks or flames.
CHEMICAL STABILITY:
Ignites easily with oxygen.
RISK:
- Extremely flammable
- Risk of explosion if heated under confinement
- Inhalation may cause effect, ingestion is not likely. Not irritating to skin and
eyes.
SAFETY:
- Keep away from sources of ignition
- Avoid exposure
Hazard Rating

11
Table 2.5: Properties of Nitrogen
PROPERTIES CHARACTERISTICS
Other names Nitrogen gas, tyrgas, praxair
Molecular
Formula N2
Molecular
Weight 28.02
State Non-Liquefied Gas
Specific Gravity Not available
Boiling Point -195.8°C
Flash Point Not applicable
Appearance Colourless, odourless compressed gas; sparingly soluble in water. Sudden release of
pressure or leakage may result in rapid generation of large volume of asphyxiant gas.
Stability FLAMMABILITY:
Risk of explosion if heated under confinement.
CHEMICAL STABILITY:
Stable when temperature protected and kept isolated as a compressed gas.
RISK:
- Inhalation may produce health damage
- Vapours potentially cause drowsiness and dizziness
SAFETY:
- Do not breathe gas/fumes/vapour/spray
- Avoid contact with skin
- Use only in well-ventilated areas
- Keep container in a well-ventilated place
- Keep container tightly closed
Hazard Rating

12
Table 2.6: Properties of Carbon Dioxide
PROPERTIES CHARACTERISTICS
Other names Carbon anhydride, carbonic acid gas
Molecular
Formula CO2
Molecular
Weight 44.00
State Non-Liquefied Gas
Specific Gravity 1.10 at -37°C
Boiling Point -56.6°C
Flash Point Not applicable
Appearance Colourless, odourless gas; slightly soluble in water. A saturated solution of gas in
water has pH of 3.8. High pressure liquefiable gas.
Stability FLAMMABILITY:
Risk of explosion if heated under confinement.
CHEMICAL STABILITY:
Reacts violently with strong bases and alkali metals.
RISK:
- Inhalation may produce health damage
- Cumulative effects may result following exposure
- May affect fertility
- Vapours potentially cause drowsiness and dizziness
SAFETY:
- Avoid exposure
- Keep container in a well-ventilated place
- Keep container tightly closed
Hazard Rating

13
Table 2.7: Properties of MDEA
PROPERTIES CHARACTERISTICS
Other names Methyldiethanolamine
Molecular
Formula CH3N(C2H4OH)2
Molecular
Weight 119.20
State Liquid
Specific Gravity 1.05 at 20°C
Boiling Point 240-255°C
Flash Point 115.6°C
Appearance Pale straw liquid with amine odour.
Stability FLAMMABILITY:
Oxides of carbon and nitrogen are hazardous products of combustion.
CHEMICAL STABILITY:
Chemically stable under normal and anticipated storage and handling conditions.
RISK:
- Inhalation and skin contact are expected to be primary routes of exposure
- Slightly toxic if swallowed, practically non-toxic if absorbed through skin,
severely irritation to eyes
- Avoid contact with strong acids, strong alkalis and strong oxidizers
- Thermal decomposition giving off toxic and corrosive products
SAFETY:
- Avoid contact with eyes
- Wash thoroughly after handling
- Not hazardous under normal storage conditions. However, material should be
stored in closed containers.

14
2.5 Technology Comparison
For ammonia production, there are several technologies or alternatives to produce hydrogen
which are steam reforming, electrolysis, coal gasification and biomass production.
Table 2.8: Technology Comparison
Process Steam
Reforming
Electrolysis Coal
Gasification
Biomass
Production
Cost of
Feedstock
RM 1.68/kg H2 RM 0.0089/kg
H2
RM 5.42/kg H2 RM 3.13/kg H2
Operation &
Maintenance
Cost
Low fuel cost
from natural gas
High electricity
cost to crack
Low fuel cost
from coal
High cost
because undergo
many processes
Conversion of
Feed
1 mol CH4: 3
mol H2
1 mol H2O: 1
mol H2
3 mol C: 1 mol
H2
1 mol C: 2 mol
H2
Emission Low CO2 gas
emission
No greenhouse
gas
High CO2 gas
emission
CO2 , NOx , SOx
emission – can
cause acid rain
Economic analysis for hydrogen production.
This analysis has been done to compare the cost of producing 1 kilogram of hydrogen from every
1 kilogram of feedstock.
1. Coal gasification
Primary reaction: 3C + O2 + H2O H2 + 3CO
From this reaction, 3 mol of carbon will produce 1 mol of hydrogen.
Assuming flowrate of feed of 1000 kg/hour, we calculate molar flowrate of feed as of:
Feed mass flowrate divided by the molecular weight of C.
1000 kg/hour divide by 12 kg/kmol = 83.3333 kmol/hour
Feed molar flowrate = 83.3333 kmol/hour
83.3333 kmol/hour C 1/3 x 83.3333 kmol/hour hydrogen
27.7777 kmol/hour hydrogen

15
The molar flowrate of hydrogen in the outlet is 27.7777 kmol/hour. From this value, we
determine the mass flowrate of hydrogen from the outlet.
Mass flowrate = molar flowrate x molecular weight of hydrogen
= 27.7777 kmol/hour x 2.02 kg/kmol
= 56.11 kg/hour
So from 1000kg/hour of feed, 56.11 kg/hour of hydrogen will be produced. It means that
to produced 1kg /hour of hydrogen, 17.82 kg/hour of feed is needed. Assuming coal
market price as 0.095USD per kg, the price to produce 1kg of hydrogen from 1kg of feed
(carbon) is:
0.095 USD x 17.82 = 1.69 USD/kg H2
2. Steam reforming
Primary reaction: CH4 + H2O 3H2 + CO (reversible reaction)
From this reaction, 1 mol of methane will produce 3 mol of hydrogen.
Assuming mass flowrate of feed of 1000 kg/hour, we calculate molar flowrate of feed as
of:
Feed mass flowrate divided by the molecular weight of methane:
1000 kg/hour divide by 16.04 kg/kmol = 62.34 kmol/hour
Feed molar flowrate = 62.34 kmol/hour
62.34 kmol/hour C 3 x 62.34 kmol/hour hydrogen
187.02 kmol/hour hydrogen
The molar flowrate of hydrogen in the outlet is 187.02 kmol/hour. From this value, we
determine the mass flowrate of hydrogen from the outlet.
Mass flowrate = molar flowrate x molecular weight of hydrogen
= 187.02 kmol/hour x 2.02 kg/kmol
= 377.78 kg/hour
16
So from 1000kg/hour of feed, 377.78 kg/hour of hydrogen will be produced. It means
that to produced 1kg /hour of hydrogen, 2.6470 kg/hour of feed is needed. Assuming
methane market price as 0.198USD per kg, the price the produce 1kg of hydrogen from
1kg of methane is:
0.198 USD x 17.82 = 0.52 USD/kg H2
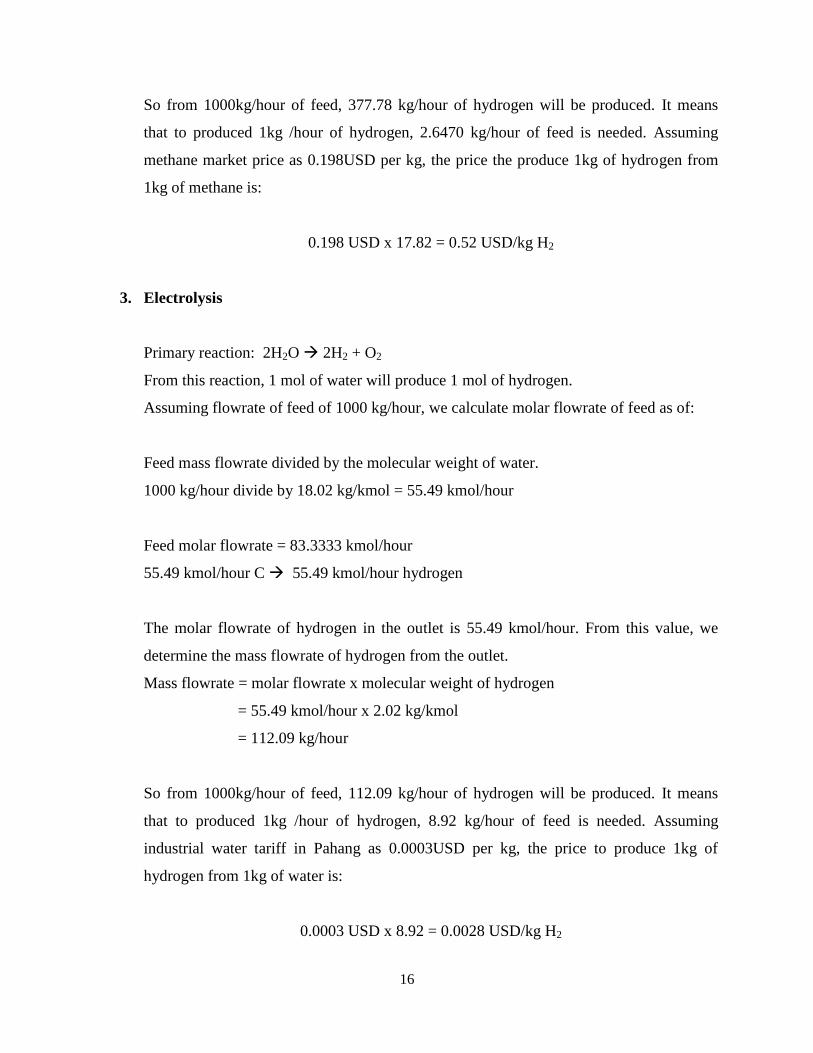
3. Electrolysis
Primary reaction: 2H2O 2H2 + O2
From this reaction, 1 mol of water will produce 1 mol of hydrogen.
Assuming flowrate of feed of 1000 kg/hour, we calculate molar flowrate of feed as of:
Feed mass flowrate divided by the molecular weight of water.
1000 kg/hour divide by 18.02 kg/kmol = 55.49 kmol/hour
Feed molar flowrate = 83.3333 kmol/hour
55.49 kmol/hour C 55.49 kmol/hour hydrogen
The molar flowrate of hydrogen in the outlet is 55.49 kmol/hour. From this value, we
determine the mass flowrate of hydrogen from the outlet.
Mass flowrate = molar flowrate x molecular weight of hydrogen
= 55.49 kmol/hour x 2.02 kg/kmol
= 112.09 kg/hour
So from 1000kg/hour of feed, 112.09 kg/hour of hydrogen will be produced. It means
that to produced 1kg /hour of hydrogen, 8.92 kg/hour of feed is needed. Assuming
industrial water tariff in Pahang as 0.0003USD per kg, the price to produce 1kg of
hydrogen from 1kg of water is:
0.0003 USD x 8.92 = 0.0028 USD/kg H2

17
Table 2.9: Technology Advantages and Disadvantages
Technology Advantages Disadvantages
Electrolysis Very environmentally friendly
as there is no emission of
greenhouse gases from the
process
Low cost for feedstock because
water is very cheap
Oxygen produced can be used
or sold as a relatively valuable
by-product
Huge amounts of electricity
is required – electricity is
quite costly in Malaysia
Energy consumption to
produce 1 MT ammonia is
about 12 megawatt-hours
1 MT of ammonia is more
expensive to produce from
electrolysis compared to
steam reforming – in terms of
energy cost
Coal
Gasification Most abundant source of
energy
Cheap source of energy
(95USD per metric tonne)
Easy for feedstock
transportation and storage
Reaction will produce many by
products which can also be
sold.
Low conversion, 3 moles of
C needed to produce 1 mol of
hydrogen
High CO2 and sulfur
emission
Highest cost to produce 1 kg
of hydrogen based on
economic analysis level one
Partial
Oxidation No external heat required for
the reaction
Process startup is fast.
Transient test is relatively easy
to control
Low hydrogen yield
The heat generated from the
reaction needs to be removed
or utilized by the system
High temperature
startup/shutdowns may cause
catalyst degradation
Steam
Reforming Burning value of the fuel
increased
Produces less exhaust
emissions
Soot is formed in the reactor
at high temperatures
Water sequestration from the
exhaust is not easy to
perform
The decision matrix is simple. Each item defines the critical points in producing hydrogen. The
weightage of the different items shows how each item is evaluated quantitatively. The score is
rated from 1 to 3. 1 marks as the lowest score while 3 is the highest. All in all, the highest total
score is the most viable process economically, in terms of its operational needs, production cost

18
and productivity. By comparing the marks from other hydrogen producing processes, we can
decide which of the processes has the best prospect based on the score line.
Table 2.10: Weighted Table
Criteria Weighted
%
Steam
Reforming Electrolysis
Coal
Gasification
Partial
Oxidation
Capital Cost 15 3 1 1.5 2
Cost of
Feedstock 20 2 2 2.5
2
Operation &
Maintenance
Cost
25 3 2 1.5
2
Conversion of
Feed/kg H2 30 3 2 1
1
Emission 10 1 3 0.5 1
TOTAL 100 260 195 145 160
Base on the weighted in the table above, it is clearly shown that steam reforming is the
best technology to be used in ammonia production. Besides, base on the calculation per H2
required as stated above, steam reforming is among the technologies that consume least cost. So,
the technology selected for ammonia production is Steam Reforming.
Steam reforming is the conventional way of producing hydrogen using methane and
mainly water vapor at temperature ranging from 600°C to 1000°C. The reaction utilizes nickel
based materials as the catalyst. However in recent years the development of new catalysts for
steam reforming calls for a new rhodium based catalyst to be used in the process. The capital
cost of building a steam reformer unit is more or less competitive in the market, therefore
making it a good prospect.
This process is by far the cheapest in terms of its feedstock and the most practical,
producing 3 mol of H2 for every mol of CH4. Its operation and maintenance cost is relatively
affordable and can be covered by the market price and demand. The process however produces
large amount of carbon dioxide, thus making it quite a problem in terms of its emission. Overall,
below is the table in which the process is evaluated by and also a quantitative analysis of the
process.

19
2.6 Site Feasibility Study
2.6.1 Criteria of selection
Site location plays an important role in ensuring the profitability and productivity of a plant. The
basic aim of the site selection is to choose a location that maximizes income and minimizes cost
where compromises are usually made. The suitable location should allow future expansion. The
potential location is considered by evaluating industrial areas in a few states to find the most
strategic place. There are a few factors involved in the selection of a location for the plant which
can be divided into primary and specific factors. The factors are explained further in the
following. Three existing industrial area have been evaluated to choose the most suitable location
for the construction of the new plant in Malaysia.
2.6.2 Primary Factors
i. Availability of feedstock
The cost of transportation can be reduced by a closer source of feedstock to the operating plant.
In order to produce large quantities of product which is ammonia in this case, large volumes of
raw materials would be required. Therefore, the closer the plant site is to the source of raw
materials, the lower the transportation and storage cost for raw materials. Besides, factors such as
supply, freight or transportation cost, availability and reliability of supply, level of purification of
raw materials and storage requirements also need to be considered. Location that is nearer to the
seaport would be very essential if the feedstock has to be imported, in order to minimize the cost
of shipping and fuel to the plant site.
ii. Market prospective
This chosen site should be close to the distribution centre. This is because the cost of product
distribution and requirement for cargo is influenced by this factor. It is very crucial to consider
the proximity of the major markets in locating suitable area for the plant development.

20
iii. Reasonable land price and size
The land price depends on the location and its size. Making the right choice of economical land
price can give a lower total investment cost. Besides, it is important to choose the lowest land
price and right size for constructing a new plant so that the highest profit and economic value can
be achieved.
iv. Utilities
Electricity supplies power to run the machines and equipments in a petrochemical plant. Large
amount of water supply would also be required to perform processes such as cooling and other
general uses in a chemical plant. Hence, adequate supply of power and water is very important to
ensure a smooth operation of the plant.
2.6.3 Specific factors
i. Transportation facilities
The plant should be situated near to the road network, seaport and airport. These main
transportation facilities enable a smooth import and export activities. Further more, the costs for
transportation of feedstock, product, plant equipments and personnel can be reduced.
ii. Availability of labour and services
A sufficient supply of labour should be considered in selecting the location of the plant.
Normally, non-local workers with high construction skills will be brought in while the low
skilled local workers will undergo training of plant operations. The operation costs will be
decreased if within the vicinity inexpensive manpower is readily available and could be used to
operate the plant.
iii. Waste and effluent disposal facilities
21
Location of the plant should provide capable and adequate disposal system. This is important to
ensure that the industrial waste and effluent will be treated properly if those are to be treated off-
site.
iv. Government incentives
The state governments attract other investors to invest in their state by giving a good offer of
incentives. The incentives are in the form of partial or total relief from income tax payment for a
specified period. Indirect tax incentives are also given to the investors where they receive
exemptions from import duty, sales tax and excise duty. All of the incentives assist a reduction in
the initial operating costs of the plant.
2.6.4 Characteristics of potential locations
The plant should be located in special zones set by the government. Three main locations have
been considered as strategic and feasible locations for the plant:
1. Kerteh Integrated Petroleum Complex, Terengganu
2. Gebeng Industrial Estate, Kuantan, Pahang
3. Pasir Gudang Industrial Estate, Johor
Evaluation for each location is summarized in the following tables:

22
Table 2.11: Comparison of Potential Industrial Area
Selection Criteria Kerteh Integrated Petroleum
Complex
Gebeng Industrial Estate Pasir Gudang Industrial
Estate
Main city Paka (5 km) Kuantan (30 km) Johor bahru (36 km)
Land price
(per m2)
RM2.00 to RM60.30 RM32.30 to RM118.40 RM88.10 to RM 236.80
Land availability
(Area )
± 2000.00 acres ± 1618.78 acres ± 44.16 acres
Raw material
Supplier
Optimal Glycol (M),
Kerteh
Amoco Chemicals (M),
Gebeng
Optimal Glycol (M),
Kerteh
Amoco Chemicals (M),
Gebeng
Optimal Glycol (M),
Kerteh
Amoco Chemicals (M),
Gebeng
Power Supply
Tasik Kenyir
Hydroelectric Dam
IPP YTL (600 MW)
Paka Power plant (900
MW)
CUF Kertih
Tanjung Gelang TNB
(1200MW),
CUF Gebeng (42MW)
Sultan Iskandar Power
Station (644 MW)
IPP YTL Power
Generation Sdn. Bhd.
Water Supply Bukit Sah
Sungai Cherol
Sungai Kemasik
CUF Gebeng
Loji Air Semambu
CUF Gebeng
Loji Air Sungai Layang
Syarikat Air Johor
Loji Air Sungai Buluh
Roadways Karak highway
(KT-Kuantan-KL)
East-West highway
(federal road KT-
Kerteh-Telok Kalung-
Gebeng-Kuantan-KL)
Karak highway
(KT-Kuantan-KL)
East-West highway
(federal road KT- Kerteh-
Telok Kalung-Gebeng-
Kuantan-KL)
Federal highway
(Bukit Kayu Hitam-Singapore)
Pasir Gudang
(Kim Kim River)
highway from Pasir
Gudang-Tanjung
Kupang-Tuas Singapore

23
Selection Criteria Kerteh Integrated Petroleum
Complex
Gebeng Industrial Estate Pasir Gudang Industrial Estate
Port Kerteh port (5 km)
Kemaman port (30 km)
Kuantan port (5 km) Johor port
Railway facilities Kuantan-Kerteh Railway Kuantan-Kerteh Railway Singapore and North
Peninsular Malaysia
Incentives
Infrastructure Allowance.
Five-year exemption on
import duty.
5 % discount on monthly
electrical bills for first 2 years.
25-38 % exemption on daily
water cost for 4545
m3 of water
Pioneer Status and Investment
Tax Allowance and
Reinvestment Allowance.
Incentives for high tech
industries
Infrastructure Allowance.
Five-year exemption on import
duty.
5 % discount on monthly
electricity bills for first 2 years.
85% tax exemption on gross
profit
Pioneer Status and Investment
Tax Allowance and
Reinvestment Allowance.
Incentives for high tech
industries
Incentive for exports
Incentives for research
development
Incentives for training tariff
protection
Exemption from import duty
on direct raw
materials/components
Pioneer Status and
Investment Tax Allowance
and Reinvestment
Allowance.
Incentives for high tech
industries
Waste water
management Effluent Treatment Plant of
CUF
Kualiti Alam Sdn Bhd
Indah Water Konsortium
Effluent Treatment Plant of
CUF
Kualiti Alam Sdn Bhd
Indah Water Konsortium
Effluent Treatment Plant of
CUF
Kualiti Alam Sdn Bhd
Local people
(15-30 years old)
650 000 peoples 350 000 peoples 500 000 peoples
(Reference: Malaysia Industrial Development Authority, 2010)

24
Table 2.12: Weighted Marks and Explanation on the Plant Site Location Factors
Factors 0-1 Marks 2-3 Marks 4-5 Marks
Supply of feedstock Incapable to obtain feedstock from
close sources with the distance
exceeding 80km.
Forced to import from foreign
countries.
Uses a pipeline system as well.
Source of raw materials from
neighbouring states or countries
with the distance not exceeding
80km.
Uses a pipeline system as well.
Able to obtain large supply
locally thus saving on import
cost.
Having long pipeline
networks for the
transportation of raw
materials.
Land price and size Land area below 500 acres
Price of land exceeds RM30/m2
Land area below 1000 acres
Price of land exceeds RM 20/m2
Land area exceeding 1000
acres
Price of land less than RM
20/m2
Local Government
Incentives No incentives from the Local
Organization of Country
Development.
Incentives from the Local
Organization of Country
Development.
Incentives from the Local
Organization of Country
Development
Incentives from special
company
Transportation Average road systems
No close highway or expressway
system
No railway system.
Very distant from the ports and
airports
Good federal road and highway
systems
Limited railway system access
More distant from the ports
Airport facilities which may not
have international flight facilities
– only providing domestic
flights.
Complete network and well
maintained highways,
expressways and roads.
International Airport
facilities access to the main
locations around the world.
Location near to
international port with
import and export activities.
Reliable railway lines to
remote areas not accessible
by roads.

25
Table 2.13: Weighted Table Comparison
According to the weighted evaluation done, Gebeng Industrial Estate has maximum scores.
Hence, it has been chosen as the strategic location for the production plant of Ammonia due to a
few reasons as listed below:
i) Gebeng Industrial Estate is situated at East coast of peninsular Malaysia and it is
only 25 km from Kuantan city and 5 km from Kuantan Port. Any trade involving
the import and export of products and, if necessary, raw materials can be achieved
with relative ease.
ii) Raw materials required in large quantities, which is natural gas from PGB with
high purity of methane.
iii) Kuantan Port has centralized tankage facilities, pipeline and pipe rack system
connecting Gebeng to Kuantan Port, container and bulk liquid port and railway
linking Kerteh, Gebeng and Kuantan Port.
iv) Existence of all major transportation networks to the proposed plant location
offers wider range of marketability options, locally or internationally.
Selected Site Gebeng Industrial
Estate
Pasir Gudang
Industrial Estate
Kerteh Petrochemical
Integrated Complex
Types of Industrial 5 5 5
Price and Land Areas 4 3 5
Raw Material Sources 4 3 3
Transportation 4 4 3
Utilities 5 4 4
TOTAL MARKS 22/25 19/25 20/25
PERCENTAGES (%) 88 76 80
RANKING 1 (Selected) 3 2

26
v) Strategically located in the heart of South East Asia, one of the world‟s fastest
growing economic regions, where Kuantan Port allows for ease of transportation
all over the world with all year round deep-water seaport.
vi) Constant supply of utilities such as cooling water, power supply, steam and waste
management.
o Power supply: CUF Gebeng (42MW) & Tanjung Gelang TNB (1200 MW)
o Water supply: CUF Gebeng, Semambu Water Treatment Plant
o Waste management: Effluent Treatment Plant of CUF Kualiti Alam Sdn Bhd &
Indah Water Konsortium
vii) Inexpensive cost of land and availability of vacant site for construction and
expansion.
The map of Gebeng Industrial Estate is shown in the Figure 2.3.
Figure 2.3: Gebeng Industrial Area Map

27
CHAPTER 3
3.0 CONCEPTUAL DESIGN AND SYNTHESIS
3.1 Hierarchial Decomposition Approach
From to Douglas‟ (1988) formulation of a decision hierarchy as a set of levels to guide the
selection of process alternatives, the levels are classified according to the following process
decisions:
Level 1: Batch versus Continuous
Level 2: Input–output structure of the flowsheet.
Level 3: Recycle structure of flowsheet
Decision 1. Reactor performance
Decision 2. Reactor operating conditions: (1) concentration, (2) temperature, (3)
pressure, (4) phase, (5) catalyst
Decision 3. Reactor configuration: reactor volume (capacity of reactor i.e., input and
output flow rates, orientation, and configuration;
Level 4: Separation system synthesis
Decision 1. Types of separators: type of suitable separators.
Decision 2. Sequencing of separators (for homogeneous mixtures): how are the
separators arranged? (sequencing of distillation columns)
Decision 3. Operating conditions: (a) temperature, (b) pressure, (c) concentration
Level 5: Heat exchanger network

28
3.2 Level 1 – Continuous or Batch
In the process of choosing between continuous or batch plant process, Douglas highlights three
main criteria in the decision making process which are production rates, market forces and
operational problems. The table below summarizes continuous or batch process decision making
basis.
Table 3.1: Comparison between Batch and Continuous Flow
Criteria Batch Continuous Decision and Reasoning
Production
Rates
Plant capacity less than 1x10⁶
lb/yr
Plant capacity greater
than 10x106 lb/yr
Plant capacity is 8.1 x 10⁹
lb/yr
Market
Forces
For seasonal product For yearly production Ammonia is in high demand
throughout the year
Operational
Problems
For slow reaction. For fast reaction. Economical ammonia
production requires a fast
reaction rate to produce the
required amount
Proposed plant concept required more than 10x106 lb product per year with high demand of
product in the market and fast reaction rate to produce required and substantial amount for
economical production. All criteria required the process to be in continuous flow and neglect the
selection of batch process. As a conclusion, continuous type of process is selected.
3.3 Level 2 – Input-Output Structure
3.3.1 Purifications of Feed
Feed purification process is considered as preprocess purification system. It certainly involved
cost in capital and operations but it is best to considered it in long term planning especially with
the case of high impurities in available feed source. More purified feed certainly cost more than
the less pure feed and installation of feed purification system is one of the way to reduce cost in
raw material purchase by producing own in-house purification process.
However, the available feed source of natural gas for the designated plant is quite pure. The feed
is already processed and purified at a natural gas plant where impurities such as mercury and
sulfur are already removed. The composition of the natural gas which is the main feed is

29
comprised of 95% methane, 3% ethane and 2% propane. Therefore there is no need for further
purification.
Figure 3.1: Input Output Structure
3.3.2 Reactants Recycle Streams
By recycling the unreacted reactant back to reactant input, the fresh reactant requirement will be
less thus reducing the raw material cost. Adhering to these guidelines to reduce those cost, the
unreacted hydrogen and nitrogen gas from the ammonia reactor is fed back to the mixer before
the ammonia reactor so that the unprocessed reactants are not wasted.
3.3.3 Number of Products Streams
The number of products streams option being evaluated as to adhere the common sense in design
guideline that it is never advantageous to separate two streams and then mix them together. It is a
good practice to list down the components and assigned each to a destination code. It will ease
latter work on separations system to identify best separation flow and sequence to practice.
Table 3.2: Input Output Condition
Component Boiling Point (oC) Destination code
Ammonia -33.34 Primary Product
Hydrogen -252.87 Recycle
Nitrogen -210.00 Recycle

30
Water 100.00 Waste
Carbon Dioxide -57.00 Waste
By considering the input-output structure, it gives clear indication on the required decision on
both input and output structure. Efficient input-output structure certainly proves to reduce raw
material consumption and improved the output flow structure.
3.4 Level 3 - Reactor Design and Recycle Structure of Flowsheet
Reactor design and recycle structure of flowsheet is one step ahead from Level 2 – Input Output
Structure. In this level, there are several factors that should be highlighted and discussed in order
to come up with the best decisions. Factors or questions that help the decisions making for
recycle structure of the flowsheet are:
1. How many reactor systems are required? Is there any separation between the reactor
systems?
2. How many recycle streams are required?
3. Do we want to use an excess of one reactant at the reactor inlet?
4. Is a gas compressor required? What are the costs?
5. Should the reactor be operated adiabically, with direct heating or cooling, or is a diluent
or heat carrier required?
6. Do we want to shift the equilibrium conversion? How?
7. How do the reactor costs affect the economic potential?
To achieve good reactor performance is the highest importance in deciding the most economical
and feasible design which is also vital towards the environment impact of the process. Among
the issues to consider for good reactor design are:
1. Reactor type selection
2. Catalyst selection
3. Reactor operating conditions (Concentration, Temperature, Pressure, Phase)

31
It is very important in selecting the suitable reactor, so that the feed can be optimized. From the
Douglas approach, guidelines for selecting the best reactor design are given. It is stated that the
reactor that always maintains the highest concentration could maximize the conversion of the
feed. A reactor type is necessary to select for the ammonia production. Below is the table
comparison for reactor type.
Table 3.3: Comparison Between CSTR and PFR
CSTR PFR
Characteristics Runs at steady state with
continuous flow of reactants
and products
Exit stream has the same
composition as in the tank
Primarily used for:
Liquid phase reaction
Steady state operation
Perfectly mixed reactions
Arranged as one long
reactor or many short
reactors in a tube bank;
concentration changes with
length down the reactor
Primarily used for:
Gas phase
Usages Continuous production
Suitable for agitating
processes
Series configurations for
different concentration
streams
Continuous production
Large scale
Fast reactions
Homogenous and
heterogeneous reactions
High temperature
Advantages Uniform temperature
throughout the reactor
because of perfect mixing
Easily adapts to two phase
runs
Low operating cost
Easy to clean
High conversion per unit
volume
Continuous operation
Heat transfer can be
optimized by using more
thinner tubes
Run for a long period of
time without maintenance
Residence time is the same
for all the reactants

32
Based on the characteristics, usages and advantages of the reactor, the reactor type selected for
ammonia production is PFR. PFR is primarily used for gas phase reaction where the designated
ammonia production is run in gas phase system. Besides, PFR is used for continuous production
and large scale of production where the designated ammonia plant is operated continuously
throughout the year and has large scale capacity which is 427,420 metric ton per year. PFR also
has its own usage particularly for high temperature reactions.
By using PFR as a selected reactor type, it gives a lot of advantages like high conversion per unit
volume, continuous operations; heat transfer can be optimized by using thinner tubes, run for a
long period of times without maintenance and residence time is the same for all reactants. These
advantages of PFR help ammonia production to be effective as what it should be since the
designated plant required large scale of production. Low temperature shift (LTS) converter needs
high conversion per unit volume, so it is clearly shows that PFR will be the best type of reactor
for the LTS.
There are six reactors required in ammonia plant which are:
Table 3.4: Reactions for Each Reactor
Reactor Reaction(s) Temperature
(oC)
Pressure
(bar)
Primary Reformer CH4 + H2O 3H2 + CO
C2H6 + 2H20 5H2 + CO
C3H8 + 3H2O H2 + 3CO
502 39.32
Secondary Reformer CH4 + 1.5O2 2H2O + CO
CH4 + H2O 3H2 + CO
H2O + CO H2 + CO2
438.9 38.64
High Temperature Shift
Converter
H2O + CO H2 + CO2 366.85 35.90
Low Temperature Shift
Converter
H2O + CO H2+ CO2 216.85 34.37
Methanator 3H2 + CO H2O + CH4 325 27.32
33
4H2 + CO2 CH4 + 2H2O
Ammonia Converter 3H2 + N2 2NH3 450 100
There is one recycle stream for this ammonia plant which is to recycle hydrogen and nitrogen in
order to achieve high conversion of ammonia. With the recycle stream, the production of
ammonia is absolutely higher compare to the non recycle system. Gas compressor is required in
ammonia plant to increase the pressure to achieve desired pressure for each reaction. Besides,
there are reactors that should be operated adiabatically in order to make sure there is no heat loss
to the surrounding.
3.5 Level 4 - Separation System Synthesis
Separation system is a system whereas mixed streams with two or more components are
separated. This is important as it can affect the process overall and also important in keeping the
product up to quality. In most process, the desired products from the reactors are always mixed
with byproducts and unreacted feed. Economically, this can affect the process since the feed is
not utilized fully and having unwanted byproducts can cause sales of product to go down.
Ammonia processes rely heavily on a good and efficient separation system. For instance, having
a good carbon monoxide and carbon dioxide removal system in the hydrogen synthesis section
helps protect the catalyst bed used in ammonia synthesis. Also, ammonia needs to be at 90%
purity and above in order for it to be marketable. Good separation systems will not only help in
purifying the ammonia, but also in recycling unreacted feed back into the reactor. This will
ensure maximum utilization of feed and reducing the amount of feed per product.
According to industrial practice, in industrial ammonia production, a system called the ammonia
synthesis loop has to be designed in order to capitalize fully on the hydrogen feed. The synthesis
loop is a network of reactor(s) and separators that is designed to recycle excess hydrogen from
the reactor. Some of the feed will of course have to be purged but mostly are recycled back into
the process and into the reactor as part of the feed. This is because ammonia reactors are known
34
to have low conversion of feed (20% - 30 %). And while nitrogen is fairly easy and free to get,
the same cannot be said for hydrogen.
In fact, the bulk of the ammonia process plant relies on the hydrogen synthesis. Therefore, losing
hydrogen as unreacted feed is unacceptable and economically deteriorating. In following the
industrial practices, this project will also utilize the ammonia synthesis loop, and therefore this
section will discuss further on the matter.
We know now that a separation system is required to optimize ammonia synthesis in the overall
process. But the question is how do we approach on designing the separation system? This can
be overcome by the three basic choosing criteria as per the general heuristics of separation
system, as listed below:
1. Type(s) of separators to be used.
2. Separator sequencing
3. Optimum operating conditions.
In summary, based on the outlet of the reactor, we need to decide the separator type we would be
using. The sequencing is based on the fact which stream has the vital component. The optimum
operating conditions are based on the physical properties of the components within the mixture.
All three criteria need to be fulfilled in order to achieve a good separation system.
Decision 1: Choosing Separator Types
Separators are differed mainly by the mixture they have to separate. Conventionally, there are
three types of mixture stream that are found in the industry. The mixture stream can either be all
vapor phase, a mixture of vapor and liquid phase or fully liquid phase. Solid phase are usually
not found in streams since solid phase cannot flow and can hinder the process overall.
For the ammonia process, the reactor effluent is mainly in vapor (gas) phase. In dealing with a
homogenous vapor mixture, there are a few methods that can be approached. We can either cool
the stream down, or pressurize the stream. Both will cause parts of the mixture components to
condense and a phase split can be achieved. This method is known as condensation. Other
methods include adsorption, absorption, membrane separation, and reaction systems. However,

35
since we want to reuse parts of the components in the mixture, adsorption, absorption and
reaction systems are not viable while membrane separation systems are complex and most are
still under research.
Therefore condensation method is the best for this process. This is achievable since ammonia,
the end product that we want can be easily condensed and since the other components are readily
gas even at room conditions. By considering the above factors, we can conclude that we would
be using condensers and horizontal separators in order to separate the desired product and
recyclable components.
Principal of Condensers and Flash Drum Separators
Condensers, as the name suggest, condense components in the vapor/gas phase that are readily
condensable at the given operating temperature and pressure. Our reactor effluent, consisting
mainly of ammonia, hydrogen, nitrogen and a little methane (0.1 PPM) is in vapor phase. Also,
in this case, ammonia, as the desired product, is easily condensed compared to other components
in the gas mixture.
Ammonia is also stored as liquid. Therefore, by condensing ammonia, we can create a two phase
mixture whereas the mixture can be separated via a phase split. Flash drum is one of the various
equipments that can be used to achieve the phase split. Flash drums are vessels that functions to
hold liquid-gas/vapor phase mixture together for a certain retention time to allow separation by
phase to occur. Reasons for choosing flash drum separators include the following:
a) Easiest method of separating liquid and vapor phase
b) Easy to operate
c) Widely used in industry to separate liquid and vapor phases
d) Easy to design
Basic Equipment Operation and Terminology
Condensers are simple heat exchangers meant to cool down the reactor effluent. This will cause
condensation to occur, leading to the formation of a heterogeneous mixture of liquid and
vapor/gas. Since hydrogen is not easily condensable, the condenser will be set as to condense
36
ammonia instead. This is also very convenient for our process since ammonia is usually
marketed in liquid phase. To achieve this condensation, a cooling liquid will be introduced into
the system to cool down the ammonia-hydrogen mixture. Afterwards, this heterogeneous mixture
will enter the flash drum to be separated by phase.
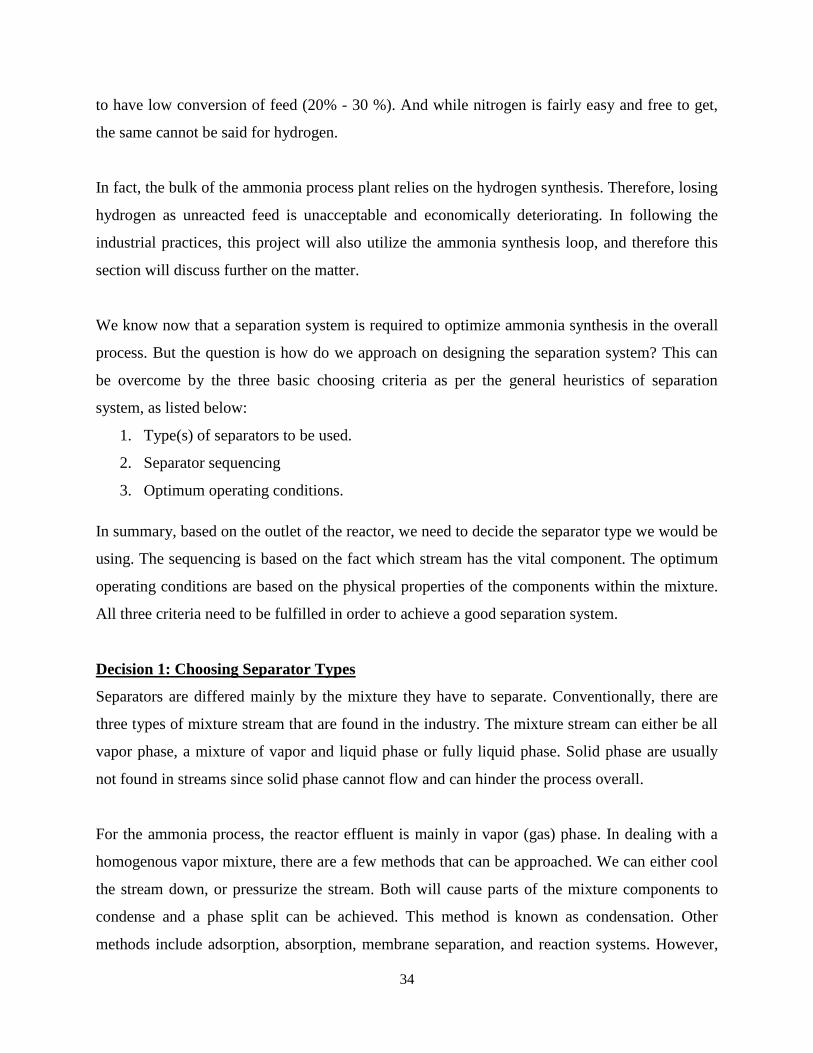
Flash drums operations are based on gravitational separation. Simply saying, the separation will
occur in such a way that the liquid, having higher density, will settle at the bottom of the vessel
whereas gas/vapor will move upwards towards the bottom. This is the simplest and easiest
method of separating a heterogeneous stream. In order to allow the separation to be optimum, the
liquid phase will have to be hold within the vessel for some time. This holding time is known as
the retention time. The retention time is to allow any gas/vapor that may have been trapped
within the liquid phase to be completely released. In other words, a suitable retention time is
needed for the heterogeneous mixture to reach phase equilibrium.
For our design, the reactor effluent mixture mainly consisting of ammonia and hydrogen, in
vapor phase, is to go through a condenser. The condenser will operate at such operating
conditions that it will cause the ammonia in the mixture to condense and form a heterogeneous
phase. This heterogeneous mixture will then enter the flash drum separator where separation will
then occur.
Figure 3.2: Flash Drum Separator

37
Decision 2: Separator Sequencing
Separators have mainly two types of sequencing: direct and indirect. Direct sequences are when
two or more separators are placed in sequence along the bottom side of the previous separator.
This sequence is preferred if the desired component exits in liquid phase and needed to be
purified or the component needs recovered. Indirect sequence is the opposite of direct
sequencing. Indirect sequencing places the next separator at the top exit of the previous
separator. Just as with direct sequencing, indirect sequencing is preferable when the desired
component is in gas/vapor phase.
Separator sequencing is especially important when there is a mixture containing three major
components, in which separating needs to be done in two or more columns. Also, considering
other factors like azeotrope mixtures, more complex heuristics will have to be applied in
deciding the sequence of separators.
Figure 3.3: Sequencing of Separators; (a) Direct Sequencing and (b) Indirect Sequencing
The target of this separation is mainly to recover ammonia from the reactor. For our ammonia
synthesis, however, the major components are only two, which is ammonia as the desired
product, and hydrogen, as the recyclable feed. Therefore, separation sequencing is not really
needed. However, in the case of ammonia not reaching the needed purity to be sold, a second

38
separator will have to be placed in direct sequence to the first one, since ammonia will be exiting
as liquid.
The purity of hydrogen as recycled feed can usually be neglected unless hydrogen reenters the
reactor with components that are poisonous towards the catalyst. In our ammonia synthesis, no
such component exist which is why no extra separation is needed to purify hydrogen.
Decision 3: Optimum Operating Conditions
The optimum operating conditions will be based on the physical properties of ammonia and
hydrogen. Since we would want ammonia to condense first before entering the flash drum, we
would first have to set the cooling temperature to the condensing temperature of ammonia at the
said pressure. Operating pressure also plays an important part as it affects hydrogen solubility
into aqueous ammonia plus the partial vapor pressure. In order to have low solubility, a low
pressure is preferred. However, this would ultimately result in the recycled hydrogen to be
compressed before reentering the feed stream.
In terms of sizing and designing, flash drums do not require tray numbers and spacing, unlike
distillation columns. This means that we would need only to determine the diameter and the
height of the vessel. We do need to determine the retention time, however. This shows that the
retention time will determine the vessel‟s capacity.
The efficiency of the flash drum separator is dependent on the retention time mainly. Therefore,
the main parameter would be the retention time itself. Based on a literature, the retention time for
the flash drum in the ammonia synthesis is around 10 minutes, which is the normal retention
time for most flash drums in the industry.
The flash drum separator is also set so as it is nominally half-full with liquid, another common
practice of the industry. These settings are normal settings for flash drums, and will be used as
assumptions to ease designing the flash drum. These assumptions are made based on the basis of
common industrial practices in ammonia synthesis, and are considered to be reliable.

39
Below are the operating conditions of the condenser flash drum. Note that the sizing and design
are not included in this report.
*Two condensers are needed since the temperature drop is very high (236°C to -20°C)
Condensers Operating Conditions
Condenser 1
Parameter Value/Item
Duty (kcal/hr) 3711.632
Coolant Cooling Water
Temperature Drop, ΔT
(°C)
202. 6
Outlet Temperature (°C) 30
Condenser 2
Parameter Value/Item
Duty (kcal/hr) 463
Coolant Ammonia
Refrigerant
Temperature Drop, ΔT
(°C)
50
Outlet Temperature (°C) -20
Flash Drum Operating Conditions
Parameter Value/Item
Temperature (°C) -20
Pressure (bar) 25
Retention Time
(minutes)
10
Liquid Level Half-full
3.6 Level 5 – Heat Exchanger Network
Heat integration emphasizes on energy conservation which is very crucial in process designing.
Heating and cooling duties for heat recovery system are done after the acceptance of major
processing steps (reactors, separators and recycles). ). Targets can be set for the heat exchanger
network to assess the performance of complete process design. These targets allow both energy
and capital cost for heat exchanger network to be assessed. The energy used during heating and
cooling process is maximized to its full potential by using pinch analysis.
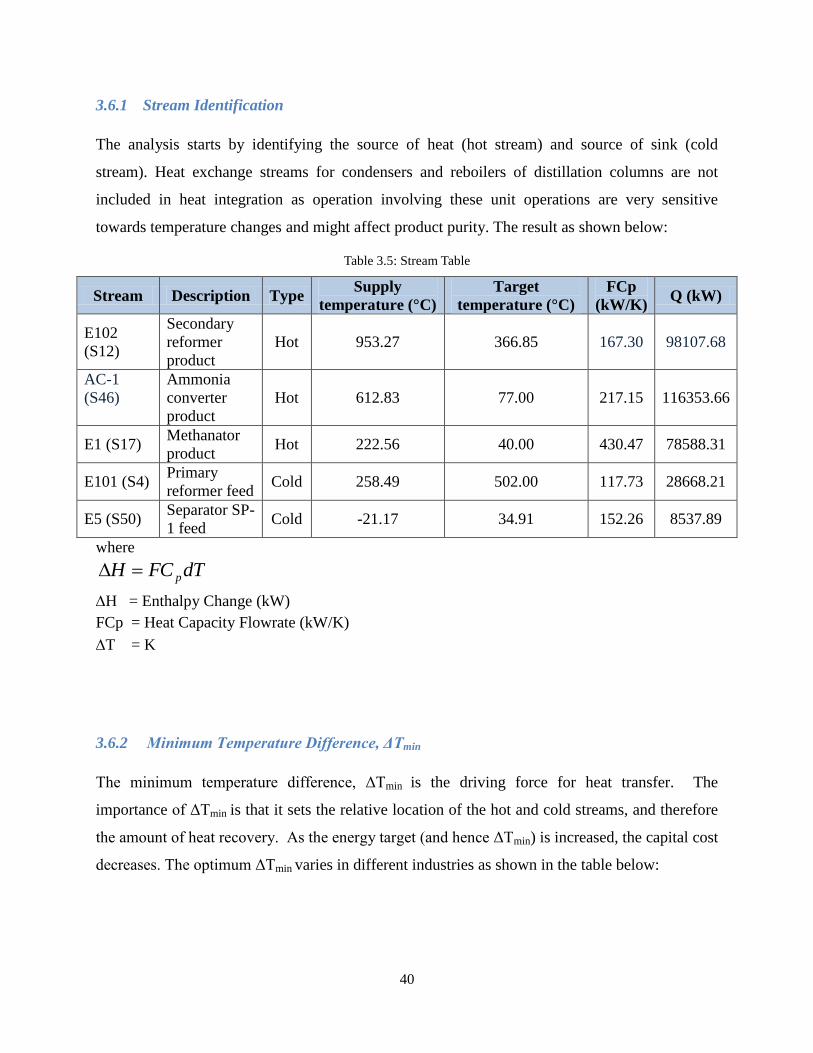
40
3.6.1 Stream Identification
The analysis starts by identifying the source of heat (hot stream) and source of sink (cold
stream). Heat exchange streams for condensers and reboilers of distillation columns are not
included in heat integration as operation involving these unit operations are very sensitive
towards temperature changes and might affect product purity. The result as shown below:
Table 3.5: Stream Table
Stream Description Type Supply
temperature (°C)
Target
temperature (°C)
FCp
(kW/K) Q (kW)
E102
(S12)
Secondary
reformer
product
Hot 953.27 366.85 167.30 98107.68
AC-1
(S46)
Ammonia
converter
product
Hot 612.83 77.00 217.15 116353.66
E1 (S17) Methanator
product Hot 222.56 40.00 430.47 78588.31
E101 (S4) Primary
reformer feed Cold 258.49 502.00 117.73 28668.21
E5 (S50) Separator SP-
1 feed Cold -21.17 34.91 152.26 8537.89
where
dTFCH p
H = Enthalpy Change (kW)
FCp = Heat Capacity Flowrate (kW/K)
T = K
3.6.2 Minimum Temperature Difference, ΔTmin
The minimum temperature difference, ΔTmin is the driving force for heat transfer. The
importance of ΔTmin is that it sets the relative location of the hot and cold streams, and therefore
the amount of heat recovery. As the energy target (and hence ΔTmin) is increased, the capital cost
decreases. The optimum ΔTmin varies in different industries as shown in the table below:

41
Table 3.6: Optimum Delta T min for Industrial Sector
Industrial sector Optimum ΔTmin
values (oC)
Remarks
Oil refining 20 – 40
Relatively low heat transfer coefficients, parallel
composite curves in many applications, fouling
of heat exchangers
Petrochemical 10 – 20
Reboiling and condensing duties provide better
heat transfer coefficients, low fouling
Chemical 10 – 20 As for petrochemicals
Low temperature
Processes 3 – 5
Power requirement for refrigeration system is
very expensive. ΔTmin decreases with low
refrigeration temperatures
Source: Pinch Analysis Foundation Training Course (1997)
As production of ammonia is in petrochemical industries, ΔTmin of 10oC is chosen.
3.6.3 Pinch Technology Method
Pinch Technology Method is used to determine the energy requirement from the process and the
amount of energy recovery. This section will analyze how to calculate the amount of energy for
the process by constructing composite curves to set energy target or develop the problem table
algorithm and heat cascade diagram. Composite curves are useful in providing the conceptual
understanding of the process but the problem table algorithm is a more convenient calculation
tool.
The term Pinch Analysis is been used correspond to application of the tools and algorithms of
Pinch Technology related in industrial process. The application of First and Second Law of
Thermodynamics determine the direction of Pinch Analysis application. Heat energy only flows
in the direction of hot to cold. This prohibits the temperature crossovers of the hot and cold
stream profiles through the exchanger unit. There is two main important things in dealing with
transfer of heat between hot and cold stream which are, heat load and temperature. The minimum
heat load between the two streams is selected when comparing their value while in a heat
exchanger unit a hot stream cannot be cooled below cold stream supply temperature nor a cold
stream can be heated to temperature more than hot stream supply temperature.
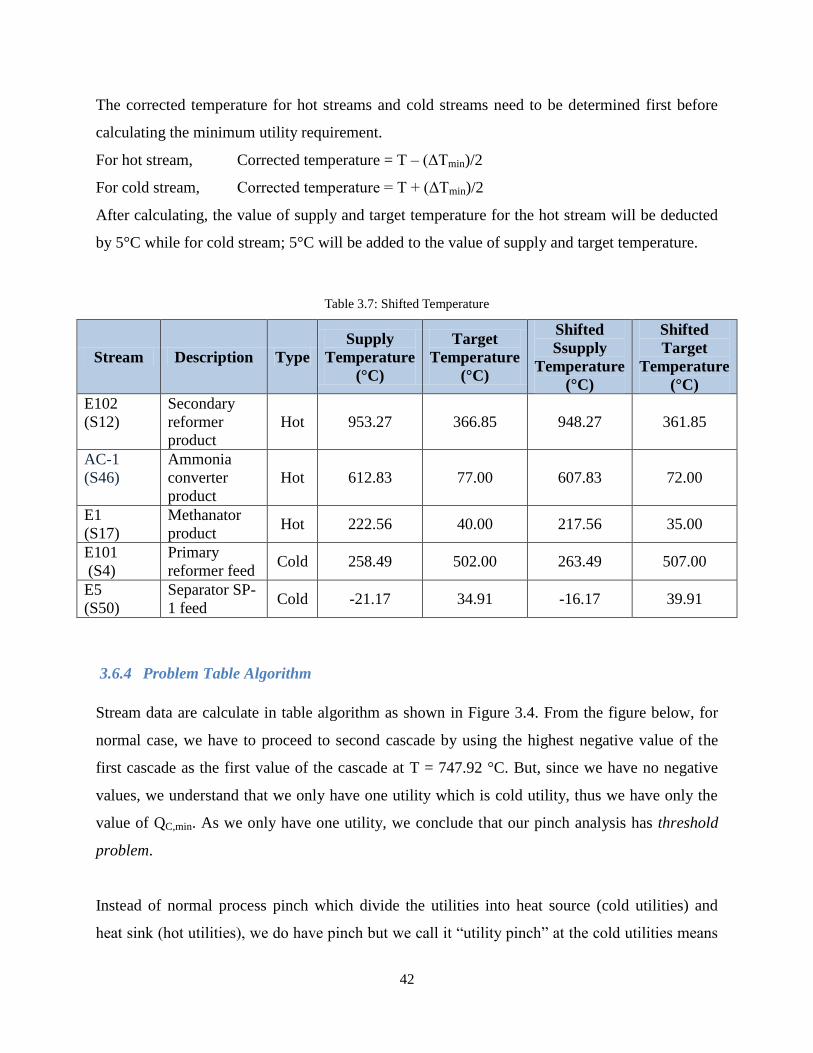
42
The corrected temperature for hot streams and cold streams need to be determined first before
calculating the minimum utility requirement.
For hot stream, Corrected temperature = T – (ΔTmin)/2
For cold stream, Corrected temperature = T + (ΔTmin)/2
After calculating, the value of supply and target temperature for the hot stream will be deducted
by 5°C while for cold stream; 5°C will be added to the value of supply and target temperature.
Table 3.7: Shifted Temperature
Stream Description Type
Supply
Temperature
(°C)
Target
Temperature
(°C)
Shifted
Ssupply
Temperature
(°C)
Shifted
Target
Temperature
(°C)
E102
(S12)
Secondary
reformer
product
Hot 953.27 366.85 948.27 361.85
AC-1
(S46)
Ammonia
converter
product
Hot 612.83 77.00 607.83 72.00
E1
(S17)
Methanator
product Hot 222.56 40.00 217.56 35.00
E101
(S4)
Primary
reformer feed Cold 258.49 502.00 263.49 507.00
E5
(S50)
Separator SP-
1 feed Cold -21.17 34.91 -16.17 39.91
3.6.4 Problem Table Algorithm
Stream data are calculate in table algorithm as shown in Figure 3.4. From the figure below, for
normal case, we have to proceed to second cascade by using the highest negative value of the
first cascade as the first value of the cascade at T = 747.92 °C. But, since we have no negative
values, we understand that we only have one utility which is cold utility, thus we have only the
value of QC,min. As we only have one utility, we conclude that our pinch analysis has threshold
problem.
Instead of normal process pinch which divide the utilities into heat source (cold utilities) and
heat sink (hot utilities), we do have pinch but we call it “utility pinch” at the cold utilities means

43
that we only have the heat source. Because we have threshold problem, we must make sure all
hot utilities under our pinch is fully utilizes which will be explained under heat exchanger
network.
Figure 3.4: Algorithm Table
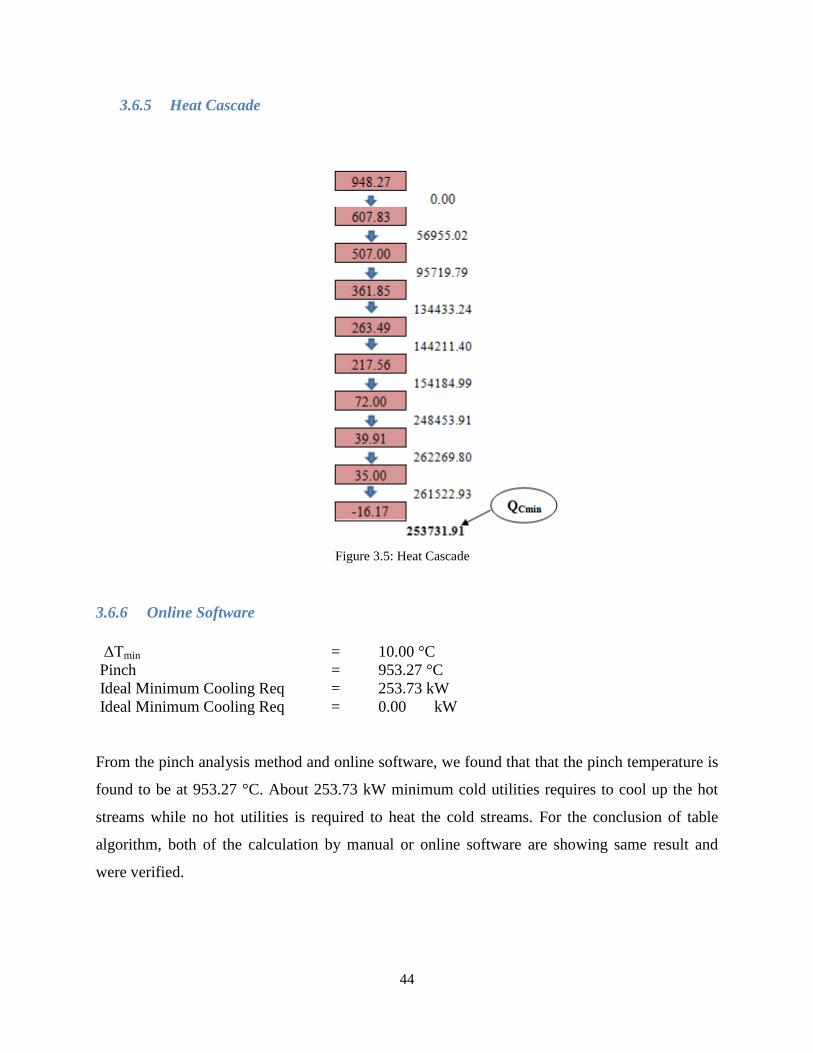
44
3.6.5 Heat Cascade
Figure 3.5: Heat Cascade
3.6.6 Online Software
ΔTmin = 10.00 °C
Pinch = 953.27 °C
Ideal Minimum Cooling Req = 253.73 kW
Ideal Minimum Cooling Req = 0.00 kW
From the pinch analysis method and online software, we found that that the pinch temperature is
found to be at 953.27 °C. About 253.73 kW minimum cold utilities requires to cool up the hot
streams while no hot utilities is required to heat the cold streams. For the conclusion of table
algorithm, both of the calculation by manual or online software are showing same result and
were verified.

45
3.6.7 Composite Curve by Sprint
Assumption made in constructing the composite curve is that all heat capacities for respective
streams are constant. It is represented on a T-H diagram by a line from stream supply
temperature to stream target temperature.
From figure, the red line indicates that the hot stream and blue line indicate the cold stream. Both
of the stream combined in a one graph to estimate the pinch temperature based on Tmin which is
equal to 10oC. Also, from this figure we can also indicate that we have only one major utility
which is the cold utility (hot stream) and therefore we only have the ideal minimum cooling
required, the enthalpy cold utilities QCmin .
3.6.8 Heat Exchanger Network
Pairing of streams is determined from the Maximum Energy Recovery (MER) method:
for the above pinch region, CPc > CPH
for the below pinch region, CPH > CPc
Heat Exchanger Network Diagram shows how the heat transfers operations. Hot streams run
from the left to the right and cold streams run from right to the left. A heat exchanger
transferring heat between the cold and hot streams are indicated by a vertical line connecting two
Figure 3.6: Combined Composite Curve from Online Software

46
circles on the two matched streams.
Figure 3.7: Heat Exchanger Network
From the figure, we can state that, we can only paired two streams thus only one heat exchanger
use to fully utilize cold stream. For heat exchanger E101; we match the stream S4 (cold) and S12
(hot) where the energy of 28668.21 kW from heater E101 is used to partially cool the hot stream
from cooler E102 from 953.27°C to 788.37°C.
By this heat exchanger network, we have fully utilizes all our hot utilities resulting in energy
recovery of 57336.42 kW or 14.45% of utility recovery.

47
CHAPTER 4
4.0 INSTRUMENTATION AND CONTROL
4.1 Introduction
For a plant to make profit, the quality of the product and the rate it is produced needs to be
controlled. By producing a high quality product at the lowest product cost, the profit can be
maximized. In a plant the factors that control the quality of a product, in this case it is ammonia,
are the temperatures and pressure which controls the conversion of the reactants. The ammonia is
then purified further through several flash vessels and a stripper. For each equipment there are
certain variables that influence the quality and rate of production, which needs to be controlled in
order to produce products at a desirable rate and quality. This is why a control system is
required.
Other than controlling the quality and rate of production the control system also ensures safe
plant operation. A control system involves 4 variables which are the controlled, measured,
disturbance and manipulated variable. A feedback control system for example measures the
controlled variable, compares it to a set point then sends a signal to a manipulated variable which
changes a variable of the process affecting the controlled variables value. There are 3
equipment‟s involved in this process which is the transmitter, controller and final control
element. The transmitter sends the measured value to the controller which makes a decision and
implements the decision through the final control element which is normally a valve
manipulating flowrate or pressure.
The importance of a control system is as follows:
1. Maintaining safe plant operation
Keeping the variables in their tolerable and safe limits
Providing interlocks and alarms to warn and prevent dangerous operating conditions
Avoid unnecessary shutdowns
2. Controlling the quality of the product
Keeping the process variables at the desired value to maintain product quality
3. Controlling the throughput

48
Keeping the process variables at the desired value to maintain product throughput
4. Keeping production cost low
To keep production costs low
Optimize the use of utilities such as steam and cooling water to keep costs low
4.2 Basic Control Strategies
4.2.1 Feedback Control Strategy
Figure 4.1: Feedback Control
In a feedback control strategy, the controlled variable is measured and compared to a set point,
which in the case of any deviations is corrected by the controller. The control action is
implemented through the final control element. In the feedback control , the controlled variable
is always measured and compared against the set point or reference, thus creating a loop. The
feedback control strategy is the most widely used control system due to its simplicy, impying
that is does not require a process model.
4.2.2 Feedforward Control Strategy
Figure 4.2: Feedforward control

49
The feedforward is different from the feedback in the measured variable, the feedback measures
the controlled variable where as the feedforward measures the disturbance variable affecting the
controlled variable. However, an accurate model of the process is required in order for the
feedforward controller to function properly, thus increasing costs. The advantage is that the
feedforward controller can take action before the controlled variable deviates from its setpoint.
4.2.3 Cascade Control
Figure 4.3: Cascade Control
The cascade control is essentially 2 or more feedback loops that is arreanged in a loop formation
as seen in figure 4.3. The cascade is used when there is a slow process interaction such as reactor
temperature changes. The cascade control improves control action time by taking and
intermediate measurement that has faster process dynamics and takes control action based on
that measurement. The cascade control is also used when the manipulated variable is also a
disturbance variable.
4.2.4 Ratio Control
Figure 4.4: Ratio Control
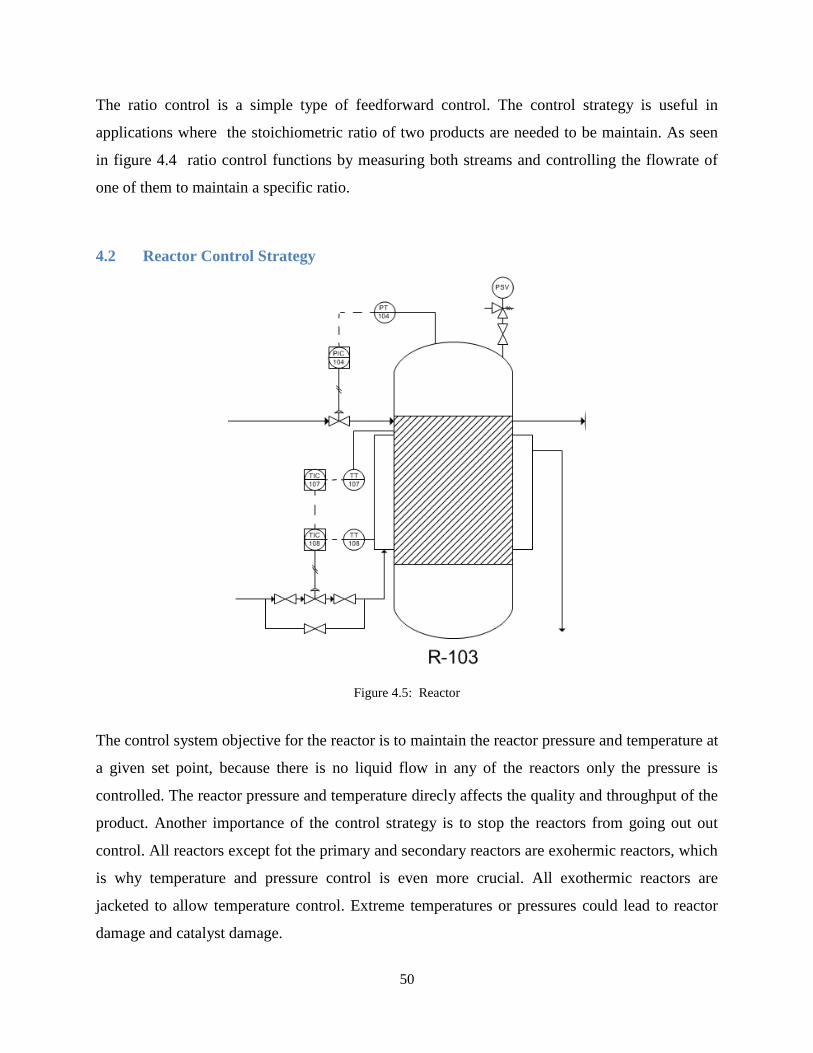
50
The ratio control is a simple type of feedforward control. The control strategy is useful in
applications where the stoichiometric ratio of two products are needed to be maintain. As seen
in figure 4.4 ratio control functions by measuring both streams and controlling the flowrate of
one of them to maintain a specific ratio.
4.2 Reactor Control Strategy
Figure 4.5: Reactor
The control system objective for the reactor is to maintain the reactor pressure and temperature at
a given set point, because there is no liquid flow in any of the reactors only the pressure is
controlled. The reactor pressure and temperature direcly affects the quality and throughput of the
product. Another importance of the control strategy is to stop the reactors from going out out
control. All reactors except fot the primary and secondary reactors are exohermic reactors, which
is why temperature and pressure control is even more crucial. All exothermic reactors are
jacketed to allow temperature control. Extreme temperatures or pressures could lead to reactor
damage and catalyst damage.

51
Table 4.1: Variable types
Controlled
Variable
Measured variable Manipulated
Variable
Disturbance
Variable
Controller
Type
Reactor
pressure
Reactor pressure Inlet stream
pressure
Inlet stream
pressure/Inlet
stream composition
Feedback
Reactor
temperature
Reactor
temperature/Jacket
temperature
Cooling water
flowrate
Inlet stream
temperature/Cooling
water
flowrate/Cooling
water temperature
Cascade
PIC-104
1. Control Strategy Used: Feedback control
2. Control Objective: To keep the reactor pressure at a desired set point
3. Control strategy concept: The reactor pressure is controlled by manipulating the inlet valve.If
the valve is opened, the reactor pressure will increase, if it is closed then the reactor pressure
will decrease.
TIC-107/TIC-108
1. Control Strategy Used: Cascade control
2. Control Objective: To keep the reactor temperature at a desired set point
3. Control strategy concept: Temperature control involves a slow process dynamics.Implying
that if no intermediate measurement is taken then the time taken to correct any process
variable devition will be lengthy.Which is why a cascade control strategy is chosen. TIC-107
will send a setpoint to TIC-108 which make a control decision based on the measured
cooling water flowrate.
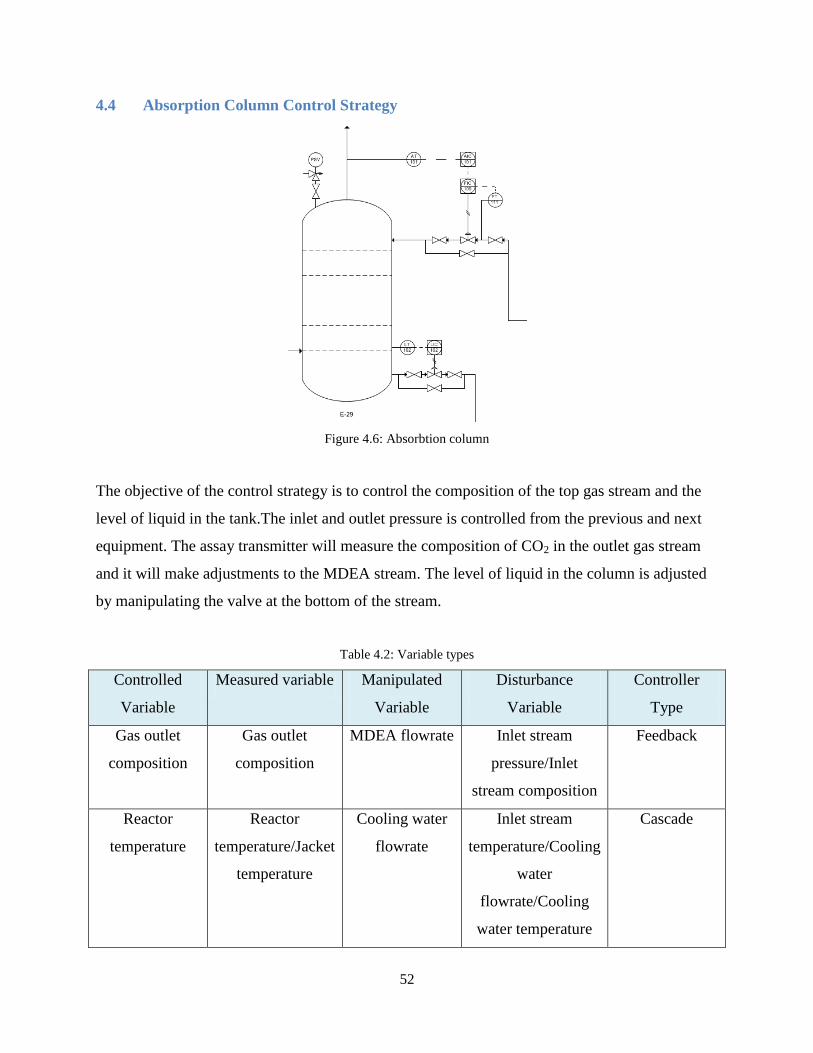
52
4.4 Absorption Column Control Strategy
Figure 4.6: Absorbtion column
The objective of the control strategy is to control the composition of the top gas stream and the
level of liquid in the tank.The inlet and outlet pressure is controlled from the previous and next
equipment. The assay transmitter will measure the composition of CO2 in the outlet gas stream
and it will make adjustments to the MDEA stream. The level of liquid in the column is adjusted
by manipulating the valve at the bottom of the stream.
Table 4.2: Variable types
Controlled
Variable
Measured variable Manipulated
Variable
Disturbance
Variable
Controller
Type
Gas outlet
composition
Gas outlet
composition
MDEA flowrate Inlet stream
pressure/Inlet
stream composition
Feedback
Reactor
temperature
Reactor
temperature/Jacket
temperature
Cooling water
flowrate
Inlet stream
temperature/Cooling
water
flowrate/Cooling
water temperature
Cascade
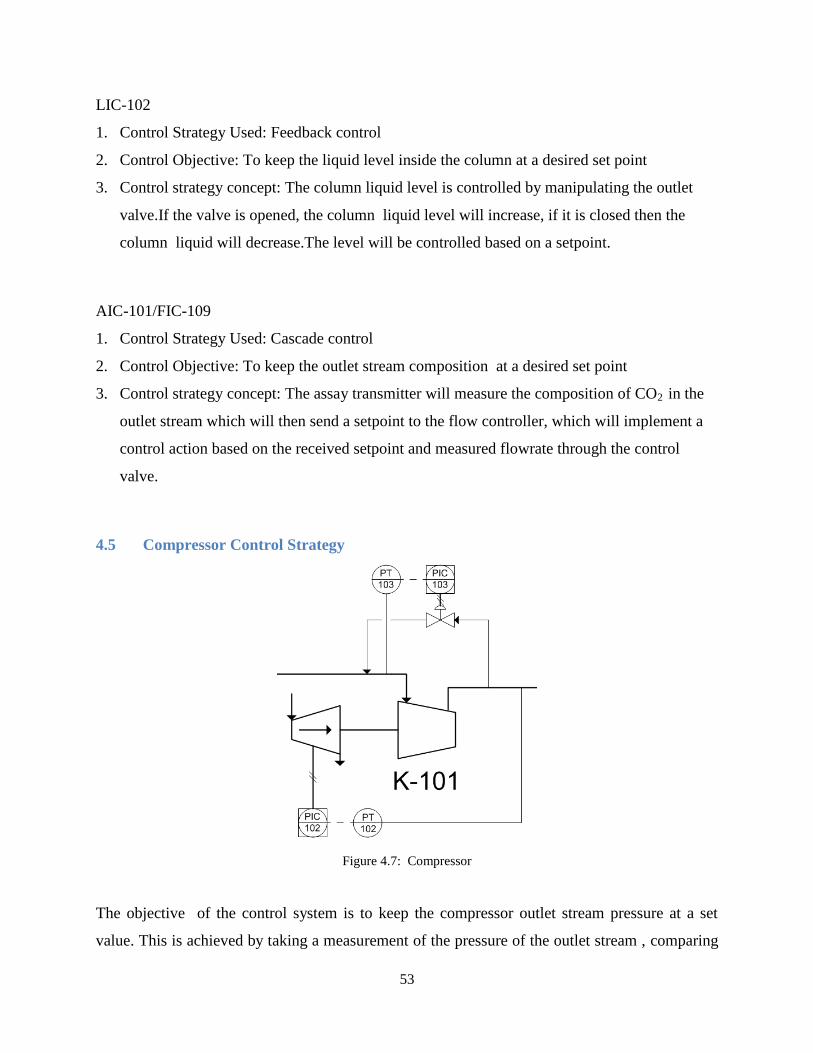
53
LIC-102
1. Control Strategy Used: Feedback control
2. Control Objective: To keep the liquid level inside the column at a desired set point
3. Control strategy concept: The column liquid level is controlled by manipulating the outlet
valve.If the valve is opened, the column liquid level will increase, if it is closed then the
column liquid will decrease.The level will be controlled based on a setpoint.
AIC-101/FIC-109
1. Control Strategy Used: Cascade control
2. Control Objective: To keep the outlet stream composition at a desired set point
3. Control strategy concept: The assay transmitter will measure the composition of CO2 in the
outlet stream which will then send a setpoint to the flow controller, which will implement a
control action based on the received setpoint and measured flowrate through the control
valve.
4.5 Compressor Control Strategy
Figure 4.7: Compressor
The objective of the control system is to keep the compressor outlet stream pressure at a set
value. This is achieved by taking a measurement of the pressure of the outlet stream , comparing
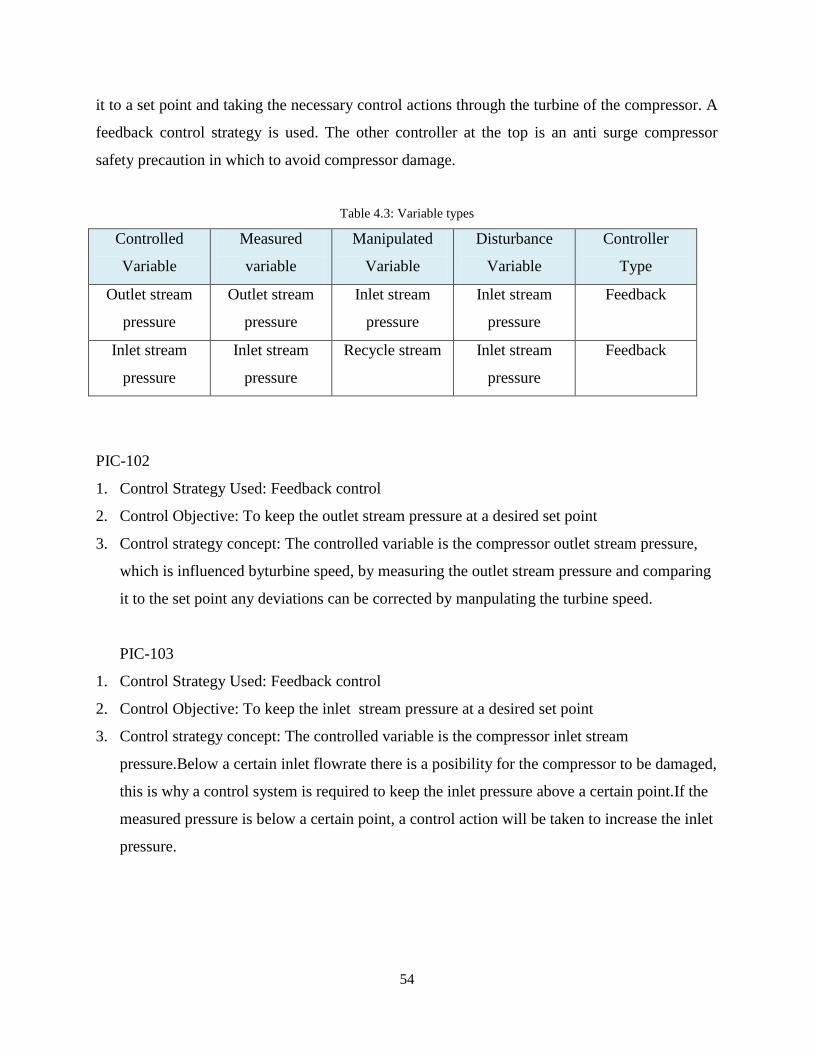
54
it to a set point and taking the necessary control actions through the turbine of the compressor. A
feedback control strategy is used. The other controller at the top is an anti surge compressor
safety precaution in which to avoid compressor damage.
Table 4.3: Variable types
Controlled
Variable
Measured
variable
Manipulated
Variable
Disturbance
Variable
Controller
Type
Outlet stream
pressure
Outlet stream
pressure
Inlet stream
pressure
Inlet stream
pressure
Feedback
Inlet stream
pressure
Inlet stream
pressure
Recycle stream Inlet stream
pressure
Feedback
PIC-102
1. Control Strategy Used: Feedback control
2. Control Objective: To keep the outlet stream pressure at a desired set point
3. Control strategy concept: The controlled variable is the compressor outlet stream pressure,
which is influenced byturbine speed, by measuring the outlet stream pressure and comparing
it to the set point any deviations can be corrected by manpulating the turbine speed.
PIC-103
1. Control Strategy Used: Feedback control
2. Control Objective: To keep the inlet stream pressure at a desired set point
3. Control strategy concept: The controlled variable is the compressor inlet stream
pressure.Below a certain inlet flowrate there is a posibility for the compressor to be damaged,
this is why a control system is required to keep the inlet pressure above a certain point.If the
measured pressure is below a certain point, a control action will be taken to increase the inlet
pressure.

55
4.6 Stripper Control Strategy
Figure 4.8: Stripper
The control objective of the stripper is to control the reflux ratio of the regenerated MDEA
solution, control the column temperature, pressure and liquid level. Several types of
controlstrategies are used to maintain the various variables at their setpoints.
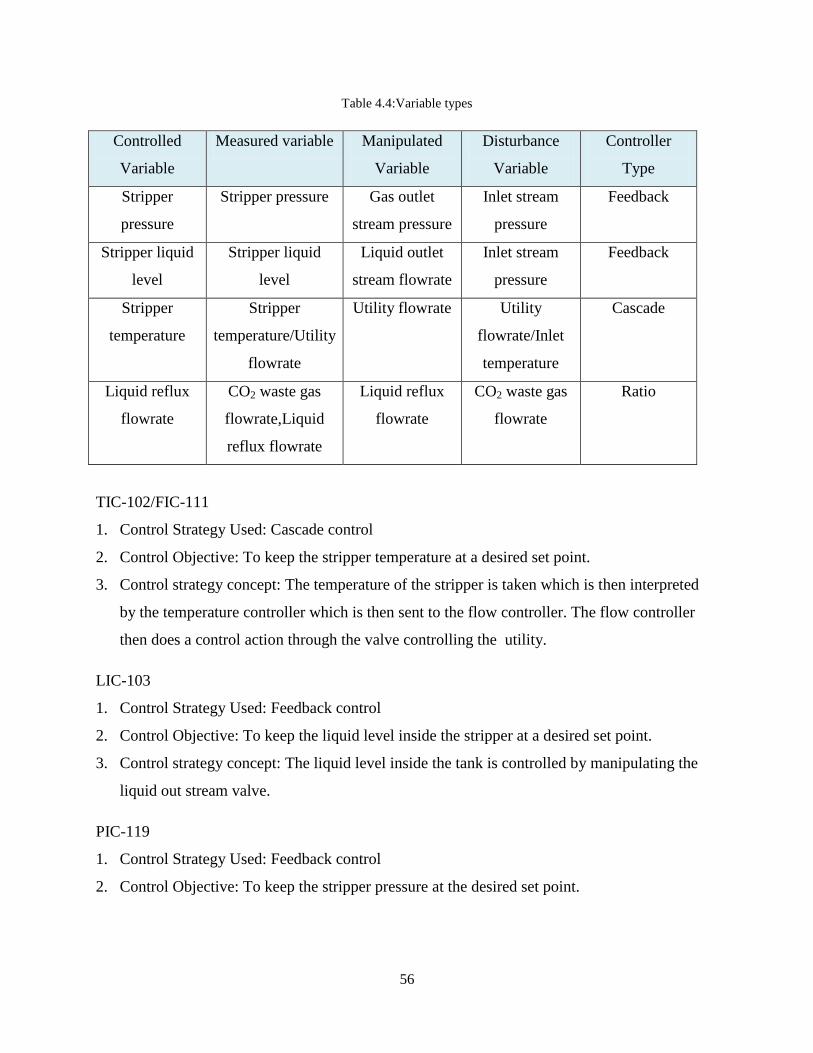
56
Table 4.4:Variable types
TIC-102/FIC-111
1. Control Strategy Used: Cascade control
2. Control Objective: To keep the stripper temperature at a desired set point.
3. Control strategy concept: The temperature of the stripper is taken which is then interpreted
by the temperature controller which is then sent to the flow controller. The flow controller
then does a control action through the valve controlling the utility.
LIC-103
1. Control Strategy Used: Feedback control
2. Control Objective: To keep the liquid level inside the stripper at a desired set point.
3. Control strategy concept: The liquid level inside the tank is controlled by manipulating the
liquid out stream valve.
PIC-119
1. Control Strategy Used: Feedback control
2. Control Objective: To keep the stripper pressure at the desired set point.
Controlled
Variable
Measured variable Manipulated
Variable
Disturbance
Variable
Controller
Type
Stripper
pressure
Stripper pressure Gas outlet
stream pressure
Inlet stream
pressure
Feedback
Stripper liquid
level
Stripper liquid
level
Liquid outlet
stream flowrate
Inlet stream
pressure
Feedback
Stripper
temperature
Stripper
temperature/Utility
flowrate
Utility flowrate Utility
flowrate/Inlet
temperature
Cascade
Liquid reflux
flowrate
CO2 waste gas
flowrate,Liquid
reflux flowrate
Liquid reflux
flowrate
CO2 waste gas
flowrate
Ratio
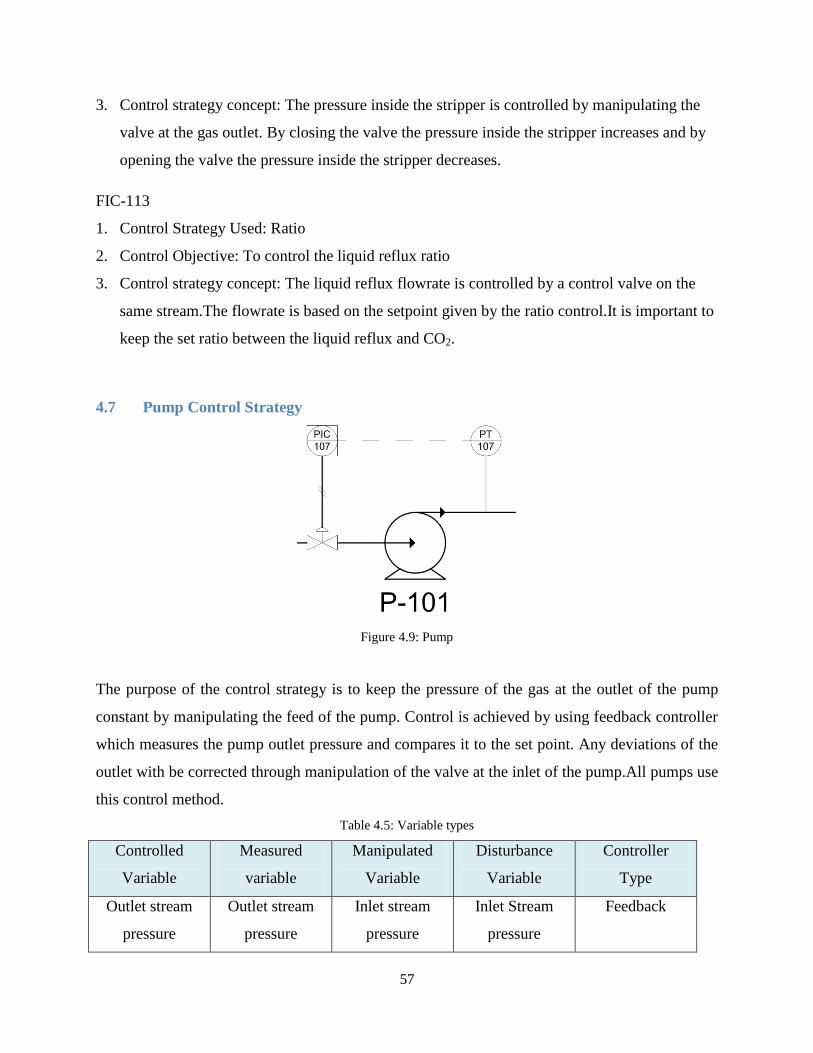
57
3. Control strategy concept: The pressure inside the stripper is controlled by manipulating the
valve at the gas outlet. By closing the valve the pressure inside the stripper increases and by
opening the valve the pressure inside the stripper decreases.
FIC-113
1. Control Strategy Used: Ratio
2. Control Objective: To control the liquid reflux ratio
3. Control strategy concept: The liquid reflux flowrate is controlled by a control valve on the
same stream.The flowrate is based on the setpoint given by the ratio control.It is important to
keep the set ratio between the liquid reflux and CO2.
4.7 Pump Control Strategy
Figure 4.9: Pump
The purpose of the control strategy is to keep the pressure of the gas at the outlet of the pump
constant by manipulating the feed of the pump. Control is achieved by using feedback controller
which measures the pump outlet pressure and compares it to the set point. Any deviations of the
outlet with be corrected through manipulation of the valve at the inlet of the pump.All pumps use
this control method.
Table 4.5: Variable types
Controlled
Variable
Measured
variable
Manipulated
Variable
Disturbance
Variable
Controller
Type
Outlet stream
pressure
Outlet stream
pressure
Inlet stream
pressure
Inlet Stream
pressure
Feedback
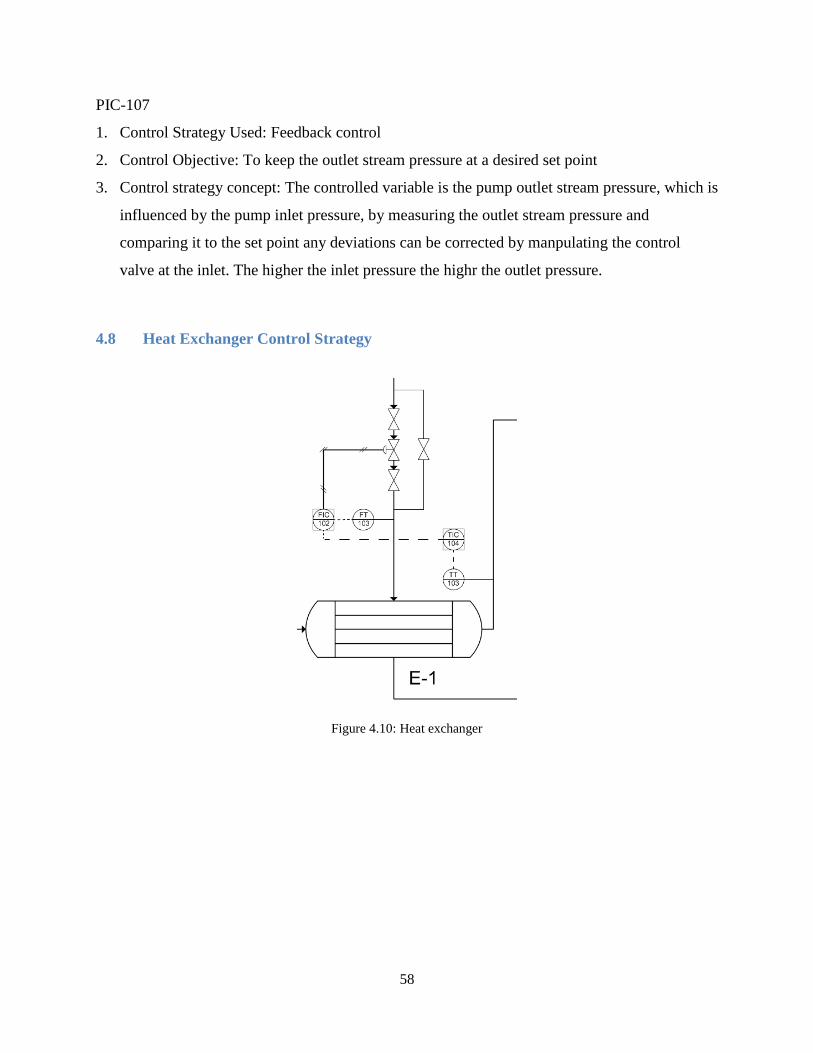
58
PIC-107
1. Control Strategy Used: Feedback control
2. Control Objective: To keep the outlet stream pressure at a desired set point
3. Control strategy concept: The controlled variable is the pump outlet stream pressure, which is
influenced by the pump inlet pressure, by measuring the outlet stream pressure and
comparing it to the set point any deviations can be corrected by manpulating the control
valve at the inlet. The higher the inlet pressure the highr the outlet pressure.
4.8 Heat Exchanger Control Strategy
Figure 4.10: Heat exchanger

59
Figure 4.11: Cooler
The objective of the control system is to keep the outlet temperature of the heat exchanger at a
certain setpoint.This is achieved by measuring the temperature of the outlet stream and
comparing it to a set point. An interpretation of the controller is then sent to a seconday
controller which makes a decision based on measurement of the ultility flowrate and takes
control action through the control valve. The control strategy used is the cascade control strategy.
The cascade control strategy is chosen because of the long process dynamics involved in
temperature control. The ultility flowrate may also become a disturbance variable, the cascade
control makes for a quicker control response. The cascade control strategy is used for all heat
exchangers, coolers and heater.
Table 4.6:Variable types
Controlled
Variable
Measured variable Manipulated
Variable
Disturbance
Variable
Controller
Type
Outlet stream
temperatre
Outlet stream
temperature/Utility
flowrate
Utility flowrate Inlet
temperature/Utility
flowrate
Cascade
TIC-104/FIC-102
1. Control Strategy Used: Cascade control
2. Control Objective: To keep the outlet stream temperature at a desired set point

60
3. Control strategy concept: The cascade control is used because of the long process dynamics
involved in temperature control and the utility used also being a distrubance variable. The
inner loop with the faster process dynamics does the control action on the final control
element.
4.9 Flash Vessel Control Strategy
Figure 4.12: Flash vessel
The flash vessel is used to separate a gas phase from a liquid phase.The objective of the control
strategy is to make sure that the liquid level and gas pressure inside the flash vessel remains at a
set value. A feedback control strategy is used for both cases. The gas pressure inside the vessel is
measured and controlled using the top outlet stream valve, whereas the level in the tank is
controlled by the bottom control valve.
Table 4.7: Variable types
Controlled
Variable
Measured
variable
Manipulated
Variable
Disturbance
Variable
Controller
Type
Tank gas
pressure
Tank gas
pressure
Top outlet
stream
Inlet
composition/Inlet
flowrate
Feedback

61
Tank liquid
level
Tank liquid
level
Bottm outlet
stream
Inlet
composition/Inlet
flowrate
Feedback
PIC-106
1. Control Strategy Used: Feedback
2. Control Objective: To keep the flash vessel pressure at a desired set point
3. Control strategy concept: The pressure of the vessel is measured, compared to a setpoint and
then corrected by manipulating thetop control valve.By closing the valve the pressure inside
the vessel increases, by opening the valve the pressure decreases.
LIC-101
1. Control Strategy Used: Feedback
2. Control Objective: To keep the flash vessel level at a desired level
3. Control strategy concept: The level of the vessel is measured, compared to a setpoint and is
then corrected by manipulating the bottom control valve.By closing the valve the level inside
the vessel increases, by opening the valve the level decreases.
4.10 Conclusion
A control system is vital for a plant to operate safely while producing quality product at a
specified rate. This is why great attention must be paid to the control strategy. It is also best to
avoid advance control techniques wherever possible to avoid high costs.
It is possible for controller contradictions to occur. Certain control strategies may be ineffective
because of too many constraints. By conducting a relative gain array test it is possible to check
whether the control strategy will work. The relative gain array test is also able to determine the
most appropriate control strategy.

62
CHAPTER 5
5.0 SAFETY AND LOSS PREVENTION
5.1 Hazard and Operability Studies (HAZOP)
5.1.1 Description
Process safety study is important prior to developing a chemical plant. A good management
practice of safety is vital in order to ensure safe operation that will also ensure efficient
operation. This can be achieved by identifying all the potential hazards or incident scenarios
while minimizing possible risks.
Process safety study is usually conducted as hazard and operability studies or, as it is more
commonly known as, HAZOP. It is a systematic technique used in identifying all plant and
equipment hazard and operation problems. Each segment such as pipeline, equipment parts,
instrumentation set-up and many more are carefully examined to identify all possible deviations
from normal operating conditions. This is avital tools in loss prevention throughout the life cycle
of the facility. The assessment method should be conducted during the early stages of conceptual
design phase, final design stage, and also pre-setart up period. Once the plant is in full operation,
the study must also be conducted regularly in order to identify possible new hazards to the plant
equipment and plant operation. During the final stage of plant design, a thorough hazard and risk
assessment of the new facility is essential as at this stage the piping and instrumental diagrams,
equipment details and maintenance procedures are finalised.
The HAZOP process is based on the principle that a team approach to hazard analysis will
identify more problems than when individuals working separately combine results. The HAZOP
team is made up of individuals with multi-discipline backgrounds and expertise. The expertise is
brought together during HAZOP sessions and through a collective brainstorming effort that
stimulates creativity and new ideas, a thorough review of the process under consideration is
made.
A typical study team would comprise of the following:

63
i. Team leader.
ii. Secretary.
iii. Process Engineer.
iv. Control Engineer.
v. Production Operations Manager/Supervisor.
vi. Instrument Engineer.
vii. Other Specialist (civil Engineer, electrical engineer etc).
5.1.2 The HAZOP Process
HAZOP study is done to identify all plant or equipment hazards and operability problems, which
the plant might face in future. A formal operability study is the systematic study of the design,
vessel by vessel, and line by line, using “guide words” to help generate thought about the way
deviations from the intended operating conditions can cause hazardous situations (R K Sinnot,
2005). This technique is systematically applied to parts of a system such that hazard and
operability problems on the complete system are eventually identified. The study follows
specific procedures or methodology, such as shown below:
Figure 5.1: HAZOP Procedure
Select a node ('sub-system')
Apply a parameter ('property word')
Apply a 'guide word' to a property word to give a 'deviation'
Identify the 'causes'
Identify the 'consequences'
Identify the existing 'safeguards'
Decide on any 'action' to eliminate or mitigate the identified problem
Repeat for other property words, guide words as relevant
Repeat for all nodes

64
As shown in the flowchart above, HAZOP study contains the following important features:
Property words
Guide words
Deviations from design intention
Causes
Consequences (hazards, operating difficulties)
The meanings for the commonly used guide words for HAZOP are as shown below:
Table 5.1: List of Basic HAZOP Guide Words
Guide Word Meanings Comments
NO or NOT The complete negation
of the intention
No part of the intentions is achieved but
nothing else happens.
MORE Quantitative increase or
decrease
These refer to quantities and properties such as
a flow rates and temperature, as well as heat
and reaction.
LESS Quantitative increase or
decrease
These refer to quantities and properties such as
a flow rates and temperature, as well as heat
and reaction.
AS WELL AS A qualitative increase All the design and operating intentions are
achieved together with some additional
activities.
PART OF A qualitative decrease Only some of the intentions are achieved; some
are not.
REVERSE The logical opposite of
the intention
Usually applied to activities, for example
reverse flow or chemical reaction. It can also
be applied to substances.
OTHER THAN Complete substitution No part of the original intention is achieved.
Something quite different happens.

65
5.1.3 HAZOP Study for Ammonia Plant
HAZOP study focused on specific sub-system of the process or operation called “study node”,
process sections, or operating steps. Three nodes have been chosen which involved process lines
and related equipments. The selection should be based on the process nodes that contain highly
hazardous materials and critical process conditions identified during preliminary hazard study.
The chosen study nodes are as the following:
Node 1: inlet stream S4 to primary reformer (R-101) to outlet stream S10
Node 2: inlet stream S10 to secondary reformer (R-102) to oulet stream S11
Node 3: inlet stream S11 to heat exchanger (E-6) and outlet stream S18 to cooler E-101
Figure 5.2: System under study for HAZOP
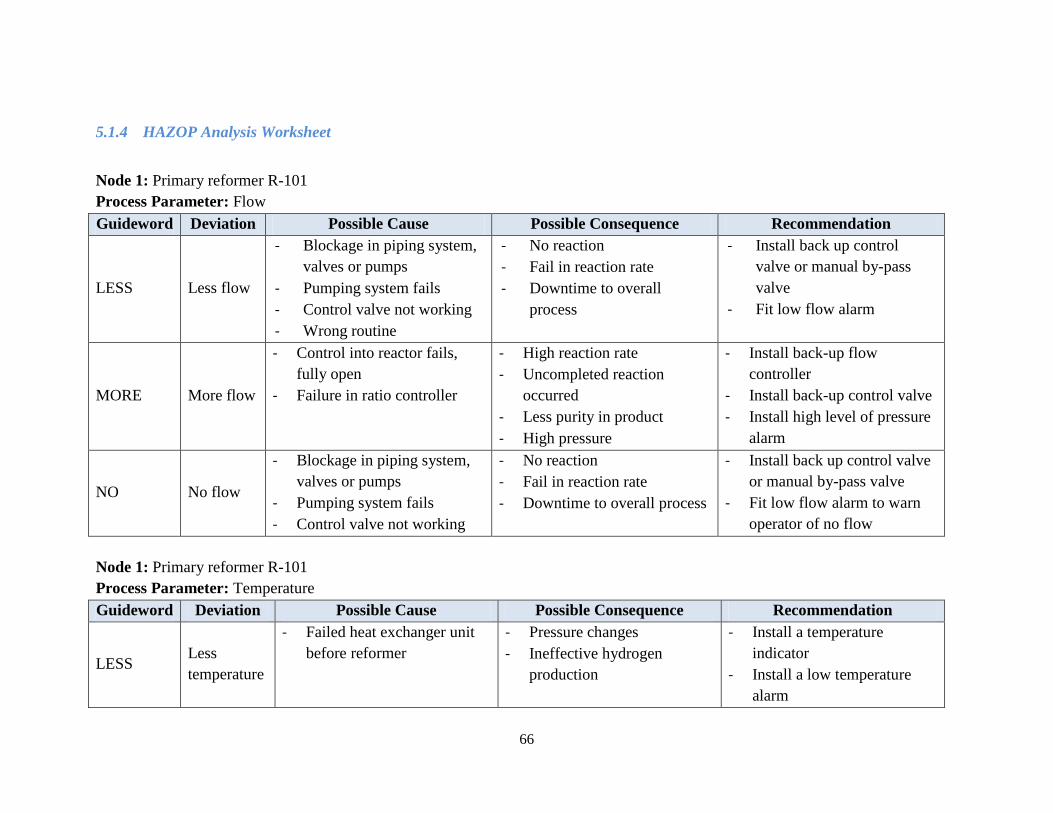
66
5.1.4 HAZOP Analysis Worksheet
Node 1: Primary reformer R-101
Process Parameter: Flow
Guideword Deviation Possible Cause Possible Consequence Recommendation
LESS Less flow
- Blockage in piping system,
valves or pumps
- Pumping system fails
- Control valve not working
- Wrong routine
- No reaction
- Fail in reaction rate
- Downtime to overall
process
- Install back up control
valve or manual by-pass
valve
- Fit low flow alarm
MORE More flow
- Control into reactor fails,
fully open
- Failure in ratio controller
- High reaction rate
- Uncompleted reaction
occurred
- Less purity in product
- High pressure
- Install back-up flow
controller
- Install back-up control valve
- Install high level of pressure
alarm
NO No flow
- Blockage in piping system,
valves or pumps
- Pumping system fails
- Control valve not working
- No reaction
- Fail in reaction rate
- Downtime to overall process
- Install back up control valve
or manual by-pass valve
- Fit low flow alarm to warn
operator of no flow
Node 1: Primary reformer R-101
Process Parameter: Temperature
Guideword Deviation Possible Cause Possible Consequence Recommendation
LESS Less
temperature
- Failed heat exchanger unit
before reformer
- Pressure changes
- Ineffective hydrogen
production
- Install a temperature
indicator
- Install a low temperature
alarm
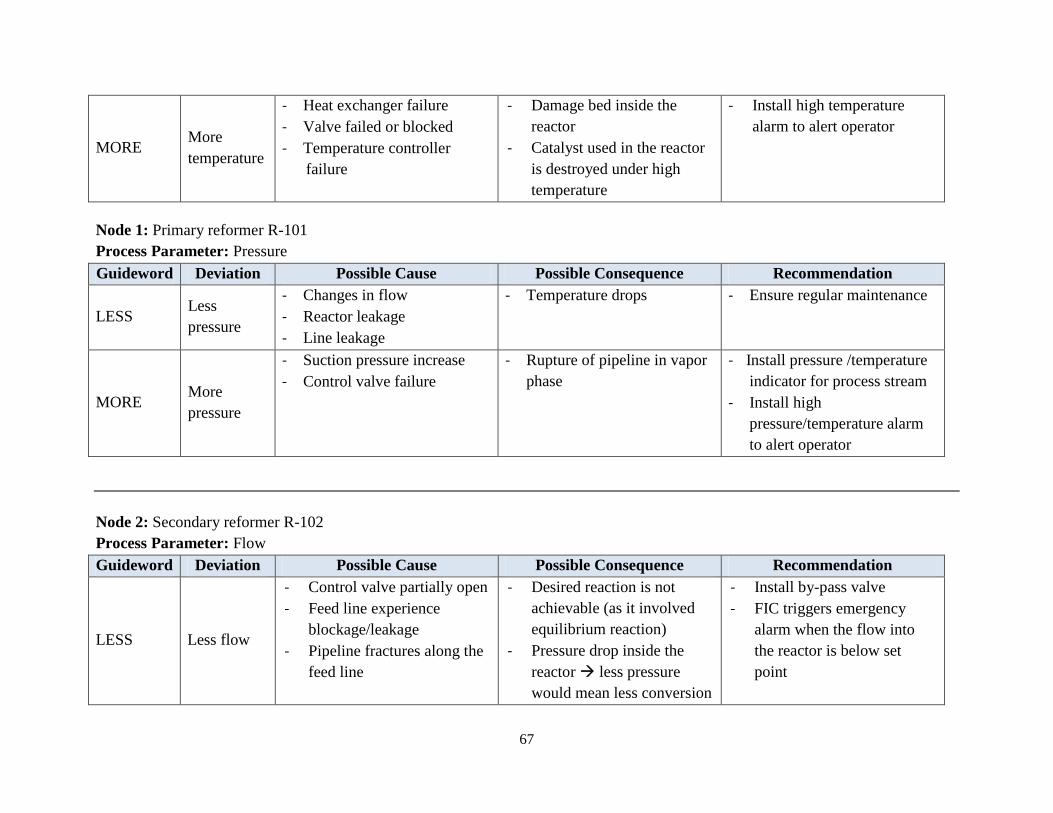
67
MORE More
temperature
- Heat exchanger failure
- Valve failed or blocked
- Temperature controller
failure
- Damage bed inside the
reactor
- Catalyst used in the reactor
is destroyed under high
temperature
- Install high temperature
alarm to alert operator
Node 1: Primary reformer R-101
Process Parameter: Pressure
Guideword Deviation Possible Cause Possible Consequence Recommendation
LESS Less
pressure
- Changes in flow
- Reactor leakage
- Line leakage
- Temperature drops
- Ensure regular maintenance
MORE More
pressure
- Suction pressure increase
- Control valve failure
- Rupture of pipeline in vapor
phase
- Install pressure /temperature
indicator for process stream
- Install high
pressure/temperature alarm
to alert operator
Node 2: Secondary reformer R-102
Process Parameter: Flow
Guideword Deviation Possible Cause Possible Consequence Recommendation
LESS Less flow
- Control valve partially open
- Feed line experience
blockage/leakage
- Pipeline fractures along the
feed line
- Desired reaction is not
achievable (as it involved
equilibrium reaction)
- Pressure drop inside the
reactor less pressure
would mean less conversion
- Install by-pass valve
- FIC triggers emergency
alarm when the flow into
the reactor is below set
point

68
which leads to less product
MORE More flow
- Control valve fails to close
- By-pass valve fails to close
- Pressure build-up inside the
reacto
- Less reaction and so less
product is formed
- Alarm to warn if the reactor
flow is above set point
- Install pressure-relief valve
NO No flow
- Blockage or leakage along
the pipeline carrying inlet
stream
- Control valve fails to open
- No reaction in the reactor
- Bed damage inside the
reactor
- Accumulation of products
and reactants in the reactor
- Possibilities of reverse flow
out of the reactor
- Install back up control valve
or manual by-pass valve
- Fit low flow alarm to warn
operator of no flow
Node 2: Secondary reformer R-102
Process Parameter: Temperature
Guideword Deviation Possible Cause Possible Consequence Recommendation
LESS Less
temperature
- Methane flowrate is low
- Combustion rate decrease
due to air flowrate/methane
flowrate being low
- Desired reaction is not
achieved
- Increase methane slip out of
the secondary reformer
resulting in the waste of
fuel
- Less reaction inside
primary reformer as heat
from secondary reformer is
supplied to the primary
reformer
- Install TC based on
methane flowrate
MORE More
temperature
- Combustion rate increase
due to excess methane
- Damage bed inside the
reactor
- Increase flowrate of the
cooling water inside the

69
flowrate - Catalyst used in the reactor
is destroyed under high
temperature
- Increase the reaction inside
the reactor
- Increase the heat duty,
causing energy costs as
well as equipment costs to
escalate
jacket
Node 2: Secondary reformer R-102
Process Parameter: Pressure
Guideword Deviation Possible Cause Possible Consequence Recommendation
LESS Less pressure
- Changes in flow
- Reactor leakage
- Line leakage
- Temperature drops
- Ensure regular maintenance
MORE More
pressure
- Suction pressure increase
- Control valve failure
- More unreacted methane
from the reactor
- Less hydrogren production
- Install pressure indicator
for process stream
- Install high pressure alarm
to alert operator.
NO Vacuum
- Fracture of the pipelines
before and after
- Reactor rupture
- Gauge pressure inside the
reactor
- Shutdown of the reactor
and repair
- Regular maintenance and
close observation during
planned shutdown to
monitor condition
- Reinforced material of the
reactor

70
Node 3: Heat Exchanger E-101
Process Parameter: Flow
Guideword Deviation Possible Cause Possible Consequence Recommendation
LESS Less flow - Control valve failure
- No raw material sent to
the heat exchanger
- Install low flows alarm onto
control valve
MORE More flow
- Control valve failure
- Possible thermal runaway
- Desired temperature is not
achieved
- Install temperature indicator
- Install stop valve
- Install high temperature
alarm to alert operator
- Install high temperature
emergency shutdown
NO No flow
- Control valve is not
functioning properly
- Desired temperature is not
achieved
- Further process cannot be
carried out
- Install low flow alarm onto
control feed flow rate.
- Install temperature indicator
for process stream
Node 3: Heat Exchanger E-102
Process Parameter: Temperature
Guideword Deviation Possible Cause Possible Consequence Recommendation
LESS Less
temperature
- Control system is not
functioning
- Temperature will decrease
with that condition
- Install low temperature
transmission
MORE More - Temperature controller is - Possible thermal runaway. - Install high temperature

71
temperature not functioning
- Valve failure
- Desired temperature is not
achieved
indicator.
- Install stop valve.
- Install high temperature
alarm to alert operator.
- Install high temperature
emergency shutdown.
Node 3: Heat Exchanger E-101
Process Parameter: Pressure
Guideword Deviation Possible Cause Possible Consequence Recommendation
LESS Less
pressure
- High pressure drop - The flow of fluid stream is
disturbed
- Install the low pressure
alarm
MORE More
pressure
- The pressure inlet is not
stable (disturbance)
- Temperature will increase - Install stop valve
- Install high pressure alarm
to alert operator.
- Install high pressure
emergency shutdown.

72
5.2 Plant Layout
5.2.1 Introduction
Plant/site layout must be considered early in the design work to ensure economical
construction and efficient operation of the completed plant. This section of the report
provides the basic information and safety justifications on the plant layout designed for
the newly proposed ammonia plant. As with so many aspects of design, the layout of a
process plant is not an exact science but rather an art, where it embraces a high degree of
experience coupled with the need to anticipate the human elements in both operation and
maintenance. It is an important factor in that a carefully planned, functional arrangement
of equipment, buildings and pipe works is the key to economical construction and
efficient operation. Some of the principal to consider are:
The process unit and ancillary buildings should be laid out to give the most
economical flow of materials and personnel around the site.
Hazardous processes must be located at a safe distance from other buildings.
Consideration must also be given to the future expansion of the site.
The ancillary buildings and services required on a site, in addition to the main
processing unit (buildings) will include:
i. Storages for raw materials and products, tank farms and warehouses.
ii. Maintenance and workshops.
iii. Stores for maintenances and operating supplies.
iv. Laboratories for process control.
The distances for transfer of materials between plant/storage units to a minimum
to reduce risks and cost.
Locating hazardous materials facilities as far as possible from site boundaries and
people living in the local neighborhood.
The need to provide access for emergency services.
The need to provide emergency assembly point and escape routes for on-site
personnel.
However, the most important factors of plant layout as far as safety aspects are
concerned are those to:
Prevent, limit and/or mitigate escalation of adjacent events (domino).
73
Ensure safety within on-site occupied buildings.
Control access of unauthorized personnel.
5.2.2 Plant Layout Consideration Factors
Based on the previous factors stated, the factor to design plant layout for the ammonia
plant has been cut down to several factors as followed. Thus, to ensure that the final
design for plant layout is complied with all the factors that has been discussed earlier.
Cost - The most important thing is to have an arrangement for best operation and
maintenance. Besides that, minimization of construction cost is done by adopting
shortest pipeline between raw materials and product loading storage and the
ammonia synthesis plant.
Operation - Equipment such as valves, sample points and instruments are
considered as frequently attended equipments. They are located not far away
from control room, with convenient positions and heights, to ease the operators‟
job.
Maintenance - When laying out the plant, some considerations were made
regarding maintenance work. For examples, all equipments are accessible to
crane/lift truck.
Safety - Among the safety consideration that we have when laying out this plant
are:
o Operators have 3 assembly points if anything occurs in the plant. Escape
routes are available in each and all buildings.
o Storage farm which stores flammable materials are located at safe
distance from the main process area.
o Equipment subject to explosion hazard is set away from occupied
buildings and areas.
5.2.3 Site Layout
Based on the earlier decision made, the plant location is situated in Gebeng Industrial
Area. The site layout can be divided into two parts:
i. Non-Process area - area where there is no production activity and has low
risk and hazards to workers.

74
ii. Process Area - consists of all processing units and equipments, where
ammonia is produced.
5.2.4 Non-Process Area
The non-process area usually occupies a smaller fraction of the overall plant site area.
All the facilities in the non-process area should be located in a logical manner that
considers site terrain, accessibility to roads, soil bearing capability and the climate
including the wind direction and other unusual weather condition. This is important to
avoid any undesired incident due to explosion or fire from the process zone that will be
easily spread to the non-process area. Among the buildings or units in the non-process
area are:
a) Security Post
Security post are located at the entrance of the site in order to ensure that only
authorized personnel gets access into the plant. There are three security posts that
are situated at the crucial entrances in the plant:
i. Main entrance – there is only one main entrance to check in and out the
visitors, staffs and operators of the plant.
ii. Process area security post (Gate 2) – to control the flow in and out of
personnel or vehicles between the process area and the non-process area.
The personnel may be operators and engineers while the vehicles may be
of contractors‟, fire truck and ambulance with whom have gain access to
enter the process area to ensure security.
iii. Process entrance security post (Gate 3) – to only check in and out trucks.
This is to avoid congestion and at the same time reduce the hazard of
material spillage at the plant. With this, the public are less exposed to the
danger of chemicals exposure or accidents with the trucks.
b) Administration building
The administration block is built near the parking area which acts as assembly
area for staffs as well to ensure the staffs can arrive faster at the assembly point
during an emergency. Based on the plant layout, the administration building is
placed far from the process area in order to protect the staffs and visitors from
any potential hazards.

75
c) Canteen
The canteen is located near the administration office for ease of access to the
employees and visitors, and far away from the process area to avoid contaminant
in food and ensure safety of the public. The location is so strategic that in order to
avoid the food supplier from being exposed to the process area allowing them to
move in and out easily. There are other facilities that located in the non-process
area including prayer hall, clinic and parking lot. A multipurpose hall is built for
other non-production activities. Prayer hall (surau) is located near the multi-
purpose hall for Muslims employees to perform their prayers during breaks.
d) Warehouse, Maintenance and Workshop
Warehouse stores all the process equipments‟ spare parts. Thus, it is placed near
to the maintenance and workshop where maintenance job and workshop work
conducted. It is also located beside to the control building where the engineers
can easily monitor the contractors‟ work in the maintenance and workshop to
ensure security for warehouse stores expensive equipments.
5.2.5 Process Area
Process zone is deemed as hazardous area where all processing equipment is allocated.
Due to this, the safety precaution has to be applied at all time. The buildings or units
situated in this process zone are:
a) Process Area Security Post (Gate 2)
This facility is to ensure no unauthorized personnel will have access into the
process area only by using a security pass, to record the personnel activity, such
as check-in and check-out between process area and non-process area. The
purpose of this process area security post is to ensure that all the personnel will
obey to the plant rule and regulations.
b) Control Building
All the control valves for the whole process area will be controlled and monitored
from this central control building. The control building is designed with blast
proof construction and has emergency backup power and is air conditioned in
order to save and secure the vital documents of the process that it houses during

76
emergency.
c) Laboratory
The quality and purity of ammonia is tested after the product is recovered to
determine whether it meets the specifications or not. All the results will be sent to
the control room and some adjustments in controlling will be made, if needed.
The distance between laboratory and control room is near. Laboratory staffs will
also perform analysis of the waste of the process before being channeled to
wastewater treatment and flare system; or being released to atmosphere.
d) Waste Treatment Plants
The waste stream from the separation area will flow into the waste treatment
plant to separate the contaminant from the water. The treatment plant is located
away from the personnel in the process area.
e) Ammonia Synthesis Plant
This area places the major processing unit which is the reactors where the
hydrogen and ammonia is produced. Consideration is taken from aspects such as
economy, operability and maintenance has been made to ensure the area is safe.
f) Plant Utilities
The plant utilities site is operating to supply the utilities to the all plant and
administration area. It is located near the process area and the Control Central
Building. This unit will supply cooling water, high pressure steam and nitrogen to
the main process unit. Its location is perfectly suitable to give the most
economical run of pipe to and from the process unit.
g) Product Loading and Storage
Raw materials for ammonia production are placed in the storage before
distributed to the ammonia plant via pipe line. The end products from the
ammonia synthesis are stored in the product loading before distributed to the
customer.
77
h) Future Expansion
Empty area is allocated at the process area for future expansion in case the
management decides to increase production rate or other crucial considerations.
They occupy enough space for further expansion, whether for process reaction or
producing the plant‟s own utility such as cooling water and steam.
i) Water Tank, Fire Water and Tank Farms
A water tank is allocated to supply water for ammonia production while fire
water tank is built in case of fire emergency occur. A number of tanks for
production use are placed in the tank farms.
j) Raw Material and Chemical Storage
This warehouse is located near the process plant for transportation of the material
is easy. Since it was near to the process plant area, it is easy to evacuate the
chemical or raw material to the process and reduce the hazard during the loading
and unloading material.
k) Loading Area
Loading area is where the trucks deliver the chemicals used in running of the
plant and also load the products that are going to be distributed locally. Thus, it is
directly located to the storage. Security post is also place at the entrance to the
loading area.
l) Flare Area
Flare is used to burn excess gas that is emitted from the process units as well as to
burn some of the waste gas from waste treatment area. The flare is located far
from the process area and administration complex for this purpose
5.2.6 Conclusion
The scaled plant layout is designed in accordance to the available land size at the chonse
plant complex. Meteorological data such as wind direction is also taken into
consideration in designing the plant layout so as to ensure the health, safety and
environmen awareness is kept as a topmost priority. Refer to the appendix for the
drawing of the scaled plant layout. The approximate plant area is 810 m by 550 m.

78
CHAPTER 6
6.0 WASTE TREATMENT
6.1 Introduction
All companies have a duty of care to their neighbours and to the environment in general.
Vigilance is required in both the design and operation of process plant to ensure that
legal standards are met and no harm is done to the environment. Since the environmental
awareness is increasing globally and locally, it has pushed the authority to implement
stringent regulation to limit the release of proven and potentially hazardous materials by
chemicals plants. For example in Malaysia, we have Environment Rules and Regulations
Act, 1978. In order to meet Environmental Quality Act (EQA) 1974 Malaysia, the waste
treatment strategy for ammonia plant is carefully planned. Besides, disposal of hazardous
waste on-site or off-site is governed by DOE (Department of Environment, Malaysia)
regulations on scheduled waste.
Waste arises mainly as by-products or unused reactants from the process, or as off-
specification product produced through mis-operation. There will also be fugitive
emissions from leaking seals and flanges, and inadvertent spills and discharges through
mis-operation (Sinnot, 1998). Waste is divided into three sections which are air
emissions that should be monitored annually, effluents that should be monitored
continuously specially pH adjustment, and other parameters to be monitored monthly.
Monitoring data should be analyzed and reviewed at regular intervals and compared with
the operating standards so that any necessary corrective actions can be taken. Records of
monitoring results should be reported to the responsible authorities and relevant parties,
as required.
This chapter basically covers the regulations for waste treatment in Malaysia, including
air pollution and water effluent. Then, waste is identified base on iCON simulation with
flow rate and its composition for specific stream with any other possible waste that might
be produced in ammonia plant. After that, treatment strategy is proposed by using block
diagram for ammonia plant in order to make sure the emission meet the regulations
requirement.
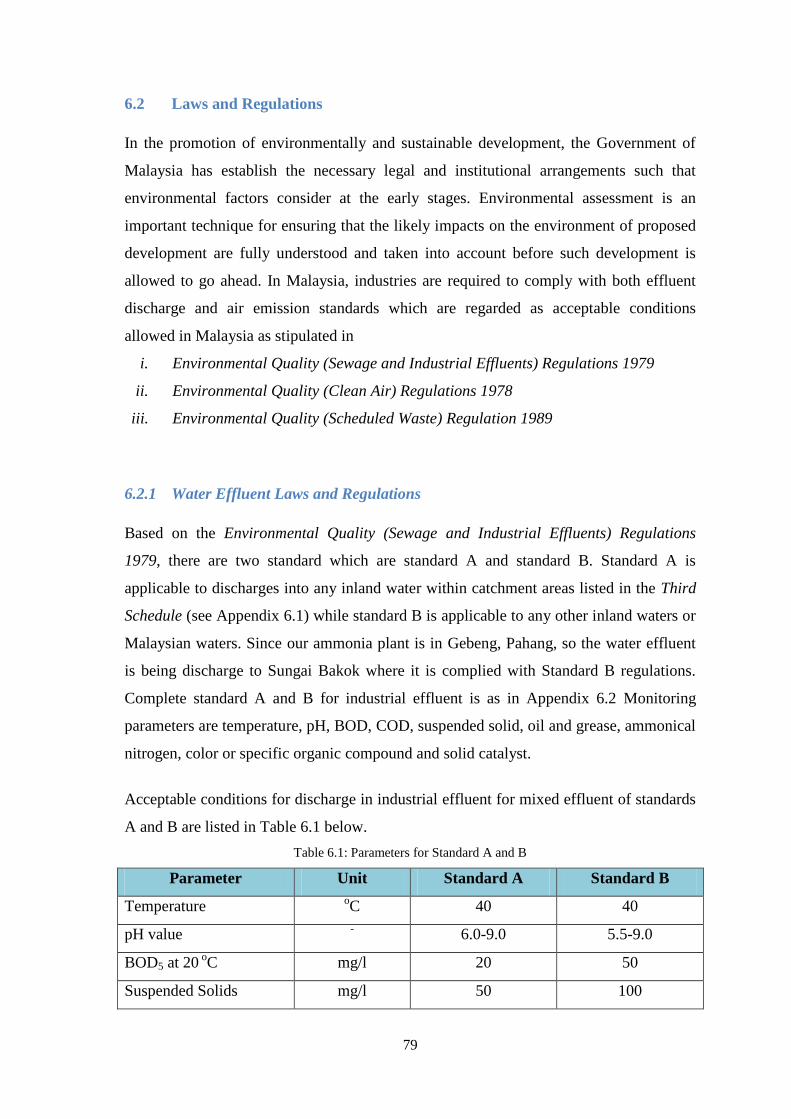
79
6.2 Laws and Regulations
In the promotion of environmentally and sustainable development, the Government of
Malaysia has establish the necessary legal and institutional arrangements such that
environmental factors consider at the early stages. Environmental assessment is an
important technique for ensuring that the likely impacts on the environment of proposed
development are fully understood and taken into account before such development is
allowed to go ahead. In Malaysia, industries are required to comply with both effluent
discharge and air emission standards which are regarded as acceptable conditions
allowed in Malaysia as stipulated in
i. Environmental Quality (Sewage and Industrial Effluents) Regulations 1979
ii. Environmental Quality (Clean Air) Regulations 1978
iii. Environmental Quality (Scheduled Waste) Regulation 1989
6.2.1 Water Effluent Laws and Regulations
Based on the Environmental Quality (Sewage and Industrial Effluents) Regulations
1979, there are two standard which are standard A and standard B. Standard A is
applicable to discharges into any inland water within catchment areas listed in the Third
Schedule (see Appendix 6.1) while standard B is applicable to any other inland waters or
Malaysian waters. Since our ammonia plant is in Gebeng, Pahang, so the water effluent
is being discharge to Sungai Bakok where it is complied with Standard B regulations.
Complete standard A and B for industrial effluent is as in Appendix 6.2 Monitoring
parameters are temperature, pH, BOD, COD, suspended solid, oil and grease, ammonical
nitrogen, color or specific organic compound and solid catalyst.
Acceptable conditions for discharge in industrial effluent for mixed effluent of standards
A and B are listed in Table 6.1 below.
Table 6.1: Parameters for Standard A and B
Parameter Unit Standard A Standard B
Temperature oC 40 40
pH value -
6.0-9.0 5.5-9.0
BOD5 at 20 oC mg/l 20 50
Suspended Solids mg/l 50 100

80
Oil and Grease mg/l 1.0 10.0
Ammonical Nitrogen mg/l 10 20
Colour ADMI 100 200
6.2.2 Air Effluent Laws and Regulations
For industries emitting gaseous and air emission, they are required to comply with the
following air emission standards for the control of air pollution and gaseous emissions
which are:
i. Stack Gas Standards from Environmental Quality (Clean Air) Regulations 1978
ii. Recommended Malaysian Air Quality Guidelines (Ambient Standards).
Malaysia guideline for air emission based on Malaysian Air Quality Guidelines (Ambient
Standards) at 25oC and 101.13 kPa is stated as below:
Table 6.2: Air Emissions Guidelines
Pollutant Averaging Time Malaysia Guidelines
(ppm) (ug/m3)
Carbon Monoxide 1 hour 30 35
8 hour 9 10
Nitrogen Dioxide 1 hour 0.17 320
Sulfur Dioxide 10 minute 0.19 500
1 hour 0.13 350
24 hour 0.04 105
Detail for both air emission regulation stated above is shown in Appendix 6.3
6.3 Waste Identification
Basically, waste is divided into three groups which are water effluents, air effluents and
solid waste. Each of the waste group has its own criteria. For ammonia plant, all types of
waste have been discovered and discussed in general in this chapter, followed by specific
waste production base on iCON simulation.

81
6.3.1 Solid Waste
For ammonia plant, solid waste normally comes from spent catalyst in ammonia
production. Besides, solid wastes also include by-products such as pyrite ashes, calcium
carbonate, sand, and plastic bags used to transport the fertilizer. Sludge cake and
skimmed oil from the wastewater treatment plant is also considered as solid waste.
Currently, solid waste in Malaysia is dispose in landfills. The authority that responsible
to solid waste is Kualiti Alam Sdn Bhd. Solid waste further treatment is done by Kualiti
Alam including the handling for scheduled waste. The waste treatment facilities provided
are incineration, physical/chemical treatment, solidification and waste disposal in
secured landfill. In Malaysia, comprehensive set of legal provisions related to the
management of toxic and hazardous wastes. The regulation was based on the cradle to
grave principle. A facility which generates, stores, transports, treats or disposes schedule
waste is subject to Environmental Quality (Scheduled Waste) Regulation 1989.
6.3.2 Air Effluents
Air effluent in ammonia plant comes from purge gas stream. It normally consist of
nitrogen, carbon dioxide, methane, ammonia and hydrogen based on the process involve
for ammonia production. Some of the plant might have huge valuable component in
purge gas stream like hydrogen where it needs to be recovered for recycle purposes.
Besides, flue gases like NOx, CO2 and CO are among the air effluent from the primary
reformers that should be treated. Other than that, CO2 removal section might contribute
CO2 emission as well.
6.3.3 Water Effluents
Industrial wastewater contains different pollutants and is often more variable,
concentrated, and toxic. There are several possible contaminated effluents in ammonia
plant likes:
i. Cooling water including blow down water
ii. Filter washing drain water (CO2 removal)
iii. Floor washing water including oily water
iv. Effluent water from the laboratory
v. Regeneration wastewater from demineralizer condensate treatment units
vi. Off-spec process condensate from ammonia unit
vii. Filter backwash water from cooling tower unit
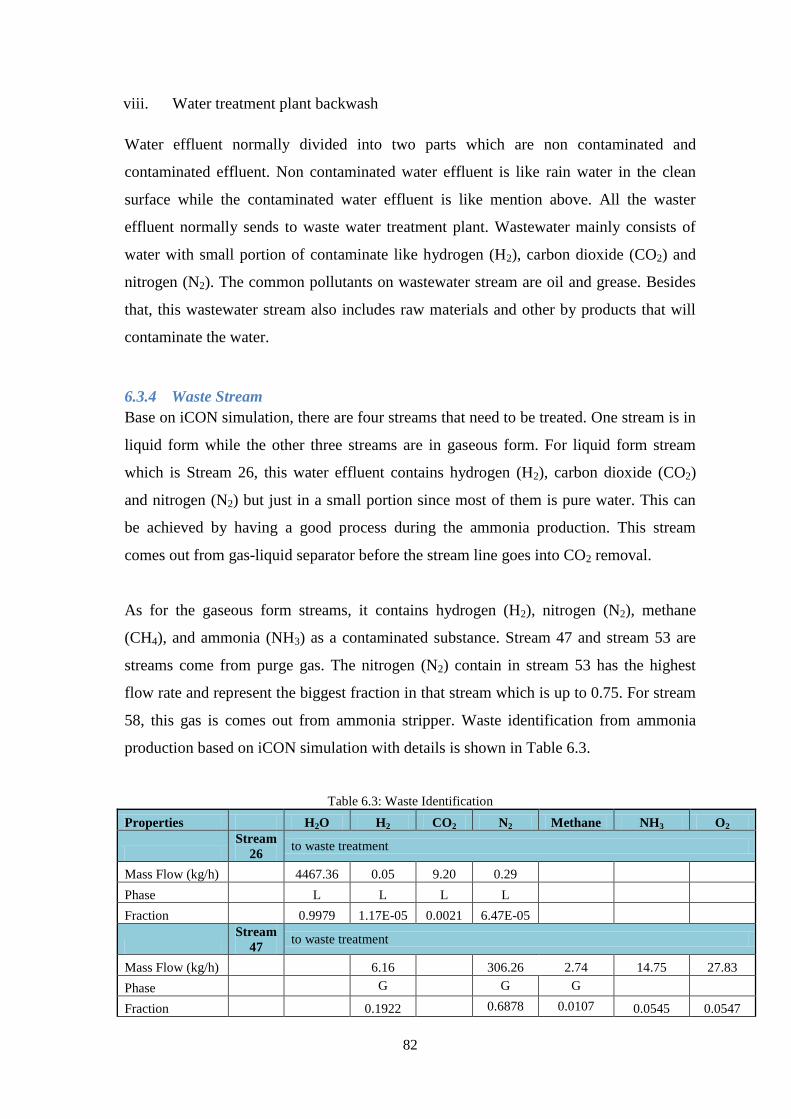
82
viii. Water treatment plant backwash
Water effluent normally divided into two parts which are non contaminated and
contaminated effluent. Non contaminated water effluent is like rain water in the clean
surface while the contaminated water effluent is like mention above. All the waster
effluent normally sends to waste water treatment plant. Wastewater mainly consists of
water with small portion of contaminate like hydrogen (H2), carbon dioxide (CO2) and
nitrogen (N2). The common pollutants on wastewater stream are oil and grease. Besides
that, this wastewater stream also includes raw materials and other by products that will
contaminate the water.
6.3.4 Waste Stream
Base on iCON simulation, there are four streams that need to be treated. One stream is in
liquid form while the other three streams are in gaseous form. For liquid form stream
which is Stream 26, this water effluent contains hydrogen (H2), carbon dioxide (CO2)
and nitrogen (N2) but just in a small portion since most of them is pure water. This can
be achieved by having a good process during the ammonia production. This stream
comes out from gas-liquid separator before the stream line goes into CO2 removal.
As for the gaseous form streams, it contains hydrogen (H2), nitrogen (N2), methane
(CH4), and ammonia (NH3) as a contaminated substance. Stream 47 and stream 53 are
streams come from purge gas. The nitrogen (N2) contain in stream 53 has the highest
flow rate and represent the biggest fraction in that stream which is up to 0.75. For stream
58, this gas is comes out from ammonia stripper. Waste identification from ammonia
production based on iCON simulation with details is shown in Table 6.3.
Table 6.3: Waste Identification
Properties H2O H2 CO2 N2 Methane NH3 O2
Stream
26 to waste treatment
Mass Flow (kg/h) 4467.36 0.05 9.20 0.29
Phase L L L L
Fraction 0.9979 1.17E-05 0.0021 6.47E-05
Stream
47 to waste treatment
Mass Flow (kg/h) 6.16 306.26 2.74 14.75 27.83
Phase G G G
Fraction 0.1922 0.6878 0.0107 0.0545 0.0547
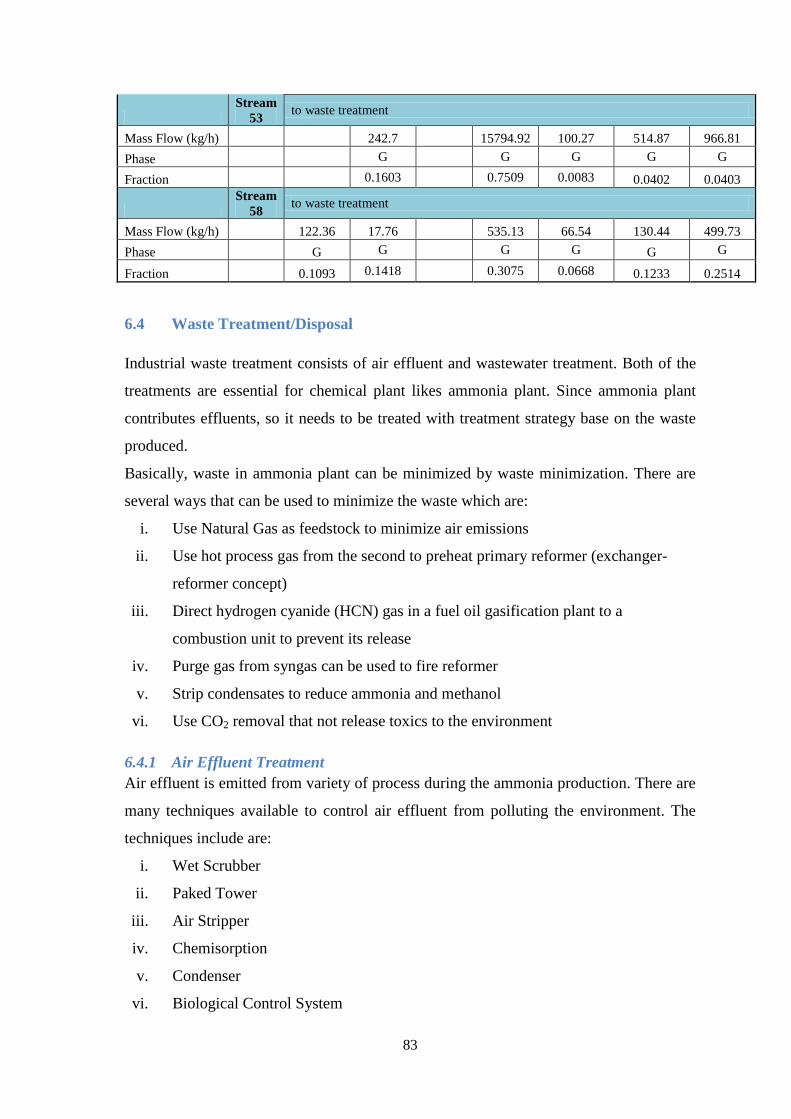
83
Stream
53 to waste treatment
Mass Flow (kg/h) 242.7 15794.92 100.27 514.87 966.81
Phase G G G G G
Fraction 0.1603 0.7509 0.0083 0.0402 0.0403
Stream
58 to waste treatment
Mass Flow (kg/h) 122.36 17.76 535.13 66.54 130.44 499.73
Phase G G G G G G
Fraction 0.1093 0.1418 0.3075 0.0668 0.1233 0.2514
6.4 Waste Treatment/Disposal
Industrial waste treatment consists of air effluent and wastewater treatment. Both of the
treatments are essential for chemical plant likes ammonia plant. Since ammonia plant
contributes effluents, so it needs to be treated with treatment strategy base on the waste
produced.
Basically, waste in ammonia plant can be minimized by waste minimization. There are
several ways that can be used to minimize the waste which are:
i. Use Natural Gas as feedstock to minimize air emissions
ii. Use hot process gas from the second to preheat primary reformer (exchanger-
reformer concept)
iii. Direct hydrogen cyanide (HCN) gas in a fuel oil gasification plant to a
combustion unit to prevent its release
iv. Purge gas from syngas can be used to fire reformer
v. Strip condensates to reduce ammonia and methanol
vi. Use CO2 removal that not release toxics to the environment
6.4.1 Air Effluent Treatment
Air effluent is emitted from variety of process during the ammonia production. There are
many techniques available to control air effluent from polluting the environment. The
techniques include are:
i. Wet Scrubber
ii. Paked Tower
iii. Air Stripper
iv. Chemisorption
v. Condenser
vi. Biological Control System

84
vii. Flare
Below is the comparison of gaseous pollutant removal systems base on Fundamentals of
Air Pollution (Vallero, 2007).
Table 6.4: Comparison of Gaseous Pollutant Removal Systems
Type of Equipment Pressure Drop
(cmH2O)
Installed Cost
(1990 US$ per m3)
Annual Operating Cost
(1990 US$ per m3)
Scrubber 10 9.80 14.00
Absorber 10 10.40 28.00
Condenser 2.5 28.00 7.00
Direct-flame
afterburner
1.2 8.2 8.40 + gas
Catalytic afterburner 2.5 11.60 28.0 + gas
Bioligical Control
Systems
Low (e.g < in
compost)
Variable ( low to
moderate)
Variable ( low to
moderate)
Based on the comparison table above, it shows that direct flame after burner is the best
way to remove gaseous pollutant as it has the lowest pressure drop, installation and
annual operating cost. Flare is used to dispose gaseous waste from many industries such
as:
i. Purged and wasted products from refineries
ii. Unrecoverable gases emerging with oil from oil wells
iii. Vented gases from blast furnaces
iv. Unused gases from coke ovens
v. Gaseous from chemical industries.
Besides that, flare is also used for waste gases generated by ammonia fertilizer plants.
An ammonia plant is handling hazardous gases like natural gas, synthesis gas, and
ammonia starting from front end to back end. For the safe and satisfactory operation of
the plant, the flare system is the single most important element for operational or
emergency relief of flammable gases (R.Desai, 2010).
6.4.2 Air Effluent Treatment Block Diagram
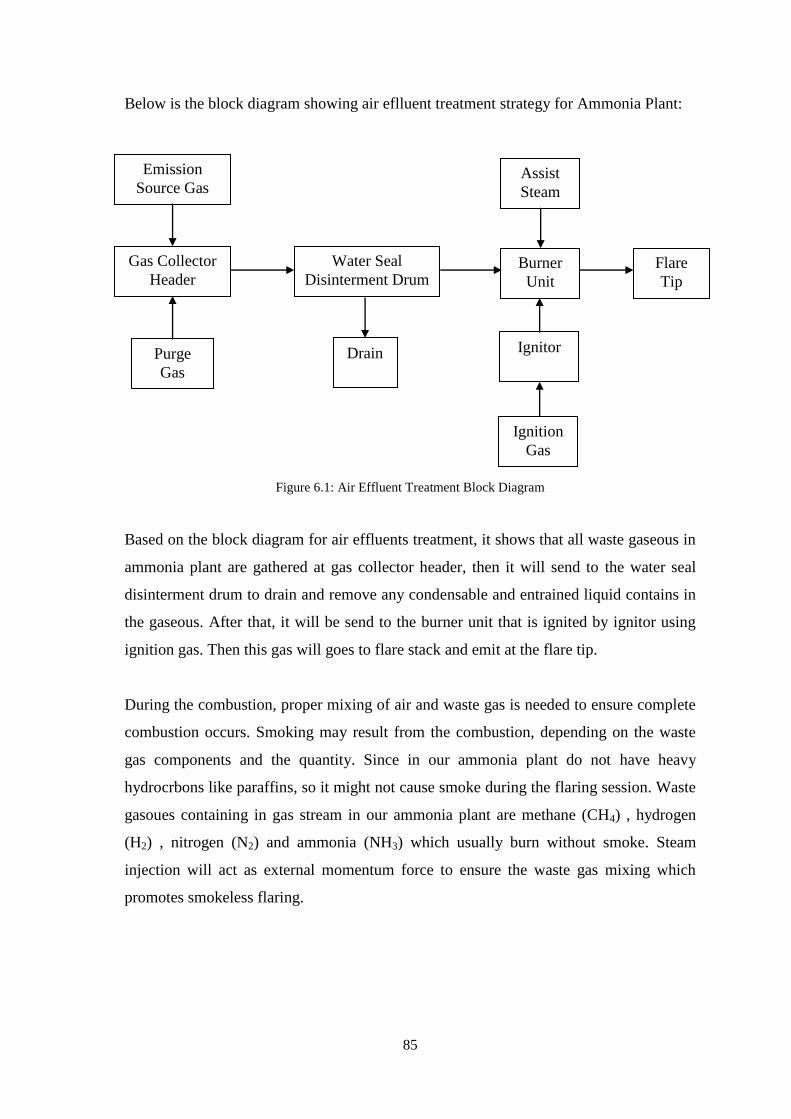
85
Below is the block diagram showing air eflluent treatment strategy for Ammonia Plant:
Figure 6.1: Air Effluent Treatment Block Diagram
Based on the block diagram for air effluents treatment, it shows that all waste gaseous in
ammonia plant are gathered at gas collector header, then it will send to the water seal
disinterment drum to drain and remove any condensable and entrained liquid contains in
the gaseous. After that, it will be send to the burner unit that is ignited by ignitor using
ignition gas. Then this gas will goes to flare stack and emit at the flare tip.
During the combustion, proper mixing of air and waste gas is needed to ensure complete
combustion occurs. Smoking may result from the combustion, depending on the waste
gas components and the quantity. Since in our ammonia plant do not have heavy
hydrocrbons like paraffins, so it might not cause smoke during the flaring session. Waste
gasoues containing in gas stream in our ammonia plant are methane (CH4) , hydrogen
(H2) , nitrogen (N2) and ammonia (NH3) which usually burn without smoke. Steam
injection will act as external momentum force to ensure the waste gas mixing which
promotes smokeless flaring.
Assist
Steam
Burner
Unit
Flare
Tip
Ignitor
Ignition
Gas
Emission
Source Gas
Gas Collector
Header
Purge
Gas
Water Seal
Disinterment Drum
Drain
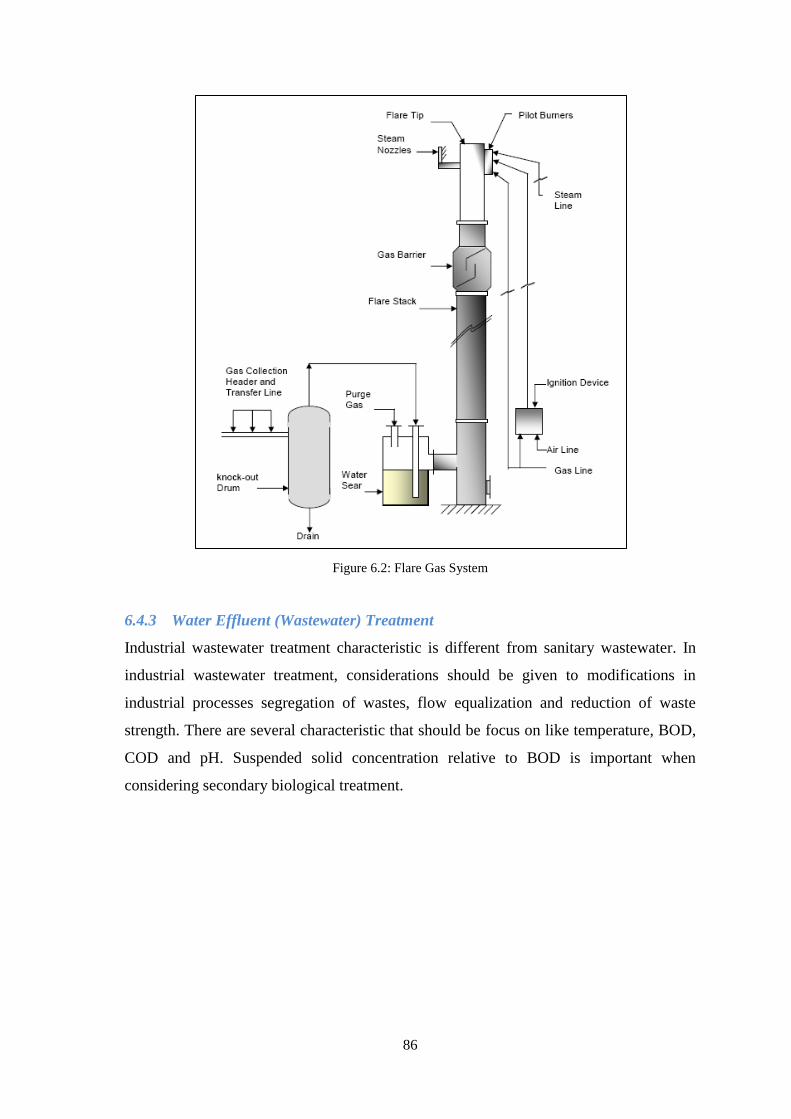
86
Figure 6.2: Flare Gas System
6.4.3 Water Effluent (Wastewater) Treatment
Industrial wastewater treatment characteristic is different from sanitary wastewater. In
industrial wastewater treatment, considerations should be given to modifications in
industrial processes segregation of wastes, flow equalization and reduction of waste
strength. There are several characteristic that should be focus on like temperature, BOD,
COD and pH. Suspended solid concentration relative to BOD is important when
considering secondary biological treatment.
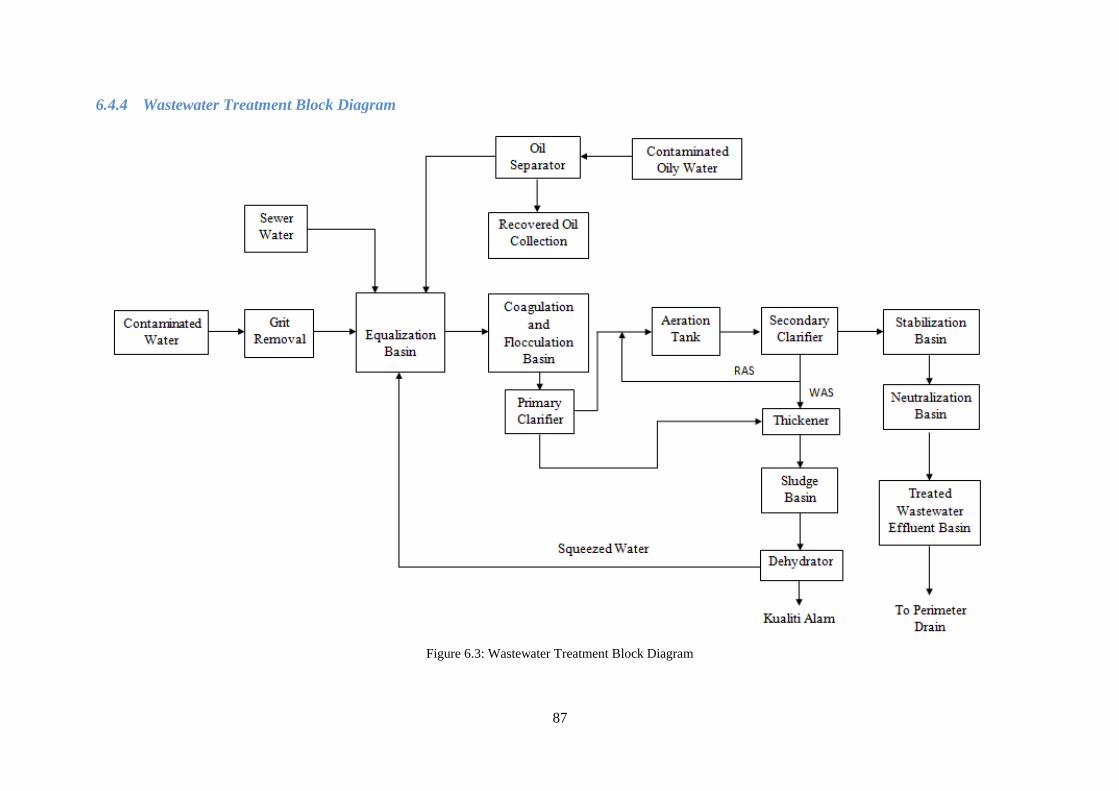
87
6.4.4 Wastewater Treatment Block Diagram
Figure 6.3: Wastewater Treatment Block Diagram
RA
S
Kualiti Alam
WA
S Thickener
Sludge
Basin
Dehydrator
Secondary
Clarifier
Neutralization
Basin
Treated
Wastewater
Effluent Basin
To Perimeter
Drain
Stabilization
Basin
Coagulation
and
Flocculation
Basin
Aeration
Tank
Primary
Clarifier
Squeezed Water

88
Process Description
The waste water treatment process description base on the above block diagram is:
i. Oily contaminated water is fed to the oil separator system to eliminate oil from the
effluent where oil is skimmed and the oil-free water will overflows to the equalization
basin. Density difference between oil and water helps the oil separator system
function well where oil is skimmed and the oil-free water overflows to the
Equalization Basin. The oil that has been recovered will be sent to the storage pit
before the disposal take place.
ii. Non oily contaminated water that comes from various sources is sent to the
equalization basin. The completely mixed equalization system is designed to
completely mix a single flow or multiple flow streams combined at the front end of
the wastewater treatment facility. The equalization basin is on-line and receives flows
continuously (Driscoll, 2008). This equalization basin is used to reduce variances in
each stream, minimize and control fluctuation in wastewater and provide optimum
conditions for subsequent treatment process.
iii. For contaminated water from the ammonia plant, it will be sent to the grit removal
before fed into equalization basin. In industrial wastewater, grit removal is one of the
preliminary treatments that have been used to ensure overall treatment process
reliability and effectiveness. Grit removal reduces abrasive wear on mechanical
equipment and prevents then accumulation of sand in tanks and piping (Eddy, 1991).
Grit is predominantly non-putrescible solids (e.g. sand, small gravel, metal shavings,
ash, and soot) that settle faster than putrescible and other solids. Grit removals is used
to protect downstream pre-treatment equipment and prevents heavy material from
accumulating in sewers and equalization, neutralization, and aeration tanks (Driscoll,
2008). Besides, it is also used in order to protect pumps, valves and downstream
pipelines.
iv. Next, the effluent is fed to coagulation and flocculation basin. Here, the basin is
provided with a motor driven stirrer to continuously ensure the coagulant added to the
coagulation basin is well mixed with the water. Coagulation is the destabilization of
colloids by addition of chemicals that neutralizes the negative charges. The coagulant
added will cause small groups of suspended solid. Then it will further agglomerate the
89
particles into large size particles known as flocs which can be effectively remove by
flotation or sedimentation.
v. The effluent then will be sent to primary clarifier where most of the coagulant and
flocculent will be eliminated and send to the thickener tank. In clarifier, the suspended
solid will go to the bottom center of the clarifier. Clear water will be send to the
activated sludge treatment for further treatment.
vi. After that, the wastewater is send to the activated sludge treatment which consists of
aeration tank and secondary clarifier. Purposes of activated sludge are to develop
biomass and substrate, predict of biomass and soluble substrates concentrations,
prediction of the reactor biomass and MLSS/MLVSS concentrations and the amount
of waste sludge produced daily. The water-absorbed ammonia is fed into an aeration
tank, where either air from atmosphere is bubbled into the tank or the mechanical
surface aerator is used to saturate the wastewater with oxygen. Microorganisms exist
in the aeration tank to digest the ammonia.
vii. Then, the wastewater is send to the secondary clarifier. Here, same concept in primary
clarifier applied. The suspended solid in secondary clarifier is send to the thickener
while the clean water is send to the stabilization basin.
viii. In stabilization basin, sludge is stabilize in order to reduce pathogen, eliminate
offensive odors, and inhibits, reduce or eliminate the potential for putrefaction.
Survival of pathogens, release of odors and putrefaction occur when microorganisms
are allowed to flourish in the organic fraction of the sludge. The means to eliminate
these nuisance conditions through stabilization are the biological reduction of volatile
content, the chemical oxidation of volatile matter, the addition of chemicals to the
sludge to render it unsuitable for the survival of microorganism and the application of
heat to disinfect or sterilize the sludge (Eddy, 1991). Then the effluent is fed to
naturalization basin.
ix. Naturalization basin act as final pH adjustment before the effluent is discharge. In
neutralization basin, alkalinity and acidity are useful concepts for determining
neutralization requirement. pH measurement is required in order to determine how
90
much acid or alkali is needed to neutralize the wastewater. Water in the neutralization
basin is treated with either sulphuric acid or caustic soda to get the correct pH range
of 6.5 to 8.5.
x. Finally, the effluent is fed to treated wastewater effluent basin and being discharge to
the perimeter drain.
xi. For solid handling parts, it consists of thickener, sludge basin and dehydrator.
Thickener is used to thicken the sludge then the sludge is fed to the sludge basin.
Sludge basin is provided with an air mixing blower to prevent deposition / settlement
of sludge. The sludge in the basin is discharge to the dehydrator.
xii. Dehydrator is used to squeezes the intake sludge and discharges the water-free sludge
into a container. The squeezed water is recovered back to the Equalization Basin.
6.4.5 Specific Treatment for Ammonia Wastewater
Ammonia that generated is alkaline and reacts corrosively with all body tissues. For a 25%
solution of ammonia in water, the aqueous ammonia is a colorless liquid with pungent odor.
It forms strong base, which corrodes aluminum and zinc. The over exposure to this liquid in
closed area may extremely destructive to tissues of the mucous membranes and upper
respiratory tract (if inhaled). Symptoms may include burning sensation, coughing, wheezing,
shortness of breath, and so on.
For this plant, we have chosen the activated sludge treatment system. There is a constraint for
activated sludge system, i.e. the contents of the active component (for chemical plant, usually
organic in nature) in the liquid cannot exceed a certain value. It is because in activated
sludge, microorganisms (bacteria and protozoa) are used to biodegrade the organic
components in wastewater. High concentration of waste in the effluent destroys the proper
biological functions/operations of those microorganisms, killing them eventually. Therefore,
laboratory examination of the effluent is needed to determine the content and concentration
of the effluent to be treated.
91
In aeration tank (atmosphere pressure) the waste will treat with combination bacteria and
oxygen entering, this combination make reaction occurs in aeration tank. The reaction occur
in this show as below :
HeatboimassNewNHCOCHOOHmatterOrganic 324
bacteria
22
Notes: Organic matter such as Ammonia
The „biomass‟ from aeration tank will be pumped to Clarifier, settling tank to separate the
liquid and solid. In clarifier, the solid will go down to filter press and the water will pass to
final conditioning tank using pump. Filter Press pressed the solid to separate it into solid and
liquid form, whereas liquid is recycle back to aeration tank. The solid produced is called
sludge and sent to Quality Alam for disposal to environment without dangerous. Since the
components of in the effluent are all organic, the concentration of BOD is taken as a
guideline to determine whether the treated effluent is safe enough to be discharged into the
environment. (shown in Table 4.5)
The wastewater treatment plant is a tapered aeration activated sludge treatment facility. Take
BOD5 = 1000. This value corresponds to the BOD5 of the effluent of an Ammonia plant in
United States.
Therefore, BOD5 before treatment,
BOD5i = 1000 mg/L
To comply with the Environmental Quality Act (Amendment 1979), B Standard, we only
allow 20 mg/L BOD5 in the wastewater effluent from our chemical plant.
After treatment, BOD5f = 20 mg/L
We use typical design values for tapered aeration activated sludge plants for design. Typical
design values (see page 429, Table 15.4 (Reynolds, 1996)):
Mixed liquor suspended solids, MLSS = 2000 mg/L
Mixed liquor volatile suspended solids, MLVSS = 1500 mg/L (75% of MLSS)
Sludge density index, SDI = 10000 mg/L

92
CHAPTER 7
7.0 PROCESS ECONOMICS AND COST ESTIMATION
7.1 Introduction
Process economics is an integral part of any process. Since building a plant is financially
huge, it is essential to estimate the costs. According to Peters et. al (2003), an acceptable
plant design must represent a plant that can produce a product which can sell profit.
Therefore, plant designers need to be able to design different alternative plant designs,
estimate the costs rather effectively, and choose the best profitable design, which in turn will
pull in shareholders. Cost estimation would also help in determining whether the plant is
economically stable and sustainable in the long run, since chemical plants will be operating to
an expected 15 to 20 years‟ lifetime.
Process economics cover a wide range, from capital plant costs, up to operating, taxes,
transportation and administrative costs. The main focus on process economics however, is the
capital costs and the operating costs, which is usually a substantial part in plant finance and
economics. Capital cost, or CAPEX for short, is usually consists of plant equipments while
operating costs, or OPEX is the cost of running the plant and usually estimated by 2% from
CAPEX. However, detailed calculations are needed for more accurate estimation; the
estimation accuracy is dependent upon the request of the client and extensive design.
For our ammonia plant, the production is 1744 MTPD, or 576,000 MT per year. As per
required of plant designs, a substantial process economics and cost estimation of our
proposed plant is done to assess the economics of the plant. The assessment will help to
determine whether the proposed design is profitable and prospective for construction.
The location for the plant is planned at the Gebeng Industrial Park, due to reasons listed
below:
a) Raw material
The raw materials for the ammonia synthesis are natural gas (methane) and steam.
Natural gas is acquired from a dedicated pipeline from PETRONAS Gas Bhd., while
steam is a part of the utility provided by Centralized Utilities Facilities (CUF) in
Gebeng. As such, no additional costs are needed for transportation of natural gas and
generation of steam.

93
b) Realistic land price
Since Gebeng is declared as an industrial park by the government, incentives are
provided for any development of plants in the area, which include reduced land prices
to attract more investors. This is a boost to the economics of the plant construction.
c) Product demand
The ammonia demand is growing rapidly every year, and not only in Malaysia, but
worldwide as well. This is due to the fact that ammonia is very important reactant in
urea production which is widely used in agriculture as a fertilizer and is tied to the
growing food demand.
d) Power and water supply
Both supplies are available since Gebeng provides CUF.
e) Accessibility
Gebeng is accessible by sea and train transportations, since Gebeng is near the
Kuantan Port, and there is also an integrated train line.
f) Labor force
Malaysia has a large labor force, including able engineers and technicians that can
operate the plant effectively. The Malaysian economy also encourages a healthy and
competitive labor force for better personnel selectivity.
All the calculations are done via Detailed Factorial Method, and to provide enough values to
be able to construct detailed cash flows for the proposed process economics.
7.2 Capital Investment
As stated previously, the capital investment is mainly the equipment cost. The equipment cost
mainly consist of the equipment body, the installation costs, type of material, and other
factors such as wiring and instrumentation. All these cost can be calculated superficially from
the equipment‟s body cost via factors. This method is otherwise known as the detailed
factorial method.

94
There are two major factor tables that are widely used by engineers today. The two major
tables are:-
a) Lang factors
b) Guthrie factors (also known as bare-module factors)
The differences between the two factor tables are the factors‟ weightage and basis. Lang
factors base on the type of the plant to be built (either solids processing, solids-fluids
processing, or fluids processing) while Guthrie factors emphasize on the types of equipment.
The Lang factor was recently broken down into more sub-factors by Peters, Timmerhaus, and
West (2003) to increase its accuracy. The Guthrie factor, already a complex calculation
method in itself, was not known to be updated recently as it was noted that the factors are
quite substantial.
For our equipment F.O.B. (free on board) estimation, the cost estimation mainly follows
Elsevier (2010) and Seider, Seader, Lewin, and Widagdo (2010) for supplementary
calculations. As such, the basis method is based on the Lang factors, since Seider et al.,
(2010) gives a total capital investment multiplier that is based on Lang factor to estimate the
installation costs including piping and labor. Following this method, we can estimate total
cost of capital cost based on total F.O.B. of equipment. Seider, Seader, Lewin and Widagdo
(2010) provide basic calculations method for pricing of equipment like heat exchangers,
ammonia synthesis, and catalysts prices. The table below depicts the modified Lang factor for
each type of plant as mentioned in Seider et al., (2010). Note that this table only depicts the
total capital investment factor with each respect to plant type.
Table 7.1: Lang factor for Total Capital Investment
Lang factor for Total Capital Investment
Type of Plant Factor
Solids Processing 4.67
Solids – Fluid Processing 5.03
Fluids Processing 5.93
Columns 2.1
The cost index that will be used along in the project is based on Marshall and Swift (MS).
Since all the F.O.B costs are estimated as of 2006, the index for total F.O.B cost will be based
on 2006 MS index, which is 1365. The MS index for year 2011 is 1519.8. Based on the
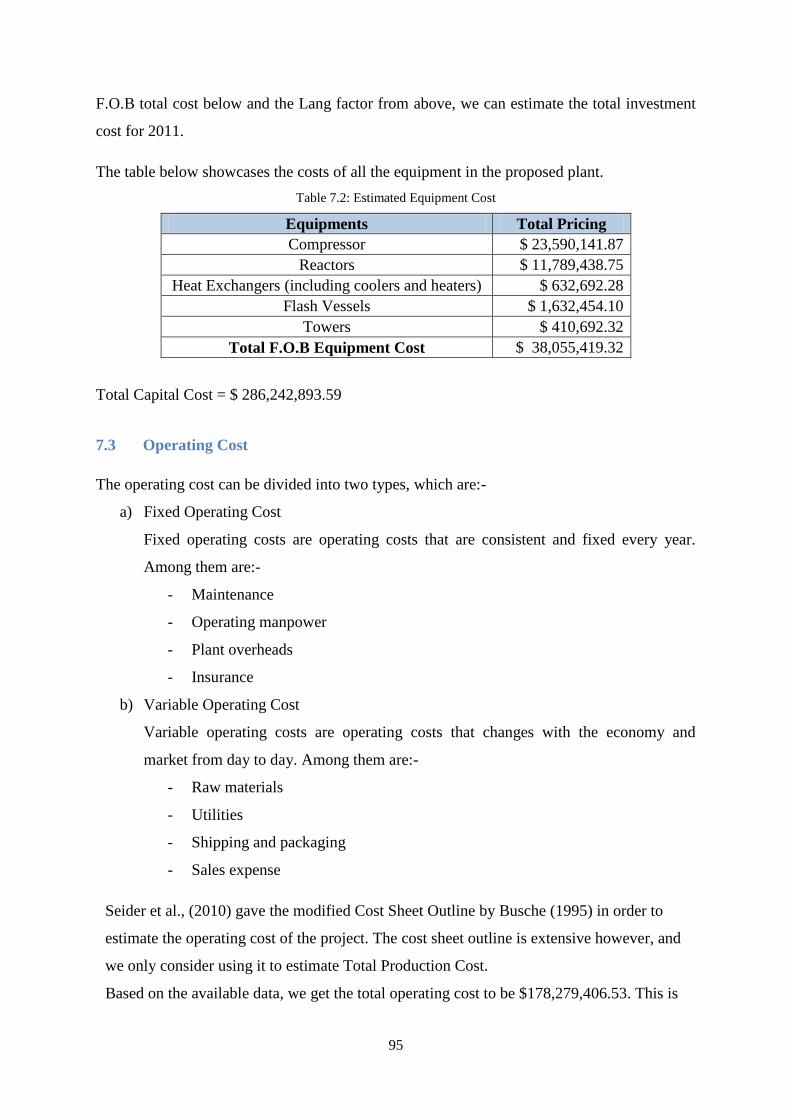
95
F.O.B total cost below and the Lang factor from above, we can estimate the total investment
cost for 2011.
The table below showcases the costs of all the equipment in the proposed plant.
Table 7.2: Estimated Equipment Cost
Equipments Total Pricing
Compressor $ 23,590,141.87
Reactors $ 11,789,438.75
Heat Exchangers (including coolers and heaters) $ 632,692.28
Flash Vessels $ 1,632,454.10
Towers $ 410,692.32
Total F.O.B Equipment Cost $ 38,055,419.32
Total Capital Cost = $ 286,242,893.59
7.3 Operating Cost
The operating cost can be divided into two types, which are:-
a) Fixed Operating Cost
Fixed operating costs are operating costs that are consistent and fixed every year.
Among them are:-
- Maintenance
- Operating manpower
- Plant overheads
- Insurance
b) Variable Operating Cost
Variable operating costs are operating costs that changes with the economy and
market from day to day. Among them are:-
- Raw materials
- Utilities
- Shipping and packaging
- Sales expense
Seider et al., (2010) gave the modified Cost Sheet Outline by Busche (1995) in order to
estimate the operating cost of the project. The cost sheet outline is extensive however, and
we only consider using it to estimate Total Production Cost.
Based on the available data, we get the total operating cost to be $178,279,406.53. This is

96
after we have considered operating cost on general, which includes feed stocks, operations,
maintenance, overhead, depreciation, and general expenses.
7.4 Economic Analysis
A standardized economic analysis will require the project to be analyzed for its Internal Rate
of Return (IRR) and its Payback Period. For the payback period, two different scenarios are
analyzed, one where the payback is without discount and the other with discount. Since we
are counting the time value of money, only discounted cash flow is considered for full
analysis including
- IRR
- Pay Back Period
- NPV
- Cumulative PV
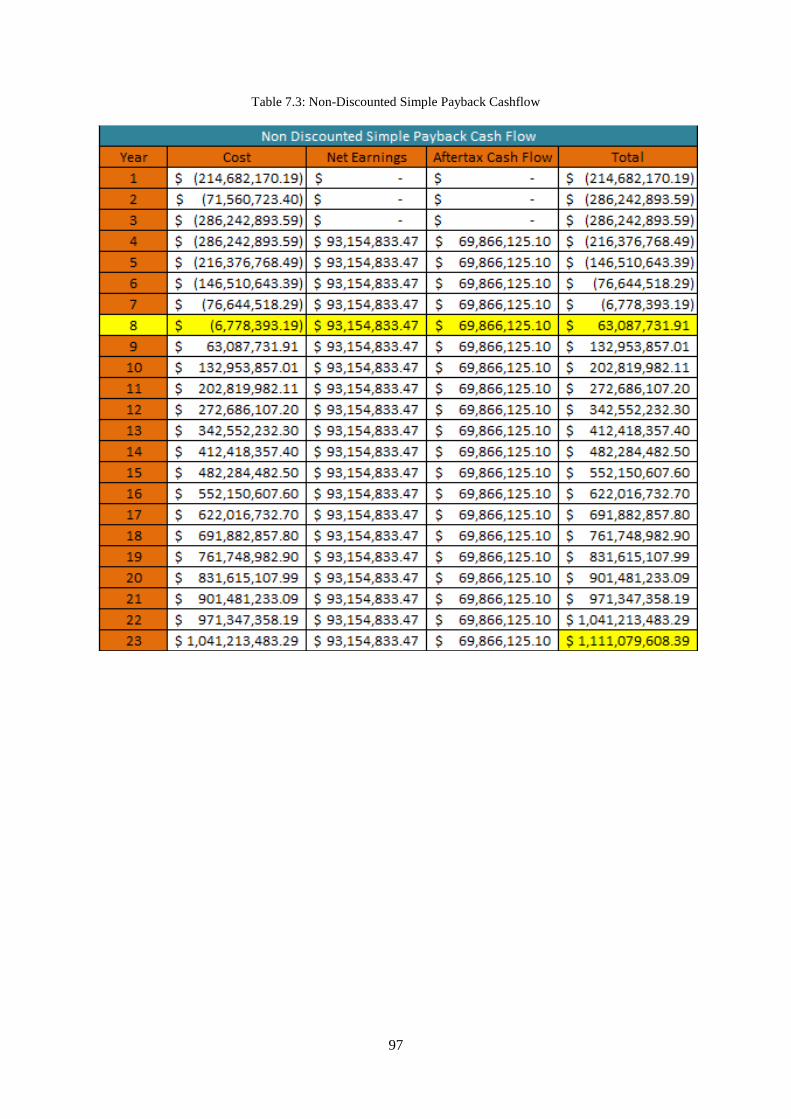
97
Table 7.3: Non-Discounted Simple Payback Cashflow

98
Figure 7.1: Graph of PV vs No of Years for Simple Payback Period
$(400,000,000.00)
$(200,000,000.00)
$-
$200,000,000.00
$400,000,000.00
$600,000,000.00
$800,000,000.00
$1,000,000,000.00
$1,200,000,000.00
0 1 2 3 4 5 6 7 8 9 10 11 12 13 14 15 16 17 18 19 20 21 22 23 24 25
PV
($
)
Year
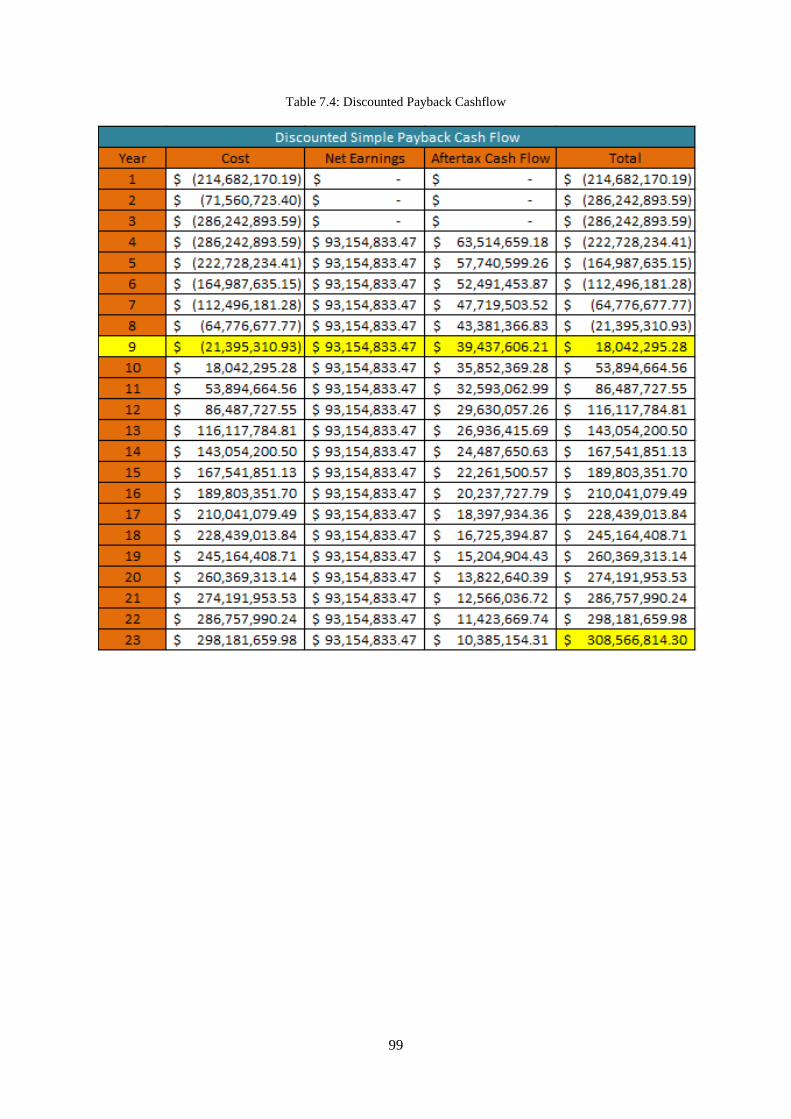
99
Table 7.4: Discounted Payback Cashflow
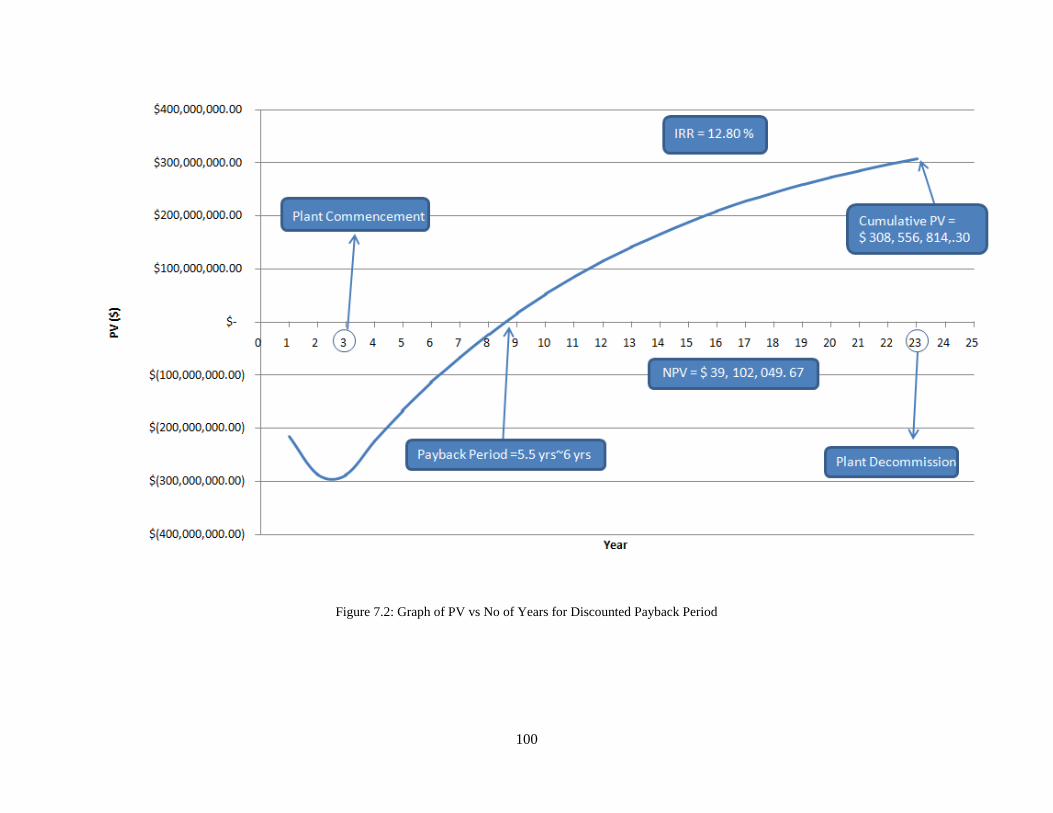
100
Figure 7.2: Graph of PV vs No of Years for Discounted Payback Period

101
CONCLUSION AND RECOMMENDATION
As a conclusion, constructing the proposed 543,000 metric tones per year of ammonia plant
is in Malaysia highly feasible. As the demand of ammonia is increasing highly every year,
the construction of this plant would help in assisting in supplying ammonia to the world
market. Plus, ammonia as an important part of urea production is in turn affecting the world
food supply, therefore making this project highly prospective. For our plant location,
Gebeng Industrial Park, located in Pahang, is chosen due to its availability of CUF and
accessibility to land (train) and sea transportations.
Literature review has shown that ammonia is highly demanded around the globe. The
ammonia market shows that demand is far higher than the market could supply. Due to this,
the ammonia selling price rarely drops; a factor that will surely help in attracting investors.
However, a good process design is needed in order for the plant to give a revenue that highly
substantial than the cost incurred. Process optimization includes a recycle system to recover
unreacted hydrogen and the utilization of HEN. It is noted that by utilizing HEN, energy loss
as much as up to 14.45% can be saved. The recycle system, meanwhile, increased the
production rate up to 2.7 times, while at the same time using the same amount of feedstock.
Equipment design, sizing, and cost estimates are shown in an Equipment Specification Sheet
with the appropriate standards. For each of the part that is design, sizing, and cost estimates
are done with great understanding of engineering knowledge.
Integrated process control was also designed and included into the proposed plant design.
The control and instrumentation was designed to ensure the plant runs at a safe and
workable environment, while at the same time, able to good great quality ammonia
consistently. The control system proposed in the design consists of only feedback and
cascade systems to ensure simplistic yet efficient control of the plant processes.

102
Designing of the proposed plant also take into account the safety and wellbeing of the
workers. This includes Hazard and Operability (HAZOP) studies as well as safety
requirements for all equipment, for instance, having pressure relief valves at every reactor.
The proposed plant layout was design with safety and environment concerns so as to
minimize accidents in the plant. However, since safety and environmental issues always at
large, it is recommended that extra precautions are taken once the plant is under
commencement.
In recent literature reviews, reportedly there have been extensive researches whereas
reforming process, where hydrogen for ammonia is conceived, can have a built-in
membrane separator within the reformer unit itself, thus increasing the plant output while at
the same decreasing the plant costs, due to less cost incurred for operation of hydrogen
cleansing. Other technological advancements, like newfound catalysts and membrane
separators within the ammonia synthesis, have also been researched recently. Hopefully, this
new technologies can increase the efficiencies of ammonia plants.
As CO2 and global warming is threatening the environment more and more these days, a
better separation process is in need. Not only that, since CO2 produced from this plant might
not be suitable in the market, a need comes as to where can the CO2 can be dumped. A better
CO2 removal method that comes with a good CO2 storage system is currently under research
and field testing. The method we are referring to is known as sequestration. Since MDEA
waste itself is hazard, safer ways of CO2 capture can be designed and replace the MDEA
method. There are already methods like pressure swing adsorption that shows considerable
CO2 capture capabilities. Potential new methods like hydrate formation to capture CO2 gases
can also be tested and tried.
In terms of the economic analysis, the plant shows that it is economically feasible to
continue on with the project since its MARR (10%), or hurdle rate, is lower than that of the
project‟s IRR (12.80% for the discounted cash flow). The payback period for non-
discounted cash flow is 8 years while it is 9 years for the discounted payback period. Since
there are no sensitivity study regarding the discount rate and the payback period, no

103
conclusive evidence is there to support the link between the discount raye and the payback
period, however.
To conclude, the proposed 543,000 metric tones per year of ammonia plant is in Gebeng
Industrial Park is technologically and economically feasible and prospective. Added with the
aid of the Malaysian government incentives, we can say that the project is a good investment
for any investors.

104
REFERENCES
Bare, S. R., Strongin, D. R., & Somorjai, G. A. (1986). Ammonia Synthesis over Iron Single-
Crystal Catalysts: The Effects of Alumina and Potassium. California: J. Phys. Chem.
Berkowitz, N. (1979). An Introduction to Coal Technology. New York: Academic Press.
Bhakta, M. L., & Grotz, B. J. (1994). High Conversion Ammonia Synthesis. US Patent No.
5352428.
Brady, S. B., Farnell, P. W., & Fowles, M. (2010). Steam Reforming. US Patent No.
7731935B2.
Cassey Lee (2005), Water Tariff and Development: The Case of Malaysia. Faculty of
Economics and Administration, University Malaya.
Danckwerts, P.V. (1970), Gas Liquid Reactions, McGraw Hill, New York.
Douglas, J. M. (1988). Conceptual Design of Chemical Processes. Singapore: McGraw-Hill
Book Company.
Driscoll, T. P. (2008). Industrial Wastewater Management, Treatment and Disposal.
Alexandri, Virginia: Mc Graww Hill.
DuPart, M., et al. (2001), A New Deep CO2 Removal Solvent for Ammonia Industry,
Freeporrt, Texas.
Eddy, M. &. (1991). Wastewater Engineering, Treatment, Disposal, Reuse. Singapore: Mc-
Grawwhill International Editions.
European Fertilizer Manufacturers' Association. (2000). Best Available Techniques for
Pollution Prevention and Control in the European Fertilizer Industry: Booklet No. 1 of 8:
Production of Ammonia. Brussels: Fisherprint Ltd.
John C. Molburg, Richard D. Doctor, (2003). Hydrogen with stream-methane reforming
with C02 capture. 20th
Annual International Pittsburgh Coal Conference.
Jusino, A., & Schobert, H. H. The use of sulfur to extract hydrogen from coal. Pennsylvania:
The Pennsylvania State University.
Lovell, R., & Harvey, D. G. (1950). A Preliminary Study of Ammonia Production by
Corynebacterium renale and some other Pathogenic Bacteria. London: Royal Veterinary
College.
Kothari, R., Buddhi, D., & Sawhney, R. L. (2006). Comparison of Environmental and
Economic Aspects of Various Hydrogen Production Methods. ScienceDirect .
105
McKee, R.L., et al. (1991), “CO2 Removal: Membrane Plus Amine”, Hydrocarbon
Processing.
McKellar, M. G., O'Brien, J. E., Stoots, C. M., & Hawkes, G. L. (2007). Process Model for
The Production of Syngas Via High Temperature Co-Electrolysis. ASME International
Mechanical Engineering Congress & Exposition (p. 8). Idaho: Idaho National Library
(INL).
Meng Ni (2005), An Overview of Hydrogen Production from Biomass, University of Hong
Kong, China.
Meyer, H.S. and J.P. Gamez (1995), Gas Separation Membranes: Coming of Age for
Carbon Dioxide Removal from Natural Gas, presented at the Laurence Reid Gas
Conditioning Conference.
Meyers, R. A. (2005), Handbook of Petrochemicals Production Processes. McGraw-Hill,
USA
M.H. Spritzer, G.T.Hong (2003), Supercritical Water Partial Oxidation, FY 2003 Progress
Report, National Renewable Energy Laboratory.
Mori, N., Nakamura, T., Sakai, O., Iwamoto, Y., & Hattori, T. (2008). CO-Free Hydrogen
Production by Membrane Reactor Equipped with CO Methanator. Japan: Ind. Eng.
Chem. Res.
Moulijn, J. A., Makke, M., & Van Diepen, A. (2001). Chemical Process Technology.
Singapore: John Wiley and Sons.
R.Desai, R. S. (2010). Self-Supported Flare Stack Vibrations in Ammonia Plant. AIChe -
Wiley online Library , 10.
Rochelle, G.T. and M.M. Mshewa (1994), Carbon Dioxide Absorption/Desorption Kinetics
in Blended Amines, presented at the Laurence Reid Gas Conditioning Conference.
Savage, D.W., and E.W. Funk (April 5-9, 1981), “Selective Absorption of H2S and CO2 into
Aqueous Solutions of Methyldiethanolamine”, paper presented at AIChE Meeting,
Houston, Texas.
Seider, W. D., Seader, J. D., Lewin, D. R., & Widagdo, S. (2010). Product and Process
Design Principles: Synthesis, Analysis, and Evaluation. Singapore: John Wiley and Sons.
Sinnot, R. (1998). Chemical Engineering. Britain: Butterworth-Heinemann.
Smith, R. (2005). Chemical Process Design and Integration. Singapore: John Wiley and
Sons.

106
Vallero, D. (2007). Fundamentals of Air Pollution. Durham, North Carolina: Academic
Press.
van Delft, Y. C., Overbeek, J. P., Saric, M., de Groot, A., & Jansen, D. (2009). Towards
Application of Palladium Membrane Reactors in Large Scale Production of Hydrogen.
8th World Congress on Chemical Engineering. Montreal: Energy Research Center of the
Netherlands (ECN).
Veritech (2009). Pinch Analysis: For the Efficient Use of Energy, Water and Hydrogen.
National Resources Canada.
Wang, R., & Rohr, D. (2002). Natural Gas Processing Technologies for Large Scale Solid
Oxide Fuel Cells . Fuel Chemistry Division Preprints , 506-507.
Gebeng Industrial Estate. (2010). Retrieved February 2011, from
http://www.investinpahang.gov.my
Low Temperature Methanation Catalyst . (2010). Retrieved February 2011, from
http://www.haldortopsoe.com

107
APPENDICES

108
APPENDIX 4.1
Process Flow Diagram (PFD)

109

110
APPENDIX 4.2
Piping and Instrumentation Diagram (P&ID)

111

112
APPENDIX 5.1
Plant Layout
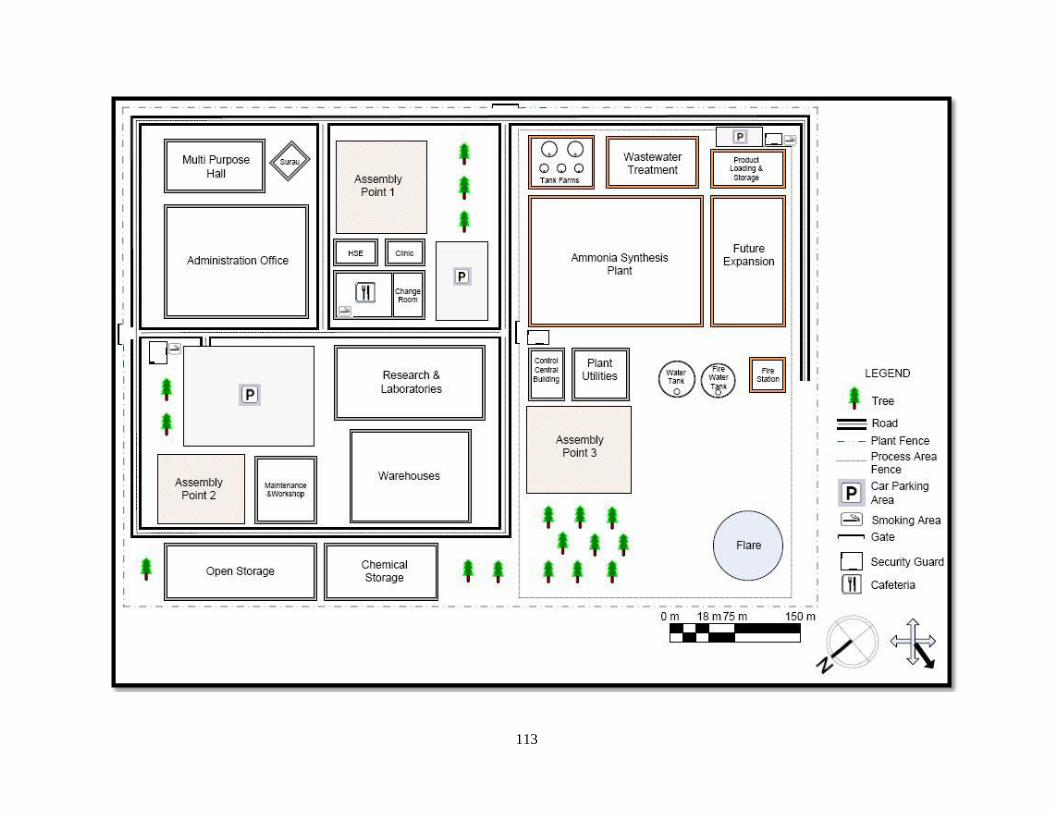
113
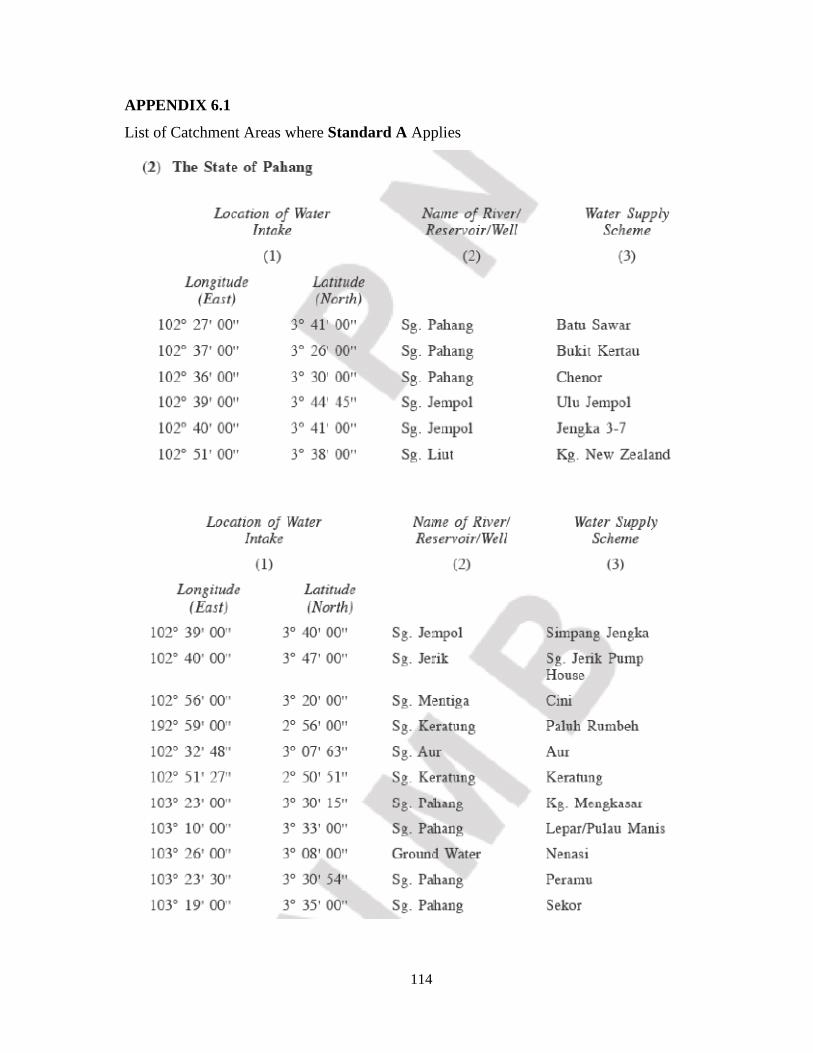
114
APPENDIX 6.1
List of Catchment Areas where Standard A Applies

115

116
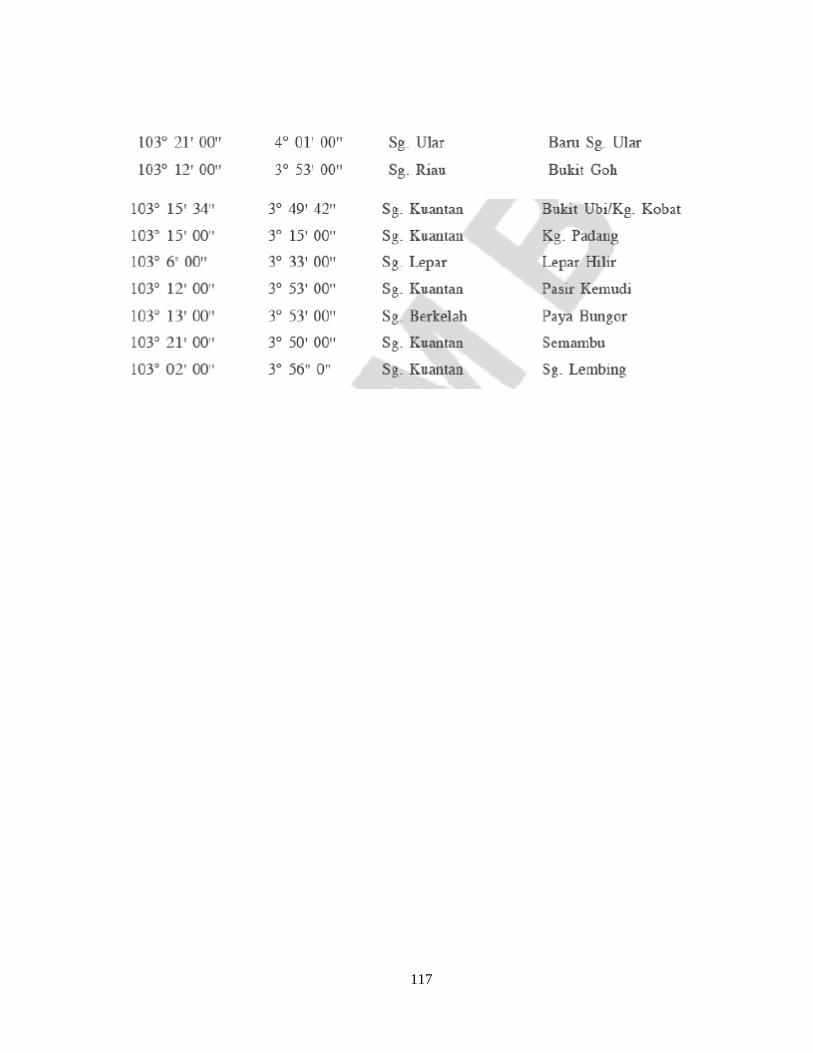
117
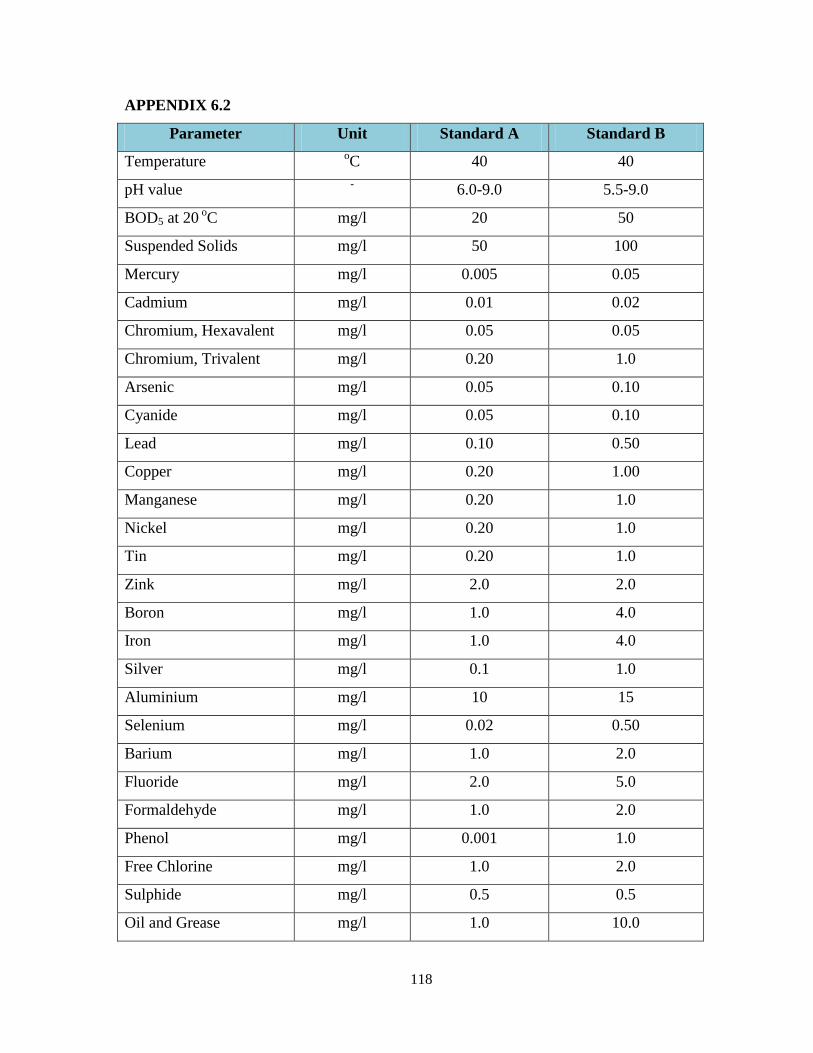
118
APPENDIX 6.2
Parameter Unit Standard A Standard B
Temperature oC 40 40
pH value -
6.0-9.0 5.5-9.0
BOD5 at 20 oC mg/l 20 50
Suspended Solids mg/l 50 100
Mercury mg/l 0.005 0.05
Cadmium mg/l 0.01 0.02
Chromium, Hexavalent mg/l 0.05 0.05
Chromium, Trivalent mg/l 0.20 1.0
Arsenic mg/l 0.05 0.10
Cyanide mg/l 0.05 0.10
Lead mg/l 0.10 0.50
Copper mg/l 0.20 1.00
Manganese mg/l 0.20 1.0
Nickel mg/l 0.20 1.0
Tin mg/l 0.20 1.0
Zink mg/l 2.0 2.0
Boron mg/l 1.0 4.0
Iron mg/l 1.0 4.0
Silver mg/l 0.1 1.0
Aluminium mg/l 10 15
Selenium mg/l 0.02 0.50
Barium mg/l 1.0 2.0
Fluoride mg/l 2.0 5.0
Formaldehyde mg/l 1.0 2.0
Phenol mg/l 0.001 1.0
Free Chlorine mg/l 1.0 2.0
Sulphide mg/l 0.5 0.5
Oil and Grease mg/l 1.0 10.0
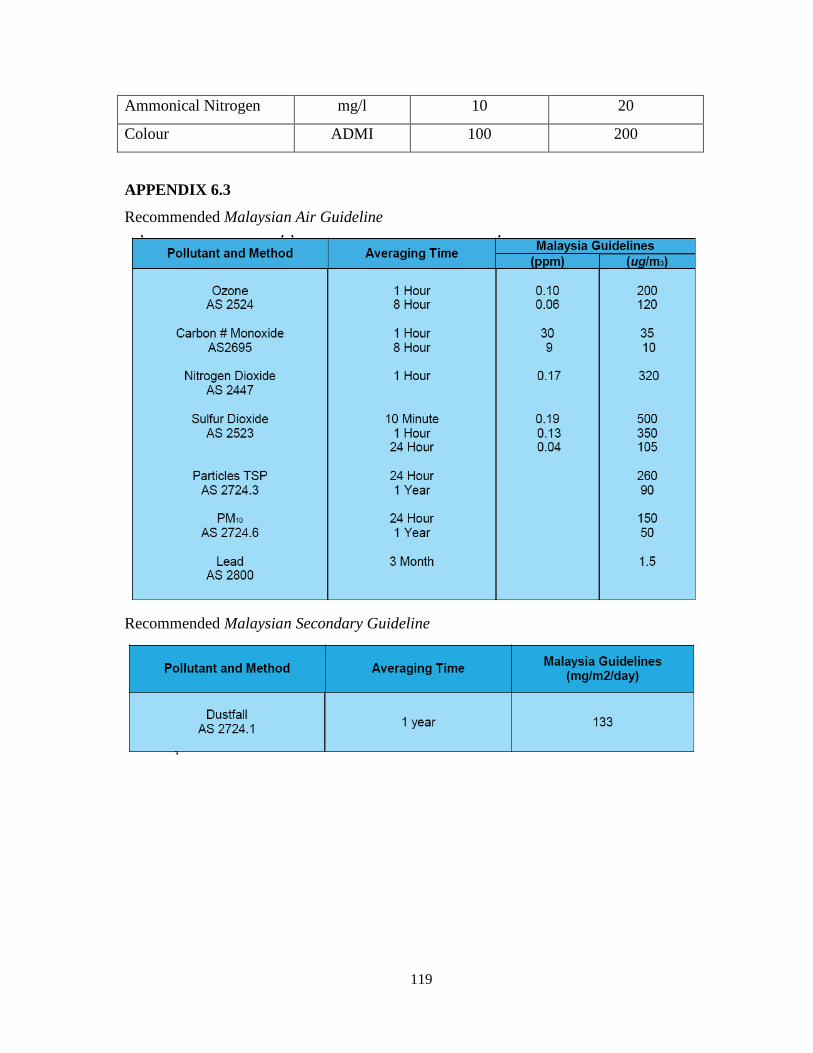
119
Ammonical Nitrogen mg/l 10 20
Colour ADMI 100 200
APPENDIX 6.3
Recommended Malaysian Air Guideline
Recommended Malaysian Secondary Guideline
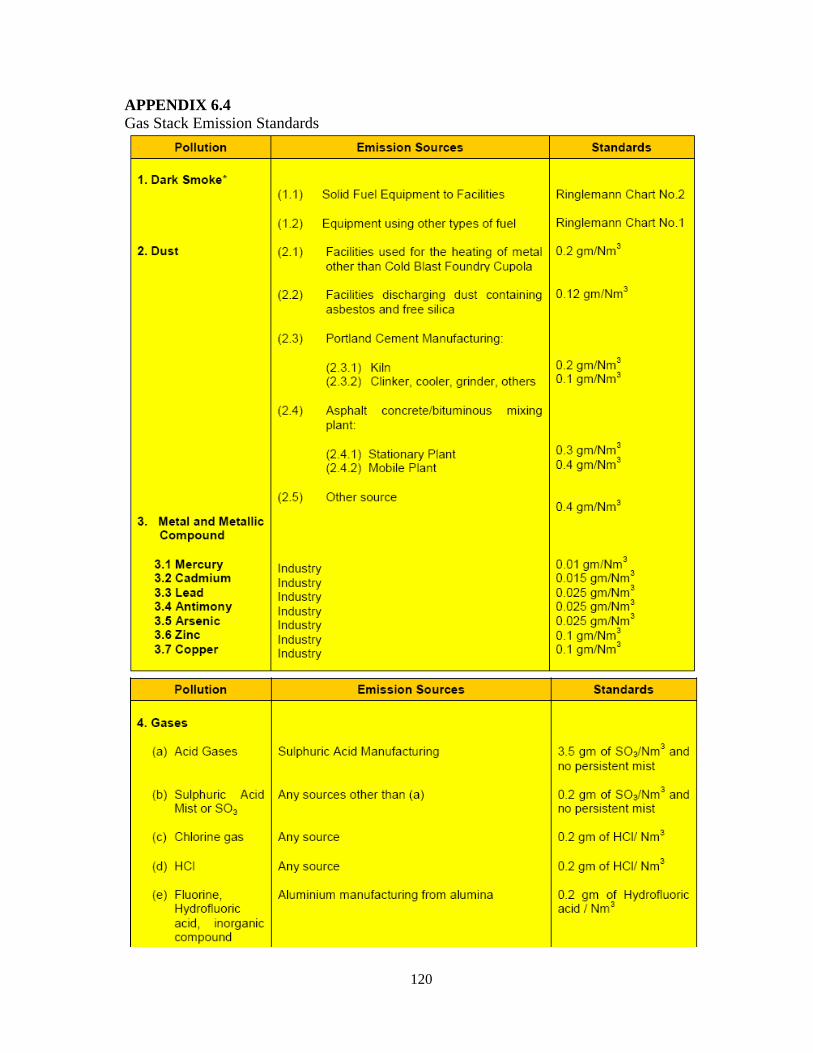
120
APPENDIX 6.4
Gas Stack Emission Standards

121

122