Embed Size (px)
Citation preview

ISSN 0127-9181
PERANGKAAN EKONOMIMALAYSIASIRI MASA
2015
MALAYSIA ECONOMICSTATISTICSTIME SERIES
JABATAN PERANGKAAN MALAYSIADEPARTMENT OF STATISTICS, MALAYSIA


KATA PENGANTAR
Penerbitan Perangkaan Ekonomi Malaysia Siri Masa menyediakan maklumat
yang komprehensif tentang prestasi sektor utama ekonomi Malaysia, terutama
dalam meneliti pembangunan sektor tersebut. Maklumat mengikut siri masa dan
sektor diperlukan untuk perancangan dan pemantauan ekonomi serta ramalan
senario masa hadapan.
Perangkaan Ekonomi Malaysia Siri Masa 2015, memuatkan maklumat utama
ekonomi antaranya berkenaan akaun negara, imbangan pembayaran,
perdagangan luar negeri, pertanian, pembuatan, pembinaan, guna tenaga dan
kependudukan. Penerbitan ini juga mengandungi semua data retrospektif bagi
setiap bidang subjek di samping mengambil pertimbangan perbandingan antara
tempoh bagi siri data.
Penerbitan ini diharapkan menjadi satu rujukan yang bermanfaat.
Penambahbaikan kandungan penerbitan ini akan dibuat secara berterusan
dengan pertambahan maklumat dan data yang terkini. Keterangan lanjut atau
maklumat terperinci boleh dirujuk daripada penerbitan yang berkaitan.
Jabatan merakamkan penghargaan kepada semua pihak yang telah memberikan
kerjasama dan bantuan dalam membekalkan data yang diperlukan untuk
menjayakan penerbitan ini. Ulasan dan cadangan ke arah memperbaiki lagi
penerbitan ini pada masa hadapan amatlah dihargai.
DATUK DR. HAJI ABDUL RAHMAN HASAN
Ketua Perangkawan
Malaysia
Disember 2015
i

PREFACE
The publication of the Malaysia Economic Statistics Time Series provides
comprehensive information on the performance of the main sectors of Malaysia’s
economy and the development of the sectors over a period of time. Information
by time series and by sectors are pertinent in the planning and monitoring of the
economy as well as forecasting the future scenario.
The Malaysia Economic Statistics Time Series 2015, contains main
economic information such as on national accounts, balance of payments,
external trade, agriculture, manufacturing, construction, employment and
population. This publication includes all the retrospective data on each subject
area while taking into consideration the intertemporal comparability of the data
series.
It is hoped that this publication serves as a useful reference. The contents of the
publication will be continually improved with additional information and latest
data. Further explanation or detailed information can be referred to the related
publications.
The Department express its appreciation to all parties concerned for their
cooperation and assistance in providing the required data to make this
publication a success. Comments and suggestions in improving this publication in
future would be greatly appreciated.
DATUK DR. HAJI ABDUL RAHMAN HASAN
Chief Statistician
Malaysia
December 2015
ii

SINGKATAN / ABBREVIATIONS
IHP : Indeks Harga PenggunaCPI : Consumer Price Index
IHPR : Indeks Harga PengeluarPPI : Producer Price Index
IMF : Tabung Kewangan AntarabangsaInternational Monetary Fund
IPP : Indeks Pengeluaran PerindustrianIIP : Index of Industrial Production
KDNK : Keluaran Dalam Negeri KasarGDP : Gross Domestic Product
PNK : Pendapatan Negara KasarGNI : Gross National Income
RM : Ringgit Malaysia
BPM5 : Balance of Payments Manual, 5th. Edition
BPM6 : Balance of Payments and International Investment Position Manual,
6th. Edition
MIC : Malaysia Industrial Classification
ISIC : International Standard Industrial Classification
MSIC : Piawaian Klasifikasi Industri MalaysiaMalaysia Standard Industrial Classification
SITC : Standard International Trade Classification
SNA 1993 : System of National Accounts, 1993
SNA 2008 : System of National Accounts, 2008
FISIM : Financial Intermediation Services Indirectly Measured
CHGS : Classification of Household Goods and Services
COICOP : Classification of Individual Consumption According to Purpose
IIP : Kedudukan Pelaburan AntarabangsaInternational Investment Position
DIA : Pelaburan Langsung di Luar NegaraDirect Investment Abroad
FDI : Pelaburan Langsung AsingForeign Direct Investment
TNB : Tenaga Nasional Berhad
SESB : Sabah Electricity Sdn. Bhd.
SEB : Sarawak Energy Berhad
IPU : Indeks Pencemaran UdaraAPI : Air Pollutant Index
JAS : Jabatan Alam SekitarDOE : Department of Environment
iii
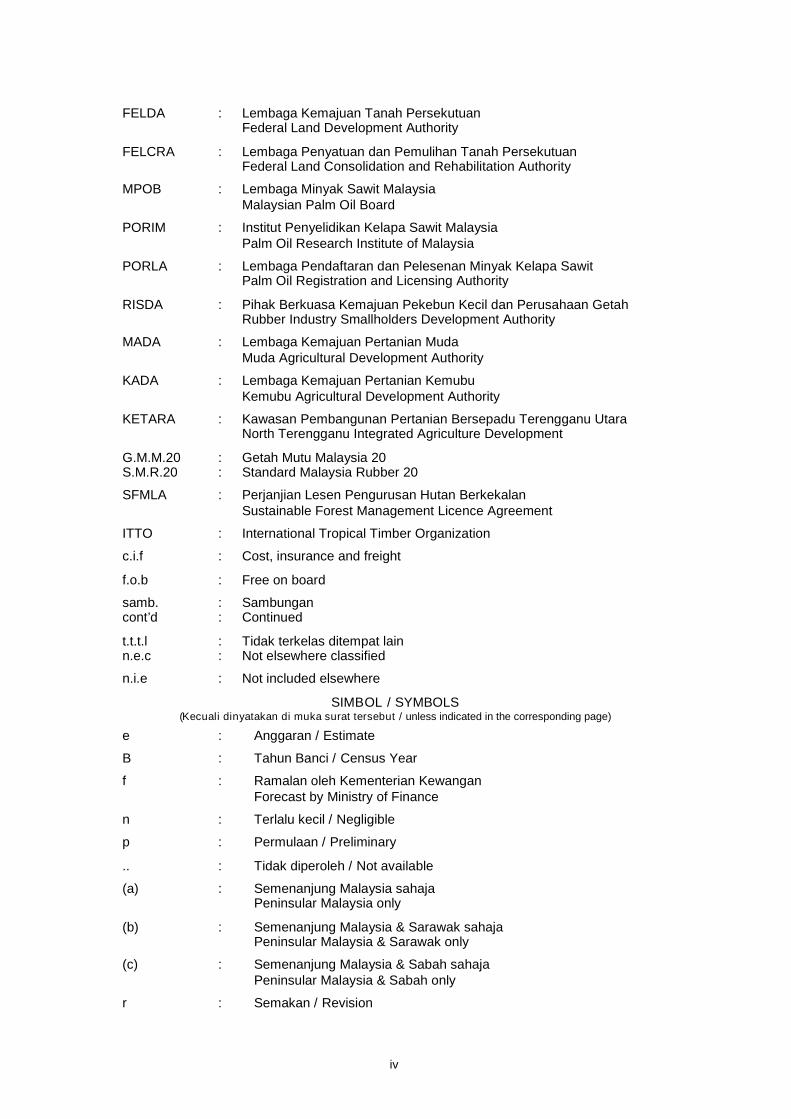
FELDA : Lembaga Kemajuan Tanah PersekutuanFederal Land Development Authority
FELCRA : Lembaga Penyatuan dan Pemulihan Tanah PersekutuanFederal Land Consolidation and Rehabilitation Authority
MPOB : Lembaga Minyak Sawit MalaysiaMalaysian Palm Oil Board
PORIM : Institut Penyelidikan Kelapa Sawit MalaysiaPalm Oil Research Institute of Malaysia
PORLA : Lembaga Pendaftaran dan Pelesenan Minyak Kelapa SawitPalm Oil Registration and Licensing Authority
RISDA : Pihak Berkuasa Kemajuan Pekebun Kecil dan Perusahaan GetahRubber Industry Smallholders Development Authority
MADA : Lembaga Kemajuan Pertanian MudaMuda Agricultural Development Authority
KADA : Lembaga Kemajuan Pertanian KemubuKemubu Agricultural Development Authority
KETARA : Kawasan Pembangunan Pertanian Bersepadu Terengganu UtaraNorth Terengganu Integrated Agriculture Development
G.M.M.20 : Getah Mutu Malaysia 20S.M.R.20 : Standard Malaysia Rubber 20
SFMLA : Perjanjian Lesen Pengurusan Hutan BerkekalanSustainable Forest Management Licence Agreement
ITTO : International Tropical Timber Organization
c.i.f : Cost, insurance and freight
f.o.b : Free on board
samb. : Sambungancont’d : Continued
t.t.t.l : Tidak terkelas ditempat lainn.e.c : Not elsewhere classified
n.i.e : Not included elsewhere
SIMBOL / SYMBOLS(Kecuali dinyatakan di muka surat tersebut / unless indicated in the corresponding page)
e : Anggaran / Estimate
B : Tahun Banci / Census Year
f : Ramalan oleh Kementerian KewanganForecast by Ministry of Finance
n : Terlalu kecil / Negligible
p : Permulaan / Preliminary
.. : Tidak diperoleh / Not available
(a) : Semenanjung Malaysia sahajaPeninsular Malaysia only
(b) : Semenanjung Malaysia & Sarawak sahajaPeninsular Malaysia & Sarawak only
(c) : Semenanjung Malaysia & Sabah sahajaPeninsular Malaysia & Sabah only
r : Semakan / Revision
iv
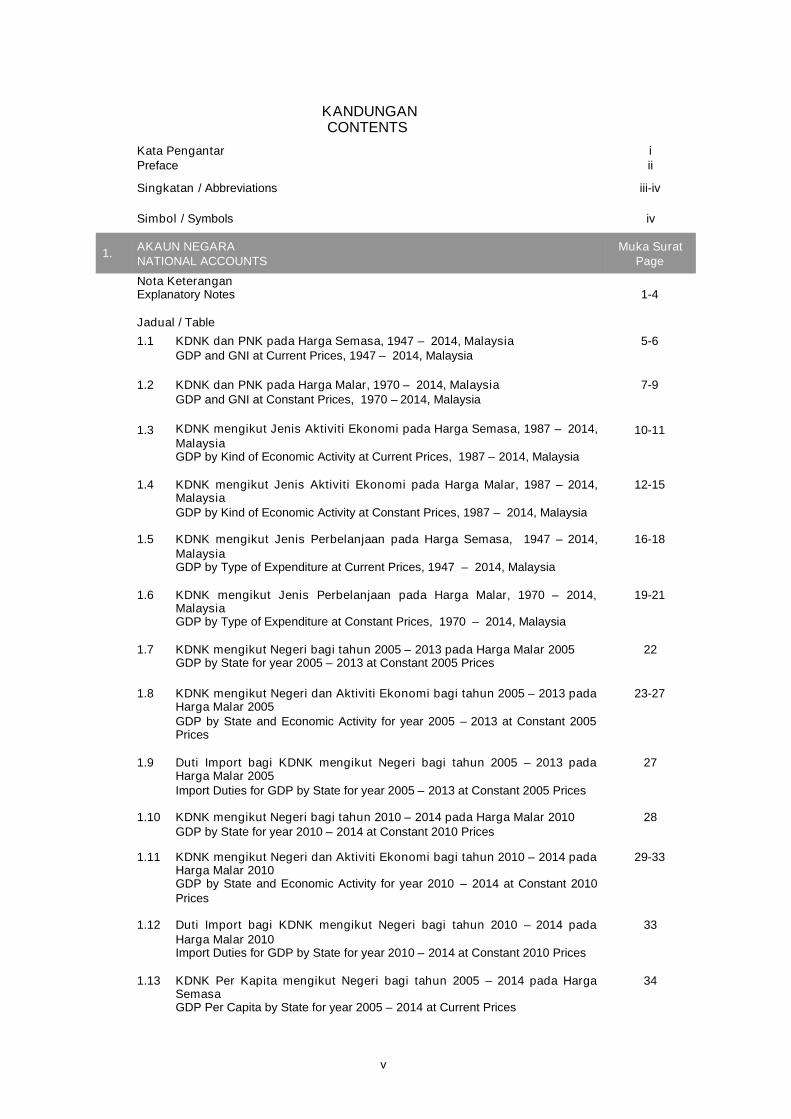
KANDUNGANCONTENTS
Kata PengantarPreface
iii
1. AKAUN NEGARANATIONAL ACCOUNTS
Muka SuratPage
Nota KeteranganExplanatory Notes 1-4
Jadual / Table
1.1 KDNK dan PNK pada Harga Semasa, 1947 – 2014, MalaysiaGDP and GNI at Current Prices, 1947 – 2014, Malaysia
5-6
1.2 KDNK dan PNK pada Harga Malar, 1970 – 2014, MalaysiaGDP and GNI at Constant Prices, 1970 – 2014, Malaysia
7-9
1.3 KDNK mengikut Jenis Aktiviti Ekonomi pada Harga Semasa, 1987 – 2014,MalaysiaGDP by Kind of Economic Activity at Current Prices, 1987 – 2014, Malaysia
10-11
1.4 KDNK mengikut Jenis Aktiviti Ekonomi pada Harga Malar, 1987 – 2014,MalaysiaGDP by Kind of Economic Activity at Constant Prices, 1987 – 2014, Malaysia
12-15
1.5 KDNK mengikut Jenis Perbelanjaan pada Harga Semasa, 1947 – 2014,MalaysiaGDP by Type of Expenditure at Current Prices, 1947 – 2014, Malaysia
16-18
1.6 KDNK mengikut Jenis Perbelanjaan pada Harga Malar, 1970 – 2014,MalaysiaGDP by Type of Expenditure at Constant Prices, 1970 – 2014, Malaysia
19-21
1.7 KDNK mengikut Negeri bagi tahun 2005 – 2013 pada Harga Malar 2005GDP by State for year 2005 – 2013 at Constant 2005 Prices
22
1.8 KDNK mengikut Negeri dan Aktiviti Ekonomi bagi tahun 2005 – 2013 padaHarga Malar 2005GDP by State and Economic Activity for year 2005 – 2013 at Constant 2005Prices
23-27
1.9 Duti Import bagi KDNK mengikut Negeri bagi tahun 2005 – 2013 padaHarga Malar 2005Import Duties for GDP by State for year 2005 – 2013 at Constant 2005 Prices
27
1.10 KDNK mengikut Negeri bagi tahun 2010 – 2014 pada Harga Malar 2010GDP by State for year 2010 – 2014 at Constant 2010 Prices
28
1.11 KDNK mengikut Negeri dan Aktiviti Ekonomi bagi tahun 2010 – 2014 padaHarga Malar 2010GDP by State and Economic Activity for year 2010 – 2014 at Constant 2010Prices
29-33
1.13 KDNK Per Kapita mengikut Negeri bagi tahun 2005 – 2014 pada HargaSemasaGDP Per Capita by State for year 2005 – 2014 at Current Prices
34
Singkatan / Abbreviations iii-iv
Simbol / Symbols iv
1.12 Duti Import bagi KDNK mengikut Negeri bagi tahun 2010 – 2014 padaHarga Malar 2010Import Duties for GDP by State for year 2010 – 2014 at Constant 2010 Prices
33
v

3. PERDAGANGAN LUAR NEGERIEXTERNAL TRADENota KeteranganExplanatory Notes 69-71
Jadual / Table
3.1 Perangkaan Utama Perdagangan Luar Negeri, 1967 – 2014, MalaysiaPrincipal Statistics of External Trade, 1967 – 2014, Malaysia
72-73
3.2 Perangkaan Utama Perdagangan Luar Negeri, Eksport & Import mengikutSeksyen Barangan, 1967 – 2014, MalaysiaPrincipal Statistics of External Trade, Exports & Imports by Commodity Section,1967 – 2014, Malaysia
74-81
2.IMBANGAN PEMBAYARANBALANCE OF PAYMENTS
Muka SuratPage
Nota KeteranganExplanatory Notes 37-40
Jadual / Table
2.1 Perangkaan Imbangan Pembayaran, 1947 – 1998, MalaysiaBalance of Payments Statistics, 1947 – 1998, Malaysia
41-51
2.2 Perangkaan Imbangan Pembayaran, 1999 – 2004, MalaysiaBalance of Payments Statistics, 1999 – 2004, Malaysia
52
2.4 Kedudukan Pelaburan Antarabangsa, 2001 – 2014, MalaysiaInternational Investment Position, 2001 – 2014, Malaysia
55-58
2.5a Kedudukan Pelaburan Langsung di Luar Negara mengikut Sektor,2008 – 2014Direct Investment Abroad Position by Sector, 2008 – 2014
59
2.6a Kedudukan Pelaburan Langsung Asing di Malaysia mengikut Sektor,2008 – 2014Foreign Direct Investment Position in Malaysia by Sector, 2008 – 2014
61
2.5b Kedudukan Pelaburan Langsung di Luar Negara mengikut Blok Negara,2008 – 2014Direct Investment Abroad Position by Blocks of Countries, 2008 – 2014
60
2.6b Kedudukan Pelaburan Langsung Asing di Malaysia mengikut BlokNegara, 2008 – 2014Foreign Direct Investment Position in Malaysia by Blocks of Countries,2008 – 2014
62
2.7a Aliran Bersih Pelaburan Langsung di Luar Negara mengikut Sektor,2008 – 2014Net Flows of Direct Investment Abroad by Sector, 2008 – 2014
63
2.7b Aliran Bersih Pelaburan Langsung di Luar Negara mengikut Blok Negara,2008 – 2014Net Flows of Direct Investment Abroad by Blocks of Countries, 2008 – 2014
64
2.8a Aliran Bersih Pelaburan Langsung Asing di Malaysia mengikut Sektor,2008 – 2014Net Flows of Foreign Direct Investment in Malaysia by Sector, 2008 – 2014
65
2.8b Aliran Bersih Pelaburan Langsung Asing di Malaysia mengikut BlokNegara, 2008 – 2014Net Flows of Foreign Direct Investment in Malaysia by Blocks of Countries,2008 – 2014
66
2.3 Perangkaan Imbangan Pembayaran, 2005 – 2014, MalaysiaBalance of Payments Statistics, 2005 – 2014, Malaysia
53-54
vi

vii
INDEKS IINDEXES
4. INDEKS HARGA PENGGUNACONSUMER PRICE INDEX
Muka SuratPage
Nota KeteranganExplanatory Notes 87-88
Jadual / Table
4.1 Indeks Harga Pengguna (2000=100) mengikut Kumpulan Utama (CHGS),1980 – 2005, MalaysiaConsumer Price Index (2000=100) by Main Groups (CHGS), 1980 – 2005,Malaysia
89
4.2 Indeks Harga Pengguna (2010=100) mengikut Kumpulan Utama(COICOP), 2003 – 2014, MalaysiaConsumer Price Index (2010=100) by Main Groups (COICOP), 2003 – 2014,Malaysia
90
5. INDEKS HARGA PENGELUAR DAN INDEKS HARGA IMPORT & EKSPORTPRODUCER PRICE INDEX AND IMPORT & EXPORT PRICE INDICES
Nota KeteranganExplanatory Notes 93-96
Jadual / Table
5.1 Indeks Harga Pengeluar (2010=100) bagi Barangan dalam EkonomiDomestik mengikut Seksyen Barangan (SITC 4), 1978 – 2014, MalaysiaProducer Price Index (2010=100) for Goods in the Domestic Economy byCommodity Sections (SITC 4), 1978 – 2014, Malaysia
97
5.2 Indeks Harga Pengeluar (2010=100) bagi Pengeluaran Tempatanmengikut Seksyen Barangan (SITC 4), 1978 – 2014, MalaysiaProducer Price Index (2010=100) for Local Production by CommoditySections (SITC 4), 1978 – 2014, Malaysia
98
5.3 Indeks Harga Import (2010=100) mengikut Seksyen Barangan (SITC 4),1978 – 2014, MalaysiaImport Price Index (2010=100) by Commodity Sections (SITC 4),1978 – 2014, Malaysia
99
5.4 Indeks Harga Eksport (2010=100) mengikut Seksyen Barangan (SITC 4),2005 – 2014, MalaysiaExport Price Index (2010=100) by Commodity Sections (SITC 4), 2005 – 2014,Malaysia
100
6. INDEKS PERDAGANGAN LUAR NEGERIEXTERNAL TRADE INDICES
Nota KeteranganExplanatory Notes 103-104
6.1 105Indeks Nilai Seunit, Volum dan Terma Perdagangan bagi Import danEksport (2005=100), 1999 – 2014, MalaysiaImport and Export Unit Value Indices, Volume Indices and Terms of Trade(2005=100), 1999 – 2014, Malaysia
Jadual / Table

viii
7.INDEKS PENGELUARAN PERINDUSTRIANINDEX OF INDUSTRIAL PRODUCTION
Muka SuratPage
Nota KeteranganExplanatory Notes 109
Jadual / Table7.1 Indeks Pengeluaran Perindustrian (2005=100), 1968 – 2010, Malaysia
Index of Industrial Production (2005=100), 1968 – 2010, Malaysia110
7.2 Indeks Pengeluaran Perindustrian (2010=100), 2010 – 2014, MalaysiaIndex of Industrial Production (2010=100), 2010 – 2014, Malaysia
111
8. INDEKS KUANTITI PERDAGANGAN EDARANVOLUME INDEX OF DISTRIBUTIVE TRADE
Muka SuratPage
Nota KeteranganExplanatory Notes 115
8.1 Indeks Kuantiti Perdagangan Edaran (2010=100), 2008 – 2014, MalaysiaVolume Index of Distributive Trade (2010=100), 2008 – 2014, Malaysia
116
PERTANIAN, PERHUTANAN & PERIKANANAGRICULTURE, FORESTRY & FISHING
9. PADIPADDY
Nota KeteranganExplanatory Notes 121-122
Jadual / Table
9.1 Perangkaan Utama Padi dan Beras mengikut Semua Musim, 1980 – 2014,MalaysiaPrincipal Statistics of Paddy and Rice by All Seasons, 1980 – 2014, Malaysia
123
9.2 Perangkaan Utama Padi dan Beras mengikut Semua Musim, 1980 – 2014,Kawasan Jelapang PadiPrincipal Statistics of Paddy and Rice by All Seasons, 1980 – 2014, GranaryAreas
124
Jadual / Table
10. GETAHRUBBER
Nota KeteranganExplanatory Notes 127
Jadual / Table10.1 Perangkaan Utama Estet Getah, 1965 – 2014, Malaysia
Principal Statistics of Rubber Estates, 1965 – 2014, Malaysia128-129
10.2 Jumlah Keluasan Hektar Tanaman dan Pengeluaran Getah, 1965 – 2014,MalaysiaTotal Planted Area Hectareage and Production of Rubber, 1965 – 2014,Malaysia
130-131
11. KELAPA SAWITOIL PALMNota KeteranganExplanatory Notes 135
Jadual / Table
11.1 Perangkaan Utama Estet Kelapa Sawit, 1974 – 2014, MalaysiaPrincipal Statistics of Oil Palm Estates, 1974 – 2014, Malaysia
136-137
11.2 Jumlah Keluasan Hektar Tanaman Kelapa Sawit, 1974 – 2014, MalaysiaTotal Planted Area Hectareage of Oil Palm, 1974 – 2014, Malaysia
138

ix
13.PERHUTANANFORESTRY
Nota KeteranganExplanatory Notes 149-150
Jadual / Table13.1 Perangkaan Utama Perhutanan dan Pembalakan, 1947 – 2014,
MalaysiaPrincipal Statistics of Forestry and Logging, 1947 – 2014, Malaysia
151-152
14. PERIKANANFISHING
Nota KeteranganExplanatory Notes 155
Jadual / Table
14.1 Perangkaan Utama Pendaratan Ikan Marin dan Pengeluaran Akuakulturdan Perikanan Darat serta Nilai, 1988 – 2014, MalaysiaPrincipal Statistics of Marine Fish Landing, Aquaculture and Inland FisheryProduction and Value, 1988 – 2014, Malaysia
156
15. PERLOMBONGAN & PENGKUARIAN BATUMINING & STONE QUARRYING
Nota KeteranganExplanatory Notes 159-160
Jadual / Table
15.1 Perangkaan Utama Industri Perlombongan, 1963 – 2013, MalaysiaPrincipal Statistics of Mining Industries, 1963 – 2013, Malaysia
161-162
15.2 Import dan Eksport Petroleum Mentah, 1963 – 2013, MalaysiaImports and Exports of Crude Petroleum, 1963 – 2013, Malaysia
163-164
15.3 Perangkaan Utama Pengkuarian Batu, 1972 – 2010, MalaysiaPrincipal Statistics of Stone Quarrying, 1972 – 2010, Malaysia
165
12.KOKOCOCOA
Muka SuratPage
Nota KeteranganExplanatory Notes 141
Jadual / Table
12.1 Perangkaan Utama Estet Koko, 1968 – 2014, MalaysiaPrincipal Statistics of Cocoa Estate, 1968 – 2014, Malaysia
142-143
12.2 Jumlah Keluasan Tanaman dan Eksport Koko, 1968 – 2014, MalaysiaTotal Planted Area and Exports of Cocoa, 1968 – 2014, Malaysia
144-145
16. PEMBUATANMANUFACTURING
Nota KeteranganExplanatory Notes 169-170
Jadual / Table
16.1 Perangkaan Utama Industri Pembuatan, 1959 – 2012, MalaysiaPrincipal Statistics of Manufacturing Industries, 1959 – 2012, Malaysia
171-172

x
18. PEMBINAANCONSTRUCTION
Nota KeteranganExplanatory Notes
185-186
Jadual / Table
18.1 Perangkaan Utama Industri Pembinaan, 1963 – 2013, MalaysiaPrincipal Statistics of Construction Industries, 1963 – 2013, Malaysia
187-188
19. PERKHIDMATANSERVICES
Nota KeteranganExplanatory Notes 191-193
Jadual / Table
19.1 Perangkaan Utama Perkhidmatan Guaman, 1971 – 2012, MalaysiaPrincipal Statistics of Legal Services, 1971 – 2012, Malaysia
194
19.2 Perangkaan Utama Perkhidmatan Perakaunan, 1971 – 2012, MalaysiaPrincipal Statistics of Accounting Services, 1971 – 2012, Malaysia
195
19.3 Perangkaan Utama Perkhidmatan Arkitek, 1971 – 2012, MalaysiaPrincipal Statistics of Architectural Services, 1971 – 2012, Malaysia
196
19.4 Perangkaan Utama Perkhidmatan Kejuruteraan, 1971 – 2012, MalaysiaPrincipal Statistics of Engineering Services, 1971 – 2012, Malaysia
197
19.5 Perangkaan Utama Perkhidmatan Juruukur, 1971 – 2012, MalaysiaPrincipal Statistics of Surveying Services, 1971 – 2012, Malaysia
198
19.6 Perangkaan Utama Perkhidmatan Pendidikan, 1971 – 2010, MalaysiaPrincipal Statistics of Education Services, 1971 – 2010, Malaysia
199
19.7 Perangkaan Utama Perkhidmatan Perubatan, 1971 – 2010, MalaysiaPrincipal Statistics of Medical Services, 1971 – 2010, Malaysia
200
19.8 Perangkaan Utama Perkhidmatan Pergigian, 1971 – 2010, MalaysiaPrincipal Statistics of Dental Services, 1971 – 2010, Malaysia
201
19.9 Perangkaan Utama Perkhidmatan Veterinar, 1971 – 2012, MalaysiaPrincipal Statistics of Veterinary Services, 1971 – 2012, Malaysia
202
19.10 Perangkaan Utama Perkhidmatan Hospital dan Rumah BersalinPersendirian, 1971 – 2010, MalaysiaPrincipal Statistics of Private Hospitals and Maternity Homes Services,1971 – 2010, Malaysia
203
19.11 Perangkaan Utama Penginapan, 1983 – 2010, MalaysiaPrincipal Statistics of Accommodation, 1983 – 2010, Malaysia
204
17. ELEKTRIKELECTRICITY
Muka SuratPage
Nota KeteranganExplanatory Notes 175
Jadual / Table
17.1 Elektrik yang dijanakan, 1955 – 2013, MalaysiaElectricity Generated, 1955 – 2013, Malaysia
176-182

xi
19. PERKHIDMATANSERVICES
Muka SuratPage
Jadual / Table
19.12 Perangkaan Utama Perkhidmatan Broker Stok, Saham, Komoditi danTukaran Wang Asing, 1971 – 2010, MalaysiaPrincipal Statistics of Stock, Share, Commodity Brokers and ForeignExchange Services, 1971 – 2010, Malaysia
205
19.13 Perangkaan Utama Perkhidmatan Hartanah, 1971 – 2012, MalaysiaPrincipal Statistics of Real Estate Services, 1971 – 2012, Malaysia
206
19.14 Perangkaan Utama Perkhidmatan Pengiklanan, 1983 – 2012, MalaysiaPrincipal Statistics of Advertising Services, 1983 – 2012, Malaysia
207
19.15 Perangkaan Utama Perkhidmatan Bas, 1971 – 2010, MalaysiaPrincipal Statistics of Bus Services, 1971 – 2010, Malaysia
208
19.16 Perangkaan Utama Pengangkutan Muatan Melalui Jalan Raya,1971 – 2010, MalaysiaPrincipal Statistics of Freight Transport by Road, 1971 – 2010, Malaysia
209
19.17 Perangkaan Utama Pengangkutan Laut, 1971 – 2010, MalaysiaPrincipal Statistics of Sea Transport, 1971 – 2010, Malaysia
210
19.18 Perangkaan Utama Pengangkutan Air Pedalaman, 2000 – 2010,MalaysiaPrincipal Statistics of Inland Water Transport , 2000 – 2010, Malaysia
211
19.19 Perangkaan Utama Pengangkutan Udara, 2000 – 2010, MalaysiaPrincipal Statistics of Air Transport, 2000 – 2010, Malaysia
211
19.20 Perangkaan Utama Perkhidmatan Kereta api / Transit Aliran Ringan,2000 – 2010, MalaysiaPrincipal Statistics of Train / Light Rail Transit Services, 2000 – 2010,Malaysia
212
19.21 Perangkaan Utama Perkhidmatan Pengendalian Kargo, 2000 – 2010,MalaysiaPrincipal Statistics Cargo Handling Services, 2000 – 2010, Malaysia
212
19.22 Perangkaan Utama Perkhidmatan Pemunggahan, 1971 – 2010, MalaysiaPrincipal Statistics of Stevedoring Services, 1971 – 2010, Malaysia
213
19.23 Perangkaan Utama Perkhidmatan Penyimpanan dan Gudang,2000 – 2010, MalaysiaPrincipal Statistics for Storage and Warehousing Services, 2000 – 2010,Malaysia
214
19.24 Perangkaan Utama Perkhidmatan Tempat Letak Kereta, 2002 – 2010,MalaysiaPrincipal Statistics of Parking Lots Services, 2002 – 2010, Malaysia
214
19.25 Perangkaan Utama Perkhidmatan Pengoperasian Lebuh Raya,2000 – 2010, MalaysiaPrincipal Statistics of Highway Operation Services, 2000 – 2010, Malaysia
215
19.26 Perangkaan Utama Perkhidmatan Pengoperasian Pelabuhan,2000 – 2010, MalaysiaPrincipal Statistics of Port Operations Services, 2000 – 2010, Malaysia
215
19.27 Perangkaan Utama Perkhidmatan Agensi Pengembaraan dan OperatorPelancongan, 1971 – 2012, MalaysiaPrincipal Statistics of Travel Agencies and Tour Operators Services,1971 – 2012, Malaysia
216

xii
19. PERKHIDMATANSERVICES
Muka SuratPage
Jadual / Table
19.28 Perangkaan Utama Agensi Perkapalan, 1971 – 2010, MalaysiaPrincipal Statistics of Shipping Agencies, 1971 – 2010, Malaysia
217
19.29 Perangkaan Utama Perkhidmatan Agensi Penghantaran, 2000 – 2010,MalaysiaPrincipal Statistics of Forwarding Agencies Services, 2000 – 2010, Malaysia
218
19.30 Perangkaan Utama Perkhidmatan Pos dan Kurier, 2000 – 2010,MalaysiaPrincipal Statistics of Post and Courier Services, 2000 – 2010, Malaysia
218
19.31 Perangkaan Utama Perkhidmatan Telekomunikasi, 2000 – 2012,MalaysiaPrincipal Statistics of Telecommunications Services, 2000 – 2012,Malaysia
219
19.32 Perangkaan Utama Perkhidmatan Komputer, 2000 – 2012, MalaysiaPrincipal Statistics of Computer Services, 2000 – 2012, Malaysia
219
19.33 Perangkaan Utama Perkhidmatan Pemprograman dan Penyiaran,2000 – 2012, MalaysiaPrincipal Statistics of Programming and Broadcasting Services,2000 – 2012, Malaysia
220
19.34 Perangkaan Utama Perkhidmatan Maklumat, 2000 – 2012, MalaysiaPrincipal Statistics of Information Services Activities, 2000 – 2012, Malaysia
220
19.35 Perangkaan Utama Perdagangan Borong, 2005 – 2014, MalaysiaPrincipal Statistics of Wholesale Trade, 2005 – 2014, Malaysia
221
19.36 Perangkaan Utama Perdagangan Runcit, 2005 – 2014, MalaysiaPrincipal Statistics of Retail Trade, 2005 – 2014, Malaysia
221
19.37 Perangkaan Utama Perdagangan Kenderaan Bermotor, 2005 – 2014,MalaysiaPrincipal Statistics of Motor Vehicle Trade, 2005 – 2014, Malaysia
222
19.38 Perangkaan Utama Aktiviti Penerbitan, 2009 – 2012, MalaysiaPrincipal Statistics of Publishing Activities, 2009 – 2012, Malaysia
222
19.39 Perangkaan Utama Aktiviti Penerbitan Wayang Gambar, Video danProgram Televisyen, Rakaman Bunyi dan Penerbitan Muzik,2010 – 2012, MalaysiaPrincipal Statistics of Motion Picture, Video and Television ProgrammeProduction, Sound Recording and Music Activities, 2010 – 2012, Malaysia
223
xiii
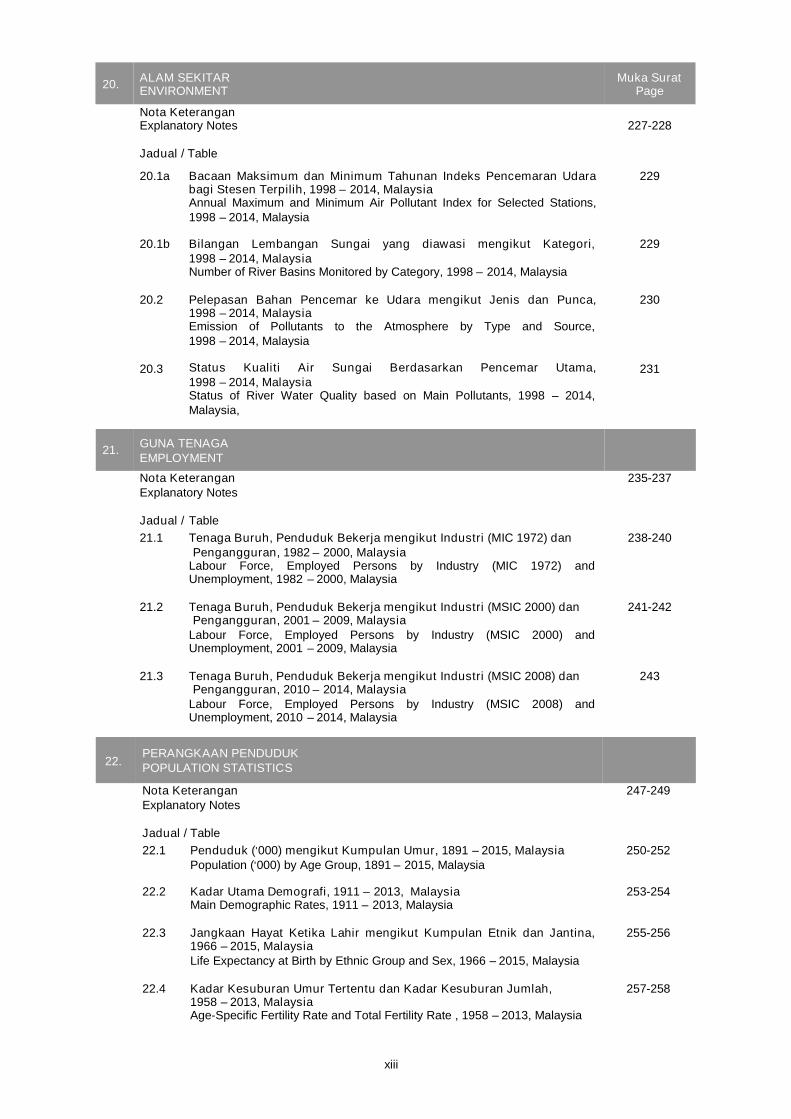
22.PERANGKAAN PENDUDUKPOPULATION STATISTICS
Nota KeteranganExplanatory Notes
247-249
Jadual / Table22.1 Penduduk ('000) mengikut Kumpulan Umur, 1891 – 2015, Malaysia
Population ('000) by Age Group, 1891 – 2015, Malaysia250-252
22.2 Kadar Utama Demografi, 1911 – 2013, MalaysiaMain Demographic Rates, 1911 – 2013, Malaysia
253-254
22.3 Jangkaan Hayat Ketika Lahir mengikut Kumpulan Etnik dan Jantina,1966 – 2015, MalaysiaLife Expectancy at Birth by Ethnic Group and Sex, 1966 – 2015, Malaysia
255-256
22.4 Kadar Kesuburan Umur Tertentu dan Kadar Kesuburan Jumlah,1958 – 2013, MalaysiaAge-Specific Fertility Rate and Total Fertility Rate , 1958 – 2013, Malaysia
257-258
21. GUNA TENAGAEMPLOYMENT
Nota KeteranganExplanatory Notes
235-237
Jadual / Table21.1 Tenaga Buruh, Penduduk Bekerja mengikut Industri (MIC 1972) dan
Pengangguran, 1982 – 2000, MalaysiaLabour Force, Employed Persons by Industry (MIC 1972) andUnemployment, 1982 – 2000, Malaysia
238-240
21.2 Tenaga Buruh, Penduduk Bekerja mengikut Industri (MSIC 2000) danPengangguran, 2001 – 2009, Malaysia
Labour Force, Employed Persons by Industry (MSIC 2000) andUnemployment, 2001 – 2009, Malaysia
241-242
21.3 Tenaga Buruh, Penduduk Bekerja mengikut Industri (MSIC 2008) danPengangguran, 2010 – 2014, Malaysia
Labour Force, Employed Persons by Industry (MSIC 2008) andUnemployment, 2010 – 2014, Malaysia
243
20. ALAM SEKITARENVIRONMENT
Muka SuratPage
Nota KeteranganExplanatory Notes 227-228
Jadual / Table
20.1a Bacaan Maksimum dan Minimum Tahunan Indeks Pencemaran Udarabagi Stesen Terpilih, 1998 – 2014, MalaysiaAnnual Maximum and Minimum Air Pollutant Index for Selected Stations,1998 – 2014, Malaysia
229
20.2 Pelepasan Bahan Pencemar ke Udara mengikut Jenis dan Punca,1998 – 2014, MalaysiaEmission of Pollutants to the Atmosphere by Type and Source,1998 – 2014, Malaysia
230
20.3 Status Kualiti Air Sungai Berdasarkan Pencemar Utama,1998 – 2014, MalaysiaStatus of River Water Quality based on Main Pollutants, 1998 – 2014,Malaysia,
231
20.1b Bilangan Lembangan Sungai yang diawasi mengikut Kategori,1998 – 2014, MalaysiaNumber of River Basins Monitored by Category, 1998 – 2014, Malaysia
229


AKAUN NEGARANATIONAL ACCOUNTS


1
AKAUN NEGARA
Nota Keterangan
1. Seksyen ini mempersembahkan akaunmakroekonomi dalam bentuk KeluaranDalam Negeri Kasar (KDNK) danPendapatan Negara Kasar (PNK) padaharga semasa dan harga malar.
2. KDNK adalah jumlah nilai barangan danperkhidmatan yang dikeluarkan dalamtempoh tertentu selepas ditolak kos barang
dan perkhidmatan yang digunakan dalamproses pengeluaran. Nilai ini merupakannilai sebelum ditolak nilai peruntukan bagimodal tetap; iaitu jumlah nilai ditambahpada harga pengeluar bagi pengeluarresiden ditambah dengan duti import.KDNK ini juga bersamaan denganperbelanjaan ke atas KDNK (pada hargapembeli) iaitu jumlah bagi semuakomponen perbelanjaan akhir ke atas
barangan dan perkhidmatan tolak denganimport barangan dan perkhidmatan.
KDNK boleh diukur dengan menggunakantiga kaedah iaitu Kaedah Pengeluaran,Perbelanjaan dan Pendapatan. Namunbegitu, penerbitan ini hanya menggunakanKaedah Pengeluaran dan Perbelanjaansahaja.
3. KDNK berasaskan Kaedah Pengeluaranboleh didefinisikan sebagai jumlah nilai
barangan dan perkhidmatan yangdikeluarkan di Malaysia setelah ditolakdengan nilai penggunaan perantaraan.Kaedah ini turut dikenali sebagai kaedahnilai ditambah yang mana ia menunjukkansumbangan setiap aktiviti ekonomiterhadap keseluruhan KDNK.
NATIONAL ACCOUNTS
Explanatory Notes
1. This section presents macroeconomicaccounts in terms of Gross DomesticProduct (GDP) and Gross NationalIncome (GNI) in both current andconstant prices.
2. GDP is the total value of all goods andservices produced in a certain periodafter deducting the cost of goods and
services used up in the process ofproduction. This value is beforededucting the al lowances forconsumption of fixed capital i.e. the sumof value added of resident producer inproducer's price plus import duties. GDPis equivalent to expenditure on the GDP(in purchaser's price) i.e. the sum of allcomponents of final expenditure ongoods and services less imports of goods
and services.
GDP can be measured by using threeapproaches namely Production,Expenditure and Income Approach.However, this publication only presents
Production and Expenditure Approach.
3. GDP based on Production Approach isdefined as value of total production ofgoods and services produced in Malaysiaafter deducting value of intermediateconsumption. This approach is alsoknown as value added approach whichwill be able to show the contribution of
each economic activity on overall GDP.

2
4. KDNK berasaskan Kaedah Perbelanjaanialah penjumlahan Penggunaan AkhirSwasta, Penggunaan Akhir Kerajaan,Pembentukan Modal Tetap Kasar,
Perubahan Inventori dan BaranganBerharga, Eksport barangan danperkhidmatan dan ditolak dengan Importbarangan dan perkhidmatan. Semua sektorini dikategorikan sebagai ‘permintaan akhir’atau ‘perbelanjaan akhir’. Kaedah inimengira nilai barangan dan perkhidmatanyang digunakan oleh pengguna akhirterhadap barangan dan perkhidmatan yangdikeluarkan oleh residen.
5. PNK merujuk pada jumlah barang danperkhidmatan yang dihasilkan dalamnegara, ditambah pendapatan diterimadaripada negara lain, tolak pembayarankepada negara lain. PNK boleh jugadiperoleh daripada KDNK denganmenambah pendapatan faktor bersih dariluar negara.
6. Penyusunan KDNK pada harga semasabermula dari tahun 1947 sehingga 2014,
manakala KDNK pada harga nilai malaradalah mengikut tahun-tahun asas yangberlainan. Tahun-tahun asas tersebut ialah :
i. KDNK/ PNK (Tahun Asas 1970)ii. KDNK/ PNK (Tahun Asas 1978)iii. KDNK/ PNK (Tahun Asas 1987)iv. KDNK/ PNK (Tahun Asas 2000)v. KDNK/ PNK (Tahun Asas 2005)vi. KDNK/PNK (Tahun Asas 2010)
7. Perangkaan Akaun Negara bagi tahun 1947hingga 1949 meliputi Persekutuan TanahMelayu dan Singapura telah disediakan olehDr. Frederic Benham, Penasihat Ekonomikepada Ketua Suruhjaya bagi UnitedKingdom di Asia Tenggara. Data inidiperoleh dari “The National Income ofMalaya, 1947–1949”.
4. GDP based on Expenditure Approach isthe summation of Private FinalConsumption, Government FinalConsumption, Gross Fixed Capital
Formation, Changes in Inventories andValuables, Exports of goods and servicesminus Imports of goods and services. Allthese sectors are categorised as ‘finaldemand’ or ‘final expenditure’. Thisapproach measures value of goods andservices used by final users on goods andservices produced by residents.
5. GNI refers to total goods and servicesproduced within the country, plus incomereceived from other countries, less similarpayments made to other countries. GNIcan also be derived from GDP by addingnet factor incomes from abroad.
6. The compilation of GDP at current pricesbegins from year 1947 to 2014, while GDP
at constant prices is based on differentbase years. The base years are:
i. GDP/ GNI (Base Year 1970)ii. GDP/ GNI (Base Year 1978)
iii. GDP/ GNI (Base Year 1987)iv. GDP/ GNI (Base Year 2000)v. GDP/ GNI (Base Year 2005)vi. GDP/GNI (Base Year 2010)
7. National Accounts Statistics for the years1947 to 1949 covering Federation of Malayaand Singapore, were prepared byDr. Frederic Benham, the Economic Adviserto the Commissioner-General for the UnitedKingdom in South East Asia. The data can
be obtained from “The National Income ofMalaya, 1947–1949”.

8. Perangkaan Akaun Negara bagi tahun1949 hingga tahun 1953 telah disediakanoleh International Bank for Reconstructionand Development. Ia meliputi PersekutuanTanah Melayu dan Singapura. Walau
bagaimanapun, tiada anggaran disediakanbagi tahun 1954.
9. Mulai tahun 1955, Jabatan PerangkaanMalaysia telah menyusun dan menerbitkanPerangkaan Akaun Negara pada hargasemasa secara tahunan. Ia diterbitkandalam Laporan Satu Misi yang dikelolaoleh International Bank for Reconstructionand Development (September, 1955).
10. Data dari 1955 sehingga 1959 merujukkepada Persekutuan Tanah Melayu. Daritahun 1960 sehingga 1962, data bolehdidapati bagi Semenanjung Malaysia.Mulai tahun 1963, data adalah merujukkepada Malaysia.
11. Siri pertama harga malar bagi tahun 1970sehingga 1983 telah disusun mengikutJadual Input-Output tahun 1970.
12. Pada tahun 1987 sehingga 2006, JabatanPerangkaan Malaysia telah menyusunKDNK dengan menggunakan pendekatanpengeluaran dan perbelanjaan pada hargasemasa dan harga malar pada tahun asas1987.
8. National Accounts Statistics for theyears 1949 to 1953 were prepared byt h e In t e rna t i ona l B an k fo rReconstruction and Development. Itcovers the Federation of Malaya andSingapore. However, no estimates are
available for the year 1954.
9. From year 1955 onwards, theDepartment of Statistics, Malaysia hascompiled and published NationalAccounts Statistics at current prices onan annual basis. It was published inReport of A Mission organized by theInternational Bank for Reconstructionand Development (September, 1955).
10. Data from 1955 to 1959 refers to theFederation of Malaya. From 1960 until1962, the data was available forPeninsular Malaysia. Starting from 1963onwards, the data is referred to Malaysia.
11. The first constant price series wascompiled for years 1970 to 1983 by usingthe 1970 Input-Output Tables.
12. In 1987 until 2006, Department ofStatistics, Malaysia has compiled theGDP by using production andexpenditure approaches in current andconstant prices at 1987 base.
3

13. Bagi tahun asas 2000, KDNK telah disusundengan menggunakan pendekatanpengeluaran dan perbelanjaan pada hargasemasa dan harga malar dari tahun 2000sehingga 2010. Bagi tahun asas 2005,
KDNK telah disusun dari tahun 2005hingga 2014. Pada harga semasa danharga malar 2005, data FISIM telahdiagihkan kepada semua aktiviti danperubahan inventori adalah termasukbarangan berharga.
Bagi Tahun Asas 2010, aktiviti ekonomidisusun mengikut Piawaian KlasifikasiIndustri Malaysia 2008 (MSIC 2008) yang
terkini. Pengasasan semula ini telahmengambil kira perubahan danpenambahbaikan terutamanya padaperubahan konsep dan metodologi,penyelarasan data serta perubahan dalamklasifikasi industri.
14. Penyusunan KDNK adalah berdasarkankonsep dan metodologi yang terdapatdalam “System of National Accounts(SNA), 1993 dan 2008” dari PertubuhanBangsa-Bangsa Bersatu.
15. Keluaran Dalam Negeri Kasar (KDNK)mengikut Negeri pada harga malar 2005telah diterbitkan daripada tahun 2005hingga 2013. Sementara itu, penyusunanmenggunakan tahun asas 2010 telahditerbitkan daripada tahun 2010 hingga2014. Penyusunan tahunan inidilaksanakan menggunakan kaedahpengeluaran. Ia merangkumi KDNK bagi
1 3 b u a h n e g e r i , W i l a y a hPersekutuan Kuala Lumpur (termasukPutrajaya) dan Labuan.
Penyusunan KDNK Mengikut Negeri telahmengguna pakai perakuan System ofNational Accounts 2008 oleh PertubuhanBangsa-Bangsa Bersatu.
13. For the 2000 base year, GDP wascompiled by using production andexpenditure approaches in current andconstant prices from year 2000 to 2010.For the 2005 base year, GDP is compiledfrom year 2005 to 2014. For current
prices and constant prices at 2005, FISIMhas been distributed to all activities andchanges in inventories are inclusive ofvaluables.
For base year 2010, the economicactivities were compiled in accordanceto the latest Malaysia Standard IndustrialClassification 2008 (MSIC 2008).Rebasing of GDP has undertaken
changes and improvements mainly inthe changes in conceptual treatment andmethodology, data reconciliation as wellas changes in industrial classification.
14. The compilation of GDP in Malaysia isbased on the concepts and methodologyoutlined in the “System of NationalAccounts (SNA), 1993 and 2008” of theUnited Nations.
15. Gross Domestic Product (GDP) by Stateat constant 2005 prices was publishedfrom year 2005 to 2013. Meanwhile,compilation using 2010 base year waspublished from year 2010 to 2014. Thisannual compilation is based on theproduction approach. It covers the GDPfor 13 states, Federal Territories ofKuala Lumpur (includes Putrajaya)and Labuan.
The compilation of GDP by State hasadopted the recommendation of theSystem of National Accounts 2008,United Nation.
4

5
JADUAL 1.1 : KDNK DAN PNK PADA HARGA SEMASA, 1947 – 2014, MALAYSIA
Tahun KDNK PNK Penduduk KDNK PNKYear GDP GNI Population per kapita per kapita
GDP GNIper capita per capita
RM (Juta/ Million) RM (Juta/ Million) ('000) RM RM
1947 3,531 3,511 5,820 607 603
1948 3,619 3,580 5,952 608 601
1949 3,550 3,400 6,066 585 561
1950 5,345 4,765 6,245 856 763
1951 7,520 6,840 6,382 1,178 1,072
1952 6,350 6,155 6,586 964 935
1953 5,780 5,690 6,829 846 833
1954 .. .. .. .. ..
1955 4,992 4,756 6,058 824 785
1956 5,060 4,842 6,252 809 774
1957 5,126 4,948 6,279 816 788
1958 4,896 4,758 6,505 753 731
1959 5,527 5,316 6,703 825 793
1960 5,866 5,616 6,919 848 812
1961 5,822 5,633 7,147 815 788
1962 6,127 5,985 7,384 830 811
1963 7,684 7,513 8,920 861 842
1964 8,187 7,960 9,168 893 868
1965 9,050 8,776 9,437 959 930
1966 9,623 9,344 9,733 989 960
1967 9,762 9,647 10,007 975 964
1968 10,195 10,074 10,253 994 983
1969 11,218 10,939 10,500 1,068 1,042
1970 11,829 11,644 10,882 1,087 1,070
1971 12,955 12,592 11,160 1,161 1,128
1972 14,220 13,842 11,441 1,243 1,210
1973 18,723 18,064 11,720 1,598 1,541
1974 22,858 21,861 12,001 1,905 1,822
1975 22,332 21,606 12,300 1,816 1,757
1976 28,085 26,988 12,588 2,231 2,144
1977 32,340 31,064 12,901 2,507 2,408
1978 37,886 36,186 13,200 2,870 2,741
1979 46,424 44,354 13,518 3,434 3,281
1980 53,308 51,390 13,879 3,841 3,703
Table 1.1 : GDP and GNI at Current Prices, 1947 – 2014, Malaysia

JADUAL 1.1 : KDNK DAN PNK PADA HARGA SEMASA, 1947 – 2014, MALAYSIA (samb.)Table 1.1 : GDP and GNI at Current Prices, 1947 – 2014, Malaysia (cont’d)
Tahun KDNK PNK Penduduk KDNK PNKYear GDP GNI Population per kapita per kapita
GDP GNIper capita per capita
RM (Juta/ Million) RM (Juta/ Million) ('000) RM RM
1981 57,613 55,602 14,257 4,041 3,900
1982 62,599 59,710 14,651 4,273 4,075
1983 70,444 66,033 15,048 4,681 4,388
1984 79,550 74,182 15,450 5,149 4,801
1985 77,470 71,962 15,883 4,878 4,531
1986 71,594 66,818 16,329 4,384 4,092
1987 81,085 76,104 16,774 4,834 4,537
1988 92,370 87,286 17,219 5,364 5,069
1989 105,233 99,330 17,662 5,958 5,624
1990 119,081 114,017 18,102 6,578 6,298
1991 135,124 128,324 18,547 7,285 6,919
1992 150,682 142,676 19,043 7,903 7,492
1993 172,194 163,928 19,564 8,785 8,379
1994 195,461 186,049 20,112 9,704 9,251
1995 222,473 212,095 20,689 10,757 10,251
1996 253,732 241,931 21,169 11,956 11,429
1997 281,795 266,699 21,666 12,945 12,310
1998 283,243 267,923 22,180 12,682 12,080
1999 300,764 279,878 22,714 13,128 12,322
2000 356,401 327,492 23,495 15,169 13,939
2001 352,579 326,956 24,123 14,672 13,553
2002 383,213 358,152 24,727 15,614 14,484
2003 418,769 396,232 25,320 16,725 15,649
2004 474,048 449,646 25,905 18,560 17,357
2005 543,578 519,635 26,046 20,868 19,951
2006 596,784 579,490 26,550 22,478 21,826
2007 665,340 651,355 27,058 24,589 24,072
2008 769,949 746,915 27,568 27,929 27,094
2009 712,857 698,643 28,082 25,385 24,879
2010 821,434 795,303 28,589 28,733 27,819
2011 911,733 890,133 29,062 31,372 30,629
2012 971,252 935,410 29,510 32,913 31,698
2013e 1,018,821 984,846 30,214 33,721 32,596
2014p 1,106,580 1,069,258 30,598 36,165 34,945
Nota / Notes:1947-1953 Persekutuan Tanah Melayu dan Singapura / Federation of Malaya and Singapore1955-1959 Persekutuan Tanah Melayu / Federation of Malaya1960-1962 Semenanjung Malaysia / Peninsular Malaysia1963-2014 Malaysia
Nilai KDNK Per Kapita dan PNK Per Kapita tahun 2013 dan 2014 dikira menggunakan data anggaran penduduk yangtelah disemak semulaThe Values of GDP Per Capita and GNI Per Capita 2013 and 2014 based on the revised population estimation
6

JADUAL 1.2 : KDNK DAN PNK PADA HARGA MALAR, 1970 – 2014, MALAYSIATable 1.2 : GDP and GNI at Constant Prices, 1970 – 2014, Malaysia
Tahun KDNK PNK Penduduk KDNK PNKYear GDP GNI Population per kapita per kapita
GDP GNI
RM (Juta/ Million) RM (Juta/ Million) ('000) RM RM
(1970=100)
1970 11,829 11,644 10,882 1,087 1,070
1971 13,016 12,667 11,160 1,166 1,135
1972 14,238 13,903 11,441 1,244 1,215
1973 15,904 15,365 11,720 1,357 1,311
1974 17,227 16,545 12,001 1,435 1,379
1975 17,365 16,918 12,300 1,412 1,375
1976 19,373 18,731 12,588 1,539 1,488
1977 20,875 20,146 12,901 1,618 1,562
1978 22,264 21,343 13,200 1,687 1,617
1979 24,324 23,268 13,518 1,799 1,721
1980 26,228 25,260 13,879 1,890 1,820
1981 28,092 27,086 14,257 1,970 1,900
1982 29,677 28,393 14,651 2,026 1,938
1983 31,442 29,640 15,048 2,089 1,970
(1978=100)
1978 37,886 36,186 13,200 2,870 2,741
1979 41,428 39,494 13,518 3,065 2,922
1980 44,511 42,950 13,879 3,207 3,095
1981 47,601 46,175 14,257 3,339 3,239
1982 50,430 48,294 14,651 3,442 3,296
1983 53,583 50,158 15,048 3,561 3,333
1984 57,742 53,513 15,450 3,737 3,464
1985 57,150 52,716 15,883 3,598 3,319
1986 57,859 54,266 16,329 3,543 3,323
1987 60,863 57,164 16,774 3,629 3,408
1988 66,303 62,602 17,219 3,815 3,636
1989 72,405 68,320 17,662 4,099 3,868
1990 79,455 76,030 18,102 4,389 4,200
1991 86,345 81,707 18,547 4,655 4,405
1992 92,866 87,667 19,068 4,870 4,598
1993 100,617 95,291 19,602 5,133 4,861
1994 109,915 103,932 20,142 5,457 5,160
1995 120,272 113,704 20,682 5,815 5,498
1996 130,621 123,166 21,223 6,155 5,804
1997 140,684 132,811 21,769 6,462 6,101
per capita per capita
7

8
JADUAL 1.2 : KDNK DAN PNK PADA HARGA MALAR, 1970 – 2014, MALAYSIA (samb.)Table 1.2 : GDP and GNI at Constant Prices, 1970 – 2014, Malaysia (cont’d)
Tahun KDNK PNK Penduduk KDNK PNKYear GDP GNI Population per kapita per kapita
GDP GNIper capita per capita
RM (Juta/ Million) RM (Juta/ Million) ('000) RM RM
(1987=100)
1987 81,085 76,104 16,774 4,834 4,537
1988 89,143 84,729 17,219 5,177 4,921
1989 97,219 92,091 17,662 5,504 5,214
1990 105,977 101,657 18,102 5,854 5,616
1991 116,093 110,443 18,547 6,259 5,955
1992 126,408 118,224 19,043 6,629 6,208
1993 138,916 130,118 19,564 7,087 6,651
1994 151,713 141,890 20,112 7,532 7,055
1995 166,625 155,204 20,689 8,057 7,502
1996 183,292 170,104 21,169 8,637 8,036
1997 196,714 182,298 21,666 9,036 8,414
1998 182,237 172,787 22,180 8,160 7,790
1999 193,422 179,794 22,714 8,443 7,916
2000 210,557 191,287 23,495 8,962 8,142
2001 211,227 193,585 24,031 8,790 8,062
2002 220,422 203,169 24,527 8,981 8,284
2003 232,496 217,292 25,048 9,286 8,675
2004 249,314 233,443 25,581 9,761 9,126
2005 262,175 246,210 26,128 10,066 9,423
(2000=100)
2000 356,401 327,492 23,495 15,169 13,939
2001 358,246 331,740 24,123 14,908 13,752
2002 377,559 351,671 24,727 15,384 14,222
2003 399,414 376,809 25,320 15,952 15,882
2004 426,508 402,838 25,905 16,699 15,551
2005 449,250 424,261 26,477 17,249 16,024
2006 475,526 455,784 26,832 17,911 16,987
2007 506,341 482,819 27,186 18,713 17,760
2008 530,683 494,323 27,541 19,250 17,949
2009 522,001 497,436 27,895 18,589 17,832
2010 559,554 516,833 28,251 19,573 18,295

9
JADUAL 1.2 : KDNK DAN PNK PADA HARGA MALAR, 1970 – 2014, MALAYSIA (samb.)Table 1.2 : GDP and GNI at Constant Prices, 1970 – 2014, Malaysia (cont’d)
Tahun KDNK PNK Penduduk KDNK PNKYear GDP GNI Population per kapita per kapita
GDP GNIper capita per capita
RM (Juta/ Million) RM (Juta/ Million) ('000) RM RM
(2005=100)
2005 543,518 519,576 26,046 20,868 19,949
2006 573,936 554,242 26,550 21,617 20,875
2007 610,087 589,003 27,058 22,547 21,768
2008 639,565 605,386 27,568 23,200 21,960
2009 629,885 607,948 28,082 22,431 21,649
2010 676,653 635,743 28,589 23,669 22,238
2011 711,760 667,303 29,062 24,491 22,961
2012e 751,934 693,570 29,510 25,481 23,503
2013p 787,611 730,485 29,915 26,328 24,418
2014p 835,040 774,626 30,262 27,594 25,598
(2010=100)
2010 821,434 795,303 28,589 28,733 27,819
2011 864,920 839,052 29,062 29,761 28,871
2012 912,261 871,804 29,510 30,914 29,543
2013e 955,260 916,903 30,214 31,617 30,347
2014p 1,012,506 971,916 30,598 33,091 31,764
Nota / Notes:
1947-1953 Persekutuan Tanah Melayu dan Singapura / Federation of Malaya and Singapore
1955-1959 Persekutuan Tanah Melayu / Federation of Malaya
1960-1962 Semenanjung Malaysia / Peninsular Malaysia
1963-2014 Malaysia
Nilai KDNK Per Kapita dan PNK Per Kapita tahun 2013 dan 2014 dikira menggunakan data anggaran penduduk yangtelah disemak semulaThe Values of GDP Per Capita and GNI Per Capita 2013 and 2014 based on the revised population estimation

10
JADUAL 1.3 : KDNK MENGIKUT JENIS AKTIVITI EKONOMI PADA HARGA SEMASA, 1987 – 2014, MALAYSIATable 1.3 : GDP by Kind of Economic Activity at Current Prices, 1987 – 2014, Malaysia
RM (Juta/ Million)
Tahun Pertanian,Ternakan,
Perhutanan danPerikanan
Perlombongandan Pengkuarian
Pembuatan Pembinaan PerkhidmatanServices
Utiliti PerdaganganBorong dan Runcit,
Penginapan,Makanan dan
Minuman
Year Agriculture,Livestock, Forestry
and Fishing
Mining andQuarrying
Manufacturing Construction Utilities Wholesale and RetailTrade,
Accommodation, Foodand Beverage
1987 16,185 10,235 16,058 2,818 2,129 8,720
1988 18,540 10,107 20,157 2,866 2,300 10,689
1989 19,028 10,796 25,048 3,475 2,568 13,297
1990 18,120 14,111 28,847 4,649 2,643 16,171
1991 19,398 13,725 34,524 5,939 2,708 19,404
1992 21,958 12,399 38,910 7,396 3,295 22,238
1993 23,741 11,037 44,643 9,054 4,289 25,924
1994 26,702 10,426 52,072 10,909 4,858 30,186
1995 28,809 13,864 58,684 13,747 5,813 34,132
1996 29,637 16,598 70,646 16,641 6,560 37,794
1997 31,283 19,432 79,974 18,474 7,726 41,529
1998 37,706 19,055 81,525 14,507 9,188 43,169
1999 32,610 23,081 93,045 13,987 9,619 44,378
2000 30,647 37,617 109,998 13,971 10,629 47,934
2001 28,245 33,945 103,434 14,241 11,281 49,201
2002 34,432 34,169 112,076 14,673 11,970 51,326
2003 38,971 41,918 125,332 15,200 12,607 53,062
2004 43,949 56,881 144,007 15,458 13,711 59,401
2005 44,912 72,111 149,754 16,107 14,076 74,641
2006 51,383 81,759 164,510 16,451 14,878 81,528
2007 66,446 88,332 173,804 18,739 15,840 95,353
2008 76,753 120,170 189,105 21,156 16,855 114,197
2009 65,719 81,342 169,661 23,187 17,852 115,263
2010 82,882 89,793 192,493 28,213 22,173 134,634
2011 104,424 95,905 212,618 30,892 23,676 151,000
2012 95,122 101,474 224,730 37,909 25,699 161,393
2013e 92,754 103,484 232,720 42,764 27,428 174,764
2014p 98,150 109,123 253,392 48,741 30,923 197,576

11
JADUAL 1.3 : KDNK MENGIKUT JENIS AKTIVITI EKONOMI PADA HARGA SEMASA, 1987 – 2014, MALAYSIA (samb.)Table 1.3 : GDP by Kind of Economic Activity at Current Prices, 1987 – 2014, Malaysia (cont’d)
RM (Juta/ Million)
Tahun Perkhidmatan Tolak :FISIM yang
Tidak Diagihkan
Campur :Duti Import
KDNK padaHarga Pembeli
Pengangkutan,Penyimpanan,Maklumat danKomunikasi
Kewangan,Insurans,
Hartanah danPerkhidmatan
Perniagaan
Perkhidmatan-perkhidmatan
Lain
PerkhidmatanKerajaan
Year Transport,Storage,
Information andCommunication
Finance,Insurance, Real
Estate andBusiness Services
Other Services GovernmentServices
Less :Undistributed
FISIM
Plus :Import Duties
GDP atPurchasers'
Prices
1987 5,267 6,239 5,526 8,853 3,261 2,316 81,085
1988 5,801 7,032 6,191 9,217 3,467 2,936 92,370
1989 6,551 9,445 6,729 10,335 5,597 3,558 105,233
1990 7,026 10,707 7,572 11,149 6,220 4,305 119,081
1991 8,505 12,243 8,757 11,653 6,884 5,151 135,124
1992 9,215 15,018 9,971 12,366 7,707 5,625 150,682
1993 10,798 21,001 11,408 13,465 9,253 6,086 172,194
1994 12,902 22,946 13,016 14,662 10,618 7,400 195,461
1995 14,964 25,758 14,891 16,780 12,529 7,559 222,473
1996 16,761 32,716 17,052 17,216 16,057 8,169 253,732
1997 18,762 38,210 18,743 18,704 19,858 8,815 281,795
1998 19,433 37,774 19,996 18,335 22,760 5,316 283,243
1999 20,290 38,326 20,836 20,184 22,052 6,459 300,764
2000 24,898 48,287 21,324 22,576 17,308 5,826 356,401
2001 26,488 50,987 22,594 24,104 17,594 5,653 352,579
2002 28,197 55,828 23,810 27,450 17,324 6,605 383,213
2003 30,172 57,914 24,891 29,569 17,374 6,507 418,769
2004 33,319 60,531 26,099 31,827 17,531 6,396 474,048
2005 36,434 66,015 27,500 35,656 - 6,372 543,578
2006 39,289 72,521 28,762 40,045 - 5,659 596,784
2007 43,009 80,827 30,812 46,210 - 5,969 665,340
2008 46,482 89,966 33,058 54,675 - 7,531 769,949
2009 46,900 94,257 35,123 56,588 - 6,964 712,857
2010 68,511 93,939 36,766 64,359 - 7,672 821,434
2011 73,701 99,118 39,297 72,390 - 8,711 911,733
2012 79,620 108,044 41,514 85,560 - 10,186 971,252
Services
2013e 85,973 113,993 44,216 89,960 - 10,763 1,018,821
2014p 93,509 120,907 46,873 95,438 - 11,947 1,106,580

12
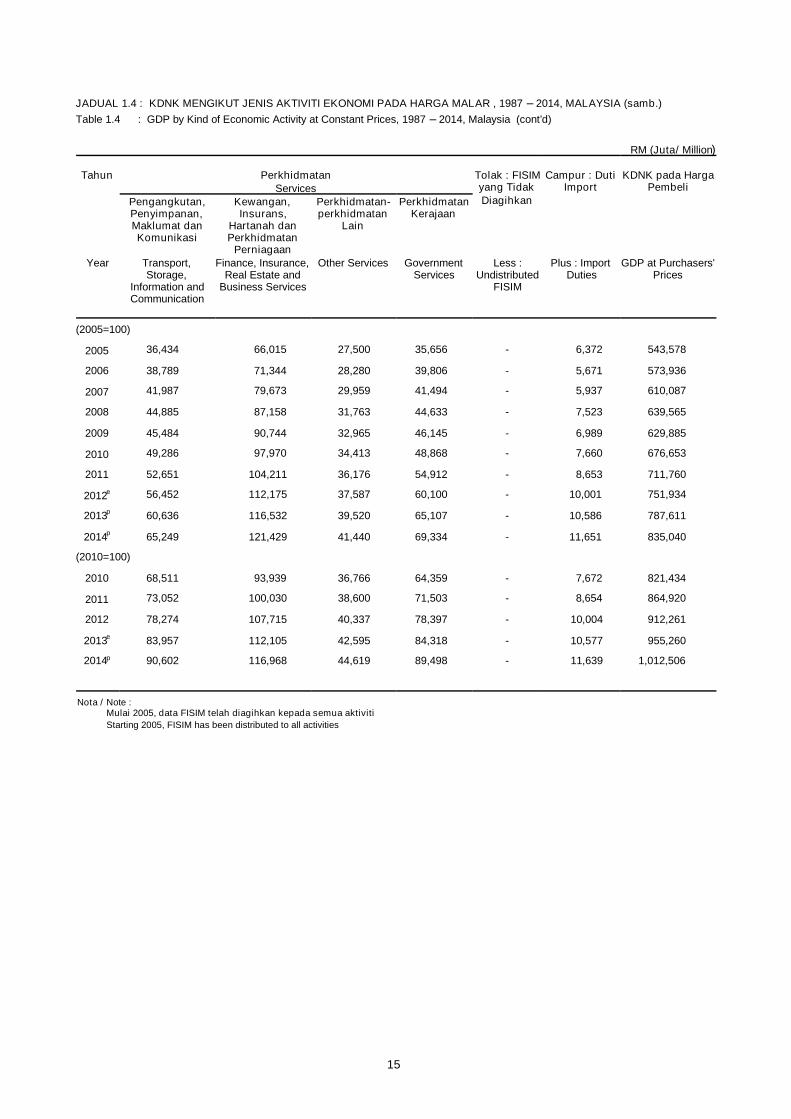
JADUAL 1.4 : KDNK MENGIKUT JENIS AKTIVITI EKONOMI PADA HARGA MALAR , 1987 – 2014, MALAYSIATable 1.4 : GDP by Kind of Economic Activity at Constant Prices, 1987 – 2014, Malaysia
RM (Juta/ Million)
Tahun Pertanian,Ternakan,
Perhutanan danPerikanan
Perlombongandan Pengkuarian
Pembuatan Pembinaan PerkhidmatanServices
Utiliti PerdaganganBorong dan Runcit,
Penginapan,Makanan dan
Minuman
Year Agriculture, Livestock,Forestry and Fishing
Mining andQuarrying
Manufacturing Construction Utilities Wholesale and RetailTrade,
Accommodation,Food and Beverage
(1987=100)
1987 16,185 10,235 16,058 2,818 2,129 8,720
1988 16,624 11,309 18,786 2,853 2,357 10,255
1989 17,415 9,955 22,604 3,163 2,671 12,054
1990 17,308 9,968 26,060 3,750 2,833 14,019
1991 17,292 10,432 29,708 4,333 2,838 16,277
1992 18,478 10,910 31,788 4,799 3,370 18,282
1993 17,898 10,475 36,423 5,317 4,335 20,267
1994 17,559 11,099 40,566 6,122 4,940 22,702
1995 17,114 13,643 45,174 7,411 5,876 25,304
1996 17,890 14,040 53,387 8,610 6,441 27,297
1997 18,010 14,305 58,788 9,522 6,070 29,484
1998 17,512 14,357 50,899 7,241 6,745 28,489
1999 17,596 15,344 56,840 6,926 7,078 29,383
2000 18,662 15,385 67,250 6,964 8,278 31,116
2001 18,551 15,160 63,299 7,108 8,568 31,907
2002 19,064 15,810 66,019 7,251 9,075 32,732
2003 20,109 16,720 71,691 7,359 9,594 33,235
2004 21,107 17,372 78,742 7,248 10,297 35,626
2005 21,626 17,504 82,724 7,133 10,873 38,459
(2000=100)
2000 30,647 37,617 109,998 13,971 10,629 47,934
2001 30,594 36,980 105,301 14,427 11,062 48,974
2002 31,471 38,610 109,640 14,762 11,759 50,986
2003 33,369 40,959 119,687 15,031 12,282 51,965
2004 34,929 42,627 131,127 14,903 13,100 56,441
2005 35,835 42,472 137,940 14,685 13,851 61,346
2006 37,701 42,030 147,154 14,639 14,523 65,492
2007 38,177 42,881 151,257 15,707 15,106 74,380
2008 39,825 41,831 153,078 16,365 15,475 82,040
2009 40,083 39,209 138,784 17,329 15,604 83,472
2010 40,916 39,270 154,640 18,220 16,879 89,779

13
JADUAL 1.4 : KDNK MENGIKUT JENIS AKTIVITI EKONOMI PADA HARGA MALAR , 1987 – 2014, MALAYSIA (samb.)Table 1.4 : GDP by Kind of Economic Activity at Constant Prices, 1987 – 2014, Malaysia (cont’d)
RM (Juta/ Million)
Tahun Perkhidmatan Tolak : FISIMyang TidakDiagihkan
Campur : DutiImport
KDNK padaHarga Pembeli
Pengangkutan,Penyimpanan,Maklumat danKomunikasi
Kewangan,Insurans, Hartanahdan Perkhidmatan
Perniagaan
Perkhidmatan-perkhidmatan
Lain
PerkhidmatanKerajaan
Year Transport,Storage,
Information andCommunication
Finance, Insurance,Real Estate and
Business Services
Other Services GovernmentServices
Less :Undistributed
FISIM
Plus : ImportDuties
GDP atPurchasers'
Prices
(1987=100)1987 5,267 6,239 5,526 8,853 3,261 2,316 81,085
1988 5,708 6,522 6,248 9,092 3,469 2,857 89,143
1989 6,348 7,674 6,818 9,132 3,924 3,309 97,219
1990 7,124 8,694 7,631 9,318 4,681 3,954 105,977
1991 7,777 10,033 8,596 9,738 5,551 4,620 116,093
1992 8,239 12,067 9,389 10,304 6,316 5,097 126,408
1993 9,240 15,118 10,335 11,043 6,980 5,444 138,916
1994 10,967 15,756 11,429 11,639 7,727 6,661 151,713
1995 12,298 17,287 12,780 11,803 8,888 6,823 166,625
1996 13,208 20,220 13,792 12,004 10,954 7,356 183,292
1997 14,764 24,044 14,760 13,041 13,759 7,684 196,714
1998 14,720 23,583 15,036 13,180 13,956 4,430 182,236
1999 15,354 24,976 15,447 14,055 14,896 5,319 193,422
2000 16,858 26,755 16,070 14,331 15,832 4,721 210,557
2001 18,249 29,288 17,185 14,997 17,678 4,594 211,227
2002 18,996 33,461 17,917 15,786 21,073 5,384 220,422
2003 20,011 35,563 18,500 17,053 22,622 5,282 232,496
2004 21,701 38,064 19,399 18,223 23,461 4,995 249,314
2005 23,045 40,245 20,346 19,604 24,296 4,912 262,175
(2000=100)
2000 24,898 48,287 21,324 22,576 17,308 5,826 356,401
2001 26,409 50,570 22,223 23,583 17,505 5,629 358,246
2002 27,441 55,392 23,105 24,816 17,018 6,594 377,559
2003 28,621 58,011 23,996 26,693 17,654 6,453 399,414
2004 30,973 60,775 24,996 28,243 17,705 6,099 426,508
2005 32,870 65,541 26,064 30,371 17,742 6,017 449,250
2006 35,185 71,253 27,234 33,412 18,385 5,287 475,526
2007 38,191 80,893 28,737 35,099 19,607 5,521 506,341
2008 40,974 85,996 30,252 38,335 20,412 6,924 530,683
2009 41,713 90,004 31,580 39,671 21,897 6,449 522,001
2010 44,944 96,194 32,833 41,981 23,171 7,068 559,554
Services

14
JADUAL 1.4 : KDNK MENGIKUT JENIS AKTIVITI EKONOMI PADA HARGA MALAR , 1987 – 2014, MALAYSIA (samb.)Table 1.4 : GDP by Kind of Economic Activity at Constant Prices, 1987 – 2014, Malaysia (cont’d)
RM (Juta/ Million)
Tahun Pertanian,Ternakan,
Perhutanan danPerikanan
Perlombongandan Pengkuarian
Pembuatan Pembinaan PerkhidmatanServices
Utiliti PerdaganganBorong dan Runcit,
Penginapan,Makanan dan
Minuman
Year Agriculture, Livestock,Forestry and Fishing
Mining andQuarrying
Manufacturing Construction Utilities Wholesale and RetailTrade,
Accommodation,Food and Beverage
(2005=100)
2005 44,852 72,111 149,754 16,107 14,076 74,641
2006 47,533 71,276 160,880 16,022 14,728 79,607
2007 48,188 72,758 165,879 17,391 15,415 91,405
2008 50,036 70,996 167,148 18,151 15,930 101,343
2009 50,063 66,386 152,150 19,270 16,246 103,444
2010 51,263 66,182 170,261 21,459 17,496 111,796
2011 54,250 62,607 178,237 22,464 18,133 119,465
2012e 54,963 63,243 186,748 26,640 18,918 125,108
2013p 56,095 63,680 193,237 29,554 19,687 132,979
2014p 57,528 65,650 205,200 32,984 20,375 144,200
(2010=100)
2010 82,882 89,793 192,493 28,213 22,173 134,634
2011 88,555 85,373 202,960 29,524 23,048 143,620
2012 89,406 86,751 211,921 34,880 24,169 150,407
2013e 91,097 87,789 219,216 38,646 25,226 159,735
2014p 92,979 90,645 232,868 43,190 26,178 173,321
15
JADUAL 1.4 : KDNK MENGIKUT JENIS AKTIVITI EKONOMI PADA HARGA MALAR , 1987 – 2014, MALAYSIA (samb.)Table 1.4 : GDP by Kind of Economic Activity at Constant Prices, 1987 – 2014, Malaysia (cont’d)
RM (Juta/ Million)
Tahun Perkhidmatan Tolak : FISIMyang TidakDiagihkan
Campur : DutiImport
KDNK pada HargaPembeliServices
Pengangkutan,Penyimpanan,Maklumat danKomunikasi
Kewangan,Insurans,
Hartanah danPerkhidmatan
Perniagaan
Perkhidmatan-perkhidmatan
Lain
PerkhidmatanKerajaan
Year Transport,Storage,
Information andCommunication
Finance, Insurance,Real Estate and
Business Services
Other Services GovernmentServices
Less :Undistributed
FISIM
Plus : ImportDuties
GDP at Purchasers'Prices
(2005=100)
2005 36,434 66,015 27,500 35,656 - 6,372 543,578
2006 38,789 71,344 28,280 39,806 - 5,671 573,936
2007 41,987 79,673 29,959 41,494 - 5,937 610,087
2008 44,885 87,158 31,763 44,633 - 7,523 639,565
2009 45,484 90,744 32,965 46,145 - 6,989 629,885
2010 49,286 97,970 34,413 48,868 - 7,660 676,653
2011 52,651 104,211 36,176 54,912 - 8,653 711,760
2012e 56,452 112,175 37,587 60,100 - 10,001 751,934
2013p 60,636 116,532 39,520 65,107 - 10,586 787,611
2014p 65,249 121,429 41,440 69,334 - 11,651 835,040
(2010=100)
2010 68,511 93,939 36,766 64,359 - 7,672 821,434
2011 73,052 100,030 38,600 71,503 - 8,654 864,920
2012 78,274 107,715 40,337 78,397 - 10,004 912,261
2013e 83,957 112,105 42,595 84,318 - 10,577 955,260
2014p 90,602 116,968 44,619 89,498 - 11,639 1,012,506
Nota / Note :Mulai 2005, data FISIM telah diagihkan kepada semua aktivitiStarting 2005, FISIM has been distributed to all activities

JADUAL 1.5 : KDNK MENGIKUT JENIS PERBELANJAAN PADA HARGA SEMASA, 1947 – 2014, MALAYSIATable 1.5 : GDP by Type of Expenditure at Current Prices, 1947 – 2014, Malaysia
RM (Juta/ Million)
Tahun Perbelanjaan PenggunaanAkhir
PerubahanInventori
PembentukanModal Tetap
Kasar
EksportBarang dan
Perkhidmatan
Import Barangdan
Perkhidmatan
KDNK padaHarga Pembeli
Year Final Consumption Expenditure Changesin
Inventories*
Gross FixedCapital Formation
Exports ofGoods and
Services
Imports of Goodsand Services
GDP atPurchasers'
Pricesa) Kerajaan b) PersendirianGovernment Private
1947 141 3,048 .. 365 1,660 1,683 3,531
1948 252 3,017 .. 355 2,041 2,046 3,619
1949 348 2,790 .. 377 1,887 1,852 3,550
1950 369 3,400 .. 241 4,251 2,916 5,345
1951 562 4,910 .. 458 6,346 4,756 7,520
1952 699 4,600 .. 756 4,179 3,884 6,350
1953 770 4,370 .. 600 3,280 3,240 5,780
1954 .. .. .. .. .. .. ..
1955 647 2,964 13 460 2,488 1,580 4,992
1956 705 3,156 21 557 2,422 1,801 5,060
1957 738 3,251 26 630 2,351 1,870 5,126
1958 768 3,178 34 580 2,040 1,704 4,896
1959 774 3,385 -60 580 2,638 1,790 5,527
1960 727 3,634 43 652 3,113 2,303 5,866
1961 794 3,838 12 777 2,822 2,421 5,822
1962 855 4,086 40 968 2,821 2,643 6,127
1963 1,190 4,899 .. 1,462 3,513 3,380 7,684
1964 1,378 5,131 .. 1,536 3,609 3,467 8,187
1965 1,535 5,446 .. 1,664 4,063 3,658 9,050
1966 1,740 5,761 .. 1,742 4,091 3,711 9,623
1967 1,704 6,221 .. 1,599 3,999 3,761 9,762
1968 1,744 6,423 .. 1,669 4,407 4,048 10,195
1969 1,826 6,723 .. 1,525 5,297 4,153 11,218
16

JADUAL 1.5 : KDNK MENGIKUT JENIS PERBELANJAAN PADA HARGA SEMASA, 1947 – 2014, MALAYSIA (samb.)Table 1.5 : GDP by Type of Expenditure at Current Prices, 1947 – 2014, Malaysia (cont’d)
RM (Juta/ Million)
Tahun Perbelanjaan PenggunaanAkhir
PerubahanInventori
PembentukanModal Tetap
Kasar
EksportBarang dan
Perkhidmatan
Import Barangdan
Perkhidmatan
KDNK padaHarga Pembeli
Year Final Consumption Expenditure Changesin
Inventories*
Gross FixedCapital Formation
Exports ofGoods and
Services
Imports of Goodsand Services
GDP atPurchasers'
Pricesa) Kerajaan b) PersendirianGovernment Private
1970 2,162 7,095 .. 2,071 5,389 4,888 11,829
1971 2,170 7,911 -13 2,701 5,242 5,056 12,955
1972 2,738 8,613 -150 3,211 5,121 5,313 14,220
1973 2,934 10,308 207 4,219 7,767 6,712 18,723
1974 3,516 12,776 714 5,798 11,043 10,989 22,858
1975 3,924 13,086 -381 5,602 10,172 10,071 22,332
1976 4,301 14,715 -71 6,206 14,554 11,620 28,085
1977 5,388 16,812 247 7,465 16,216 13,788 32,340
1978 6,090 19,584 723 9,381 18,585 16,477 37,886
1979 6,475 22,406 1,173 12,250 26,004 21,884 46,424
1980 8,811 26,946 -380 16,597 30,676 29,342 53,308
1981 10,425 30,594 -602 20,759 30,154 33,717 57,613
1982 11,469 33,226 613 22,745 31,846 37,300 62,599
1983 11,015 36,458 1,253 25,213 36,298 39,793 70,444
1984 11,741 39,594 1,306 25,391 43,171 41,653 79,550
1985 11,844 40,283 -1,757 23,124 42,537 38,561 77,470
1986 12,127 36,499 -261 18,865 40,305 35,941 71,594
1987 12,060 39,063 812 17,904 50,998 39,752 81,085
1988 13,148 45,444 1,624 22,726 61,348 51,920 92,370
1989 14,798 52,619 835 30,599 75,112 68,730 105,233
1990 16,426 61,687 -813 39,348 88,675 86,241 119,081
1991 18,504 70,501 1,938 49,126 105,161 110,107 135,124
1992 19,604 75,749 -1,906 55,191 114,494 112,450 150,682
17

JADUAL 1.5 : KDNK MENGIKUT JENIS PERBELANJAAN PADA HARGA SEMASA, 1947 – 2014, MALAYSIA (samb.)Table 1.5 : GDP by Type of Expenditure at Current Prices, 1947 – 2014, Malaysia (cont’d)
RM (Juta/ Million)
Tahun Perbelanjaan PenggunaanAkhir
PerubahanInventori
PembentukanModal Tetap
Kasar
EksportBarangan danPerkhidmatan
ImportBarangan danPerkhidmatan
KDNK padaHarga Pembeli
Year Final Consumption Expenditure Changesin
Inventories*
Gross FixedCapital Formation
Exports ofGoods and
Services
Imports of Goodsand Services
GDP atPurchasers'
Pricesa) Kerajaan b) PersendirianGovernment Private
1993 21,750 83,144 535 66,937 135,896 136,068 172,194
1994 23,973 94,088 1,870 78,664 174,255 177,389 195,461
1995 27,527 106,613 120 96,967 209,323 218,077 222,473
1996 28,178 116,794 -2,579 107,825 232,358 228,843 253,732
1997 30,341 127,783 -398 121,494 262,885 260,310 281,795
1998 27,670 117,718 -427 75,982 327,836 265,536 283,243
1999 33,044 125,056 1,476 65,841 364,861 289,514 300,764
2000 36,229 155,941 5,615 90,141 427,003 358,529 356,401
2001 42,448 162,618 -2,557 88,580 389,256 327,765 352,579
2002 49,656 172,485 4,955 89,995 415,040 348,919 383,213
2003 54,306 186,674 1,462 93,864 447,846 365,383 418,769
2004 59,635 208,571 9,930 99,336 546,925 450,350 474,048
2005 62,368 240,188 505 121,237 613,694 494,415 543,578
2006 66,647 264,584 4,467 131,024 669,505 539,443 596,784
2007 76,959 300,418 6,689 149,064 706,380 574,170 665,340
2008 88,581 344,215 6,837 158,381 766,096 594,160 769,949
2009 93,017 348,168 -29,517 156,660 651,671 507,142 712,857
2010 103,346 395,245 7,813 184,292 714,075 583,337 821,434
2011 120,993 437,340 9,164 202,251 777,302 635,316 911,733
2012 134,442 482,238 3,741 246,343 770,202 665,714 971,252
2013e 139,822 527,749 -5,522 269,814 770,368 683,408 1,018,821
Nota / Notes :
1947-1953 Persekutuan Tanah Melayu dan Singapura / Federation of Malaya and Singapore
1955-1959 Persekutuan Tanah Melayu / Federation of Malaya
1960-1962 Semenanjung Malaysia / Peninsular Malaysia
1963-2014 Malaysia
* Termasuk perbezaan statistik/ Including statistical discrepancy
2014p 147,646 579,908 -10,697 287,498 817,176 714,950 1,106,580
18

19
JADUAL 1.6 : KDNK MENGIKUT JENIS PERBELANJAAN PADA HARGA MALAR, 1970 – 2014, MALAYSIATable 1.6 : GDP by Type of Expenditure at Constant Prices, 1970 – 2014, Malaysia
RM (Juta/ Million)
Tahun Perbelanjaan PenggunaanAkhir
PerubahanInventori
PembentukanModal Tetap
Kasar
EksportBarangan danPerkhidmatan
ImportBarangan danPerkhidmatan
KDNK padaHarga Pembeli
Year Final Consumption Expenditure Gross FixedCapital Formation
Exports ofGoods and
Services
Imports of Goodsand Services
GDP atPurchasers'
Pricesa) Kerajaan b) PersendirianGovernment Private
(1970=100)
1970 2,162 7,095 .. 2,071 5,389 4,888 11,829
1971 2,078 7,731 -26 2,609 5,480 4,856 13,016
1972 2,429 8,132 -200 2,995 5,591 4,709 14,238
1973 2,540 8,918 67 3,489 6,384 5,494 15,904
1974 2,919 9,722 450 4,252 7,401 7,517 17,227
1975 3,117 9,631 -266 3,936 7,179 6,232 17,365
1976 3,382 10,304 -38 4,133 8,397 6,805 19,373
1977 3,714 11,283 275 4,736 8,746 7,879 20,875
1978 3,931 12,398 299 5,119 9,410 8,893 22,264
1979 4,273 13,854 723 5,851 11,053 11,430 24,324
1980 5,131 15,345 -85 7,186 11,353 12,702 26,228
1981 5,903 15,729 -168 8,837 11,413 13,622 28,092
1982 6,325 16,150 136 9,800 12,409 15,143 29,677
1983 6,552 16,828 98 10,517 13,770 16,323 31,442
(1978=100)
1978 6,090 19,584 723 9,381 18,585 16,477 37,886
1979 6,195 21,698 285 11,170 21,924 19,844 41,428
1980 7,750 24,445 -319 13,931 22,619 23,914 44,511
1981 8,784 25,686 -498 16,450 22,431 25,251 47,601
1982 9,552 26,531 478 17,767 24,826 28,724 50,430
1983 9,989 27,376 445 19,193 27,889 31,310 53,583
1984 9,500 29,142 952 19,761 31,733 33,347 57,742
1985 9,417 29,299 -1,302 17,888 31,875 30,027 57,150
1986 9,536 26,369 -157 14,601 35,632 28,122 57,859
1987 9,676 26,857 62 13,954 40,819 30,505 60,863
1988 10,149 31,189 1,228 16,084 45,637 37,984 66,303
1989 10,914 35,616 -195 21,212 53,903 49,045 72,405
1990 11,513 39,728 -875 25,872 63,250 60,033 79,455
1991 12,937 43,507 277 31,352 72,535 74,263 86,345
1992 13,464 45,401 -1,017 33,877 76,303 75,162 92,866
1993 14,903 46,866 -785 39,689 89,455 89,511 100,617
1994 16,372 51,455 338 46,463 109,566 114,279 109,915
1995 17,568 56,288 644 55,715 128,827 138,770 120,272
1996 17,818 59,668 -1,485 61,160 138,043 144,583 130,621
1997 18,763 62,490 -569 66,354 152,942 159,297 140,684
Changesin
Inventories*

20
JADUAL 1.6 : KDNK MENGIKUT JENIS PERBELANJAAN PADA HARGA MALAR, 1970 – 2014, MALAYSIA (samb.)Table 1.6 : GDP by Type of Expenditure at Constant Prices, 1970 – 2014, Malaysia (cont’d)
RM (Juta/ Million)
Tahun Perbelanjaan PenggunaanAkhir
PerubahanInventori
PembentukanModal Tetap
Kasar
EksportBarangan danPerkhidmatan
ImportBarangan danPerkhidmatan
KDNK padaHarga Pembeli
Year Final Consumption Expenditure Changesin
Inventories*
Gross FixedCapital Formation
Exports ofGoods and
Services
Imports of Goodsand Services
GDP atPurchasers'
Pricesa) Kerajaan b) Persendirian
Government Private
(1987=100)
1987 12,060 39,063 812 17,904 50,998 39,752 81,085
1988 12,947 43,657 1,513 22,059 56,556 47,589 89,143
1989 13,429 49,473 748 28,240 65,149 59,820 97,219
1990 14,219 55,354 -697 35,886 76,758 75,544 105,977
1991 15,889 60,361 1,657 43,912 88,863 94,588 116,093
1992 16,673 63,170 -1,612 48,738 100,056 100,617 126,408
1993 18,078 67,120 446 57,413 111,605 115,745 138,916
1994 19,500 73,422 1,486 66,668 136,054 145,417 151,713
1995 20,682 81,981 90 81,895 161,856 179,878 166,625
1996 20,833 87,609 -1,900 88,624 176,792 188,666 183,292
1997 22,017 91,385 -276 96,744 186,499 199,655 196,714
1998 20,059 82,031 -233 55,177 187,415 162,212 182,237
1999 23,485 84,377 1,254 51,568 212,085 179,347 193,422
2000 23,868 95,370 3,384 64,840 246,158 223,062 210,557
2001 28,007 97,630 -1,279 63,050 227,685 203,866 211,227
2002 30,926 101,946 3,200 63,249 237,904 216,802 220,422
2003 34,440 108,722 -1,094 64,960 251,463 225,996 232,496
2004 36,558 120,181 5,823 66,996 292,476 272,721 249,314
2005 38,526 131,266 -838 70,175 317,693 294,647 262,175
(2000=100)
2000 36,229 155,941 5,615 90,141 427,003 358,529 356,401
2001 41,918 160,662 -1,450 88,282 397,838 329,004 358,246
2002 46,902 166,883 4,907 88,792 419,430 349,356 377,559
2003 50,939 180,423 966 91,317 440,963 365,195 399,414
2004 54,832 198,193 4,052 94,561 511,774 436,906 426,507
2005 58,395 216,247 -3,080 99,266 554,261 475,838 449,250
2006 61,332 230,948 257 106,750 590,784 514,544 475,526
2007 65,381 255,263 -770 116,751 614,815 545,099 506,341
2008 71,877 277,540 -5,466 118,077 625,370 556,715 530,683
2009e 74,669 279,361 -14,391 111,516 559,537 488,691 522,001
2010p 75,009 297,604 11,891 122,443 614,988 562,382 559,554

21
JADUAL 1.6 : KDNK MENGIKUT JENIS PERBELANJAAN PADA HARGA MALAR, 1970 – 2014, MALAYSIA (samb.)Table 1.6 : GDP by Type of Expenditure at Constant Prices, 1970 – 2014, Malaysia (cont’d)
RM (Juta/ Million)
Tahun Perbelanjaan PenggunaanAkhir
PerubahanInventori
danbaranganberharga
PembentukanModal Tetap
Kasar
EksportBarangan danPerkhidmatan
ImportBarangan danPerkhidmatan
KDNK padaHarga Pembeli
Year Final Consumption Expenditure Changesin
Inventoriesand
valuables *
Gross FixedCapital Formation
Exports ofGoods and
Services
Imports of Goodsand Services
GDP atPurchasers'
Pricesa) Kerajaan b) Persendirian
Government Private
(2005=100)
2005 62,368 240,188 505 121,237 613,695 494,415 543,578
2006 65,792 256,065 3,358 128,832 654,697 534,808 573,936
2007 70,149 282,807 1,906 142,178 679,467 566,421 610,087
2008 74,970 307,467 1,199 145,525 690,103 579,698 639,565
2009 78,675 309,169 -8,682 141,584 615,012 505,874 629,885
2010 81,383 330,385 8,129 158,397 683,391 585,031 676,653
2011 94,563 353,293 3,172 168,393 713,893 621,555 711,760
2012e 99,249 382,384 5,629 200,773 700,819 636,921 751,934
2013p 105,510 409,817 -1,452 217,879 705,260 649,404 787,611
2014p 110,203 438,748 -8,849 228,089 741,333 674,483 835,040
2010 103,346 395,245 7,813 184,292 714,075 583,337 821,434
2011 117,983 422,376 4,793 195,996 743,919 620,147 864,920
2012 124,390 457,625 4,289 233,203 730,961 638,206 912,261
2013e 131,719 490,798 -3,177 252,271 732,856 649,208 955,260
2014p 137,511 524,979 -8,598 264,276 770,503 676,165 1,012,506
(2010=100)
* Termasuk perbezaan statistik/ Including statistical discrepancy

JADUAL 1.7 : KDNK MENGIKUT NEGERI BAGI TAHUN 2005 – 2013 PADA HARGA MALAR 2005Table 1.7 : GDP by State for Year 2005 – 2013 at Constant 2005 Prices
RM (Juta/ Million)
Negeri 2005 2006 2007 2008 2009 2010 2011 2012e 2013p
State
Johor 50,058 52,539 54,685 56,990 55,268 60,679 64,592 68,899 72,275
Kedah 17,829 19,255 21,033 21,209 21,092 21,998 23,837 25,278 26,434
Kelantan 9,031 9,658 10,482 11,203 11,436 11,991 12,780 13,476 13,963
Melaka 15,049 16,333 17,422 18,250 18,472 19,689 20,474 21,944 22,646
Negeri Sembilan 19,736 21,554 22,680 23,657 23,804 25,177 26,414 27,730 28,691
Pahang 23,061 24,693 25,206 26,465 26,203 27,484 29,201 30,791 32,489
Pulau Pinang 39,186 43,401 46,226 48,749 43,626 48,161 50,053 52,571 54,968
Perak 27,733 29,558 31,048 33,060 32,700 34,576 37,001 39,688 41,787
Perlis 2,845 2,945 3,157 3,250 3,166 3,318 3,386 3,537 3,648
Selangor 113,185 118,819 128,169 139,877 139,237 155,739 164,751 176,377 186,548
Terengganu 15,562 16,867 18,122 18,500 17,720 18,487 18,980 19,642 20,554
Sabah 32,427 34,221 35,318 39,114 40,986 42,101 42,680 44,469 45,791
Sarawak 57,700 60,265 65,283 65,470 64,173 66,947 70,849 71,879 74,887
WP Kuala Lumpur 67,017 71,894 78,302 85,414 88,488 97,830 106,615 114,277 122,059
WP Labuan 2,146 2,551 2,678 2,369 2,486 2,646 3,007 3,217 3,475
Supra1 51,013 49,381 50,274 45,990 41,028 39,827 37,139 38,159 37,397
KDNK pada Harga Pembeli 543,578 573,936 610,087 639,565 629,885 676,653 711,760 751,934 787,611
GDP at Purchasers' Prices
Nota / Note:1 Supra State merangkumi aktiviti pengeluaran yang melangkaui pusat kepentingan ekonomi utama bagi mana-mana negeri
Supra State covers production activities that beyond the centre of predominant economic interest for any state
22
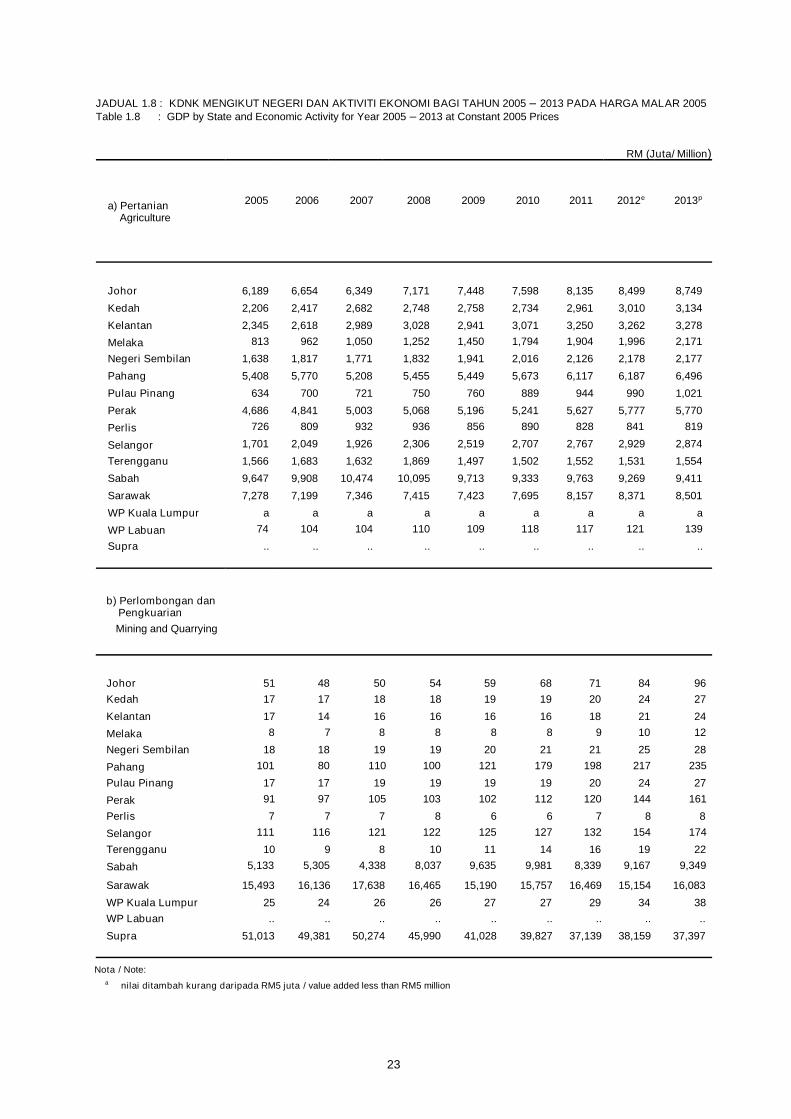
JADUAL 1.8 : KDNK MENGIKUT NEGERI DAN AKTIVITI EKONOMI BAGI TAHUN 2005 – 2013 PADA HARGA MALAR 2005Table 1.8 : GDP by State and Economic Activity for Year 2005 – 2013 at Constant 2005 Prices
a) Pertanian 2005 2006 2007 2008 2009 2010 2012e 2013p
Agriculture
Johor 6,189 6,654 6,349 7,171 7,448 7,598 8,499 8,749
Kedah 2,206 2,417 2,682 2,748 2,758 2,734 3,010 3,134
Kelantan 2,345 2,618 2,989 3,028 2,941 3,071 3,262 3,278
Melaka 813 962 1,050 1,252 1,450 1,794 1,996 2,171
Negeri Sembilan 1,638 1,817 1,771 1,832 1,941 2,016 2,178 2,177
Pahang 5,408 5,770 5,208 5,455 5,449 5,673 6,187 6,496
Pulau Pinang 634 700 721 750 760 889 990 1,021
Perak 4,686 4,841 5,003 5,068 5,196 5,241 5,777 5,770
Perlis 726 809 932 936 856 890 841 819
Selangor 1,701 2,049 1,926 2,306 2,519 2,707 2,929 2,874
Terengganu 1,566 1,683 1,632 1,869 1,497 1,502 1,531 1,554
Sabah 9,647 9,908 10,474 10,095 9,713 9,333 9,269 9,411
Sarawak 7,278 7,199 7,346 7,415 7,423 7,695 8,371 8,501
WP Kuala Lumpur a a a a a a a a
WP Labuan 74 104 104 110 109 118 121 139
Supra .. .. .. .. .. .. .. ..
RM (Juta/ Million)
2011
8,135
2,961
3,2501,904
2,126
6,117
944
5,627828
2,767
1,552
9,763
8,157
a117
..
b) Perlombongan danPengkuarianMining and Quarrying
Johor 51 48 50 54 59 68 71 84 96Kedah 17 17 18 18 19 19 20 24 27
Kelantan 17 14 16 16 16 16 18 21 24
Melaka 8 7 8 8 8 8 9 10 12
Negeri Sembilan 18 18 19 19 20 21 21 25 28
Pahang 101 80 110 100 121 179 198 217 235
Pulau Pinang 17 17 19 19 19 19 20 24 27
Perak 91 97 105 103 102 112 120 144 161
Perlis 7 7 7 8 6 6 7 8 8
Selangor 111 116 121 122 125 127 132 154 174
Terengganu 10 9 8 10 11 14 16 19 22
Sabah 5,133 5,305 4,338 8,037 9,635 9,981 8,339 9,167 9,349
Sarawak 15,493 16,136 17,638 16,465 15,190 15,757 16,469 15,154 16,083
WP Kuala Lumpur 25 24 26 26 27 27 29 34 38WP Labuan .. .. .. .. .. .. .. .. ..
Supra 51,013 49,381 50,274 45,990 41,028 39,827 37,139 38,159 37,397
Nota / Note:a nilai ditambah kurang daripada RM5 juta / value added less than RM5 million
23

JADUAL 1.8 : KDNK MENGIKUT NEGERI DAN AKTIVITI EKONOMI BAGI TAHUN 2005 – 2013 PADAHARGA MALAR 2005 (samb.)
Table 1.8 : GDP by State and Economic Activity for Year 2005 – 2013 at Constant 2005 Prices (cont’d)
RM (Juta/ Million)
c) Pembuatan 2005
Manufacturing
Johor 19,314 20,066 20,663 21,037 23,336 24,405
Kedah 6,439 6,984 7,718 6,638 7,852 8,045
Kelantan 546 511 538 691 739 728
Melaka 7,594 8,313 8,496 8,441 9,030 9,190
Negeri Sembilan 10,528 11,477 11,877 12,289 13,395 13,483
Pahang 6,423 7,111 7,053 6,899 7,841 8,261
Pulau Pinang 21,249 24,429 25,374 24,264 25,411 26,301
Perak 5,548 6,255 6,343 6,549 7,658 8,092
Perlis 352 345 324 302 352 362
Selangor 41,648 42,584 42,880 50,189 55,498 57,388
Terengganu 6,476 7,204 7,758 7,215 7,440 7,670
Sabah 3,149 3,308 3,333 3,296 3,496 3,605
Sarawak 15,987 17,375 18,774 18,117 19,400 19,926
WP Kuala Lumpur 3,908 4,024 3,911 3,757 4,584 5,029
WP Labuan 595 894 840 576 718 751
Supra … … … … .. ..
2006 2007 2010 2012e 2013p2009
17,6506,416
570
7,992
11,755
6,693
21,239
5,800290
41,858
6,918
3,149
17,490
3,763
568…
2008
20,0286,957
572
8,527
12,038
7,210
26,348
6,605349
44,795
7,568
3,412
18,472
3,672
593…
2011
21,9957,352
720
8,527
12,895
7,260
24,567
7,268341
52,570
7,150
3,486
19,237
4,191
676..
d) PembinaanConstruction
Johor 1,671 1,568 1,578 2,045 2,397 2,591
Kedah 480 454 521 541 609 544
Kelantan 177 169 159 207 229 184
Melaka 340 314 486 570 906 693
Negeri Sembilan 412 403 436 583 693 711
Pahang 575 572 576 782 873 927
Pulau Pinang 844 813 924 1,022 1,315 1,308
Perak 704 675 555 717 1,095 1,316
Perlis 103 101 100 109 97 100
Selangor 5,047 5,028 5,963 7,248 8,790 10,144Terengganu 414 455 603 648 757 796
Sabah 950 1,050 840 1,048 1,280 1,107
Sarawak 1,368 1,387 1,623 1,877 2,263 2,301
WP Kuala Lumpur 2,998 3,009 3,007 4,039 5,302 6,782WP Labuan 24 24 18 21 34 52
Supra … … … … .. ..
1,817538
195553
540696
982643
92
6,585610880
1,708
3,41319
…
1,597571
176524
495662
1,005583
101
6,244572823
1,585
3,19421
…
2,029545
205579
612761
1,074721
105
7,881630
1,127
1,853
4,32022
..
24

JADUAL 1.8 : KDNK MENGIKUT NEGERI DAN AKTIVITI EKONOMI BAGI TAHUN 2005 – 2013 PADAHARGA MALAR 2005 (samb.)
Table 1.8 : GDP by State and Economic Activity for Year 2005 – 2013 at Constant 2005 Prices (cont’d)
e) Utiliti, Pengangkutan,Penyimpanan &KomunikasiUtilities, Transport,Storage & Communication
2005 2006 2007 2010 2012e 2013p
Johor 5,122 5,431 5,839 6,751 7,898 8,222
Kedah 1,286 1,360 1,465 1,779 2,071 2,215Kelantan 724 744 787 936 1,072 1,128
Melaka 1,257 1,311 1,372 1,618 1,799 1,979Negeri Sembilan 1,564 1,943 2,047 2,380 2,698 2,723Pahang 1,182 1,193 1,282 1,477 1,691 1,786
Pulau Pinang 3,423 3,595 3,973 4,570 5,238 5,501Perak 5,266 5,560 5,697 6,445 7,426 8,094
Perlis 547 577 604 677 714 721
Selangor 16,202 17,166 18,524 21,753 24,475 26,317Terengganu 2,939 3,086 3,243 3,627 3,658 3,896
Sabah 2,601 2,740 2,960 3,461 3,872 4,101Sarawak 4,159 4,195 4,623 5,246 5,820 6,132WP Kuala Lumpur 4,063 4,428 4,793 5,859 6,714 7,276
WP Labuan 177 189 191 202 222 231Supra … … … … ... ...
RM (Juta/ Million)
2009
6,168
1,646854
1,5032,1781,378
4,2355,950
634
20,1433,383
3,1764,9175,362
202…
2008
6,091
1,586824
1,4532,1421,378
4,2125,834
618
19,8343,335
3,1554,9285,216
208…
2011
7,297
1,9181,009
1,7192,5101,589
4,8496,773
709
22,9983,784
3,6935,5156,210
212…
25
f) Perdagangan Borong &Runcit, Penginapan,Makanan dan MinumanWholesale & Retail Trade,Accommodation, Food andBeverage
Johor 4,739 5,092 5,812 7,181 8,012 8,451
Kedah 2,024 2,145 2,500 3,164 3,421 3,716
Kelantan 1,624 1,681 1,883 2,199 2,406 2,510
Melaka 1,861 2,031 2,351 3,040 3,362 3,541
Negeri Sembilan 1,686 1,768 2,033 2,619 2,829 2,989
Pahang 3,213 3,345 3,866 4,535 4,905 5,058
Pulau Pinang 4,378 4,717 5,393 6,218 6,806 7,280
Perak 3,384 3,587 4,166 5,194 5,813 6,150
Perlis 180 188 227 283 307 331
Selangor 20,230 21,833 24,902 29,899 33,681 36,011
Terengganu 1,190 1,228 1,395 1,653 1,814 1,936
Sabah 3,787 4,323 4,960 6,027 6,770 7,043
Sarawak 4,255 4,431 5,117 6,281 7,041 7,340
WP Kuala Lumpur 21,924 23,061 26,593 33,264 37,683 40,341
WP Labuan 168 177 207 240 259 281
Supra … … … … ... ...
6,633
2,905
2,164
2,9652,428
4,180
5,736
4,779
26028,412
1,564
5,770
6,02629,395
226
…
6,595
2,802
2,058
2,6702,309
4,148
5,915
4,824
25027,732
1,527
5,387
5,75329,153
221
…
7,682
3,317
2,304
3,2422,705
4,713
6,545
5,562
29131,903
1,717
6,529
6,74735,960
249
…

JADUAL 1.8 : KDNK MENGIKUT NEGERI DAN AKTIVITI EKONOMI BAGI TAHUN 2005 – 2013 PADA
Table 1.8 : GDP by State and Economic Activity for Year 2005 – 2013 at Constant 2005 Prices (cont’d)
RM (Juta/ Million)
g) Kewangan, Insurans,Hartanah danPerkhidmatanPerniagaan 2005Finance, Insurance, RealEstate and BusinessServices
Johor 6,491 6,795 7,739 8,074 9,120 9,370Kedah 1,562 1,764 2,161 2,279 2,708 2,773
Kelantan 648 734 923 992 1,136 1,162Melaka 1,277 1,363 1,681 1,814 2,006 2,023
Negeri Sembilan 1,465 1,615 1,951 2,049 2,282 2,333Pahang 1,371 1,443 1,803 1,906 2,217 2,282
Pulau Pinang 4,706 4,975 5,912 6,403 7,038 7,184Perak 2,991 3,146 3,914 3,897 4,408 4,468
Perlis 186 171 237 254 290 298
Selangor 14,073 15,240 22,090 24,580 27,814 29,169
Terengganu 545 566 800 837 956 983
Sabah 2,792 2,986 3,399 3,662 4,371 4,460
Sarawak 4,221 4,403 5,548 5,981 6,880 7,138
WP Kuala Lumpur 22,714 25,112 31,417 33,928 39,294 41,087
WP Labuan 974 1,032 1,167 1,313 1,654 1,801
Supra … … … … ... ...
HARGA MALAR 2005 (samb.)
2006 2009 2010 2012e 2013p2008
7,8682,035
9211,568
1,9271,753
5,8833,898
230
21,135753
3,1705,261
29,6961,058
…
2007
7,2511,871
7871,496
1,7851,604
5,5093,486
195
18,393695
3,6154,783
27,0171,186
…
2011
8,6302,490
1,0441,873
2,1622,025
6,7734,022
268
25,514873
3,9866,354
36,6651,533
…
26
h) Perkhidmatan-perkhidmatan LainOther Services
Johor 2,497 2,531 2,598 2,685 2,765 2,905 3,097 3,208 3,299
Kedah 1,614 1,652 1,689 1,798 1,867 1,926 2,010 2,060 2,140
Kelantan 1,142 1,174 1,204 1,263 1,313 1,357 1,410 1,458 1,531
Melaka 960 941 1,007 1,052 1,088 1,131 1,206 1,242 1,291
Negeri Sembilan 1,046 1,013 1,139 1,203 1,303 1,376 1,415 1,478 1,537
Pahang 2,812 2,848 3,078 3,208 3,279 3,423 3,659 3,769 4,027
Pulau Pinang 1,744 1,791 1,912 2,014 2,094 2,201 2,284 2,400 2,538
Perak 2,276 2,326 2,501 2,643 2,747 2,754 2,851 2,918 3,021
Perlis 220 213 229 238 245 256 266 272 281
Selangor 5,685 6,011 6,368 6,917 7,155 7,542 7,886 8,294 8,782
Terengganu 763 782 812 854 878 888 942 975 1,013
Sabah 1,439 1,459 1,513 1,600 1,661 1,706 1,780 1,832 1,916
Sarawak 1,900 1,970 2,047 2,132 2,212 2,294 2,446 2,534 2,668
WP Kuala Lumpur 3,343 3,506 3,798 4,092 4,289 4,586 4,851 5,074 5,399
WP Labuan 60 63 64 64 67 69 71 73 76
Supra … … … … … … … ... ...

JADUAL 1.8 : KDNK MENGIKUT NEGERI DAN AKTIVITI EKONOMI BAGI TAHUN 2005 – 2013 PADAHARGA MALAR 2005 (samb.)
Table 1.8 : GDP by State and Economic Activity for Year 2005 – 2013 at Constant 2005 Prices (cont’d)
i) Perkhidmatan Kerajaan 2005Government Services
Johor 3,257 3,632 3,804 4,326 5,544 5,815Kedah 2,091 2,328 2,443 2,789 3,361 3,668Kelantan 1,798 2,003 2,106 2,501 3,129 3,389Melaka 927 1,077 1,124 1,265 1,579 1,726Negeri Sembilan 1,285 1,431 1,495 1,616 1,959 2,117Pahang 1,937 2,310 2,406 2,601 3,077 3,393Pulau Pinang 1,888 2,076 2,139 2,296 2,940 3,328Perak 2,721 3,019 3,167 3,652 4,432 4,693Perlis 393 433 445 467 586 643Selangor 4,727 5,611 5,813 7,026 8,496 9,395Terengganu 1,651 1,845 1,958 2,088 2,474 2,670Sabah 2,802 3,028 3,136 3,393 4,226 4,613Sarawak 2,811 2,983 3,089 3,398 4,168 4,565WP Kuala Lumpur 7,329 7,983 8,319 11,362 14,012 14,966WP Labuan 40 47 52 88 119 126Supra … … … … ... ...
RM (Juta/ Million)
2006 2007 2010 2012e 2013p2009
4,2232,6412,4381,2021,5892,5222,2643,552
4646,4322,0463,3643,3709,965
74…
2008
4,0582,5532,3281,1841,5742,4862,2433,481
4536,2981,9903,2363,1489,532
69…
2011
4,9373,0942,7961,4081,7932,8722,6564,038
5207,8322,2963,7893,804
12,971106
…
27
JADUAL 1.9 : DUTI IMPORT BAGI KDNK MENGIKUT NEGERI BAGI TAHUN 2005 – 2013 PADA HARGA MALAR 2005
Duti ImportImport Duties
Johor 729 720 767 694 801 1,275Kedah 110 134 142 130 162 171Kelantan 11 10 22 21 24 27Melaka 13 14 29 8 15 20Negeri Sembilan 95 69 101 229 193 592Pahang 40 22 82 10 13 26Pulau Pinang 304 288 383 279 409 479Perak 67 54 17 15 17 23Perlis 131 101 81 73 70 85Selangor 3,762 3,181 3,917 4,668 6,246 6,295Terengganu 9 10 12 13 18 14Sabah 127 114 237 193 186 184Sarawak 229 187 288 301 248 233WP Kuala Lumpur 711 745 856 1,006 1,580 1,140WP Labuan 34 21 54 19 18 19Supra … … … … ... ...
Table 1.9 : Import Duties for GDP by State for Year 2005 – 2013 at Constant 2005 Prices
74012714327924
2632494
3,27918
14724383717…
844140
1811
11864
3602266
4,49222
198312830
26…
72012923
8173
83401851
5,26819
189268
1,41722…

JADUAL 1.10 : KDNK MENGIKUT NEGERI BAGI TAHUN 2010 – 2014 PADA HARGA MALAR 2010Table 1.10 : GDP by State for Year 2010 – 2014 at Constant 2010 Prices
RM (Juta/ Million)
Negeri 2010 2011 2012 2013e 2014p
State
Johor 74,102 78,946 84,050 88,013 93,737
Kedah 27,356 29,585 31,241 32,755 34,139
Kelantan 15,591 16,691 17,558 18,140 19,055
Melaka 24,187 25,487 27,276 27,947 30,078
Negeri Sembilan 30,229 32,007 33,924 34,858 35,943
Pahang 35,871 38,148 40,047 42,158 43,810
Pulau Pinang 52,946 55,827 58,353 61,288 66,187
Perak 43,313 46,346 49,756 52,381 54,789
Perlis 4,105 4,214 4,426 4,576 4,809
Selangor 177,718 187,434 200,906 212,760 227,085
Terengganu 22,769 23,509 24,292 25,359 26,890
Sabah 58,127 59,339 61,223 63,150 66,283
Sarawak 87,131 92,700 94,013 98,132 102,385
WP Kuala Lumpur 113,095 122,890 131,514 140,625 152,439
WP Labuan 3,389 3,852 4,167 4,550 4,791
Supra1 51,505 47,946 49,515 48,570 50,086
KDNK pada Harga Pembeli 821,434 864,920 912,261 955,260 1,012,506
GDP at Purchasers' Prices
Nota / Note:1 Supra State merangkumi aktiviti pengeluaran yang melangkaui pusat kepentingan ekonomi utama bagi mana-mana negeri
Supra State covers production activities that beyond the centre of predominant economic interest for any state
28

JADUAL 1.11 : KDNK MENGIKUT NEGERI DAN AKTIVITI EKONOMI BAGI TAHUN 2010 – 2014 PADA HARGA MALAR 2010Table 1.11 : GDP by State and Economic Activity for Year 2010 – 2014 at Constant 2010 Prices
RM (Juta/ Million)
a) Pertanian 2010 2011 2012 2013e 2014p
Agriculture
Johor 12,501 13,352 13,836 14,126 14,637
Kedah 4,428 4,800 4,851 5,020 4,940
Kelantan 4,498 4,847 4,869 4,874 4,983
Melaka 2,562 2,747 2,878 3,100 3,226
Negeri Sembilan 3,380 3,575 3,682 3,645 3,491
Pahang 10,068 10,878 10,968 11,488 11,434
Pulau Pinang 1,280 1,357 1,425 1,468 1,530
Perak 8,599 9,183 9,402 9,312 9,478
Perlis 1,122 1,056 1,073 1,049 1,093
Selangor 3,910 3,976 4,211 4,105 3,863
Terengganu 2,633 2,732 2,667 2,669 2,554
Sabah 15,889 16,989 16,004 16,334 16,797
Sarawak 11,864 12,915 13,388 13,733 14,859
WP Kuala Lumpur a a a a a
WP Labuan 148 147 151 174 94
Supra .. .. .. .. ..
b) Perlombongan danPengkuarianMining and Quarrying
Johor 228 237 282 323 367Kedah 56 59 71 82 94
Kelantan 125 133 159 182 207
Melaka 25 26 31 35 41
Negeri Sembilan 52 54 63 71 82
Pahang 387 430 471 500 536
Pulau Pinang 33 35 40 46 52
Perak 234 255 304 339 375
Perlis 31 33 38 38 38
Selangor 328 342 394 443 494
Terengganu 35 39 46 53 58
Sabah 14,092 12,049 13,286 13,648 14,433
Sarawak 22,586 23,652 21,958 23,355 23,666
WP Kuala Lumpur 76 81 93 104 116WP Labuan .. .. .. .. ..
Supra 51,505 47,946 49,515 48,570 50,086
Nota / Note:a nilai ditambah kurang daripada RM5 juta / value added less than RM5 million
29

JADUAL 1.11 : KDNK MENGIKUT NEGERI DAN AKTIVITI EKONOMI BAGI TAHUN 2010 – 2014 PADA HARGA MALAR2010 (samb.)
Table 1.11 : GDP by State and Economic Activity for Year 2010 – 2014 at Constant 2010 Prices (cont’d)
RM (Juta/ Million)
c) Pembuatan 2010 2011 2012 2013e 2014p
Manufacturing
Johor 23,532 24,637 26,048 27,228 28,769
Kedah 7,959 8,790 9,395 9,714 10,097
Kelantan 987 1,029 1,059 1,056 1,077
Melaka 10,213 10,540 11,146 11,067 12,160
Negeri Sembilan 13,187 14,089 14,845 14,854 14,980
Pahang 8,147 8,504 9,135 9,512 9,841
Pulau Pinang 24,299 25,221 25,617 26,617 29,183
Perak 7,568 8,326 8,756 9,361 10,051
Perlis 321 363 381 395 410
Selangor 54,869 57,576 60,648 62,863 67,032
Terengganu 8,256 8,230 8,585 8,828 9,552
Sabah 4,823 5,147 5,091 5,328 5,721
Sarawak 24,121 25,712 26,044 26,745 27,835
WP Kuala Lumpur 3,456 3,907 4,235 4,670 5,175
WP Labuan 756 889 937 979 983
Supra .. .. .. .. ..
d) PembinaanConstruction
Johor 2,707 2,686 3,153 3,408 4,544
Kedah 593 597 662 591 539
Kelantan 316 313 347 279 297
Melaka 651 661 1,031 788 743
Negeri Sembilan 860 902 1,016 1,042 1,219
Pahang 943 918 1,046 1,109 1,309
Pulau Pinang 1,486 1,561 1,900 1,890 2,137
Perak 1,236 1,243 1,877 2,255 2,106
Perlis 161 155 142 147 179
Selangor 8,943 9,712 10,754 12,415 13,885Terengganu 813 790 943 992 981
Sabah 1,870 2,009 2,271 1,963 2,046
Sarawak 2,282 2,253 2,734 2,781 2,616
WP Kuala Lumpur 5,280 5,645 6,885 8,803 10,392WP Labuan 73 79 119 182 196
Supra .. .. .. .. ..
30

JADUAL 1.11: KDNK MENGIKUT NEGERI DAN AKTIVITI EKONOMI BAGI TAHUN 2010 – 2014 PADA HARGA MALAR2010 (samb.)
Table 1.11 : GDP by State and Economic Activity for Year 2010 – 2014 at Constant 2010 Prices (cont’d)
RM (Juta/ Million)
e) Utiliti, Pengangkutan, Penyimpanan& Komunikasi
Utilities, Transport, Storage &Communication 2010 2011 2012 2013e 2014p
Johor 8,287 9,033 9,756 10,215 11,022Kedah 2,276 2,508 2,670 2,861 3,122
Kelantan 1,245 1,359 1,418 1,508 1,629
Melaka 2,101 2,264 2,377 2,616 2,935Negeri Sembilan 3,671 3,871 4,205 4,207 4,385
Pahang 1,716 1,858 1,985 2,105 2,241
Pulau Pinang 5,640 6,058 6,520 6,891 7,371Perak 7,584 8,022 8,795 9,601 10,061
Perlis 774 818 830 844 867
Selangor 31,649 32,692 35,251 37,834 40,330Terengganu 4,269 4,475 4,345 4,640 5,064
Sabah 4,113 4,423 4,580 4,862 5,129Sarawak 6,026 6,390 6,723 7,102 7,546WP Kuala Lumpur 11,111 12,086 12,729 13,622 14,777
WP Labuan 219 243 259 276 302Supra .. .. .. .. ..
31
f) Perdagangan Borong & Runcit,Penginapan, Makanan dan Minuman
Wholesale & Retail Trade,Accommodation, Food and Beverage
Johor 9,043 9,633 10,041 10,562 11,572
Kedah 3,993 4,172 4,304 4,677 5,068
Kelantan 2,913 3,053 3,193 3,341 3,589
Melaka 3,744 3,992 4,141 4,362 4,700
Negeri Sembilan 3,497 3,605 3,769 3,974 4,298
Pahang 5,643 5,861 6,102 6,293 6,730
Pulau Pinang 7,783 8,186 8,533 9,108 9,908
Perak 6,611 7,069 7,395 7,804 8,338
Perlis 388 399 421 453 486
Selangor 34,866 37,175 39,171 41,828 45,423
Terengganu 2,220 2,306 2,427 2,587 2,804
Sabah 7,410 8,011 8,315 8,649 9,261
Sarawak 7,638 8,185 8,541 8,911 9,613
WP Kuala Lumpur 38,566 41,642 43,711 46,816 51,135
WP Labuan 319 331 344 372 397
Supra .. .. .. .. ..

JADUAL 1.11 : KDNK MENGIKUT NEGERI DAN AKTIVITI EKONOMI BAGI TAHUN 2010 – 2014 PADA HARGA MALAR2010 (samb.)
Table 1.11 : GDP by State and Economic Activity for Year 2010 – 2014 at Constant 2010 Prices (cont’d)
RM (Juta/ Million)
g) Kewangan, Insurans, Hartanah danPerkhidmatan Perniagaan 2010 2011 2012 2013e 2014p
Finance, Insurance, Real Estate andBusiness Services
Johor 8,051 8,633 9,178 9,471 9,816Kedah 2,200 2,363 2,573 2,656 2,742
Kelantan 934 985 1,079 1,113 1,147Melaka 1,753 1,846 1,981 2,027 2,132
Negeri Sembilan 1,792 1,905 2,027 2,082 2,161Pahang 1,949 2,070 2,260 2,345 2,435
Pulau Pinang 6,262 6,640 6,962 7,161 7,391Perak 4,007 4,189 4,610 4,693 4,866
Perlis 251 262 286 295 308
Selangor 21,014 21,950 24,113 25,267 26,336
Terengganu 846 894 984 1,020 1,058
Sabah 3,587 3,837 4,159 4,291 4,463
Sarawak 5,445 5,826 6,255 6,547 6,812
WP Kuala Lumpur 34,256 36,786 39,243 40,940 42,877
WP Labuan 1,594 1,841 2,007 2,197 2,425
Supra .. .. .. .. ..
32
h) Perkhidmatan- perkhidmatan LainOther Services
Johor 3,347 3,573 3,724 3,831 4,005
Kedah 2,072 2,153 2,205 2,283 2,374
Kelantan 1,245 1,299 1,342 1,406 1,473
Melaka 1,305 1,392 1,438 1,503 1,561
Negeri Sembilan 1,266 1,299 1,356 1,413 1,471
Pahang 3,470 3,704 3,887 4,218 4,465
Pulau Pinang 2,720 2,829 2,986 3,160 3,304
Perak 2,729 2,826 2,895 2,993 3,123
Perlis 228 236 241 248 254
Selangor 8,382 8,743 9,226 9,815 10,278
Terengganu 839 893 921 954 992
Sabah 1,694 1,768 1,828 1,915 1,996
Sarawak 2,380 2,543 2,651 2,782 2,881
WP Kuala Lumpur 5,025 5,277 5,570 6,004 6,370
WP Labuan 64 66 68 70 72
Supra .. .. .. .. ..

JADUAL 1.11 : KDNK MENGIKUT NEGERI DAN AKTIVITI EKONOMI BAGI TAHUN 2010 – 2014 PADA HARGA MALAR2010 (samb.)
Table 1.11 : GDP by State and Economic Activity for year 2010 – 2014 at Constant 2010 Prices (cont’d)
RM (Juta/ Million)
i) Perkhidmatan Kerajaan 2010 2011 2012 2013e 2014p
Government Services
Johor 5,713 6,443 7,236 7,573 8,059Kedah 3,649 4,014 4,348 4,699 4,968Kelantan 3,307 3,649 4,069 4,354 4,627Melaka 1,825 2,010 2,239 2,429 2,560Negeri Sembilan 2,295 2,530 2,766 2,978 3,146Pahang 3,537 3,916 4,181 4,562 4,797Pulau Pinang 3,165 3,600 3,959 4,470 4,803Perak 4,729 5,215 5,705 5,998 6,366Perlis 755 841 944 1,024 1,086Selangor 9,082 10,000 10,892 11,904 12,728Terengganu 2,845 3,130 3,357 3,602 3,809Sabah 4,454 4,918 5,503 5,976 6,267Sarawak 4,488 4,955 5,471 5,944 6,306WP Kuala Lumpur 14,318 16,047 17,464 18,522 19,678WP Labuan 198 235 265 282 297Supra .. .. .. .. ..
33
JADUAL 1.12 : DUTI IMPORT BAGI KDNK MENGIKUT NEGERI BAGI TAHUN 2010 – 2014 PADA HARGA MALAR 2010Table 1.12 : Import Duties for GDP by State for year 2010 – 2014 at Constant 2010 Prices
Duti ImportImport Duties
Johor 695 717 795 1,277 946Kedah 130 130 163 173 194Kelantan 21 23 23 27 27Melaka 8 8 15 20 21Negeri Sembilan 229 176 197 592 709Pahang 11 8 13 26 22Pulau Pinang 280 340 411 477 510Perak 15 17 17 23 26Perlis 74 51 70 83 88Selangor 4,674 5,268 6,246 6,285 6,716Terengganu 13 19 18 14 18Sabah 194 189 185 184 169Sarawak 302 268 248 233 250WP Kuala Lumpur 1,006 1,418 1,584 1,142 1,917WP Labuan 19 22 18 19 25Supra .. .. .. .. ..

34
JADUAL 1.13 : KDNK PER KAPITA MENGIKUT NEGERI BAGI TAHUN 2005 – 2014 PADA HARGA SEMASATable 1.13 : GDP Per Capita by State for year 2005 – 2014 at Current Prices
Negeri 2005 2006 2007 2010 2012 2013e
State
Johor 16,298 16,996 18,753 22,035 25,442 26,317
Kedah 9,811 10,821 12,160 14,034 16,088 16,629
Kelantan 6,075 6,752 7,662 9,806 11,217 11,265
Melaka 20,410 22,065 23,415 29,366 34,965 35,727
Negeri Sembilan 20,768 22,796 24,605 29,363 33,761 34,092
Pahang 16,534 18,108 20,160 23,883 27,413 27,912
Pulau Pinang 26,833 29,624 31,381 33,597 37,053 38,472
Perak 12,320 13,233 14,832 18,207 21,711 22,438
Perlis 12,761 13,555 14,500 17,410 19,537 20,136
Selangor 23,494 24,571 26,359 32,300 36,799 38,082
Terengganu 15,863 17,692 19,476 21,573 23,935 24,488
Sabah 11,134 12,138 14,104 17,831 19,487 18,647
Sarawak 25,291 27,782 30,790 35,034 41,493 41,792
WP Kuala Lumpur 42,414 45,519 49,687 64,693 77,073 82,262
WP Labuan 26,552 31,281 33,687 38,445 49,157 53,610
KDNK Per Kapitapada Harga Semasa
20,870 22,478 24,589 28,733 32,913 33,721GDP Per Capita atCurrent Prices
RM
2009
18,878
12,481
8,421
25,397
25,595
20,548
30,098
15,809
15,186
28,468
19,102
15,515
31,286
57,040
31,200
25,385
2008
20,162
13,023
8,570
25,885
26,950
22,351
33,694
16,552
15,705
29,273
20,984
17,523
37,125
56,135
31,107
27,929
2011
24,350
15,563
10,894
32,421
32,136
27,069
35,527
20,370
18,299
34,478
23,282
19,648
40,632
70,675
44,044
31,372
2014p
28,466
17,321
11,815
38,766
35,969
29,575
42,186
24,207
21,084
40,701
26,573
19,672
44,437
91,097
56,062
36,165
Nota / Note :
Nilai KDNK Per Kapita tahun 2013 dan 2014 dikira menggunakan data anggaran penduduk yang telah disemak semulaThe Values of GDP Per Capita 2013 and 2014 based on the revised population estimation

IMBANGAN PEMBAYARANBALANCE OF PAYMENTS

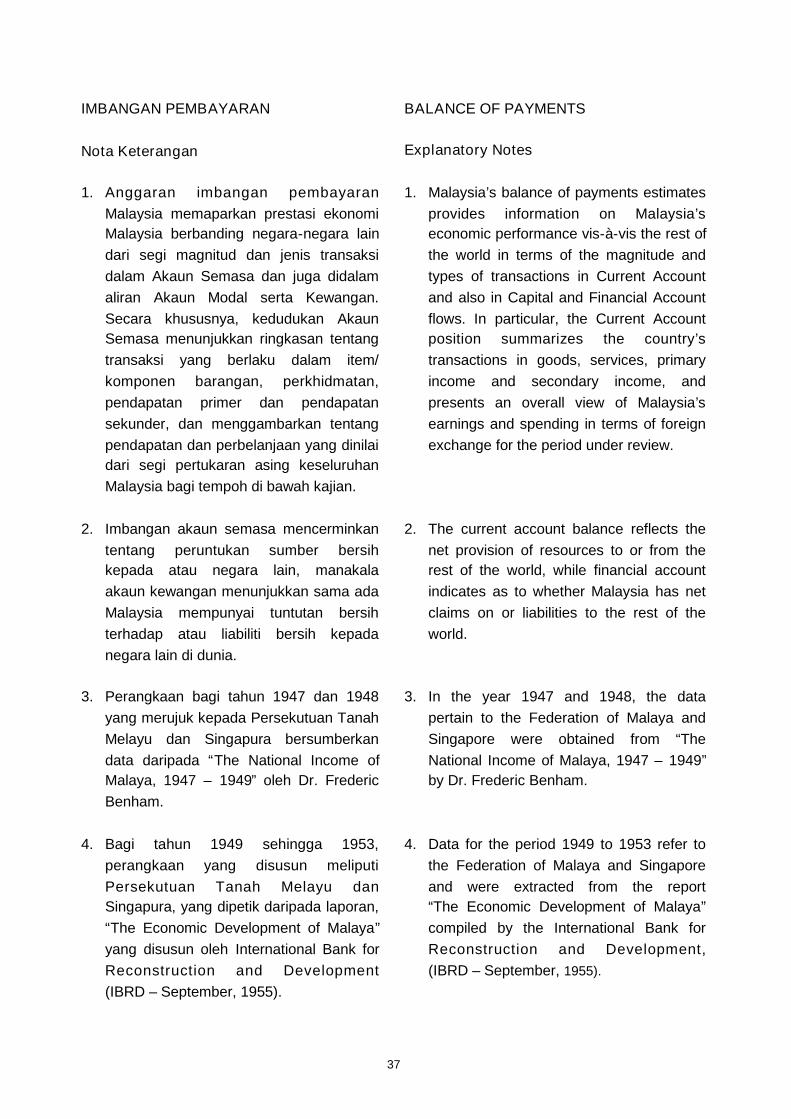
37
IMBANGAN PEMBAYARAN
Nota Keterangan
1. Anggaran imbangan pembayaranMalaysia memaparkan prestasi ekonomiMalaysia berbanding negara-negara laindari segi magnitud dan jenis transaksidalam Akaun Semasa dan juga didalamaliran Akaun Modal serta Kewangan.Secara khususnya, kedudukan AkaunSemasa menunjukkan ringkasan tentangtransaksi yang berlaku dalam item/komponen barangan, perkhidmatan,pendapatan primer dan pendapatansekunder, dan menggambarkan tentangpendapatan dan perbelanjaan yang dinilaidari segi pertukaran asing keseluruhanMalaysia bagi tempoh di bawah kajian.
2. Imbangan akaun semasa mencerminkantentang peruntukan sumber bersihkepada atau negara lain, manakalaakaun kewangan menunjukkan sama adaMalaysia mempunyai tuntutan bersihterhadap atau liabiliti bersih kepadanegara lain di dunia.
3. Perangkaan bagi tahun 1947 dan 1948yang merujuk kepada Persekutuan TanahMelayu dan Singapura bersumberkandata daripada “The National Income ofMalaya, 1947 – 1949” oleh Dr. FredericBenham.
4. Bagi tahun 1949 sehingga 1953,perangkaan yang disusun meliputiPersekutuan Tanah Melayu danSingapura, yang dipetik daripada laporan,“The Economic Development of Malaya”yang disusun oleh International Bank forReconstruction and Development(IBRD – September, 1955).
BALANCE OF PAYMENTS
Explanatory Notes
1. Malaysia’s balance of payments estimatesprovides information on Malaysia’seconomic performance vis-à-vis the rest ofthe world in terms of the magnitude andtypes of transactions in Current Accountand also in Capital and Financial Accountflows. In particular, the Current Accountposition summarizes the country’stransactions in goods, services, primaryincome and secondary income, andpresents an overall view of Malaysia’searnings and spending in terms of foreignexchange for the period under review.
2. The current account balance reflects thenet provision of resources to or from therest of the world, while financial accountindicates as to whether Malaysia has netclaims on or liabilities to the rest of theworld.
3. In the year 1947 and 1948, the datapertain to the Federation of Malaya andSingapore were obtained from “TheNational Income of Malaya, 1947 – 1949”by Dr. Frederic Benham.
4. Data for the period 1949 to 1953 refer tothe Federation of Malaya and Singaporeand were extracted from the report“The Economic Development of Malaya”compiled by the International Bank forReconstruction and Development,(IBRD – September, 1955).

38
5. Anggaran bagi tahun 1954 tidak diperoleh.Bagi tempoh 1955 hingga 1960,perangkaan yang disusun hanya merujukkepada Persekutuan Tanah Melayusahaja, sumbernya ialah “NationalAccounts of the Federation of Malaya1955 – 1960 Reports”.
6. Jabatan Perangkaan Malaysia mulamenyusun perangkaan ImbanganPembayaran mulai tahun 1961. Bagitempoh tersebut hingga 1962, ia merujukkepada Persekutuan Tanah Melayu,British North Borneo (Sabah) danSarawak. Mulai tahun 1963, perangkaanyang disusun merujuk kepada Malaysia.
7. Siri masa disusun berdasarkan: BPM3: 1969 - 1973 BPM4: 1974 - 1998 BPM5: 1999 - 2004 BPM6: 2005 - 2009 (tanpa ‘treatment’’
barangan untuk prosesan) BPM6: 2010 - dan seterusnya
Bermula 2010, data eksport dan importbarangan untuk prosesan (GFP) yangtiada pertukaran hak milik antara residendengan bukan residen dikeluarkandaripada penyusunan eksport dan importbarangan.
8. Bagi tempoh 1947 – 1953, nilai importdinilai berasaskan cost including freightand insurance (c.i.f), manakala bagi tahun1955 dan seterusnya, ia dinilai berasaskanfree on board (f.o.b).
9. Jabatan Perangkaan Malaysia telahmemulakan penyusunan LaporanKedudukan Pelaburan Antarabangsa (IIP)tahunan dari tahun 2001.
5. The estimates for 1954 were not available.For the period of 1955 to 1960, the datarefer only to the Federation of Malaya andwere extracted from the “NationalAccounts of the Federation of Malaya1955 – 1960 Reports”.
6. The Department of Statistics, Malaysiacommenced the compilation for the year1961. For that period until 1962, the datarefer to the Federation of Malaya, BritishNorth Borneo (Sabah) and Sarawak. Fromthe year 1963 onwards, the data pertain toMalaysia.
7. Data series were compiled based on: BPM3: 1969 - 1973 BPM4: 1974 - 1998 BPM5: 1999 - 2004 BPM6: 2005 - 2009 (without treatment
of goods for processing) BPM6: 2010 - and onwards
Starting 2010, exports and imports ofgoods for processing (GFP) withoutchange of ownership between residentand non-resident are excluded from thecompilation of goods exports and imports.
8. For the period of 1947 – 1953, the importswere valued at cost including freight andinsurance (c.i.f), while for year 1955 andthereafter, the imports were valued at freeon board (f.o.b).
9. The Department of Statistics, Malaysiacommenced the compilation of annualInternational Investment Position (IIP) fromthe year 2001.

10. Laporan IIP menyediakan perangkaantentang stok aset kewangan dan liabilitiasing Malaysia pada sesuatu masa(biasanya pada penghujung tahun).
11. Perbezaan diantara nilai aset dengan nilailiabiliti mencerminkan IIP bersih Malaysiayang menunjukkan perbandingan diantaraapa yang Malaysia miliki dengan yang iaberhutang. Secara khusus, jika kedudukanaset Malaysia melebihi liabilitinya, inimenunjukkan ekonomi Malaysia beradapada IIP yang positif. Aset asing danliabiliti dikelaskan mengikut jenispelaburan iaitu pelaburan langsung,pelaburan portfolio, derivatif kewangan,pelaburan lain dan aset rizab (hanya untukaset).
12. Pelaburan Langsung di Luar Negara(DIA)DIA merujuk kepada pelaburan dalambentuk instrumen kewangan iaitu modalekuiti, pelaburan dilabur semula danmodal lain daripada pelabur langsungMalaysia dalam enterpris pelaburanlangsung di luar negeri.
13. Pelaburan Langsung Asing (FDI)FDI merujuk kepada pelaburan dalambentuk instrumen kewangan daripadapelabur langsung asing dalam enterprislangsung asing di Malaysia.
10. The IIP statements provide statistics onthe stock of Malaysia’s external financialassets and liabilities at one point of time(usually at end of year).
11. The difference between the assets andliabilities reflects Malaysia’s net IIP whichshows what Malaysia owns in relation towhat it owes. In particular, shouldMalaysia’s external assets exceed itsliabilities, it indicates that the economy ofMalaysia is in a positive net IIP. Theexternal assets and liabilities are furtherclassified by functional types ofinvestment, namely direct investment,portfolio investment, financial derivatives,other investment and reserve assets (onlyfor assets).
12. Direct Investment Abroad (DIA)DIA refers to investment in the form offinancial instruments namely equitycapital, reinvested earnings and othercapital by Malaysian direct investors indirect investment enterprises abroad.
13. Foreign Direct Investment (FDI)FDI refers to investment in the form offinancial instruments by foreign directinvestors in direct investment enterprisesin Malaysia.
39

14. Klasifikasi SektorSektor dikelaskan mengikut PiawaianKlasifikasi Industri Malaysia (MSIC) 2008Ver. 1.0. Bagi tujuan laporan ini,pengkelasan sektor ekonomi adalahberdasarkan aktiviti utama syarikat indukMalaysia.
15. Aliran TransaksiIa merujuk kepada perolehan danpelupusan asset kewangan dan liabilitidalam tempoh rujukan. Ia terdiri daripadatransaksi dalam tiga instrumen kewanganutama iaitu modal ekuiti, perolehandilabur semula dan modal lain. Bagi kesDIA, nilai negatif (-) menunjukkan alirankeluar atau penambahan dalampelaburan.
16. Kedudukan Pelaburan LangsungIa merujuk kepada jumlah stok modalpelaburan langsung pada akhir tempohrujukan. Kedudukan akhir diperolehdaripada stok awal ditambah alirantransaksi kewangan dan ditambahperubahan lain (perubahan harga, kadarpertukaran asing dan lain-lain).
14. Sector ClassificationThe sectors are classified according toMalaysia Standard Industrial Classification(MSIC) 2008 Ver.1.0. For the purpose ofthis report, the classifications of economicsectors are based on the principalactivities of Malaysia’s parent companies.
15. FlowsThis refers to acquisitions and disposals offinancial assets and liabilities during areference period. It comprises oftransactions in three major financialinstruments namely equity capital,reinvested earnings and other capital. Inthe case of DIA, negative values (-)indicate an outflow or the increase ininvestment.
16. Direct Investment PositionThis refers to total stock of directinvestment as at end of reference period.The end position is derived from openingstock plus financial flows and otherchanges (price changes, exchange ratechanges and other changes).
40

41
JADUAL 2.1 : PERANGKAAN IMBANGAN PEMBAYARAN, 1947 – 1998, MALAYSIATable 2.1 : Balance of Payments Statistics, 1947 – 1998, Malaysia
RM (Juta/ Million)
Item 1947 1948 1949 1950 1951
1. Barangan f.o.b. (Bersih) -90 -96 -129 1,101 1,321Goods f.o.b. (Net)
a. Eksport 1,295 1,731 1,722 4,016 6,076Exports
b. Import 1,385 1,827 1,851 2,915 4,755Imports
2. Perkhidmatan (Bersih) 265 181 22 -335 -399Services (Net)
a. Tambang dan Insurans 41 55 .. .. ..Freight and Insurance
b. Pengangkutan Lain 32 40 .. .. ..Other Transportation
c. Perjalanan dan Pelajaran -50 -57 .. .. ..Travel and Education
d. Pendapatan Pelaburan -20 -39 -143 -570 -667Investment Income
e. Urus Niaga Kerajaan t.t.t.l 171 150 160 220 270Government Transactions n.i.e
f. Perkhidmatan Lain 91 32 5 15 -2Other Services
3. Pindahan (Bersih) -68 -59 -15 -82 -208Unrequited Transfers (Net)
4. Imbangan Akaun Semasa [ 1+2+3 ] 107 26 -122 684 714Balance on Current Account [ 1+2+3 ]
5. Modal (Bersih) .. .. 68 22 48Capital (Net)
a. Modal Jangka Panjang Persendirian .. .. .. .. ..Private Long-term Capital
b. Modal Jangka Panjang Rasmi .. .. 68 22 48Official Long-term Capital
6. Imbangan Asas [ 4+5 ] 107 26 -54 706 762Basic Balance [ 4+5 ]
7. Modal Jangka Pendek Persendirian .. .. .. .. ..Private Short-term Capital
8. Kesilapan dan Ketinggalan (Bersih) -150 -70 105 (*) -145 (*) -65 (*)
Errors and Omissions (Net)
9. Imbangan Keseluruhan [Lebihan +/Defisit -] -43 -44 51 561 697Overall Balance [Surplus +/Deficit -]
10. Peruntukan Hak Pengeluaran Khas dan Sumber IMF 0 0 0 0 0Allocation of Special Drawing Rights and IMF Resources
11. Perubahan Bersih Dalam Rizab Luar Negeri Bank Negara Malaysia .. .. -51 (**) -561 (**) -697 (**)
Net Change in Bank Negara Malaysia's External Reserves
Nota / Notes :
(*) Termasuk aliran masuk modal persendirian / Includes private capital inflow
(**) Aliran masuk imbangan Sterling / Inflow of Sterling balances

42
JADUAL 2.1 : PERANGKAAN IMBANGAN PEMBAYARAN, 1947 – 1998, MALAYSIA (samb.)Table 2.1 : Balance of Payments Statistics, 1947 – 1998, Malaysia (cont’d)
RM (Juta/ Million)
Item 1952 1953 1954 1955 1956
1. Barangan f.o.b. (Bersih) 46 -218 .. 848 519Goods f.o.b. (Net)
a. Eksport 3,919 3,020 .. 2,367 2,258Exports
b. Import 3,873 3,238 .. 1,519 1,739Imports
2. Perkhidmatan (Bersih) 63 180 .. -176 -116Services (Net)
a. Tambang dan Insurans .. .. .. 15 17Freight and Insurance
b. Pengangkutan Lain .. .. .. .. ..Other Transportation
c. Perjalanan dan Pelajaran .. .. .. 79 117Travel and Education
d. Pendapatan Pelaburan -184 -76 .. -248 -230Investment Income
e. Urus Niaga Kerajaan t.t.t.l 260 260 .. 1 4Government Transactions n.i.e
f. Perkhidmatan Lain -13 -4 .. -23 -24Other Services
3. Pindahan (Bersih) -214 -206 .. -195 -204Unrequited Transfers (Net)
4. Imbangan Akaun Semasa [ 1+2+3 ] -105 -244 .. 477 199Balance on Current Account [ 1+2+3 ]
5. Modal (Bersih) 116 63 .. 49 35Capital (Net)
a. Modal Jangka Panjang Persendirian .. .. .. 4 0Private Long-term Capital
b. Modal Jangka Panjang Rasmi 116 63 .. 45 35Official Long-term Capital
6. Imbangan Asas [ 4+5 ] 11 -181 .. 526 234Basic Balance [ 4+5 ]
7. Modal Jangka Pendek Persendirian .. .. .. -176 103Private Short-term Capital
8. Kesilapan dan Ketinggalan (Bersih) 15(*) 65(*) .. -105 -171Errors and Omissions (Net)
9. Imbangan Keseluruhan [Lebihan +/Defisit -] 26 -116 .. 245 166Overall Balance [Surplus +/Deficit -]
10. Peruntukan Hak Pengeluaran Khas dan Sumber IMF 0 0 .. 0 0Allocation of Special Drawing Rights and IMF Resources
11. Perubahan Bersih Dalam Rizab Luar Negeri Bank Negara Malaysia -26(**) 116(**) .. -245 -166Net Change in Bank Negara Malaysia's External Reserves
Nota / Notes :
(*) Termasuk aliran masuk modal persendirian / Includes private capital inflow
(**) Aliran masuk imbangan Sterling / Inflow of Sterling balances

43
JADUAL 2.1 : PERANGKAAN IMBANGAN PEMBAYARAN, 1947 – 1998, MALAYSIA (samb.)Table 2.1 : Balance of Payments Statistics, 1947 – 1998, Malaysia (cont’d)
RM (Juta/ Million)
Item 1957 1958 1959 1960 1961
1. Barangan f.o.b. (Bersih) 376 244 746 797 511Goods f.o.b. (Net)
a. Eksport 2,174 1,874 2,462 2,915 3,208Exports
b. Import 1,798 1,630 1,716 2,118 2,697Imports
2. Perkhidmatan (Bersih) -73 -46 -109 -262 -334Services (Net)
a. Tambang dan Insurans 18 19 20 13 -133Freight and Insurance
b. Pengangkutan Lain .. .. .. .. -8Other Transportation
c. Perjalanan dan Pelajaran 123 110 116 67 -67Travel and Education
d. Pendapatan Pelaburan -189 -148 -221 -278 -231Investment Income
e. Urus Niaga Kerajaan t.t.t.l .. .. 2 7 145Government Transactions n.i.e
f. Perkhidmatan Lain -25 -27 -26 -71 -40Other Services
3. Pindahan (Bersih) -200 -200 -206 -210 -193Unrequited Transfers (Net)
4. Imbangan Akaun Semasa [ 1+2+3 ] 103 -2 431 325 -16Balance on Current Account [ 1+2+3 ]
5. Modal (Bersih) 3 33 94 92 195Capital (Net)
a. Modal Jangka Panjang Persendirian 8 41 69 63 180Private Long-term Capital
b. Modal Jangka Panjang Rasmi -5 -8 25 29 15Official Long-term Capital
6. Imbangan Asas [ 4+5 ] 106 31 525 417 179Basic Balance [ 4+5 ]
7. Modal Jangka Pendek Persendirian 102 -8 -125 -21 77Private Short-term Capital
8. Kesilapan dan Ketinggalan (Bersih) -211 84 -109 -29 -103Errors and Omissions (Net)
9. Imbangan Keseluruhan [Lebihan +/Defisit -] -3 107 291 367 153Overall Balance [Surplus +/Deficit -]
10. Peruntukan Hak Pengeluaran Khas dan Sumber IMF 0 0 0 0 0Allocation of Special Drawing Rights and IMF Resources
11. Perubahan Bersih Dalam Rizab Luar Negeri Bank Negara Malaysia 3 -107 -291 -367 -153Net Change in Bank Negara Malaysia's External Reserves

44
JADUAL 2.1 : PERANGKAAN IMBANGAN PEMBAYARAN, 1947 – 1998, MALAYSIA (samb.)Table 2.1 : Balance of Payments Statistics, 1947 – 1998, Malaysia (cont’d)
RM (Juta/ Million)
Item 1962 1963 1964 1965 1966
1. Barangan f.o.b. (Bersih) 337 283 272 521 553Goods f.o.b. (Net)
a. Eksport 3,232 3,296 3,346 3,752 3,808Exports
b. Import 2,895 3,013 3,074 3,231 3,255Imports
2. Perkhidmatan (Bersih) -310 -321 -326 -341 -407Services (Net)
a. Tambang dan Insurans -145 -155 -154 -162 -165Freight and Insurance
b. Pengangkutan Lain -8 -9 -15 -16 -11Other Transportation
c. Perjalanan dan Pelajaran -70 -69 -74 -80 -78Travel and Education
d. Pendapatan Pelaburan -177 -195 -230 -255 -268Investment Income
e. Urus Niaga Kerajaan t.t.t.l 131 150 197 225 189Government Transactions n.i.e
f. Perkhidmatan Lain -41 -43 -50 -53 -74Other Services
3. Pindahan (Bersih) -194 -181 -74 -58 -106Unrequited Transfers (Net)
4. Imbangan Akaun Semasa [ 1+2+3 ] -167 -219 -128 122 40Balance on Current Account [ 1+2+3 ]
5. Modal (Bersih) 282 416 394 324 388Capital (Net)
a. Modal Jangka Panjang Persendirian 235 270 165 150 170Private Long-term Capital
b. Modal Jangka Panjang Rasmi 47 146 229 174 218Official Long-term Capital
6. Imbangan Asas [ 4+5 ] 115 197 266 446 428Basic Balance [ 4+5 ]
7. Modal Jangka Pendek Persendirian 12 59 0 -102 33Private Short-term Capital
8. Kesilapan dan Ketinggalan (Bersih) -107 -212 -204 -235 -396Errors and Omissions (Net)
9. Imbangan Keseluruhan [Lebihan +/Defisit -] 20 44 62 109 65Overall Balance [Surplus +/Deficit -]
10. Peruntukan Hak Pengeluaran Khas dan Sumber IMF 0 0 0 0 0Allocation of Special Drawing Rights and IMF Resources
11. Perubahan Bersih Dalam Rizab Luar Negeri Bank Negara Malaysia -20 -44 -62 -109 -65Net Change in Bank Negara Malaysia's External Reserves

45
JADUAL 2.1 : PERANGKAAN IMBANGAN PEMBAYARAN, 1947 – 1998, MALAYSIA (samb.)Table 2.1 : Balance of Payments Statistics, 1947 – 1998, Malaysia (cont’d)
RM (Juta/ Million)
Item 1967 1968 1969 1970 1971
1. Barangan f.o.b. (Bersih) 475 637 1,613 1,067 686Goods f.o.b. (Net)
a. Eksport 3,679 4,070 4,921 5,020 4,884Exports
b. Import 3,204 3,433 3,308 3,953 4,198Imports
2. Perkhidmatan (Bersih) -351 -400 -702 -862 -878Services (Net)
a. Tambang dan Insurans -170 -186 -247 -304 -322Freight and Insurance
b. Pengangkutan Lain -9 -12 -14 -21 -34Other Transportation
c. Perjalanan dan Pelajaran -69 -73 -96 -105 -106Travel and Education
d. Pendapatan Pelaburan -144 -154 -334 -355 -363Investment Income
e. Urus Niaga Kerajaan t.t.t.l 132 125 105 68 52Government Transactions n.i.e
f. Perkhidmatan Lain -91 -100 -116 -145 -105Other Services
3. Pindahan (Bersih) -142 -143 -180 -180 -137Unrequited Transfers (Net)
4. Imbangan Akaun Semasa [ 1+2+3 ] -18 94 731 25 -329Balance on Current Account [ 1+2+3 ]
5. Modal (Bersih) 495 245 510 319 717Capital (Net)
a. Modal Jangka Panjang Persendirian 130 93 245 287 306Private Long-term Capital
b. Modal Jangka Panjang Rasmi 365 152 265 32 411Official Long-term Capital
6. Imbangan Asas [ 4+5 ] 477 339 1,241 344 388Basic Balance [ 4+5 ]
7. Modal Jangka Pendek Persendirian 191 115 -126 -16 68Private Short-term Capital
8. Kesilapan dan Ketinggalan (Bersih) -709 -277 -621 -260 -253Errors and Omissions (Net)
9. Imbangan Keseluruhan [Lebihan +/Defisit -] -41 177 494 68 203Overall Balance [Surplus +/Deficit -]
10. Peruntukan Hak Pengeluaran Khas dan Sumber IMF 0 0 0 64 61Allocation of Special Drawing Rights and IMF Resources
11. Perubahan Bersih Dalam Rizab Luar Negeri Bank Negara Malaysia 41 -177 -494 -132 -264Net Change in Bank Negara Malaysia's External Reserves
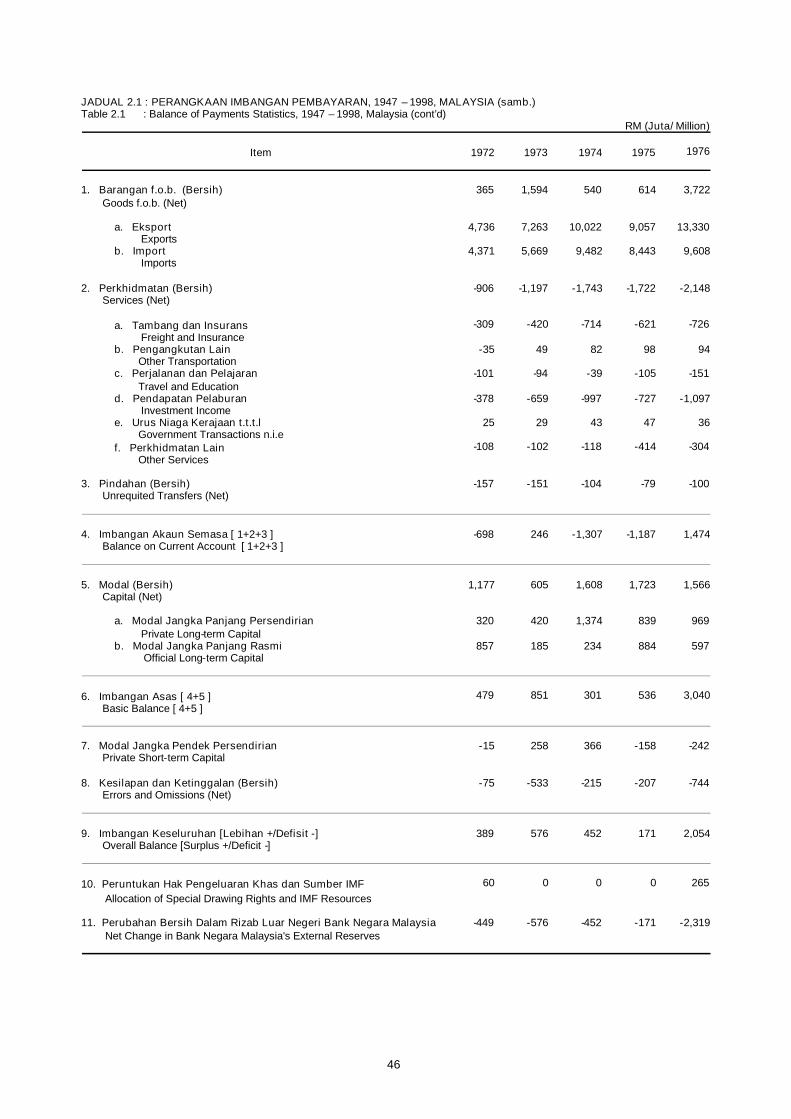
46
JADUAL 2.1 : PERANGKAAN IMBANGAN PEMBAYARAN, 1947 – 1998, MALAYSIA (samb.)Table 2.1 : Balance of Payments Statistics, 1947 – 1998, Malaysia (cont’d)
RM (Juta/ Million)
Item 1972 1973 1974 1975 1976
1. Barangan f.o.b. (Bersih) 365 1,594 540 614 3,722Goods f.o.b. (Net)
a. Eksport 4,736 7,263 10,022 9,057 13,330Exports
b. Import 4,371 5,669 9,482 8,443 9,608Imports
2. Perkhidmatan (Bersih) -906 -1,197 -1,743 -1,722 -2,148Services (Net)
a. Tambang dan Insurans -309 -420 -714 -621 -726Freight and Insurance
b. Pengangkutan Lain -35 49 82 98 94Other Transportation
c. Perjalanan dan Pelajaran -101 -94 -39 -105 -151Travel and Education
d. Pendapatan Pelaburan -378 -659 -997 -727 -1,097Investment Income
e. Urus Niaga Kerajaan t.t.t.l 25 29 43 47 36Government Transactions n.i.e
f. Perkhidmatan Lain -108 -102 -118 -414 -304Other Services
3. Pindahan (Bersih) -157 -151 -104 -79 -100Unrequited Transfers (Net)
4. Imbangan Akaun Semasa [ 1+2+3 ] -698 246 -1,307 -1,187 1,474Balance on Current Account [ 1+2+3 ]
5. Modal (Bersih) 1,177 605 1,608 1,723 1,566Capital (Net)
a. Modal Jangka Panjang Persendirian 320 420 1,374 839 969Private Long-term Capital
b. Modal Jangka Panjang Rasmi 857 185 234 884 597Official Long-term Capital
6. Imbangan Asas [ 4+5 ] 479 851 301 536 3,040Basic Balance [ 4+5 ]
7. Modal Jangka Pendek Persendirian -15 258 366 -158 -242Private Short-term Capital
8. Kesilapan dan Ketinggalan (Bersih) -75 -533 -215 -207 -744Errors and Omissions (Net)
9. Imbangan Keseluruhan [Lebihan +/Defisit -] 389 576 452 171 2,054Overall Balance [Surplus +/Deficit -]
10. Peruntukan Hak Pengeluaran Khas dan Sumber IMF 60 0 0 0 265Allocation of Special Drawing Rights and IMF Resources
11. Perubahan Bersih Dalam Rizab Luar Negeri Bank Negara Malaysia -449 -576 -452 -171 -2,319Net Change in Bank Negara Malaysia's External Reserves

47
JADUAL 2.1 : PERANGKAAN IMBANGAN PEMBAYARAN, 1947 – 1998, MALAYSIA (samb.)Table 2.1 : Balance of Payments Statistics, 1947 – 1998, Malaysia (cont’d)
RM (Juta/ Million)
Item 1977 1978 1979 1980 1981
1. Barangan f.o.b. (Bersih) 3,738 3,690 6,908 5,238 -243Goods f.o.b. (Net)
a. Eksport 14,854 16,932 24,060 28,013 26,900Exports
b. Import 11,116 13,242 17,152 22,775 27,143Imports
2. Perkhidmatan (Bersih) -2,586 -3,337 -4,858 -5,813 -5,312Services (Net)
a. Tambang dan Insurans -883 -1,061 -1,318 -1,781 -2,008Freight and Insurance
b. Pengangkutan Lain 158 143 21 -56 7Other Transportation
c. Perjalanan dan Pelajaran -196 -324 -553 -885 -672Travel and Education
d. Pendapatan Pelaburan -1,276 -1,716 -1,991 -1,820 -1,836Investment Income
e. Urus Niaga Kerajaan t.t.t.l 22 5 -13 -7 7Government Transactions n.i.e
f. Perkhidmatan Lain -411 -384 -1,004 -1,264 -810Other Services
3. Pindahan (Bersih) -78 -104 -17 -45 -78Unrequited Transfers (Net)
4. Imbangan Akaun Semasa [ 1+2+3 ] 1,074 249 2,033 -620 -5,633Balance on Current Account [ 1+2+3 ]
5. Modal (Bersih) 1,617 1,576 2,055 2,213 5,931Capital (Net)
a. Modal Jangka Panjang Persendirian 999 1,158 1,255 2,033 2,914Private Long-term Capital
b. Modal Jangka Panjang Rasmi 618 418 800 180 3,017Official Long-term Capital
6. Imbangan Asas [ 4+5 ] 2,691 1,825 4,088 1,593 298Basic Balance [ 4+5 ]
7. Modal Jangka Pendek Persendirian -982 -145 -1,584 902 97Private Short-term Capital
8. Kesilapan dan Ketinggalan (Bersih) -954 -1,055 -715 -1,493 -1,488Errors and Omissions (Net)
9. Imbangan Keseluruhan [Lebihan +/Defisit -] 755 625 1,789 1,002 -1,093Overall Balance [Surplus +/Deficit -]
10. Peruntukan Hak Pengeluaran Khas dan Sumber IMF -265 0 74 76 583Allocation of Special Drawing Rights and IMF Resources
11. Perubahan Bersih Dalam Rizab Luar Negeri Bank Negara Malaysia -490 -625 -1,863 -1,078 510Net Change in Bank Negara Malaysia's External Reserves
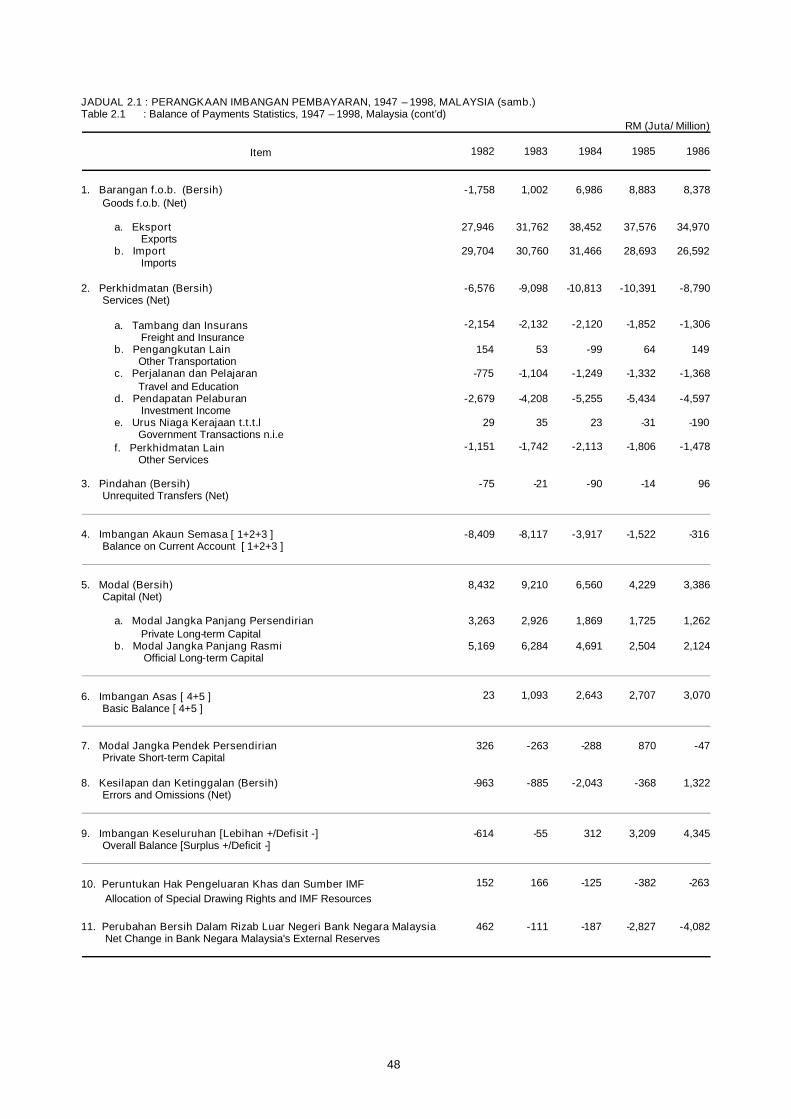
48
JADUAL 2.1 : PERANGKAAN IMBANGAN PEMBAYARAN, 1947 – 1998, MALAYSIA (samb.)Table 2.1 : Balance of Payments Statistics, 1947 – 1998, Malaysia (cont’d)
RM (Juta/ Million)
Item 1982 1983 1984 1985 1986
1. Barangan f.o.b. (Bersih) -1,758 1,002 6,986 8,883 8,378Goods f.o.b. (Net)
a. Eksport 27,946 31,762 38,452 37,576 34,970Exports
b. Import 29,704 30,760 31,466 28,693 26,592Imports
2. Perkhidmatan (Bersih) -6,576 -9,098 -10,813 -10,391 -8,790Services (Net)
a. Tambang dan Insurans -2,154 -2,132 -2,120 -1,852 -1,306Freight and Insurance
b. Pengangkutan Lain 154 53 -99 64 149Other Transportation
c. Perjalanan dan Pelajaran -775 -1,104 -1,249 -1,332 -1,368Travel and Education
d. Pendapatan Pelaburan -2,679 -4,208 -5,255 -5,434 -4,597Investment Income
e. Urus Niaga Kerajaan t.t.t.l 29 35 23 -31 -190Government Transactions n.i.e
f. Perkhidmatan Lain -1,151 -1,742 -2,113 -1,806 -1,478Other Services
3. Pindahan (Bersih) -75 -21 -90 -14 96Unrequited Transfers (Net)
4. Imbangan Akaun Semasa [ 1+2+3 ] -8,409 -8,117 -3,917 -1,522 -316Balance on Current Account [ 1+2+3 ]
5. Modal (Bersih) 8,432 9,210 6,560 4,229 3,386Capital (Net)
a. Modal Jangka Panjang Persendirian 3,263 2,926 1,869 1,725 1,262Private Long-term Capital
b. Modal Jangka Panjang Rasmi 5,169 6,284 4,691 2,504 2,124Official Long-term Capital
6. Imbangan Asas [ 4+5 ] 23 1,093 2,643 2,707 3,070Basic Balance [ 4+5 ]
7. Modal Jangka Pendek Persendirian 326 -263 -288 870 -47Private Short-term Capital
8. Kesilapan dan Ketinggalan (Bersih) -963 -885 -2,043 -368 1,322Errors and Omissions (Net)
9. Imbangan Keseluruhan [Lebihan +/Defisit -] -614 -55 312 3,209 4,345Overall Balance [Surplus +/Deficit -]
10. Peruntukan Hak Pengeluaran Khas dan Sumber IMF 152 166 -125 -382 -263Allocation of Special Drawing Rights and IMF Resources
11. Perubahan Bersih Dalam Rizab Luar Negeri Bank Negara Malaysia 462 -111 -187 -2,827 -4,082Net Change in Bank Negara Malaysia's External Reserves

49
JADUAL 2.1 : PERANGKAAN IMBANGAN PEMBAYARAN, 1947 – 1998, MALAYSIA (samb.)Table 2.1 : Balance of Payments Statistics, 1947 – 1998, Malaysia (cont’d)
RM (Juta/ Million)
Item 1987 1988 1989 1990 1991
1. Barangan f.o.b. (Bersih) 14,703 14,524 10,599 7,093 1,449Goods f.o.b. (Net)
a. Eksport 44,733 54,607 66,818 77,458 92,220Exports
b. Import 30,030 40,083 56,219 70,365 90,771Imports
2. Perkhidmatan (Bersih) -8,409 -10,180 -11,392 -9,723 -13,195Services (Net)
a. Tambang dan Insurans -1,185 -2,072 -3,027 -3,837 -4,847Freight and Insurance
b. Pengangkutan Lain 45 -44 -5 -25 -10Other Transportation
c. Perjalanan dan Pelajaran -1,327 -1,403 -891 632 547Travel and Education
d. Pendapatan Pelaburan -4,824 -5,019 -5,935 -5,072 -6,735Investment Income
e. Urus Niaga Kerajaan t.t.t.l -193 -217 -261 -3 -55Government Transactions n.i.e
f. Perkhidmatan Lain -925 -1,425 -1,273 -1,418 -2,095Other Services
3. Pindahan (Bersih) 348 395 219 147 102Unrequited Transfers (Net)
4. Imbangan Akaun Semasa [ 1+2+3 ] 6,642 4,739 -574 -2,483 -11,644Balance on Current Account [ 1+2+3 ]
5. Modal (Bersih) -1,405 -3,218 2,702 3,473 10,331Capital (Net)
a. Modal Jangka Panjang Persendirian 1,065 1,884 4,518 6,309 10,996Private Long-term Capital
b. Modal Jangka Panjang Rasmi -2,470 -5,102 -1,816 -2,836 -665Official Long-term Capital
6. Imbangan Asas [ 4+5 ] 5,237 1,521 2,128 990 -1,313Basic Balance [ 4+5 ]
7. Modal Jangka Pendek Persendirian -2,491 -2,914 1,562 1,356 5,135Private Short-term Capital
8. Kesilapan dan Ketinggalan (Bersih) 147 289 -358 3,015 -395Errors and Omissions (Net)
9. Imbangan Keseluruhan [Lebihan +/Defisit -] 2,893 -1,104 3,332 5,361 3,427Overall Balance [Surplus +/Deficit -]
10. Peruntukan Hak Pengeluaran Khas dan Sumber IMF 0 0 0 0 0Allocation of Special Drawing Rights and IMF Resources
11. Perubahan Bersih Dalam Rizab Luar Negeri Bank Negara Malaysia -2,893 1,104 -3,332 -5,361 -3,427Net Change in Bank Negara Malaysia's External Reserves

50
JADUAL 2.1 : PERANGKAAN IMBANGAN PEMBAYARAN, 1947 – 1998, MALAYSIA (samb.)Table 2.1 : Balance of Payments Statistics, 1947 – 1998, Malaysia (cont’d)
RM (Juta/ Million)
Item 1992 1993 1994 1995 1996
1. Barangan f.o.b. (Bersih) 8,609 8,231 4,460 97 10,088Goods f.o.b. (Net)
a. Eksport 100,910 118,383 148,506 179,491 193,363Exports
b. Import 92,301 110,152 144,046 179,394 183,275Imports
2. Perkhidmatan (Bersih) -14,568 -16,670 -17,005 -19,229 -18,371Services (Net)
a. Tambang dan Insurans -4,265 -4,890 -7,367 -9,028 -8,203Freight and Insurance
b. Pengangkutan Lain -355 -196 441 737 1,725Other Transportation
c. Perjalanan dan Pelajaran 657 906 3,603 4,143 4,801Travel and Education
d. Pendapatan Pelaburan -7,920 -8,174 -9,448 -10,338 -11,629Investment Income
e. Urus Niaga Kerajaan t.t.t.l 54 -72 -36 -23 -27Government Transactions n.i.e
f. Perkhidmatan Lain -2,739 -4,244 -4,198 -4,720 -5,038Other Services
3. Pindahan (Bersih) 337 513 -2,225 -2,515 -2,943Unrequited Transfers (Net)
4. Imbangan Akaun Semasa [ 1+2+3 ] -5,622 -7,926 -14,770 -21,647 -11,226Balance on Current Account [ 1+2+3 ]
5. Modal (Bersih) 10,328 13,864 11,659 16,611 13,525Capital (Net)
a. Modal Jangka Panjang Persendirian 13,204 12,885 10,798 10,464 12,777Private Long-term Capital
b. Modal Jangka Panjang Rasmi -2,876 979 861 6,147 748Official Long-term Capital
6. Imbangan Asas [ 4+5 ] 4,706 5,938 -3,111 -5,036 2,299Basic Balance [ 4+5 ]
7. Modal Jangka Pendek Persendirian 11,957 13,931 -8,484 2,529 10,317Private Short-term Capital
8. Kesilapan dan Ketinggalan (Bersih) 81 9,370 3,333 -1,896 -6,371Errors and Omissions (Net)
9. Imbangan Keseluruhan [Lebihan +/Defisit -] 16,744 29,239 -8,262 -4,403 6,245Overall Balance [Surplus +/Deficit -]
10. Peruntukan Hak Pengeluaran Khas dan Sumber IMF 0 0 0 0 0Allocation of Special Drawing Rights and IMF Resources
11. Perubahan Bersih Dalam Rizab Luar Negeri Bank Negara Malaysia -16,744 -29,239 8,262 4,403 -6,245Net Change in Bank Negara Malaysia's External Reserves
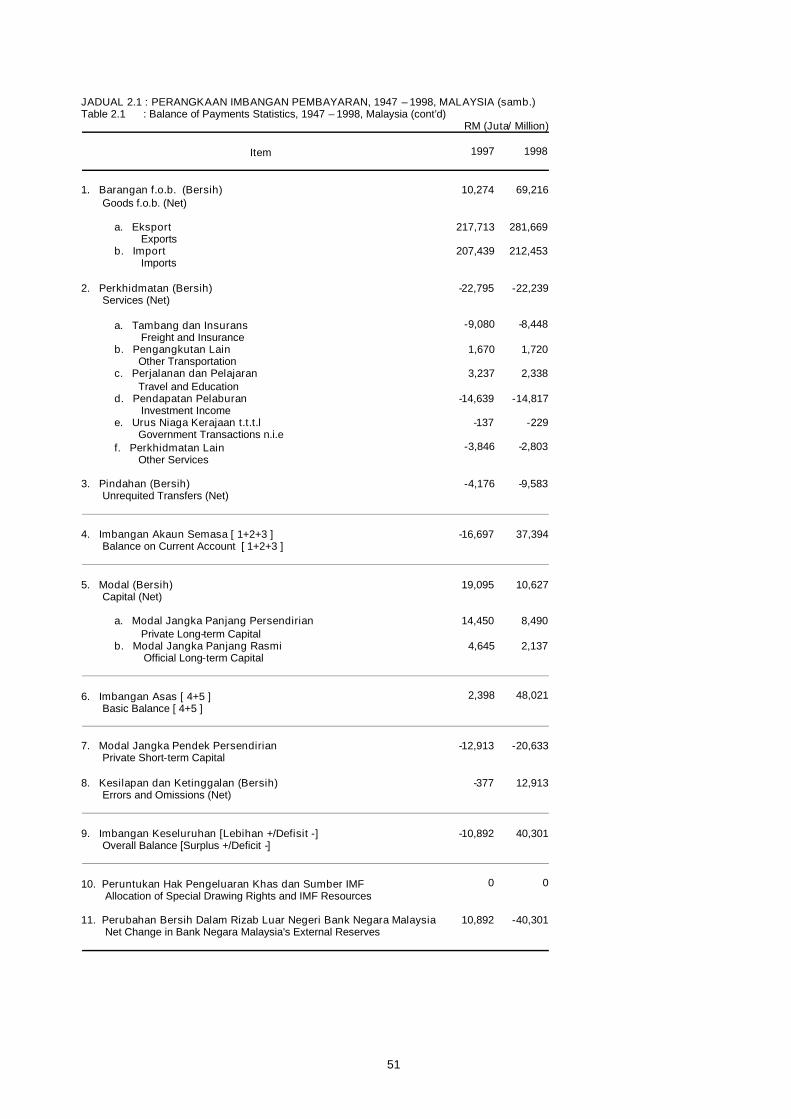
51
JADUAL 2.1 : PERANGKAAN IMBANGAN PEMBAYARAN, 1947 – 1998, MALAYSIA (samb.)
RM (Juta/ Million)
Item 1997 1998
1. Barangan f.o.b. (Bersih) 10,274 69,216Goods f.o.b. (Net)
a. Eksport 217,713 281,669Exports
b. Import 207,439 212,453Imports
2. Perkhidmatan (Bersih) -22,795 -22,239Services (Net)
a. Tambang dan Insurans -9,080 -8,448Freight and Insurance
b. Pengangkutan Lain 1,670 1,720Other Transportation
c. Perjalanan dan Pelajaran 3,237 2,338Travel and Education
d. Pendapatan Pelaburan -14,639 -14,817Investment Income
e. Urus Niaga Kerajaan t.t.t.l -137 -229Government Transactions n.i.e
f. Perkhidmatan Lain -3,846 -2,803Other Services
3. Pindahan (Bersih) -4,176 -9,583Unrequited Transfers (Net)
4. Imbangan Akaun Semasa [ 1+2+3 ] -16,697 37,394Balance on Current Account [ 1+2+3 ]
5. Modal (Bersih) 19,095 10,627Capital (Net)
a. Modal Jangka Panjang Persendirian 14,450 8,490Private Long-term Capital
b. Modal Jangka Panjang Rasmi 4,645 2,137Official Long-term Capital
6. Imbangan Asas [ 4+5 ] 2,398 48,021Basic Balance [ 4+5 ]
7. Modal Jangka Pendek Persendirian -12,913 -20,633Private Short-term Capital
8. Kesilapan dan Ketinggalan (Bersih) -377 12,913Errors and Omissions (Net)
9. Imbangan Keseluruhan [Lebihan +/Defisit -] -10,892 40,301Overall Balance [Surplus +/Deficit -]
10. Peruntukan Hak Pengeluaran Khas dan Sumber IMF 0 0Allocation of Special Drawing Rights and IMF Resources
11. Perubahan Bersih Dalam Rizab Luar Negeri Bank Negara Malaysia 10,892 -40,301Net Change in Bank Negara Malaysia's External Reserves
Table 2.1 : Balance of Payments Statistics, 1947 – 1998, Malaysia (cont’d)

52
JADUAL 2.2 : PERANGKAAN IMBANGAN PEMBAYARAN, 1999 – 2004, MALAYSIATable 2.2 : Balance of Payments Statistics, 1999 – 2004, Malaysia
RM (Juta/ Million)
Item 1999 2000 2001 2002 2003 2004
1. Barangan f.o.b. (Bersih) 86,049 79,144 69,854 72,117 97,762 104,774Goods f.o.b. (Net)
a. Eksport 319,568 374,033 334,326 358,504 397,969 481,903Exports
b. Import 233,519 294,889 264,472 286,387 300,207 377,129Imports
2. Perkhidmatan (Bersih) -10,701 -10,670 -8,366 -5,996 -15,300 -8,199Services (Net)
a. Pengangkutan -8,464 -11,736 -11,352 -11,572 -13,486 -17,545Transportation
b. Perjalanan dan Pelajaran 6,135 11,158 16,148 17,102 11,523 19,096Travel and Education
c. Perkhidmatan Lain -8,395 -10,030 -13,187 -11,242 -13,011 -9,029Other Services
d. Urus Niaga Kerajaan t.t.t.l 23 -62 25 -284 -327 -721Government Transactions n.i.e
3. Pendapatan (Bersih) -20,886 -28,909 -25,623 -25,061 -22,537 -24,402Income (Net)
a. Pampasan Pekerja -611 -975 -1,014 -1,179 -960 -995Compensation of employees
b. Pendapatan Pelaburan -20,275 -27,934 -24,609 -23,882 -21,577 -23,408Investment Income
4. Pindahan Semasa (Bersih) -6,567 -7,313 -8,178 -10,566 -9,300 -14,871Current Transfers (Net)
5. Imbangan Akaun Semasa [ 1+2+3+4 ]Balance on Current Account [ 1+2+3 +4 ] 47,895 32,252 27,687 30,494 50,625 57,302
6. Akaun Modal (Bersih) .. .. .. .. .. ..Capital Account (Net)
a. Pindahan Modal .. .. .. .. .. ..Capital Transfers
b. Aset Bukan Kewangan Bukan Pengeluaran .. .. .. .. .. ..Non-produced Non-financial Assets
7. Akaun Kewangan -25,152 -23,848 -14,791 -11,941 -12,146 19,347Financial Account
a. Pelaburan Langsung 9,397 6,694 1,091 4,935 4,194 9,739Direct Investment
b. Pelaburan Portfolio -4,392 -9,395 -2,466 -6,506 4,168 32,994Portfolio Investment
c. Pelaburan Lain -30,157 -21,147 -13,416 -10,370 -20,508 -23,386Other Investment
8. Imbangan Akaun Modal & Kewangan [ 6+7 ] -25,152 -23,848 -14,791 -11,941 -12,146 19,347Balance on Capital and Financial Account [ 6+7 ]
9. Kesilapan dan Ketinggalan (Bersih) -4,924 -16,580 -8,378 -3,958 1,302 7,079Error and Omissions (Net)
10. Imbangan Keseluruhan [Lebihan +/ Defisit-] 17,819 -8,176 4,518 14,595 39,781 83,728Overall Balance [Surplus +/Deficit -]
11. Aset Rizab -17,819 8,176 -4,518 -14,595 -39,781 -83,728Reserve Assets
a. Sumber IMF .. .. .. .. .. ..IMF Resource
b. Perubahan Bersih dalam Rizab Luar NegeriBank Negara Malaysia
-17,819 8,176 -4,518 -14,595 -39,781 -83,728
Net change in Bank Negara Malaysia’sExternal Reserves

53
JADUAL 2.3 : PERANGKAAN IMBANGAN PEMBAYARAN, 2005 – 2014, MALAYSIATable 2.3 : Balance of Payments Statistics, 2005 – 2014, Malaysia
RM (Juta/ Million)
Item 2005 2006 2007 2009
AKAUN SEMASA 78,367 96,029 102,190 110,727CURRENT ACCOUNT
1. Barangan f.o.b. (Bersih) 130,152 139,489 130,825 140,355Goods f.o.b. (Net)
a. Eksport 540,681 592,215 606,512 552,920Exports
b. Import 410,529 452,726 475,687 412,565Imports
2. Perkhidmatan (Bersih) -10,872 -9,427 1,384 4,173Services (Net)
a. Perkhidmatan penyelenggaraan dan pembaikan t.t.t.l 291 400 270 345Maintenance and repair services n.i.e
b. Pengangkutan -15,422 -19,285 -12,570 -15,818Transport
c. Perjalanan 18,684 22,633 29,052 32,168Travel
d. Pembinaan -1,362 -565 -1,149 -525Construction
e. Perkhidmatan insurans dan pencen -928 -1,174 -1,120 -881Insurance and pension services
f. Perkhidmatan kewangan -191 -214 -397 -510Financial services
g. Caj penggunaan harta intelek t.t.t.l -4,919 -3,402 -3,940 -3,003Charges for the use intellectual property n.i.e
h. Perkhidmatan telekomunikasi, komputer dan maklumat -195 -287 -157 77Telecommunications, computer and information
i. Perkhidmatan perniagaan lain -5,979 -6,119 -7,231 -6,468Other business services
j. Perkhidmatan persendirian, kebudayaan dan rekreasi -502 -974 -1,015 -603Personal, cultural and recreational services
k. Barangan dan perkhidmatan kerajaan t.t.t.l -350 -440 -359 -609Government goods and services n.i.e
3. Pendapatan Primer (Bersih) -23,943 -17,294 -13,985 -14,214Primary Income (Net)
a. Pampasan Pekerja -535 -306 -622 -1,463Compensation of employees
b. Pendapatan Pelaburan -23,408 -16,988 -13,362 -12,751Investment Income
4. Pendapatan Sekunder (Bersih) -16,971 -16,739 -16,035 -19,587Secondary Income (Net)
AKAUN MODAL .. -203 -109 -51CAPITAL ACCOUNT1. Perolehan/pelupusan aset bukan kewangan bukan
pengeluaran .. -46 -116 -31Acquisitions/disposals of non-produced non-financial assets
2. Pindahan modal .. -156 7 -20Capital transfers
AKAUN KEWANGAN -36,991 -43,182 -38,955 -80,173FINANCIAL ACCOUNT1. Pelaburan langsung 3,749 144 -9,348 -22,315
Direct investment2. Pelaburan portfolio -13,896 12,680 18,548 -1,781
Portfolio investment3. Derivatif kewangan -220 106 -164 2,369
Financial derivatives4. Pelaburan lain -26,624 -56,112 -47,991 -58,447
Other investment
ASET RIZAB -13,550 -25,158 -45,296 -13,831RESERVE ASSETS
KESILAPAN DAN KETINGGALAN BERSIH -27,825 -27,485 -17,831 -16,671NET ERRORS AND OMISSIONS
2008
131,414
170,380
662,455
492,076
1,557
526
-14,812
28,510
-457
-1,173
-720
-3,659
-286
-4,508
-1,275
-590
-23,033
-894
-22,139
-17,490
672
757
-85
-119,082
-25,996
-83,193
-2,029
-7,865
18,250
-31,252
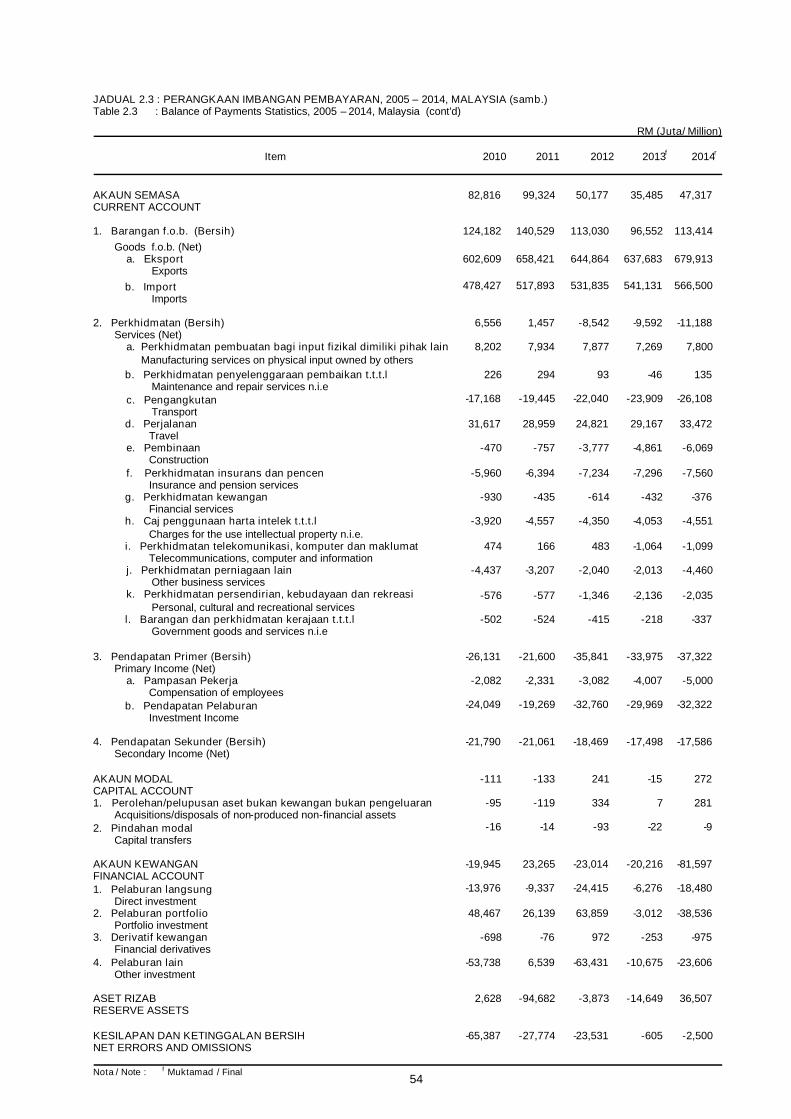
54
JADUAL 2.3 : PERANGKAAN IMBANGAN PEMBAYARAN, 2005 – 2014, MALAYSIA (samb.)Table 2.3 : Balance of Payments Statistics, 2005 – 2014, Malaysia (cont’d)
RM (Juta/ Million)
Item 2010 2011 2012 2013f 2014r
AKAUN SEMASA 82,816 99,324 50,177 35,485 47,317CURRENT ACCOUNT
1. Barangan f.o.b. (Bersih) 124,182 140,529 113,030 96,552 113,414Goods f.o.b. (Net)
a. Eksport 602,609 658,421 644,864 637,683 679,913Exports
b. Import 478,427 517,893 531,835 541,131 566,500Imports
2. Perkhidmatan (Bersih) 6,556 1,457 -8,542 -9,592 -11,188Services (Net)
a. Perkhidmatan pembuatan bagi input fizikal dimiliki pihak lain 8,202 7,934 7,877 7,269 7,800Manufacturing services on physical input owned by others
b. Perkhidmatan penyelenggaraan pembaikan t.t.t.l 226 294 93 -46 135Maintenance and repair services n.i.e
c. Pengangkutan -17,168 -19,445 -22,040 -23,909 -26,108Transport
d. Perjalanan 31,617 28,959 24,821 29,167 33,472Travel
e. Pembinaan -470 -757 -3,777 -4,861 -6,069Construction
f. Perkhidmatan insurans dan pencen -5,960 -6,394 -7,234 -7,296 -7,560Insurance and pension services
g. Perkhidmatan kewangan -930 -435 -614 -432 -376Financial services
h. Caj penggunaan harta intelek t.t.t.l -3,920 -4,557 -4,350 -4,053 -4,551Charges for the use intellectual property n.i.e.
i. Perkhidmatan telekomunikasi, komputer dan maklumat 474 166 483 -1,064 -1,099Telecommunications, computer and information
j. Perkhidmatan perniagaan lain -4,437 -3,207 -2,040 -2,013 -4,460Other business services
k. Perkhidmatan persendirian, kebudayaan dan rekreasi -576 -577 -1,346 -2,136 -2,035Personal, cultural and recreational services
l. Barangan dan perkhidmatan kerajaan t.t.t.l -502 -524 -415 -218 -337
3. Pendapatan Primer (Bersih) -26,131 -21,600 -35,841 -33,975 -37,322Primary Income (Net)
a. Pampasan Pekerja -2,082 -2,331 -3,082 -4,007 -5,000Compensation of employees
b. Pendapatan Pelaburan -24,049 -19,269 -32,760 -29,969 -32,322Investment Income
4. Pendapatan Sekunder (Bersih) -21,790 -21,061 -18,469 -17,498 -17,586Secondary Income (Net)
AKAUN MODAL -111 -133 241 -15 272CAPITAL ACCOUNT1. Perolehan/pelupusan aset bukan kewangan bukan pengeluaran -95 -119 334 7 281
Acquisitions/disposals of non-produced non-financial assets2. Pindahan modal -16 -14 -93 -22 -9
Capital transfers
AKAUN KEWANGAN -19,945 23,265 -23,014 -20,216 -81,597FINANCIAL ACCOUNT1. Pelaburan langsung -13,976 -9,337 -24,415 -6,276 -18,480
Direct investment2. Pelaburan portfolio 48,467 26,139 63,859 -3,012 -38,536
Portfolio investment3. Derivatif kewangan -698 -76 972 -253 -975
Financial derivatives4. Pelaburan lain -53,738 6,539 -63,431 -10,675 -23,606
Other investment
ASET RIZAB 2,628 -94,682 -3,873 -14,649 36,507RESERVE ASSETS
KESILAPAN DAN KETINGGALAN BERSIH -65,387 -27,774 -23,531 -605 -2,500NET ERRORS AND OMISSIONS
Nota / Note : f Muktamad / Final
Government goods and services n.i.e
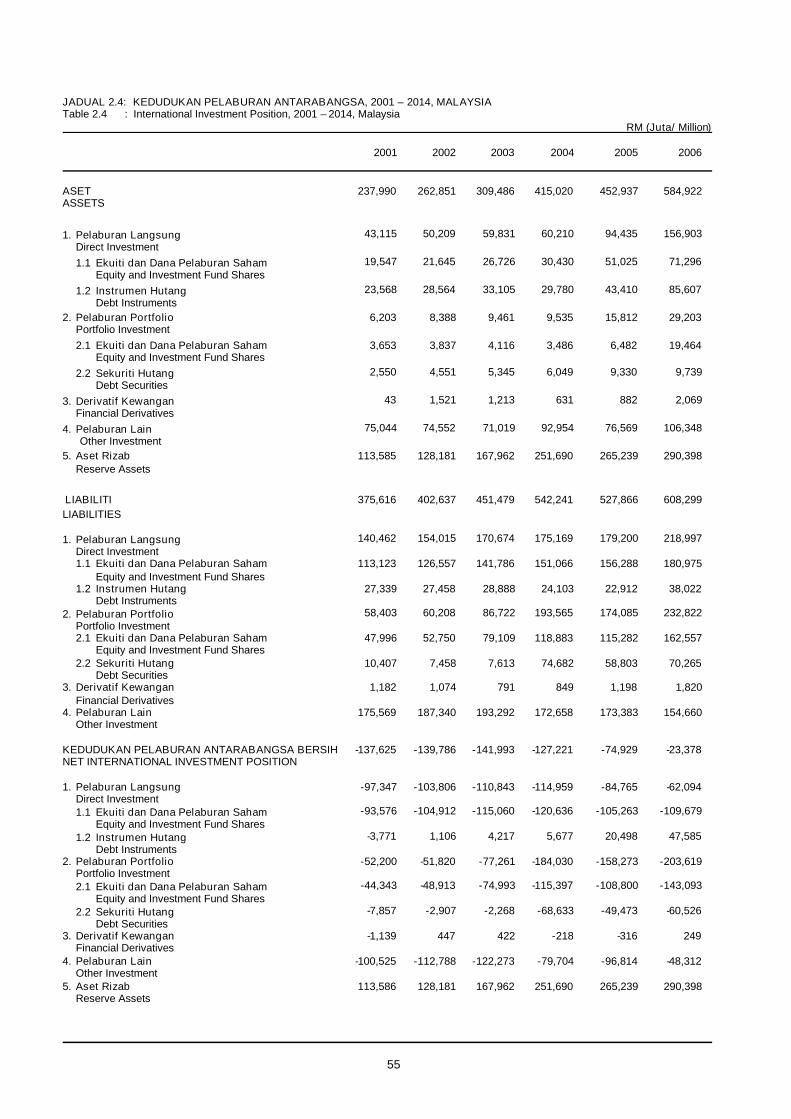
JADUAL 2.4: KEDUDUKAN PELABURAN ANTARABANGSA, 2001 – 2014, MALAYSIATable 2.4 : International Investment Position, 2001 – 2014, Malaysia
RM (Juta/ Million)
2001 2002 2003 2004 2005 2006
ASET 237,990 262,851 309,486 415,020 452,937 584,922ASSETS
1. Pelaburan Langsung 43,115 50,209 59,831 60,210 94,435 156,903Direct Investment1.1 Ekuiti dan Dana Pelaburan Saham 19,547 21,645 26,726 30,430 51,025 71,296
Equity and Investment Fund Shares1.2 Instrumen Hutang 23,568 28,564 33,105 29,780 43,410 85,607
Debt Instruments2. Pelaburan Portfolio 6,203 8,388 9,461 9,535 15,812 29,203
Portfolio Investment2.1 Ekuiti dan Dana Pelaburan Saham 3,653 3,837 4,116 3,486 6,482 19,464
Equity and Investment Fund Shares2.2 Sekuriti Hutang 2,550 4,551 5,345 6,049 9,330 9,739
Debt Securities3. Derivatif Kewangan 43 1,521 1,213 631 882 2,069
Financial Derivatives4. Pelaburan Lain 75,044 74,552 71,019 92,954 76,569 106,348
Other Investment5. Aset Rizab 113,585 128,181 167,962 251,690 265,239 290,398
Reserve Assets
LIABILITI 375,616 402,637 451,479 542,241 527,866 608,299LIABILITIES
1. Pelaburan Langsung 140,462 154,015 170,674 175,169 179,200 218,997Direct Investment1.1 Ekuiti dan Dana Pelaburan Saham 113,123 126,557 141,786 151,066 156,288 180,975
Equity and Investment Fund Shares1.2 Instrumen Hutang 27,339 27,458 28,888 24,103 22,912 38,022
Debt Instruments2. Pelaburan Portfolio 58,403 60,208 86,722 193,565 174,085 232,822
Portfolio Investment2.1 Ekuiti dan Dana Pelaburan Saham 47,996 52,750 79,109 118,883 115,282 162,557
Equity and Investment Fund Shares2.2 Sekuriti Hutang 10,407 7,458 7,613 74,682 58,803 70,265
Debt Securities3. Derivatif Kewangan 1,182 1,074 791 849 1,198 1,820
Financial Derivatives4. Pelaburan Lain 175,569 187,340 193,292 172,658 173,383 154,660
Other Investment
KEDUDUKAN PELABURAN ANTARABANGSA BERSIH -137,625 -139,786 -141,993 -127,221 -74,929 -23,378NET INTERNATIONAL INVESTMENT POSITION
1. Pelaburan Langsung -97,347 -103,806 -110,843 -114,959 -84,765 -62,094Direct Investment1.1 Ekuiti dan Dana Pelaburan Saham -93,576 -104,912 -115,060 -120,636 -105,263 -109,679
Equity and Investment Fund Shares1.2 Instrumen Hutang -3,771 1,106 4,217 5,677 20,498 47,585
Debt Instruments2. Pelaburan Portfolio -52,200 -51,820 -77,261 -184,030 -158,273 -203,619
Portfolio Investment2.1 Ekuiti dan Dana Pelaburan Saham -44,343 -48,913 -74,993 -115,397 -108,800 -143,093
Equity and Investment Fund Shares2.2 Sekuriti Hutang -7,857 -2,907 -2,268 -68,633 -49,473 -60,526
Debt Securities3. Derivatif Kewangan -1,139 447 422 -218 -316 249
Financial Derivatives4. Pelaburan Lain -100,525 -112,788 -122,273 -79,704 -96,814 -48,312
Other Investment5. Aset Rizab 113,586 128,181 167,962 251,690 265,239 290,398
Reserve Assets
55

JADUAL 2.4: KEDUDUKAN PELABURAN ANTARABANGSA, 2001 – 2014, MALAYSIA (samb.)Table 2.4 : International Investment Position, 2001 – 2014, Malaysia (cont’d)
RM (Juta/ Million)
2001 2002 2003 2004 2005 2006
Pelaburan Langsung Mengikut Asas Arah AliranDirect Investment According To Directional Basis
Di Luar Negeri 31,746 38,855 45,671 48,619 83,292 127,582Abroad
Modal Ekuiti dan Perolehan Dilabur Semula 19,547 21,645 26,726 30,430 51,025 71,296Equity Capital and Reinvested EarningsModal Lain 12,199 17,210 18,945 18,189 32,267 56,286Other Capital
Di Malaysia 129,093 142,661 156,514 163,578 168,057 189,676In Malaysia
Modal Ekuiti dan Perolehan Dilabur Semula 113,123 126,557 141,786 151,066 156,288 180,975Equity Capital and Reinvested EarningsModal Lain 15,970 16,104 14,728 12,512 11,769 8,701Other Capital
Pelaburan Langsung Bersih -97,347 -103,806 -110,843 -114,959 -84,765 -62,094Net Direct Investment
Modal Ekuiti dan Perolehan Dilabur Semula -93,576 -104,912 -115,060 -120,636 -105,263 -109,679Equity Capital and Reinvested EarningsModal Lain -3,771 1,106 4,217 5,677 20,498 47,585Other Capital
56

57
JADUAL 2.4: KEDUDUKAN PELABURAN ANTARABANGSA, 2001 – 2014, MALAYSIA (samb.)Table 2.4 : International Investment Position, 2001 – 2014, Malaysia (cont’d)
RM (Juta/ Million)
2007 2008 2009 2010 2011 2014p
ASET 785,658 805,314 896,026 950,190 1,135,956 1,450,972ASSETS
1. Pelaburan Langsung 235,141 280,396 316,177 346,051 397,355 534,231Direct Investment1.1 Ekuiti dan Dana Pelaburan Saham 113,474 148,957 185,034 202,262 225,002 303,562
Equity and Investment Fund Shares1.2 Instrumen Hutang 121,667 131,439 131,143 143,789 172,353 230,669
Debt Instruments2. Pelaburan Portfolio 50,655 56,425 95,138 110,675 127,565 237,125
Portfolio Investment2.1 Ekuiti dan Dana Pelaburan Saham 41,411 40,440 68,946 77,240 84,217 158,871
Equity and Investment Fund Shares2.2 Sekuriti Hutang 9,244 15,985 26,192 33,435 43,348 78,254
Debt Securities3. Derivatif Kewangan 1,789 7,741 7,785 5,243 6,796 9,843
Financial Derivatives4. Pelaburan Lain 162,378 143,306 145,648 159,572 180,908 264,428
Other Investment5. Aset Rizab 335,695 317,445 331,277 328,649 423,331 405,345
Reserve Assets
LIABILITI 800,669 700,526 790,232 937,250 1,099,403 1,464,083LIABILITIES
1. Pelaburan Langsung 292,433 303,519 313,890 360,409 424,727 527,530Direct Investment1.1 Ekuiti dan Dana Pelaburan Saham 236,966 237,649 250,471 294,273 342,461 429,165
Equity and Investment Fund Shares1.2 Instrumen Hutang 55,467 65,870 63,418 66,136 82,266 98,364
Debt Instruments2. Pelaburan Portfolio 341,256 222,905 290,307 396,315 451,769 618,351
Portfolio Investment2.1 Ekuiti dan Dana Pelaburan Saham 225,379 95,878 142,856 203,208 211,468 277,534
Equity and Investment Fund Shares2.2 Sekuriti Hutang 115,877 127,027 147,451 193,107 240,301 340,818
Debt Securities3. Derivatif Kewangan 1,772 7,395 8,694 4,620 6,381 9,899
Financial Derivatives4. Pelaburan Lain 165,208 166,706 177,341 175,906 216,526 308,303
Other Investment
KEDUDUKAN PELABURANANTARABANGSA BERSIH -15,011 104,789 105,794 12,940 36,553 -13,111NET INTERNATIONALINVESTMENT POSITION
1. Pelaburan Langsung -57,292 -23,123 2,288 -14,358 -27,372 6,701Direct Investment1.1 Ekuiti dan Dana Pelaburan Saham -123,492 -88,692 -65,437 -92,011 -117,459 -125,603
Equity and Investment Fund Shares1.2 Instrumen Hutang 66,200 65,569 67,725 77,653 90,086 132,305
Debt Instruments2. Pelaburan Portfolio -290,601 -166,480 -195,169 -285,640 -324,204 -381,227
Portfolio Investment2.1 Ekuiti dan Dana Pelaburan Saham -183,968 -55,438 -73,910 -125,968 -127,251 -118,663
Equity and Investment Fund Shares2.2 Sekuriti Hutang -106,633 -111,042 -121,259 -159,672 -196,953 -262,564
Debt Securities3. Derivatif Kewangan 17 346 -909 623 416 -56
Financial Derivatives4. Pelaburan Lain -2,830 -23,400 -31,693 -16,333 -35,617 -43,876
Other Investment5. Aset Rizab 335,695 317,445 331,277 328,649 423,331 405,345
Reserve Assets
Nota / Note : f Muktamad / Final
2012
1,225,683
424,484
235,722
188,762
155,023
100,486
54,537
10,501
208,471
427,204
1,243,445
462,104
382,662
79,442
557,537
247,803
309,734
10,920
212,884
-17,762
-37,621
-146,940
109,320
-402,514
-147,318
-255,196
-419
-4,412
427,204
2013f
1,354,089
479,109
264,461
214,648
196,867
132,092
64,775
6,946
229,314
441,853
1,401,158
504,749
414,110
90,639
619,778
282,846
336,932
7,610
269,020
-47,069
-25,640
-149,649
124,009
-422,911
-150,754
-272,157
-664
-39,706
441,853

58
JADUAL 2.4: KEDUDUKAN PELABURAN ANTARABANGSA, 2001 – 2014, MALAYSIA (samb.)Table 2.4 : International Investment Position, 2001 – 2014, Malaysia (cont’d)
RM (Juta/ Million)
2007 2008 2009 2010 2011 2014p
Pelaburan Langsung Mengikut Asas Arah AliranDirect Investment According to Directional Basis
Di Luar Negeri 193,217 231,833 272,805 298,988 338,186 474,218Abroad
Modal Ekuiti dan Perolehan Dilabur Semula 113,474 148,957 185,034 202,262 225,002 303,562Equity Capital and Reinvested EarningsModal Lain 79,743 82,876 87,770 96,726 113,184 170,656Other Capital
Di Malaysia 250,509 254,955 270,517 313,346 365,558 467,516In Malaysia
Modal Ekuiti dan Perolehan Dilabur Semula 236,966 237,649 250,471 294,273 342,461 429,165Equity Capital and Reinvested EarningsModal Lain 13,543 17,306 20,045 19,073 23,097 38,351Other Capital
Pelaburan Langsung Bersih -57,292 -23,123 2,288 -14,358 -27,372 6,701Net Direct Investment
Modal Ekuiti dan Perolehan Dilabur Semula -123,492 -88,692 -65,437 -92,011 -117,459 -125,603Equity Capital and Reinvested EarningsModal Lain 66,200 65,569 67,725 77,653 90,086 132,305Other Capital
Nota / Note : f Muktamad / Final
2012
368,075
235,722
132,353
405,696
382,662
23,033
-37,621
-146,940
109,320
2013f
420,737
264,461
156,276
446,377
414,110
32,268
-25,640
-149,649
124,009

JADUAL 2.5a: KEDUDUKAN PELABURAN LANGSUNG DI LUAR NEGARA MENGIKUT SEKTOR, 2008 – 2014Table 2.5a : Direct Investment Abroad Position by Sector, 2008 – 2014
RM (Juta/ Million)
Akhir/ End ofSektor1 2008 2009 2010 2011 2012 2013f 2014p
Sectors1
Pertanian, Perhutanan dan Perikanan 13,909 32,882 30,930 33,814 30,824 32,639 33,599Agriculture, Forestry and Fishing
Perlombongan dan Pengkuarian(termasuk minyak dan gas) 75,187 84,454 82,606 93,186 102,445 120,880 130,588Mining and Quarrying (including oil and gas)
Pembuatan 20,986 17,638 21,684 21,601 20,014 24,952 26,138Manufacturing
Pembinaan 2,841 4,143 3,503 4,720 5,484 5,349 6,095Construction
Aktiviti Perkhidmatan:Services Activities:Perdagangan Borong dan Runcit 7,866 7,281 8,412 8,719 9,863 4,478 5,093Wholesale and Retail Trade
Maklumat dan Komunikasi 22,156 23,071 32,065 33,228 36,580 41,694 52,059Information and Communication
Aktiviti Kewangan dan Insurans/ Takaful2 55,142 65,719 78,150 98,012 112,510 127,735 145,471Financial and Insurance/ Takaful Activities2
Perkhidmatan Lain 33,746 37,615 41,637 44,906 50,355 63,010 75,175Other Services
Jumlah 231,833 272,805 298,988 338,186 368,075 420,737 474,218Total
Nota / Notes:f Muktamad / Final1 Sektor adalah berdasarkan sektor Pelaburan Langsung dari Malaysia
2 Termasuk pelaburan oleh syarikat pemegangInclude investments by holding companies
The sector based on Direct Investment sector from Malaysia
59

60
JADUAL 2.5b: KEDUDUKAN PELABURAN LANGSUNG DI LUAR NEGARA MENGIKUT BLOK NEGARA, 2008 – 2014Table 2.5b : Direct Investment Abroad Position by Blocks of Countries, 2008 – 2014
RM (Juta/ Million)
Akhir/ End ofBlok Negara Negara 2008 2009 2010 2011 2012 2013f 2014p
Blocks of Countries Countries
1 Amerika Utara, antaranya Amerika Syarikat 904 945 743 366 423 623 1,657North America of which United States
2 Amerika Latin, Kepulauan Cayman 6,477 10,502 11,153 13,376 14,481 20,354 19,598antaranya Cayman IslandsLatin America Kepulauan Virgin British 9,992 13,789 15,577 19,873 21,686 18,725 19,793of which Virgin Islands (British)
3 Eropah, antaranya Belanda 7,446 8,096 6,707 5,371 5,209 6,392 5,034Europe of which Netherlands
Jerman 2,727 2,543 2,310 2,499 2,748 2,397 1,564Germany
United Kingdom 8,211 8,381 10,184 9,178 10,045 12,982 21,890
4 Asia Timur, antaranya China, Republik Rakyat 4,221 4,704 4,325 5,825 5,467 5,725 6,572East Asia of which China, People’s Republic of
Hong Kong, SAR 6,603 3,767 4,840 6,093 6,423 9,113 12,751
Taiwan 2,580 2,826 2,526 2,670 1,691 1,915 2,492
5 Asia Selatan, antaranya India 3,283 7,161 8,871 2,731 3,391 6,786 12,966South Asia of which
6 Asia Tenggara, antaranya Filipina 1,208 1,654 1,848 1,379 1,370 1,075 1,400Southeast Asia of which Philippines
Indonesia 35,246 30,624 38,747 43,825 44,596 46,603 53,098
Kemboja 992 1,021 1,310 1,423 1,378 1,895 2,180Cambodia
Thailand 2,500 10,604 10,416 11,428 11,613 13,365 12,515
Singapura 28,069 40,897 51,427 55,846 59,607 66,990 70,407Singapore
Vietnam 5,114 5,042 5,192 8,069 8,354 9,230 7,823
7 Asia Barat, antaranya Emiriah Arab Bersatu 686 677 1,116 1,603 2,417 1,988 1,724West Asia of which United Arab Emirates
8 Oceania, antaranya Australia 14,115 17,003 15,986 20,280 23,043 27,608 29,278Oceania of which
9 Afrika, antaranya Mauritius 10,098 15,300 16,732 21,989 20,779 21,072 26,698Africa of which
10 Lain-lain Negara 81,361 87,269 88,978 104,362 123,353 145,899 164,779Other Countries
Jumlah 231,833 272,805 298,988 338,186 368,075 420,737 474,218Total
Nota / Note : f Muktamad / Final

61
JADUAL 2.6a: KEDUDUKAN PELABURAN LANGSUNG ASING DI MALAYSIA MENGIKUT SEKTOR, 2008 – 2014Table 2.6a : Foreign Direct Investment Position in Malaysia by Sector, 2008 – 2014, Malaysia
RM (Juta/ Million)Akhir/ End of
Sektor 2008 2009 2010 2011 2012 2014p
Sectors
Pertanian, Perhutanan dan Perikanan 8,791 9,211 9,359 9,471 9,901 11,063Agriculture, Forestry and Fishing
Perlombongan dan Pengkuarian(termasuk minyak dan gas)
14,670 17,156 18,364 24,288 27,527 35,770
Mining and Quarrying (including oil and gas)
Pembuatan 125,268 126,677 146,755 173,276 187,622 204,071Manufacturing
Pembinaan 1,116 1,052 1,370 1,390 1,610 3,420Construction
Aktiviti Perkhidmatan:Services Activities:Perdagangan Borong dan Runcit 18,805 21,270 25,529 30,523 34,092 34,468Wholesale and Retail TradeMaklumat dan Komunikasi 19,701 17,264 21,766 25,555 33,462 45,010Information and CommunicationAktiviti Kewangan dan Insurans/ Takaful1 53,585 64,288 73,895 81,384 87,344 97,955Financial and Insurance/ Takaful Activities1
Perkhidmatan Lain 13,020 13,599 16,308 19,671 24,138 35,759Other Services
Jumlah 254,955 270,517 313,346 365,558 405,696 467,516Total
Nota / Notes:f Muktamad / Final1 Termasuk pelaburan oleh syarikat pemegang
Include investments by holding companies
2013f
10,913
35,000
203,428
2,788
32,256
34,748
94,824
32,420
446,377

62
JADUAL 2.6b: KEDUDUKAN PELABURAN LANGSUNG ASING DI MALAYSIA MENGIKUT BLOK NEGARA, 2008 – 2014Table 2.6b : Foreign Direct Investment Position in Malaysia by Blocks of Countries, 2008 – 2014
RM (Juta/ Million)
Akhir/ End ofBlok Negara Negara 2008 2009 2010 2011 2012 2013f 2014p
Blocks of Countries Countries
1 Amerika Utara, antaranya Amerika Syarikat 36,153 31,124 34,140 37,964 36,041 38,850 35,827North America of which United States
2 Amerika Latin, Bermuda 5,093 5,459 6,610 8,627 10,453 14,346 11,425antaranyaLatin America Kepulauan Cayman 7,350 7,276 8,515 3,314 2,598 2,557 4,083of which Cayman Islands
Kepulauan Virgin (British) 13,739 15,066 16,630 16,898 18,250 16,673 17,727Virgin Islands (British)
3 Eropah, antaranya Belanda 23,627 25,131 27,439 29,800 31,367 35,137 43,196Europe of which Netherlands
Denmark 2,282 3,040 3,163 3,624 4,201 4,263 4,490
Luxembourg 334 1,315 1,363 619 1,519 359 -49
Jerman 12,191 12,411 12,399 16,030 17,836 19,243 18,559Germany
Perancis1,319 1,446 2,293 3,045 2,871 3,138 4,287
France
Switzerland 12,607 8,465 11,172 15,275 18,283 21,037 21,256
United Kingdom 15,491 18,308 18,326 17,400 18,978 19,023 20,022
4 Asia Timur, antaranya China, Republik Rakyat 1,090 685 1,003 1,170 752 1,080 2,137East Asia of which China, People’s Republic of
Hong Kong, SAR 6,302 8,909 11,689 11,449 14,740 20,421 23,168
Jepun 31,513 32,412 37,501 47,271 56,369 65,310 66,447Japan
Republik Korea 2,728 3,181 7,943 8,377 7,611 7,255 7,331Korea, Republic of
Taiwan 2,172 2,201 1,930 1,953 1,746 1,889 1,951
5 Asia Tenggara, antaranya Thailand 684 259 -529 253 -665 -454 -558Southeast Asia of which
Singapura 45,287 47,869 52,810 66,687 72,537 80,745 87,629Singapore
6 Oceania, antaranya Australia 2,380 5,900 9,158 10,522 12,188 13,197 11,996Oceania of which
7 Lain-lain Negara 32,613 40,060 49,791 65,280 78,021 82,311 86,593Other Countries
Jumlah 254,955 270,517 313,346 365,558 405,696 446,377 467,516Total
Nota / Note : f Muktamad / Final

63
JADUAL 2.7a: ALIRAN BERSIH PELABURAN LANGSUNG DI LUAR NEGARA MENGIKUT SEKTOR, 2008 – 2014Table 2.7a : Net Flows of Direct Investment Abroad by Sector, 2008 – 2014
RM (Juta/ Million)Akhir/ End of
Sektor1 2008 2009 2010 2011 2012 2013f 2014r
Sectors1
Pertanian, Perhutanan dan Perikanan -28 -2,592 -1,398 -2,990 -509 -309 -2,126Agriculture, Forestry and Fishing
Perlombongan dan Pengkuarian (termasuk minyakdan gas)
-18,918 -9,685 -10,594 -13,766 -27,037 -24,379 -23,426
Mining and Quarrying (including oil and gas)
Pembuatan -4,517 -1,517 -4,724 660 359 -3,107 -442Manufacturing
Pembinaan -939 -887 215 -984 -653 392 -193Construction
Aktiviti Perkhidmatan:Services Activities:Perdagangan Borong dan Runcit 1,102 1,079 -579 -461 -2,889 501 636Wholesale and Retail Trade
Maklumat dan Komunikasi -4,302 -4,096 -1,279 -4,265 -1,912 -4,391 -7,906Information and CommunicationAktiviti Kewangan dan Insurans/ Takaful2 -19,081 -6,863 -18,993 -22,293 -12,977 -8,542 -13,258Financial and Insurance/ Takaful Activities2
Perkhidmatan Lain -3,238 -2,875 -5,808 -2,563 -7,334 -4,615 -7,108Other Services
Jumlah -49,920 -27,436 -43,160 -46,662 -52,952 -44,450 -53,824Total
Nota / Notes:f Muktamad / Final1 Sektor adalah berdasarkan sektor Pelabur Langsung dari Malaysia
The sector based on Direct Investment sector from Malaysia2 Termasuk pelaburan oleh syarikat pemegang
Include investments by holding companies

64
JADUAL 2.7b: ALIRAN BERSIH PELABURAN LANGSUNG DI LUAR NEGARA MENGIKUT BLOK NEGARA, 2008 – 2014Table 2.7b : Net Flows of Direct Investment Abroad by Blocks of Countries, 2008 – 2014
RM (Juta/ Million)
Akhir/ End ofBlok Negara Negara 2008 2009 2010 2011 2012 2013f 2014r
Blocks of Countries Countries
1 Amerika Utara, antaranya Amerika Syarikat -181 -108 95 201 -54 260 -269North America of which United States
2 Amerika Latin, antaranya Kepulauan Cayman -976 -833 -1,137 -1,719 -1,170 637 -1,523Latin America of which Cayman Islands
Kepulauan Virgin British -69 -3,371 -1,953 -3,679 -1,699 -908 -532Virgin Islands (British)
3 Eropah, antaranya Belanda 914 524 -338 202 225 -230 -767Europe of which Netherlands
Jerman -2,654 146 -166 -93 -71 -66 680Germany
United Kingdom -2,576 -666 -2,855 -1,551 -468 -690 -5,073
4 Asia Timur, antaranya China, Republik Rakyat -749 -796 -24 -924 -6 -92 -563East Asia of which China, People’s Republic of
Hong Kong, SAR -214 -22 -938 -549 -3,111 -2,160 -867
Taiwan 67 -157 45 -53 986 -126 -422
5 Asia Selatan, antaranya India -2,994 -1,085 -759 5,713 -574 -3,456 -5,773South Asia of which
6 Asia Tenggara, antaranya Filipina -214 -242 -286 123 -111 -130 -290Southeast Asia of which Philippines
Indonesia -12,931 -2,391 -2,763 -4,023 -2,787 -3,835 -5,480
Kemboja -323 -135 -351 -66 -95 -336 -138Cambodia
Thailand -619 -2,748 -1,001 -178 -1,077 -1,736 -174
Singapura -5,319 -3,569 -12,800 -9,603 -8,322 -3,856 -895Singapore
Vietnam -1,749 -837 -427 -2,886 -89 -341 12
7 Asia Barat, antaranya Emiriah Arab Bersatu -496 -73 -360 -481 -346 582 319West Asia of which United Arab Emirates
8 Oceania, antaranya Australia -7,509 -946 -6,040 -7,492 -4,288 -6,474 -4,405Oceania of which
9 Afrika, antaranya Mauritius -4,236 -3,649 -1,659 -6,526 1,739 1,526 -1,724Africa of which
10 Lain-lain Negara -7,093 -6,478 -9,442 -13,080 -31,633 -23,018 -25,939Other Countries
Jumlah -49,920 -27,436 -43,160 -46,662 -52,952 -44,450 -53,824Total
Nota / Note : f Muktamad / Final

65
JADUAL 2.8a: ALIRAN BERSIH PELABURAN LANGSUNG ASING DI MALAYSIA MENGIKUT SEKTOR, 2008 – 2014Table 2.8a : Net Flows of Foreign Direct Investment in Malaysia by Sector, 2008 – 2014
RM (Juta/ Million)Akhir/ End of
Sektor 2008 2009 2010 2011 2012 2013f 2014r
Sectors
Pertanian, Perhutanan dan Perikanan 265 -88 -47 82 291 1,001 416Agriculture, Forestry and Fishing
Perlombongan dan Pengkuarian (termasuk minyakdan gas)
-2,296 3,270 3,108 7,777 9,446 11,223 12,737
Mining and Quarrying (including oil and gas)
Pembuatan 12,368 -1,742 16,545 16,704 13,096 14,445 4,670Manufacturing
Pembinaan 114 -103 -223 98 379 817 1,053Construction
Aktiviti Perkhidmatan:Services Activities:Perdagangan Borong dan Runcit 38 2,689 2,599 3,328 2,435 -98 3,414Wholesale and Retail TradeMaklumat dan Komunikasi 639 -2,058 349 -385 92 2,476 627Information and CommunicationAktiviti Kewangan dan Insurans/ Takaful1 11,694 4,247 6,233 5,315 1,460 2,743 9,805Financial and Insurance/ Takaful Activities1
Perkhidmatan Lain 1,101 -1,092 618 4,405 1,337 5,568 2,621Other ServicesJumlah 23,925 5,121 29,183 37,325 28,537 38,175 35,344Total
Nota / Notes:f Muktamad / Final1 Termasuk pelaburan oleh syarikat pemegang
Include investments by holding companies

66
JADUAL 2.8b: ALIRAN BERSIH PELABURAN LANGSUNG ASING DI MALAYSIA MENGIKUT BLOK NEGARA, 2008 – 2014Table 2.8b : Net Flows of Foreign Direct Investment in Malaysia by Blocks of Countries, 2008 – 2014
RM (Juta/ Million)
Akhir/ End ofBlok Negara Negara 2008 2009 2010 2013f 2014r
Blocks of Countries Countries
1 Amerika Utara, antaranya Amerika Syarikat 4,003 -7,700 7,823 580 -1,755North America of which United States
2 Amerika Latin, Bermuda 1,478 1,142 337 1,555 2,318antaranyaLatin America Kepulauan Cayman 3,774 -410 1,253 760 2,357of which Cayman Islands
Kepulauan Virgin British 1,275 1,502 1,350 2,553 1,072Virgin Islands (British)
3 Eropah, antaranya Belanda 2,499 1,719 6,136 4,742 6,832Europe of which Netherlands
Denmark 636 458 -104 159 164
Luxembourg -52 395 131 -280 -225
Jerman 1,289 -344 -496 -24 1,093Germany
Perancis 161 44 714 208 1,419France
Switzerland 1,533 -3,939 493 2,192 565
United Kingdom 622 1,294 -1,785 -248 43
4 Asia Timur, antaranya China, Republik Rakyat 201 -424 -95 324 975East Asia of which China, People’s Republic of
Hong Kong, SAR 777 1,603 -718 4,468 3,431
Jepun 1,783 565 2,923 8,017 1,962Japan
Republik Korea 6 396 4,544 -525 -835Korea, Republic of
Taiwan 282 -66 -411 78 39
5 Asia Tenggara, antaranya Thailand 953 -305 -512 764 401Southeast Asia of which
Singapura 4,291 442 1,681 5,519 7,468Singapore
6 Oceania antaranya Australia 342 604 254 386 -407Oceania of which
7 Lain-lain Negara -1,929 8,145 5,665 6,946 8,427Other Countries
Jumlah 23,925 5,121 29,183 38,175 35,344Total
Nota / Note : f Muktamad / Final
2011 2012
3,342 -1,366
1,398 647
-3,976 -287
-803 1,232
3,552 1,955
103 -82
-521 702
3,077 1,720
345 -88
1,033 1,638
1,030 988
25 96
-436 1,146
9,868 5,872
429 -697
-119 -246
1,147 -173
6,347 5,350
675 1,672
10,807 8,458
37,325 28,537

PERDAGANGAN LUAR NEGERIEXTERNAL TRADE


EXTERNAL TRADE
Explanatory Notes
1. The compilation of Malaysia’s externaltrade statistics aims to provide informationon Malaysia’s trade performance vis-à-visthe rest of the world in terms of volume,value and average unit value ofmerchandise goods. In this report, only thevalue of external trade is presented.
2. The general system of recording isadopted in compiling Malaysian externaltrade statistics. Under this system, thenational boundary of the country is usedas the statistical frontier. All goodsentering or leaving the country (exceptspecific exclusions goods) are recorded,whether or not such goods are subject toclearance. Accordingly, goods entering orleaving customs bonded warehouses,Free Industrial Zones, Free CommercialZones and Free Zones are recorded in thestatistics.
3. Commodities are classified according tothe Standard International TradeClassification of the United Nations. Thecommodity classifications that were in usesince 1967 are as follows :-
i. 1967 to 1977 (SITC Rev.1)ii. 1978 to 1987 (SITC Rev.2)iii. 1988 to March 2008 (SITC Rev.3)vi. April 2008 onwards (SITC Rev.4)
PERDAGANGAN LUAR NEGERI
Nota Keterangan
1. Penyusunan perangkaan perdaganganluar negeri Malaysia bertujuan untukmembekalkan maklumat tentang prestasiperdagangan Malaysia berbandingdengan negara-negara lain di dunia darisegi kuantiti, nilai dan nilai unit puratabarang dagangan. Dalam laporan ini,hanya nilai perdagangan luar negeridipersembahkan.
2. Malaysia menggunakan sistem umumd a l a m m e n y u s u n p e r a n g k a a nperdagangan luar negeri. Di bawah sistemini, sempadan negara digunakan sebagaisempadan perangkaan. Semua barangyang dibawa masuk atau keluar darinegara (selain barang yang dikecualikan)direkodkan, sama ada barang itu tertaklukkepada kelulusan tertentu ataupun tidak.Demikian juga barang yang dibawa masukatau keluar dari gudang-gudang simpanankastam, Zon Perindustrian Bebas, ZonKomersial Bebas dan Zon Bebasdirekodkan dalam perangkaan ini.
3. Barang dagangan dikelaskan mengikutPiawaian Klasifikasi PerdaganganAntarabangsa oleh Pertubuhan Bangsa-Bangsa Bersatu. Pengelasan jeniskomoditi yang telah digunakan sejak tahun1967 adalah seperti berikut :-
i. 1967 sehingga 1977 (SITC Rev.1)ii. 1978 sehingga 1987 (SITC Rev.2)iii. 1988 sehingga Mac 2008 (SITC Rev.3)vi. April 2008 dan seterusnya
(SITC Rev.4)
69

4. Import baranganSesuatu barang dianggap sebagai importapabila ianya dibawa masuk ke dalamnegara, sama ada terus ataupundisimpan di gudang-gudang yang dikawaltanpa mengira sama ada barang tersebutadalah untuk kegunaan sendiri, diproses,digunakan dalam perkilangan ataupununtuk dieksport semula ke negara lain.
5. Eksport baranganSesuatu barang (keluaran atau buatantempatan atau diimport untuk dieksportsemula) dianggap sebagai eksportapabila ianya dibawa keluar dari negara.
6. Import - c.i.f. (kos, insuran dantambang)Nilai barangan di pasaran di sempadanperangkaan/kastam negara pengimport,termasuk semua perbelanjaan insurandan tambang semasa dalam perjalanantetapi kos pemunggahan dari alatpengangkutan tidak diambil kira kecualikos tersebut ditanggung sendiri olehpengangkut.
7. Eksport - f.o.b (free on board)Nilai barangan di pasaran di sempadanperangkaan/kastam negara pengeksport,termasuk semua perbelanjaanpengangkutan ke sempadan tersebut,duti eksport dan duti lain yang perludibayar serta kos untuk memunggahbarang ke atas alat pengangkutankecuali kos terakhir itu ditanggung sendirioleh pengangkut.
4. Imports of goodsGoods are regarded as imports whenthey are brought into the country eitherdirectly or into bonded warehouses,irrespective of whether such goods arefor consumption, to be processed, use inmanufacturing or subsequent re-exportsto other countries.
5. Exports of goodsGoods (locally produced or manufacturedor imported for subsequent re-exports)are regarded as exports when they aretaken out of the country.
6. Imports - c.i.f (cost, insurance andfreight)The value of the goods in the market atthe statistical/customs frontier of theimporting country, including all chargesfor transport and insurance whilst intransit but excluding the cost of unloadingfrom the carrier unless it is borne by thecarrier.
7. Exports - f.o.b (free on board)The value of the goods in the market atthe statistical/customs frontier of theexporting country, including all costs oftransporting the goods to the statistical/customs frontier, export and other dutiespayable as well as the cost of loading thegoods onto the carrier unless the lattercost is borne by the carrier.
70

8. Imbangan perdaganganPerbezaan antara nilai eksport danimport. Apabila eksport melebihi importlebihan direkodkan manakala defisit puladicatatkan apabila import melebihieksport.
8. Balance of tradeThe difference between the value ofexports and imports. When exportsexceed imports it is recorded as a surpluswhile a deficit is registered when importsexceed exports.
71
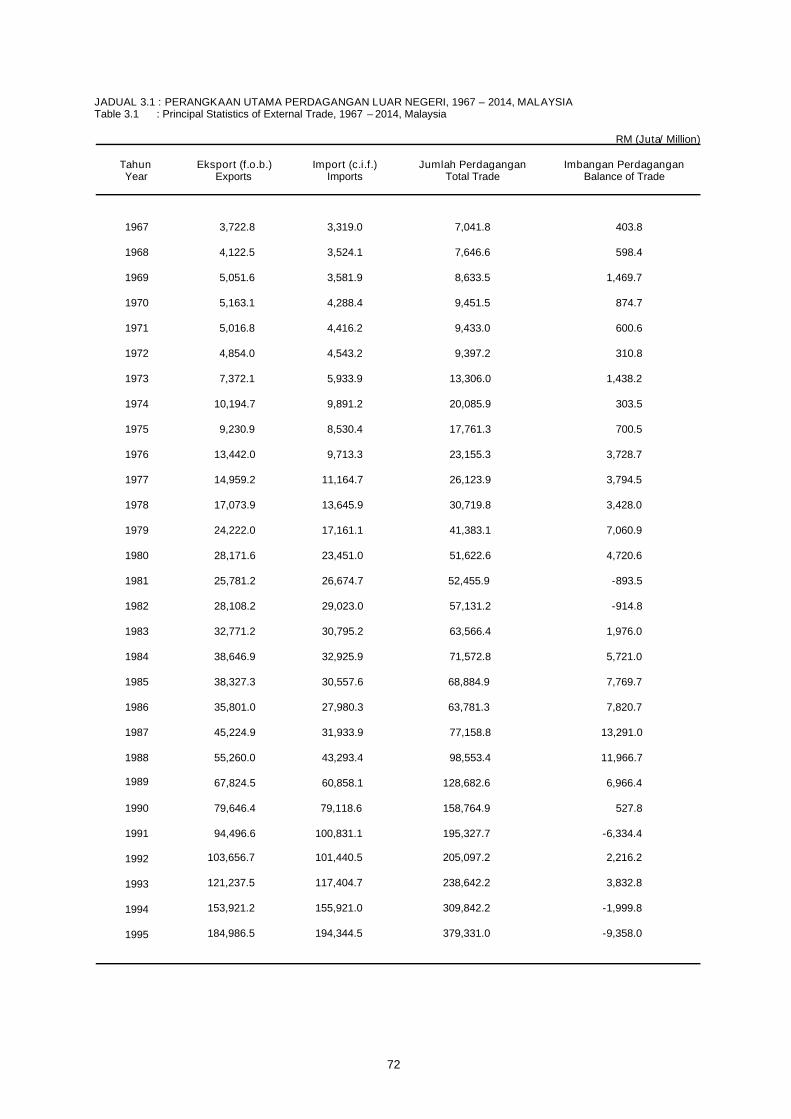
72
JADUAL 3.1 : PERANGKAAN UTAMA PERDAGANGAN LUAR NEGERI, 1967 – 2014, MALAYSIATable 3.1 : Principal Statistics of External Trade, 1967 – 2014, Malaysia
RM (Juta/ Million)
Tahun Eksport (f.o.b.) Import (c.i.f.) Jumlah Perdagangan Imbangan PerdaganganYear Exports Imports Total Trade Balance of Trade
1967 3,722.8 3,319.0 7,041.8 403.8
1968 4,122.5 3,524.1 7,646.6 598.4
1969 5,051.6 3,581.9 8,633.5 1,469.7
1970 5,163.1 4,288.4 9,451.5 874.7
1971 5,016.8 4,416.2 9,433.0 600.6
1972 4,854.0 4,543.2 9,397.2 310.8
1973 7,372.1 5,933.9 13,306.0 1,438.2
1974 10,194.7 9,891.2 20,085.9 303.5
1975 9,230.9 8,530.4 17,761.3 700.5
1976 13,442.0 9,713.3 23,155.3 3,728.7
1977 14,959.2 11,164.7 26,123.9 3,794.5
1978 17,073.9 13,645.9 30,719.8 3,428.0
1979 24,222.0 17,161.1 41,383.1 7,060.9
1980 28,171.6 23,451.0 51,622.6 4,720.6
1981 25,781.2 26,674.7 52,455.9 -893.5
1982 28,108.2 29,023.0 57,131.2 -914.8
1983 32,771.2 30,795.2 63,566.4 1,976.0
1984 38,646.9 32,925.9 71,572.8 5,721.0
1985 38,327.3 30,557.6 68,884.9 7,769.7
1986 35,801.0 27,980.3 63,781.3 7,820.7
1987 45,224.9 31,933.9 77,158.8 13,291.0
1988 55,260.0 43,293.4 98,553.4 11,966.7
1989 67,824.5 60,858.1 128,682.6 6,966.4
1991 94,496.6 100,831.1 195,327.7 -6,334.4
1990 79,646.4 79,118.6 158,764.9 527.8
1992 103,656.7 101,440.5 205,097.2 2,216.2
1993 121,237.5 117,404.7 238,642.2 3,832.8
1994 153,921.2 155,921.0 309,842.2 -1,999.8
1995 184,986.5 194,344.5 379,331.0 -9,358.0
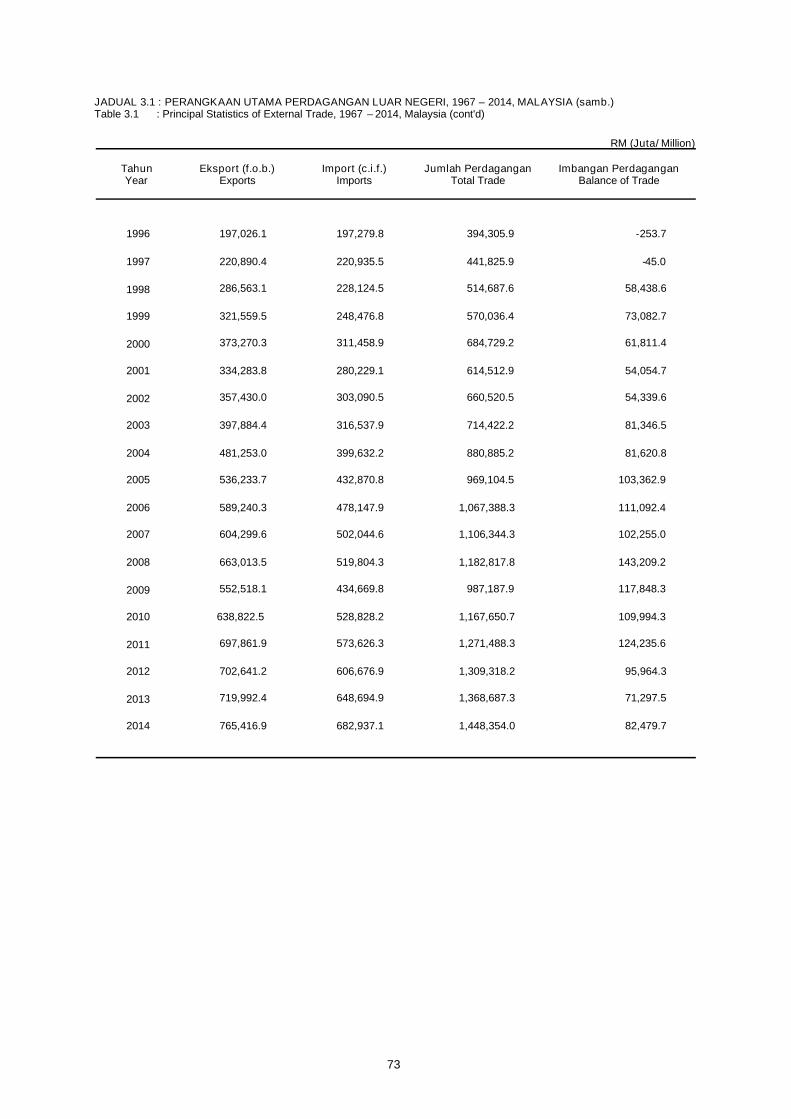
73
JADUAL 3.1 : PERANGKAAN UTAMA PERDAGANGAN LUAR NEGERI, 1967 – 2014, MALAYSIA (samb.)Table 3.1 : Principal Statistics of External Trade, 1967 – 2014, Malaysia (cont'd)
RM (Juta/ Million)
Tahun Eksport (f.o.b.) Import (c.i.f.) Jumlah Perdagangan Imbangan PerdaganganYear Exports Imports Total Trade Balance of Trade
1996 197,026.1 197,279.8 394,305.9 -253.7
1997 220,890.4 220,935.5 441,825.9 -45.0
1998 286,563.1 228,124.5 514,687.6 58,438.6
1999 321,559.5 248,476.8 570,036.4 73,082.7
2000 373,270.3 311,458.9 684,729.2 61,811.4
2001 334,283.8 280,229.1 614,512.9 54,054.7
2002 357,430.0 303,090.5 660,520.5 54,339.6
2003 397,884.4 316,537.9 714,422.2 81,346.5
2004 481,253.0 399,632.2 880,885.2 81,620.8
2005 536,233.7 432,870.8 969,104.5 103,362.9
2006 589,240.3 478,147.9 1,067,388.3 111,092.4
2007 604,299.6 502,044.6 1,106,344.3 102,255.0
2008 663,013.5 519,804.3 1,182,817.8 143,209.2
2009 552,518.1 434,669.8 987,187.9 117,848.3
2010 638,822.5 528,828.2 1,167,650.7 109,994.3
2011 697,861.9 573,626.3 1,271,488.3 124,235.6
2012 702,641.2 606,676.9 1,309,318.2 95,964.3
2013 719,992.4 648,694.9 1,368,687.3 71,297.5
2014 765,416.9 682,937.1 1,448,354.0 82,479.7

JADUAL 3.2 : PERANGKAAN UTAMA PERDAGANGAN LUAR NEGERI, EKSPORT & IMPORT MENGIKUT SEKSYENBARANGAN, 1967 – 2014, MALAYSIA
Table 3.2 : Principal Statistics of External Trade, Exports & Imports by Commodity Section, 1967 – 2014, Malaysia
RM (Juta/ Million)Eksport
Seksyen Barangan ExportsCommodity Sections 1967 1968 1969 1970 1971
0 Makanan 207.5 220.5 235.1 284.0 315.9Food
1 Minuman dan Tembakau 21.5 10.9 17.7 21.7 23.4Beverages and Tobacco
2 Bahan-bahan Mentah, Tidak Boleh Dimakan 2,061.2 2,259.6 3,001.5 2,777.5 2,392.2Crude Materials, Inedible
3 Bahan Api Galian, Pelicin, dan Lain-lain 295.5 351.0 340.0 365.6 502.5Mineral Fuels, Lubricants, etc.
4 Minyak dan Lemak Binatang dan Sayur-sayuran 141.7 165.4 177.6 309.8 422.8Animal and Vegetable Oils and Fats
5 Bahan Kimia 34.3 37.6 39.0 36.4 38.7Chemicals
6 Barang-barang Keluaran Kilang 827.2 918.4 1,070.4 1,182.8 1,111.8Manufactured Goods
7 Jentera dan Kelengkapan Pengangkutan 56.5 73.5 84.0 84.1 83.6Machinery and Transport Equipment
8 Pelbagai Barang Keluaran Kilang 29.6 31.2 33.0 43.4 48.5Miscellaneous Manufactured Articles
9 Pelbagai Urus Niaga dan Barangan 47.8 54.4 53.3 57.8 77.4Miscellaneous Transactions and Commodities
Jumlah 3,722.8 4,122.5 5,051.6 5,163.1 5,016.8Total
ImportSeksyen Barangan Imports
Commodity Sections 1967 1968 1969 1970 1971
0 Makanan 761.8 765.0 726.8 786.7 735.6Food
1 Minuman dan Tembakau 90.1 77.0 87.3 92.9 108.8Beverages and Tobacco
2 Bahan-bahan Mentah, Tidak Boleh Dimakan 166.4 283.5 302.8 322.1 267.1Crude Materials, Inedible
3 Bahan Api Galian, Pelicin, dan Lain-lain 445.7 501.4 485.3 517.5 576.3Mineral Fuels, Lubricants, etc.
4 Minyak dan Lemak Binatang dan Sayur-sayuran 14.9 22.1 19.3 23.8 22.8Animal and Vegetable Oils and Fats
5 Bahan Kimia 247.2 237.9 272.5 312.5 341.5Chemicals
6 Barang-barang Keluaran Kilang 590.9 610.2 621.6 770.2 780.6Manufactured Goods
7 Jentera dan Kelengkapan Pengangkutan 735.8 776.2 827.8 1,197.3 1,332.6Machinery and Transport Equipment
8 Pelbagai Barang Keluaran Kilang 191.3 186.2 179.6 199.9 194.6Miscellaneous Manufactured Articles
9 Pelbagai Urus Niaga dan Barangan 74.9 64.6 58.9 65.5 56.2Miscellaneous Transactions and Commodities
Jumlah 3,319.0 3,524.1 3,581.9 4,288.4 4,416.2Total
74

75
JADUAL 3.2 : PERANGKAAN UTAMA PERDAGANGAN LUAR NEGERI, EKSPORT & IMPORT MENGIKUT SEKSYENBARANGAN, 1967 – 2014, MALAYSIA (samb.)
Table 3.2 : Principal Statistics of External Trade, Exports & Imports by Commodity Section, 1967 – 2014, Malaysia (cont'd)
RM (Juta/ Million)EksportExports
1972 1973 1974 1975 1976 1977 1978 1979 1980
360.8 440.9 513.7 593.1 799.1 826.9 872.3 1,081.9 1,013.2
27.7 21.3 24.4 27.7 27.9 23.4 15.7 20.9 29.1
2,249.1 4,156.7 4,515.8 3,231.4 5,668.3 5,975.7 6,360.1 9,024.9 9,105.3
319.5 371.5 832.9 967.1 1,905.4 2,101.1 2,342.7 4,345.8 6,898.4
411.5 559.6 1,370.0 1,508.5 1,378.2 1,979.4 2,105.7 3,016.4 3,131.3
46.4 66.7 79.8 79.4 82.0 86.8 102.3 131.0 171.5
1,217.5 1,317.6 1,966.2 1,624.3 2,132.7 2,324.3 2,825.4 3,314.5 3,690.7
90.9 142.0 399.4 573.0 739.6 1,001.2 1,861.1 2,535.4 3,238.4
72.3 225.7 395.9 529.3 608.5 545.4 495.5 603.8 737.7
58.3 70.1 96.6 97.1 100.3 95.0 138.1 147.4 156.0
4,854.0 7,372.1 10,194.7 9,230.9 13,442.0 14,959.2 17,073.9 24,222.0 28,171.6
ImportImports
1972 1973 1974 1975 1979 1980
808.8 1,078.2 1,585.0 1,401.5 2,051.5 2,444.3
81.7 97.7 114.9 119.4 185.2 221.3
310.3 372.5 543.1 554.9 850.3 1,052.8
368.3 392.9 1,003.5 1,021.1 2,076.7 3,554.4
22.3 27.2 44.1 26.0 30.2 29.7
377.2 525.9 879.0 711.8 1,747.4 2,022.4
847.7 1,250.6 1,864.6 1,389.4 2,919.8 3,849.2
1,470.8 1,786.6 3,207.0 2,774.1 6,373.6 9,105.3
199.9 333.0 559.7 465.3 791.0 975.0
56.2 69.3 90.3 66.9 135.4 196.6
4,543.2 5,933.9 9,891.2 8,530.4 17,161.1 23,451.0
1976
1,440.6
116.7
537.5
1,309.8
21.1
919.3
1,620.0
3,179.9
491.9
76.5
9,713.3
1978
1,978.7
184.6
725.8
1,470.3
25.7
1,217.7
2,236.5
4,949.7
722.0
134.9
13,645.9
1977
1,643.7
145.4
637.8
1,421.7
26.0
1,079.0
1,788.2
3,761.0
581.1
80.8
11,164.7

JADUAL 3.2 : PERANGKAAN UTAMA PERDAGANGAN LUAR NEGERI, EKSPORT & IMPORT MENGIKUT SEKSYENBARANGAN, 1967 – 2014, MALAYSIA (samb.)
Table 3.2 : Principal Statistics of External Trade, Exports & Imports by Commodity Section, 1967 – 2014, Malaysia (cont’d)
RM (Juta/ Million)Eksport
Seksyen Barangan ExportsCommodity Sections 1981 1982 1983 1984 1985
0 Makanan 1,134.5 1,152.5 1,272.9 1,479.8 1,659.8Food
1 Minuman dan Tembakau 29.8 22.1 28.2 28.2 25.5Beverages and Tobacco
2 Bahan-bahan Mentah, Tidak Boleh Dimakan 7,716.2 7,583.2 8,261.7 8,121.2 7,268.4Crude Materials, Inedible
3 Bahan Api Galian, Pelicin, dan Lain-lain 7,144.6 7,980.9 9,300.5 11,435.4 12,249.8Mineral Fuels, Lubricants, etc.
4 Minyak dan Lemak Binatang dan Sayur-sayuran 3,361.2 3,255.8 3,829.2 5,868.2 4,845.6Animal and Vegetable Oils and Fats
5 Bahan Kimia 191.9 235.8 293.9 426.7 441.1Chemicals
6 Barang-barang Keluaran Kilang 3,281.3 2,625.9 3,035.1 2,554.7 3,101.1Manufactured Goods
7 Jentera dan Kelengkapan Pengangkutan 2,007.6 4,335.0 5,652.5 7,322.9 7,155.8Machinery and Transport Equipment
8 Pelbagai Barang Keluaran Kilang 698.7 753.8 902.3 1,196.1 1,369.4Miscellaneous Manufactured Articles
9 Pelbagai Urus Niaga dan Barangan 214.5 163.2 194.9 213.7 210.6Miscellaneous Transactions and Commodities
Jumlah 25,781.2 28,108.2 32,771.2 38,646.9 38,327.3Total
ImportSeksyen Barangan Imports
Commodity Sections 1981 1982 1983 1984 1985
0 Makanan 2,941.5 2,999.4 2,984.5 3,227.1 3,075.4Food
1 Minuman dan Tembakau 255.1 247.6 250.2 212.8 228.7Beverages and Tobacco
2 Bahan-bahan Mentah, Tidak Boleh Dimakan 1,162.0 1,132.3 1,186.6 1,157.8 1,037.6Crude Materials, Inedible
3 Bahan Api Galian, Pelicin, dan Lain-lain 4,606.9 4,389.6 4,241.6 3,332.3 3,691.2Mineral Fuels, Lubricants, etc.
4 Minyak dan Lemak Binatang dan Sayur-sayuran 35.2 36.5 56.3 119.9 81.5Animal and Vegetable Oils and Fats
5 Bahan Kimia 2,097.9 2,145.0 2,424.9 2,635.6 2,639.8Chemicals
6 Barang-barang Keluaran Kilang 4,326.3 4,915.5 4,881.6 5,086.0 4,436.6Manufactured Goods
7 Jentera dan Kelengkapan Pengangkutan 9,863.9 11,548.4 13,171.2 15,128.8 13,290.7Machinery and Transport Equipment
8 Pelbagai Barang Keluaran Kilang 1,077.9 1,354.0 1,395.9 1,715.6 1,708.6Miscellaneous Manufactured Articles
9 Pelbagai Urus Niaga dan Barangan 308.3 254.7 202.3 310.0 324.0Miscellaneous Transactions and Commodities
Jumlah 26,674.7 29,023.0 30,795.2 32,925.9 30,557.6Total
76
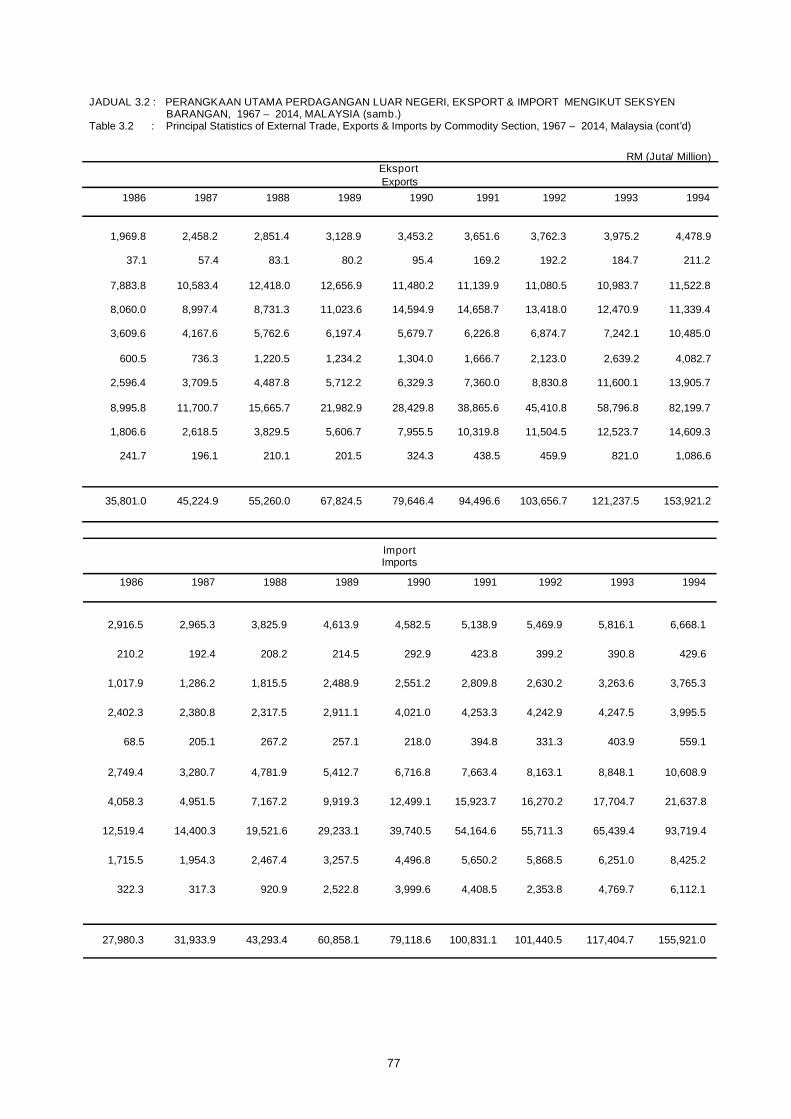
JADUAL 3.2 : PERANGKAAN UTAMA PERDAGANGAN LUAR NEGERI, EKSPORT & IMPORT MENGIKUT SEKSYENBARANGAN, 1967 – 2014, MALAYSIA (samb.)
Table 3.2 : Principal Statistics of External Trade, Exports & Imports by Commodity Section, 1967 – 2014, Malaysia (cont’d)
RM (Juta/ Million)EksportExports
1986 1987 1988 1989 1990 1991 1992 1993 1994
1,969.8 2,458.2 2,851.4 3,128.9 3,453.2 3,651.6 3,762.3 3,975.2 4,478.9
37.1 57.4 83.1 80.2 95.4 169.2 192.2 184.7 211.2
7,883.8 10,583.4 12,418.0 12,656.9 11,480.2 11,139.9 11,080.5 10,983.7 11,522.8
8,060.0 8,997.4 8,731.3 11,023.6 14,594.9 14,658.7 13,418.0 12,470.9 11,339.4
3,609.6 4,167.6 5,762.6 6,197.4 5,679.7 6,226.8 6,874.7 7,242.1 10,485.0
600.5 736.3 1,220.5 1,234.2 1,304.0 1,666.7 2,123.0 2,639.2 4,082.7
2,596.4 3,709.5 4,487.8 5,712.2 6,329.3 7,360.0 8,830.8 11,600.1 13,905.7
8,995.8 11,700.7 15,665.7 21,982.9 28,429.8 38,865.6 45,410.8 58,796.8 82,199.7
1,806.6 2,618.5 3,829.5 5,606.7 7,955.5 10,319.8 11,504.5 12,523.7 14,609.3
241.7 196.1 210.1 201.5 324.3 438.5 459.9 821.0 1,086.6
35,801.0 45,224.9 55,260.0 67,824.5 79,646.4 94,496.6 103,656.7 121,237.5 153,921.2
ImportImports
1986 1987 1988 1989 1993 1994
2,916.5 2,965.3 3,825.9 4,613.9 5,816.1 6,668.1
210.2 192.4 208.2 214.5 390.8 429.6
1,017.9 1,286.2 1,815.5 2,488.9 3,263.6 3,765.3
2,402.3 2,380.8 2,317.5 2,911.1 4,247.5 3,995.5
68.5 205.1 267.2 257.1 403.9 559.1
2,749.4 3,280.7 4,781.9 5,412.7 8,848.1 10,608.9
4,058.3 4,951.5 7,167.2 9,919.3 17,704.7 21,637.8
12,519.4 14,400.3 19,521.6 29,233.1 65,439.4 93,719.4
1,715.5 1,954.3 2,467.4 3,257.5 6,251.0 8,425.2
322.3 317.3 920.9 2,522.8 4,769.7 6,112.1
27,980.3 31,933.9 43,293.4 60,858.1 117,404.7 155,921.0
1990
4,582.5
292.9
2,551.2
4,021.0
218.0
6,716.8
12,499.1
39,740.5
4,496.8
3,999.6
79,118.6
1992
5,469.9
399.2
2,630.2
4,242.9
331.3
8,163.1
16,270.2
55,711.3
5,868.5
2,353.8
101,440.5
1991
5,138.9
423.8
2,809.8
4,253.3
394.8
7,663.4
15,923.7
54,164.6
5,650.2
4,408.5
100,831.1
77

JADUAL 3.2 : PERANGKAAN UTAMA PERDAGANGAN LUAR NEGERI, EKSPORT & IMPORT MENGIKUT SEKSYENBARANGAN, 1967 – 2014, MALAYSIA (samb.)
Table 3.2 : Principal Statistics of External Trade, Exports & Imports by Commodity Section, 1967 – 2014, Malaysia (cont’d)
RM (Juta/ Million)Eksport
Seksyen Barangan ExportsCommodity Sections 1995 1996 1997 1998 1999
0 Makanan 4,515.8 4,722.8 5,304.9 6,193.6 6,229.3Food
1 Minuman dan Tembakau 397.7 577.0 746.8 924.9 1,046.5Beverages and Tobacco
2 Bahan-bahan Mentah, Tidak Boleh Dimakan 11,991.8 10,759.4 10,102.1 9,312.8 9,910.4Crude Materials, Inedible
3 Bahan Api Galian, Pelicin, dan Lain-lain 12,932.3 15,884.8 17,943.9 17,661.6 22,480.0Mineral Fuels, Lubricants, etc.
4 Minyak dan Lemak Binatang dan Sayur-sayuran 12,634.0 11,726.8 13,000.0 21,386.1 18,280.0Animal and Vegetable Oils and Fats
5 Bahan Kimia 5,629.1 6,255.8 7,878.0 9,961.9 10,353.0Chemicals
6 Barang-barang Keluaran Kilang 16,339.9 18,289.9 19,870.6 23,819.2 24,242.8Manufactured Goods
7 Jentera dan Kelengkapan Pengangkutan 101,995.1 108,929.9 123,984.1 169,701.7 200,071.5Machinery and Transport Equipment
8 Pelbagai Barang Keluaran Kilang 16,131.6 17,713.7 19,325.5 24,945.7 26,188.4Miscellaneous Manufactured Articles
9 Pelbagai Urus Niaga dan Barangan 2,419.3 2,166.0 2,734.6 2,655.6 2,757.7Miscellaneous Transactions and Commodities
Jumlah 184,986.5 197,026.1 220,890.4 286,563.1 321,559.5Total
ImportSeksyen Barangan Imports
Commodity Sections 1995 1996 1997 1998 1999
0 Makanan 7,884.7 9,094.9 10,083.6 10,514.2 10,873.0Food
1 Minuman dan Tembakau 558.2 499.1 661.1 596.3 682.0Beverages and Tobacco
2 Bahan-bahan Mentah, Tidak Boleh Dimakan 4,615.2 4,964.9 5,496.9 5,723.8 6,224.6Crude Materials, Inedible
3 Bahan Api Galian, Pelicin, dan Lain-lain 4,351.0 5,222.1 6,413.1 6,991.9 7,488.8Mineral Fuels, Lubricants, etc.
4 Minyak dan Lemak Binatang dan Sayur-sayuran 380.1 263.2 493.5 1,040.6 1,056.3Animal and Vegetable Oils and Fats
5 Bahan Kimia 13,759.2 13,336.4 15,379.0 16,275.1 18,790.3Chemicals
6 Barang-barang Keluaran Kilang 26,956.6 26,467.0 28,729.0 25,059.0 28,467.3Manufactured Goods
7 Jentera dan Kelengkapan Pengangkutan 116,722.1 118,527.0 132,930.2 143,825.0 153,917.4Machinery and Transport Equipment
8 Pelbagai Barang Keluaran Kilang 9,508.4 9,508.8 11,615.7 11,884.6 12,872.7Miscellaneous Manufactured Articles
9 Pelbagai Urus Niaga dan Barangan 9,573.2 9,396.5 9,133.4 6,214.0 8,050.4Miscellaneous Transactions and Commodities
Jumlah 194,344.5 197,279.8 220,935.5 228,124.5 248,476.8Total
78

JADUAL 3.2 : PERANGKAAN UTAMA PERDAGANGAN LUAR NEGERI, EKSPORT & IMPORT MENGIKUT SEKSYENBARANGAN, 1967 – 2014, MALAYSIA (samb.)
Table 3.2 : Principal Statistics of External Trade, Exports & Imports by Commodity Section, 1967 – 2014, Malaysia (cont’d)
RM (Juta/ Million)EksportExports
2000 2001 2002 2003 2004 2005 2006 2007
6,470.3 6,581.3 7,477.0 8,424.0 10,026.4 10,754.9 11,481.5 13,850.5
1,214.9 1,307.7 1,294.6 1,492.2 1,642.8 1,710.6 1,929.7 2,203.9
10,288.3 7,564.8 8,418.1 10,152.9 12,599.6 14,096.1 16,949.0 16,251.3
35,902.5 32,288.3 30,645.3 40,231.6 55,817.5 71,886.3 80,653.4 86,986.7
12,936.9 12,342.5 17,925.6 24,226.2 26,535.7 24,692.8 27,944.5 39,576.1
14,277.8 14,318.4 16,669.5 20,549.9 27,081.4 31,111.7 32,928.9 36,167.1
25,788.0 24,114.5 24,844.9 27,918.5 37,069.4 39,097.7 47,935.6 52,658.3
233,378.9 202,827.8 215,292.0 226,077.6 262,488.3 289,566.6 309,343.4 295,906.0
29,925.1 29,171.4 30,452.8 33,637.0 41,356.4 45,233.9 49,933.5 51,937.7
3,087.6 3,767.1 4,410.2 5,111.6 6,635.6 8,083.0 10,140.9 8,761.9
373,270.3 334,283.8 357,430.0 397,884.4 481,253.0 536,233.7 589,240.3 604,299.6
ImportImports
2000 2001 2002 2003 2004 2005 2006 2007
11,393.1 12,277.0 12,439.4 12,727.6 16,482.1 17,780.2 19,967.9 23,415.9
708.7 924.0 1,137.3 1,142.5 1,390.8 1,463.3 1,539.2 1,704.4
7,095.7 6,890.9 6,821.7 7,380.3 10,475.8 10,496.3 12,826.7 16,412.5
14,973.1 14,705.9 14,368.3 17,519.5 25,118.3 34,938.2 41,545.6 44,248.1
604.0 793.3 1,265.7 1,358.7 2,911.0 2,094.6 2,692.8 3,160.2
22,371.5 20,703.5 21,761.3 22,764.0 31,785.9 33,895.6 36,813.2 40,796.3
32,596.4 29,297.4 30,319.3 30,480.0 43,317.2 47,964.0 55,615.4 63,508.0
195,728.0 169,609.0 187,969.2 195,328.5 232,491.3 248,767.5 266,663.0 267,349.7
17,658.9 15,730.3 17,186.8 18,127.5 23,745.9 22,601.5 26,216.1 24,696.6
8,329.5 9,297.9 9,821.4 9,709.2 11,913.9 12,869.7 14,232.1 16,753.0
311,458.9 280,229.1 303,090.5 316,537.9 399,632.2 432,870.8 478,147.9 502,044.6
79

80
JADUAL 3.2 : PERANGKAAN UTAMA PERDAGANGAN LUAR NEGERI, EKSPORT & IMPORT MENGIKUT SEKSYEN
Table 3.2 : Principal Statistics of External Trade, Exports & Imports by Commodity Section, 1967 – 2014, Malaysia (cont'd)RM (Juta/ Million)
EksportSeksyen Barangan ExportsCommodity Sections 2008 2009 2010 2011 2012
0 Makanan 17,815.7 15,791.0 18,168.0 20,555.2 20,691.9Food
1 Minuman dan Tembakau 2,431.4 2,476.6 2,815.1 3,136.4 3,725.9Beverages and Tobacco
2 Bahan-bahan Mentah, Tidak Boleh Dimakan 17,694.4 13,157.1 19,128.8 25,026.5 20,609.7Crude Materials, Inedible
3 Bahan Api Galian, Pelicin, dan Lain-lain 121,651.9 79,508.1 101,958.4 125,752.3 143,388.1Mineral Fuels, Lubricants, etc.
4 Minyak dan Lemak Binatang dan Sayur-sayuran 56,833.1 43,641.0 54,139.4 73,118.6 63,393.7Animal and Vegetable Oils and Fats
5 Bahan Kimia 39,486.1 33,263.4 40,618.3 46,210.7 46,101.6Chemicals
6 Barang-barang Keluaran Kilang 59,150.8 49,356.4 56,391.2 65,399.6 63,624.0Manufactured Goods
7 Jentera dan Kelengkapan Pengangkutan 286,099.3 258,628.0 280,416.0 269,762.8 266,684.8Machinery and Transport Equipment
8 Pelbagai Barang Keluaran Kilang 55,846.1 52,202.2 60,406.7 64,707.3 68,704.4Miscellaneous Manufactured Articles
9 Pelbagai Urus Niaga dan Barangan 5,968.5 4,494.2 3,780.6 4,192.6 5,717.3Miscellaneous Transactions and Commodities
Jumlah 663,013.5 552,518.1 638,822.5 697,861.9 702,641.2Total
BARANGAN, 1967 – 2014, MALAYSIA (samb.)
ImportSeksyen Barangan ImportsCommodity Sections
2008 2009 2010
0 Makanan 27,969.3 26,732.1 30,252.8Food
1 Minuman dan Tembakau 2,115.3 2,097.0 2,355.2Beverages and Tobacco
2 Bahan-bahan Mentah, Tidak Boleh Dimakan 18,641.8 14,881.2 19,444.3Crude Materials, Inedible
3 Bahan Api Galian, Pelicin, dan Lain-lain 56,804.3 35,688.2 52,690.6Mineral Fuels, Lubricants, etc.
4 Minyak dan Lemak Binatang dan Sayur-sayuran 5,219.0 4,977.6 7,208.7Animal and Vegetable Oils and Fats
5 Bahan Kimia 45,621.6 39,405.6 47,860.0Chemicals
6 Barang-barang Keluaran Kilang 67,154.9 52,801.2 65,553.2Manufactured Goods
7 Jentera dan Kelengkapan Pengangkutan 254,283.0 222,364.1 261,591.1Machinery and Transport Equipment
8 Pelbagai Barang Keluaran Kilang 28,628.9 25,817.6 32,075.2Miscellaneous Manufactured Articles
9 Pelbagai Urus Niaga dan Barangan 13,366.3 9,905.1 9,797.2Miscellaneous Transactions and Commodities
Jumlah 519,804.3 434,669.8 528,828.2Total
2011
34,492.5
3,096.5
24,758.5
67,635.0
11,513.7
53,902.2
75,038.9
255,279.7
36,012.0
11,897.3
573,626.3
2012
36,090.5
3,780.1
24,886.9
86,047.0
9,748.7
54,547.5
75,196.5
266,469.9
37,414.2
12,495.8
606,676.9

81
JADUAL 3.2 : PERANGKAAN UTAMA PERDAGANGAN LUAR NEGERI, EKSPORT & IMPORT MENGIKUT SEKSYEN
Table 3.2 : Principal Statistics of External Trade, Exports & Imports by Commodity Section, 1967 – 2014, Malaysia (cont'd)RM (Juta/ Million)
EksportSeksyen Barangan ExportsCommodity Sections 2013 2014
0 Makanan 22,100.5 25,646.7Food
1 Minuman dan Tembakau 3,883.9 4,079.4Beverages and Tobacco
2 Bahan-bahan Mentah, Tidak Boleh Dimakan 19,491.6 17,164.3Crude Materials, Inedible
3 Bahan Api Galian, Pelicin, dan Lain-lain 160,347.7 168,624.1Mineral Fuels, Lubricants, etc.
4 Minyak dan Lemak Binatang dan Sayur-sayuran 49,019.2 50,490.6Animal and Vegetable Oils and Fats
5 Bahan Kimia 51,761.4 56,574.6Chemicals
6 Barang-barang Keluaran Kilang 67,700.5 67,819.0Manufactured Goods
7 Jentera dan Kelengkapan Pengangkutan 273,675.9 296,735.4Machinery and Transport Equipment
8 Pelbagai Barang Keluaran Kilang 67,318.7 73,716.9Miscellaneous Manufactured Articles
9 Pelbagai Urus Niaga dan Barangan 4,693.0 4,566.0Miscellaneous Transactions and Commodities
Jumlah 719,992.4 765,416.9Total
BARANGAN, 1967 – 2014, MALAYSIA (samb.)
ImportSeksyen Barangan ImportsCommodity Sections
2013 2014
0 Makanan 38,857.4 42,642.6Food
1 Minuman dan Tembakau 4,069.3 4,049.3Beverages and Tobacco
2 Bahan-bahan Mentah, Tidak Boleh Dimakan 23,888.2 21,991.6Crude Materials, Inedible
3 Bahan Api Galian, Pelicin, dan Lain-lain 105,022.4 114,876.5Mineral Fuels, Lubricants, etc.
4 Minyak dan Lemak Binatang dan Sayur-sayuran 4,117.1 4,521.1Animal and Vegetable Oils and Fats
5 Bahan Kimia 59,415.6 65,992.5Chemicals
6 Barang-barang Keluaran Kilang 85,373.8 87,418.9Manufactured Goods
7 Jentera dan Kelengkapan Pengangkutan 276,278.0 285,547.6Machinery and Transport Equipment
8 Pelbagai Barang Keluaran Kilang 37,085.9 41,774.0Miscellaneous Manufactured Articles
9 Pelbagai Urus Niaga dan Barangan 14,587.2 14,123.0Miscellaneous Transactions and Commodities
Jumlah 648,694.9 682,937.1Total


INDEKSINDEXES


INDEKS HARGA PENGGUNACONSUMER PRICE INDEX


87
INDEKS HARGA PENGGUNA
Nota Keterangan
1. Indeks Harga Pengguna (IHP) mengukurperubahan peratus kos pembelianmengikut masa bagi bakul tetapbarangan dan perkhidmatan yangmewakili corak purata pembelian olehsekumpulan penduduk pada sesuatutempoh masa yang ditetapkan. IHP dikiraberdasarkan standard dan prosedur yangditerima pakai di peringkat antarabangsa;menggunakan formula Laspeyres.
2. IHP Malaysia mula diterbitkan padaFebruari 1987 dengan menggunakantahun asas 1980 = 100.
3. Sebelum tahun 2006, item dalam bakulbarangan dan perkhidmatan IHPdikelaskan berpandukan kepadaClassification of Household Goods andServices (CHGS) dengan sembilankumpulan utama seperti berikut:
Makanan
Minuman dan Tembakau
Pakaian dan Kasut
Sewa Kasar, Bahan Api & Kuasa
Perabot, Hiasan Dalaman &Peralatan dan Pengendalian Rumah
Perbelanjaan Rawatan Perubatandan Kesihatan
Pengangkutan dan Perhubungan
Perkhidmatan Rekreasi, Hiburan,Pelajaran dan Kebudayaan
Pelbagai Barang dan Perkhidmatan
CONSUMER PRICE INDEX
Explanatory Notes
1. The Consumer Price Index (CPI)measures the percentage changethrough time in the cost of purchasing aconstant basket of goods and servicesrepresenting the average pattern ofpurchases made by a particularpopulation group in a specified timeperiod. CPI is calculated based on theinternational standard and procedures;known as the Laspeyres formula.
2. The CPI for Malaysia was first released inthe February 1987 publication with1980 = 100 as the base year.
3. Prior to 2006, the items in this basket ofgoods and services were classifiedaccording to Classification of HouseholdGoods & Services (CHGS) with ninemain groups as follows:
Food
Beverages and Tobacco
Clothing and Footwear
Gross Rent, Fuel & Power
Furniture, Furnishing & HouseholdEquipment and Operation
Medical Care and Health Expenses
Transport and Communication
Recreation, Entertainment, Education
and Cultural Services
Miscellaneous Goods and Services

88
4. Bermula pada Januari 2006, itemdike laskan berpandu kepadaClassification of Individual ConsumptionAccording to Purpose (COICOP)dengan dua belas kumpulan utamaseperti berikut:
Makanan dan Minuman BukanBeralkohol
Minuman Beralkohol dan Tembakau
Pakaian dan Kasut
Perumahan, Air, Elektrik, Gas dan
Bahan Api Lain
H i a s a n , P e r k a k a s a n d a nPenyelenggaraan Isi Rumah
Kesihatan
Pengangkutan
Komunikasi
Perkhidmatan Rekreasi danKebudayaan
Pendidikan
Restoran dan Hotel
Pelbagai Barang dan Perkhidmatan
4. Commencing from January 2006, theitems are classified based onClassification of Individual ConsumptionAccording to Purpose (COICOP), bytwelve main groups as follows:
Food and Non-Alcoholic Beverages
Alcoholic Beverages and Tobacco
Clothing and Footwear
Housing, Water, Electricity, Gas andOther Fuels
Furnishing, Household Equipment andRoutine Household Maintenance
Health
Transport
Communication
Recreation Services and Culture
Education
Restaurants and Hotels
Miscellaneous Goods and Services
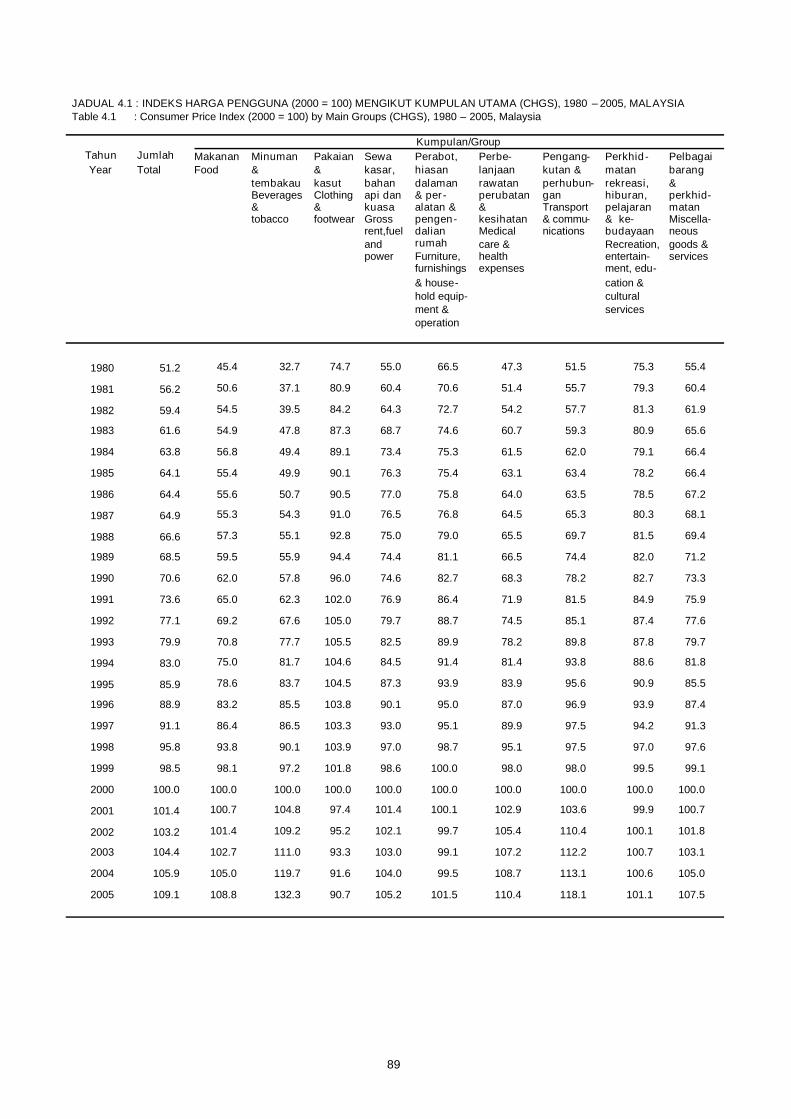
Table 4.1 : Consumer Price Index (2000 = 100) by Main Groups (CHGS), 1980 – 2005, Malaysia
Kumpulan/GroupTahun Jumlah Makanan Minuman Pakaian Sewa Perabot, Perbe- Pengang- Perkhid- PelbagaiYear Total Food & & kasar, hiasan lanjaan kutan & matan barang
tembakau kasut bahan dalaman rawatan perhubun- rekreasi, &Beverages Clothing api dan & per- perubatan gan hiburan, perkhid-& & kuasa alatan & & Transport pelajaran matantobacco footwear Gross pengen- kesihatan & commu- & ke- Miscella-
rent,fuel dalian Medical nications budayaan neousand rumah care & Recreation, goods &power Furniture, health entertain- services
furnishings expenses ment, edu-& house- cation &hold equip- culturalment & servicesoperation
1980 51.2 45.4 32.7 74.7 55.0 66.5 47.3 51.5 75.3 55.4
1981 56.2 50.6 37.1 80.9 60.4 70.6 51.4 55.7 79.3 60.4
1982 59.4 54.5 39.5 84.2 64.3 72.7 54.2 57.7 81.3 61.9
1983 61.6 54.9 47.8 87.3 68.7 74.6 60.7 59.3 80.9 65.6
1984 63.8 56.8 49.4 89.1 73.4 75.3 61.5 62.0 79.1 66.4
1985 64.1 55.4 49.9 90.1 76.3 75.4 63.1 63.4 78.2 66.4
1986 64.4 55.6 50.7 90.5 77.0 75.8 64.0 63.5 78.5 67.2
1987 64.9 55.3 54.3 91.0 76.5 76.8 64.5 65.3 80.3 68.1
1988 66.6 57.3 55.1 92.8 75.0 79.0 65.5 69.7 81.5 69.4
1989 68.5 59.5 55.9 94.4 74.4 81.1 66.5 74.4 82.0 71.2
1990 70.6 62.0 57.8 96.0 74.6 82.7 68.3 78.2 82.7 73.3
1991 73.6 65.0 62.3 102.0 76.9 86.4 71.9 81.5 84.9 75.9
1992 77.1 69.2 67.6 105.0 79.7 88.7 74.5 85.1 87.4 77.6
1993 79.9 70.8 77.7 105.5 82.5 89.9 78.2 89.8 87.8 79.7
1994 83.0 75.0 81.7 104.6 84.5 91.4 81.4 93.8 88.6 81.8
1995 85.9 78.6 83.7 104.5 87.3 93.9 83.9 95.6 90.9 85.5
1996 88.9 83.2 85.5 103.8 90.1 95.0 87.0 96.9 93.9 87.4
1997 91.1 86.4 86.5 103.3 93.0 95.1 89.9 97.5 94.2 91.3
1998 95.8 93.8 90.1 103.9 97.0 98.7 95.1 97.5 97.0 97.6
1999 98.5 98.1 97.2 101.8 98.6 100.0 98.0 98.0 99.5 99.1
2000 100.0 100.0 100.0 100.0 100.0 100.0 100.0 100.0 100.0 100.0
2001 101.4 100.7 104.8 97.4 101.4 100.1 102.9 103.6 99.9 100.7
2002 103.2 101.4 109.2 95.2 102.1 99.7 105.4 110.4 100.1 101.8
2003 104.4 102.7 111.0 93.3 103.0 99.1 107.2 112.2 100.7 103.1
2004 105.9 105.0 119.7 91.6 104.0 99.5 108.7 113.1 100.6 105.0
2005 109.1 108.8 132.3 90.7 105.2 101.5 110.4 118.1 101.1 107.5
JADUAL 4.1 : INDEKS HARGA PENGGUNA (2000 = 100) MENGIKUT KUMPULAN UTAMA (CHGS), 1980 – 2005, MALAYSIA
89

JADUAL 4.2 : INDEKS HARGA PENGGUNA (2010 = 100) MENGIKUT KUMPULAN UTAMA (COICOP), 2003 – 2014, MALAYSIATable 4.2 : Consumer Price Index (2010 = 100) by Main Groups (COICOP), 2003 – 2014, Malaysia
Kumpulan/GroupTahun Jumlah Makan- Minum- Pakai- Perumah- Hiasan, Kesihat- Pengang- Komuni- Perkhid- Pendidi- Resto- PelbagaiYear Total an dan an an & an, air, perkakas- an kutan kasi matan kan ran dan barang
minum- alkohol kasut elektrik, an dan Health Transport Commu- rekreasi, Educationhotel &an & temba- Clothing gas dan penyeleng- nication dan ke- Restau- perkhid-bukan kau & bahan garaan budayaan rant and matanalkohol Alcoholic foot- api lain isi rumah Recrea- hotel Miscella-Food & bevera- wear Housing Furnishings, tion, neousnon- ges water, household services goods &alcoholic & tobacco electricity, equipment & culture servicesbevera- gas and and routineges other fuels household
mainte-nance
2003 83.9 76.4 58.0 108.8 91.4 90.0 88.1 82.1 103.3 94.0 88.0 79.0 85.7
2004 85.2 78.0 64.4 106.8 92.3 90.4 89.3 82.7 104.1 93.2 89.2 80.4 86.9
2005 87.7 80.9 73.4 105.7 93.4 91.6 90.8 87.9 104.1 93.3 90.8 83.2 88.0
2006 90.9 83.6 78.5 104.3 94.8 92.6 92.8 97.5 102.6 93.9 92.3 86.3 90.0
2007 92.7 86.2 84.5 102.9 96.0 93.6 94.2 99.8 101.3 95.2 93.9 89.5 90.8
2008 97.7 93.8 90.7 102.3 97.5 96.4 96.3 108.6 100.7 97.0 96.1 95.3 93.8
2009 98.3 97.6 96.2 101.3 98.9 99.3 98.4 98.4 100.2 98.4 98.4 98.1 97.3
2010 100.0 100.0 100.0 100.0 100.0 100.0 100.0 100.0 100.0 100.0 100.0 100.0 100.0
2011 103.2 104.8 104.6 99.8 101.8 101.8 102.7 104.4 99.7 102.0 102.2 105.9 102.4
2012 104.9 107.6 105.0 99.2 103.4 103.8 104.8 105.1 99.1 103.2 104.7 109.0 104.4
2013 107.1 111.5 111.3 98.6 105.2 105.4 106.8 107.2 98.4 103.3 107.2 111.7 104.7
2014 110.5 115.2 124.2 98.4 108.8 106.5 109.9 112.4 97.7 104.9 109.8 116.9 105.4
90

INDEKS HARGA PENGELUARDAN
INDEKS HARGA IMPORT &EKSPORT
PRODUCER PRICE INDEXAND
IMPORT & EXPORT PRICE INDICES


93
A) INDEKS HARGA PENGELUAR
Nota Keterangan
1. Indeks Harga Pengeluar (IHPR) bagipengeluaran tempatan mengukur purataperubahan harga yang dikenakan olehpengeluar barangan dalam sesuatuindustri pada bulan rujukan berbandingtempoh asas. Oleh itu, ia merupakanpenunjuk ekonomi makro yangdigunakan bagi memantau pergerakanharga output tempatan dan sering dilihatsebagai penunjuk awal kepada IndeksHarga Pengguna.
2. IHPR yang pertama telah disusun bagiSemenanjung Malaysia untuk tahunrujukan 1973 menggunakan tahun asas1972. Sejak itu, ia telah melalui beberapasiri pembangunan yang bukan sahajatelah memperbaiki metodologi yangd ig unak an te tap i j ug a te lahmenjadikannya sebagai salah satudaripada penunjuk ekonomi utamanegara. Selepas tahun asas 1972, IHPRtelah dikira bagi tahun asas 1978, 1989,2000, 2005 dan kini disusunmenggunakan 2010 sebagai tahun asas.
3. Indeks Harga Ekonomi Domestik ialahindeks komposit berdasarkan data hargayang diperoleh daripada indeks hargapengeluaran tempatan dan import.Indeks ekonomi domestik diwakili oleh66.7 peratus wajaran dari pengeluarantempatan dan 33.3 peratus wajaran dariimport.
4. IHPR meliputi lima sektor ekonomi, iaituPertanian, Perhutanan & Perikanan,Perlombongan, Pembuatan, Bekalanelektrik & gas dan Bekalan air.
A) PRODUCER PRICE INDEX
Explanatory Notes
1. The Producer Price Index (PPI) for localproduction measures the averagechange in the prices charged byproducers of goods of an industry in areference month compared with the baseperiod. Thus, it is an importantmacroeconomic indicator used formonitoring the price movements of localoutputs and is often viewed as a leadingindicator of Consumer Price Index.
2. The first PPI was compiled for PeninsularMalaysia for the reference year 1973 with1972 as its base year. Since then, it hasundergone a series of developmentwhich has not only improved themethodology but also placed itself as oneof the leading economic indicators in thecountry. Subsequent to 1972 base year,the PPI was constructed for base years1978, 1989, 2000, 2005 and is currentlycompiled using 2010 as the base year.
3. The Domestic Economy Price Index is acomposite index which is based on theprice data derived from that of the localproduction and import price indices. Thedomestic economy index is representedby 66.7 per cent weights from localproduction and 33.3 per cent weightsfrom imports.
4. PPI covers the following five sectors ofthe economy, namely Agriculture,Fo res t r y & F ish ing , Min ing ,Manufacturing, Electricity & gas andWater supply.

5. Mulai tahun asas 2005, harga pengeluarbagi pengeluaran tempatan menggunakanbasic price. Walau bagaimanapun, bagitahun asas 1972, 1978, 1989 dan 2000,duti eksais dan cukai jualan dimasukkansebagai komponen dalam hargapengeluar.
6. Pemilihan pertubuhan adalah berdasarkansumbangan pertubuhan tersebut kepadajumlah output bagi industri yang telahterpilih. Pertubuhan yang terpilih mewakiliproduk masing-masing. Pertubuhan inisecara kolektif menyumbang sekurang-kurangnya 85 peratus daripada jumlahoutput produk yang terpilih. Senaraipertubuhan yang terlibat dalampengeluaran tempatan diambil daripadaBanci Ekonomi 2010 dan sumber-sumbertambahan. Sampel tersebut meliputi 1,165pertubuhan yang dipilih secara ‘cut-off’daripada rangka penyiasatan pembuatanbulanan dan tahunan.
5. Starting from base year 2005, the producerprice for local production has been usingbasic price. However, for base years 1972,1978, 1989 and 2000, excise duties andsales tax were included as components ofthe producer price.
6. The selection of establishments is based ontheir contributions to the total output of theselected industry. The selectedestablishments are representative of theirproducts. These establishments collectivelyaccounted for at least 85 per cent of thetotal output of the products selected. Thelists of establishments are drawn from theEconomic Census, 2010 as well as fromother supplementary sources. The samplecovers 1,165 establishments selected on acut-off basis from the monthly and annualmanufacturing frames.
94

B) INDEKS HARGA IMPORT & EKSPORT
Nota Keterangan
1. Indeks harga import mengukur perubahanharga yang dibayar oleh pengimport bagibarangan yang diimport ke Malaysia bagisesuatu tempoh masa. Ia adalah indeksberasaskan input yang mengukur perubahanharga bahan mentah dan baranganperantaraan yang diimport oleh pengeluartempatan bagi produk siap.
2. Indeks harga eksport mengukur perubahanharga yang diterima oleh pengeksport bagibarangan yang dieksport ke luar Malaysia.
3. Indeks Harga Import dan Eksport meliputikomoditi yang dikelas berdasarkan StandardInternational Trade Classification, Revision 4(SITC 4) oleh Pertubuhan Bangsa-BangsaBersatu merangkumi seksyen komoditiberikut:
0 - Makanan1 - Minuman dan tembakau2 - Bahan-bahan mentah tidak boleh
dimakan3 - Bahan api galian, pelincir, dll4 - Minyak dan lemak binatang dan
sayur-sayuran5 - Bahan kimia6 - Barang-barang keluaran kilang7 - Jentera dan kelengkapan pengangkutan8 - Pelbagai barang keluaran kilang9 - Pelbagai urus niaga dan barangan
B) IMPORT & EXPORT PRICE INDICES
Explanatory Notes
1. The import price index measures thechanges over time in the price paid byimporters for goods imported intoMalaysia. It is an input-based index whichmeasures the change in the price of rawmaterials and intermediate goods importedby local producers for the production oftheir final products.
2. The export price index measures thechanges over time in the prices of goodsreceived by exporters for goods exportedoutside Malaysia.
3. The Import and Export Price Indices covercommodities which are classified based onthe Standard International TradeClassification, Revision 4 (SITC 4) byUnited Nations comprising the followingcommodity sections:
0 - Food1 - Beverages and tobacco2 - Crude materials, inedible3 - Mineral fuels, lubricants, etc.4 - Animal and vegetable oils and fats5 - Chemicals6 - Manufactured goods7 - Machinery and transport equipment8 - Miscellaneous manufactured articles9 - Miscellaneous transactions and
commodities
95

4. Sejumlah 3,274 spesifikasi item telahdipilih untuk mewakili 1,107 item komoditi(SITC 9 digit) dalam penyusunan indeksharga import manakala 2,467 spesifikasiitem telah dipilih digunakan untukpenyusunan indeks harga eksport yangmewakili 725 item komoditi (SITC 9 digit).
4. A total of 3,274 item specifications areselected to represent 1,107 commodityitems (9 digit SITC) in the compilation ofthe import price index while 2,467 itemspecifications are used in the compilationof the export price index which represent725 commodity items (9 digit SITC).
96

97
JADUAL 5.1 : INDEKS HARGA PENGELUAR (2010=100) BAGI BARANGAN DALAM EKONOMI DOMESTIK MENGIKUTSEKSYEN BARANGAN (SITC 4), 1978 – 2014, MALAYSIA
Table 5.1 : Producer Price Index (2010=100) for Goods in the Domestic Economy by Commodity Sections (SITC 4),1978 – 2014, Malaysia
Seksyen/SectionTahun Jumlah Makanan Minuman Bahan- Bahan api Minyak Bahan Barang- Jentera & Pelbagai PelbagaiYear Total Food & bahan galian, & lemak kimia barang keleng- barang urus niaga
tembakau mentah pelincir, binatang Chemicals keluaran kapan keluaran &Beverages tidak dll. & sayur- kilang pengang- kilang barangan& boleh Mineral sayuran Manu- kutan Miscella- Miscella-tobacco dimakan fuels, Animal factured Machinery neous neous
Crude lubricants, & vege- goods & transport manu- transactionsmaterials, etc. table oils equipment factured &inedible & fats articles commodities
1978 39.7 32.1 30.8 31.0 19.7 40.1 44.1 47.8 60.4 48.8 36.0
1979 44.3 32.6 31.5 37.4 23.7 46.2 49.5 52.6 63.9 52.5 46.9
1980 48.6 35.0 33.3 40.6 30.2 37.8 55.8 58.2 69.0 56.5 63.0
1981 50.4 38.1 38.4 36.9 35.3 36.8 58.7 59.9 71.1 60.5 74.6
1982 49.2 38.1 40.6 34.2 34.8 31.1 56.8 59.3 71.1 61.0 74.1
1983 50.3 38.1 48.4 37.3 33.6 36.1 55.9 58.8 72.0 61.3 69.1
1984 52.0 39.9 50.4 37.8 33.2 55.4 56.0 58.5 72.8 62.2 73.1
1985 50.9 41.3 51.0 35.3 33.0 41.7 56.3 58.9 73.1 62.6 72.0
1986 47.8 43.3 51.8 33.6 27.3 23.7 56.3 53.9 73.1 64.1 57.5
1987 49.5 46.1 54.5 35.4 26.8 29.5 57.5 54.6 75.1 65.8 53.7
1988 53.2 49.5 54.8 41.2 25.9 39.5 60.2 58.3 77.8 68.3 55.9
1989 55.2 52.6 56.3 41.8 27.5 35.5 63.0 63.0 79.7 71.2 59.0
1990 55.6 52.9 56.9 44.9 28.8 28.7 62.3 63.4 79.2 73.0 59.7
1991 55.7 53.1 61.9 41.7 28.7 33.0 64.4 63.4 79.6 76.5 62.1
1992 57.6 54.3 68.5 43.1 29.0 37.1 66.7 67.9 79.8 76.9 63.0
1993 58.0 55.2 73.8 43.1 28.8 36.2 67.1 68.7 81.7 77.2 65.7
1994 60.3 58.3 75.3 47.4 27.5 43.2 67.4 70.9 82.0 81.3 66.8
1995 62.7 59.7 77.0 50.7 27.5 54.4 68.8 70.8 80.5 83.1 66.5
1996 64.1 63.0 77.4 49.9 30.9 51.2 69.6 71.4 80.9 86.0 66.7
1997 65.8 64.5 77.4 47.5 33.0 57.8 70.4 71.4 83.6 84.9 66.4
1998 73.0 70.0 78.6 48.9 32.2 94.7 73.7 76.3 88.6 89.5 67.7
1999 70.5 68.3 86.7 47.6 36.8 66.9 74.8 75.6 88.1 90.8 67.2
2000 72.7 68.6 87.0 48.2 49.2 45.5 75.6 76.3 88.0 91.6 67.4
2001 72.9 69.1 88.1 44.4 45.5 37.9 73.3 74.7 92.2 91.8 65.5
2002 72.4 68.7 88.2 49.5 44.5 48.7 73.8 73.1 89.8 89.2 69.8
2003 75.8 69.2 88.8 56.1 51.0 58.7 78.7 75.7 90.9 91.5 75.6
2004 80.5 73.9 90.6 61.8 61.2 64.0 86.7 83.4 92.5 93.4 79.5
2005 85.3 77.6 92.9 63.5 77.2 63.9 92.3 88.2 94.5 93.7 80.7
2006 87.9 79.8 96.7 71.3 83.9 62.6 95.0 90.2 95.1 95.0 83.8
2007 92.8 86.6 97.5 87.0 87.0 89.5 97.9 92.6 96.8 96.3 87.3
2008 102.2 97.3 98.9 95.7 116.0 108.7 105.0 98.9 97.4 98.0 96.6
2009 94.7 97.5 100.6 81.7 89.2 85.1 97.0 98.2 98.9 99.4 89.6
2010 100.0 100.0 100.0 100.0 100.0 100.0 100.0 100.0 100.0 100.0 100.0
2011 109.6 109.4 104.6 119.5 122.4 122.5 108.9 103.6 100.7 102.7 107.3
2012 109.7 109.7 105.3 104.3 129.4 110.2 108.4 103.1 102.6 103.5 110.7
2013 107.8 111.3 106.7 91.0 128.6 93.5 109.3 102.5 103.5 104.0 105.3
2014 109.3 116.2 109.7 89.1 129.0 100.5 111.7 103.0 104.8 104.8 102.7

98
JADUAL 5.2 : INDEKS HARGA PENGELUAR (2010=100) BAGI PENGELUARAN TEMPATAN MENGIKUT SEKSYENBARANGAN (SITC 4), 1978 – 2014, MALAYSIA
Table 5.2 : Producer Price Index (2010=100) for Local Production by Commodity Sections (SITC 4), 1978 – 2014, Malaysia
Seksyen/SectionsTahun Jumlah Makanan Minuman Bahan- Bahan api Minyak Bahan Barang- Jentera & PelbagaiYear Total Food & bahan galian, & lemak kimia barang keleng- barang
tembakau mentah pelincir, binatang Chemicals keluaran kapan keluaranBeverages tidak dll. & sayur- kilang pengang- kilang& boleh Mineral sayuran Manu- kutan Miscella-tobacco dimakan fuels, Animal factured Machinery neous
Crude lubricants, & vege- goods & transport manu-materials, etc. table oils equipment facturedinedible & fats articles
1978 37.9 30.6 30.9 29.3 20.3 40.1 44.8 50.2 65.4 44.1
1979 42.6 31.4 31.5 35.6 23.9 46.2 49.3 55.4 66.7 47.9
1980 46.3 33.4 33.7 38.6 28.8 37.8 54.5 61.2 75.4 51.4
1981 47.3 36.2 39.2 34.9 33.6 36.7 56.9 61.9 75.2 55.3
1982 46.0 37.5 42.0 32.2 33.1 31.0 54.5 60.9 75.6 56.9
1983 47.7 37.6 49.0 35.3 32.4 36.0 55.1 61.3 76.7 58.5
1984 50.0 39.6 50.3 35.8 32.5 55.5 55.4 60.3 79.0 60.1
1985 48.4 41.6 51.1 33.2 32.0 41.7 55.2 60.8 78.4 60.6
1986 44.3 44.1 51.8 31.8 25.0 23.6 54.5 53.0 76.4 61.8
1987 46.4 47.4 53.9 33.6 24.9 29.3 55.3 53.3 79.7 63.4
1988 50.4 50.7 53.1 39.4 24.0 39.4 58.3 56.0 83.9 66.0
1989 52.3 53.2 54.5 39.7 26.4 35.4 60.5 60.7 87.8 69.0
1990 52.7 53.8 54.7 42.9 27.4 28.4 60.7 61.1 87.3 70.7
1991 52.7 54.2 59.4 39.7 27.3 32.7 62.7 61.0 86.4 74.7
1992 54.9 55.4 66.2 41.1 27.5 36.8 65.4 65.9 89.8 74.7
1993 55.1 55.9 71.8 41.1 27.2 36.0 65.4 66.6 92.8 74.3
1994 57.9 59.9 73.2 45.2 25.7 43.0 64.9 69.5 93.9 78.5
1995 60.6 61.0 75.0 48.4 25.6 54.4 65.7 68.7 92.9 80.4
1996 62.3 64.6 75.4 47.7 29.4 51.2 65.8 69.4 95.1 83.7
1997 63.9 66.3 75.3 45.2 31.6 57.9 66.9 69.5 96.9 82.7
1998 71.1 71.1 76.6 46.5 30.7 95.3 69.4 74.1 97.0 87.2
1999 68.3 69.3 85.1 45.3 35.7 67.1 70.9 73.5 96.6 88.6
2000 70.8 69.6 85.5 45.9 49.3 45.4 71.9 74.3 95.6 89.3
2001 69.5 70.0 87.3 41.8 45.3 37.6 68.5 72.7 98.2 90.8
2002 69.3 70.1 87.3 47.3 44.5 48.6 69.9 70.9 94.4 87.8
2003 72.5 69.9 88.2 53.8 51.0 58.6 75.1 73.6 93.5 90.6
2004 77.1 74.2 90.1 59.4 61.3 64.0 84.2 81.5 92.7 92.3
2005 82.7 78.6 92.5 60.9 76.2 63.9 91.6 85.6 96.4 92.0
2006 85.9 80.8 96.7 69.0 83.0 62.7 94.4 87.6 97.2 93.4
2007 92.0 87.1 97.5 85.9 86.4 89.6 97.7 91.0 98.7 95.2
2008 104.1 98.4 98.9 95.2 117.4 108.6 107.6 99.5 98.4 97.4
2009 92.8 97.3 100.7 79.8 86.9 84.5 95.2 98.1 99.4 99.1
2010 100.0 100.0 100.0 100.0 100.0 100.0 100.0 100.0 100.0 100.0
2011 112.3 110.2 105.0 122.8 124.7 123.2 112.5 104.4 98.6 103.2
2012 111.8 110.5 105.9 104.9 131.9 110.4 111.2 103.7 101.2 103.6
2013 108.8 111.9 107.3 88.9 131.5 93.3 112.5 102.8 101.4 103.7
2014 110.4 116.9 110.6 86.7 131.9 100.6 115.9 103.5 102.5 104.1

99
JADUAL 5.3 : INDEKS HARGA IMPORT (2010=100) MENGIKUT SEKSYEN BARANGAN (SITC 4), 1978 – 2014, MALAYSIATable 5.3 : Import Price Index (2010=100) by Commodity Sections (SITC 4), 1978 – 2014, Malaysia
Seksyen/Section
Tahun Jumlah Makanan Minuman Bahan- Bahan api Minyak Bahan Barang- Jentera & Pelbagai PelbagaiYear Total Food & bahan galian, & lemak kimia barang keleng- barang urus niaga
tembakau mentah pelincir, binatang Chemicals keluaran kapan keluaran &Beverages tidak dll. & sayur- kilang pengang- kilang barangan& boleh Mineral sayuran Manu- kutan Miscella- Miscella-tobacco dimakan fuels, Animal factured Machinery neous neous
Crude lubricants, & vege- goods & transport manu- transactionsmaterials, etc. table oils equipment factured &inedible & fats articles commodities
1978 45.9 39.7 37.0 48.5 21.6 42.7 44.6 44.3 54.4 60.8 48.5
1979 50.0 38.8 38.1 50.9 27.8 44.1 50.9 50.5 58.9 64.4 50.3
1980 56.2 43.1 39.0 56.4 40.4 45.2 58.2 57.7 61.6 69.5 53.9
1981 60.8 47.5 43.6 57.8 47.6 45.5 61.6 61.1 64.9 74.2 55.9
1982 59.6 42.0 44.7 57.0 47.4 45.2 59.9 59.4 64.6 72.2 56.0
1983 58.8 41.1 56.4 56.5 43.7 44.7 57.9 57.5 65.5 69.8 56.9
1984 58.8 42.1 61.1 57.2 41.6 44.3 57.9 57.4 65.4 68.9 56.9
1985 59.2 41.2 61.2 58.3 42.6 45.0 58.5 58.1 66.1 69.3 57.0
1986 59.0 40.4 62.4 53.5 40.2 45.0 59.1 57.4 67.2 71.6 58.7
1987 59.7 41.2 67.6 50.8 38.3 45.3 60.5 59.2 68.4 73.4 61.3
1988 62.3 45.3 71.8 54.5 37.1 46.0 63.2 64.9 70.2 75.7 64.1
1989 65.2 50.8 73.8 60.6 38.6 50.6 66.4 70.0 70.9 78.7 65.7
1990 65.5 50.5 79.1 59.1 41.5 50.6 64.6 70.1 70.3 81.0 67.8
1991 66.6 49.7 87.0 59.7 42.7 54.0 66.8 70.2 71.9 81.0 65.5
1992 66.5 51.3 91.6 57.7 43.2 60.3 68.7 73.3 69.3 83.5 63.6
1993 67.6 53.4 91.4 56.6 43.7 58.0 69.6 74.7 70.2 88.2 62.2
1994 67.8 52.7 94.6 60.5 44.4 54.7 70.7 74.1 69.7 91.1 65.2
1995 68.2 55.7 94.7 62.1 44.7 54.7 73.1 76.7 67.8 92.7 64.4
1996 68.3 57.4 95.5 62.8 45.2 54.7 74.5 76.7 66.5 92.2 65.1
1997 70.2 58.1 97.2 63.8 47.0 54.6 75.1 76.5 70.0 91.2 64.0
1998 76.6 66.5 96.6 67.8 47.0 55.7 79.5 82.1 79.3 96.1 68.5
1999 76.2 65.8 98.3 66.7 46.4 55.6 80.1 81.5 78.8 96.2 66.6
2000 77.0 65.5 98.6 67.4 48.6 55.3 80.5 81.8 79.7 97.5 67.4
2001 80.1 66.7 95.4 65.5 46.7 59.8 79.4 80.0 85.6 94.3 65.5
2002 79.1 64.5 96.0 67.5 44.1 58.4 78.9 78.8 84.6 93.2 69.8
2003 82.7 67.2 95.3 75.0 50.5 62.5 83.7 81.3 88.0 94.0 75.6
2004 87.8 73.2 95.4 82.0 60.2 65.5 90.2 88.5 92.2 96.5 79.5
2005 90.7 75.0 97.2 85.6 82.6 61.8 93.8 94.9 92.4 98.3 80.7
2006 92.2 77.0 96.4 90.2 88.8 60.5 96.2 97.0 92.8 99.2 83.8
2007 94.4 85.3 98.2 95.2 90.5 87.6 98.2 97.1 94.6 99.2 87.3
2008 98.2 94.3 98.6 100.1 109.2 113.5 100.4 97.5 96.3 99.4 96.6
2009 98.7 98.2 98.9 97.6 102.0 101.1 100.5 98.6 98.2 100.2 89.6
2010 100.0 100.0 100.0 100.0 100.0 100.0 100.0 100.0 100.0 100.0 100.0
2011 104.1 107.8 102.0 104.9 111.6 111.6 101.8 101.9 102.8 101.8 107.3
2012 105.3 108.1 101.2 101.5 117.4 106.8 102.9 101.8 104.0 103.3 110.7
2013 105.8 110.1 102.1 100.5 114.7 97.4 103.1 102.1 105.6 104.7 105.3
2014 106.9 114.9 102.7 100.2 115.5 98.9 103.7 102.0 106.9 106.1 102.7

100
JADUAL 5.4 : INDEKS HARGA EKSPORT (2010=100) MENGIKUT SEKSYEN BARANGAN (SITC 4), 2005 – 2014, MALAYSIATable 5.4 : Export Price Index (2010=100) by Commodity Sections (SITC 4), 2005 – 2014, Malaysia
Seksyen/SectionTahun Jumlah Makanan Minuman Bahan- Bahan api Minyak Bahan Barang- Jentera & Pelbagai PelbagaiYear Total Food & bahan galian, & lemak kimia barang keleng- barang urus niaga
tembakau mentah pelincir, binatang Chemicals keluaran kapan keluaran &Beverages tidak dll. & sayur- kilang pengang- kilang barangan& boleh Mineral sayuran Manu- kutan Miscella- Miscella-tobacco dimakan fuels, Animal factured Machinery neous neous
Crude lubricants, & vege- goods & transport manu- transactionsmaterials, etc. table oils equipment factured &inedible & fats articles commodities
2005 88.1 79.5 91.2 72.0 74.8 51.9 95.4 86.7 100.5 88.9 47.4
2006 92.7 80.4 93.5 87.0 87.2 56.2 95.0 90.7 102.3 92.8 62.9
2007 95.4 88.8 96.7 88.8 91.5 88.5 96.1 92.8 99.3 95.6 68.0
2008 103.2 95.8 95.3 97.5 119.4 105.4 100.9 94.5 100.5 96.6 77.9
2009 94.5 93.9 98.9 77.6 80.5 81.2 96.1 94.0 102.4 98.6 86.5
2010 100.0 100.0 100.0 100.0 100.0 100.0 100.0 100.0 100.0 100.0 100.0
2011 107.9 107.9 101.9 120.2 116.5 122.2 114.3 107.0 101.3 104.2 119.5
2012 109.1 110.1 103.4 103.9 120.8 106.9 115.5 100.2 106.9 105.6 122.0
2013 108.0 112.2 103.0 97.1 120.0 88.1 113.7 97.5 109.3 106.5 117.5
2014 108.1 115.9 104.1 87.2 118.3 91.3 118.8 98.7 108.7 108.1 121.8

INDEKS PERDAGANGANLUAR NEGERI
EXTERNAL TRADE INDICES


103
INDEKS PERDAGANGAN LUAR NEGERI
Nota Keterangan
1. Indeks Perdagangan Luar NegeriIndeks perdagangan luar negeri mengukurperubahan paras nilai seunit serta volumeksport dan import Malaysia. Indeks inidisusun buat pertama kalinya denganmenggunakan tahun 1970 sebagai tahunasas diikuti dengan tahun 1999. Kini,indeks ini diasaskan semula kepada tahun2005.
Sebanyak 1,191 barangan eksport dan1,941 barangan import telah digunakandalam pengiraan indeks import dan eksportini. Indeks ini adalah berdasarkan konsepsatu bakul barangan yang tetap. Bagitahun asas semasa (2005=100), klasifikasibarangan adalah berdasarkan StandardInternational Trade Classification,Revision 3 (SITC 3). Wajaran yangdiguna pakai dalam pengiraan indeks iniadalah ni la i berdasarkan dataperdagangan tahun 2005.
2 . Indeks Nilai SeunitIndeks nilai seunit digunakan untukmengukur perubahan nilai seunit importdan eksport Malaysia. Nilai seunitdihasilkan daripada pembahagian nilaibarangan dengan kuantitinya yang diimportatau dieksport bagi sesuatu baranganterpilih. Indeks nilai seunit yang dihasilkandikira dengan menggunakan indeksLaspeyres.
EXTERNAL TRADE INDICES
Explanatory Notes
1. External Trade IndicesExternal trade indices measure changes inthe levels of unit values and volume ofMalaysia’s imports and exports. Theindices are first constructed with 1970 asthe base year followed by 1999. Currently,the indices are rebased to 2005.
Approximately 1,191 export items and1,941 import items are used in thecalculation of the index of imports andexports, respectively. The indices arebased on the concept of a fixed basket ofcommodities. For the current base year(2005=100), the commodities areclassified according to StandardInternational Trade Classification,Revision 3 (SITC 3). The weights used inthe index are based on 2005 trade data.
2. Unit Value IndicesUnit value indices measure the changes inlevels of unit values of imports and exportsof Malaysia. Unit value is derived bydividing the value of exports and importswith the export and import quantity for theselected commodities. The unit valueindices is calculated using Laspeyresindex.

3. Indeks VolumIndeks volum digunakan untuk mengukurperubahan kuantiti barangan yang diimportdan dieksport daripada Malaysia. Indeksvolum eksport dan import dihasilkan secaratidak langsung daripada pembahagianindeks nilai eksport dan import denganindeks nilai seunit yang berkaitan. Dalamkes ini, indeks volum eksport dan importyang disusun merupakan indeks volumPaasche.
4. Indeks Terma PerdaganganIndeks nilai seunit eksport dan import bolehdigunakan untuk mengukur termaperdagangan Malaysia. Indeks termaperdagangan dikira berasaskan kepadanisbah indeks nilai seunit eksport kepadaindeks nilai seunit import.
3. Volume IndicesVolume indices are used to measure thechanges of volumes of Malaysia's importsand exports. Volume indices for exportsand imports are derived indirectly bydeflating indices of values of exports andimports with the corresponding unit valueindices. In this case, the resulting indirectvolume index is Paasche volume index.
4. Terms of Trade IndexThe export and import unit value indicescan be used to measure Malaysia’s termsof trade. The terms of trade index iscalculated based on the ratio of unit valueindex of exports to the unit value index ofimports.
104

JADUAL 6.1 : INDEKS NILAI SEUNIT, VOLUM DAN TERMA PERDAGANGAN BAGI IMPORT DAN EKSPORT(2005=100), 1999 – 2014, MALAYSIA
Table 6.1 : Import and Export Unit Value Indices, Volume Indices and Terms of Trade (2005=100),
Tahun Indeks Nilai Seunit Indeks Volum Terma PerdaganganYear Unit Value Index Volume Index Terms of Trade
Import Eksport Import EksportImports Exports Imports Exports
1999 88.7 100.2 64.6 60.3 113.1
2000 89.9 103.3 79.8 68.0 114.9
2001 88.0 96.7 73.2 65.2 110.0
2002 89.3 96.3 77.7 69.2 107.9
2003 91.3 97.4 76.8 73.3 106.8
2004 93.7 98.1 98.0 91.7 104.7
2005 100.0 100.0 100.0 100.0 100.0
2006 95.1 101.8 116.8 107.9 107.2
2007 96.7 107.5 120.6 105.0 111.2
2008 104.6 124.6 116.6 100.1 119.1
2009 114.2 119.3 88.9 87.3 104.5
1999 – 2014, Malaysia
2010 117.7 125.3 105.0 96.0 106.5
2011 122.0 130.0 110.2 101.1 106.6
2012 128.7 136.2 110.4 97.2 105.8
2013 130.0 137.0 116.9 98.9 105.7
2014 131.2 137.8 122.1 104.8 105.0
105


INDEKS PENGELUARANPERINDUSTRIAN
INDEX OF INDUSTRIAL PRODUCTION

109
INDEKS PENGELUARANPERINDUSTRIAN
Nota Keterangan
1. Indeks Pengeluaran Perindustrian (IPP)meliputi tiga sektor utama iaituPerlombongan, Pembuatan dan Elektrik.Objektif utama IPP adalah untukmengukur kadar perubahan sebenard a l a m p e n g e l u a r a n k o m o d i t iperindustrian bagi satu tempoh masa.
2. IPP yang disusun adalah satu wajaranpurata aritmetik tahun asas bagi kuantitirelatif yang dikira mengikut formulaLaspeyres. Ia telah disusun buat kalipertama dengan menggunakan tahun1968 sebagai tahun asas (1968=100).Pengasasan semula telah dilakukanpada tahun 1981, 1985, 1988, 1993,2000, 2005 dan terkini kepada tahun2010.
3. IPP merujuk kepada peringkat Malaysiakecuali bagi tahun asas 1968 dan 1981yang mana meru juk kepadaSemenanjung Malaysia.
INDEX OF INDUSTRIALPRODUCTION
Explanatory Notes
1. The Industrial Production Index, Malaysia(IPI) covers three main sectors which areMining, Manufacturing and Electricity.The main objective of the IPI is tomeasure the rate of change in theproduction of industrial commodities inreal terms over time.
2. IPI compiled is a base year weightedarithmetic average of quantity relativescalculated by the Laspeyres’ formula. Itwas first constructed with 1968 as thebase year (1968=100). Subsequently, theIPI was rebased to 1981, 1985, 1988,1993, 2000, 2005 and currently to 2010.
3. The IPI refers to Malaysia except for thebase years 1968 and 1981 which refer toPeninsular Malaysia.

110
JADUAL 7.1 : INDEKS PENGELUARAN PERINDUSTRIAN (2005=100), 1968 – 2010, MALAYSIATable 7.1 : Index of Industrial Production (2005=100), 1968 – 2010, Malaysia
Tahun Indeks Keseluruhan Perlombongan Pembuatan ElektrikYear Overall Index Mining Manufacturing Electricity
1968 5.1 44.0 3.1 3.41969 5.6 43.0 3.5 3.61970 6.0 42.1 4.0 3.9
1971 6.1 37.6 4.2 4.2
1972 6.8 37.4 4.8 4.81973 7.7 35.5 5.7 5.31974 8.6 33.2 6.6 5.8
1975 8.6 31.1 6.6 6.3
1976 9.9 30.7 7.9 7.1
1977 10.8 28.5 8.7 7.8
1978 11.6 30.3 9.4 8.7
1979 12.6 30.6 10.2 9.6
1980 13.6 29.8 11.1 10.5
1981 14.0 29.3 11.5 11.2
1982 14.8 30.9 12.1 11.6
1983 16.6 38.7 12.9 12.9
1984 19.3 43.6 15.4 13.8
1985 18.7 43.8 14.5 14.8
1986 20.6 50.6 15.5 16.3
1987 22.4 52.1 17.5 17.6
1988 25.6 58.5 20.2 19.5
1989 28.2 63.3 22.5 21.9
1990 31.6 66.6 26.0 25.0
1991 35.2 70.0 29.6 28.2
1992 38.2 71.9 32.7 32.2
1993 41.9 72.8 36.9 36.1
1994 47.0 75.3 42.4 41.1
1995 53.2 82.1 48.4 47.0
1996 59.0 86.9 54.3 52.9
1997 65.3 89.0 61.1 60.4
1998 61.1 89.9 54.8 62.5
1999 66.1 87.1 61.9 64.9
2000 78.8 86.9 77.3 68.9
2001 76.1 89.5 72.3 74.9
2002 79.7 91.1 76.1 82.6
2003 87.0 96.0 84.4 87.3
2004 96.5 101.7 95.1 94.6
2005 100.0 100.0 100.0 100.0
2006 104.9 96.2 109.0 105.1
2007 107.3 98.3 111.4 109.2
2008 108.1 99.1 112.2 110.5
2009 99.9 95.5 100.9 111.4
2010 107.1 93.9 112.1 121.2

111
JADUAL 7.2 : INDEKS PENGELUARAN PERINDUSTRIAN (2010=100), 2010 – 2014, MALAYSIATable 7.2 : Index of Industrial Production (2010=100), 2010 – 2014, Malaysia
Tahun Indeks Keseluruhan Perlombongan Pembuatan ElektrikYear Overall Index Mining Manufacturing Electricity
2010 100.0 100.0 100.0 100.0
2011 102.4 94.8 105.7 102.0
2012 106.7 96.2 111.3 107.22013 110.3 97.0 116.0 113.12014 116.0 99.5 123.0 118.4


INDEKS KUANTITIPERDAGANGAN EDARANVOLUME INDEX OF DISTRIBUTIVE TRADE

115
INDEKS KUANTITI PERDAGANGANEDARAN
Nota Keterangan
1. Indeks kuantiti Perdagangan Edaran(subsektor Kenderaan Bermotor,Perdagangan Borong dan PerdaganganRuncit) mengukur perubahan nilai jualanpada harga malar dengan mengeluarkankesan harga pada suatu tempoh masa.
VOLUME INDEX OF DISTRIBUTIVETRADE
Explanatory Notes
1. The volume index of Distributive Trade(Motor Vehicles, Wholesale Trade andRetail Trade sub-sectors) measures thechanges in sales at constant price byremoving price effect in a specifiedreference period.

116
JADUAL 8.1 : INDEKS KUANTITI PERDAGANGAN EDARAN (2010=100), 2008 – 2014 MALAYSIATable 8.1 : Volume Index of Distributive Trade (2010=100), 2008 – 2014, Malaysia
Indeks PerdaganganEdaran
Indeks KenderaanBermotor
Indeks PerdaganganBorong
Indeks PerdaganganRuncit
Index of DistributiveTrade Index of Motor Vehicles Index of Wholesale Trade Index of Retail Trade
2008 93.2 95.6 95.4 89.5
2009 93.0 90.1 94.9 92.2
2010 100.0 100.0 100.0 100.0
2011 109.8 106.8 115.2 105.0
2012 114.1 111.7 119.0 109.5
2013 120.4 115.4 125.2 117.3
2014 129.9 122.6 133.8 129.0
TahunYear
Nota / Note:Indeks Kuantiti Perdagangan Edaran (2010=100) disusun menggunakan kaedah re-referencing mulai suku pertama 2014Volume Index of Distributive Trade (2010=100) was compiled using re-referencing method beginning first quarter 2014

PERTANIAN, PERHUTANAN& PERIKANAN
AGRICULTURE, FORESTRY & FISHING


PADIPADDY


121
PENANAMAN PADI
Nota Keterangan
1. Sebelum tahun 1991, data kadar hasildiperoleh daripada Jabatan PerangkaanMalaysia melalui ujian tuaian padi bagitanaman musim utama dan tanaman luarmusim semenjak tahun 1964 dan 1969.
2. Mulai tahun 1991, data penanaman padidiperoleh daripada Jabatan PertanianMalaysia. Sumber pengumpulan datadiambil daripada Penyiasatan Hasil Padidan Penyiasatan Keluasan AktivitiTanaman Padi.
3. Data tahunan padi bagi sesuatu tahunmerujuk kepada jumlah data yangdilaporkan bagi dua musim, iaitu MusimUtama dan Luar Musim. Contohnya, databagi tahun 2000, merujuk kepada dataMusim Utama 1999/2000 dan LuarMusim 2000. Data ini dilaporkan di dalam
laporan sebagai Semua Musim.
4. Musim UtamaMusim utama ditakrifkan sebagai tempohbila padi ditanam yang mana tarikh muladitanam jatuh antara 1hb Ogos hingga28hb/29hb Februari tahun berikutnya.
5. Pengeluaran PadiPengeluaran padi merujuk kepadamaklumat jumlah pengeluaran padisawah dan padi huma.
PADDY PLANTATION
Explanatory Notes
1. Prior to 1991, yield data were obtainedfrom the Department of Statistics,Malaysia through the annual crop-cuttingtest on main season wet paddy crop andoff-season crop since 1964 and 1969respectively.
2. Since 1991, the paddy planting data areprovided by Department of AgricultureMalaysia. The source of data gathered aretaken from Paddy Yield Survey and PaddyCultivation Activities Area Survey.
3. Yearly data for paddy refers to thesummation of data reported in the MainSeason and Off Season. For example,data for 2000 refers to the compiled MainSeason 1999/2000 data and Off Season2000 data; and are reported in the reportas All Season.
4. Main SeasonMain season is defined as the periodwhen paddy is planted in which thecommence date of planting falls between1st August to 28th/29th February of thefollowing year.
5. Paddy ProductionPaddy production refers to the totalproduction wetland paddy data anddryland paddy.

122
6. Average Yield of PaddyThe average yield of paddy (Kg/Ha) is theaverage yield of paddy after drying,cleaning and when the moisture contentis at exact 14 per cent.
7. Wetland PaddyWetland paddy is the primary paddy typeplanted in Malaysia and comprises ofdifferent varieties of paddy.
8. Dryland PaddyDryland paddy refers to paddy on dryareas whether on highland or lowlandand depends purely on rainfall.
9. Granary AreasGranary Areas refer to major irrigationschemes (areas greater than 4,000hectares) and recognized by theGovernment in the National AgriculturalPolicy as the main paddy producingareas.
There are ten Granary Areas inMalaysia, namely Muda AgriculturalDevelopment Authority (MADA), KemubuAgricultural Development Authority(KADA), Kerian Integrated AgricultureDevelopment Area, Barat Laut SelangorIntegrated Agriculture Development Area,Seberang Perak Integrated AgricultureDevelopment Area, Pulau PinangIntegrated Agriculture Development Area,North Terengganu Integrated AgricultureDevelopment (KETARA), KemasinSemerak Integrated AgricultureDevelopment Area, Pekan IntegratedAgriculture Development Area andRompin Integrated AgricultureDevelopment Area.
6. Purata Hasil PadiPurata hasil padi (Kg/Ha) adalah puratahasil padi selepas pengeringan,dibersihkan dan apabila kandungankelembapan wap basah tepat pada 14peratus.
7. Padi SawahPadi Sawah adalah jenis padi yangutama ditanam di Malaysia dan terdiridari pelbagai jenis padi yang berbeza.
8. Padi HumaPadi Huma meliputi padi yang ditanam dikawasan kering sama ada di tanah tinggiatau di tanah rendah dan bergantungkepada air hujan.
9. Jelapang PadiJelapang Padi ialah skim pengairan yangbesar (keluasan melebihi 4,000 hektar)dan diiktiraf oleh Kerajaan dalam DasarPertanian Negara sebagai kawasanutama pengeluaran padi.
Terdapat sepuluh kawasan Jelapang Padidi Malaysia iaitu Lembaga KemajuanPertanian Muda (MADA), LembagaKemajuan Pertanian Kemubu (KADA),Kawasan Pembangunan PertanianBersepadu Kerian, KawasanPembangunan Pertanian BersepaduBarat Laut Selangor, KawasanPembangunan Pertanian BersepaduSeberang Perak, Kawasan PertanianBersepadu Pulau Pinang, KawasanPembangunan Terengganu Utara(KETARA), Kawasan PembangunanPertanian Bersepadu Kemasin Semerak,Kawasan Pembangunan PertanianBersepadu Pekan dan KawasanPembangunan Pertanian BersepaduRompin.

JADUAL 9.1 : PERANGKAAN UTAMA PADI DAN BERAS MENGIKUT SEMUA MUSIM, 1980 – 2014, MALAYSIATable 9.1 : Principal Statistics of Paddy and Rice by All Seasons, 1980 – 2014, Malaysia
Tahun Keluasan Bertanam Purata Hasil Pengeluaran Padi Pengeluaran BerasYear Planted Area Average Yield Paddy Production Rice Production
Hektar Kilogram/Hektar Tan Metrik Tan MetrikHectare Kilogram/Hectare Tonne Tonne
1980 716,873 2,852 2,044,604 1,318,332
1981 710,789 2,842 2,019,900 1,302,921
1982 682,070 2,762 1,883,604 1,213,281
1983 665,813 2,605 1,734,325 1,116,937
1984 630,833 2,491 1,571,674 1,010,279
1985 656,375 2,975 1,952,914 1,257,970
1986 650,875 2,640 1,718,215 1,104,501
1987 658,954 2,469 1,626,699 1,046,467
1988 671,755 2,525 1,696,239 1,091,478
1989 664,137 2,625 1,743,444 1,122,617
1990 680,647 2,769 1,884,984 1,215,065
1991 683,640 2,818 1,926,354 1,241,796
1992 672,753 2,992 2,012,732 1,297,914
1993 693,434 3,035 2,104,447 1,357,432
1994 698,624 3,061 2,138,788 1,378,945
1995 672,787 3,162 2,127,271 1,372,584
1996 685,468 3,251 2,228,489 1,438,794
1997 690,975 3,068 2,119,615 1,367,951
1998 674,404 2,883 1,944,240 1,256,854
1999 692,389 2,941 2,036,641 1,314,437
2000 698,702 3,064 2,140,904 1,381,662
2001 673,634 3,110 2,094,995 1,351,461
2002 678,544 3,238 2,197,351 1,415,117
2003 671,820 3,360 2,257,037 1,453,137
2004 676,310 3,434 2,291,353 1,467,052
2005 666,781 3,471 2,314,378 1,490,015
2006 676,034 3,236 2,187,519 1,407,220
2007 676,111 3,514 2,375,604 1,530,971
2008 656,602 3,584 2,353,032 1,516,470
2009 674,928 3,720 2,511,043 1,620,259
2010 677,884 3,636 2,464,831 1,588,457
2011 687,940 3,748 2,578,519 1,661,260
2012 684,545 3,797 2,599,382 1,674,981
2013 671,679 3,876 2,603,654 1,677,368
2014 679,315 4,194 2,848,852 1,835,015
123
Sumber / Source : Jabatan Pertanian Malaysia / Department of Agriculture, Malaysia

Sumber / Source : Jabatan Pertanian Malaysia / Department of Agriculture, Malaysia
124
JADUAL 9.2 : PERANGKAAN UTAMA PADI DAN BERAS MENGIKUT SEMUA MUSIM, 1980 – 2014, KAWASANJELAPANG PADI
Table 9.2 : Principal Statistics of Paddy and Rice by All Seasons, 1980 – 2014, Granary Areas
Tahun Keluasan Bertanam Purata Hasil Pengeluaran Padi Pengeluaran BerasYear Planted Area Average Yield Paddy Production Rice Production
Hektar Kilogram/Hektar Tan Metrik Tan MetrikHectare Kilogram/Hectare Tonne Tonne
1980 317,041 4,075 1,291,942 839,715
1981 316,825 3,990 1,264,132 821,699
1982 307,446 3,779 1,161,838 755,202
1983 299,544 3,533 1,058,289 687,948
1984 273,141 3,170 865,857 562,823
1985 326,033 3,942 1,285,222 835,450
1986 334,082 3,298 1,101,751 716,138
1987 359,077 3,011 1,081,225 702,796
1988 362,507 3,064 1,110,806 722,024
1989 350,071 3,341 1,169,705 760,308
1990 373,588 3,474 1,297,722 843,519
1991 378,092 3,695 1,397,159 908,153
1992 384,562 3,716 1,428,872 928,767
1993 389,708 3,829 1,492,256 969,966
1994 383,947 3,846 1,476,723 959,870
1995 383,201 3,987 1,527,738 993,030
1996 382,453 4,039 1,544,834 1,004,142
1997 395,010 3,811 1,505,517 978,586
1998 394,688 3,750 1,479,982 961,988
1999 394,076 3,696 1,456,505 946,728
2000 391,012 3,749 1,465,735 952,728
2001 375,116 3,833 1,437,659 934,478
2002 382,355 3,904 1,492,818 970,332
2003 381,310 4,106 1,565,776 1,017,754
2004 377,794 4,051 1,530,271 994,676
2005 384,112 4,132 1,587,298 1,031,744
2006 387,312 3,771 1,460,473 949,308
2007 386,592 4,207 1,626,449 1,057,192
2008 384,145 4,249 1,632,407 1,061,065
2009 391,625 4,646 1,819,406 1,182,614
2010 387,160 4,540 1,757,575 1,142,423
2011 389,544 4,773 1,859,357 1,208,582
2012 381,583 4,866 1,856,476 1,206,710
2013 369,273 5,002 1,847,208 1,200,686
2014 400,733 5,212 2,088,449 1,357,492

GETAHRUBBER


127
GETAH
Nota Keterangan
1. EstetSesebuah estet getah ditakrifkan:(i) semua kawasan bersambungan atau
berpecah-pecah dengan keluasan tidakkurang daripada 40.47 hektar (100ekar), ditanam dengan sesuatutanaman atau di mana penanamantanaman tersebut dibenarkan dan dibawah satu hak milik yang sah; atau
(ii) mana-mana keluasan yang ditanamdengan sesuatu tanaman tersebut diestet yang telah sedia ada.
2. Kebun KecilSesebuah kebun kecil getah ditakrifkansebagai semua kawasan, bersambungan
atau berpecah-pecah, dengan keluasankurang daripada 40.47 hektar (100 ekar),ditanam dengan sesuatu tanaman atau dimana penanaman tanaman tersebutdibenarkan dan di bawah satu hak milikyang sah.
Walau bagaimanapun, rancangankemajuan tanah (RISDA, FELDA, FELCRAdan sebagainya) adalah dimasukkansebagai kebun kecil walaupun ada diantara rancangan kemajuan tanah mungkinmempunyai keluasan lebih daripada 40.47hektar (100 ekar).
3. Pengeluaran Getah AsliPengeluaran getah asli merujuk kepadakandungan getah kering (KGK) susu getahcair, skrap dan getah keping yangdihasilkan oleh estet dan pekebun kecil.Data pengeluaran estet diperoleh terusdaripada estet. Manakala data pengeluaranpekebun kecil diperoleh daripada syarikatpemproses getah.
4. Keluasan BertanamKeluasan yang ditanam dengan getahsama ada matang dan/atau belum matang.
RUBBER
Explanatory Notes
1. EstatesA rubber estate is defined as:(i) all areas, contiguous or non-
contiguous, aggregating not less than40.47 hectares (100 acres), plantedwith the crop or on which the plantingof the crop is permitted and is under asingle legal ownership; or
(ii) any area planted with the crop in analready existing estate.
2. SmallholdingsA rubber smallholding is defined as allareas, contiguous or non-contiguous,aggregating less than 40.47 hectares(100 acres) planted with the crop or onwhich the planting of the crop is permittedand is under a single legal ownership.
However, land development schemes(RISDA, FELDA, FELCRA and others)are included as smallholdings althoughsome land schemes may be more than40.47 hectares (100 acres).
3. Production of Natural RubberProduction of natural rubber refers to thedry rubber content (DRC) of field latex,scrap and sheets produced by estatesand smallholders. Estate production isobtained directly from the estates. While,smallholding production is obtained fromrubber processors companies.
4. Planted AreaThe area of rubber which is eithermatured and/or immature.

128
JADUAL 10.1 : PERANGKAAN UTAMA ESTET GETAH, 1965 – 2014, MALAYSIATable 10.1 : Principal Statistics of Rubber Estates, 1965 – 2014, Malaysia
Tahun Bilangan Keluasan Keluasan Pengeluaran Hasil bagi Harga Purata Jumlah PekerjaYear Estet bertanam ditoreh Production per Hektar G.M.M. 20 f.o.b Bergaji yang Diambil
Number Planted Tapped Yield Average price Bekerja dalamof Area Area per Hectare S.M.R.20 f.o.b Tempoh Gaji
Estate TerakhirTotal Number ofPaid Employee
During the('000) ('000) ('000) Kg Sen/kg Last Pay Period
HektarHectare
HektarHectare
Tan MetrikTonne ('000)
1965 2,216 788.5 542.3 507.9 937 .. 262.1
1966 2,232 770.0 536.8 531.2 990 .. 258.4
1967 2,249 744.8 535.1 543.5 1,016 .. 235.4
1968 2,246 715.1 533.3 581.8 1,090 .. 209. 8
1969 2,219 695.6 539.2 612.2 1,136 .. 212.7
1970 2,180 677.0 537.9 631.3 1,174 .. 205.4
1971 2,129 659.2 528.3 672.1 1,273 .. 205.2
1972 2,072 638.0 511.9 670.0 1,311 .. 197.7
1973 2,011 612.3 500.5 684.6 1,362 158.01 193.5
1974 1,961 596.6 428.9 666.3 1,380 159.98 191.5
1975 1,911 583.4 463.6 587.2 1,267 131.61 185.5
1976 1,893 573.1 453.4 657.8 1,451 189.77 181.2
1977 1,861 558.5 445.4 633.6 1,422 195.77 175.6
1978 1,839 541.5 434.9 624.8 1,434 215.63 169.7
1979 1,807 525.6 427.3 611.7 1,432 263.83 167.1
1980 1,767 506.1 415.7 591.5 1,427 273.73 160.4
1981 1,738 493.3 406.0 578.5 1,425 219.94 153.0
1982 1,704 481.9 395.9 562.2 1,420 175.46 140.8
1983 1,676 477.5 385.9 547.5 1,419 218.72 137.7
1984 1,612 454.8 373.6 518.1 1,387 209.18 130.8
1985 1,592 428.8 356.6 504.3 1,414 173.54 124.0
1986 1,519 399.4 333.5 497.5 1,492 191.30 119.4
1987 1,481 381.5 327.7 490.6 1,497 224.31 114.9
1988 1,448 371.1 324.8 481.1 1,481 277.86 113.3
1989 1,414 361.0 315.7 432.8 1,371 226.81 108.3
1990 1,367 348.7 298.4 396.6 1,329 204.64 101.7
1991 1,293 333.4 273.7 366.2 1,338 213.07 89.6
1992 1,189 314.1 250.0 333.0 1,332 208.68 79.1
1993 1,133 292.5 229.2 296.3 1,293 202.85 68.2
1994 1,075 275.0 191.5 271.3 1,417 293.75 58.9
1995 1,048 255.7 186.5 240.7 1,291 382.60 55.5
1996 853 223.9 182.8 237.9 1,301 329.55 49.9
1997 735 200.7 169.6 215.9 1,273 271.83 43.6
1998 699 179.9 147.9 196.7 1,330 259.00 40.7
1999 621 151.2 126.5 183.1 1,447 226.94 35.3

129
JADUAL 10.1 : PERANGKAAN UTAMA ESTET GETAH, 1965 – 2014, MALAYSIA (samb.)Table 10.1 : Principal Statistics of Rubber Estates, 1965 – 2014, Malaysia (cont’d)
Tahun Bilangan Keluasan Keluasan Pengeluaran Hasil bagi Harga Purata Jumlah PekerjaYear Estet bertanam ditoreh Production per Hektar G.M.M. 20 f.o.b Bergaji yang Diambil
Number Planted Tapped Yield Average price Bekerja dalamof Area Area per Hectare S.M.R.20 f.o.b Tempoh Gaji
Estate TerakhirTotal Number ofPaid Employee
During the('000) ('000) ('000) Kg Sen/kg Last Pay PeriodHektarHectare
HektarHectare
Tan MetrikTonne ('000)
2000 559 123.8 98.3 126.7 1,289 242.52 25.8
2001 391 95.5 73.7 99.5 1,358 205.56 18.9
2002 364 84.8 61.6 85.0 1,381 285.98 16.1
2003 360 78.5 56.8 76.4 1,343 378.97 14.6
2004 262 64.4 50.4 71.2 1,410 461.93 13.4
2005 229 58.7 47.3 65.3 1,381 523.07 11.8
2006 213 54.2 44.9 68.4 1,525 710.92 11.9
2007 197 52.7 43.7 65.5 1,497 734.06 11.6
2008 196 50.9 42.1 59.6 1,414 831.37 11.1
2009 185 49.7 40.5 56.8 1,401 637.36 10.4
2010 188 49.9 40.6 56.3 1,388 1,058.08 10.2
2013 173 77.4 41.2 57.4 1,393 774.70 12.0
2011 188 49.9 38.5 53.0 1,378 1,348.33 10.9
2012 172 65.9 41.6 58.8 1,412 952.50 12.5
2014 184 80.1 39.3 55.8 1,420 553.10 12.4

130
JADUAL 10.2 : JUMLAH KELUASAN HEKTAR TANAMAN DAN PENGELUARAN GETAH, 1965 – 2014, MALAYSIATable 10.2 : Total Planted Area Hectareage and Production of Rubber, 1965 – 2014, Malaysia
Tahun Keluasan bertanam PengeluaranYear Planted Area Production
('000) Hektar/Hectare ('000) Tan Metrik/Tonne
Jumlah Estet Kebun Jumlah Estet KebunKeluasan Kecil (a) KecilTotal Area Estate Smallholding Total Estate Smallholding
1965 2,043.7 788.5 1,255.2 917.0 507.9 409.1
1966 2,050.7 770.0 1,280.7 972.9 531.2 441.7
1967 2,044.7 744.8 1,299.9 991.2 543.5 447.7
1968 2,022.3 715.1 1,307.2 1,100.4 581.8 518.6
1969 2,022.9 695.6 1,327.3 1,268.2 612.2 656.0
1970 2,019.4 677.0 1,342.4 1,269.3 631.3 638.0
1971 2,016.0 659.2 1,356.8 1,318.6 672.1 646.5
1972 1,999.7 638.0 1,361.7 1,304.3 670.0 634.3
1973 1,990.9 612.3 1,378.6 1,542.5 684.6 857.9
1974 1,988.7 596.6 1,392.1 1,522.1 666.3 855.8
1975 1,991.6 583.4 1,408.2 1,454.5 587.2 867.3
1976 1,997.8 573.1 1,424.7 1,608.0 657.8 950.2
1977 1,999.2 558.5 1,440.7 1,584.8 633.6 951.2
1978 1,995.9 541.5 1,454.4 1,581.5 624.8 956.7
1979 1,953.4 525.6 1,427.8 1,565.2 611.7 953.5
1980 1,998.2 506.1 1,492.1 1,524.6 591.5 933.1
1981 2,000.0 493.3 1,506.7 1,504.8 578.5 926.3
1982 1,991.6 481.9 1,509.7 1,494.1 562.2 931.9
1983 1,971.0 477.5 1,493.5 1,563.7 547.5 1,016.2
1984 1,972.7 454.8 1,517.9 1,530.6 518.1 1,012.5
1985 1,955.4 428.8 1,526.6 1,469.4 504.3 965.1
1986 1,912.0 399.4 1,512.7 1,538.6 497.5 1,041.1
1987 1,881.3 381.5 1,499.8 1,578.7 490.6 1,088.1
1988 1,865.8 371.1 1,494.7 1,661.6 481.1 1,180.5
1989 1,849.0 361.0 1,488.0 1,415.6 432.8 982.8
1990 1,836.7 348.7 1,488.0 1,291.0 396.6 894.4
1991 1,818.7 333.4 1,485.3 1,255.7 366.2 889.4
1992 1,792.3 314.1 1,478.2 1,170.9 333.0 837.9
1993 1,762.8 292.5 1,470.3 1,074.3 296.3 778.0
1994 1,737.1 275.0 1,462.1 1,100.6 271.3 829.3
1995 1,688.8 255.7 1,433.1 1,087.5 240.7 846.8
1996 1,644.3 223.9 1,420.4 1,082.3 237.9 844.4
1997 1,616.5 200.7 1,415.8 971.1 215.9 755.2
1998 1,543.6 179.9 1,363.7 883.5 196.7 686.8
1999 1,464.8 151.2 1,313.6 777.8 183.1 594.7
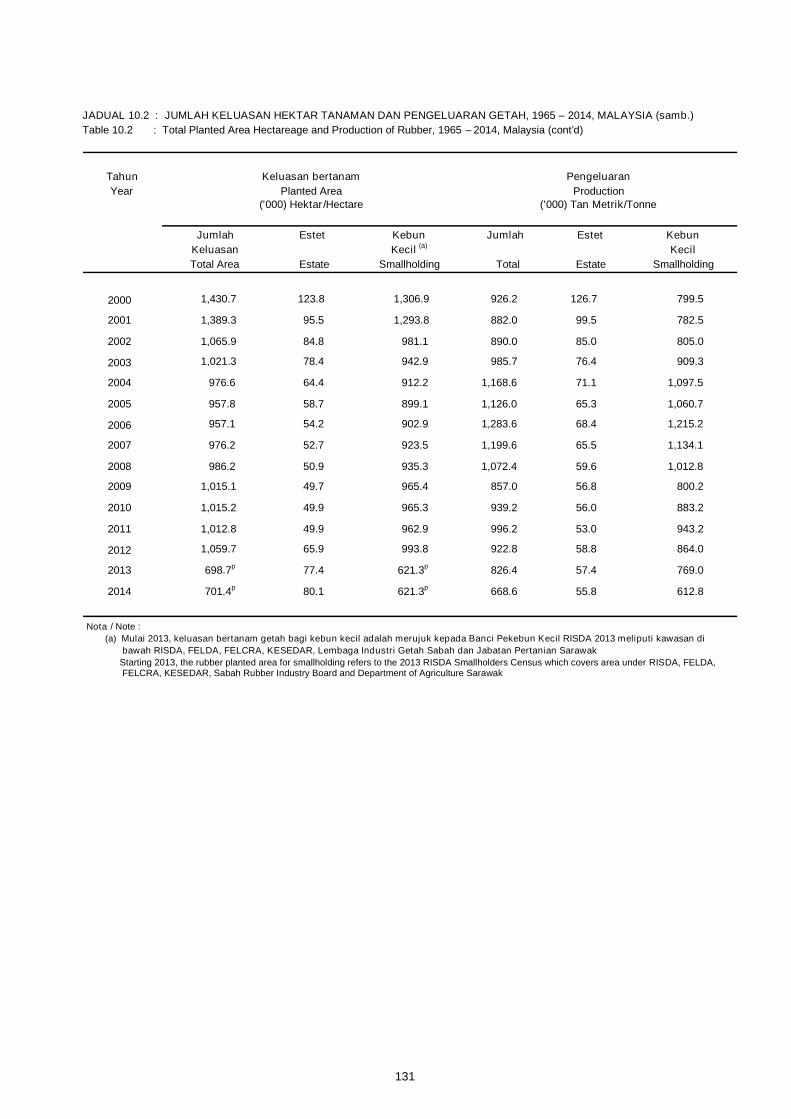
131
JADUAL 10.2 : JUMLAH KELUASAN HEKTAR TANAMAN DAN PENGELUARAN GETAH, 1965 – 2014, MALAYSIA (samb.)Table 10.2 : Total Planted Area Hectareage and Production of Rubber, 1965 – 2014, Malaysia (cont’d)
Tahun Keluasan bertanam PengeluaranYear Planted Area Production
('000) Hektar/Hectare ('000) Tan Metrik/Tonne
Jumlah Estet Kebun Jumlah Estet KebunKeluasan Kecil (a) KecilTotal Area Estate Smallholding Total Estate Smallholding
2000 1,430.7 123.8 1,306.9 926.2 126.7 799.5
2001 1,389.3 95.5 1,293.8 882.0 99.5 782.5
2002 1,065.9 84.8 981.1 890.0 85.0 805.0
2003 1,021.3 78.4 942.9 985.7 76.4 909.3
2004 976.6 64.4 912.2 1,168.6 71.1 1,097.5
2005 957.8 58.7 899.1 1,126.0 65.3 1,060.7
2006 957.1 54.2 902.9 1,283.6 68.4 1,215.2
2007 976.2 52.7 923.5 1,199.6 65.5 1,134.1
2008 986.2 50.9 935.3 1,072.4 59.6 1,012.8
2009 1,015.1 49.7 965.4 857.0 56.8 800.2
2010 1,015.2 49.9 965.3 939.2 56.0 883.2
2013 698.7p 77.4 621.3p 826.4 57.4 769.0
2011 1,012.8 49.9 962.9 996.2 53.0 943.2
2012 1,059.7 65.9 993.8 922.8 58.8 864.0
2014 701.4p 80.1 621.3p 668.6 55.8 612.8
Nota / Note :(a) Mulai 2013, keluasan bertanam getah bagi kebun kecil adalah merujuk kepada Banci Pekebun Kecil RISDA 2013 meliputi kawasan di
bawah RISDA, FELDA, FELCRA, KESEDAR, Lembaga Industri Getah Sabah dan Jabatan Pertanian SarawakStarting 2013, the rubber planted area for smallholding refers to the 2013 RISDA Smallholders Census which covers area under RISDA, FELDA,FELCRA, KESEDAR, Sabah Rubber Industry Board and Department of Agriculture Sarawak


KELAPA SAWITOIL PALM


135
KELAPA SAWIT
Nota Keterangan
1. Penyusunan data kelapa sawitberdasarkan Banci Tahunan Estet KelapaSawit yang dijalankan oleh JabatanPerangkaan Malaysia bagi tempoh1959 – 1988. Tugas pengumpulan datatelah diambil alih oleh LembagaPendaftaran dan Pelesenan MinyakKelapa Sawit (PORLA) mulai tahun 1989.Mulai tahun 2000, data telah diperolehdaripada Lembaga Minyak SawitMalaysia (MPOB), iaitu gabunganPORLA dan Institut Penyelidikan KelapaSawit Malaysia (PORIM). Maka liputanestet PORLA mulai 1989 berbeza denganliputan Jabatan Perangkaan Malaysia.Data mulai tahun tersebut tidak sesuaidibandingkan dengan data tahunterdahulu.
2. Data siri masa mengenai jumlahkeluasan hektar tanaman kelapa sawitmeliputi estet dan kebun kecil (tidaktermasuk FELDA, FELCRA, RISDA danAgensi Kerajaan Negeri).
3. Harga Purata Penghantaran Tempatanadalah merujuk kepada purata hargayang diniagakan sehingga ke destinasipembeli tempatan. Lazimnya pengeluartempatan merujuk kepada pengilangkelapa sawit sementara pembeli pulaadalah pengusaha penapisan minyaksawit. Ia juga merangkumi hargapengeluar (harga di kilang) termasuk kospengangkutan dan insurans.
OIL PALM
Explanatory Notes
1. The compilation of oil palm data forreference years 1959 – 1988 wereobtained from the Annual Censusof Oil Palm Estates conducted by theDepartment of Statistics, Malaysia.From 1989, the Palm Oil Registration andLicensing Authority (PORLA) has takenover the responsibility of data collection.Since year 2000, the data were obtainedfrom Malaysian Palm Oil Board (MPOB),the merger of PORLA and Palm OilResearch Institute of Malaysia (PORIM).PORLA’s coverage of estates differsfrom the coverage of the Department ofStatistics, Malaysia starting from 1989.Data for that year onwards are notcomparable with the earlier years data.
2. Time series data on total plantedhectareage of oil palm include estatesand independent smallholdings(excluding FELDA, FELCRA, RISDA andState Agency).
3. Local Delivered Average Price means theaverage traded price up to the localbuyers destination. Normally the localsellers are the miller and the buyers arethe refinery. It includes the seller priceex–mill base plus the transportation costand insurance up to the buyers factorygate.
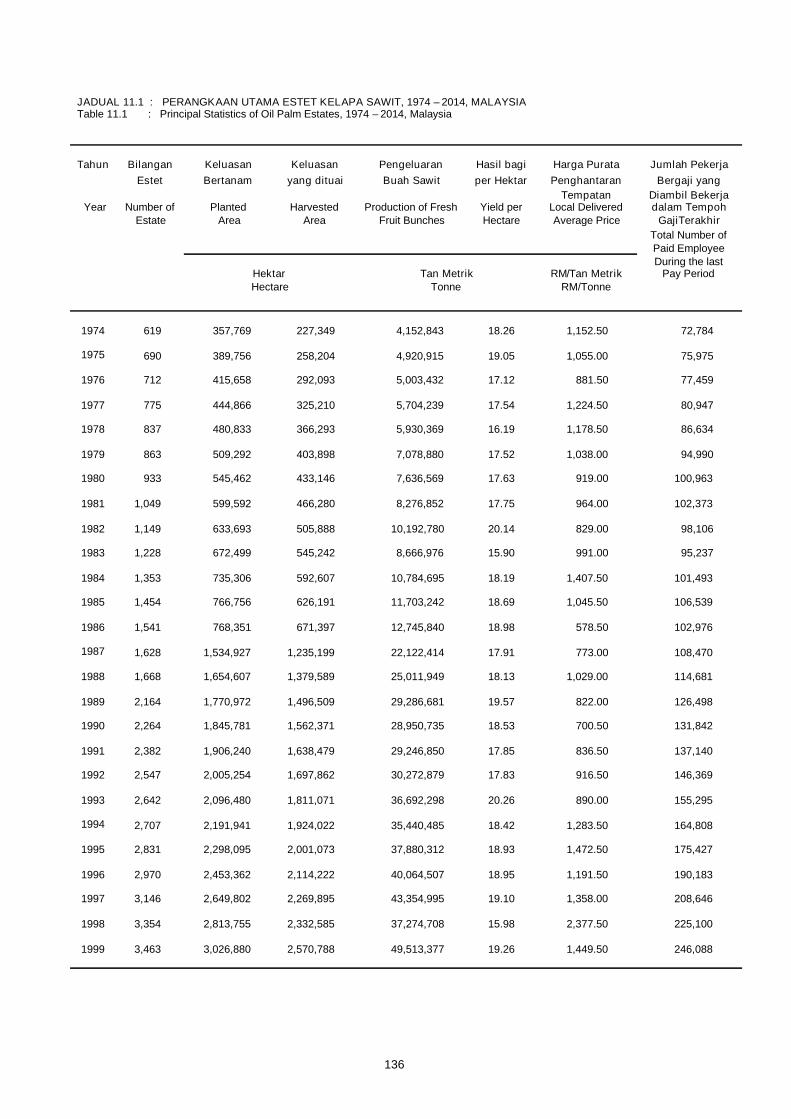
JADUAL 11.1 : PERANGKAAN UTAMA ESTET KELAPA SAWIT, 1974 – 2014, MALAYSIATable 11.1 : Principal Statistics of Oil Palm Estates, 1974 – 2014, Malaysia
Tahun Bilangan Keluasan Keluasan Pengeluaran Hasil bagi Harga Purata Jumlah PekerjaEstet Bertanam yang dituai Buah Sawit per Hektar Penghantaran Bergaji yang
Tempatan Diambil BekerjaYear Number of Planted Harvested Production of Fresh Yield per Local Delivered dalam Tempoh
Estate Area Area Fruit Bunches Hectare Average Price GajiTerakhirTotal Number ofPaid EmployeeDuring the last
Hektar Tan Metrik RM/Tan Metrik Pay PeriodHectare Tonne RM/Tonne
1974 619 357,769 227,349 4,152,843 18.26 1,152.50 72,784
1975 690 389,756 258,204 4,920,915 19.05 1,055.00 75,975
1976 712 415,658 292,093 5,003,432 17.12 881.50 77,459
1977 775 444,866 325,210 5,704,239 17.54 1,224.50 80,947
1978 837 480,833 366,293 5,930,369 16.19 1,178.50 86,634
1979 863 509,292 403,898 7,078,880 17.52 1,038.00 94,990
1980 933 545,462 433,146 7,636,569 17.63 919.00 100,963
1981 1,049 599,592 466,280 8,276,852 17.75 964.00 102,373
1982 1,149 633,693 505,888 10,192,780 20.14 829.00 98,106
1983 1,228 672,499 545,242 8,666,976 15.90 991.00 95,237
1984 1,353 735,306 592,607 10,784,695 18.19 1,407.50 101,493
1985 1,454 766,756 626,191 11,703,242 18.69 1,045.50 106,539
1986 1,541 768,351 671,397 12,745,840 18.98 578.50 102,976
1987 1,628 1,534,927 1,235,199 22,122,414 17.91 773.00 108,470
1988 1,668 1,654,607 1,379,589 25,011,949 18.13 1,029.00 114,681
1989 2,164 1,770,972 1,496,509 29,286,681 19.57 822.00 126,498
1990 2,264 1,845,781 1,562,371 28,950,735 18.53 700.50 131,842
1991 2,382 1,906,240 1,638,479 29,246,850 17.85 836.50 137,140
1992 2,547 2,005,254 1,697,862 30,272,879 17.83 916.50 146,369
1993 2,642 2,096,480 1,811,071 36,692,298 20.26 890.00 155,295
1994 2,707 2,191,941 1,924,022 35,440,485 18.42 1,283.50 164,808
1995 2,831 2,298,095 2,001,073 37,880,312 18.93 1,472.50 175,427
1996 2,970 2,453,362 2,114,222 40,064,507 18.95 1,191.50 190,183
1997 3,146 2,649,802 2,269,895 43,354,995 19.10 1,358.00 208,646
1998 3,354 2,813,755 2,332,585 37,274,708 15.98 2,377.50 225,100
1999 3,463 3,026,880 2,570,788 49,513,377 19.26 1,449.50 246,088
136

JADUAL 11.1 : PERANGKAAN UTAMA ESTET KELAPA SAWIT, 1974 – 2014, MALAYSIA (samb.)Table 11.1 : Principal Statistics of Oil Palm Estates, 1974 – 2014, Malaysia (cont'd)
Tahun Bilangan Keluasan Keluasan Pengeluaran Hasil bagi Harga Purata Jumlah PekerjaEstet Bertanam yang dituai Buah Sawit per Hektar Penghantaran Bergaji yang
Tempatan Diambil BekerjaYear Number of Planted Harvested Production of Fresh Yield per Local Delivered dalamTempoh
Estate Area Area Fruit Bunches Hectare Average Price Gaji TerakhirTotal Number ofPaid EmployeeDuring the last
Hektar Tan Metrik RM/Tan Metrik Pay PeriodHectare Tonne RM/Tonne
2000 3,581 3,055,846 2,621,502 48,052,132 18.33 996.50 252,549
2001 3,622 3,155,670 2,663,610 50,981,495 19.14 894.50 265,182
2002 3,778 3,311,148 2,831,657 50,884,876 17.97 1,363.50 285,444
2003 3,877 3,414,042 2,915,909 55,373,112 18.99 1,544.00 314,658
2004 3,940 3,508,841 3,085,290 57,386,394 18.60 1,610.00 331,648
2005 4,069 3,626,801 3,212,305 60,648,318 18.88 1,394.00 329,709
2006 4,142 3,710,319 3,256,536 63,828,106 19.60 1,510.50 347,755
2007 4,253 3,834,758 3,320,092 63,181,350 19.03 2,530.50 509,831
2008 4,283 3,947,763 3,405,983 68,732,737 20.18 2,777.50 500,817
2009 4,317 4,082,124 3,477,438 66,766,810 19.20 2,244.50 502,229
2010 4,370 4,202,381 3,565,321 64,282,738 18.03 2,701.00 446,368
2011 4,444 4,302,283 3,625,416 71,384,441 19.69 3,219.00 421,465
2012 4,518 4,385,241 3,696,902 69,834,479 18.89 2,764.00 435,763
2013 4,587 4,481,447 3,808,628 72,440,105 19.02 2,371.00 442,094
2014 4,688 4,585,227 3,902,847 72,710,040 18.63 2,383.50 451,507
137
Sumber / Source : Lembaga Minyak Sawit Malaysia / Malaysian Palm Oil Board

JADUAL 11.2 : JUMLAH KELUASAN HEKTAR TANAMAN KELAPA SAWIT, 1974 – 2014, MALAYSIATable 11.2 : Total Planted Area Hectareage of Oil Palm, 1974 – 2014, Malaysia
Tahun Keluasan BertanamYear Planted Area
Hektar/Hectare
Jumlah Keluasan Estet Kebun KecilTotal Area Estate Smallholding
1974 565,766 357,769 207,997
1975 641,791 389,756 252,035
1976 714,600 415,658 298,942
1977 781,814 444,866 336,948
1978 852,979 480,833 372,146
1979 938,863 509,292 429,571
1980 1,023,306 545,462 477,844
1981 1,121,181 599,592 521,589
1982 1,182,797 633,693 549,104
1983 1,253,040 672,499 580,541
1984 1,330,266 735,306 594,960
1985 1,482,399 766,756 715,643
1986 1,599,311 768,351 830,960
1987 1,672,875 1,534,927 137,948
1988 1,805,923 1,654,607 151,316
1989 1,946,559 1,770,972 175,587
1990 2,029,464 1,845,781 183,683
1991 2,094,028 1,906,240 187,788
1992 2,197,660 2,005,254 192,406
1993 2,305,925 2,096,480 209,445
1994 2,411,999 2,191,941 220,058
1995 2,540,087 2,298,095 241,992
1996 2,692,286 2,453,362 238,924
1997 2,893,089 2,649,802 243,287
1998 3,078,116 2,813,755 264,361
1999 3,313,393 3,026,880 286,513
2000 3,376,664 3,055,846 320,818
2001 3,499,012 3,155,670 343,342
2002 3,670,243 3,311,148 359,095
2003 3,802,040 3,414,042 387,998
2004 3,875,327 3,508,841 366,486
2005 4,051,374 3,626,801 424,573
2006 4,165,215 3,710,319 454,896
2007 4,304,913 3,834,758 470,155
2008 4,487,957 3,947,763 540,194
2009 4,691,160 4,082,124 609,036
2010 4,853,766 4,202,381 651,385
2013 5,229,739 4,481,447 748,292
2011 5,000,109 4,302,283 697,826
2012 5,076,929 4,385,241 691,688
2014 5,392,235 4,585,227 807,008
138
Sumber / Source : Lembaga Minyak Sawit Malaysia / Malaysian Palm Oil Board

KOKOCOCOA


141
KOKO
Nota Keterangan
1. Banci Tahunan Estet Koko yangdijalankan oleh Jabatan PerangkaanMalaysia bagi tahun rujukan 1968 - 1995menjadi sumber data bagi siri tanamankoko. Mulai tahun rujukan 1996,Lembaga Koko Malaysia mengambil alihtugas menjalankan Banci Tahunan EstetKoko.
2. Data bagi tahun rujukan antara 1968hingga 1977 merujuk kepada Sabahsahaja. Data bagi tahun rujukan 1978,1996 dan 1997 merujuk kepadaSemenanjung Malaysia dan Sabah,manakala bagi tahun-tahun seterusnyamerujuk kepada Malaysia.
COCOA
Explanatory Notes
1. Data for reference years 1968 - 1995were sourced from the Annual Census ofCocoa Estates conducted by Departmentof Statistics, Malaysia. Starting fromreference year 1996, the MalaysianCocoa Board was responsible forconducting the Annual Census of CocoaEstates.
2. Data for the reference years 1968 to1977 refer to Sabah only. For referenceyears 1978, 1996 and 1997 the data referto Peninsular Malaysia and Sabah only,while for the rest of the years the datarefer to Malaysia.
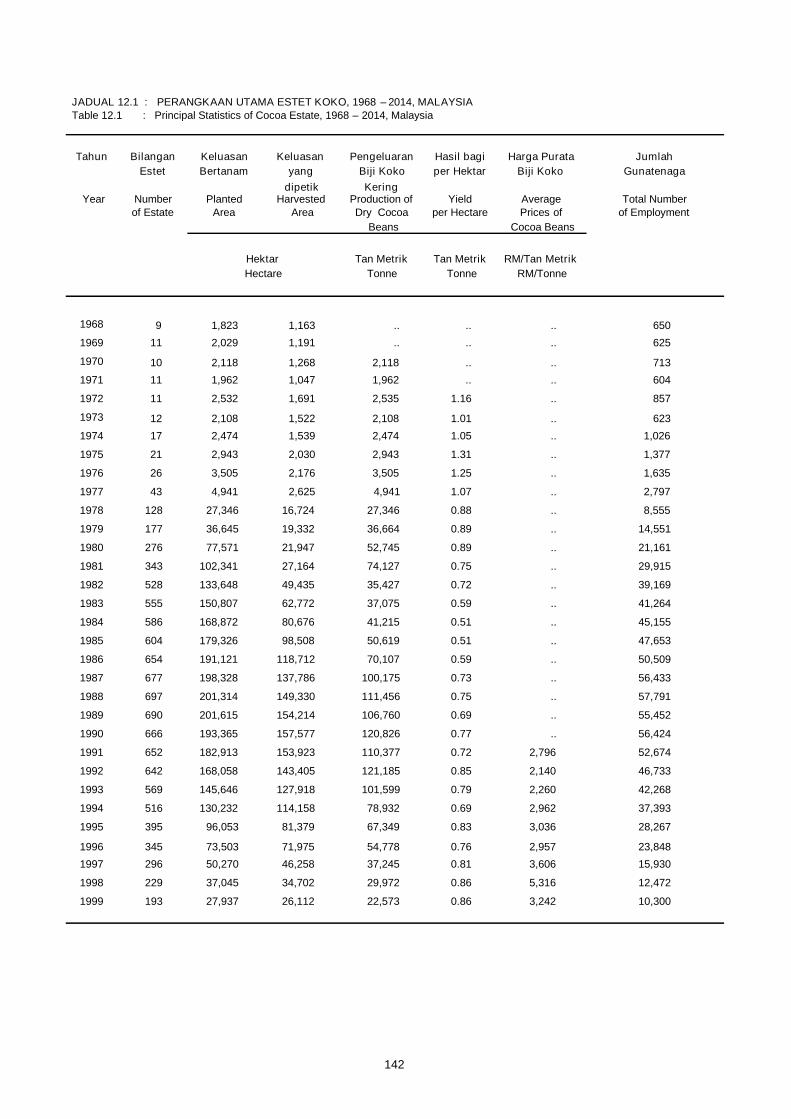
JADUAL 12.1 : PERANGKAAN UTAMA ESTET KOKO, 1968 – 2014, MALAYSIATable 12.1 : Principal Statistics of Cocoa Estate, 1968 – 2014, Malaysia
Tahun Bilangan Keluasan Keluasan Pengeluaran Hasil bagi Harga Purata JumlahEstet Bertanam yang Biji Koko per Hektar Biji Koko Gunatenaga
dipetik KeringYear Number Planted Harvested Production of Yield Average Total Number
of Estate Area Area Dry Cocoa per Hectare Prices of of EmploymentBeans Cocoa Beans
Hektar Tan Metrik Tan Metrik RM/Tan MetrikTonne Tonne RM/Tonne
1968 9 1,823 1,163 .. .. .. 650
1969 11 2,029 1,191 .. .. .. 625
1970 10 2,118 1,268 2,118 .. .. 713
1971 11 1,962 1,047 1,962 .. .. 604
1972 11 2,532 1,691 2,535 1.16 .. 857
1973 12 2,108 1,522 2,108 1.01 .. 623
1974 17 2,474 1,539 2,474 1.05 .. 1,026
1975 21 2,943 2,030 2,943 1.31 .. 1,377
1976 26 3,505 2,176 3,505 1.25 .. 1,635
1977 43 4,941 2,625 4,941 1.07 .. 2,797
1978 128 27,346 16,724 27,346 0.88 .. 8,555
1979 177 36,645 19,332 36,664 0.89 .. 14,551
1980 276 77,571 21,947 52,745 0.89 .. 21,161
1981 343 102,341 27,164 74,127 0.75 .. 29,915
1982 528 133,648 49,435 35,427 0.72 .. 39,169
1983 555 150,807 62,772 37,075 0.59 .. 41,264
1984 586 168,872 80,676 41,215 0.51 .. 45,155
1985 604 179,326 98,508 50,619 0.51 .. 47,653
1986 654 191,121 118,712 70,107 0.59 .. 50,509
1987 677 198,328 137,786 100,175 0.73 .. 56,433
1988 697 201,314 149,330 111,456 0.75 .. 57,791
1989 690 201,615 154,214 106,760 0.69 .. 55,452
1990 666 193,365 157,577 120,826 0.77 .. 56,424
1991 652 182,913 153,923 110,377 0.72 2,796 52,674
1992 642 168,058 143,405 121,185 0.85 2,140 46,733
1993 569 145,646 127,918 101,599 0.79 2,260 42,268
1994 516 130,232 114,158 78,932 0.69 2,962 37,393
1995 395 96,053 81,379 67,349 0.83 3,036 28,267
1996 345 73,503 71,975 54,778 0.76 2,957 23,848
1997 296 50,270 46,258 37,245 0.81 3,606 15,930
1998 229 37,045 34,702 29,972 0.86 5,316 12,472
1999 193 27,937 26,112 22,573 0.86 3,242 10,300
Hectare
142

JADUAL 12.1 : PERANGKAAN UTAMA ESTET KOKO, 1968 – 2014, MALAYSIA (samb.)Table 12.1 : Principal Statistics of Cocoa Estate, 1968 – 2014, Malaysia (cont’d)
Tahun Bilangan Keluasan Keluasan Pengeluaran Hasil bagi Harga Purata JumlahEstet Bertanam yang Biji Koko per Hektar Biji Koko Gunatenaga
dipetik KeringYear Number Planted Harvested Production of Yield Average Total Number
of Estate Area Area Dry Cocoa per Hectare Prices of of EmploymentBeans Cocoa Beans
Hektar Tan Metrik Tan Metrik RM/Tan MetrikTonne Tonne RM/Tonne
2000 159 22,439 20,778 16,941 0.82 2,491 7,765
2001 141 19,605 17,364 15,999 0.92 3,209 6,686
2002 134 16,201 13,903 10,203 0.73 5,311 5,640
2003 123 14,946 12,994 6,851 0.53 5,653 5,306
2004 106 11,661 10,868 6,523 0.60 4,966 4,553
2005 75 9,348 8,707 4,646 0.53 4,768 3,558
2006 57 5,895 5,219 2,238 0.43 4,652 2,264
2007 42 4,163 3,890 1,702 0.44 5,429 1,694
2008 38 3,613 2,578 814 0.32 6,976 1,142
2009 29 2,400 1,697 559 0.33 7,283 964
2010 24 1,880 1,358 462 0.34 8,133 813
2011 22 1,384 915 234 0.26 7,382 696
2012 9 749 588 81 0.14 5,896 477
Hectare
2013 8 827 608 78 0.13 6,115 463
2014 8 859 583 66 0.11 7,656 477
143
Sumber / Source : Lembaga Koko Malaysia / Malaysian Cocoa Board
Nota / Note :Jumlah gunatenaga termasuk pemilik yang bekerja, pekerja keluarga yang tidak bergaji dan rakan niaga aktifTotal number of employment include working proprietors, unpaid family workers and active business partners

144
JADUAL 12.2 : JUMLAH KELUASAN TANAMAN DAN EKSPORT KOKO, 1968 – 2014 , MALAYSIATable 12.2 : Total Planted Area and Exports of Cocoa, 1968 – 2014, Malaysia
Tahun Keluasan Bertanam Eksport Biji KokoYear Planted Area dan Produk Koko
Hektar/ Hectare Exports of Cocoa Beansand Cocoa Products
Jumlah Estet KebunKeluasan Estate KecilTotal Area Smallholding RM ('000)
1968 3,117 1,823 1,294 ..
1969 3,331 2,029 1,302 ..
1970 4,019 2,118 1,901 ..
1971 4,517 1,962 2,555 ..
1972 5,447 2,532 2,915 ..
1973 6,242 2,108 4,134 ..
1974 8,126 2,474 5,652 ..
1975 9,823 2,943 6,880 ..
1976 11,673 3,505 8,168 ..
1977 14,994 4,941 10,053 ..
1978 56,735 27,346 29,389 ..
1979 89,356 36,664 52,692 ..
1980 123,855 77,571 46,284 202,573
1981 158,784 102,341 56,443 217,935
1982 209,399 133,648 75,751 245,541
1983 231,080 150,807 80,273 286,616
1984 265,510 168,872 96,638 462,568
1985 303,897 179,326 124,571 545,665
1986 327,348 191,121 136,227 646,449
1987 370,057 198,328 171,729 866,828
1988 407,860 201,314 206,546 907,091
1989 414,236 201,615 212,621 725,465
1990 393,465 193,365 200,100 755,834
1991 398,950 182,913 216,037 719,686
1992 378,540 168,058 210,482 638,419
1993 299,995 145,646 154,349 674,355
1994 271,339 130,232 141,107 726,868
1995 190,127 96,053 94,074 628,339
1996 168,219 73,503 94,716 595,6451997 140,899 50,270 90,629 670,2801998 117,679 37,045 80,634 770,573
1999 100,803 27,937 72,866 733,345

Sumber / Source : Lembaga Koko Malaysia / Malaysian Cocoa Board
Nota / Note :(i) Bermula pada tahun 1992, perolehan eksport biji koko dan produk koko adalah termasuk kulit koko
Starting from 1992, export earnings of cocoa beans and cocoa products include cocoa shell(ii) Keluasan bertanam bagi estet koko adalah termasuk estet-estet di bawah agensi kerajaan
Planted area for cocoa estate include the estates under government agencies
JADUAL 12.2 : JUMLAH KELUASAN TANAMAN DAN EKSPORT KOKO, 1968 – 2014 , MALAYSIA (samb.)Table 12.2 : Total Planted Area and Exports of Cocoa, 1968 – 2014, Malaysia (cont’d)
Tahun Keluasan Bertanam Eksport Biji Koko
Year Planted Area dan Produk KokoHektar/ Hectare Exports of Cocoa Beans
and Cocoa Products
Jumlah Estet Kebun
Keluasan Estate Kecil
Total Area Smallholding RM ('000)
2000 75,766 22,439 53,327 596,6482001 57,963 19,605 38,358 661,5892002 48,631 16,201 32,430 906,635
2003 45,493 14,946 30,547 1,270,587
2004 42,208 11,661 30,547 1,688,440
2005 33,994 9,348 24,646 1,941,446
2006 31,740 5,895 25,845 2,078,100
2007 28,459 4,163 24,296 2,587,564
2008 21,411 3,613 17,798 3,347,388
2009 18,047 2,400 15,647 3,229,803
2010 20,083 1,880 18,203 4,189,465
2013 13,826 827 12,999 3,625,151
2011 20,848 1,384 19,464 4,215,435
2012 11,748 749 10,999 3,690,221
2014e 16,102 859 15,243 4,795,821
145


PERHUTANANFORESTRY


149
PERHUTANAN
Nota Keterangan
1. Maklumat perhutanan dan pembalakandiperoleh daripada Jabatan PerhutananSemenanjung Malaysia, JabatanPerhutanan Sabah dan Jabatan HutanSarawak. Data dari jabatan tersebutdiagregat untuk mendapatkan keluasandan pengeluaran di peringkat Malaysia.Perincian data perhutanan mengikutkawasan juga dipersembahkan secaraberasingan.
2. Pengeluaran hasil kayu utama diSemenanjung Malaysia adalah kayubalak, kayu gergaji, papan lapis, venierdan kayu kumai. Industri berasas kayumeliputi kilang papan, kilang papan lapis/venier, kilang kayu kumai dan lain-lain(kilang perabot, kilang papan blok, kilangpapan serpai, kilang papan gentiansederhana padat dan kilang papanserpih).
3. Data bilangan pekerja merujuk kepadaindustri berasas kayu sahaja.
4. Pengeluaran kayu balak di Sarawakboleh dibahagikan kepada dua kawasaniaitu hutan bukit dan hutan paya. Kuotapengeluaran balak adalah berdasarkankadar pengeluaran lestari seperti yangdisyorkan oleh pihak InternationalTropical Timber Organization (ITTO)untuk hutan simpanan kekal.
FORESTRY
Explanatory Notes
1. Statistics for forestry and logging areprovided by Forestry DepartmentPeninsular Malaysia, Sabah ForestryDepartment and Forests DepartmentSarawak. Data obtained from thesedepartments were aggregated to derivethe total area and production of logs atMalaysia level. The details on forestry byregion are also presented separately.
2. Production of major timber products inPeninsular Malaysia are saw logs, sawntimber, plywood, veneer and moulding.Major timber industries includingsawmills, plywood/veneer mills, mouldingmills and others (furniture factory, blockboard plant, chipboard plant, mediumdensity fibreboard plant and mouldedparticleboard plant).
3. Number of workers refer to onlywood-based industries.
4. Log production in Sarawak can bedivided into two areas, that is hill forestand swamp forest. Log production quotais based on sustainable production levelas recommended by the InternationalTropical Timber Organization (ITTO) forpermanent reserved forest.
150
5. Pengeluaran kayu balak di Sabahmeliputi pengeluaran hutan asli dan kayutanaman. Industri berasas kayu di Sabahmeliputi kilang papan, kilang papan lapis,kilang kayu kumai, kilang perabot, kilangpapan blok, kilang papan serpai, kilangpapan gentian sederhana padat dankilang papan serpih. Penurunanpengeluaran kayu balak mulai 1989adalah disebabkan oleh PelaksanaanPengurusan Hutan Berkekalan denganpemeterian Perjanjian Lesen PengurusanHutan Berkekalan (SFMLA) pada tahun1997 dan pengurangan lesen–lesenjangka pendek secara berperingkat.
5. Production of logs in Sabah coversnatural forest and forest plantation. Majortimber industries in Sabah includingsawmills, plywood/veneer mills, mouldingplant, furniture factory, block board plant,chipboard plant, medium densityfibreboard plant and mouldedparticleboard plant. The decline in logproduction since 1989 was attributed tothe implementation of Sustainable ForestManagement Licence Agreement(SFMLA) in 1997 and the phasing out ofshort–term licences.

151
JADUAL 13.1 : PERANGKAAN UTAMA PERHUTANAN DAN PEMBALAKAN, 1947 – 2014, MALAYSIATable 13.1 : Principal Statistics of Forestry and Logging, 1947 – 2014, Malaysia
Tahun Keluasan Hutan Pengeluaran Kayu Balak Bilangan PekerjaYear Forest Area Production of Logs dalam Industri
Berasas Kayu
('000) ('000) Number of Workers in theHektar/Hectare Meter Padu /Cubic Metre Wood-Based Industries
1947 7,222 138 ..
1948 17,136 402 299
1949 17,098 484 306
1950 16,978 452 359
1951 16,939 524 300
1952 16,937 548 174
1953 16,874 736 2301954 16,903 1,074 7,062
1955 16,778 1,286 8,056
1956 16,450 1,524 7,828
1957 16,104 1,920 ..
1958 16,061 2,308 7,2821959 16,080 3,124 7,6561960 15,915 4,413 8,6091961 15,414 4,838 8,7341962 15,263 5,103 ..
1963 12,180 6,152 9,964
1964 15,065 8,405 9,8421965 14,992 9,697 10,5721966 14,538 12,344 ..1967 14,553 13,527 ..1968 14,428 15,213 ..
1969 14,395 15,777 15,670
1970 14,369 17,791 19,477
1971 14,235 18,230 22,9161972 13,947 20,616 27,236
1973 13,810 24,063 29,262
1974 13,679 21,371 50,171
1975 12,828 19,163 48,7551976 12,737 26,597 58,8391977 12,485 27,582 73,7981978 12,276 28,684 59,4061979 11,802 28,760 5,681
1980 11,717 27,914 16,175
1981 11,306 30,654 16,2521982 11,200 32,823 17,1591983 11,268 32,794 17,6061984 11,118 31,088 18,2341985 11,130 30,956 14,472
1986 11,192 29,172 15,366
1987 19,794 35,251 16,1591988 19,707 36,486 19,146
1989 19,706 40,812 88,836
1990 19,618 40,100 104,118

152
JADUAL 13.1 : PERANGKAAN UTAMA PERHUTANAN DAN PEMBALAKAN, 1947 – 2014, MALAYSIA (samb.)Table 13.1 : Principal Statistics of Forestry and Logging, 1947 – 2014, Malaysia (cont’d)
Tahun Keluasan Hutan Pengeluaran Kayu Balak Bilangan PekerjaYear Forest Area Production of Logs dalam Industri
Berasas Kayu('000) ('000) Number of Workers in the
Hektar/Hectare Meter Padu /Cubic Metre Wood-Based Industries
1991 19,441 39,859 122,253
1992 19,296 43,510 129,371
1993 19,169 37,260 153,781
1994 18,974 35,671 176,332
1995 18,903 31,641 184,325
1996 18,785 30,140 194,410
1997 18,794 31,161 209,786
1998 18,702 21,672 182,454
1999 18,716 21,887 179,167
2000 18,699 23,073 168,296
2001 18,459 18,922 157,837
2002 18,411 20,649 118,303
2003 18,380 21,531 121,168
2004 18,338 22,039 133,509
2005 18,313 22,399 137,966
2006 18,304 21,740 128,349
2007 18,226 22,053 126,884
2008 18,209 20,083 137,367
2013 18,124 14,400 120,472
2009 18,244 18,310 117,837
2010 18,261 17,805 153,639
2011 18,148 16,000 143,927
2012 18,092 15,898 139,075
2014p 18,089 14,908 129,757
Nota / Notes :
(i) Data yang hanya meliputi Semenanjung Malaysia dan Sabah sahaja / Data which only includes Peninsular Malaysia and Sabah
- Keluasan hutan / Forest area (1947 – 1986)- Pengeluaran kayu balak / Production of logs (1947 – 1963)
(ii) Data yang meliputi Semenanjung Malaysia sahaja / Data which includes only Peninsular Malaysia
- Bilangan pekerja dalam industri berasas kayu / Number of workers in wood-based industries (1947 – 1975)
(iii) Data yang hanya meliputi Semenanjung Malaysia dan Sarawak / Data which include only Peninsular Malaysia and Sarawak
- Bilangan pekerja dalam industri berasas kayu / Number of workers in wood-based industries (1976 – 1979)

PERIKANANFISHING


155
PERIKANAN
Nota Keterangan
1. Perangkaan perikanan yang diterbitkandiperoleh daripada Jabatan PerikananMalaysia, meliputi bilangan nelayan,pendaratan perikanan tangkapan marin,pengeluaran akuakultur dan perikanandarat.
2. Sektor perikanan dikategorikan kepadapendaratan perikanan tangkapan marin,pengeluaran akuakultur dan perikanandarat.
3. Nilai pendaratan ikan marin adalahbergantung kepada gred dan spesiesikan berasaskan harga borong pasaranpada tahun berkenaan.
4. Akuakultur didefinisikan sebagaisebarang kegiatan atau aktivitimenghasilkan benih, mengasuh benihdan ternakan untuk pembesaran ikandan kerang-kerangan. Aktiviti akuakulturmerangkumi air tawar dan air payau/marin.
5. Perikanan darat adalah pengeluaran ikandaripada perairan umum seperti sungai,tasik, bekas lombong, empangan danlain-lain perairan umum air tawar.
FISHERIES
Explanatory Notes
1. Fisheries statistics published areobtained from the Department ofFisheries Malaysia, covering the numberof fishermen, landings of marine capturefisheries, aquaculture production andinland fisheries.
2. The fisheries sector is categorised intothe landings of marine capture fisheries,aquaculture production and inlandfisheries.
3. The value of marine fish landing dependson the grade and species of fish and isbased on the prevailing wholesale marketprices.
4. Aquaculture is defined as any activity offish seed production, nurturing of seedand farming for the purpose of rising offish and shellfish. Aquaculture activityincludes freshwater and brackish water/marine.
5. In-land fisheries production cover publicwater bodies such as river, lake,ex-mining pools, dam and otherfreshwater public water bodies.

156
Sumber / Source : Jabatan Perikanan Malaysia / Department of Fisheries Malaysia
JADUAL 14.1 : PERANGKAAN UTAMA PENDARATAN IKAN MARIN, PENGELUARAN AKUAKULTUR DAN PERIKANAN DARATSERTA NILAI, 1988 – 2014, MALAYSIA
Table 14.1 : Principal Statistics of Marine Fish Landing, Aquaculture and Inland Fishery Production and Value, 1988 – 2014, Malaysia
Tahun Bilangan Pendaratan Ikan Marin Pengeluaran Akuakultur Pengeluaran Perikanan DaratYear Nelayan Marine Fish Landing Aquaculture Production Inland Fishery Production
Number of Tan Metrik Nilai Tan Nilai Tan NilaiFishermen Tonne Value Tonne Value Tonne Value
RM ('000) RM ('000) RM ('000)
1988 88,963 825,631 1,375,869 46,958 89,627 .. ..
1989 93,545 882,492 1,665,821 53,119 118,207 .. ..
1990 88,494 951,307 1,960,595 52,303 132,779 .. ..
1991 84,862 911,933 1,852,926 64,844 165,154 .. ..
1992 85,085 1,023,516 2,379,956 79,699 207,363 .. ..
1993 80,278 1,047,350 2,378,613 105,237 292,430 .. ..
1994 79,802 1,065,585 2,584,295 114,114 365,042 .. ..
1995 82,200 1,108,436 2,710,906 132,742 392,670 .. ..
1996 79,616 1,126,689 3,322,157 109,062 462,402 .. ..
1997 78,989 1,168,973 3,675,231 107,984 609,039 .. ..
1998 81,547 1,215,206 3,817,223 133,647 654,295 .. ..
1999 83,952 1,248,402 4,143,274 166,974 775,085 .. ..
2000 81,994 1,285,696 4,399,239 167,894 970,323 .. ..
2001 84,496 1,231,289 4,166,113 177,019 1,206,589 .. ..
2002 82,603 1,272,078 4,206,804 191,843 1,081,285 .. ..
2003 89,433 1,283,256 4,013,620 196,873 1,172,310 .. ..
2004 89,453 1,331,645 4,191,706 202,225 1,158,465 .. ..
2005 90,702 1,209,601 4,017,520 207,220 1,196,006 .. ..
2006 97,947 1,371,733 4,916,688 212,027 1,291,748 .. ..
2007 99,617 1,381,424 5,039,916 268,514 1,393,350 .. ..
2008 109,771 1,394,531 5,627,136 354,428 1,740,045 4,097 39,121
2009 125,632 1,393,226 6,322,572 453,860 2,268,744 4,468 39,270
2010 129,622 1,428,881 6,651,886 581,048 2,798,740 4,605 44,670
2011 134,110 1,373,105 6,939,469 526,507 2,505,370 5,694 54,828
2012 136,514 1,472,240 7,981,663 634,376 2,758,100 5,042 56,780
2013 144,019 1,482,900 8,335,915 530,025 2,688,714 5,640 63,405
2014 143,421 1,458,128 8,785,389 520,515 3,475,207 6,520 75,130

PERLOMBONGAN &PENGKUARIAN BATU
MINING & STONE QUARRYING


159
A) PERLOMBONGAN
Nota Keterangan
1. Data bagi sektor ini merangkumiperlombongan bijih besi, bijih timah,batu arang, pembilasan amang, bauksit,antimoni, emas, tembaga, barit,petroleum dan gas asli.
2. Data bagi perlombongan antimoni muladiambil kira sejak tahun 1981, manakaladata bagi perlombongan tembaga,perlombongan petroleum dan gas aslimula diambil kira sejak tahun 1983.
3. Sumber utama data adalah BanciTahunan Industri Perlombongan telahdimulakan pada tahun rujukan 1963.Sejak itu, banci dijalankan seperti biasakecuali bagi tahun rujukan 1980, 1982,1994, 1996 dan 1998. Bagi tahun 2001hingga 2004, 2006 hingga 2009 dan2011 hingga 2013, data hanya merujukkepada Banci Industri PerlombonganMinyak Mentah dan Gas Asli Tahunansahaja.
A) MINING
Explanatory Notes
1. Data on this sector include mining of ironore, tin ore, coal, amang retreatment,bauxite, antimony, gold, copper, barite,petroleum and natural gas.
2. Data on antimony mining was includedsince reference year 1981, while data oncopper mining, petroleum and natural gasmining were included since referenceyear 1983.
3. The main source of data is the AnnualCensus of Mining Industries which wasfirst conducted for reference year 1963.Since then, the census has been takenon a regular basis except for referenceyears 1980, 1982, 1994, 1996 and 1998.In 2001 to 2004, 2006 to 2009 and 2011to 2013, data only refer to the AnnualCensus of Crude Oil and Natural GasMining Industries.

160
B) PENGKUARIAN BATU
Nota Keterangan
Data diperoleh daripada BanciPengkuarian Batu. Banci yang pertamatelah mula dijalankan pada tahun rujukan1972. Data bagi tahun rujukan 1973merujuk kepada Semenanjung Malaysiasahaja. Walau bagaimanapun, banci tidakdijalankan bagi tahun rujukan 1980, 1982,1994, 1996, 1997, 1999 dan 2001 hingga2004 dan 2006 hingga 2009.
B) STONE QUARRYING
Explanatory Notes
Data was compiled from the AnnualCensus of Stone Quarrying Industries.The first census was carried out forreference year 1972. Data for referenceyear 1973 refers to Peninsular Malaysiaonly. However, there was no censuscarried out for reference years 1980,1982, 1994, 1996, 1997, 1999 and from2001 until 2004 and 2006 until 2009.

JADUAL 15.1 : PERANGKAAN UTAMA INDUSTRI PERLOMBONGAN, 1963 – 2013, MALAYSIATable 15.1 : Principal Statistics of Mining Industries, 1963 – 2013, Malaysia
Tahun Nilai Nilai input Nilai Jumlah pekerja Gaji & upah Nilai hartaYear output perantaraan ditambah pada bulan yang dibayar tetap yang
kasar Value of Value added Disember atau Salaries & dimiliki padaValue intermediate pada tempoh wages paid akhir tahun
of gross input gaji terakhir Value ofoutput Total number of fixed assets
person engaged owned as atduring December or end of the yearthe last pay period RM ('000)
1963 504,997 68,982 436,015 39,492 118,862 ..
1964 662,055 89,141 572,914 51,601 116,203 ..
1965 763,237 122,136 641,101 60,791 104,757 ..
1966 731,087 137,436 593,651 62,791 118,153 ..
1967 704,505 148,618 555,887 61,063 123,045 ..
1968 674,196 212,814 461,382 58,773 161,239 ..
1969 713,613 218,237 495,376 56,319 158,572 ..
1970 760,530 218,086 542,444 64,686 145,463 311,571
1971 672,029 218,390 453,639 63,257 133,754 280,995
1972 667,143 227,164 439,979 59,763 130,862 293,262
1973 686,943 213,936 473,007 54,608 129,516 291,558
1974 987,512 315,345 672,167 56,302 152,185 317,058
1975 836,914 337,282 499,632 49,810 153,727 400,506
1976 1,013,901 354,844 659,057 46,527 150,145 379,568
1977 1,074,873 405,387 669,486 46,596 157,991 429,025
1978 1,289,257 483,591 805,666 49,650 193,143 444,479
1979 1,462,751 548,374 914,377 48,534 216,940 477,037
1980 .. .. .. .. .. ..
1981 8,727,076 1,031,389 7,695,687 45,005 410,802 3,659,544
1982 .. .. .. .. .. ..
1983 9,525,516 1,231,911 8,293,605 36,444 427,641 4,985,360
1984 11,300,852 1,227,267 10,073,585 33,965 536,635 5,974,102
1985 11,332,988 1,039,294 10,293,694 31,075 519,581 5,929,646
1986 8,092,078 741,525 7,350,553 23,191 483,347 5,335,298
1987 9,728,968 693,091 9,035,877 20,843 473,410 6,207,373
RM ('000) RM ('000) RM ('000) RM ('000)
1990 15,570,702 2,159,457 13,411,245 23,283 543,705 8,154,241
1988 9,876,234 1,286,905 8,589,329 21,972 461,394 6,426,766
1989 12,008,912 1,737,095 10,271,817 24,435 500,261 6,889,936
161

JADUAL 15.1 : PERANGKAAN UTAMA INDUSTRI PERLOMBONGAN, 1963 – 2013, MALAYSIA (samb.)Table 15.1 : Principal Statistics of Mining Industries, 1963 – 2013, Malaysia (cont'd)
Tahun Nilai Nilai input Nilai Jumlah pekerja Gaji & upah Nilai hartaYear output perantaraan ditambah pada bulan yang dibayar tetap yang
kasar Value of Value added Disember atau Salaries & dimiliki padaValue intermediate pada tempoh wages paid akhir tahun
of gross input gaji terakhir Value ofoutput Total number of fixed assets
person engaged owned as atduring December or end of the year
RM ('000) RM ('000) RM ('000) the last pay period RM ('000) RM ('000)
1991 15,509,457 2,186,625 13,322,832 18,548 555,303 10,715,232
1992 14,340,019 2,386,104 11,953,915 18,228 613,565 11,791,559
1993 12,733,651 2,175,618 10,558,033 15,781 687,926 9,590,919
1994 .. .. .. .. .. ..
1995 15,193,397 1,862,283 13,331,114 12,326 623,609 8,377,135
1996 .. .. .. .. .. ..
1997 19,531,412 1,687,171 17,844,241 10,792 627,305 13,908,404
1998 .. .. .. .. .. ..
1999 25,355,915 1,923,768 23,432,147 12,652 726,846 14,855,293
2000 38,922,691 2,522,746 36,399,945 9,646 674,195 13,057,237
2001 34,818,902 2,454,945 32,363,957 8,895 773,115 14,029,697
2002 37,235,959 3,134,615 34,101,344 9,563 883,895 17,012,546
2003 46,892,044 4,123,468 42,768,576 9,663 953,632 18,794,926
2004 61,569,636 4,353,365 57,549,271 7,427 789,507 29,339,044
2005 B 80,387,144 4,743,501 75,643,643 10,435 1,003,211 29,933,448
2006 92,121,516 6,267,971 85,853,545 9,008 1,258,548 35,985,346
2007 98,676,787 6,854,182 91,822,605 9,649 1,667,965 52,748,745
2008 130,361,614 7,642,099 122,719,515 10,458 1,969,296 76,276,198
2009 91,215,729 7,987,974 83,227,755 12,184 2,372,613 93,785,495
2010 B 99,649,828 12,041,905 87,607,923 17,873 2,653,127 141,826,335
2011 109,193,006 16,126,193 93,066,813 13,304 2,811,577 146,523,251
2013 115,096,165 16,788,570 98,307,595 16,355 4,157,081 185,537,666
2012 109,369,827 14,928,202 94,441,625 15,015 3,691,828 159,076,312
162
Nota / Note :B = merujuk kepada tahun Banci dan data merangkumi Banci Ekonomi Perlombongan (perlombongan mineral selainminyak mentah dan gas asli) dan Banci Perlombongan Minyak Mentah dan Gas Asli TahunanData refers to Census year and data includes Economic Census of Mining (other minerals mining exclude crude oil andnatural gas) and Annual Census of Crude Oil and Natural Gas

JADUAL 15.2 : IMPORT DAN EKSPORT PETROLEUM MENTAH, 1963 – 2013, MALAYSIATable 15.2 : Imports and Exports of Crude Petroleum, 1963 – 2013, Malaysia
Tahun Petroleum Mentah
Year Crude Petroleum
Import Eksport*
Imports Exports
'000 Tan Metrik
'000 Tonne
1963 604 ..
1964 2,190 ..
1965 2,261 ..
1966 2,687 ..
1967 7,433 2,184
1968 8,745 2,899
1969 9,018 3,044
1970 9,121 3,641
1971 8,715 6,522
1972 3,838 3,137
1973 3,256 2,884
1974 2,826 2,327
1975 2,807 3,240
1976 3,239 6,417
1977 3,771 7,354
1978 4,225 9,153
1979 4,426 12,034
1980 3,961 11,227
1981 3,552 10,143
1982 2,540 11,974
1983 3,701 14,224
1984 2,553 16,497
1985 2,252 16,701
1986 1,933 18,792
1987 1,563 17,999
1988 1,509 19,899
1989 1,019 21,323
1990 1,004 22,110
163

JADUAL 15.2 : IMPORT DAN EKSPORT PETROLEUM MENTAH, 1963 – 2013, MALAYSIA (samb.)Table 15.2 : Imports and Exports of Crude Petroleum, 1963 – 2013, Malaysia (cont’d)
Tahun Petroleum Mentah
Year Crude Petroleum
Import Eksport*
Imports Exports
'000 Tan Metrik
'000 Tonne
1991 1,084 22,595
1992 1,138 22,526
1993 1,672 21,019
1994 1,538 19,061
1995 1,271 19,165
1996 1,397 17,495
1997 1,256 15,872
1998 1,929 18,071
1999 3,247 17,725
2000 6,963 16,672
2001 8,559 15,118
2002 6,845 16,192
2003 7,991 17,913
2004 7,888 18,295
2005 9,145 18,390
2006 10,322 16,875
2007 10,529 16,880
2008 9,228 16,763
2009 8,917 16,412
2010 9,067 16,373
2011 9,687 12,682
2012 10,854 11,863
2013 8,931 11,819
164
Nota / Note : * Termasuk eksport semula / Including re-export

JADUAL 15.3 : PERANGKAAN UTAMA PENGKUARIAN BATU, 1972 – 2010, MALAYSIATable 15.3 : Principal Statistics of Stone Quarrying, 1972 – 2010, Malaysia
Tahun Nilai Nilai input Nilai Jumlah pekerja Gaji & upah Nilai hartaYear output perantaraan ditambah pada bulan yang dibayar tetap yang
kasar Value of Value added Disember atau Salaries & dimiliki padaValue intermediate pada tempoh wages paid akhir tahun
of gross input gaji terakhir Value ofoutput Total number of fixed assets
person engaged owned as atduring December or end of the year
RM ('000) RM ('000) RM ('000) the last pay period RM ('000) RM ('000)
1972 61,970 25,705 36,265 5,866 17,199 31,912
1973 69,656 30,774 38,882 5,743 17,013 37,005
1974 105,968 47,779 58,189 7,956 24,817 65,669
1975 138,699 57,108 81,591 8,198 28,584 94,456
1976 162,199 75,719 86,480 8,634 31,376 103,947
1977 166,582 76,293 90,289 8,335 33,614 110,055
1978 205,932 93,337 112,595 8,313 37,695 129,737
1979 255,477 121,182 134,295 8,987 45,031 137,517
1980 .. .. .. .. .. ..
1981 409,865 .. .. 9,264 63,814 177,476
1982 .. .. .. .. .. ..
1983 492,692 222,864 269,828 10,140 78,455 224,634
1984 552,977 .. .. 10,500 90,529 241,887
1985 508,664 224,017 284,647 9,993 88,930 254,084
1986 420,175 178,693 241,482 8,901 78,282 225,388
1987 347,666 221,191 126,475 7,971 69,114 200,695
1988 354,978 219,653 135,325 8,201 70,721 173,391
1989 458,354 278,194 180,160 9,370 84,901 176,834
1990 614,600 371,952 242,648 9,939 100,983 247,969
1991 726,289 426,006 300,283 11,009 122,448 303,212
1992 959,205 564,426 394,779 11,854 147,762 431,723
1993 1,040,786 598,490 442,296 12,068 160,221 483,800
1994 .. .. .. .. .. ..
1995 1,259,561 751,064 508,497 13,675 206,248 730,840
1996 .. .. .. .. .. ..
1997 .. .. .. .. .. ..
1998 1,354,807 809,201 545,606 13,507 232,253 1,106,752
1999 .. .. .. .. .. ..
2000 1,284,662 746,421 538,241 11,608 210,353 1,198,608
2001 .. .. .. .. .. ..
2002 .. .. .. .. .. ..
2003 .. .. .. .. .. ..
2004 .. .. .. .. .. ..
2005B 1,540,119 919,243 620,876 9,420 203,158 947,327
2006 .. .. .. .. .. ..
2007 .. .. .. .. .. ..
2008 .. .. .. .. .. ..
2009 .. .. .. .. .. ..
2010B 2,967,713 1,878,415 1,089,298 14,343 344,686 1,182,713
165
Nota / Note :B = merujuk kepada tahun Banci / refers to Census year


PEMBUATANMANUFACTURING


169
PEMBUATAN
Nota Keterangan
1. Data sektor pembuatan diperoleh daripadapenyiasatan dan banci bagi industripembuatan. Banci pertama telahdilaksanakan bagi tahun rujukan 1959manakala penyiasatan pertama dijalankanbagi tahun rujukan 1960. Banci seterusnyadijalankan pada tahun 1963, 1968, 1973,1981, 1993, 2000, 2005 dan 2010.
2. Bagi tempoh antara banci, penyiasatantelah dilaksanakan secara tahunan kecualitahun 1980, 1998 dan 2011. Kaedahpensampelan mula digunakan dalampenyiasatan pembuatan bermula daritahun 1995. Liputan penyiasatanmenggunakan pensampelan berstratasatu peringkat dengan pemboleh ubahyang digunakan terdiri dari pekerja, nilaijualan dan output kasar mengikutkesesuaian pada tahun pensampelan. Unitpensampelan adalah pada peringkatpertubuhan dengan liputan penuh MSIC diperingkat 5 digit.
3. Data bagi tahun 1959 hingga 1979merujuk kepada Semenanjung Malaysiamanakala data bagi tahun-tahun lainmerujuk kepada Malaysia.
4. Data bagi nilai output kasar untuk tahun1959 hingga 1978 merujuk kepada nilaijualan kasar manakala data bagi kos inputmerujuk kepada nilai bagi bahan-bahanyang dibeli. Bagi tahun 2005, inputperantaraan termasuk bayaran terhadapperkhidmatan bukan perindustrian.
5. Data pekerja bagi tahun 1959 hingga 1969merujuk kepada pekerja bergaji manakaladata bagi tahun 1970 hingga 2012merujuk kepada jumlah pekerja.
MANUFACTURING
Explanatory Notes
1. Data on the manufacturing sector arecollected from surveys and censuses ofmanufacturing industries. The first censuswas conducted for reference year 1959,while the first survey was for referenceyear 1960. Subsequent censuses werecarried out in 1963, 1968, 1973, 1981,1993, 2000, 2005 and 2010.
2. During the intercensal years, surveyswere canvassed annually except for year1980, 1998 and 2011. The samplingmethod has been used in manufacturingsurvey since 1995. The survey coverageuses a single-stage stratified with thevariables that consist of employment,sales value and gross output asaccordingly in the sampling year.The sampling unit is at the establishmentlevel with full coverage of MSIC at the 5digit level.
3. Data for years 1959 to 1979 refer toPeninsular Malaysia while data for theother years refer to Malaysia.
4. Data on value of gross output for years1959 to 1978 refer to gross value of sales,while data on cost of input refer to thevalue of materials purchased. For year2005, value of intermediate input includespayments for non-industrial services.
5. Employment data for year 1959 to 1969refer to paid employees while data foryears 1970 to 2012 refer to totalemployment.

170
6. Mulai tahun rujukan 2009, Penyiasatan/Banci telah menggunakan PiawaianKlasifikasi Industri Malaysia 2008(MSIC 2008 Ver. 1.0) bagi menggantikanPiawaian Klasifikasi Industri Malaysia2000 (MSIC 2000).
6. Starting from reference year 2009, Survey/Census have used Malaysia StandardIndustrial Classification 2008 (MSIC 2008Ver. 1.0) to replace the Malaysia StandardIndustrial Classification 2000 (MSIC2000).

JADUAL 16.1 : PERANGKAAN UTAMA INDUSTRI PEMBUATAN, 1959 – 2012, MALAYSIATable 16.1 : Principal Statistics of Manufacturing Industries, 1959 – 2012, Malaysia
Tahun Nilai Nilai Input Nilai Jumlah Pekerja Gaji & Upah Nilai HartaYear Output Perantaraan Ditambah Pada Bulan Disember yang Dibayar Tetap Yang
Kasar Value of Value Added Atau Salaries & Dimiliki PadaValue of Intermediate Pada Tempoh Wages Paid Akhir Tahun
Gross Output Input Gaji Akhir Value of Fixed AssetsTotal Number of Persons Owned As At The
Engaged During End of The YearDecember or
RM The Last Pay Period(Juta/ Million) (Juta/ Million) (Juta/ Million) (Juta/ Million) (Juta/ Million)
1959 B 1,218 1,013 234 60,570 91 ..
1960 1,210 1,008 211 45,141 77 ..
1961 1,055 863 221 47,525 83 ..
1962 1,183 945 262 54,420 95 ..
1963 B 1,689 1,302 420 87,450 154 ..
1964 1,700 1,334 402 67,562 132 ..
1965 1,955 1,483 501 89,886 183 ..
1966 2,176 1,643 576 79,668 167 ..
1967 2,302 1,691 709 92,289 201 ..
1968 B 3,079 2,294 953 130,257 267 ..
1969 3,280 2,359 1,081 121,652 261 ..
1970 3,937 2,755 1,277 157,692 324 ..
1971 4,164 2,898 1,358 173,749 363 ..
1972 5,120 3,595 1,621 206,145 474 1,659
1973 B 7,678 5,351 2,476 297,934 587 2,295
1974 10,113 7,354 2,923 281,241 725 3,026
1975 10,733 7,708 3,181 289,154 810 3,576
1976 13,625 9,944 3,873 326,980 1,011 4,382
1977 15,725 11,289 4,635 349,444 1,178 4,782
1978 18,548 13,246 5,550 377,718 1,359 5,195
1979 24,671 17,928 7,051 418,010 1,685 5,974
1980 .. .. .. .. .. ..
1981 B 36,454 27,054 9,490 578,682 2,817 10,437
1982 37,627 28,244 9,383 520,914 3,009 11,634
1983 41,474 30,887 10,587 493,158 3,177 15,792
1984 46,256 33,954 12,301 498,952 3,509 18,199
1985 45,586 33,470 12,115 476,260 3,622 21,386
1986 42,427 30,272 12,155 478,920 3,632 21,383
RMRM RM RM
171

172
JADUAL 16.1 : PERANGKAAN UTAMA INDUSTRI PEMBUATAN, 1959 – 2012, MALAYSIA (samb.)Table 16.1 : Principal Statistics of Manufacturing Industries, 1959 – 2012, Malaysia (cont'd.)
Tahun Nilai Nilai Input Nilai Jumlah Pekerja Gaji & Upah Nilai HartaYear Output Perantaraan Ditambah Pada Bulan Disember yang Dibayar Tetap Yang
Kasar Value of Value Added Atau Salaries & Dimiliki PadaValue of Intermediate Pada Tempoh Wages Paid Akhir Tahun
Gross Output Input Gaji Akhir Value of Fixed AssetsTotal Number of Persons Owned As At The
Engaged During End of The YearDecember or
RM The Last Pay Period(Juta/ Million) (Juta/ Million) (Juta/ Million) (Juta/ Million) (Juta/ Million)
1987 50,700 37,383 13,317 517,773 3,872 23,032
1988 65,196 48,938 16,259 598,578 4,426 24,752
1989 80,802 60,211 20,591 698,060 5,258 27,216
1990 95,814 71,284 24,530 844,733 6,674 35,463
1991 120,298 89,158 31,140 976,937 8,411 45,944
1992 134,150 99,050 35,099 1,034,084 9,830 56,404
1993 B 164,974 120,767 44,207 1,266,727 12,397 69,445
1993 156,712 114,787 41,925 1,150,957 11,688 67,449
1994 196,912 147,380 49,532 1,225,396 13,603 80,777
1995 246,923 187,294 59,629 1,389,418 16,466 98,749
1996 273,439 201,901 71,538 1,448,771 19,171 112,831
1997 297,130 217,957 79,173 1,411,447 20,500 127,855
1998 .. .. .. .. .. ..
1999 361,389 273,599 87,790 1,358,176 21,443 143,879
2000 B 438,485 350,244 88,241 1,574,797 26,123 164,077
2001 393,720 316,102 77,618 1,392,172 24,571 160,095
2002 455,240 364,762 90,478 1,489,056 27,214 176,999
2003 513,624 413,556 100,068 1,502,928 28,137 183,597
2004 597,009 483,983 113,026 1,542,542 30,259 184,838
2005 B 655,520 537,310 118,210 1,675,163 32,767 190,914
2006 710,238 580,370 129,868 1,721,433 34,910 193,383
2007 742,922 600,793 142,129 1,800,353 38,379 182,632
2008 817,710 660,539 157,170 1,771,331 40,298 201,509
RM RMRM RM
2010 B 836,494 665,821 170,673 1,812,360 43,745 210,406
2009 730,043 591,562 138,481 1,693,154 39,397 195,870
2011 .. .. .. .. .. ..
2012 908,067 703,834 204,233 1,998,075 50,320 204,924
B = Banci / Census

ELEKTRIKELECTRICITY


175
ELEKTRIK
Nota Keterangan
1. Data yang diterbitkan menunjukkanjumlah penjanaan elektrik didalamnegara. Jumlah bekalan ditunjukkansecara berasingan bagi pemasanganperbadanan awam iaitu Tenaga NasionalBerhad (TNB), Sabah Electricity Sdn.Bhd. (SESB) dan Sarawak Energy Bhd(SEB) dan juga pemasangan swasta.
2. Sumber data tenaga elektrik diperolehdaripada TNB, SESB, SEB danpengeluar tenaga bebas.
ELECTRICITY
Explanatory Notes
1. The published data refer to totalelectricity generated in the country. Totalsupply is shown separately for publiccorporations which are Tenaga NasionalBerhad (TNB), Sabah Electricity Sdn.Bhd. (SESB) and Sarawak Energy Bhd(SEB) and also private installations.
2. Data are sourced from TNB, SESB, SEBand independent power producers.

176
Table 17.1 : Electricity Generated, 1955 – 2013, Malaysia(Juta/ Million) KWH
Jenis 1955 1956 1957 1958 1959 1960 1961Type
1. Pemasangan AwamPublic Installations
a. Stesen Wap 567 604 680 576 609 862 985Steam Stations
b. Stesen Diesel 61 80 77 81 86 92 99Diesel Stations
c. Stesen Hidro 199 202 213 171 165 166 185Hydro Stations
d. Turbin Gas .. .. .. .. .. .. ..Gas Turbines
e. Lain-lain .. .. .. .. .. .. ..Others
JumlahTotal 827 886 970 828 860 1,120 1,269
2. Pemasangan SwastaPrivate Installations
a. Stesen Wap 44 35 21 3 .. .. ..Steam Stations
b. Stesen Diesel 41 45 43 34 33 40 46Diesel Stations
c. Stesen Hidro 36 36 36 29 26 29 30Hydro Stations
d. Turbin Gas .. .. .. .. .. .. ..Gas Turbines
e. Lain-lain .. .. .. .. .. .. ..Others
JumlahTotal 121 116 100 66 59 69 76
3. Jumlah Mengikut JenisTotal by Type
a. Stesen Wap 611 639 701 579 609 862 985Steam Stations
b. Stesen Diesel 102 125 120 115 119 132 145Diesel Stations
c. Stesen Hidro 235 238 249 200 191 195 215Hydro Stations
d. Turbin Gas .. .. .. .. .. .. ..Gas Turbines
e. Lain-lain .. .. .. .. .. .. ..Others
JUMLAHTOTAL 948 1,002 1,070 894 919 1,189 1,345
JADUAL 17.1 : ELEKTRIK YANG DIJANAKAN, 1955 – 2013, MALAYSIA

177
JADUAL 17.1 : ELEKTRIK YANG DIJANAKAN, 1955 – 2013, MALAYSIA (samb.)
(Juta/ Million) KWH
1962 1963 1964 1965 1966 1967 1968 1969 1970 1971
1,076 1,109 1,078 1,304 1,458 1,713 1,951 1,878 1,944 2,347
115 136 153 156 148 112 82 92 113 339
209 299 531 575 677 711 790 1,000 1,189 1,033
.. .. .. .. .. .. .. .. .. ..
.. .. .. .. .. .. .. .. .. ..
1,400 1,544 1,762 2,035 2,283 2,536 2,823 2,970 3,246 3,719
.. .. .. .. .. .. .. .. .. ..
48 60 79 81 89 92 83 84 88 54
26 18 12 12 15 15 15 14 13 13
.. .. .. .. .. .. .. .. .. ..
.. .. .. .. .. .. .. .. .. ..
74 78 91 93 104 107 98 98 101 67
1,076 1,109 1,078 1,304 1,458 1,713 1,951 1,878 1,944 2,347
163 196 232 237 237 204 165 176 201 393
235 317 543 587 692 726 805 1,014 1,202 1,046
.. .. .. .. .. .. .. .. .. ..
.. .. .. .. .. .. .. .. .. ..
1,474 1,622 1,853 2,128 2,387 2,643 2,921 3,068 3,347 3,786
Table 17.1 : Electricity Generated, 1955 – 2013, Malaysia (cont’d)
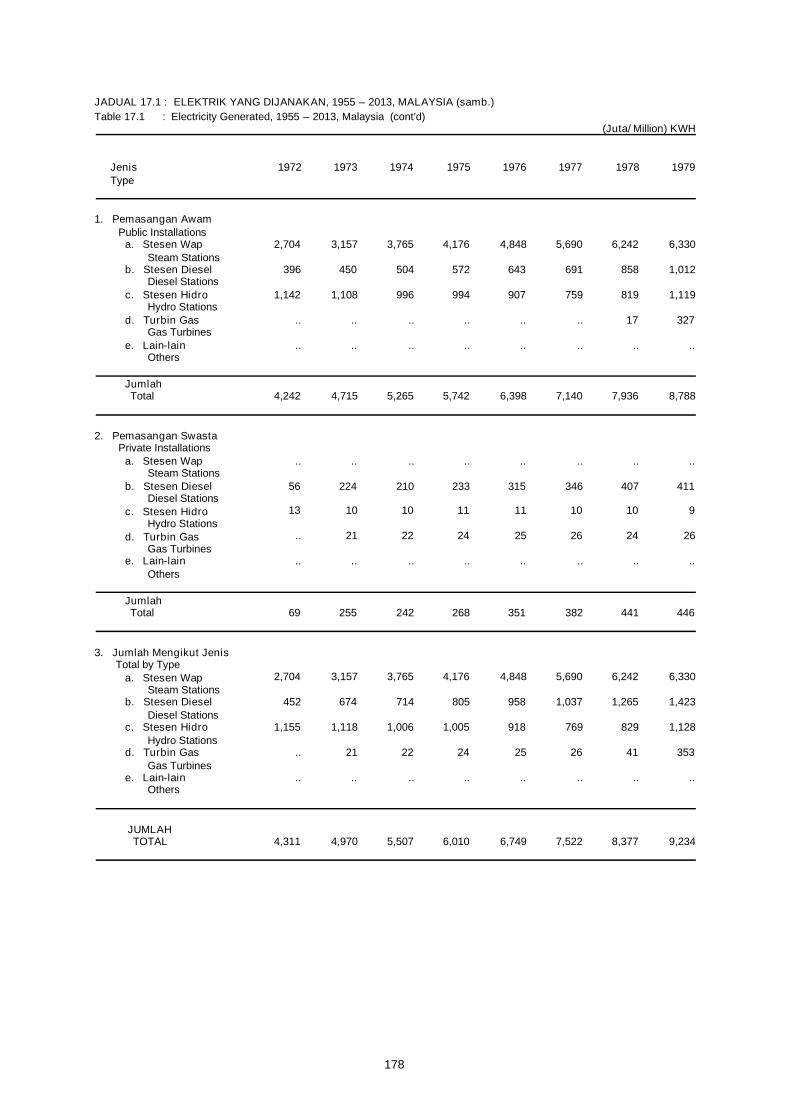
178
JADUAL 17.1 : ELEKTRIK YANG DIJANAKAN, 1955 – 2013, MALAYSIA (samb.)
(Juta/ Million) KWH
Jenis 1972 1973 1974 1975 1976 1977 1978 1979Type
1. Pemasangan AwamPublic Installations
a. Stesen Wap 2,704 3,157 3,765 4,176 4,848 5,690 6,242 6,330Steam Stations
b. Stesen Diesel 396 450 504 572 643 691 858 1,012Diesel Stations
c. Stesen Hidro 1,142 1,108 996 994 907 759 819 1,119Hydro Stations
d. Turbin Gas .. .. .. .. .. .. 17 327Gas Turbines
e. Lain-lain .. .. .. .. .. .. .. ..Others
JumlahTotal 4,242 4,715 5,265 5,742 6,398 7,140 7,936 8,788
2. Pemasangan SwastaPrivate Installations
a. Stesen Wap .. .. .. .. .. .. .. ..Steam Stations
b. Stesen Diesel 56 224 210 233 315 346 407 411Diesel Stations
c. Stesen Hidro 13 10 10 11 11 10 10 9Hydro Stations
d. Turbin Gas .. 21 22 24 25 26 24 26Gas Turbines
e. Lain-lain .. .. .. .. .. .. .. ..Others
JumlahTotal 69 255 242 268 351 382 441 446
3. Jumlah Mengikut JenisTotal by Type
a. Stesen Wap 2,704 3,157 3,765 4,176 4,848 5,690 6,242 6,330Steam Stations
b. Stesen Diesel 452 674 714 805 958 1,037 1,265 1,423Diesel Stations
c. Stesen Hidro 1,155 1,118 1,006 1,005 918 769 829 1,128Hydro Stations
d. Turbin Gas .. 21 22 24 25 26 41 353Gas Turbines
e. Lain-lain .. .. .. .. .. .. .. ..Others
JUMLAHTOTAL 4,311 4,970 5,507 6,010 6,749 7,522 8,377 9,234
Table 17.1 : Electricity Generated, 1955 – 2013, Malaysia (cont’d)

179
JADUAL 17.1 : ELEKTRIK YANG DIJANAKAN, 1955 – 2013, MALAYSIA (samb.)
(Juta/ Million) KWH
1980 1981 1982 1983 1984 1985 1986 1987 1988 1989 1990 1991 1992
6,903 7,312 7,905 8,545 7,895 6,818 7,437 7,504 7,855 10,424 12,456 14,022 14,568
1,102 1,172 1,288 1,399 1,197 1,127 841 812 821 888 1,019 1,053 907
1,388 1,564 1,275 1,674 3,384 3,757 4,050 4,880 5,580 5,266 3,943 4,405 4,331
297 312 354 467 631 2,478 3,085 3,520 4,225 4,111 6,131 7,150 10,556
.. .. .. .. .. .. .. .. .. .. .. .. ..
9,690 10,360 10,822 12,085 13,107 14,180 15,413 16,716 18,481 20,689 23,549 26,630 30,362
.. .. .. 3 3 71 135 138 121 378 441 285 303
458 491 630 423 410 478 424 454 450 472 496 532 461
10 14 15 11 13 18 19 24 23 27 39 39 26
28 30 31 133 119 249 298 284 287 323 738 849 734
.. .. .. .. .. .. .. .. .. .. .. .. ..
496 535 676 570 545 816 876 900 881 1,200 1,714 1,705 1,524
6,903 7,312 7,905 8,548 7,898 6,889 7,572 7,642 7,976 10,802 12,897 14,307 14,871
1,560 1,663 1,918 1,822 1,607 1,605 1,265 1,266 1,271 1,360 1,515 1,585 1,368
1,398 1,578 1,290 1,685 3,397 3,775 4,069 4,904 5,603 5,293 3,982 4,444 4,357
325 342 385 600 750 2,727 3,383 3,804 4,512 4,434 6,869 7,999 11,290
.. .. .. .. .. .. .. .. .. .. .. .. ..
10,186 10,895 11,498 12,655 13,651 14,996 16,289 17,616 19,362 21,889 25,263 28,335 31,886
Table 17.1 : Electricity Generated, 1955 – 2013, Malaysia (cont’d)

180
JADUAL 17.1 : ELEKTRIK YANG DIJANAKAN, 1955 – 2013, MALAYSIA (samb.)
(Juta/ Million) KWH
Jenis 1993 1994 1995 1996 1997 1998 1999 2000Type
1. Pemasangan AwamPublic Installations
a. Stesen Wap 15,336 13,787 14,096 14,753 14,699 13,819 13,312 12,241Steam Stations
b. Stesen Diesel 966 1,027 1,083 1,135 1,401 1,865 1,809 2,048Diesel Stations
c. Stesen Hidro 4,921 6,521 6,166 5,139 3,917 4,799 7,460 6,835Hydro Stations
d. Turbin Gas 12,886 17,207 23,019 29,314 37,038 37,986 37,946 43,574Gas Turbines
e. Lain-lain .. .. .. .. .. 395 481 503Others
JumlahTotal 34,109 38,542 44,364 50,341 57,055 58,864 61,008 65,201
2. Pemasangan SwastaPrivate Installations
a. Stesen Wap 273 343 277 247 266 275 274 290Steam Stations
b. Stesen Diesel 588 511 926 999 259 228 186 161Diesel Stations
c. Stesen Hidro 4 .. .. .. .. .. .. ..Hydro Stations
d. Turbin Gas 605 538 696 824 833 893 928 870Gas Turbines
e. Lain-lain .. 123 369 408 262 211 157 164Others
JumlahTotal 1,470 1,515 2,268 2,478 1,620 1,607 1,545 1,485
3. Jumlah Mengikut JenisTotal by Type
a. Stesen Wap 15,609 14,130 14,373 15,000 14,965 14,094 13,586 12,531Steam Stations
b. Stesen Diesel 1,554 1,538 2,009 2,134 1,660 2,093 1,995 2,209Diesel Stations
c. Stesen Hidro 4,925 6,521 6,166 5,139 3,917 4,799 7,460 6,835Hydro Stations
d. Turbin Gas 13,491 17,745 23,715 30,138 37,871 38,879 38,874 44,444Gas Turbines
e. Lain-lain .. 123 369 408 262 606 638 667Others
JUMLAHTOTAL 35,579 40,057 46,632 52,819 58,675 60,471 62,553 66,686
Table 17.1 : Electricity Generated, 1955 – 2013, Malaysia (cont’d)

181
Table 17.1 : Electricity Generated, 1955 – 2013, Malaysia (cont’d)(Juta/ Million) KWH
Jenis 2001 2002 2003 2004 2005 2006 2007 2008Type
1. Pemasangan AwamPublic Installations
a. Stesen Wap 11,943 16,322 20,936 19,339 22,936 24,075 24,954 25,350Steam Stations
b. Stesen Diesel 2,217 2,352 2,758 2,613 2,837 2,997 1,996 1,790Diesel Stations
c. Stesen Hidro 6,039 5,271 4,971 5,926 6,601 6,779 7,010 7,190Hydro Stations
d. Stesen Turbin Gas 49,983 49,328 53,130 60,412 60,946 63,841 67,694 69,194Gas Turbines Stations
e. Stesen Arang Batu 634 601 732 913 960 1,213 1,209 1,333Coal Stations
f. Lain-lain 0 0 0 0 0 0 63 66Others
JumlahTotal 70,816 73,874 82,526 89,202 94,280 98,906 102,927 104,923
2. Pemasangan SwastaPrivate Installations
a. Stesen Wap 251 277 255 286 275 223 239 287Steam Stations
b. Stesen Diesel 197 194 198 193 178 189 174 179Diesel Stations
c. Stesen Hidro .. .. .. 1 .. .. 1 ..Hydro Stations
d. Turbin Gas 852 819 878 811 1,316 1,357 1,444 1,371Gas Turbines
e. Stesen Arang Batu 0 0 0 0 0 0 0 0Coal Stations
f. Lain-lain 164 164 164 169 166 166 166 166Others
JumlahTotal 1,464 1,454 1,495 1,459 1,934 1,935 2,023 2,004
3. Jumlah Mengikut JenisTotal by Type
a. Stesen Wap 12,194 16,599 21,191 19,624 23,211 24,298 25,193 25,638Steam Stations
b. Stesen Diesel 2,414 2,546 2,955 2,805 3,015 3,187 2,170 1,969Diesel Stations
c. Stesen Hidro 6,039 5,271 4,971 5,926 6,601 6,779 7,011 7,190Hydro Stations
d. Turbin Gas 50,835 50,147 54,009 61,222 62,262 65,198 69,138 70,565Gas Turbines
e. Stesen Arang Batu 634 601 732 913 960 1,213 1,209 1,333Coal Stations
f. Lain-lain 164 164 164 169 166 166 229 232Others
JUMLAHTOTAL 72,280 75,328 84,022 90,661 96,214 100,841 104,950 106,927
JADUAL 17.1 : ELEKTRIK YANG DIJANAKAN, 1955 – 2013, MALAYSIA (samb.)

182
JADUAL 17.1 : ELEKTRIK YANG DIJANAKAN, 1955 – 2013, MALAYSIA (samb.)Table 17.1 : Electricity Generated, 1955 – 2013, Malaysia (cont’d)
(Juta/ Million) KWH
Jenis 2009 2010 2013Type
1. Pemasangan AwamPublic Installationsa. Stesen Wap 32,150 .. ..
Steam Stationsb. Stesen Diesel 1,776 1,859 2,640
Diesel Stationsc. Stesen Hidro 6,625 6,251 11,619
Hydro Stationsd. Turbin Gas 61,899 60,172 62,915
Gas Turbinese. Stesen Arang Batu 2,648 45,805 50,779
Coal Stationsf. Lain-lain 105 832 1,635
Others
JumlahTotal 105,203 114,919 129,588
2. Pemasangan SwastaPrivate Installationsa. Stesen Wap 233 259 368
Steam Stationsb. Stesen Diesel 182 185 159
Diesel Stationsc. Stesen Hidro 0 0 0
Hydro Stationsd. Turbin Gas 1,333 1,278 1,766
Gas Turbines
e. Stesen Arang Batu 0 0 0Coal Stations
f. Lain-lain 166 166 166Others
JumlahTotal 1,913 1,888 2,459
3. Jumlah Mengikut JenisTotal by Type
a. Stesen Wap 32,382 259 368Steam Stations
b. Stesen Diesel 1,958 2,044 2,799Diesel Stations
c. Stesen Hidro 6,625 6,251 11,619Hydro Stations
d. Turbin Gas 63,231 61,450 64,680Gas Turbines
e. Stesen Arang Batu 2,648 45,805 50,779Coal Stations
f. Lain-lain 271 998 1,801Others
JUMLAHTOTAL 107,116 116,808 132,047
2011
..
4,867
7,648
50,720
49,413
4,042
116,690
261
189
0
1,482
0
166
2,098
261
5,057
7,648
52,202
49,413
4,208
118,788
2012
..
3,703
9,069
55,432
52,435
2,259
122,898
366
166
0
1,649
0
166
2,348
366
3,869
9,069
57,082
52,435
2,425
125,245

PEMBINAANCONSTRUCTION

PEMBINAAN
Nota Keterangan
1. Perangkaan dalam laporan ini merujukkepada kerja-kerja pembinaan yangdijalankan oleh kontraktor berdaftar.
2. Pembinaan merangkumi terutamanyapembinaan baru, pengubahsuaian,pembaikan dan perobohan. Pemasangansebarang jenis mesin atau peralatanyang sedia terpasang pada masapembinaan asal turut diambil kira.Demikian juga bagi pemasangan mesinatau alat selepas pembinaan asal yangmemerlukan pengubahsuaian strukturbagi memasangnya. Pembinaan atasakaun sendiri tidak diambil kira.
3. Sumber data ini diperoleh daripadabanci/penyiasatan pembinaan dwitahunan (sejak tahun rujukan 1996). Databagi tahun rujukan 1963 hingga 1970merujuk kepada perangkaan utamaindustri pembinaan bagi SemenanjungMalaysia manakala data mulai tahunrujukan 1971 kepada Malaysia.
4. Bagi tahun rujukan 1998 sehingga 2009,penyiasatan ini meliputi pertubuhan yangmempunyai nilai kerja pembinaan yangdijalankan melebihi RM500,000. Mulaitahun rujukan 2012 penyiasatan inimeliputi semua pertubuhan denganmenggunakan metodologi reka bentukpensampelan rawak berstrata.
CONSTRUCTION
Explanatory Notes
1. The statistics presented in this report referto construction work done by registeredcontractors.
2. Construction mainly includes newconstruction, alteration, repair anddemolition. Installation of any machineryor equipment which is built-in at the timeof the original construction is included. Italso included installation of machinery orequipment after the original constructionbut which requires structural alteration inorder to install. The own accountconstruction is not included.
3. Source of data is primarily from thecensus/biennial survey of construction(since reference year 1996). Data forreference years 1963 to 1970 refer to theprincipal statistics of the constructionindustries in Peninsular Malaysia whiledata since reference year 1971 refer toMalaysia.
4. In the reference year 1998 to 2009, thissurvey covers establishment with thevalue of construction work doneRM500,000 and above. Since in 2012,this survey covers all establishments andthe methodology adopted a stratifiedrandom sampling.
185

186
5. Penyiasatan tidak dijalankan bagi tahunrujukan 1980, 1997, 1999, 2001, 2003,2006, 2008 dan 2011.
6. Mulai tahun rujukan 2007, kos inputmengambil kira pembayaran terhadapperkhidmatan bukan perindustrian(termasuk bayaran bagi pengangkutankeluar barangan, perjalanan,pengurusan, perundangan, teknologimaklumat, pengiklanan, caj oleh bank,pos, telekomunikasi, dll.).
5. There was no survey carried out forreference years 1980, 1997, 1999, 2001,2003, 2006, 2008 and 2011.
6. Since reference year 2007, cost of inputincludes payments for non-industrialservices (including payments for carriageoutwards of goods, travelling,management, legal, informationtechnology, advertising, bank charges,post, telecommunication, etc.).

JADUAL 18.1 : PERANGKAAN UTAMA INDUSTRI PEMBINAAN, 1963 – 2013, MALAYSIATable 18.1 : Principal Statistics of Construction Industries, 1963 – 2013, Malaysia
Tahun Nilai Nilai input Nilai Jumlah pekerja Gaji & upah Nilai hartaYear output perantaraan ditambah pada bulan yang dibayar tetap yang
kasar Value of Value added Disember atau Salaries & dimiliki padaValue intermediate pada tempoh wages paid akhir tahun
of gross input gaji terakhir Value ofoutput Total number of fixed assets
person engaged owned as atduring December or end of the year
RM ('000) the last pay period RM ('000)
1963 404,881 227,456 .. .. 116,807 ..
1964 435,232 246,477 188,755 47,799 115,678 ..
1965 478,718 267,531 211,187 48,014 123,053 ..
1966 515,965 290,244 225,721 51,056 133,188 ..
1967 552,119 300,787 251,332 60,162 146,499 ..
1968 496,143 279,235 216,908 45,383 119,218 ..
1969 449,949 255,865 194,084 44,231 107,785 ..
1970 487,278 279,503 207,775 51,702 110,298 63,557
1971 565,864 330,295 235,569 60,285 131,458 64,171
1972 709,797 407,948 301,849 71,614 164,820 76,880
1973 927,245 532,910 394,335 80,135 210,686 112,357
1974 1,301,740 744,418 557,322 101,679 279,482 139,536
1975 1,780,873 952,811 828,062 106,812 337,607 264,688
1976 1,983,732 1,043,388 940,344 109,190 370,724 320,844
1977 2,578,356 1,459,235 1,119,121 140,622 505,180 409,905
1978 2,817,526 1,588,733 1,228,793 150,004 583,203 510,724
1979 2,641,870 1,588,621 1,053,249 142,012 587,128 471,289
1980 .. .. .. .. .. ..
1981 6,086,140 .. .. 243,603 1,353,637 992,746
1982 8,111,496 .. .. 282,337 1,814,947 1,311,596
1983 9,108,806 5,490,943 3,617,863 306,412 2,061,897 1,394,430
1984 9,702,165 .. .. 297,811 2,057,250 1,657,136
1985 9,648,075 6,026,749 3,621,326 294,065 2,068,500 1,659,006
RM ('000)RM ('000) RM ('000)
1986 8,026,323 4,969,549 3,056,774 250,172 1,763,377 1,399,598
1987 5,914,975 3,626,309 2,288,666 195,632 1,330,808 1,232,589
1988 6,187,098 3,895,746 2,291,352 201,576 1,370,473 1,088,458
1989 8,288,596 5,288,569 3,000,027 250,481 1,832,498 1,264,102
187

188
JADUAL 18.1 : PERANGKAAN UTAMA INDUSTRI PEMBINAAN, 1963 – 2013, MALAYSIA (samb.)Table 18.1 : Principal Statistics of Construction Industries, 1963 – 2013, Malaysia ( cont'd)
Tahun Nilai Nilai input Nilai Jumlah pekerja Gaji & upah Nilai hartaYear output perantaraan ditambah pada bulan yang dibayar tetap yang
kasar Value of Value added Disember atau Salaries & dimiliki padaValue intermediate pada tempoh wages paid akhir tahun
of gross input gaji terakhir Value ofoutput Total number of fixed assets
person engaged owned as atduring December or end of the year
RM ('000) RM ('000) RM ('000) the last pay period RM ('000) RM ('000)
1990 11,938,881 7,551,229 4,387,652 305,547 2,560,663 1,864,485
1991 15,573,500 9,773,588 5,799,912 362,748 3,379,424 2,149,622
1992 19,634,765 12,185,822 7,448,943 425,285 4,401,867 4,469,927
1993 24,290,382 14,971,166 9,319,216 447,177 5,191,357 4,827,026
1994 28,311,075 16,960,992 11,350,083 507,516 6,487,381 4,115,590
1995 34,703,278 21,051,706 13,651,572 533,500 7,711,800 5,261,964
1996 B 44,642,489 27,464,500 17,177,989 627,369 10,118,370 6,500,288
1997 .. .. .. .. .. ..
1998 40,270,328 24,720,952 15,549,376 551,866 9,687,610 7,128,504
1999 .. .. .. .. .. ..
2000 39,872,025 26,647,632 13,224,393 458,580 8,722,298 6,688,178
2001 .. .. .. .. .. ..
2002 41,755,583 28,361,130 13,394,453 455,663 9,108,167 6,152,177
2003 .. .. .. .. .. ..
2004 45,775,525 31,773,391 14,002,134 449,944 9,284,764 6,623,488
2005 B 53,960,259 36,987,048 16,973,211 551,775 10,867,665 7,486,517
2006 .. .. .. .. .. ..
2007 60,715,626 42,617,107 18,098,519 595,139 12,956,935 8,395,256
2008 .. .. .. .. .. ..
2009 70,599,755 49,364,553 21,235,202 602,694 13,966,992 9,359,441
2010B 91,341,685 59,400,380 31,941,305 974,488 19,841,387 14,476,140
2011 .. .. .. .. .. ..
2012 110,068,251 73,054,604 37,013,647 1,027,900 22,433,961 14,071,223
2013 131,263,024 89,486,841 41,776,183 1,075,950 25,323,614 15,597,732
Nota / Note :B = merujuk kepada tahun Banci / refers to Census year

PERKHIDMATANSERVICES


191
PERKHIDMATAN
Nota Keterangan
1. Data perkhidmatan diperoleh daripadapelbagai banci/penyiasatan yangdijalankan secara tahunan, dwitahunanatau sekali dalam tempoh lima tahun.Bagi sub-sektor perdagangan edaran,data dikumpul dari PenyiasatanPerdagangan Edaran Bulanan.
2. Perkhidmatan Profesional, Saintifik danTeknikal merujuk kepada aktivitipenyediaan atau yang memerlukan tahaplatihan yang tinggi, dan pengetahuanserta kemahiran khusus. Perkhidmatanini termasuk guaman, perakaunan,arkitek, kejuruteraan, juru ukur tanah,aktiviti juru ukur bahan dan aktiviti arkitek& kejuruteraan lain dan perundinganteknikal berkaitan t.t.t.l. Mulai tahunrujukan 2010, perkhidmatan veterinardan pengiklanan dimasukkan di bawahperkhidmatan ini.
3. Bagi perkhidmatan Pendidikan (sektorswasta) subsektor ini meliputi aktivititadika, sekolah rendah, sekolahmenengah am, kolej dan universiti,sekolah/institusi menengah teknik danvokasional, sekolah/institusi lain,sekolah muzik dan tarian dan institusiperdagangan dan teknik lain.
4. Aktiviti yang diliputi di bawahperkhidmatan Kesihatan (sektor swasta)adalah perkhidmatan perubatan,pergigian, veterinar, hospital & rumahbersalin persendirian dan perkhidmatanpenjagaan kesihatan lain.
SERVICES
Explanatory Notes
1. Data on the services sector werecompiled from various censuses/surveyswhich were conducted annually,biennially or once in every five years. Asfor the distributive trade sub–sector, datawere compiled from the Monthly Surveyof Distributive Trade.
2. Professional, Scientific and Technicalservices refer to activities providing orwhich require a high degree of training,and specialised knowledge and skills.These services include legal, accounting,architectural, engineering, surveying,activities of quantity surveyors and otherarchitectural & engineering activities andrelated consultancy n.e.c. Starting fromreference year 2010, veterinary andadvertising services are included underthis service.
3. On the Education services (privatesector), this sub–sector includekindergartens, primary schools, generalsecondary schools, colleges anduniversities, technical and vocationalsecondary schools, other schools andinstitutions, music and dancing schoolsand other commercial and technicalinstitutions.
4. Activities covered under Health services(private sector) were medical services,dental, veterinary, private hospitals &maternity homes and other healthcareservices.
192
5. Perkhidmatan Penginapan merujukkepada aktiviti hotel (termasuk resort),hotel bajet/motel, hotel apartmen, chalet,rumah rehat/rumah tetamu, hostel, bed &breakfast. Statistik perkhidmatanpenginapan yang dilaporkan selarasmengikut sistem pengkelasan yangd ike luarkan o leh Kementer ianPelancongan Malaysia.
6. Aktiviti di bawah Perkhidmatan Terpilihmerujuk kepada perkhidmatan brokerstok, saham dan komoditi serta tukaranwang asing (termasuk pengurup wang),agensi hartanah dan agensi pengiklanan.
7. Aktiviti yang diliputi dalam perkhidmatanPengangkutan dan Penyimpanan adalahperkhidmatan bas awam, pengangkutanmuatan melalui jalan raya, laut, udaradan air pedalaman, perkhidmatanpengendalian kargo dan pemunggahankapal, kereta api/transit aliran ringan,penyimpanan & gudang, pengoperasianlebuhraya dan pelabuhan, agensiperkapalan dan penghantaran,perkhidmatan pos & kurier dan tempatletak kereta.
8. Perkhidmatan Maklumat dan Komunikasimerangkumi aktiviti pemprograman &penyiaran, perkhidmatan telekomunikasi,perkhidmatan komputer, perkhidmatanmaklumat, aktiviti penerbitan dan aktivitipenerbitan wayang gambar, video danprogram televisyen, rakaman bunyi danpenerbitan muzik.
9. Aktiviti Agensi Pengembaraan danOperator Pelancongan merangkumipertubuhan yang menyediakan maklumatperjalanan, khidmat nasihat danperancangan serta mengatur lawatan,penginapan & pengangkutan danpemanduan untuk pengembara &pelancong dan penyediaan tiket.
5. Accommodation services refer to hotels(including resorts), budget hotels/motels,apartment hotels, chalets, rest houses/guest houses, hostels and bed &break fas t . The s ta t i s t ics onaccommodation services reported are inline with the rating system used by theMinistry of Tourism, Malaysia.
6. Activities included under SelectedServices refer to stock, share andcommodity brokers, foreign exchangeservices (include money changers), realestate and advertising agencies.
7. Transportation and Storage servicesactivities covered public bus services,freight transport by road, sea, air andinland water transport, stevedoringcompanies and cargo handling services,train/light rail transit, storage &warehousing, highway and portoperations, shipping and forwardingagencies, post & courier and car parkservice.
8. Information and Communicationsservices covered include programming &b r o a d c a s t i n g a c t i v i t i e s ,telecommunication services, computerservices, information services, publishingactivities and motion picture, video andtelevision programme production, soundrecording and music publishing activities.
9. Travel Agencies and Tour Operatorsactivities covered establishmentsengaged in furnishing travel information,advice and planning, arranging tours,accommodation & transportation andguide for travellers & tourists as well asfurnishing tickets to them.

193
10. Perdagangan borong merujuk kepada“penjualan semula (tanpapengubahsuaian) barangan baru danbarangan yang telah digunakan kepadaperuncit, pengguna perindustrian,perdagangan, institusi atau profesional;atau kepada pemborong lain; ataubertindak sebagai agen atau brokerdalam pembelian barangan daganganuntuk, atau menjual dagangan kepadaorang atau syarikat berkenaan”.
11. Perdagangan runcit merujuk kepada“penjualan semula (tanpapengubahsuaian) barangan baru danterpakai kepada orang awam untukkegunaan persendirian atau isi rumah”.Ini termasuk jualan yang dilakukan olehkedai, gedung serbaneka, gerai, tempatpesanan pos, penjaja dan pengedar,koperasi pengguna, atas talian danlain-lain.
12. Kenderaan bermotor merujuk kepada“jualan secara borong dan runcitkenderaan bermotor dan motosikal, samaada baru atau terpakai, jualan alat-alatganti dan aksesori kenderaan,penyelenggaraan dan pembaikankenderaan bermotor dan motosikaltermasuk mencuci, mengilap danmenunda kenderaan serta kegiatan agenberkomisen yang terlibat dalam jualan”.
10. Wholesale trade refers to “the resale(sale without transformation) of new andused goods to retailers, industrial,commercial, institutional or professionalusers; or to other wholesalers; or involvesacting as an agent or broker in buyingmerchandise for, or selling merchandiseto, such persons or companies”.
11. Retail trade refers to “the resale (salewithout transformation) of new and usedgoods to the general public for personalor household consumption or utilisation”.It includes selling by shops, departmentstores, stalls, mail-order houses,hawkers and peddlers and consumerco–operatives , online and etc.
12. Motor vehicle trade refers to “wholesaleand retail sale of motor vehicles andmotorcycles, either new or used, sale ofmotor vehicle parts and accessories,maintenance and repair of motor vehiclesand motorcycles including washing,polishing and towing as well ascommission agents”.

JADUAL 19.1 : PERANGKAAN UTAMA PERKHIDMATAN GUAMAN, 1971 – 2012, MALAYSIATable 19.1 : Principal Statistics of Legal Services, 1971 – 2012, Malaysia
Tahun Hasil Perbelanjaan Bilangan Pekerja Gaji & Upah Nilai Harta-Year Revenue Expenditure pada Akhir yang Dibayar Harta Tetap
Bulan Disember Salaries & yang DimilikiNumber of Persons Wages Paid pada Akhir
Engaged as at Bulan DisemberEnd of December Value of Fixed
Jumlah Pekerja Assets OwnedTotal Bergaji as at End
Paid of DecemberEmployees RM ('000)
1971(a) 20,098 11,891 2,223 .. 5,342 2,4541972 27,524 16,048 2,963 .. 7,119 4,4311973 36,390 20,297 3,406 .. 8,879 5,8781974 43,684 24,347 3,770 .. 10,493 7,3931975 47,953 25,997 4,186 3,533 12,258 9,2781976 58,535 35,197 4,697 3,967 14,400 10,7191977 69,031 41,173 5,049 .. 16,532 12,4081978 78,905 46,981 5,375 .. 18,753 14,3681979 98,298 60,015 6,300 5,472 23,373 18,1571980 .. .. .. .. .. ..1981 152,911 100,539 7,225 6,235 33,925 27,1561982 .. .. .. .. .. ..1983 219,790 147,596 9,490 8,259 51,783 38,3551984 256,618 191,841 10,138 8,769 62,581 46,1511985 281,434 207,609 11,350 9,848 73,282 48,7821986 287,185 217,350 12,082 10,457 79,090 48,8321987 301,676 222,713 12,667 10,981 83,427 51,2611988 324,657 234,626 13,630 11,885 90,159 53,4321989 369,143 260,689 14,968 13,123 103,007 63,4341990 442,159 301,347 16,538 14,562 121,386 76,4641991 543,558 357,433 17,421 15,352 145,375 94,6851992 613,019 424,288 19,289 16,925 174,362 111,0661993 .. .. .. .. .. ..1994 841,923 570,236 22,124 19,355 233,846 146,8641995 .. .. .. .. .. ..1996 1,161,762 781,477 25,979 22,425 331,595 212,8151997 .. .. .. .. .. ..1998 .. .. .. .. .. ..1999 1,379,147 849,226 28,089 23,491 381,236 242,7772000 .. .. .. .. .. ..2001 .. .. .. .. .. ..2002 1,557,568 1,107,662 32,054 26,853 521,376 297,4222003 1,595,257 1,144,071 32,288 26,915 540,740 280,0202004 .. .. .. .. .. ..2005 1,942,367 1,434,568 34,970 29,553 640,630 379,1252006 .. .. .. .. .. ..2007 2,108,812 1,524,712 35,545 29,833 701,086 354,312
2010 3,471,303 2,375,119 44,847 36,545 1,014,724 513,782
RM ('000) RM ('000) RM ('000)
2009 1,902,492 1,365,824 25,446 22,287 621,380 265,2852008 .. .. .. .. .. ..
2011 .. .. .. .. .. ..2012 4,029,589 2,789,433 49,656 38,993 1,242,856 620,655
194
Nota / Note:Liputan bagi tahun 2009 merujuk kepada penyiasatan di mana hanya pertubuhan yang menyumbang 85 peratus dan ke atasdari jumlah hasil diliputiThe coverage for 2009 refer to a survey where establishments which contributed 85 per cent of total revenue and abovewere covered

JADUAL 19.2 : PERANGKAAN UTAMA PERKHIDMATAN PERAKAUNAN, 1971 – 2012, MALAYSIATable 19.2 : Principal Statistics of Accounting Services, 1971 – 2012, Malaysia
Tahun Hasil Perbelanjaan Bilangan Pekerja Gaji & Upah Nilai Harta-Year Revenue Expenditure pada Akhir yang Dibayar Harta Tetap
Bulan Disember Salaries & yang DimilikiNumber of Persons Wages Paid pada Akhir
Engaged as at Bulan DisemberEnd of December Value of Fixed
Jumlah Pekerja Assets OwnedTotal Bergaji as at End
Paid of DecemberEmployees RM ('000)
1971(a) 19,312 12,575 2,476 .. 2,765 2,0521972 25,504 16,661 2,999 .. 9,816 2,8201973 29,676 18,684 3,797 .. 10,948 3,2431974 38,154 24,931 4,066 .. 14,593 4,4771975 48,206 32,851 4,765 4,217 18,968 6,6801976 56,141 39,443 5,372 4,806 22,864 7,2551977 63,197 44,312 5,688 .. 25,740 8,0281978 69,005 48,461 6,043 .. 27,867 9,2951979 79,016 56,475 6,627 5,996 30,985 10,5671980 .. .. .. .. .. ..1981 115,846 91,706 7,567 6,870 49,478 15,9141982 .. .. .. .. .. ..1983 156,350 123,351 8,792 8,065 65,097 20,6941984 180,754 147,905 9,268 8,541 74,571 27,0041985 185,094 154,748 9,436 8,690 80,664 25,3241986 183,287 156,441 9,094 8,329 80,910 24,2321987 192,301 155,418 9,182 8,377 80,762 22,9591988 199,002 159,775 9,564 8,717 85,478 23,2701989 222,825 182,182 10,257 9,402 97,441 25,6951990 255,930 195,889 11,977 10,923 105,877 33,3591991 293,875 230,145 12,201 11,156 120,499 39,3371992 342,176 268,638 12,770 11,722 144,727 43,3551993 .. .. .. .. .. ..1994 462,138 345,300 14,545 13,462 191,705 55,6021995 .. .. .. .. .. ..1996 649,176 474,304 15,816 14,678 272,733 75,8451997 .. .. .. .. .. ..1998 .. .. .. .. .. ..1999 883,108 558,347 14,899 13,709 313,999 101,0372000 .. .. .. .. .. ..2001 .. .. .. .. .. ..2002 845,610 687,066 16,158 14,866 357,862 96,4002003 1,080,844 815,234 19,225 17,536 465,429 115,0632004 .. .. .. .. .. ..2005 1,256,138 979,092 23,015 21,199 555,346 154,9742006 .. .. .. .. .. ..2007 1,464,452 1,088,783 23,357 21,457 604,001 182,576
2009 1,264,133 1,037,986 17,393 16,479 567,133 116,874
RM ('000) RM ('000)RM ('000)
2008 .. .. .. .. .. ..
2010 2,053,567 1,582,140 28,053 25,937 738,227 304,9242011 .. .. .. .. .. ..2012 2,805,524 2,256,117 33,354 30,415 1,154,473 291,536
195
Nota / Note:Aktiviti perundingan percukaian dimasukkan di dalam liputan bagi tahun 2005 dan seterusnyaTax consultation activities were included in the coverage from year 2005 onwardsLiputan bagi tahun 2009 merujuk kepada penyiasatan di mana hanya pertubuhan yang menyumbang 85 peratus dan ke atasdari jumlah hasil diliputiThe coverage for 2009 refer to a survey where establishments which contributed 85 per cent of total revenue and abovewere covered

JADUAL 19.3 : PERANGKAAN UTAMA PERKHIDMATAN ARKITEK, 1971 – 2012, MALAYSIATable 19.3 : Principal Statistics of Architectural Services, 1971 – 2012, Malaysia
Tahun Hasil Perbelanjaan Bilangan Pekerja Gaji & Upah Nilai Harta-Year Revenue Expenditure pada Akhir yang Dibayar Harta Tetap
Bulan Disember Salaries & yang DimilikiNumber of Persons Wages Paid pada Akhir
Engaged as at Bulan DisemberEnd of December Value of Fixed
Jumlah Pekerja Assets OwnedTotal Bergaji as at End
Paid of DecemberEmployees RM ('000)
1971(a) 9,610 6,427 895 .. 2,902 1,0091972(c) 13,868 9,338 1,074 .. 3,755 1,6541973(c) 21,642 13,773 1,490 .. 5,294 1,8941974(c) 28,968 19,124 1,787 .. 7,605 3,4161975 36,026 27,032 2,213 1,972 9,829 5,9841976 40,440 32,126 2,242 1,985 12,737 6,6851977 42,581 33,397 2,296 .. 13,005 7,1201978 46,624 36,465 2,297 .. 14,129 8,1841979 61,730 46,009 2,664 2,408 17,061 9,0421980 .. .. .. .. .. ..1981 121,294 96,018 3,359 3,050 26,287 14,8661982 .. .. .. .. .. ..1983 205,429 162,473 3,709 3,375 40,339 22,6961984 229,751 196,753 4,355 4,002 53,170 28,3551985 201,939 188,925 4,181 3,812 53,031 28,9461986 151,293 142,927 3,735 3,378 43,573 25,6771987 115,263 109,122 3,079 2,723 32,169 21,9421988 113,183 99,278 2,920 2,584 30,839 22,3011989 136,874 113,542 3,344 2,967 35,849 25,0851990 187,078 150,050 4,006 3,634 48,851 30,8631991 274,159 207,334 4,671 4,255 64,811 41,9901992 302,158 241,842 5,121 4,686 83,074 53,1251993 .. .. .. .. .. ..1994 435,806 353,118 7,009 6,435 128,518 93,5541995 .. .. .. .. .. ..1996 691,180 545,437 8,063 7,460 199,466 134,5631997 .. .. .. .. .. ..1998 .. .. .. .. .. ..1999 649,393 459,841 7,396 6,637 182,282 162,2082000 .. .. .. .. .. ..2001 .. .. .. .. .. ..2002 698,729 582,494 8,466 7,733 239,909 163,2042003 759,464 648,862 9,367 8,480 262,208 187,0572004 .. .. .. .. .. ..2005 997,277 848,938 11,006 10,145 300,898 291,2572006 .. .. .. .. .. ..2007 1,145,665 952,638 11,698 10,878 309,881 243,156
2010 1,696,675 1,212,795 12,544 11,888 367,136 692,785
RM ('000) RM ('000) RM ('000)
2008 .. .. .. .. .. ..2009 1,013,964 811,798 7,518 7,239 273,087 160,604
2011 .. .. .. .. .. ..2012 1,879,930 1,470,893 15,334 13,972 499,713 695,215
196
Nota / Note:
Liputan bagi tahun 2009 merujuk kepada penyiasatan di mana hanya pertubuhan yang menyumbang 85 peratus dan ke atas
dari jumlah hasil diliputiThe coverage for 2009 refer to a survey where establishments which contributed 85 per cent of total revenue and above were covered
Liputan bagi tahun 2010 merujuk kepada perkhidmatan arkitek dan perkhidmatan pelukis pelan bangunan
The coverage for 2010 refer to survey architectural services and building draughtman services

JADUAL 19.4 : PERANGKAAN UTAMA PERKHIDMATAN KEJURUTERAAN, 1971 – 2012, MALAYSIATable 19.4 : Principal Statistics of Engineering Services, 1971 – 2012, Malaysia
Tahun Hasil Perbelanjaan Bilangan Pekerja Gaji & Upah Nilai Harta-Year Revenue Expenditure pada Akhir yang Dibayar Harta Tetap
Bulan Disember Salaries & yang DimilikiNumber of Persons Wages Paid pada Akhir
Engaged as at Bulan DisemberEnd of December Value of Fixed
Jumlah Pekerja Assets OwnedTotal Bergaji as at End
Paid of DecemberRM ('000) RM ('000) Employees RM ('000) RM ('000)
1971(a) 13,457 10,791 1,222 .. 5,693 1,1821972(c) 18,778 14,083 1,597 .. 7,568 1,9051973(c) 26,777 19,709 1,923 .. 10,702 2,7611974(c) 34,609 25,763 2,153 .. 13,519 3,3821975 52,052 44,156 3,019 2,834 21,917 4,5101976 56,730 49,651 3,205 2,990 24,966 6,0341977 55,987 48,858 3,396 .. 26,502 6,0201978 66,058 57,169 3,730 .. 29,293 7,1721979 92,045 79,411 4,735 4,524 37,857 9,5601980 .. .. .. .. .. ..1981 172,846 154,025 6,203 5,994 68,760 15,5851982 .. .. .. .. .. ..1983 269,059 234,527 7,453 7,236 111,536 27,0191984 309,562 279,790 7,926 7,718 125,056 31,2021985 291,346 273,412 7,620 7,415 128,577 35,6001986 266,771 257,949 6,970 6,749 114,885 38,9931987 212,813 198,450 6,138 5,918 92,394 38,1131988 217,855 196,695 6,156 5,935 96,206 36,3961989 304,719 264,909 7,399 7,152 120,900 40,5511990 404,039 359,481 9,313 9,058 166,168 53,9621991 644,723 557,358 11,309 11,041 256,969 72,9131992 714,367 643,931 11,661 11,393 291,618 89,3741993 .. .. .. .. .. ..1994 1,019,451 929,421 13,472 13,193 404,196 125,9691995 .. .. .. .. .. ..1996 1,482,552 1,281,059 16,568 16,295 585,030 171,8461997 .. .. .. .. .. ..1998 .. .. .. .. .. ..1999 1,310,335 1,016,784 12,531 12,311 463,968 210,8702000 .. .. .. .. .. ..2001 .. .. .. .. .. ..2002 1,492,854 1,271,104 15,225 15,027 591,786 238,8952003 1,991,565 1,795,342 15,903 15,617 762,668 258,2472004 .. .. .. .. .. ..2005 3,548,362 3,193,178 19,984 19,451 1,024,778 515,7102006 .. .. .. .. .. ..2007 4,955,723 4,426,663 27,402 26,816 1,179,099 492,1882008 .. .. .. .. .. ..2009 4,893,967 4,123,083 18,207 18,108 991,125 389,1552010 5,082,186 3,895,240 29,940 28,911 964,316 1,623,7902011 .. .. .. .. .. ..2012 6,346,078 4,809,174 34,920 33,302 1,340,304 1,680,091
197
Nota / Note:Liputan bagi tahun 2009 merujuk kepada penyiasatan di mana hanya pertubuhan yang menyumbang 85 peratus dan ke atasdari jumlah hasil diliputiThe coverage for 2009 refer to a survey where establishments which contributed 85 per cent of total revenue and abovewere covered

JADUAL 19.5 : PERANGKAAN UTAMA PERKHIDMATAN JURUUKUR, 1971 – 2012, MALAYSIATable 19.5 : Principal Statistics of Surveying Services, 1971 – 2012, Malaysia
Tahun Hasil Perbelanjaan Bilangan Pekerja Gaji & Upah Nilai Harta-Year Revenue Expenditure pada Akhir yang Dibayar Harta Tetap
Bulan Disember Salaries & yang DimilikiNumber of Persons Wages Paid pada Akhir
Engaged as at Bulan DisemberEnd of December Value of Fixed
Jumlah Pekerja Assets OwnedTotal Bergaji as at End
Paid of DecemberEmployees RM ('000)
1971(a) 7,449 5,765 1,265 .. 3,111 ..1972(c) 9,300 7,200 1,454 .. 3,839 1,0071973(c) 13,333 10,252 1,630 .. 4,545 1,4161974(c) 16,156 12,410 1,945 .. 5,962 1,8591975 23,797 18,517 2,642 2,472 8,839 2,2121976 26,456 21,071 2,712 2,546 10,172 3,9811977 32,502 26,513 3,315 .. 13,526 4,8351978 41,975 35,946 4,075 .. 16,603 5,9061979 55,784 46,424 5,241 5,063 21,378 7,7931980 .. .. .. .. .. ..1981 120,111 102,079 5,869 5,685 35,196 16,4591982 .. .. .. .. .. ..1983 156,483 135,494 6,559 6,358 51,680 24,1521984 176,545 161,063 7,165 6,924 56,684 26,2371985 172,398 154,130 7,040 6,794 61,466 28,1821986 163,221 151,110 6,539 6,307 56,195 29,6001987 165,977 152,464 6,285 6,031 54,124 30,6161988 181,589 162,029 6,354 6,089 57,040 31,5761989 223,443 194,991 7,168 6,918 66,887 36,9131990 284,055 253,491 7,753 7,485 80,064 44,3141991 339,625 296,856 8,556 8,275 97,176 62,6051992 387,587 332,416 9,342 9,031 118,817 67,3271993 .. .. .. .. .. ..1994 489,254 427,714 10,317 9,968 163,227 76,6841995 .. .. .. .. .. ..1996 637,565 536,334 11,563 11,201 215,880 101,4581997 .. .. .. .. .. ..1998 .. .. .. .. .. ..1999 590,688 460,223 9,082 8,662 186,262 107,7952000 .. .. .. .. .. ..2001 .. .. .. .. .. ..2002 715,504 618,834 10,675 10,168 226,713 127,0752003 776,515 662,983 11,007 10,457 241,830 131,9662004 .. ... .. .. .. ..2005 916,473 788,090 10,947 10,316 254,544 181,4232006 .. ... .. .. .. ..2007 1,078,805 912,129 11,817 11,259 312,566 201,512
2010(1) 933,664 682,849 8,379 8,012 210,094 271,874
RM ('000) RM ('000) RM ('000)
2009 .. .. .. .. .. ..2008 .. .. .. .. .. ..
2011 .. .. .. .. .. ..2012 1,101,820 861,960 10,566 9,909 300,992 278,225
198
Nota / Note:(1) Liputan pada tahun 2010 adalah tidak termasuk aktiviti penilai dan pentaksir
The coverage for 2010, excluding valuers and appraisers activities

JADUAL 19.6 : PERANGKAAN UTAMA PERKHIDMATAN PENDIDIKAN, 1971 – 2010, MALAYSIATable 19.6 : Principal Statistics of Education Services, 1971 – 2010, Malaysia
Tahun Hasil Perbelanjaan Bilangan Pekerja Gaji & Upah Nilai Harta-Year Revenue Expenditure pada Akhir yang Dibayar Harta Tetap
Bulan Disember Salaries & yang DimilikiNumber of Persons Wages Paid pada Akhir
Engaged as at Bulan DisemberEnd of December Value of Fixed
Jumlah Pekerja Assets OwnedTotal Bergaji as at End
Paid of DecemberRM ('000) RM ('000) Employees RM ('000) RM ('000)
1971(a) 17,507 15,985 4,424 .. 10,242 12,1761972 25,237 23,385 6,145 .. 15,273 28,9371973 30,852 27,751 6,967 .. 17,910 38,5771974 36,592 32,614 7,677 .. 20,895 43,1071975 43,799 38,312 8,057 .. 24,515 52,4031976 51,202 45,805 9,199 .. 28,697 61,9191977 60,464 53,282 10,103 .. 33,216 62,791
1978 66,160 58,537 10,783 .. 36,076 69,6151979 76,003 67,275 11,398 .. 40,876 74,8301980 .. .. .. .. .. ..
1981 104,429 95,095 12,462 11,794 53,299 91,5931982 .. .. .. .. .. ..1983 136,595 123,317 14,102 13,415 70,675 123,713
1984 166,438 155,339 15,186 14,353 87,750 152,7061985 191,665 169,539 16,993 16,076 94,676 162,2741986 202,093 187,690 17,888 16,982 104,429 173,6071987 211,076 201,203 18,579 17,631 110,590 182,3971988 225,063 213,863 19,543 18,383 116,878 224,281
1989 259,346 239,956 21,026 19,788 130,858 253,7231990 304,048 275,476 22,812 21,461 147,831 274,3431991 359,465 329,633 24,421 23,024 171,946 339,274
1992 474,695 426,126 26,351 24,943 213,180 399,8491993 .. .. .. .. .. ..1994 696,313 626,383 29,984 28,507 307,461 610,415
1995 .. .. .. .. .. ..1996 1,078,770 974,491 35,689 33,713 454,090 868,6411997 .. .. .. .. .. ..1998 .. .. .. .. .. ..1999 1,756,335 1,567,426 44,124 41,976 672,269 1,644,3852000 .. .. .. .. .. ..2001 .. .. .. .. .. ..2002 3,035,483 2,814,008 56,618 54,190 1,171,960 3,999,973
2003 4,031,523 3,167,036 62,050 59,193 1,265,893 5,061,8502004 .. .. .. .. .. ..2005 5,035,005 4,727,323 87,596 82,477 1,795,958 5,121,650
2006 .. .. .. .. .. ..2007 6,138,196 5,424,138 89,153 83,819 2,076,594 5,983,4862008 .. .. .. .. .. ..
2009(1) 6,634,517 5,705,293 64,091 62,964 2,283,819 7,013,1672010 10,007,309 8,508,074 107,939 101,742 3,165,553 8,933,593
199
Nota / Note:(1) Liputan bagi tahun 2009 bagi pendidikan menengah am dan pendidikan kolej dan universiti adalah merujuk kepada banci, manakala
pendidikan pra-sekolah hanya meliputi pertubuhan yang secara kumulatif menyumbang 80 peratus dan ke atas dari segi hasilThe coverage for 2009 for general school secondary education and college and university education services refer to census, while forpre -primary education, establishments which cumulative accounted for 80 per cent and above in terms of revenue were only covered

JADUAL 19.7 : PERANGKAAN UTAMA PERKHIDMATAN PERUBATAN, 1971 – 2010, MALAYSIATable 19.7 : Principal Statistics of Medical Services, 1971 – 2010, Malaysia
Tahun Hasil Perbelanjaan Bilangan Pekerja Gaji & Upah Nilai Harta-Year Revenue Expenditure pada Akhir yang Dibayar Harta Tetap
Bulan Disember Salaries & yang DimilikiNumber of Persons Wages Paid pada Akhir
Engaged as at Bulan DisemberEnd of December Value of Fixed
Jumlah Pekerja Assets OwnedTotal Bergaji as at End
Paid of DecemberEmployees RM ('000)
1971(a) 42,234 26,614 3,047 .. 5,462 9,3641972(a) 51,757 32,528 3,565 .. 6,673 12,4311973 65,959 40,535 4,251 .. 7,942 15,9931974 81,113 50,993 4,578 .. 9,493 17,2671975 86,357 54,566 5,018 4,068 11,212 20,6541976 96,582 60,595 5,211 4,232 13,183 23,1721977 107,745 68,171 5,577 .. 15,173 26,3021978 118,798 77,797 5,874 .. 18,239 30,3891979 134,630 91,440 6,340 5,312 21,621 36,4791980 .. .. .. .. .. ..1981 184,933 129,230 7,748 6,622 31,391 71,2851982 .. .. .. .. .. ..1983 234,062 174,357 8,513 7,223 42,970 66,1391984 252,417 191,576 8,711 7,426 49,894 83,8021985 270,312 216,082 9,062 7,737 56,217 87,2641986 271,808 219,957 9,204 7,818 59,054 97,0141987 294,482 234,806 10,140 8,546 62,235 103,7431988 326,442 252,772 10,727 9,037 64,757 111,5671989 372,456 284,441 11,502 9,704 71,441 132,5551990 449,775 342,334 12,899 10,971 87,887 156,3941991 567,298 433,075 15,251 12,895 107,743 195,6081992 658,809 500,851 16,699 14,087 124,002 231,5281993 .. .. .. .. .. ..1994 794,300 604,795 17,427 14,731 154,077 282,3371995 .. .. .. .. .. ..1996 1,078,630 818,009 19,687 16,606 207,071 373,4671997 .. .. .. .. .. ..1998 .. .. .. .. .. ..1999 1,240,912 972,529 21,223 17,993 253,745 464,1792000 .. .. .. .. .. ..2001 .. .. .. .. .. ..2002 1,452,783 1,150,875 22,106 18,934 309,457 523,1602003 1,642,164 1,292,140 23,411 20,122 349,197 569,3462004 .. .. .. .. .. ..2005 2,382,923 1,862,303 28,707 25,184 516,132 825,5892006 .. .. .. .. .. ..2007 2,991,160 2,328,512 30,612 27,013 631,147 856,856
2009(1) 1,558,157 1,278,344 15,478 13,965 326,945 365,580
RM ('000) RM ('000) RM ('000)
2008 .. .. .. .. .. ..
2010 2,973,675 2,278,709 28,800 25,121 631,232 871,761
200
Nota / Note:(1) Bagi tahun rujukan 2009, perkhidmatan perubatan hanya meliputi klinik perubatan am, di mana liputan merujuk kepada
pertubuhan yang menyumbang 80 peratus secara kumulatif dari jumlah hasilFor reference year 2009, medical services only covered general medical clinics, whereby the coverage refers to a survey whereestablishments which cumulatively contributed 80 per cent of total revenue were covered

JADUAL 19.8 : PERANGKAAN UTAMA PERKHIDMATAN PERGIGIAN, 1971 – 2010, MALAYSIATable 19.8 : Principal Statistics of Dental Services, 1971 – 2010, Malaysia
Tahun Hasil Perbelanjaan Bilangan Pekerja Gaji & Upah Nilai Harta-Year Revenue Expenditure pada Akhir yang Dibayar Harta Tetap
Bulan Disember Salaries & yang DimilikiNumber of Persons Wages Paid pada Akhir
Engaged as at Bulan DisemberEnd of December Value of Fixed
Jumlah Pekerja Assets OwnedTotal Bergaji as at End
Paid of DecemberEmployees RM ('000)
1971(a) 2,660 1,446 269 .. 360 987
1972(a) 3,316 1,755 310 .. 436 1,245
1973(a) 3,860 2,101 355 .. 507 1,854
1974(a) 4,757 2,641 386 .. 635 2,157
1975 5,576 3,327 444 328 830 2,696
1976 6,517 3,717 496 368 974 2,946
1977 7,372 4,190 513 .. 1,127 3,067
1978 8,546 4,984 565 .. 1,264 3,614
1979 11,130 7,196 706 515 1,769 4,914
1980 .. .. .. .. .. ..
1981 18,556 12,913 1,000 737 3,058 8,2461982 .. .. .. .. .. ..1983 26,740 19,029 1,301 951 4,042 11,098
1984 31,389 22,743 1,414 1,028 5,188 13,638
1985 36,500 27,179 1,680 1,221 6,383 14,465
1986 39,276 30,861 1,804 1,309 6,918 15,621
1987 40,750 31,015 1,898 1,386 6,943 16,026
1988 43,924 32,474 1,931 1,406 7,425 17,055
1989 49,629 35,404 2,076 1,512 8,325 17,380
1990 53,312 37,237 2,058 1,510 8,943 18,836
1991 61,521 43,728 2,174 1,637 10,597 20,637
1992 68,533 48,858 2,200 1,649 11,734 23,912
1993 .. .. .. .. .. ..
1994 90,506 62,183 2,528 1,898 16,230 31,355
1995 .. .. .. .. .. ..
1996 118,919 81,837 2,812 2,094 21,529 37,965
1997 .. .. .. .. .. ..
1998 .. .. .. .. .. ..
1999 152,709 107,634 3,281 2,465 31,730 54,089
2000 .. .. .. .. .. ..
2001 .. .. .. .. .. ..
2002 200,774 141,591 3,884 2,983 42,842 77,950
2003 229,314 161,836 4,085 3,115 48,935 86,439
2004 .. .. .. .. .. ..2005 281,928 202,798 4,658 3,706 65,390 97,899
2006 .. .. .. .. .. ..
2007 308,244 217,426 4,475 3,528 67,252 92,489
2010 468,553 323,852 5,370 4,293 91,447 115,859
RM ('000) RM ('000) RM ('000)
2008 .. .. .. .. .. ..
2009 .. .. .. .. .. ..
201

JADUAL 19.9 : PERANGKAAN UTAMA PERKHIDMATAN VETERINAR, 1971 – 2012, MALAYSIATable 19.9 : Principal Statistics of Veterinary Services, 1971 – 2012, Malaysia
Tahun Hasil Perbelanjaan Bilangan Pekerja Gaji & Upah Nilai Harta-Year Revenue Expenditure pada Akhir yang Dibayar Harta Tetap
Bulan Disember Salaries & yang DimilikiNumber of Persons Wages Paid pada Akhir
Engaged as at Bulan DisemberEnd of December Value of Fixed
Jumlah Pekerja Assets OwnedTotal Bergaji as at End
Paid of DecemberEmployees RM ('000)
1971(a) 168 128 22 .. 42 124
1972(a) 206 165 26 .. 42 1291973(a) 224 170 24 .. 37 138
1974(a) 232 166 22 .. 39 145
1975(a) 232 166 22 17 39 1451976(a) 341 275 32 19 42 185
1977(a) 469 375 36 .. 61 1371978(a) 730 592 46 29 93 194
1979(a) .. .. .. .. .. ..
1980 .. .. .. .. .. ..1981 1,332 1,097 72 50 192 449
1982 .. .. .. .. .. ..
1983 3,079 2,634 148 104 373 5931984 3,014 2,694 138 90 389 787
1985 3,501 3,233 138 88 403 7321986 3,721 3,526 154 98 448 8371987 3,825 3,281 146 90 400 1,044
1988 4,572 3,755 161 95 410 1,1831989 5,610 4,643 181 109 494 1,213
1990 6,365 5,137 183 115 512 1,607
1991 7,071 5,992 194 124 610 2,0691992 7,913 6,302 199 119 679 2,814
1993 .. .. .. .. .. ..1994 9,792 7,426 192 110 876 3,6861995 .. .. .. .. .. ..
1996 12,297 9,823 224 133 1,110 5,7051997 .. .. .. .. .. ..
1998 .. .. .. .. .. ..
1999 14,850 12,152 224 129 1,574 6,5082000 .. .. .. .. .. ..
2001 .. .. .. .. .. ..2002 21,007 17,614 314 194 2,905 8,1342003 27,097 22,564 390 256 4,040 11,110
2004 .. .. .. .. .. ..2005 40,054 32,247 468 325 6,319 12,0932006 .. .. .. .. .. ..
2007 70,586 59,517 858 690 12,178 17,526
2010 79,052 68,130 977 801 15,710 24,951
RM ('000) RM ('000) RM ('000)
2009 91,697 79,065 859 700 15,205 24,362
2008 .. .. .. .. .. ..
2011 .. .. .. .. .. ..
2012 98,381 84,915 866 710 18,961 27,025
202

JADUAL 19.10 : PERANGKAAN UTAMA PERKHIDMATAN HOSPITAL DAN RUMAH BERSALIN PERSENDIRIAN,1971 – 2010, MALAYSIA
Table 19.10 : Principal Statistics of Private Hospitals and Maternity Homes Services, 1971 – 2010, Malaysia
Tahun Hasil Perbelanjaan Bilangan Pekerja Gaji & Upah Nilai Harta-Year Revenue Expenditure pada Akhir yang Dibayar Harta Tetap
Bulan Disember Salaries & yang DimilikiNumber of Persons Wages Paid pada Akhir
Engaged as at Bulan DisemberEnd of December Value of Fixed
Jumlah Pekerja Assets OwnedTotal Bergaji as at End
Paid of DecemberRM ('000) RM ('000) Employees RM ('000) RM ('000)
1971(a) 9,966 9,239 1,420 .. 4,407 5,553
1972 10,637 9,906 1,588 .. 4,694 7,223
1973 12,048 11,313 1,728 .. 6,160 6,950
1974 18,789 17,194 2,190 .. 8,577 11,0191975 20,575 18,466 2,179 .. 9,350 11,8691976 29,607 24,088 2,478 .. 10,673 16,729
1977 33,405 28,908 2,784 .. 12,744 24,421
1978 39,854 34,568 3,260 .. 13,314 26,658
1979 48,234 43,372 3,615 .. 15,278 32,830
1980 .. .. .. .. .. ..
1981 70,302 62,403 3,977 3,913 20,719 59,418
1982 .. .. .. .. .. ..
1983 125,231 114,972 5,658 5,110 42,924 91,588
1984 136,929 130,429 6,260 6,187 46,926 102,5061985 161,698 152,905 6,417 6,337 54,517 106,912
1986 173,356 179,074 7,018 6,930 63,044 166,067
1987 200,410 205,566 7,958 7,853 68,893 235,354
1988 224,830 220,600 8,224 8,125 75,488 244,897
1989 266,806 253,409 8,829 8,739 86,086 303,055
1990 334,943 312,884 9,920 9,808 104,337 362,054
1991 416,854 375,504 10,787 10,691 122,422 398,176
1992 492,723 437,918 11,290 11,158 136,719 434,734
1993 .. .. .. .. .. ..1994 749,621 629,876 13,250 13,111 191,323 621,5431995 .. .. .. .. .. ..
1996 1,189,161 1,097,728 16,772 16,652 290,200 1,192,635
1997 .. .. .. .. .. ..
1998 .. .. .. .. .. ..
1999 1,600,163 1,531,302 18,709 18,618 364,981 1,508,600
2000 .. .. .. .. .. ..
2001 .. .. .. .. .. ..2002 2,404,325 2,403,482 23,618 23,550 608,090 2,190,1892003 2,814,000 2,594,333 26,047 25,979 666,802 2,265,5862004 .. .. .. .. .. ..
2005 3,422,226 3,087,550 27,094 27,015 723,323 2,549,846
2006 .. .. .. .. .. ..
2007 4,372,010 4,019,780 30,988 30,941 863,537 3,049,910
2008 .. .. .. .. .. ..
2009* 5,605,212 5,156,309 33,036 33,013 1,038,444 3,414,1762010 6,329,768 5,157,891 37,489 37,416 1,133,715 3,656,348
203
Nota / Note:* Bagi tahun rujukan 2009, hanya hospital swasta diliputi
For reference year 2009, only private hospitals were covered
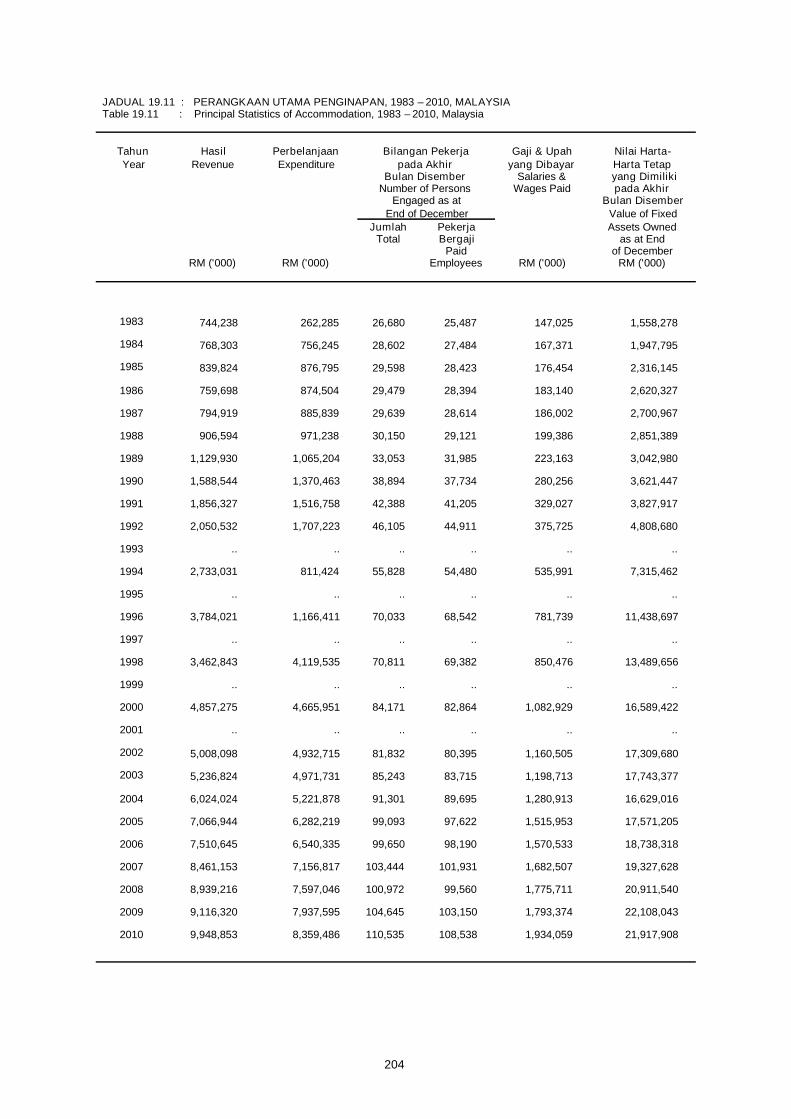
JADUAL 19.11 : PERANGKAAN UTAMA PENGINAPAN, 1983 – 2010, MALAYSIATable 19.11 : Principal Statistics of Accommodation, 1983 – 2010, Malaysia
Tahun Hasil Perbelanjaan Bilangan Pekerja Gaji & Upah Nilai Harta-Year Revenue Expenditure pada Akhir yang Dibayar Harta Tetap
Bulan Disember Salaries & yang DimilikiNumber of Persons Wages Paid pada Akhir
Engaged as at Bulan DisemberEnd of December Value of Fixed
Jumlah Pekerja Assets OwnedTotal Bergaji as at End
Paid of DecemberEmployees RM ('000)
1983 744,238 262,285 26,680 25,487 147,025 1,558,278
1984 768,303 756,245 28,602 27,484 167,371 1,947,795
1985 839,824 876,795 29,598 28,423 176,454 2,316,145
1986 759,698 874,504 29,479 28,394 183,140 2,620,327
1987 794,919 885,839 29,639 28,614 186,002 2,700,967
1988 906,594 971,238 30,150 29,121 199,386 2,851,389
1989 1,129,930 1,065,204 33,053 31,985 223,163 3,042,980
1990 1,588,544 1,370,463 38,894 37,734 280,256 3,621,447
1991 1,856,327 1,516,758 42,388 41,205 329,027 3,827,917
1992 2,050,532 1,707,223 46,105 44,911 375,725 4,808,680
1993 .. .. .. .. .. ..
1994 2,733,031 811,424 55,828 54,480 535,991 7,315,462
1995 .. .. .. .. .. ..
1996 3,784,021 1,166,411 70,033 68,542 781,739 11,438,697
1997 .. .. .. .. .. ..
1998 3,462,843 4,119,535 70,811 69,382 850,476 13,489,656
2000 4,857,275 4,665,951 84,171 82,864 1,082,929 16,589,422
2001 .. .. .. .. .. ..
2002 5,008,098 4,932,715 81,832 80,395 1,160,505 17,309,680
2003 5,236,824 4,971,731 85,243 83,715 1,198,713 17,743,377
2004 6,024,024 5,221,878 91,301 89,695 1,280,913 16,629,016
2005 7,066,944 6,282,219 99,093 97,622 1,515,953 17,571,205
2006 7,510,645 6,540,335 99,650 98,190 1,570,533 18,738,318
2007 8,461,153 7,156,817 103,444 101,931 1,682,507 19,327,628
2010 9,948,853 8,359,486 110,535 108,538 1,934,059 21,917,908
RM ('000) RM ('000) RM ('000)
2008 8,939,216 7,597,046 100,972 99,560 1,775,711 20,911,540
2009 9,116,320 7,937,595 104,645 103,150 1,793,374 22,108,043
1999 .. .. .. .. .. ..
204

JADUAL 19.12 : PERANGKAAN UTAMA PERKHIDMATAN BROKER STOK, SAHAM, KOMODITI DAN TUKARAN
Table 19.12 : Principal Statistics of Stock, Share, Commodity Brokers and Foreign Exchange Services, 1971 – 2010,
Tahun Hasil Perbelanjaan Bilangan Pekerja Gaji & Upah Nilai Harta-Year Revenue Expenditure pada Akhir yang Dibayar Harta Tetap
Bulan Disember Salaries & yang DimilikiNumber of Persons Wages Paid pada Akhir
Engaged as at Bulan DisemberEnd of December Value of Fixed
Jumlah Pekerja Assets OwnedTotal Bergaji as at End
Paid of DecemberEmployees RM ('000)
1971 6,483 4,140 404 .. 1,318 7271972 26,573 11,329 773 .. 2,932 1,2011973 39,550 22,375 1,247 .. 6,069 1,8281974 19,095 19,824 1,230 .. 5,076 2,2411975 25,836 22,317 1,194 .. 6,298 2,7111976 21,241 19,205 1,186 .. 6,110 2,3251977 27,131 21,767 1,113 .. 6,645 2,0701978 59,576 42,700 1,340 .. 9,167 2,5561979 44,076 34,656 1,312 .. 9,812 3,3691980 .. .. .. .. .. ..1981 190,460 137,069 2,006 .. 21,136 9,4001982 .. .. .. .. .. ..1983 216,447 159,788 3,216 .. 38,884 16,2131984 174,467 158,820 3,229 3,222 42,223 21,6081985 217,223 209,770 3,589 3,581 46,199 26,7811986 212,064 223,865 3,268 3,262 45,061 23,2361987 295,248 255,700 3,279 3,279 45,822 21,4451988 238,530 215,280 3,511 3,511 50,821 23,2401989 421,920 269,080 4,090 4,090 66,873 27,1701990 659,010 463,280 4,814 4,814 87,861 58,8031991 729,590 567,370 5,758 5,758 109,350 82,4611992 1,099,410 799,280 6,169 6,169 144,612 94,6061993 .. .. .. .. .. ..1994 5,394,300 3,361,530 11,537 11,537 466,264 249,7131995 .. .. .. .. .. ..1996 6,973,439 4,162,095 11,444 11,444 606,988 444,5951997 .. .. .. .. .. ..1998 3,620,723 6,619,920 9,262 9,262 380,898 701,5921999 .. .. .. .. .. ..2000 3,254,493 2,154,232 9,286 9,286 451,417 624,4372001 .. .. .. .. .. ..2002 1,680,629 1,581,702 9,541 9,541 389,946 850,5402003 1,639,455 1,506,385 7,576 7,576 321,149 513,3002004 2,215,921 1,702,897 9,225 9,203 394,624 390,9492005 2,201,972 1,887,893 9,707 9,680 398,734 501,0882006 .. .. .. .. .. ..2007 3,202,065 2,035,442 9,891 9,879 470,993 491,783
2010 1,286,617 1,708,063 3,695 3,689 145,320 320,463
RM ('000) RM ('000) RM ('000)
2009 2,308,305 1,693,616 5,825 5,825 374,895 430,9162008 .. .. .. .. .. ..
WANG ASING, 1971 – 2010, MALAYSIA
Malaysia
205
Nota / Note:Broker komoditi dimasukkan di dalam liputan bagi tahun 1983 dan seterusnyaCommodity brokers were included in the coverage from year 1983 onwardsPengurup wang dimasukkan di dalam liputan bagi tahun 2004 dan seterusnyaMoney changers were included in the coverage from year 2004 onwardsUntuk tahun 2009, data merujuk kepada Broker Stok, Saham & Bon sahajaFor the year 2009, data refer to Stock, Share & Bond Brokers only

JADUAL 19.13 : PERANGKAAN UTAMA PERKHIDMATAN HARTANAH, 1971 – 2012, MALAYSIATable 19.13 : Principal Statistics of Real Estate Services, 1971 – 2012, Malaysia
Tahun Hasil Perbelanjaan Bilangan Pekerja Gaji & Upah Nilai Harta-Year Revenue Expenditure pada Akhir yang Dibayar Harta Tetap
Bulan Disember Salaries & yang DimilikiNumber of Persons Wages Paid pada Akhir
Engaged as at Bulan DisemberEnd of December Value of Fixed
Jumlah Pekerja Assets OwnedTotal Bergaji as at End
Paid of DecemberEmployees RM ('000)
1971(a) 1,732 1,227 143 116 397 5531972(b) 2,858 1,729 213 .. 540 8651973(b) 3,652 2,739 300 .. 783 7521974(b) 3,985 3,500 358 .. 1,015 1,3601975(b) 1,745 2,021 178 .. 356 1,7041976(b) 2,151 2,130 225 .. 505 2,4051977(b) 2,866 2,144 247 .. 592 2,2751978 3,888 3,328 267 .. 734 5,6251979 5,180 4,809 308 .. 1,094 5,7451980 .. .. .. .. .. ..1981 7,818 7,157 486 .. 2,151 3,9831982 .. .. .. .. .. ..1983 12,130 10,455 633 460 3,612 4,9861984 13,400 12,712 810 625 3,770 5,0881985 14,591 13,240 1,025 790 5,247 5,3901986 14,258 12,932 1,043 828 5,293 4,4511987 22,443 20,607 1,375 1,172 6,649 4,2581988 13,873 11,822 1,014 829 4,751 4,3121989 28,791 25,696 1,353 1,159 8,231 5,7491990 37,597 33,017 1,430 1,217 11,638 9,9681991 44,763 35,437 1,237 1,038 9,274 10,1481992 53,895 43,447 1,236 1,059 12,721 11,7461993 .. .. .. .. .. ..1994 53,900 46,860 1,492 1,266 17,243 10,4681995 .. .. .. .. .. ..1996 94,462 76,240 1,493 1,285 26,802 43,5631997 .. .. .. .. .. ..1998 97,153 97,801 2,693 2,306 39,076 60,8041999 .. .. .. .. .. ..2000 167,450 154,369 3,720 3,280 62,089 51,0832001 .. .. .. .. .. ..2002 146,859 132,728 2,846 2,422 45,806 31,2302003 156,067 143,084 2,987 2,614 53,598 25,2382004 162,193 146,825 3,142 2,754 55,973 27,8492005 219,593 200,142 3,151 2,807 61,092 36,0012006 .. .. .. .. .. ..2007 344,029 306,088 3,945 3,507 89,074 86,511
2010(1) 33,962,927 26,833,222 51,936 51,152 1,579,878 46,762,854
RM ('000) RM ('000) RM ('000)
2009 .. .. .. .. .. ..2008 .. .. .. .. .. ..
2011 .. .. .. .. .. ..2012(2) 41,055,935 32,229,233 51,548 51,435 1,846,016 50,443,489
206
Nota / Note:
(1) Liputan pada tahun 2010 adalah termasuk aktiviti hartanah bagi harta milikan sendiri atau pajakanThe coverage for 2010 are including real estate activities with own or leased property
(2) Liputan pada tahun 2012 adalah tidak termasuk aktiviti hartanah atas dasar bayaran atau kontrakThe coverage for 2012 are not including real estate activities on a fee or contract basis

JADUAL 19.14 : PERANGKAAN UTAMA PERKHIDMATAN PENGIKLANAN, 1983 – 2012, MALAYSIATable 19.14 : Principal Statistics of Advertising Services, 1983 – 2012, Malaysia
Tahun Hasil Perbelanjaan Bilangan Pekerja Gaji & Upah Nilai Harta-Year Revenue Expenditure pada Akhir yang Dibayar Harta Tetap
Bulan Disember Salaries & yang DimilikiNumber of Persons Wages Paid pada Akhir
Engaged as at Bulan DisemberEnd of December Value of Fixed
Jumlah Pekerja Assets OwnedTotal Bergaji as at End
Paid of DecemberEmployees RM ('000)
1983 307,596 299,525 2,198 2,183 32,357 12,728
1984 444,965 440,993 2,475 2,446 36,788 15,335
1985 498,770 490,878 2,611 2,565 42,078 15,807
1986 451,561 456,042 2,321 2,278 40,725 16,281
1987 461,902 461,698 2,186 2,151 39,823 18,129
1988 583,621 570,793 2,218 2,182 42,633 17,806
1989 683,310 660,986 2,542 2,517 50,426 21,420
1990 875,334 845,450 3,043 3,017 66,807 31,881
1991 1,030,093 995,755 3,338 3,313 84,860 39,459
1992 1,048,857 1,032,519 3,573 3,548 91,255 77,459
1993 .. .. .. .. .. ..
1994 1,281,640 40,465 3,705 3,690 119,011 53,632
1995 .. .. .. .. .. ..
1996 1,779,691 21,625 4,079 4,056 152,035 77,368
1997 .. .. .. .. .. ..
1998 1,329,343 1,300,172 3,197 3,185 147,218 82,773
2000 1,720,755 1,670,432 2,997 2,987 148,008 98,700
2001 .. .. .. .. .. ..
2002 2,027,517 1,972,358 3,619 3,581 175,834 115,974
2003 2,172,796 2,098,356 3,855 3,802 187,625 113,195
2004 1,767,489 1,686,612 3,819 3,767 197,580 109,159
2005 2,106,548 2,014,947 5,971 5,824 253,582 153,476
2006 .. .. .. .. .. ..
2007 2,078,308 1,948,567 6,354 6,190 289,514 154,193
2010 3,019,314 2,372,311 6,762 6,568 288,314 270,769
RM ('000) RM ('000) RM ('000)
2009 2,495,675 2,190,713 6,414 6,294 295,781 232,905
2008 .. .. .. .. .. ..
1999 .. .. .. .. .. ..
2011 .. .. .. .. .. ..
2012 3,536,900 2,926,213 8,419 8,067 344,495 278,202
207

JADUAL 19.15 : PERANGKAAN UTAMA PERKHIDMATAN BAS, 1971 – 2010, MALAYSIATable 19.15 : Principal Statistics of Bus Services, 1971 – 2010, Malaysia
Tahun Hasil Perbelanjaan Bilangan Pekerja Gaji & Upah Nilai Harta-Year Revenue Expenditure pada Akhir yang Dibayar Harta Tetap
Bulan Disember Salaries & yang DimilikiNumber of Persons Wages Paid pada Akhir
Engaged as at Bulan DisemberEnd of December Value of Fixed
Jumlah Pekerja Assets OwnedTotal Bergaji as at End
Paid of DecemberEmployees RM ('000)
1971(a) 107,341 98,930 12,770 .. 35,181 48,710
1972 136,330 124,678 15,352 .. 45,033 61,4311973 155,472 137,873 16,186 .. 49,078 66,1421974 186,728 174,610 17,395 .. 58,803 85,5121975 209,426 204,069 18,965 .. 65,131 95,530
1976 235,384 227,929 19,916 .. 70,601 113,828
1977 248,694 242,199 20,200 .. 76,702 128,416
1978 279,317 261,897 20,322 .. 81,245 137,036
1979 315,614 298,683 20,987 .. 92,764 153,005
1980 .. .. .. .. .. ..
1981 422,809 405,723 22,012 .. 130,557 185,8281982 .. .. .. .. .. ..1983 488,330 485,615 24,514 .. 164,626 236,747
1984 566,834 569,701 25,644 25,480 179,167 262,808
1985 594,782 582,387 26,200 26,030 193,118 260,070
1986 591,954 569,244 26,279 26,131 195,480 268,813
1987 609,705 582,085 26,288 26,124 196,496 261,633
1988 650,810 608,390 26,350 26,184 207,698 259,0101989 707,420 661,500 27,693 27,515 221,298 298,360
1990 743,650 705,830 27,750 27,584 233,612 329,868
1991 770,320 742,660 27,181 27,005 241,145 375,315
1992 820,920 779,990 26,818 26,655 255,526 410,5901993 .. .. .. .. .. ..
1994 884,690 847,670 26,048 25,907 279,807 525,506
1995 .. .. .. .. .. ..1996 910,168 908,185 24,526 24,444 277,043 832,667
1997 .. .. .. .. .. ..
1998 959,688 1,019,206 20,930 20,915 239,153 998,9731999 .. .. .. .. .. ..2000B 1,117,416 1,082,907 20,535 20,524 288,994 897,219
2001 .. .. .. .. .. ..
2002 1,029,804 1,094,684 17,980 17,947 292,792 755,7262003 965,527 1,166,960 18,172 18,146 302,644 710,957
2004 906,831 986,289 16,108 16,032 252,889 653,307
2005B 1,095,636 1,136,610 18,623 17,788 281,150 699,7342006 1,168,390 1,267,378 16,458 16,303 294,166 835,508
2007 .. .. .. .. .. ..
2010 2,081,884 1,771,402 31,510 20,937 379,648 1,055,002
RM ('000) RM ('000) RM ('000)
2009 .. .. .. .. .. ..
2008 1,385,708 1,383,999 16,804 16,570 315,737 745,833
208

JADUAL 19.16 : PERANGKAAN UTAMA PENGANGKUTAN MUATAN MELALUI JALAN RAYA, 1971 – 2010,MALAYSIA
Table 19.16 : Principal Statistics of Freight Transport by Road , 1971 – 2010, Malaysia
Tahun Hasil Perbelanjaan Bilangan Pekerja Gaji & Upah Nilai Harta-Year Revenue Expenditure pada Akhir yang Dibayar Harta Tetap
Bulan Disember Salaries & yang DimilikiNumber of Persons Wages Paid pada Akhir
Engaged as at Bulan DisemberEnd of December Value of Fixed
Jumlah Pekerja Assets OwnedTotal Bergaji as at End
Paid of DecemberRM ('000) RM ('000) Employees RM ('000) RM ('000)
1971(a) 68,636 59,235 5,573 .. 14,650 17,775
1972 83,900 72,766 6,758 .. 17,582 22,6411973 120,567 113,938 9,011 .. 23,944 35,872
1974 221,746 204,130 16,622 .. 42,395 78,6721975 226,285 215,424 17,217 .. 46,044 92,807
1976 240,152 229,057 17,316 .. 47,565 105,2271977 292,475 270,175 18,873 .. 57,121 121,255
1978 344,862 316,333 20,716 .. 67,454 147,1791979 394,855 360,806 21,301 .. 75,476 159,887
1980 .. .. .. .. .. ..1981 593,248 551,836 23,499 .. 101,676 289,472
1982 .. .. .. .. .. ..1983 747,232 689,606 26,891 .. 149,018 300,046
1984 887,236 845,667 28,773 24,835 168,483 413,4491985 865,499 815,040 28,901 24,968 175,761 395,793
1986 881,947 820,328 29,989 25,856 182,629 374,3311987 957,706 880,855 30,806 26,610 191,682 339,554
1988 1,094,570 997,990 32,240 27,793 211,247 358,0901989 1,322,430 1,208,310 37,381 32,554 255,112 447,500
1990 1,591,530 1,416,410 40,454 35,500 294,098 453,0961991 2,106,110 1,806,510 45,986 40,302 356,467 716,574
1992 2,196,340 2,005,650 47,198 41,263 397,901 806,4371993 .. .. .. .. .. ..
1994 2,881,530 2,582,960 50,342 44,496 523,181 1,210,6541995 .. .. .. .. .. ..
1996 3,752,578 3,407,047 51,983 46,421 647,484 1,742,9961997 .. .. .. .. .. ..
1998 4,011,070 3,826,168 52,287 47,113 691,172 2,074,5861999 .. .. .. .. .. ..
2000 4,026,437 3,664,432 37,110 36,668 641,957 1,775,0052001 .. .. .. .. .. ..
2002 4,089,530 3,830,976 32,293 31,942 612,476 1,746,1682003 4,616,160 4,324,518 35,546 35,227 728,392 1,909,024
2004 5,114,583 4,747,369 43,380 41,672 829,118 1,951,2122005 7,403,107 6,836,848 62,159 57,415 1,147,814 2,793,9722006 6,724,395 6,419,780 48,161 47,092 1,066,137 2,509,8692007 .. .. .. .. .. ..
2010 14,257,728 12,344,576 89,630 83,727 2,012,710 6,702,545
2009 10,269,315 9,525,905 56,435 55,789 1,353,376 3,766,1942008 10,310,448 9,316,684 51,842 51,120 1,214,142 3,131,699
209
Nota / Note:Data bagi tahun 2000, 2005 dan 2010 merujuk kepada banci, manakala data bagi tahun – tahun lain merujuk kepada penyiasatandimana pertubuhan yang diliputi adalah yang mempunyai hasil RM500,000 dan ke atasData for 2000, 2005 and 2010 refer to census, while data for the other years refer to surveys where establishments with revenueRM500,000 and above were covered

JADUAL 19.17 : PERANGKAAN UTAMA PENGANGKUTAN LAUT, 1971 – 2010, MALAYSIATable 19.17 : Principal Statistics of Sea Transport, 1971 – 2010, Malaysia
Tahun Hasil Perbelanjaan Bilangan Pekerja Gaji & Upah Nilai Harta-Year Revenue Expenditure pada Akhir yang Dibayar Harta Tetap
Bulan Disember Salaries & yang DimilikiNumber of Persons Wages Paid pada Akhir
Engaged as at Bulan DisemberEnd of December Value of Fixed
Jumlah Pekerja Assets OwnedTotal Bergaji as at End
Paid of DecemberEmployees RM ('000)
1971(a) 25,869 28,289 689 .. 3,314 87,1131972(a) 59,628 58,991 1,235 .. 6,255 175,4051973(b) 98,846 92,643 2,449 .. 12,559 266,4061974(b) 163,919 133,576 2,690 .. 16,027 371,4701975 175,187 150,402 3,182 .. 20,167 566,6841976 248,593 215,239 3,397 .. 24,043 853,0191977 274,733 267,024 3,524 .. 24,948 529,2081978 394,692 377,441 4,313 .. 31,350 540,7671979 527,074 493,236 5,448 .. 41,662 2,119,7261980 .. .. .. .. .. ..
1981 815,392 773,615 8,456 .. 70,585 3,414,7321982 .. .. .. .. .. ..1983 1,055,296 1,140,388 9,773 .. 108,293 3,550,0601984 1,402,755 1,375,720 10,759 10,619 118,636 4,161,7741985 1,687,786 1,653,073 11,215 11,099 130,252 4,140,530
1986 1,930,517 1,649,759 10,612 10,506 105,586 3,942,8491987 2,070,162 1,830,795 9,770 9,675 119,362 3,698,8181988 2,313,988 1,915,985 9,719 9,626 123,120 3,502,0381989 2,446,181 1,851,636 9,872 9,799 127,632 3,514,5771990 2,490,180 1,918,310 10,892 10,819 144,394 3,814,240
1991 2,707,630 2,087,480 11,239 11,162 157,130 4,029,1081992 2,974,860 2,433,360 12,300 12,232 181,242 4,123,9381993 .. .. .. .. .. ..1994 3,427,260 2,809,390 11,986 11,934 226,746 5,031,0531995 .. .. .. .. .. ..
1996 3,458,810 2,813,680 13,390 13,345 286,693 6,014,9991997 .. .. .. .. .. ..1998 5,513,040 4,735,119 16,831 16,790 396,664 10,042,8531999 .. .. .. .. .. ..2000 7,631,132 5,921,978 16,974 16,917 462,633 11,070,3182001 .. .. .. .. .. ..2002 7,940,919 5,816,962 17,300 17,244 471,054 11,013,836
2003 8,720,815 6,484,441 18,378 18,318 598,119 12,702,4732004 11,459,981 6,608,617 16,977 16,925 588,917 10,620,8892005 11,469,669 8,182,740 16,102 16,058 539,283 13,795,1212006 13,331,211 8,441,460 18,914 18,870 853,462 17,346,2682007 13,040,813 9,634,093 20,997 20,966 871,541 15,445,399
2010 14,990,778 10,522,100 20,973 20,917 1,028,156 26,747,768
RM ('000) RM ('000) RM ('000)
2008 14,634,616 10,998,653 21,042 21,016 874,213 15,606,9842009 11,082,086 9,168,943 19,198 19,175 873,192 17,331,371
210
Data bagi tahun 2007- 2009 meliputi perkhidmatan pengangkutan kapal muatan dan tunda & tolak sahajaData presented for years 2007– 2009 refer to freight transportation by sea and towing & pushing services only
Nota / Note:
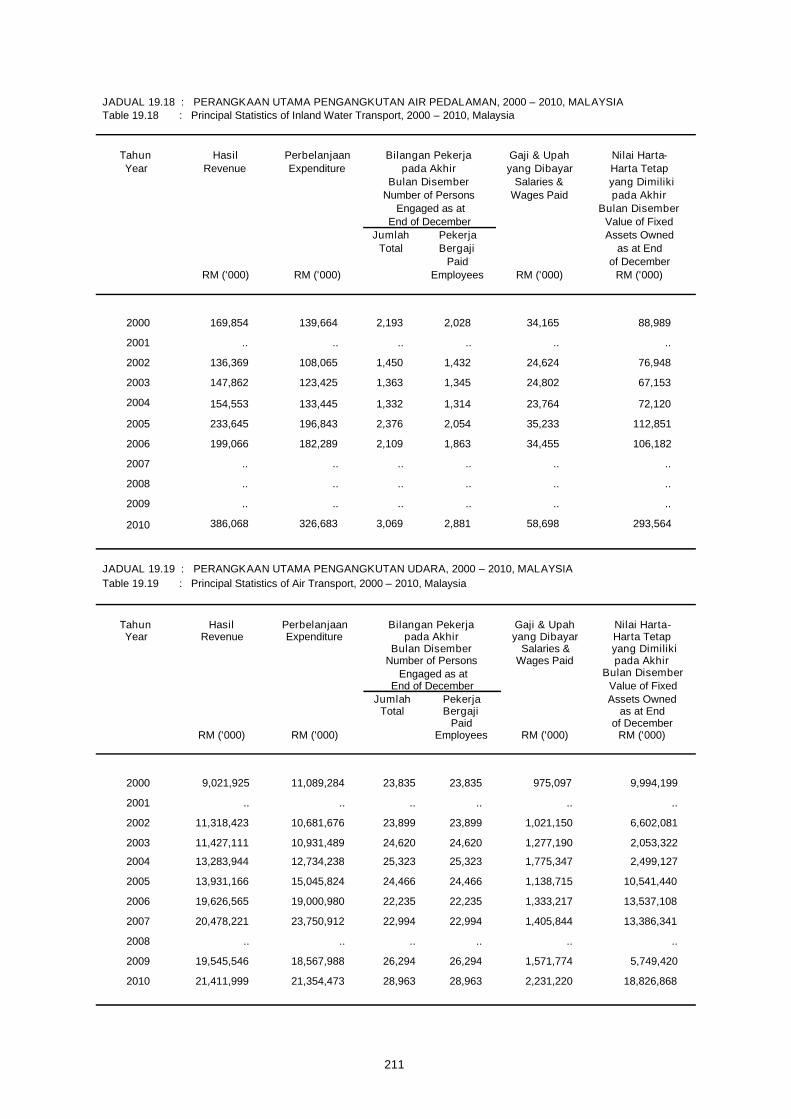
JADUAL 19.18 : PERANGKAAN UTAMA PENGANGKUTAN AIR PEDALAMAN, 2000 – 2010, MALAYSIATable 19.18 : Principal Statistics of Inland Water Transport, 2000 – 2010, Malaysia
Tahun Hasil Perbelanjaan Bilangan Pekerja Gaji & Upah Nilai Harta-Year Revenue Expenditure pada Akhir yang Dibayar Harta Tetap
Bulan Disember Salaries & yang DimilikiNumber of Persons Wages Paid pada Akhir
Engaged as at Bulan DisemberEnd of December Value of Fixed
Jumlah Pekerja Assets OwnedTotal Bergaji as at End
Paid of DecemberEmployees RM ('000)
2000 169,854 139,664 2,193 2,028 34,165 88,989
2001 .. .. .. .. .. ..
2002 136,369 108,065 1,450 1,432 24,624 76,948
2003 147,862 123,425 1,363 1,345 24,802 67,153
2004 154,553 133,445 1,332 1,314 23,764 72,120
2005 233,645 196,843 2,376 2,054 35,233 112,851
2006 199,066 182,289 2,109 1,863 34,455 106,182
2007 .. .. .. .. .. ..
2010 386,068 326,683 3,069 2,881 58,698 293,564
RM ('000) RM ('000) RM ('000)
2009 .. .. .. .. .. ..
2008 .. .. .. .. .. ..
JADUAL 19.19 : PERANGKAAN UTAMA PENGANGKUTAN UDARA, 2000 – 2010, MALAYSIATable 19.19 : Principal Statistics of Air Transport, 2000 – 2010, Malaysia
Tahun Hasil Perbelanjaan Bilangan Pekerja Gaji & Upah Nilai Harta-Year Revenue Expenditure pada Akhir yang Dibayar Harta Tetap
Bulan Disember Salaries & yang DimilikiNumber of Persons Wages Paid pada Akhir
Engaged as at Bulan DisemberEnd of December Value of Fixed
Jumlah Pekerja Assets OwnedTotal Bergaji as at End
Paid of DecemberEmployees RM ('000)
2000 9,021,925 11,089,284 23,835 23,835 975,097 9,994,199
2001 .. .. .. .. .. ..
2002 11,318,423 10,681,676 23,899 23,899 1,021,150 6,602,081
2003 11,427,111 10,931,489 24,620 24,620 1,277,190 2,053,322
2004 13,283,944 12,734,238 25,323 25,323 1,775,347 2,499,127
2005 13,931,166 15,045,824 24,466 24,466 1,138,715 10,541,440
2006 19,626,565 19,000,980 22,235 22,235 1,333,217 13,537,108
2007 20,478,221 23,750,912 22,994 22,994 1,405,844 13,386,341
2010 21,411,999 21,354,473 28,963 28,963 2,231,220 18,826,868
RM ('000) RM ('000) RM ('000)
2009 19,545,546 18,567,988 26,294 26,294 1,571,774 5,749,420
2008 .. .. .. .. .. ..
211

JADUAL 19.20 : PERANGKAAN UTAMA PERKHIDMATAN KERETA API / TRANSIT ALIRAN RINGAN, 2000 – 2010,MALAYSIA
Table 19.20 : Principal Statistics of Train / Light Rail Transit Services , 2000 – 2010, Malaysia
Tahun Hasil Perbelanjaan Bilangan Pekerja Gaji & Upah Nilai Harta-Year Revenue Expenditure pada Akhir yang Dibayar Harta Tetap
Bulan Disember Salaries & yang DimilikiNumber of Persons Wages Paid pada Akhir
Engaged as at Bulan DisemberEnd of December Value of Fixed
Jumlah Pekerja Assets OwnedTotal Bergaji as at End
Paid of DecemberEmployees RM ('000)
2000 388,724 728,450 6,588 6,588 127,504 4,030,329
2001 .. .. .. .. .. ..
2002 497,449 645,596 6,735 6,735 162,842 11,325,568
2003 628,282 901,032 6,916 6,916 187,930 12,411,703
2004 1,027,099 1,339,600 8,546 8,546 252,815 12,348,498
2005 690,943 812,504 6,368 6,368 185,299 4,264,979
2006 726,328 866,034 6,428 6,428 187,310 4,186,086
2007 727,251 862,328 6,543 6,543 198,981 4,152,544
2010 837,673 1,226,443 7,319 7,319 234,804 4,121,372
RM ('000) RM ('000) RM ('000)
2009 .. .. .. .. .. ..
2008 .. .. .. .. .. ..
212
JADUAL 19.21 : PERANGKAAN UTAMA PERKHIDMATAN PENGENDALIAN KARGO, 2000 – 2010, MALAYSIA
Tahun Hasil Perbelanjaan Bilangan Pekerja Gaji & Upah Nilai Harta-Year Revenue Expenditure pada Akhir yang Dibayar Harta Tetap
Bulan Disember Salaries & yang DimilikiNumber of Persons Wages Paid pada Akhir
Engaged as at Bulan DisemberEnd of December Value of Fixed
Jumlah Pekerja Assets OwnedTotal Bergaji as at End
Paid of DecemberEmployees RM ('000)
2000 917,775 781,182 5,550 5,546 148,414 495,020
2001 .. .. .. .. .. ..
2002 482,678 472,168 2,247 2,241 51,589 49,299
2003 354,077 328,494 2,241 2,237 57,137 157,308
2004 245,870 222,652 1,629 1,625 45,654 161,757
2005 902,631 849,426 4,558 4,529 116,902 279,273
2006 1,221,811 983,493 5,990 5,942 155,112 475,986
2007 .. .. .. .. .. ..
2010 1,210,942 1,072,607 5,563 5,487 156,596 265,532
RM ('000) RM ('000) RM ('000)
2009 .. .. .. .. .. ..
2008 1,440,539 1,301,480 6,516 6,470 175,468 630,680
Table 19.21 : Principal Statistics of Cargo Handling Services, 2000 – 2010, Malaysia
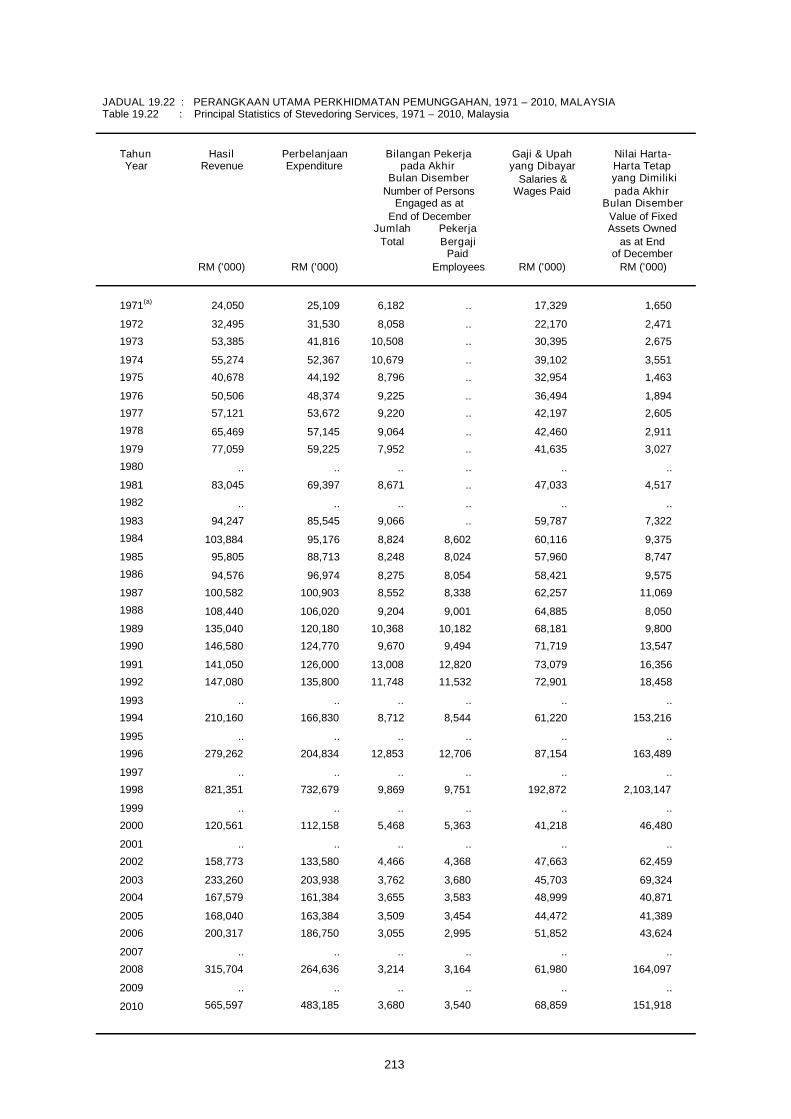
JADUAL 19.22 : PERANGKAAN UTAMA PERKHIDMATAN PEMUNGGAHAN, 1971 – 2010, MALAYSIATable 19.22 : Principal Statistics of Stevedoring Services, 1971 – 2010, Malaysia
Tahun Hasil Perbelanjaan Bilangan Pekerja Gaji & Upah Nilai Harta-Year Revenue Expenditure pada Akhir yang Dibayar Harta Tetap
Bulan Disember Salaries & yang DimilikiNumber of Persons Wages Paid pada Akhir
Engaged as at Bulan DisemberEnd of December Value of Fixed
Jumlah Pekerja Assets OwnedTotal Bergaji as at End
Paid of DecemberEmployees RM ('000)
1971(a) 24,050 25,109 6,182 .. 17,329 1,650
1972 32,495 31,530 8,058 .. 22,170 2,471
1973 53,385 41,816 10,508 .. 30,395 2,675
1974 55,274 52,367 10,679 .. 39,102 3,551
1975 40,678 44,192 8,796 .. 32,954 1,463
1976 50,506 48,374 9,225 .. 36,494 1,894
1977 57,121 53,672 9,220 .. 42,197 2,605
1978 65,469 57,145 9,064 .. 42,460 2,911
1979 77,059 59,225 7,952 .. 41,635 3,027
1980 .. .. .. .. .. ..
1981 83,045 69,397 8,671 .. 47,033 4,517
1982 .. .. .. .. .. ..
1983 94,247 85,545 9,066 .. 59,787 7,322
1984 103,884 95,176 8,824 8,602 60,116 9,375
1985 95,805 88,713 8,248 8,024 57,960 8,747
1986 94,576 96,974 8,275 8,054 58,421 9,575
1987 100,582 100,903 8,552 8,338 62,257 11,069
1988 108,440 106,020 9,204 9,001 64,885 8,050
1989 135,040 120,180 10,368 10,182 68,181 9,800
1990 146,580 124,770 9,670 9,494 71,719 13,547
1991 141,050 126,000 13,008 12,820 73,079 16,356
1992 147,080 135,800 11,748 11,532 72,901 18,458
1993 .. .. .. .. .. ..
1994 210,160 166,830 8,712 8,544 61,220 153,216
1995 .. .. .. .. .. ..
1996 279,262 204,834 12,853 12,706 87,154 163,489
1997 .. .. .. .. .. ..
1998 821,351 732,679 9,869 9,751 192,872 2,103,147
1999 .. .. .. .. .. ..
2000 120,561 112,158 5,468 5,363 41,218 46,480
2001 .. .. .. .. .. ..
2002 158,773 133,580 4,466 4,368 47,663 62,459
2003 233,260 203,938 3,762 3,680 45,703 69,324
2004 167,579 161,384 3,655 3,583 48,999 40,871
2005 168,040 163,384 3,509 3,454 44,472 41,389
2006 200,317 186,750 3,055 2,995 51,852 43,624
2007 .. .. .. .. .. ..
2010 565,597 483,185 3,680 3,540 68,859 151,918
RM ('000) RM ('000) RM ('000)
2009 .. .. .. .. .. ..
2008 315,704 264,636 3,214 3,164 61,980 164,097
213

JADUAL 19.23 : PERANGKAAN UTAMA PERKHIDMATAN PENYIMPANAN DAN GUDANG, 2000 – 2010, MALAYSIATable 19.23 : Principal Statistics for Storage and Warehousing Services, 2000 – 2010, Malaysia
Tahun Hasil Perbelanjaan Bilangan Pekerja Gaji & Upah Nilai Harta-Year Revenue Expenditure pada Akhir yang Dibayar Harta Tetap
Bulan Disember Salaries & yang DimilikiNumber of Persons Wages Paid pada Akhir
Engaged as at Bulan DisemberEnd of December Value of Fixed
Jumlah Pekerja Assets OwnedTotal Bergaji as at End
Paid of DecemberEmployees RM ('000)
2000 95,413 61,386 615 614 12,284 262,317
2001 .. .. .. .. .. ..2002 158,407 121,547 954 954 23,222 383,224
2003 390,228 401,493 2,674 2,672 64,932 366,1912004 460,770 255,264 2,343 2,341 58,014 299,9172005 578,029 377,232 1,747 1,747 55,694 469,915
2006 568,977 491,789 2,570 2,570 85,717 528,7332007 .. .. .. .. .. ..
2010 952,087 767,603 4,986 4,928 138,663 1,597,979
RM ('000) RM ('000) RM ('000)
2009 .. .. .. .. .. ..
2008 597,477 500,869 3,050 3,050 90,458 650,680
214
JADUAL 19.24 : PERANGKAAN UTAMA PERKHIDMATAN TEMPAT LETAK KERETA, 2002 – 2010, MALAYSIATable 19.24 : Principal Statistics of Parking Lots Services, 2002 – 2010, Malaysia
Tahun Hasil Perbelanjaan Bilangan Pekerja Gaji & Upah Nilai Harta-Year Revenue Expenditure pada Akhir yang Dibayar Harta Tetap
Bulan Disember Salaries & yang DimilikiNumber of Persons Wages Paid pada Akhir
Engaged as at Bulan DisemberEnd of December Value of Fixed
Jumlah Pekerja Assets OwnedTotal Bergaji as at End
Paid of DecemberEmployees RM ('000)
2002 197,364 181,709 2,313 2,256 30,195 161,201
2003 340,349 288,527 3,456 3,398 52,173 393,174
2004 370,359 331,180 3,740 3,695 54,659 370,152
2005 393,482 347,377 4,052 3,987 62,750 438,160
2006 446,839 386,391 4,211 4,141 64,687 469,273
2007 .. .. .. .. .. ..
2010 550,221 420,438 4,142 4,057 70,715 585,612
RM ('000) RM ('000) RM ('000)
2009 .. .. .. .. .. ..
2008 .. .. .. .. .. ..

JADUAL 19.25 : PERANGKAAN UTAMA PERKHIDMATAN PENGOPERASIAN LEBUH RAYA, 2000 – 2010,
Table 19.25 : Principal Statistics of Highway Operation Services, 2000 – 2010, Malaysia
Tahun Hasil Perbelanjaan Bilangan Pekerja Gaji & Upah Nilai Harta-Year Revenue Expenditure pada Akhir yang Dibayar Harta Tetap
Bulan Disember Salaries & yang DimilikiNumber of Persons Wages Paid pada Akhir
Engaged as at Bulan DisemberEnd of December Value of Fixed
Jumlah Pekerja Assets OwnedTotal Bergaji as at End
Paid of DecemberRM ('000) RM ('000) Employees
2000 2,706,599 1,532,570 5,179 5,179 110,266 16,567,967
2001 .. .. .. .. .. ..
2002 2,407,477 6,122,661 5,253 5,253 115,968 11,783,2292003 2,548,833 1,799,525 5,029 5,029 126,453 9,811,2852004 3,123,196 2,188,535 5,279 5,279 133,197 11,934,437
2005 3,426,582 2,091,222 5,402 5,402 131,565 10,844,164
2006 3,729,967 2,358,876 6,070 6,070 150,098 14,076,3782007 4,256,097 2,664,364 6,200 6,200 162,047 14,010,225
2010 7,292,618 3,203,610 7,150 7,150 178,753 14,558,103
RM ('000) RM ('000)
2009 4,874,356 2,733,439 6,228 6,228 162,610 16,589,749
2008 .. .. .. .. .. ..
MALAYSIA
JADUAL 19.26 : PERANGKAAN UTAMA PERKHIDMATAN PENGOPERASIAN PELABUHAN, 2000 – 2010,
Table 19.26 : Principal Statistics of Port Operations Services, 2000 – 2010, Malaysia
Tahun Hasil Perbelanjaan Bilangan Pekerja Gaji & Upah Nilai Harta-Year Revenue Expenditure pada Akhir yang Dibayar Harta Tetap
Bulan Disember Salaries & yang DimilikiNumber of Persons Wages Paid pada Akhir
Engaged as at Bulan DisemberEnd of December Value of Fixed
Jumlah Pekerja Assets OwnedTotal Bergaji as at End
Paid of DecemberEmployees RM ('000)
2000 1,296,956 1,187,505 8,085 8,085 269,895 4,925,560
2001 .. .. .. .. .. ..2002 2,016,005 1,729,186 9,008 9,008 348,247 5,376,9072003 2,416,566 1,838,502 9,976 9,976 375,877 5,733,507
2004 2,657,754 1,939,149 10,025 10,025 388,006 5,723,471
2005 2,704,332 2,057,811 10,070 10,070 426,204 6,199,965
2006 3,335,271 2,524,077 10,192 10,192 396,235 6,363,8892007 .. .. .. .. .. ..
2010 4,830,377 3,062,177 12,661 12,661 508,034 10,237,605
RM ('000) RM ('000) RM ('000)
2009 3,747,526 3,199,367 12,651 12,651 452,281 10,762,569
2008 3,781,302 2,602,026 11,034 11,034 451,470 9,136,561
MALAYSIA
215
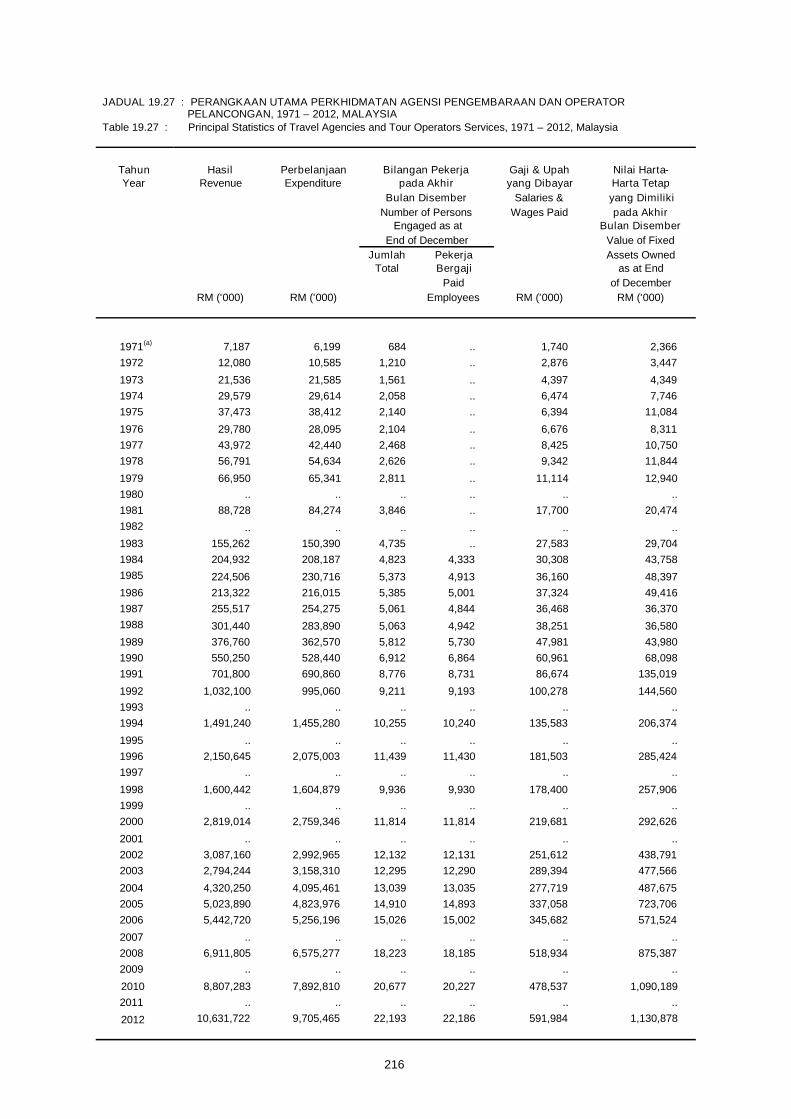
216
JADUAL 19.27 : PERANGKAAN UTAMA PERKHIDMATAN AGENSI PENGEMBARAAN DAN OPERATOR
Table 19.27 : Principal Statistics of Travel Agencies and Tour Operators Services, 1971 – 2012, Malaysia
Tahun Hasil Perbelanjaan Bilangan Pekerja Gaji & Upah Nilai Harta-Year Revenue Expenditure pada Akhir yang Dibayar Harta Tetap
Bulan Disember Salaries & yang DimilikiNumber of Persons Wages Paid pada Akhir
Engaged as at Bulan DisemberEnd of December Value of Fixed
Jumlah Pekerja Assets OwnedTotal Bergaji as at End
Paid of DecemberEmployees RM ('000)
1971(a) 7,187 6,199 684 .. 1,740 2,3661972 12,080 10,585 1,210 .. 2,876 3,447
1973 21,536 21,585 1,561 .. 4,397 4,3491974 29,579 29,614 2,058 .. 6,474 7,7461975 37,473 38,412 2,140 .. 6,394 11,084
1976 29,780 28,095 2,104 .. 6,676 8,3111977 43,972 42,440 2,468 .. 8,425 10,7501978 56,791 54,634 2,626 .. 9,342 11,844
1979 66,950 65,341 2,811 .. 11,114 12,9401980 .. .. .. .. .. ..1981 88,728 84,274 3,846 .. 17,700 20,4741982 .. .. .. .. .. ..1983 155,262 150,390 4,735 .. 27,583 29,7041984 204,932 208,187 4,823 4,333 30,308 43,7581985 224,506 230,716 5,373 4,913 36,160 48,3971986 213,322 216,015 5,385 5,001 37,324 49,4161987 255,517 254,275 5,061 4,844 36,468 36,3701988 301,440 283,890 5,063 4,942 38,251 36,5801989 376,760 362,570 5,812 5,730 47,981 43,9801990 550,250 528,440 6,912 6,864 60,961 68,0981991 701,800 690,860 8,776 8,731 86,674 135,019
1992 1,032,100 995,060 9,211 9,193 100,278 144,5601993 .. .. .. .. .. ..1994 1,491,240 1,455,280 10,255 10,240 135,583 206,374
1995 .. .. .. .. .. ..1996 2,150,645 2,075,003 11,439 11,430 181,503 285,4241997 .. .. .. .. .. ..
1998 1,600,442 1,604,879 9,936 9,930 178,400 257,9061999 .. .. .. .. .. ..2000 2,819,014 2,759,346 11,814 11,814 219,681 292,626
2001 .. .. .. .. .. ..2002 3,087,160 2,992,965 12,132 12,131 251,612 438,7912003 2,794,244 3,158,310 12,295 12,290 289,394 477,566
2004 4,320,250 4,095,461 13,039 13,035 277,719 487,6752005 5,023,890 4,823,976 14,910 14,893 337,058 723,7062006 5,442,720 5,256,196 15,026 15,002 345,682 571,524
2007 .. .. .. .. .. ..
2010 8,807,283 7,892,810 20,677 20,227 478,537 1,090,189
RM ('000) RM ('000) RM ('000)
2008 6,911,805 6,575,277 18,223 18,185 518,934 875,3872009 .. .. .. .. .. ..
PELANCONGAN, 1971 – 2012, MALAYSIA
2011 .. .. .. .. .. ..
2012 10,631,722 9,705,465 22,193 22,186 591,984 1,130,878

JADUAL 19.28 : PERANGKAAN UTAMA AGENSI PERKAPALAN, 1971 – 2010, MALAYSIATable 19.28 : Principal Statistics of Shipping Agencies, 1971 – 2010, Malaysia
Tahun Hasil Perbelanjaan Bilangan Pekerja Gaji & Upah Nilai Harta-Year Revenue Expenditure pada Akhir yang Dibayar Harta Tetap
Bulan Disember Salaries & yang DimilikiNumber of Persons Wages Paid pada Akhir
Engaged as at Bulan DisemberEnd of December Value of Fixed
Jumlah Pekerja Assets OwnedTotal Bergaji as at End
Paid of DecemberEmployees RM ('000)
1971(a) 14,384 10,264 1,177 .. 5,550 2,313
1972 18,487 13,147 1,419 .. 6,947 2,933
1973 25,544 17,852 1,885 .. 9,523 4,515
1974 31,811 22,232 2,028 .. 11,080 5,011
1975 24,437 20,349 1,493 .. 8,467 6,495
1976 31,382 24,211 1,812 .. 11,032 6,946
1977 36,852 30,294 2,072 .. 12,970 8,439
1978 44,814 34,563 2,347 .. 15,772 9,135
1979 53,025 42,240 2,393 .. 17,763 10,271
1980 .. .. .. .. .. ..
1981 71,456 58,357 2,645 .. 23,656 12,663
1982 .. .. .. .. .. ..
1983 84,115 67,995 2,831 .. 26,748 23,187
1984 96,045 81,163 2,940 2,881 30,596 32,786
1985 93,306 81,146 2,751 2,699 29,238 30,185
1986 85,853 74,033 2,585 2,532 28,685 30,967
1987 98,716 79,269 2,595 2,540 30,803 29,041
1988 123,080 89,410 2,817 2,776 35,093 29,300
1989 147,070 111,350 3,014 2,966 40,150 32,180
1990 170,500 131,280 3,444 3,394 46,002 56,308
1991 208,090 168,070 3,898 3,836 55,983 49,225
1992 245,770 198,080 4,510 4,446 65,172 66,652
1993 .. .. .. .. .. ..
1994 275,980 227,080 4,788 4,721 80,517 75,511
1995 .. .. .. .. .. ..
1996 407,667 339,719 5,186 5,130 100,382 381,595
1997 .. .. .. .. .. ..
1998 513,355 437,207 5,616 5,561 126,303 179,218
1999 .. .. .. .. .. ..
2000 738,548 642,548 4,719 4,659 121,805 158,382
2001 .. .. .. .. .. ..
2002 407,442 349,813 3,710 3,658 101,263 131,855
2003 500,750 430,115 3,885 3,845 113,113 153,051
2004 683,257 604,658 3,456 3,426 104,484 143,702
2005 947,332 791,217 3,822 3,770 113,314 160,029
2006 946,464 812,708 4,375 4,335 145,985 240,501
2007 .. .. .. .. .. ..
2010 231,106 181,332 1,080 1,035 42,598 95,254
RM ('000) RM ('000) RM ('000)
2009 .. .. .. .. .. ..
2008 1,309,593 1,139,243 4,160 4,126 135,184 313,697
217
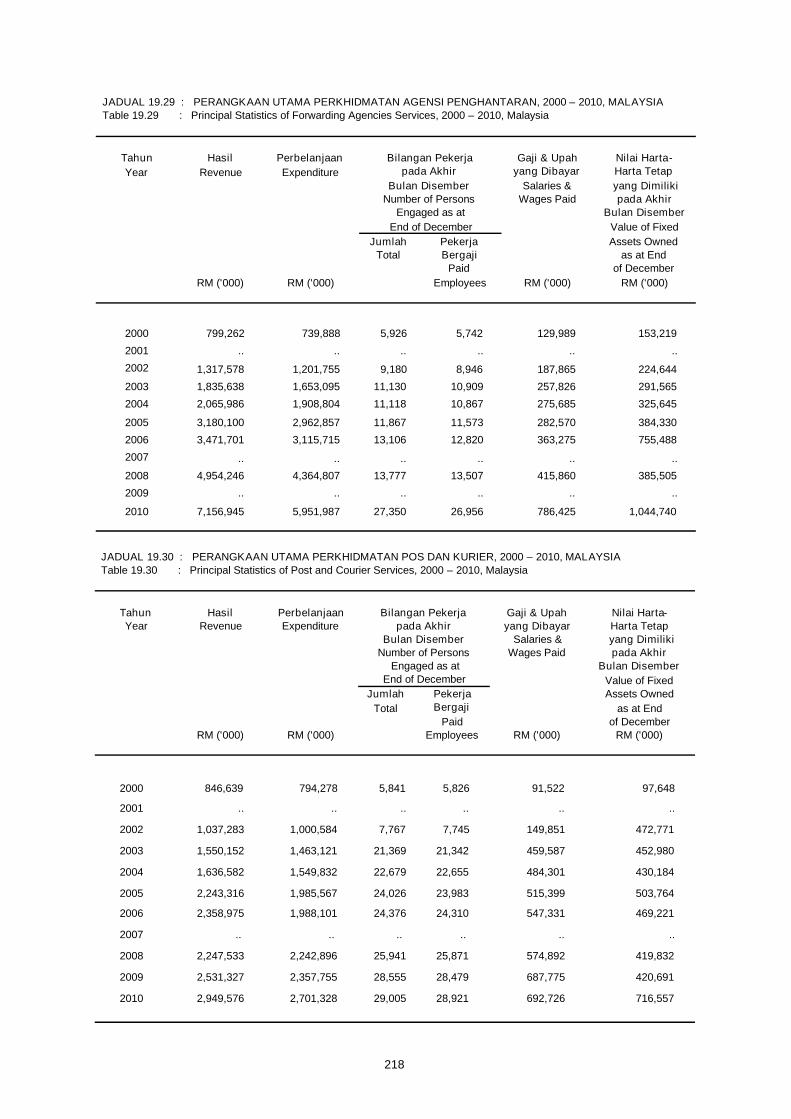
218
JADUAL 19.29 : PERANGKAAN UTAMA PERKHIDMATAN AGENSI PENGHANTARAN, 2000 – 2010, MALAYSIATable 19.29 : Principal Statistics of Forwarding Agencies Services, 2000 – 2010, Malaysia
Tahun Hasil Perbelanjaan Bilangan Pekerja Gaji & Upah Nilai Harta-Year Revenue Expenditure pada Akhir yang Dibayar Harta Tetap
Bulan Disember Salaries & yang DimilikiNumber of Persons Wages Paid pada Akhir
Engaged as at Bulan DisemberEnd of December Value of Fixed
Jumlah Pekerja Assets OwnedTotal Bergaji as at End
Paid of DecemberEmployees RM ('000)
2000 799,262 739,888 5,926 5,742 129,989 153,219
2001 .. .. .. .. .. ..
2002 1,317,578 1,201,755 9,180 8,946 187,865 224,644
2003 1,835,638 1,653,095 11,130 10,909 257,826 291,565
2004 2,065,986 1,908,804 11,118 10,867 275,685 325,645
2005 3,180,100 2,962,857 11,867 11,573 282,570 384,330
2006 3,471,701 3,115,715 13,106 12,820 363,275 755,488
2007 .. .. .. .. .. ..
2010 7,156,945 5,951,987 27,350 26,956 786,425 1,044,740
RM ('000) RM ('000) RM ('000)
2008 4,954,246 4,364,807 13,777 13,507 415,860 385,505
2009 .. .. .. .. .. ..
JADUAL 19.30 : PERANGKAAN UTAMA PERKHIDMATAN POS DAN KURIER, 2000 – 2010, MALAYSIATable 19.30 : Principal Statistics of Post and Courier Services, 2000 – 2010, Malaysia
Tahun Hasil Perbelanjaan Bilangan Pekerja Gaji & Upah Nilai Harta-Year Revenue Expenditure pada Akhir yang Dibayar Harta Tetap
Bulan Disember Salaries & yang DimilikiNumber of Persons Wages Paid pada Akhir
Engaged as at Bulan DisemberEnd of December Value of Fixed
Jumlah Pekerja Assets OwnedTotal Bergaji as at End
Paid of DecemberEmployees RM ('000)
2000 846,639 794,278 5,841 5,826 91,522 97,648
2001 .. .. .. .. .. ..
2002 1,037,283 1,000,584 7,767 7,745 149,851 472,771
2003 1,550,152 1,463,121 21,369 21,342 459,587 452,980
2004 1,636,582 1,549,832 22,679 22,655 484,301 430,184
2005 2,243,316 1,985,567 24,026 23,983 515,399 503,764
2006 2,358,975 1,988,101 24,376 24,310 547,331 469,221
2007 .. .. .. .. .. ..
2010 2,949,576 2,701,328 29,005 28,921 692,726 716,557
RM ('000) RM ('000) RM ('000)
2008 2,247,533 2,242,896 25,941 25,871 574,892 419,832
2009 2,531,327 2,357,755 28,555 28,479 687,775 420,691
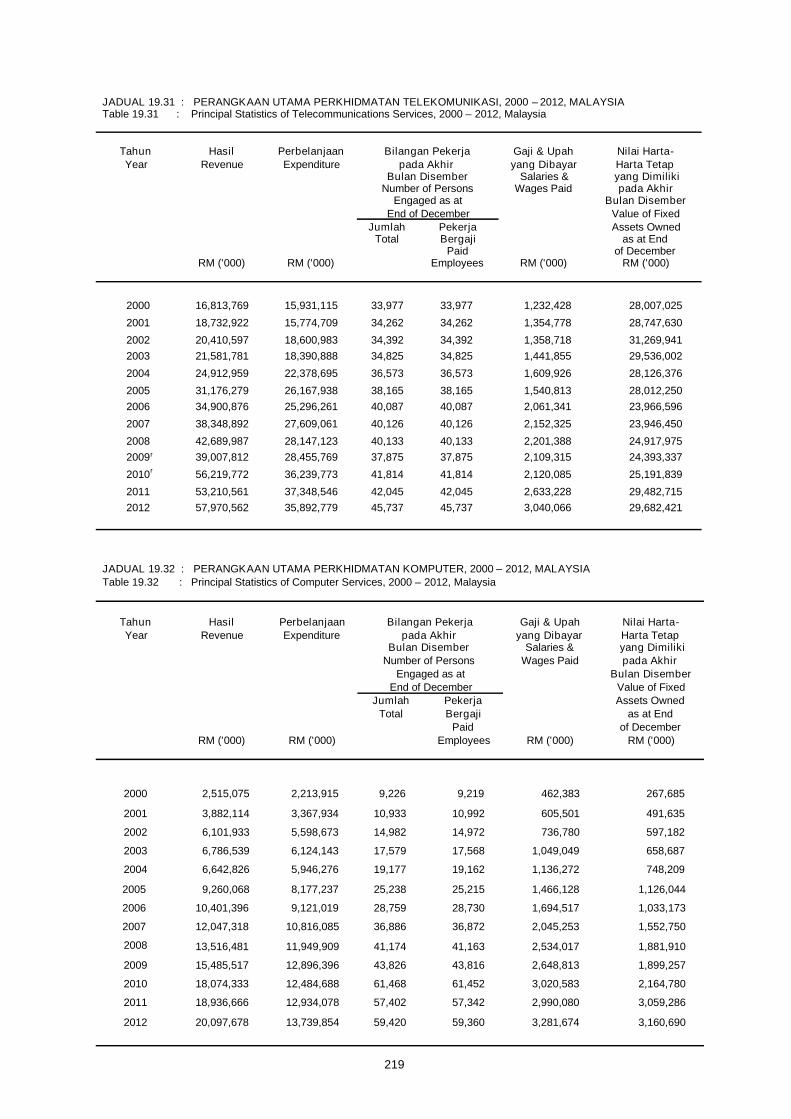
JADUAL 19.31 : PERANGKAAN UTAMA PERKHIDMATAN TELEKOMUNIKASI, 2000 – 2012, MALAYSIATable 19.31 : Principal Statistics of Telecommunications Services, 2000 – 2012, Malaysia
Tahun Hasil Perbelanjaan Bilangan Pekerja Gaji & Upah Nilai Harta-Year Revenue Expenditure pada Akhir yang Dibayar Harta Tetap
Bulan Disember Salaries & yang DimilikiNumber of Persons Wages Paid pada Akhir
Engaged as at Bulan DisemberEnd of December Value of Fixed
Jumlah Pekerja Assets OwnedTotal Bergaji as at End
Paid of DecemberEmployees RM ('000)
2000 16,813,769 15,931,115 33,977 33,977 1,232,428 28,007,025
2001 18,732,922 15,774,709 34,262 34,262 1,354,778 28,747,630
2002 20,410,597 18,600,983 34,392 34,392 1,358,718 31,269,9412003 21,581,781 18,390,888 34,825 34,825 1,441,855 29,536,002
2004 24,912,959 22,378,695 36,573 36,573 1,609,926 28,126,376
2005 31,176,279 26,167,938 38,165 38,165 1,540,813 28,012,2502006 34,900,876 25,296,261 40,087 40,087 2,061,341 23,966,596
2007 38,348,892 27,609,061 40,126 40,126 2,152,325 23,946,450
2010r 56,219,772 36,239,773 41,814 41,814 2,120,085 25,191,839
RM ('000) RM ('000) RM ('000)
2009r 39,007,812 28,455,769 37,875 37,875 2,109,315 24,393,3372008 42,689,987 28,147,123 40,133 40,133 2,201,388 24,917,975
2011 53,210,561 37,348,546 42,045 42,045 2,633,228 29,482,7152012 57,970,562 35,892,779 45,737 45,737 3,040,066 29,682,421
219
JADUAL 19.32 : PERANGKAAN UTAMA PERKHIDMATAN KOMPUTER, 2000 – 2012, MALAYSIA
Tahun Hasil Perbelanjaan Bilangan Pekerja Gaji & Upah Nilai Harta-Year Revenue Expenditure pada Akhir yang Dibayar Harta Tetap
Bulan Disember Salaries & yang DimilikiNumber of Persons Wages Paid pada Akhir
Engaged as at Bulan DisemberEnd of December Value of Fixed
Jumlah Pekerja Assets OwnedTotal Bergaji as at End
Paid of DecemberRM ('000) RM ('000) Employees RM ('000) RM ('000)
2000 2,515,075 2,213,915 9,226 9,219 462,383 267,685
2001 3,882,114 3,367,934 10,933 10,992 605,501 491,635
2002 6,101,933 5,598,673 14,982 14,972 736,780 597,182
2003 6,786,539 6,124,143 17,579 17,568 1,049,049 658,687
2004 6,642,826 5,946,276 19,177 19,162 1,136,272 748,209
2005 9,260,068 8,177,237 25,238 25,215 1,466,128 1,126,044
2006 10,401,396 9,121,019 28,759 28,730 1,694,517 1,033,173
2007 12,047,318 10,816,085 36,886 36,872 2,045,253 1,552,750
2010 18,074,333 12,484,688 61,468 61,452 3,020,583 2,164,780
Table 19.32 : Principal Statistics of Computer Services, 2000 – 2012, Malaysia
2009 15,485,517 12,896,396 43,826 43,816 2,648,813 1,899,257
2008 13,516,481 11,949,909 41,174 41,163 2,534,017 1,881,910
2011 18,936,666 12,934,078 57,402 57,342 2,990,080 3,059,286
2012 20,097,678 13,739,854 59,420 59,360 3,281,674 3,160,690

JADUAL 19.33 : PERANGKAAN UTAMA PERKHIDMATAN PEMPROGRAMAN DAN PENYIARAN, 2000 – 2012,MALAYSIA
Table 19.33 : Principal Statistics of Programming and Broadcasting Services, 2000 – 2012, Malaysia
Tahun Hasil Perbelanjaan Bilangan Pekerja Gaji & Upah Nilai Harta-Year Revenue Expenditure pada Akhir yang Dibayar Harta Tetap
Bulan Disember Salaries & yang DimilikiNumber of Persons Wages Paid pada Akhir
Engaged as at Bulan DisemberEnd of December Value of Fixed
Jumlah Pekerja Assets OwnedTotal Bergaji as at End
Paid of DecemberEmployees RM ('000)
2000 459,654 553,957 1,414 1,414 64,602 174,259
2001 552,012 462,987 1,023 1,023 60,893 243,515
2002 585,865 511,889 1,081 1,081 66,146 236,262
2003 601,261 502,700 1,095 1,095 65,791 281,570
2004 756,887 560,320 1,669 1,669 91,436 260,405
2005 850,054 637,336 1,631 1,631 98,489 292,432
2006 851,109 579,904 1,717 1,717 103,676 240,909
2007 918,819 686,957 1,786 1,786 107,133 237,989
2010r 4,040,967 2,968,143 4,934 4,934 389,210 1,419,866
RM ('000) RM ('000) RM ('000)
2009r 4,126,941 3,255,476 4,516 4,516 260,925 980,603
2008 927,721 698,728 2,103 2,103 118,482 243,195
2011 4,485,527 3,894,002 5,222 5,222 415,943 1,464,737
2012 5,127,878 3,867,649 5,462 5,462 449,817 1,394,596
JADUAL 19.34 : PERANGKAAN UTAMA PERKHIDMATAN MAKLUMAT, 2000 – 2012, MALAYSIATable 19.34 : Principal Statistics of Information Services Activities, 2000 – 2012, Malaysia
Tahun Hasil Perbelanjaan Bilangan Pekerja Gaji & Upah Nilai Harta-Year Revenue Expenditure pada Akhir yang Dibayar Harta Tetap
Bulan Disember Salaries & yang DimilikiNumber of Persons Wages Paid pada Akhir
Engaged as at Bulan DisemberEnd of December Value of Fixed
Jumlah Pekerja Assets OwnedTotal Bergaji as at End
Paid of DecemberEmployees RM ('000)
2000 918,024 775,778 3,028 3,028 119,491 228,391
2001 876,101 703,863 2,821 2,821 117,623 283,562
2002 1,948,138 1,693,361 5,229 5,229 277,030 489,861
2003 1,279,920 1,266,934 5,409 5,409 217,018 609,248
2004 2,215,270 2,026,655 8,077 8,073 548,980 705,015
2005 1,939,625 1,776,305 8,262 8,258 344,128 539,291
2006 2,680,692 2,308,148 9,899 9,894 435,481 489,718
2007 3,001,436 2,521,232 10,176 10,172 487,560 519,471
2010 3,820,624 2,134,317 13,284 13,278 579,329 601,488
RM ('000) RM ('000) RM ('000)
2009 3,574,789 2,381,983 10,374 10,369 701,370 597,814
2008 3,425,672 2,472,379 10,372 10,368 632,434 608,555
2011 3,372,699 2,261,815 14,503 14,499 765,618 742,111
2012 3,504,702 2,279,131 14,154 14,144 747,513 706,148
220

JADUAL 19.35 : PERANGKAAN UTAMA PERDAGANGAN BORONG, 2005 – 2014, MALAYSIATable 19.35 : Principal Statistics of Wholesale Trade, 2005 – 2014, Malaysia
TahunYear
Nilai JualanSales Value
Jumlah Bilangan PekerjaNumber of Persons Engaged
Gaji & Upah yang dibayarSalaries & Wages Paid
RM ('000) RM ('000)
2005 188,686,760 301,061 4,768,742
2006 236,608,014 317,711 5,909,355
2007 273,090,255 382,700 7,070,158
2008 332,441,817 386,338 8,606,815
2009 308,081,636 388,576 9,261,175
2010 339,760,939 388,422 9,915,394
2011 412,627,103 387,571 11,907,964
2012 429,022,155 392,693 12,620,861
2013 444,773,611 398,064 13,126,343
2014 471,944,658 405,797 14,053,993
JADUAL 19.36 : PERANGKAAN UTAMA PERDAGANGAN RUNCIT, 2005 – 2014, MALAYSIATable 19.36 : Principal Statistics of Retail Trade, 2005 – 2014, Malaysia
TahunYear
Nilai JualanSales Value
Jumlah Bilangan PekerjaNumber of Persons Engaged
Gaji & Upah yang dibayarSalaries & Wages Paid
RM ('000) RM ('000)
2005 105,885,795 791,203 7,185,599
2006 126,809,197 742,027 8,045,516
2007 167,107,638 735,685 8,906,327
2008 205,358,267 836,479 10,039,540
2009 216,821,206 862,290 11,016,790
2010 239,396,021 909,023 11,963,564
2011 264,697,749 923,664 16,388,506
2012 284,304,600 935,233 17,994,228
2013 309,475,252 950,281 19,814,846
2014 343,677,851 968,818 20,676,816
221
Nota / Note:
Data bagi tahun 2005 hingga 2010 telah dikemaskini berdasarkan data Banci Perdagangan Edaran 2009Data for 2005 to 2010 has been revised based on the Census of Distributive Trade 2009

JADUAL 19.37 : PERANGKAAN UTAMA PERDAGANGAN KENDERAAN BERMOTOR, 2005 – 2014, MALAYSIA
Table 19.37 : Principal Statistics of Motor Vehicle Trade, 2005 – 2014, Malaysia
TahunYear
Nilai JualanSales Value
Jumlah Bilangan PekerjaNumber of Persons Engaged
Gaji & Upah yang dibayarSalaries & Wages Paid
RM ('000) RM ('000)
2005 63,903,370 153,357 1,750,891
2006 58,245,883 142,967 2,062,773
2007 83,764,706 209,788 2,934,150
2008 100,468,987 234,972 3,757,045
2009 97,449,704 239,385 4,019,254
2010 108,009,576 240,522 4,206,259
2011 115,910,271 236,008 4,711,571
2012 123,080,273 237,003 5,147,807
2013 127,165,930 241,243 5,571,580
2014 135,588,462 243,345 5,777,238
222
Nota / Note:Data bagi tahun 2005 hingga 2010 telah dikemaskini berdasarkan data Banci Perdagangan Edaran 2009.Data for 2005 to 2010 has been revised based on the Census of Distributive Trade 2009
JADUAL 19.38 : PERANGKAAN UTAMA AKTIVITI PENERBITAN, 2009 – 2012, MALAYSIATable 19.38 : Principal Statistics of Publishing Activities, 2009 – 2012, Malaysia
Tahun Hasil Perbelanjaan Bilangan Pekerja Gaji & Upah Nilai Harta-
Year Revenue Expenditure pada Akhir yang Dibayar Harta Tetap
Bulan Disember Salaries & yang Dimiliki
Number of Persons Wages Paid pada Akhir
Engaged as at Bulan Disember
End of December Value of Fixed
Jumlah Pekerja Assets Owned
Total Bergaji as at End
Paid of December
RM ('000) RM ('000) Employees RM ('000) RM ('000)
2009 744,796 670,027 4,246 4,246 135,478 97,013
2010 1,165,506 838,291 4,671 4,671 164,699 232,911
2011 1,201,836 865,791 4,670 4,656 169,997 257,313
2012 1,277,080 996,750 4,680 4,667 173,801 294,455
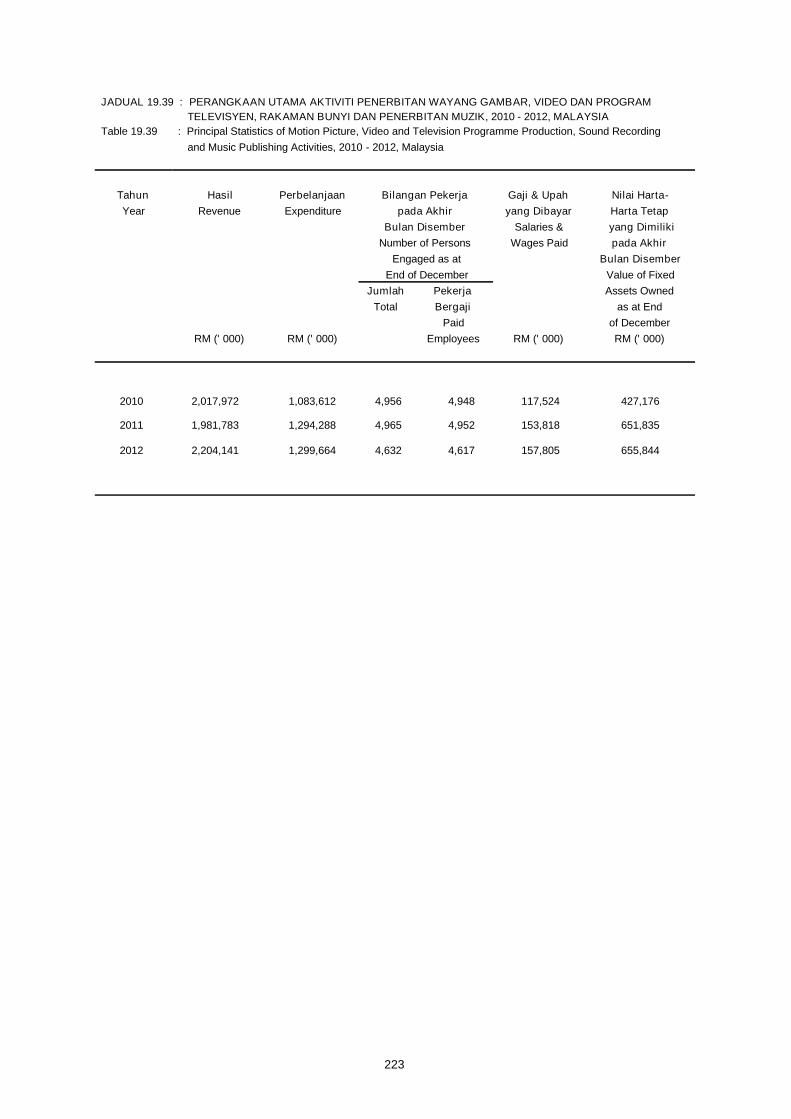
223
JADUAL 19.39 : PERANGKAAN UTAMA AKTIVITI PENERBITAN WAYANG GAMBAR, VIDEO DAN PROGRAMTELEVISYEN, RAKAMAN BUNYI DAN PENERBITAN MUZIK, 2010 - 2012, MALAYSIA
Table 19.39 : Principal Statistics of Motion Picture, Video and Television Programme Production, Sound Recording
Tahun Hasil Perbelanjaan Bilangan Pekerja Gaji & Upah Nilai Harta-Year Revenue Expenditure pada Akhir yang Dibayar Harta Tetap
Bulan Disember Salaries & yang DimilikiNumber of Persons Wages Paid pada Akhir
Engaged as at Bulan DisemberEnd of December Value of Fixed
Jumlah Pekerja Assets OwnedTotal Bergaji as at End
Paid of DecemberRM (' 000) RM (' 000) Employees RM (' 000) RM (' 000)
2010 2,017,972 1,083,612 4,956 4,948 117,524 427,176
2011 1,981,783 1,294,288 4,965 4,952 153,818 651,835
2012 2,204,141 1,299,664 4,632 4,617 157,805 655,844
and Music Publishing Activities, 2010 - 2012, Malaysia


ALAM SEKITARENVIRONMENT


227
ALAM SEKITAR
Nota Keterangan
1. Data berhubung Indeks PencemaranUdara (IPU) dan status kualiti air sungaidiperoleh daripada Jabatan Alam Sekitar(JAS), dari 1998 hingga 2014.
2. Indeks Pencemaran Udara (IPU)IPU menunjukkan status kualiti udara distesen terpilih iaitu di Cheras, KualaLumpur; Larkin, Johor Bahru; BandarayaMelaka; Seberang Jaya; Kuching; KotaKinabalu dan Miri. Bahan pencemarudara yang diambilkira dalam pengiraanIPU Malaysia adalah Ozon (O3), KarbonMonoksida (CO), Nitrogen Dioksida(NO2), Sulfur Dioksida (SO2) dan HabukHalus bersaiz kurang dari 10 mikron(PM10).
Ukuran indeks bagi menunjukkan statuskualiti udara dikategorikan sepertiberikut:
ENVIRONMENT
Explanatory Notes
1. Data pertaining to Air Pollutant Index(API) and river water quality status areobtained from the Department ofEnvironment (DOE), from 1998 to 2014.
2. Air Pollutant Index (API)API shows the air quality status in theselected stations namely in Cheras,Kuala Lumpur; Larkin, Johor Bahru;Bandaraya Melaka; Seberang Jaya;Kuching; Kota Kinabalu and Miri. The airpollutants included in Malaysian’s APIcalculation are Ozone (O3), CarbonMonoxide (CO), Nitrogen Dioxide (NO2),Sulphur Dioxide (SO2) and ParticulateMatter of less than 10 microns in size(PM10).
Index value to indicate the status of theair quality are categorized as follows:
Nilai IPU Status
0 – 50 Baik
51 – 100 Sederhana
101 – 200 Tidak Sihat
201 – 300 Sangat Tidak Sihat
Melebihi 300 Berbahaya
Value of API Status
0 – 50 Good
51 – 100 Moderate
101 – 200 Unhealthy
201 – 300 Very Unhealthy
Above 300 Hazardous

228
3. Kualiti Air SungaiProgram Pemantauan Kualiti Air Sungaid i j a l a n k a n o le h J AS u n t ukmengenalpasti status kualiti air sungai,mengesan perubahan kualiti airdisebabkan oleh aktiviti pembangunandan juga mengenal pasti puncapencemaran.
Sampel air telah diambil daripadastesen-stesen pemantauan dandianalisa bagi mengukur Indeks KualitiAir (IKA). Enam parameter yangdianalisa ialah Keperluan OksigenBiokimia (BOD5), Ammoniacal Nitrogen(NH3-N), Pepejal Terampai (SS),Keperluan Oksigen Kimia (COD), nilaipH dan Oksigen Terlarut (DO).
Hasil daripada penganalisaan tersebut,kualiti air sungai boleh diklasifikasikankepada tiga kategori iaitu Bersih (B),Sederhana Tercemar (ST) danTercemar (T).
3. River Water QualityRiver Water Quality MonitoringProgramme conducted by DOE toestablish the status of river water quality,to detect changes in water quality as aresult of development activities and alsoto identify the sources of pollution.
Water samples collected from monitoringstations and analysed to derive the WaterQuality Index (WQI). The six parameterswhich analysed are Biochemical OxygenDemand (BOD5), Ammoniacal Nitrogen(NH3-N), Suspended Solids (SS),Chemical Oxygen Demand (COD), pHvalue and Dissolved Oxygen (DO).
As a result, river water quality could beclassified into three categories namelyClean (C), Slightly Polluted (SP) andPolluted (P).

229
Nota / Note :1Bacaan status kualiti udara berdasarkan bacaan maksimum harianAir quality status readings are based on daily maximum readings
JADUAL 20.1b : BILANGAN LEMBANGAN SUNGAI YANG DIAWASI MENGIKUT KATEGORI, 1998 – 2014, MALAYSIATable 20.1b : Number of River Basins Monitored by Category, 1998 – 2014, Malaysia
TahunYear
Kualiti Air/ Water Quality
Kategori/ CategoryJumlah
LembanganSungaiDiawasi
Total RiverBasins
Monitored
TercemarPolluted
Sederhana TercemarSlightly Polluted
BersihClean
1998 120 16 71 331999 120 13 72 352000 120 12 74 342001 120 13 47 602002 120 14 43 632003 120 9 52 592004 120 9 53 582005 146 15 51 802006 146 7 59 802007 143 7 45 912008 143 7 60 762009 143 9 64 70
2010 143 13 65 652011 140 11 53 762012 140 12 54 742013 140 10 56 742014 140 12 66 62
JADUAL 20.1a : BACAAN MAKSIMUM DAN MINIMUM TAHUNAN INDEKS PENCEMARAN UDARA BAGISTESEN TERPILIH, 1998 – 2014, MALAYSIA
Table 20.1a : Annual Maximum and Minimum Air Pollutant Index for Selected Stations, 1998 – 2014, Malaysia
TahunYear
Kualiti Udara/ Air Quality
Indeks Pencemaran Udara (IPU)1/ Air Pollution Index (API)1
CherasKuala Lumpur
LarkinJohor Bahru
BandarayaMelaka
SeberangJaya
Kuching KotaKinabalu
Mak.Max.
Min.Mak.Max.
Min.Mak.Max.
Min.Mak.Max.
Min.Mak.Max.
Min.Mak.Max.
Min.Mak.Max.
Min.
1998 140 10 116 7 92 4 111 16 90 3 459 1 649 6
1999 137 3 114 6 77 3 79 10 76 4 70 1 120 4
2000 141 13 119 7 122 4 127 4 84 1 70 1 79 3
2001 157 16 119 10 127 3 140 8 84 1 80 1 84 2
2002 153 11 116 4 105 5 115 4 130 1 88 8 126 5
2003 143 11 112 2 114 6 106 11 85 6 76 2 86 3
2004 97 32 126 8 147 5 121 8 97 17 62 1 77 2
2005 390 5 111 1 114 2 151 10 78 23 63 2 133 2
2006 162 5 143 5 153 5 121 6 188 5 86 2 104 1
2007 131 4 141 0 92 4 101 8 75 6 64 3 73 62008 135 8 101 5 80 3 99 6 72 5 55 1 76 62009 168 4 99 2 137 4 106 5 114 10 78 1 179 6
2010 169 26 111 15 139 22 93 28 54 16 68 10 89 17
Miri
2011 150 11 84 3 97 12 98 6 100 4 61 2 96 4
2012 155 4 137 2 83 3 105 6 93 16 61 1 97 5
2013 186 22 226 17 415 16 132 27 89 17 90 8 93 182014 170 3 198 10 128 5 119 14 123 11 59 3 84 2

Nota / Notes :1 Data 1998-2002 merujuk kepada Pembakaran Sisa Industri. Mulai 2003, termasuk hotel, pusat komersial, institusi dan pasar malam.
1998-2002 data refer to Burning of Industrial Waste. Commencing 2003, include hotels, commercial centres, institutions and night markets.
.. Data tidak diperoleh memandangkan tiada perincian bagi punca tetapData is not available as there is no detail for stationary sources
230
JADUAL 20.2 : PELEPASAN BAHAN PENCEMAR KE UDARA MENGIKUT JENIS DAN PUNCA, 1998 – 2014,MALAYSIA
Table 20.2 : Emission of Pollutants to the Atmosphere by Type and Source, 1998 – 2014, Malaysia
('000) Tan metrik /Tonnes
TahunYear
Punca TetapStationary Sources
Kenderaan BermotorMobile Vehicles
Lain-lain1
Others1
JumlahTotal
IndustriIndustrial
StesenJanakuasaPower Plant
1998 706.5 2,402.8 146.5 3,255.8
1999 461.4 2,563.1 114.2 3,138.7
2000 566.7 2,642.6 29.2 3,238.5
2001 308.0 2,561.7 8.6 2,878.3
2002 702.1 2,939.9 14.6 3,656.6
2003 125.1 127.4 1,649.1 163.2 2,064.8
2004 372.4 359.0 1,478.6 38.7 2,248.7
2005 157.3 148.8 1,538.0 23.1 1,867.2
2006 158.7 150.7 1,631.4 44.9 1,985.7
2007 132.9 178.2 2,172.8 49.4 2,533.4
2008 148.7 221.4 1,630.8 54.4 2,055.3
2013 86.0 701.8 2,025.6 142.4 2,955.8
..
..
..
..
..
2009 166.3 595.9 1,762.8 60.3 2,585.3
2010 113.9 619.2 1,829.7 60.4 2,623.2
2011 116.4 633.5 1,905.6 90.6 2,746.1
2012 86.4 693.2 2,024.6 151.5 2,955.7
2014 101.9 742.9 2,092.0 88.1 3,024.9

Nota : T – Tercemar ST – Sederhana Tercemar B – BersihNotes : P – Polluted SP – Slightly Polluted C – Clean
231
JADUAL 20.3 : STATUS KUALITI AIR SUNGAI BERDASARKAN PENCEMAR UTAMA, 1998 – 2014, MALAYSIATable 20.3 : Status of River Water Quality based on Main Pollutants, 1998 – 2014, Malaysia
TahunYear
Jumlah LembanganSungai Yang Diawasi
Total River BasinsMonitored
Keperluan OksigenBiokimia (BOD5)
Biochemical OxygenDemand
Ammoniakal Nitrogen(NH3-N)
Ammoniacal Nitrogen
Pepejal Terampai (SS)
Suspended Solids
TP
STSP
BC
TP
STSP
BC
TP
STSP
BC
1998 120 25 36 59 52 53 15 41 28 51
1999 120 31 75 14 33 70 17 45 22 53
2000 120 18 63 39 22 48 50 53 25 42
2001 120 21 41 58 24 43 53 38 25 57
2002 120 22 29 69 29 40 51 28 14 78
2003 120 15 29 76 29 37 54 28 17 75
2004 120 18 37 65 30 47 43 31 11 78
2005 146 28 41 77 43 54 49 34 22 90
2006 146 22 28 96 41 56 49 42 20 84
2007 143 12 37 94 36 59 48 42 39 62
2008 143 18 46 79 33 38 72 53 33 57
2009 143 42 73 28 40 47 56 57 32 54
2010 143 52 79 12 42 66 35 48 27 68
2011 140 57 80 3 35 64 41 35 26 79
2012 140 59 69 12 38 67 35 16 28 96
2013 140 94 46 - 41 58 41 11 24 105
2014 140 125 15 - 40 59 41 19 22 99


GUNA TENAGAEMPLOYMENT


235
PERANGKAAN TENAGA BURUH
Nota Keterangan
1. Perangkaan tenaga buruh yang diperolehdaripada Penyiasatan Tenaga Buruhdipersembahkan mulai tahun 1982. Datatahun 1991 dan 1994 tidak diperolehkerana penyiasatan tidak dijalankan padatahun tersebut.
2. Perangkaan tenaga buruh yangdipersembahkan adalah anggarantenaga buruh, taburan guna tenagamengikut industri, dan pengangguran.
3. Tenaga buruhTenaga buruh merujuk kepada merekayang berumur 15 hingga 64 tahun (dalamtahun genap pada hari lahir terakhir)semasa minggu rujukan, sama adabekerja atau menganggur.
4. BekerjaSemua orang yang bekerja sekurang-kurangnya sejam semasa minggu rujukanuntuk mendapatkan upah, keuntunganatau keuntungan keluarga (sebagaimajikan, pekerja, bekerja sendiri ataupekerja keluarga tanpa gaji).
Juga dianggap sebagai bekerja ialahmereka yang tidak bekerja semasaminggu rujukan disebabkan sakit,kecederaan, tiada upaya, cuaca buruk,bercuti, pertelingkahan buruh dan sebab-sebab sosial atau keagamaan tetapimempunyai peker jaan, ladang,perusahaan atau perusahaan keluargalain untuk kembali bekerja. Termasukjuga mereka yang tidak bekerja buatsementara waktu tetapi bergaji dan pastiakan dipanggil bekerja semula.
LABOUR FORCE STATISTICS
Explanatory Notes
1. Statistics of the labour force obtainedfrom the Labour Force Survey waspresented since 1982. Data for the year1991 and 1994 were not available sincethe survey was not conducted for thatparticular years.
2. Statistics of the labour force presentedare the estimates of labour force,distribution of employment by industryand unemployment.
3. Labour forceLabour force refers to those who, duringthe reference week, are in the 15 to 64years (in completed years at lastbirthday) and who are either employed orunemployed.
4. EmployedAll persons who, at any time during thereference week worked at least one hourfor pay, profit or family gain (as anemployer, employee, own account workeror unpaid family worker).
Also considered as employed arepersons who did not work during thereference week because of illness, injury,disability, bad weather, leave, labourdispute and social or religious reasonsbut had a job, farm, enterprise or otherfamily enterprise to return to. Alsoincluded are those on temporary lay-offwith pay who would definitely be calledback to work.

236
5. MenganggurPenganggur dikelaskan kepada duakumpulan iaitu penganggur aktif danpenganggur tidak aktif. Penganggur aktiftermasuk mereka yang tidak bekerjasemasa minggu rujukan tetapi bersediauntuk bekerja dan aktif mencaripekerjaan dalam minggu tersebut.Penganggur tidak aktif adalah sepertiberikut:
a) mereka yang tidak mencari pekerjaandalam minggu rujukan keranapercaya tidak terdapat pekerjaanataupun tidak berkelayakan;
b) mereka yang mungkin mencaripekerjaan jika tidak kerana sakit ataucuaca buruk;
c) mereka yang menunggu jawapanpermohonan pekerjaan; dan
d) mereka yang telah mencari pekerjaansebelum minggu rujukan.
6. IndustriIndustri dikelaskan mengikut klasifikasiberikut:a) Tahun 1982-2000, Buku Penjenisan
Perusahaan Malaysia (dikemaskini)1 9 7 2 b e r a s a s k a n k e p a d aInternational Standard IndustrialClassification of All EconomicActivities (ISIC), 1968.
b) T a h u n 2 0 0 1 -2 0 0 9 , P i a wa i a nKlasifikasi Industri Malaysia (MSIC)2 0 0 0 b e r a s a s k a n k e p a d aInternational Standard IndustrialClassification of All EconomicActivities (ISIC), Revision 3.
c) Mulai 2010, Piawaian KlasifikasiIndustri Malaysia (MSIC) 2008berasaskan kepada InternationalStandard Industrial Classification ofAll Economic Activities (ISIC),Revision 4.
5. UnemployedThe unemployed are classified into twothat is the actively unemployed andinactively unemployed. The activelyunemployed include all persons who didnot work during the reference week butwere available for work and activelylooking for work during the referenceweek. Inactively unemployed personsinclude the following categories:
a) persons who did not look for workbecause they believed no work wasavailable or they were not qualified;
b) persons who would have looked forwork if they had not been temporarilyill or had it not been for bad weather;
c) persons who were waiting for result ofjob applications; and
d) persons who had looked for workprior to the reference week.
6. IndustryIndustry is classified according to thefollowing classification:a) Year 1982-2000, Malaysia Industrial
Classification (update) 1972 basedon International Standard IndustrialClassification of All EconomicActivities (ISIC) 1968.
b) Year 2001-2009, Malaysia StandardIndustrial Classification (MSIC) 2000based on the International StandardIndustrial Classification of AllEconomic Activities (ISIC), Revision3.
c) Starting 2010, Malaysia StandardIndustrial Classification (MSIC) 2008based on the International StandardIndustrial Classification of AllEconomic Activities (ISIC), Revision4.

237
7. Kadar penyertaan tenaga buruhKadar penyertaan tenaga buruhditakrifkan sebagai perkadaran pendudukdalam tenaga buruh kepada jumlahpenduduk dalam umur bekerja (15-64tahun) yang dipersembahkan dalambentuk peratus.
Formulanya adalah seperti berikut:
8. Kadar PengangguranKadar pengangguran ialah perkadaranpenduduk yang menganggur kepadajumlah penduduk dalam tenaga buruh.
Kadar ini mengukur peratus pendudukdalam tenaga buruh yang tidak bekerja.
K a d a r p e n g a n g g u r a n d i k i r amenggunakan formula berikut:
7. Labour force participation rateLabour force participation rate is definedas the ratio of the labour force to theworking age population (15-64 years),expressed as percentage.
The formula is as follow:
8. Unemployment RateUnemployment rate is the proportion ofunemployed population to the totalpopulation in labour force.
This rate measures the percentage ofunemployed population in labour force.
Unemployment rate is computed by usingthe formula below:
Kadar
pengangguran=
Bilangan penganggur
mengikut sesuatu
kategori yang tertentu
X 100Bilangan penduduk
dalam tenaga buruh bagi
kategori yang sama
Unemployment
rate=
Number of unemployedpersons in the specified
categoryX 100
Number of persons in the
labour force in the same
category
Kadar
penyertaan
tenaga buruh
=
Bilangan penduduk
dalam tenaga buruh
mengikut sesuatu
kategori yang tertentuX 100
Bilangan penduduk
umur bekerja
(15-64 tahun) dalam
kategori yang sama
Labour
force
participation
rate
=
Number of persons in
the labour force in the
specified category X 100Number of persons in
the working age (15 to
64 years) in the same
category

238
JADUAL 21.1 : TENAGA BURUH, PENDUDUK BEKERJA MENGIKUT INDUSTRI (MIC 1972) DAN PENGANGGURAN,1982 – 2000, MALAYSIA
('000)
Tahun/Year 1982 1983 1984 1985
Tenaga Buruh 5,431.4 5,671.8 5,862.5 5,990.1Labour Force
Penduduk bekerja Mengikut IndustriEmployed persons by Industry
Pertanian, Perhutanan, Penternakan dan Perikanan 1,635.8 1,670.9 1,695.0 1,717.4Agriculture, Forestry, Livestock and Fishing
Perlombongan dan Kuari 51.7 55.1 46.5 44.4Mining and Quarrying
Pembuatan 816.0 894.1 858.4 850.4Manufacturing
Elektrik, Gas dan Air 34.9 39.3 32.9 31.5Electricity, Gas and Water
Pembinaan 377.5 425.6 428.0 419.4Construction
Perdagangan Borong dan Runcit, Restoran dan Hotel 860.9 897.3 956.6 994.3Wholesale and Retail Trade, Restaurants and Hotels
Pengangkutan, Penyimpanan dan Perhubungan 223.1 235.9 242.8 244.3Transport, Storage and Communications
Perkhidmatan Kewangan, Insurans, Hartanah dan Perniagaan 202.1 197.7 200.5 218.9Finance, Insurance, Real Estate and Business Services
Perkhidmatan Masyarakat, Sosial dan Persendirian 1,046.9 1,041.0 1,106.0 1,132.7Community, Social and Personal Services
Jumlah Penduduk bekerja 5,249.0 5,457.0 5,566.7 5,653.4Total of Employed persons
Pengangguran 182.4 214.9 295.8 336.8Unemployment
Kadar Pengangguran (%) 3.4 3.8 5.0 5.6Unemployment Rate (%)
Kadar Penyertaan Tenaga Buruh (%) 64.8 65.6 65.3 65.7Labour Force Participation Rate (%)
Table 21.1 : Labour Force, Employed Persons by Industry (MIC 1972) and Unemployment, 1982 – 2000, Malaysia

239
JADUAL 21.1 : TENAGA BURUH, PENDUDUK BEKERJA MENGIKUT INDUSTRI (MIC 1972) DAN PENGANGGURAN,1982 – 2000, MALAYSIA (samb.)
Table 21.1 : Labour Force, Employed Persons by Industry (MIC 1972) and Unemployment, 1982 – 2000, Malaysia (cont'd)('000)
1986 1987 1988 1989 1990 1991 1992 1993 1994 1995
6,222.1 6,456.8 6,637.0 6,779.4 7,000.2 .. 7,319.0 7,700.1 .. 7,893.1
1,764.5 1,846.4 1,883.8 1,832.5 1,737.6 .. 1,535.8 1,558.6 .. 1,526.8
40.6 33.0 30.7 33.1 36.8 .. 36.3 37.6 .. 32.5
874.0 928.9 978.1 1,171.1 1,332.8 .. 1,639.6 1,726.9 .. 1,780.5
32.4 35.9 41.3 40.6 46.7 .. 45.9 60.3 .. 48.0
369.4 336.3 339.9 376.9 423.9 .. 506.7 538.8 .. 611.3
1,035.1 1,091.7 1,112.6 1,143.9 1,217.8 .. 1,254.5 1,266.2 .. 1,370.7
242.0 252.0 265.1 277.6 301.9 .. 326.2 344.0 .. 359.2
234.6 241.6 229.4 253.2 258.4 .. 299.8 330.1 .. 363.7
1,167.6 1,218.0 1,276.1 1,262.0 1,329.0 .. 1,403.0 1,520.9 .. 1,552.2
5,760.1 5,983.9 6,157.2 6,390.9 6,685.0 .. 7,047.8 7,383.4 .. 7,645.0
461.9 472.9 479.8 388.5 315.2 .. 271.2 316.8 .. 248.1
7.4 7.3 7.2 5.7 4.5 .. 3.7 4.1 .. 3.1
66.1 66.5 66.8 66.2 66.5 .. 65.9 66.5 .. 64.7

JADUAL 21.1 : TENAGA BURUH, PENDUDUK BEKERJA MENGIKUT INDUSTRI (MIC 1972) DAN PENGANGGURAN,1982 – 2000, MALAYSIA (samb.)
Table 21.1 : Labour Force, Employed Persons by Industry (MIC 1972) and Unemployment, 1982 – 2000, Malaysia (cont'd)('000)
Tahun/Year 1996 1997 1998 1999 2000
Tenaga Buruh 8,616.0 8,784.0 8,883.6 9,151.5 9,556.1Labour Force
Penduduk bekerja Mengikut IndustriEmployed persons by Industry
Pertanian, Perhutanan, Penternakan dan Perikanan 1,626.2 1,481.3 1,616.5 1,623.7 1,552.4Agriculture, Forestry, Livestock and Fishing
Perlombongan dan Kuari 35.0 38.5 28.4 37.8 27.7Mining and Quarrying
Pembuatan 1,912.1 2,002.5 1,907.8 1,990.7 2,174.2Manufacturing
Elektrik, Gas dan Air 44.1 50.9 50.0 50.2 49.3Electricity, Gas and Water
Pembinaan 716.5 793.0 745.9 722.8 759.9Construction
Perdagangan Borong dan Runcit, Restoran dan Hotel 1,566.7 1,577.9 1,616.0 1,660.6 1,787.2Wholesale and Retail Trade, Restaurants and Hotels
Pengangkutan, Penyimpanan dan Perhubungan 400.7 423.3 421.7 420.3 433.9Transport, Storage and Communications
Perkhidmatan Kewangan, Insurans, Hartanah dan Perniagaan 412.0 447.2 425.8 466.2 474.3Finance, Insurance, Real Estate and Business Services
Perkhidmatan Masyarakat, Sosial dan Persendirian 1,686.0 1,754.5 1,787.5 1,865.4 2,010.3Community, Social and Personal Services
Jumlah Penduduk bekerja 8,399.3 8,569.2 8,599.6 8,837.8 9,269.2Total of Employed persons
Pengangguran 216.8 214.9 284.0 313.7 286.9Unemployment
Kadar Pengangguran (%) 2.5 2.4 3.2 3.4 3.0Unemployment Rate (% )
Kadar Penyertaan Tenaga Buruh (%) 66.3 65.6 64.3 64.2 65.4Labour Force Participation Rate (%)
240
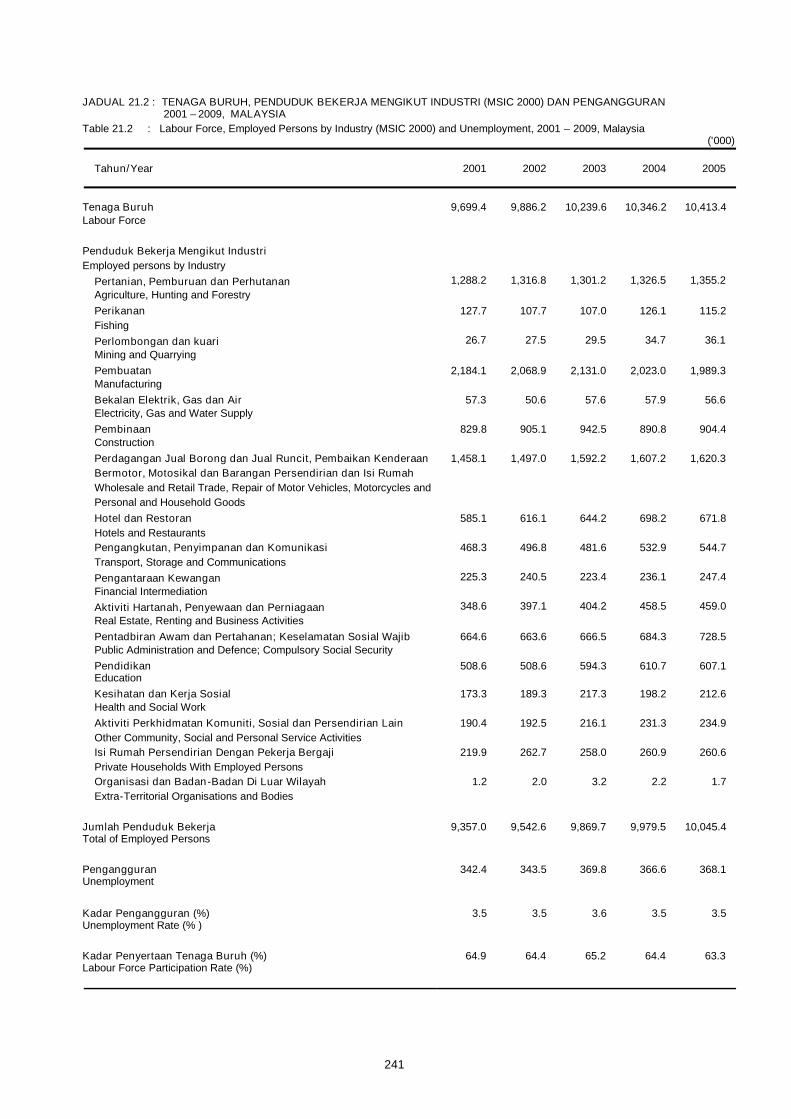
241
JADUAL 21.2 : TENAGA BURUH, PENDUDUK BEKERJA MENGIKUT INDUSTRI (MSIC 2000) DAN PENGANGGURAN2001 – 2009, MALAYSIA
('000)
Tahun/Year 2001 2004 2005
Tenaga Buruh 9,699.4 10,346.2 10,413.4Labour Force
Penduduk Bekerja Mengikut IndustriEmployed persons by Industry
Pertanian, Pemburuan dan Perhutanan 1,288.2 1,326.5 1,355.2Agriculture, Hunting and ForestryPerikanan 127.7 126.1 115.2FishingPerlombongan dan kuari 26.7 34.7 36.1Mining and QuarryingPembuatan 2,184.1 2,023.0 1,989.3ManufacturingBekalan Elektrik, Gas dan Air 57.3 57.9 56.6Electricity, Gas and Water SupplyPembinaan 829.8 890.8 904.4ConstructionPerdagangan Jual Borong dan Jual Runcit, Pembaikan Kenderaan 1,458.1 1,607.2 1,620.3Bermotor, Motosikal dan Barangan Persendirian dan Isi RumahWholesale and Retail Trade, Repair of Motor Vehicles, Motorcycles andPersonal and Household GoodsHotel dan Restoran 585.1 698.2 671.8Hotels and RestaurantsPengangkutan, Penyimpanan dan Komunikasi 468.3 532.9 544.7Transport, Storage and CommunicationsPengantaraan Kewangan 225.3 236.1 247.4Financial IntermediationAktiviti Hartanah, Penyewaan dan Perniagaan 348.6 458.5 459.0Real Estate, Renting and Business ActivitiesPentadbiran Awam dan Pertahanan; Keselamatan Sosial Wajib 664.6 684.3 728.5Public Administration and Defence; Compulsory Social SecurityPendidikan 508.6 610.7 607.1EducationKesihatan dan Kerja Sosial 173.3 198.2 212.6Health and Social WorkAktiviti Perkhidmatan Komuniti, Sosial dan Persendirian Lain 190.4 231.3 234.9Other Community, Social and Personal Service ActivitiesIsi Rumah Persendirian Dengan Pekerja Bergaji 219.9 260.9 260.6Private Households With Employed PersonsOrganisasi dan Badan-Badan Di Luar Wilayah 1.2 2.2 1.7Extra-Territorial Organisations and Bodies
Jumlah Penduduk Bekerja 9,357.0 9,979.5 10,045.4Total of Employed Persons
Pengangguran 342.4 366.6 368.1Unemployment
Kadar Pengangguran (%) 3.5 3.5 3.5Unemployment Rate (% )
Kadar Penyertaan Tenaga Buruh (%) 64.9 64.4 63.3Labour Force Participation Rate (%)
Table 21.2 : Labour Force, Employed Persons by Industry (MSIC 2000) and Unemployment, 2001 – 2009, Malaysia
2002
9,886.2
1,316.8
107.7
27.5
2,068.9
50.6
905.1
1,497.0
616.1
496.8
240.5
397.1
663.6
508.6
189.3
192.5
262.7
2.0
9,542.6
343.5
3.5
64.4
2003
10,239.6
1,301.2
107.0
29.5
2,131.0
57.6
942.5
1,592.2
644.2
481.6
223.4
404.2
666.5
594.3
217.3
216.1
258.0
3.2
9,869.7
369.8
3.6
65.2

242
JADUAL 21.2 : TENAGA BURUH, PENDUDUK BEKERJA MENGIKUT INDUSTRI (MSIC 2000) DAN PENGANGGURAN2001 – 2009, MALAYSIA (samb.)
('000)
Tahun/Year 2006 2008 2009
Tenaga Buruh 10,628.9 11,028.1 11,315.3Labour Force
Penduduk Bekerja Mengikut IndustriEmployed persons by Industry
Pertanian, Pemburuan dan Perhutanan 1,375.3 1,365.6 1,349.6Agriculture, Hunting and ForestryPerikanan 128.2 122.1 121.5Fishing
Perlombongan dan kuari 42.0 54.5 62.7Mining and QuarryingPembuatan 2,082.8 1,944.7 1,807.1ManufacturingBekalan Elektrik, Gas dan Air 75.4 60.5 58.1Electricity, Gas and Water SupplyPembinaan 908.9 998.0 1,015.9ConstructionPerdagangan Jual Borong dan Jual Runcit, Pembaikan Kenderaan 1,650.5 1,729.4 1,831.8Bermotor, Motosikal dan Barangan Persendirian dan Isi RumahWholesale and Retail Trade, Repair of Motor Vehicles, Motorcycles andPersonal and Household GoodsHotel dan Restoran 721.3 783.6 800.5Hotels and RestaurantsPengangkutan, Penyimpanan dan Komunikasi 539.7 583.4 592.0Transport, Storage and CommunicationsPengantaraan Kewangan 242.3 276.0 271.5Financial IntermediationAktiviti Hartanah, Penyewaan dan Perniagaan 508.4 553.2 601.9Real Estate, Renting and Business ActivitiesPentadbiran Awam dan Pertahanan; Keselamatan Sosial Wajib 674.1 751.1 813.9Public Administration and Defence; Compulsory Social SecurityPendidikan 600.1 656.5 731.4EducationKesihatan dan Kerja Sosial 223.2 252.6 271.7Health and Social WorkAktiviti Perkhidmatan Komuniti, Sosial dan Persendirian Lain 247.1 274.2 303.3Other Community, Social and Personal Service ActivitiesIsi Rumah Persendirian Dengan Pekerja Bergaji 254.7 253.0 262.5Private Households With Employed PersonsOrganisasi dan Badan-Badan Di Luar Wilayah 1.2 1.1 1.7Extra-Territorial Organisations and Bodies
Jumlah Penduduk Bekerja 10,275.4 10,659.6 10,897.3Total of Employed Persons
Pengangguran 353.6 368.5 418.0Unemployment
Kadar Pengangguran (%) 3.3 3.3 3.7Unemployment Rate (% )
Kadar Penyertaan Tenaga Buruh (%) 63.1 62.6 62.9Labour Force Participation Rate (%)
Table 21.2 : Labour Force, Employed Persons by Industry (MSIC 2000) and Unemployment, 2001 – 2009, Malaysia (cont'd)
2007
10,889.5
1,437.3
120.9
39.4
1,977.3
60.8
922.5
1,712.1
760.7
538.2
282.2
558.1
716.1
632.7
238.9
266.5
272.7
1.7
10,538.1
351.4
3.2
63.2
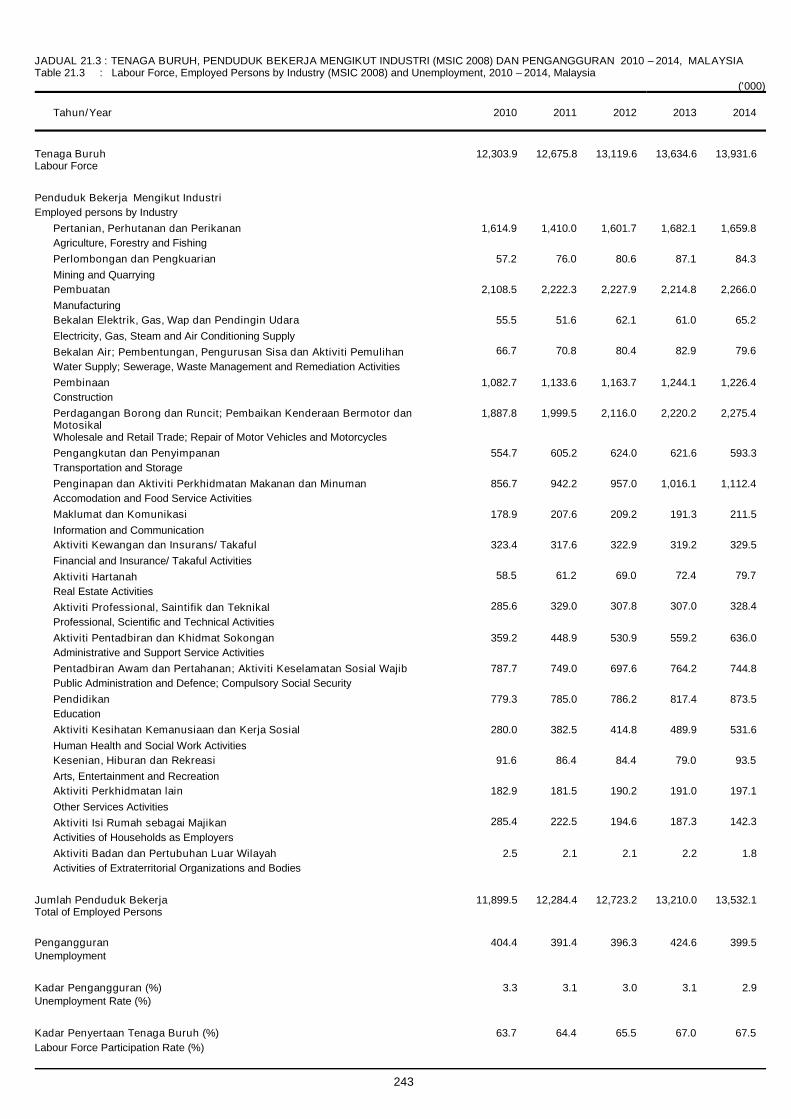
JADUAL 21.3 : TENAGA BURUH, PENDUDUK BEKERJA MENGIKUT INDUSTRI (MSIC 2008) DAN PENGANGGURAN 2010 – 2014, MALAYSIATable 21.3 : Labour Force, Employed Persons by Industry (MSIC 2008) and Unemployment, 2010 – 2014, Malaysia
('000)
Tahun/Year 2010 2011 2012 2013 2014
Tenaga Buruh 12,303.9 12,675.8 13,119.6 13,634.6 13,931.6Labour Force
Penduduk Bekerja Mengikut IndustriEmployed persons by Industry
Pertanian, Perhutanan dan Perikanan 1,614.9 1,410.0 1,601.7 1,682.1 1,659.8Agriculture, Forestry and FishingPerlombongan dan Pengkuarian 57.2 76.0 80.6 87.1 84.3Mining and QuarryingPembuatan 2,108.5 2,222.3 2,227.9 2,214.8 2,266.0ManufacturingBekalan Elektrik, Gas, Wap dan Pendingin Udara 55.5 51.6 62.1 61.0 65.2Electricity, Gas, Steam and Air Conditioning SupplyBekalan Air; Pembentungan, Pengurusan Sisa dan Aktiviti Pemulihan 66.7 70.8 80.4 82.9 79.6Water Supply; Sewerage, Waste Management and Remediation ActivitiesPembinaan 1,082.7 1,133.6 1,163.7 1,244.1 1,226.4ConstructionPerdagangan Borong dan Runcit; Pembaikan Kenderaan Bermotor danMotosikal
1,887.8 1,999.5 2,116.0 2,220.2 2,275.4
Wholesale and Retail Trade; Repair of Motor Vehicles and MotorcyclesPengangkutan dan Penyimpanan 554.7 605.2 624.0 621.6 593.3Transportation and StoragePenginapan dan Aktiviti Perkhidmatan Makanan dan Minuman 856.7 942.2 957.0 1,016.1 1,112.4Accomodation and Food Service ActivitiesMaklumat dan Komunikasi 178.9 207.6 209.2 191.3 211.5Information and CommunicationAktiviti Kewangan dan Insurans/ Takaful 323.4 317.6 322.9 319.2 329.5Financial and Insurance/ Takaful ActivitiesAktiviti Hartanah 58.5 61.2 69.0 72.4 79.7Real Estate ActivitiesAktiviti Professional, Saintifik dan Teknikal 285.6 329.0 307.8 307.0 328.4Professional, Scientific and Technical ActivitiesAktiviti Pentadbiran dan Khidmat Sokongan 359.2 448.9 530.9 559.2 636.0Administrative and Support Service ActivitiesPentadbiran Awam dan Pertahanan; Aktiviti Keselamatan Sosial Wajib 787.7 749.0 697.6 764.2 744.8Public Administration and Defence; Compulsory Social SecurityPendidikan 779.3 785.0 786.2 817.4 873.5EducationAktiviti Kesihatan Kemanusiaan dan Kerja Sosial 280.0 382.5 414.8 489.9 531.6Human Health and Social Work ActivitiesKesenian, Hiburan dan Rekreasi 91.6 86.4 84.4 79.0 93.5Arts, Entertainment and RecreationAktiviti Perkhidmatan lain 182.9 181.5 190.2 191.0 197.1Other Services ActivitiesAktiviti Isi Rumah sebagai Majikan 285.4 222.5 194.6 187.3 142.3Activities of Households as EmployersAktiviti Badan dan Pertubuhan Luar Wilayah 2.5 2.1 2.1 2.2 1.8Activities of Extraterritorial Organizations and Bodies
Jumlah Penduduk Bekerja 11,899.5 12,284.4 12,723.2 13,210.0 13,532.1Total of Employed Persons
Pengangguran 404.4 391.4 396.3 424.6 399.5Unemployment
Kadar Pengangguran (%) 3.3 3.1 3.0 3.1 2.9Unemployment Rate (%)
Kadar Penyertaan Tenaga Buruh (%) 63.7 64.4 65.5 67.0 67.5Labour Force Participation Rate (%)
243

PERANGKAAN PENDUDUKPOPULATION STATISTICS


247
PERANGKAAN PENDUDUK
Nota Keterangan
1. PendudukAnggaran penduduk bagi tahun 1891 dan1901 merujuk kepada negeri-negeriMelayu Bersekutu (Perak, Pahang,Selangor, Negeri Sembilan) dan negeri-negeri Selat (Melaka dan Pulau Pinang).
Anggaran penduduk bagi tempoh1911–1962 pula merujuk kepadaSemenanjung Malaysia sahaja. Manakalaanggaran penduduk bagi tempoh1963 – 2013 merujuk kepada Malaysia.Maklumat penduduk mengikut umur bagitahun 1891 – 1969 hanya boleh diperolehbagi tahun 1947 dan 1957.
Anggaran penduduk bagi tahun rujukan1958 – 1969 adalah berasaskan kepadaAnggaran Penduduk Antara Banci YangDiperbaiki,1957 – 1970.
Anggaran penduduk bagi tahun rujukan1958 - 2010 adalah Anggaran PendudukAntara Banci (Anggaran PendudukPertengahan Tahun yang disemaksemula) yang dijana berasaskan dataBanci Penduduk bagi tahun 1957, 1970,1980, 1991, 2000 dan 2010.
Anggaran Penduduk Pertengahan Tahun2011 - 2015 dijana berasaskan dataBanci Penduduk dan Perumahan 2010yang telah disesuaikan untuk kurangpenghitungan. Kaedah yang digunakanadalah Kaedah Komponen Kohort yangmengambil kira kelahiran, kematian danmigrasi.
POPULATION STATISTICS
Explanatory Notes
1. PopulationPopulation estimates for year 1891 and1901 refer to Federated Malay States(Perak, Pahang, Selangor, NegeriSembilan) and Straits Settlement(Malacca and Penang).
Population estimates for the period1911 - 1962, refer to Peninsular Malaysiaonly. While population estimates for theperiod 1963 - 2013 refer to Malaysia.Information regarding population by agefor the period 1891 - 1969 were onlyavailable for 1947 and 1957.
Population estimates for the years1958 –1969 were based on the RevisedIntercensal Population Estimates,Malaysia,1957 – 1970.
Population estimates for the years1958 - 2010 were Intercensal PopulationEstimates (revised Mid-Year PopulationEstimates) generated based onPopulation Census data for the year1957, 1970, 1980, 1991, 2000 and 2010.
Mid-year Population Estimates for2011 - 2015 are generated based on the2010 Population and Housing Censuswhich had adjusted for under -enumeration. The Cohort-componentMethod takes into account birth, deathand migration in its calculation.

2. Kadar Utama DemografiKadar utama demografi adalahberasaskan kepada data kelahiran dankematian yang disusun oleh JabatanP e r a n g k a a n M a l a y s i a y a n gbersumberkan pendaftaran sivil olehJabatan Pendaf ta ran Negara .Penyusunan mulai tahun 1963 bagiSemenanjung Malaysia dan tahun 1966bagi Sabah dan Sarawak.
Maklumat sebelumnya diperolehdaripada “Report of the Registrar Generalof Births and Deaths” dan Laporan BanciPenduduk bagi tahun-tahun tertentu.
Kadar Demografi adalah seperti berikut :
Kadar Pertambahan Semula JadiKasar merupakan perbezaan diantara kelahiran dan kematian bagisetiap 1,000 penduduk.
Kadar Kelahiran Kasar merujukkepada bilangan kelahiran hidupbagi setiap 1,000 penduduk.
Kadar Kematian Kasar merujuk
kepada bilangan kematian bagisetiap 1,000 penduduk.
Kadar Mortaliti Neonatal merujukkepada kematian bayi yangberumur kurang daripada 28 haribagi setiap 1,000 kelahiran hidup.
Kadar Mortaliti Bayi merujukkepada bilangan kematian bayiberumur kurang daripada 1 tahunbagi setiap 1,000 kelahiran hidup.
Kadar Mortaliti Kanak-kanakmerujuk kepada bilangan kematiankanak-kanak yang berumur 1 – 4tahun bagi setiap 1,000 pendudukberumur 1 – 4 tahun.
2. Main Demographic RatesThe main demographic rates on birth anddeath data compiled by the Departmentof Statistics, Malaysia, are based on civilregistration process provided by theNational Registration Department. Thecompilation began from year 1963 forPeninsular Malaysia and 1966 for Sabahand Sarawak.
Prior to that, the information werecollected from “Report of the RegistrarGeneral of Births and Deaths” andPopulation Census Report for certainyears.
The Demographic rates as follows :
Crude Rate of Natural Increaserefers to the excess of births overdeaths per 1,000 population.
Crude Birth Rate refers to the numberof live births per 1,000 population.
Crude Death Rate refers to thenumber of deaths per 1,000population.
Neonatal Mortality Rate refers to
deaths of infants aged less than 28days per 1,000 live births.
Infant Mortality Rate refers to thenumber of deaths aged below 1 yearper 1,000 live births.
Toddler Mortality Rate refers to thenumber of deaths of toddlers aged1 – 4 years per 1,000 population aged1 – 4 years old.
248

249
• Nisbah Mortaliti Ibu Bersalin merujukkepada kematian yang disebabkan olehkesulitan semasa hamil atau semasamelahirkan anak atau kematian dalamtempoh 42 hari selepas bersalin bagisetiap 100,000 kelahiran hidup.
3. Jangkaan Hayat Ketika LahirPurata baki umur (tahun) seseorangdijangka akan dapat hidup ketika lahir.
4. Pertumbuhan PendudukPertumbuhan penduduk adalahperubahan penduduk sejajar denganperubahan masa dan boleh dikirasebagai perubahan bilangan individudalam penduduk menggunakan “per unitmasa” sebagai pengukuran.
5. Kadar Kesuburan JumlahMerujuk kepada purata bilangan anakyang akan dilahirkan sekiranyaseseorang perempuan terus hidupsehingga akhir tempoh reproduktifnyadan di sepanjang tempoh itu tertaklukkepada kadar kesuburan umur tertentubagi sesuatu tahun.
6. Kadar Kesuburan Umur TertentuMerujuk kepada bilangan kelahiran olehibu-ibu bagi kumpulan umur tertentudalam sesuatu tahun, bagi setiap seribuperempuan dalam kumpulan umurberkenaan.
• Maternal Mortality Ratio refers to
deaths which are caused bycomplications of pregnancies, childbirthand the puerperium, within the period of42 days after childbirth per 100,000 livebirths.
3. Life Expectancy At BirthThe average remaining age (years) for aperson is expected to live at birth.
4. Population GrowthPopulation growth is the change inpopulation over time, and can bequantified as the change in the number ofindividuals in a population using “per unittime” for measurement.
5. Total Fertility RateRefers to the average number of childrenwhich would be born if women survived tothe end of their reproductive period andthroughout that period are subject to theschedule of age–specific fertility rates forthe given year.
6. Age-specific Fertility RateRefers to the number of births by motherswithin a specific age group during a givenyear, per thousand females in that agegroup.

250
JADUAL 22.1 : PENDUDUK ('000) MENGIKUT KUMPULAN UMUR, 1891 – 2015, MALAYSIATable 22.1 : Population ('000) by Age Group, 1891 – 2015, Malaysia
Tahun/Year
Kumpulan umur/ Age groupPurata kadar pertumbuhan
penduduk tahunan (%)
Jumlah/Total 0 – 14 15 – 64 65+Average annual population growth
rate (%)
1891 746.3 a .. .. .. ..
1901 1,022.3 a .. .. .. ..
1911 2,342.2 b .. .. .. ..
1921 2,910.2 b .. .. .. ..
1931 3,788.5 b .. .. .. ..
1932 1,622.9 c .. .. .. ..
1935 1,777.4 c .. .. .. ..
1937 1,961.4 c .. .. .. ..
1938 2,089.8 c .. .. .. ..
1939 2,125.3 c .. .. .. ..
1940 2,169.3 c .. .. .. ..
1941 4,776.0 d .. .. .. ..
1947 4,908.1 b 1,945.6* 2,795.6* 133.6* ..
1948 4,987.4 d .. .. .. ..
1949 5,081.8 d .. .. .. ..
1950 5,226.5 d .. .. .. ..
1951 5,337.2 d .. .. .. ..
1952 5,506.4 d .. .. .. ..
1953 5,706.0 d .. .. .. ..
1954 5,888.6 d .. .. .. ..
1955 6,058.3 d .. .. .. ..
1956 6,251.6 d .. .. .. ..
1957 6,278.8 b 2,752.2 3,351.5 175.0 ..
1958 6,504.6 e .. .. .. ..
1959 6,702.6 e .. .. .. ..
1960 8,118.0e** .. .. .. ..
1961 8,378.5 f .. .. .. 3.2
1962 8,651.8 f .. .. .. 3.2
1963 8,920.2 f .. .. .. 3.1
1964 9,168.4 f .. .. .. 2.7
1965 9,436.6 f .. .. .. 2.9
1966 9,732.8 f .. .. .. 3.1
1967 10,007.4 f .. .. .. 2.8
1968 10,252.8 f .. .. .. 2.4
1969 10,500.2 f .. .. .. 2.4

251
JADUAL 22.1 : PENDUDUK ('000) MENGIKUT KUMPULAN UMUR, 1891 – 2015, MALAYSIA (samb.)Table 22.1 : Population ('000) by Age Group, 1891 – 2015, Malaysia (cont’d)
Tahun/YearKumpulan umur/ Age group
Purata kadar pertumbuhanpenduduk tahunan (%)
Jumlah/Total 0 – 14 15 – 64 65+Average annual population
growth rate (%)
1970 10,881.8 4,847.3 5,677.6 356.8 3.6
1971 11,159.7 4,907.0 5,876.4 376.3 2.5
1972 11,441.3 4,975.1 6,076.9 389.3 2.5
1973 11,719.8 5,037.5 6,276.0 406.3 2.4
1974 12,001.3 5,100.3 6,477.0 424.0 2.4
1975 12,300.3 5,170.5 6,686.9 442.9 2.5
1976 12,588.1 5,229.1 6,903.3 455.8 2.3
1977 12,901.1 5,302.3 7,135.8 463.0 2.5
1978 13,200.2 5,365.1 7,361.2 473.9 2.3
1979 13,518.3 5,435.7 7,596.4 486.1 2.4
1980 13,879.2 5,542.4 7,845.7 491.1 2.6
1981 14,256.9 5,621.9 8,126.2 508.8 2.7
1982 14,651.1 5,723.7 8,400.4 527.0 2.7
1983 15,048.2 5,818.8 8,686.1 543.3 2.7
1984 15,450.4 5,933.9 8,957.2 559.3 2.6
1985 15,882.7 6,081.2 9,227.3 574.2 2.8
1986 16,329.4 6,223.5 9,514.8 591.2 2.8
1987 16,773.5 6,370.0 9,794.6 608.8 2.7
1988 17,219.1 6,512.0 10,080.7 626.3 2.6
1989 17,662.1 6,650.0 10,369.5 642.5 2.5
1990 18,102.4 6,775.0 10,669.0 658.5 2.5
1991 18,547.2 6,899.9 10,971.5 675.9 2.4
1992 19,067.5 7,038.6 11,322.1 706.7 2.8
1993 19,601.5 7,192.0 11,680.6 728.9 2.8
1994 20,141.7 7,329.2 12,058.4 754.1 2.7
1995 20,681.8 7,453.3 12,447.7 780.7 2.7
1996 21,222.6 7,566.1 12,850.5 806.1 2.6
1997 21,769.3 7,668.7 13,266.5 834.1 2.5
1998 22,333.5 7,781.8 13,688.7 863.0 2.6
1999 22,909.5 7,885.6 14,129.1 894.8 2.6
2000 23,494.9 8,003.1 14,560.0 931.8 2.5
2001 24,030.5 8,073.8 14,979.4 977.3 2.3
2002 24,542.5 8,097.5 15,420.1 1,024.9 2.1
2003 25,038.1 8,086.5 15,878.1 1,073.5 2.0
2004 25,541.5 8,070.1 16,349.6 1,121.7 2.0
2005 26,045.5 8,039.5 16,836.0 1,170.1 2.0
2006 26,549.9 7,998.0 17,331.3 1,220.6 1.9
2007 27,058.4 7,951.9 17,838.7 1,267.8 1.9
2008 27,567.6 7,904.4 18,349.7 1,313.5 1.9
2009 28,081.5 7,865.9 18,854.6 1,361.0 1.8
2010 28,588.6 7,822.1 19,341.4 1,425.1 1.8
2012 29,510.0 7,776.6 20,167.2 1,566.2 1.5
2011 29,062.0 7,790.8 19,779.1 1,492.1 1.6
2013 30,213.7 7,783.4 20,780.3 1,649.9 2.4
2014p 30,598.0 7,762.9 21,099.0 1,736.1 1.3
2015e 30,995.7 7,754.5 21,415.1 1,826.1 1.3

252
Punca / Source :1. 1891 & 1901 : Kertas penyelidikan Bil. 10, Penduduk-penduduk Malaysia, ms.9
Research Paper No. 10, The Population of Malaysia, pg.92. 1911, 1921, 1931 & 1947 : Laporan Banci Penduduk 1947, Malaya, ms. 584 – 587 dan 132 (Jadual 2)
A report on the 1947 Census of Population, Malaya, pg. 584 – 587 and 132 (Table 2)3. 1932, 1935, 1937 – 1940 : Laporan Pendaftar Besar Kelahiran dan kematian atau Siri Masa Perangkaan Penting,
Semenanjung Malaysia, 1911 – 1985Report of the Registrar General of Births and Deaths or Vital Statistics Time Series, PeninsularMalaysia, 1911 – 1985
4. 1941 : Laporan Pendaftaran Kelahiran dan kematian 1947Report of the Registration of Births and Deaths for the year 1947
5. 1948 – 1952 : Laporan Pendaftaran Kelahiran dan kematian 1952Report of the Registration of Births and Deaths for the year 1952
6. 1953 – 1956 : Laporan Pendaftar Besar Penduduk, Kelahiran, Kematian, Perkahwinan dan Pengambilan anak angkat1957Report of the Registrar General on Population, Births, Deaths, Marriages & Adoption for the year 1957
7. 1957 : Banci Penduduk 1957 (Laporan 14) Jabatan Perangkaan Persekutuan Tanah Melayu, Kuala Lumpur(1960)1957 Census of Population (Report 14) Department of Statistics, Federation of Malaya, Kuala Lumpur (1960)
8. 1958 – 1970 : Anggaran-anggaran Penduduk Antara Banci yang diperbaiki, Malaysia, 1957 – 1970Revised Inter-Censal Population Estimates, Malaysia, 1957 – 1970
9. 1971 – 1979 : Kajian Semula Anggaran Penduduk Pertengahan Tahun Antara Banci 1971 – 1979. (Tidak diterbitkan)Revised Intercensal Mid –Year Population Estimates, 1971 – 1979 (Unpublished)
10. 1980 – 1990 : Kajian Semula Anggaran Penduduk Pertengahan Tahun Antara Banci, Malaysia, 1981 – 1990Revised Intercensal Mid – Year Population Estimates, Malaysia, 1981 – 1990
11. 1991 – 2000 : Kajian Semula Anggaran Penduduk Pertengahan Tahun Antara Banci Mengikut Negeri, Malaysia,1992 – 1999Revised Intercensal Mid – Year Population Estimates by States, Malaysia, 1992 – 1999
12. 2000 – 2010 : Anggaran Penduduk Pertengahan Tahun Antara Banci, Malaysia dan Negeri, 2001 – 2009Intercensal Mid-Year Population Estimates, Malaysia and States, 2001 - 2009
13. 2011 – 2015 : Anggaran Penduduk Pertengahan Tahun berasaskan data Banci Penduduk dan PerumahanMalaysia 2010Mid-Year Population Estimates based on the Population and Housing Census of Malaysia 2010
Nota / Notes :
1. 1891, 1901, 1911, 1921, 1931, 1947 dan 1957 : Data Banci Semenanjung Malaysia ; 1960 : Banci di Sabah/Sarawak1891, 1901, 1911, 1921, 1931, 1947 and 1957 : Census data of Peninsular Malaysia ; 1960 : Census on Sabah/Sarawak
2. a Terdiri daripada Negeri-negeri Melayu Bersekutu (Negeri Sembilan, Pahang, Perak & Selangor) dan Negeri-negeriSelat (Melaka & Pulau Pinang)Comprised of the Federated Malay States (Negeri Sembilan, Pahang, Perak & Selangor) and Straits Settlements (Malacca& Penang)
3. Angka tahun 1911, 1921 dan 1931 termasuk kategori penduduk sementaraFigures for 1911,1921 and 1931 include transient population categories
4. * Tidak termasuk 29,648 orang penduduk Orang Asli dan umur tidak dinyatakan (Data Siri Masa Banci Pendudukdan Perumahan 1911 – 2000)Excluded 29,648 persons of nomadic aborigines and age not stated (Time Series Data Population and Housing Census,1911 – 2000)
5. b Data Banci untuk Semenanjung MalaysiaCensus data for Peninsular Malaysia
6. c Anggaran penduduk pertengahan tahun dan terdiri daripada Negeri-negeri Bersekutu (Negeri Sembilan, Pahang,Perak & Selangor)Estimated mid – year population and comprised of the Federated Malay States (Negeri Sembilan, Pahang, Perak &Selangor)
7. d Anggaran penduduk pertengahan tahun dan terdiri daripada negeri-negeri di Semenanjung MalaysiaEstimated mid – year population and comprised of the states in Peninsular Malaysia
8. e Anggaran Penduduk pertengahan tahun Antara Banci untuk Semenanjung MalaysiaMid – year Intercensal Population Estimates for Peninsular Malaysia
9. f Anggaran Penduduk pertengahan tahun Antara Banci untuk MalaysiaMid – year Intercensal Population Estimates for Malaysia
10. ** Termasuk data Banci di Sabah dan SarawakInclude Census data in Sabah and Sarawak
Jumlah campuran mungkin berbeza kerana pembundaranThe added total may differ due to rounding

JADUAL 22.2 : KADAR UTAMA DEMOGRAFI, 1911 – 2013, MALAYSIA
Tahun Kadar Kadar Kadar Kadar Kadar Kadar Kadar NisbahPertambahan Kelahiran Kematian Kesuburan Mortaliti Mortaliti Mortaliti MortalitiSemula Jadi Kasar Kasar Jumlah Neonatal Bayi Kanak- Ibu
Kasar kanak BersalinYear Crude Rate Crude Crude Total Neonatal Infant Toddler Maternal
of Natural Birth Rate Death Fertility Mortality Mortality Mortality MortalityIncrease Rate Rate Rate Rate Rate Ratio
1911 .. 19.4 39.1 .. .. .. .. ..1912 .. 23.5 37.8 .. .. .. .. ..1913 .. 23.1 34.0 .. .. .. .. ..1914 .. 24.6 34.3 .. .. .. .. ..1915 .. 25.3 28.9 .. .. .. .. ..1916 .. 24.2 30.6 .. .. .. .. ..1917 .. 27.9 34.2 .. .. .. .. ..1918 .. 25.8 52.9 .. .. .. .. ..1919 .. 24.6 29.4 .. .. .. .. ..1920 .. 27.1 32.3 .. .. .. .. ..1921 .. 27.2 28.5 .. .. .. .. ..1922 .. 25.5 25.6 .. .. 171.0 .. ..1923 .. 25.3 24.1 .. .. 180.0 .. ..1924 .. 27.3 23.2 .. .. 181.0 .. ..1925 .. 28.1 22.9 .. .. 177.0 .. ..1926 .. .. .. .. .. .. .. ..1927 .. 30.5 30.7 .. .. 203.0 .. ..1928 .. 32.5 28.0 .. .. 182.0 .. ..1929 .. 32.4 24.6 .. .. 178.0 .. ..1930 .. 36.5 24.1 .. .. 163.0 .. ..1931 .. 33.3 19.1 .. .. 139.0 .. ..1932 15.5 34.0 18.5 .. .. 137.2 .. ..1933 .. 35.5 20.2 .. .. 146.0 .. 1,084.81934 .. 35.4 21.4 .. .. 163.0 .. 974.11935 16.0 35.9 19.9 .. 58.6 144.2 .. 955.71936 .. 38.7 19.2 .. .. 142.0 .. 1,008.31937 17.9 37.8 19.9 .. 58.1 146.9 .. 901.71938 20.5 39.7 19.1 .. 54.3 146.6 .. 854.81939 23.4 41.0 17.5 .. 49.2 126.9 .. 834.11940 21.1 39.7 18.6 .. 49.2 134.3 .. 765.91946 .. .. .. .. 31.9 91.7 .. 668.11947 23.6 43.0 19.4 .. 40.2 102.2 .. 700.11948 24.2 40.4 16.3 .. 36.4 89.6 .. 583.01949 29.6 43.8 14.2 .. 33.4 80.6 .. 533.71950 26.2 42.0 15.8 .. 34.4 101.6 .. 533.91951 28.3 43.6 15.3 .. 31.5 97.3 .. 569.81952 30.8 44.4 13.6 .. 32.1 90.0 .. 520.01953 31.3 43.7 12.4 .. 31.1 83.4 .. 471.61954 31.6 43.8 12.2 .. 30.2 83.1 .. 475.91955 31.6 43.0 11.5 .. 29.5 78.4 11.1 418.01956 34.3 45.5 11.3 .. 30.1 75.2 9.1 396.21957 33.7 46.2 12.4 .. 29.6 75.5 10.6 282.21958 32.3 43.3 11.0 6.3 32.2 79.6 9.0 277.31959 32.4 42.1 9.7 6.2 28.6 66.0 8.0 209.61960 31.4 40.9 9.5 6.0 30.1 68.9 8.0 242.31961 32.6 41.8 9.2 6.2 28.6 59.7 8.0 200.31962 31.0 40.4 9.4 6.0 30.8 59.3 7.6 230.01963 29.7 38.1 8.5 6.0 26.5 55.5 7.0 206.41964 30.5 38.2 7.7 6.0 23.0 47.2 5.8 187.41965 28.5 36.1 7.5 5.6 25.0 48.5 5.8 186.4
1970 25.7 32.4 6.7 4.9 21.4 39.4 4.2 140.8
Table 22.2 : Main Demographic Rates, 1911 – 2013, Malaysia
1966 29.4 36.7 7.3 5.7 23.6 46.6 5.1 169.61967 27.7 34.9 7.2 5.4 22.6 44.0 5.4 162.41968 28.0 35.2 7.2 5.4 21.6 40.7 5.4 162.31969 26.3 33.3 7.0 5.1 21.8 41.4 4.9 154.7
253

JADUAL 22.2 : KADAR UTAMA DEMOGRAFI, 1911 – 2013, MALAYSIA (samb.)Table 22.2 : Main Demographic Rates, 1911 – 2013, Malaysia (cont'd)
Tahun Kadar Kadar Kadar Kadar Kadar Kadar Kadar NisbahPertambahan Kelahiran Kematian Kesuburan Mortaliti Mortaliti Mortaliti MortalitiSemula Jadi Kasar Kasar Jumlah Neonatal Bayi Kanak- Ibu
Kasar kanak BersalinYear Crude Rate Crude Crude Total Neonatal Infant Toddler Maternal
of Natural Birth Rate Death Fertility Mortality Mortality Mortality MortalityIncrease Rate Rate Rate Rate Rate Ratio
1971 26.3 32.8 6.6 4.9 20.8 37.2 4.0 112.21972 25.9 32.2 6.3 4.7 21.0 36.1 3.4 99.01973 24.8 31.1 6.3 4.5 21.4 36.8 3.7 97.41974 25.3 31.3 6.0 4.4 20.5 33.8 3.1 90.11975 24.8 30.7 6.0 4.3 19.3 32.2 3.1 77.31976 25.3 30.9 5.7 4.2 16.9 28.8 2.6 72.71977 24.5 30.3 5.8 4.1 16.7 29.3 2.9 70.71978 24.3 29.7 5.4 4.0 15.5 26.1 2.3 75.51979 25.0 30.4 5.4 4.0 14.9 25.1 2.4 59.61980 25.4 30.6 5.3 4.0 14.2 23.8 2.1 56.41981 26.3 31.2 4.9 4.0 12.3 19.9 1.7 53.01982 26.0 31.0 5.0 4.0 12.1 19.5 1.7 45.41983 25.1 30.2 5.1 3.8 12.3 20.2 1.7 35.51984 25.9 31.0 5.0 3.9 11.4 17.5 1.5 36.11985 26.6 31.5 5.0 4.0 10.4 16.4 1.4 33.31986 25.8 30.6 4.7 3.9 9.9 15.5 1.2 25.41987 24.7 29.3 4.5 3.7 9.3 14.5 1.1 24.01988 25.0 29.7 4.6 3.7 9.1 14.1 1.1 24.21989 22.2 26.8 4.6 3.4 8.6 13.4 1.0 19.61990 23.3 27.9 4.6 3.5 8.5 13.1 0.9 18.61991 23.0 27.6 4.5 3.4 8.1 12.5 0.9 19.21992 23.2 27.7 4.5 3.5 7.9 12.1 0.8 19.51993 23.2 27.6 4.5 3.5 7.5 11.3 0.8 19.61994 22.2 26.7 4.5 3.4 7.1 10.9 0.8 19.21995 21.5 26.1 4.6 3.3 6.8 10.3 0.8 19.31996 21.1 25.6 4.5 3.2 6.0 9.0 0.7 15.61997 20.4 24.8 4.5 3.1 6.0 9.4 0.7 16.81998 18.8 23.5 4.8 3.0 6.3 10.6 0.8 29.11999 17.9 22.8 4.9 2.9 5.5 9.3 0.7 36.22000 18.6 22.9 4.3 2.9 3.1 6.0 0.5 24.42001 16.7 21.0 4.3 2.7 3.7 6.5 0.5 29.92002 15.7 20.2 4.5 2.6 3.8 6.9 0.5 32.22003 14.7 19.2 4.5 2.5 3.7 6.6 0.5 28.52004 14.4 18.9 4.4 2.5 3.7 6.5 0.4 27.22005 13.8 18.2 4.4 2.4 3.9 6.7 0.4 27.42006 13.4 17.8 4.4 2.3 3.8 6.3 0.4 26.92007 13.3 17.7 4.5 2.3 3.8 6.3 0.4 28.82008 13.3 17.9 4.6 2.3 4.0 6.4 0.4 27.02009 13.2 17.9 4.7 2.2 4.3 6.9 0.4 26.72010 12.6 17.2 4.6 2.1 4.3 6.7 0.4 26.12011 12.9 17.6 4.7 2.2 4.2 6.5 0.4 26.22012 13.1 17.8 4.7 2.2 4.0 6.2 0.4 23.22013p 11.6 16.3 4.7 2.0 4.1 6.5 0.4 25.2
254
Nota / Notes :Pertambahan semula jadi, Kelahiran hidup dan Kematian / Natural increase, Live birth and Death1932 – 1962 : Semenanjung Malaysia / Peninsular Malaysia1963 – 2013 : MalaysiaKematian Neonatal / Neonatal death1935 – 1962 : Semenanjung Malaysia / Peninsular Malaysia1963 – 1964 : Semenanjung Malaysia dan Sabah sahaja / Peninsular Malaysia and Sabah1965 – 2013 : MalaysiaKematian bayi / Infant death1922 – 1962 : Semenanjung Malaysia / Peninsular Malaysia1963 – 2013 : MalaysiaKematian kanak-kanak / Toddler death1955 –1979 : Semenanjung Malaysia / Peninsular Malaysia1980 – 2013 : MalaysiaKematian Ibu Bersalin / Maternal death1933 –1962 : Semenanjung Malaysia / Peninsular Malaysia1963 – 2013 : Malaysia
Kelahiran hidup dan Kematian / Live birth and death1911 – 1962 : Semenanjung Malaysia / Peninsular Malaysia1963 – 2013 : Malaysia
Kadar kesuburan jumlah / Total fertility rate1958 –1969 : Semenanjung Malaysia / Peninsular Malaysia1970 – 2013 : Malaysia
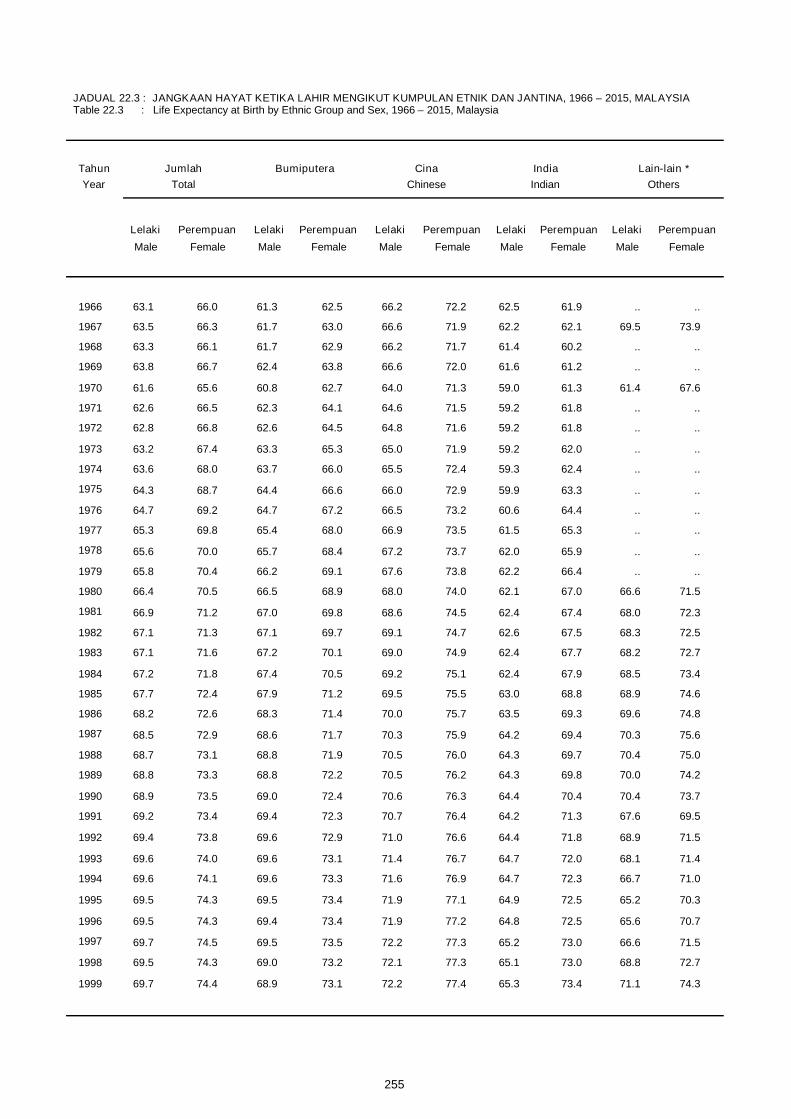
JADUAL 22.3 : JANGKAAN HAYAT KETIKA LAHIR MENGIKUT KUMPULAN ETNIK DAN JANTINA, 1966 – 2015, MALAYSIATable 22.3 : Life Expectancy at Birth by Ethnic Group and Sex, 1966 – 2015, Malaysia
Tahun Jumlah Bumiputera Cina India Lain-lain *Year Total Chinese Indian Others
Lelaki Perempuan Lelaki Perempuan Lelaki Perempuan Lelaki Perempuan Lelaki Perempuan
Male Female Male Female Male Female Male Female Male Female
1966 63.1 66.0 61.3 62.5 66.2 72.2 62.5 61.9 .. ..
1967 63.5 66.3 61.7 63.0 66.6 71.9 62.2 62.1 69.5 73.9
1968 63.3 66.1 61.7 62.9 66.2 71.7 61.4 60.2 .. ..
1969 63.8 66.7 62.4 63.8 66.6 72.0 61.6 61.2 .. ..
1970 61.6 65.6 60.8 62.7 64.0 71.3 59.0 61.3 61.4 67.6
1971 62.6 66.5 62.3 64.1 64.6 71.5 59.2 61.8 .. ..
1972 62.8 66.8 62.6 64.5 64.8 71.6 59.2 61.8 .. ..
1973 63.2 67.4 63.3 65.3 65.0 71.9 59.2 62.0 .. ..
1974 63.6 68.0 63.7 66.0 65.5 72.4 59.3 62.4 .. ..
1975 64.3 68.7 64.4 66.6 66.0 72.9 59.9 63.3 .. ..
1976 64.7 69.2 64.7 67.2 66.5 73.2 60.6 64.4 .. ..
1977 65.3 69.8 65.4 68.0 66.9 73.5 61.5 65.3 .. ..
1978 65.6 70.0 65.7 68.4 67.2 73.7 62.0 65.9 .. ..
1979 65.8 70.4 66.2 69.1 67.6 73.8 62.2 66.4 .. ..
1980 66.4 70.5 66.5 68.9 68.0 74.0 62.1 67.0 66.6 71.5
1981 66.9 71.2 67.0 69.8 68.6 74.5 62.4 67.4 68.0 72.3
1982 67.1 71.3 67.1 69.7 69.1 74.7 62.6 67.5 68.3 72.5
1983 67.1 71.6 67.2 70.1 69.0 74.9 62.4 67.7 68.2 72.7
1984 67.2 71.8 67.4 70.5 69.2 75.1 62.4 67.9 68.5 73.4
1985 67.7 72.4 67.9 71.2 69.5 75.5 63.0 68.8 68.9 74.6
1986 68.2 72.6 68.3 71.4 70.0 75.7 63.5 69.3 69.6 74.8
1987 68.5 72.9 68.6 71.7 70.3 75.9 64.2 69.4 70.3 75.6
1988 68.7 73.1 68.8 71.9 70.5 76.0 64.3 69.7 70.4 75.0
1989 68.8 73.3 68.8 72.2 70.5 76.2 64.3 69.8 70.0 74.2
1990 68.9 73.5 69.0 72.4 70.6 76.3 64.4 70.4 70.4 73.7
1991 69.2 73.4 69.4 72.3 70.7 76.4 64.2 71.3 67.6 69.5
1992 69.4 73.8 69.6 72.9 71.0 76.6 64.4 71.8 68.9 71.5
1993 69.6 74.0 69.6 73.1 71.4 76.7 64.7 72.0 68.1 71.4
1994 69.6 74.1 69.6 73.3 71.6 76.9 64.7 72.3 66.7 71.0
1995 69.5 74.3 69.5 73.4 71.9 77.1 64.9 72.5 65.2 70.3
1996 69.5 74.3 69.4 73.4 71.9 77.2 64.8 72.5 65.6 70.7
1997 69.7 74.5 69.5 73.5 72.2 77.3 65.2 73.0 66.6 71.5
1998 69.5 74.3 69.0 73.2 72.1 77.3 65.1 73.0 68.8 72.7
1999 69.7 74.4 68.9 73.1 72.2 77.4 65.3 73.4 71.1 74.3
255

JADUAL 22.3 : JANGKAAN HAYAT KETIKA LAHIR MENGIKUT KUMPULAN ETNIK DAN JANTINA, 1966 – 2015,MALAYSIA (samb.)
Table 22.3 : Life Expectancy at Birth by Ethnic Group and Sex, 1966 – 2015, Malaysia (cont’d)
Tahun Jumlah Bumiputera Cina India Lain-lain *
Year Total Chinese Indian Others
Lelaki Perempuan Lelaki Perempuan Lelaki Perempuan Lelaki Perempuan Lelaki PerempuanMale Female Male Female Male Female Male Female Male Female
2000 70.0 74.7 69.0 73.3 72.4 77.6 65.7 73.5 73.6 75.7
2001 70.6 75.1 69.5 73.7 72.8 77.9 66.4 73.7 76.3 78.3
2002 70.8 75.3 69.6 73.9 73.0 78.1 66.8 74.1 76.1 77.5
2003 70.9 75.6 69.7 74.2 73.1 78.3 66.8 74.5 76.2 77.5
2004 71.1 75.9 69.9 74.4 73.3 78.5 67.2 75.1 75.6 76.6
2005 71.4 76.2 70.1 74.7 73.6 78.9 67.6 75.4 75.9 77.0
2006 71.5 76.3 70.2 74.7 73.8 79.0 67.9 75.5 76.4 77.4
2007 71.5 76.3 70.2 74.8 73.9 79.2 67.9 75.7 76.6 77.4
2008 71.6 76.4 70.2 74.8 73.9 79.3 67.9 75.7 76.8 77.5
2009 71.6 76.5 70.2 74.8 74.0 79.5 68.0 75.8 77.1 77.7
2010 71.9 76.6 70.7 75.4 74.4 79.1 67.6 75.7 75.7 76.7
2011 72.1 76.8 70.9 75.6 74.6 79.3 67.6 75.8 75.9 76.9
2012 72.2 76.9 71.0 75.7 74.8 79.6 67.6 75.8 75.9 77.2
2013p 72.4 77.1 71.1 75.9 74.9 79.7 67.6 75.8 76.6 77.9
2014e 72.5 77.2 71.2 76.0 75.0 79.9 67.6 75.8 76.8 78.1
2015e 72.5 77.4 71.2 76.1 75.1 80.1 67.7 75.8 76.8 78.0
256
Nota / Notes : * Termasuk bukan warganegara Malaysia / includes non-Malaysian1966 – 1990 : Semenanjung Malaysia / Peninsular Malaysia1991 – 2015 : Malaysia

JADUAL 22.4 : KADAR KESUBURAN UMUR TERTENTU DAN KADAR KESUBURAN JUMLAH, 1958 – 2013, MALAYSIATable 22.4 : Age-Spesific Fertility Rate and Total Fertility Rate, 1958 – 2013, Malaysia
TahunYear
Kadar Kesuburan Umur Tertentu Kadar Kesuburan Jumlah
Age–Spesific Fertility Rate ( ASFR ) Total Fertility Rate (TFR)
15 – 19 20 – 24 25 – 29 30 – 34 35 – 39 40 – 44 45 – 49
1958 128 318 318 243 162 67 19 6,275
1959 123 313 305 237 168 69 20 6,175
1960 114 306 301 241 160 68 19 6,045
1961 118 313 314 258 160 67 9 6,195
1962 105 299 318 257 157 65 7 6,040
1963 91 284 323 252 153 72 19 5,970
1964 85 282 322 248 156 79 22 5,970
1965 80 261 302 241 155 67 20 5,630
1966 78 259 306 253 163 67 19 5,725
1967 68 247 292 241 153 59 17 5,385
1968 65 240 291 250 152 61 18 5,385
1969 58 225 274 234 141 59 20 5,055
1970 58 226 262 214 142 57 18 4,885
1971 58 225 258 217 145 57 14 4,870
1972 56 215 253 211 141 54 12 4,710
1973 53 205 242 199 136 50 12 4,485
1974 53 207 241 195 130 48 10 4,420
1975 53 198 240 183 122 49 10 4,275
1976 49 200 244 182 117 46 9 4,235
1977 48 191 232 177 115 47 8 4,090
1978 45 187 230 170 106 45 7 3,950
1979 44 184 234 177 107 45 7 3,990
1980 43 183 237 180 106 42 7 3,990
1981 42 184 237 181 110 42 7 4,015
1982 40 179 233 181 112 41 6 3,960
1983 37 171 227 177 108 39 6 3,825
1984 36 170 234 184 113 39 5 3,905
1985 35 167 239 193 115 41 6 3,980
1986 34 159 230 184 115 43 5 3,850
1987 31 148 221 178 110 43 5 3,680
1988 29 147 226 183 111 41 4 3,705
1989 28 135 197 163 102 41 5 3,355
257

JADUAL 22.4 : KADAR KESUBURAN UMUR TERTENTU DAN KADAR KESUBURAN JUMLAH, 1958 – 2013,MALAYSIA (samb.)
Table 22.4 : Age-Spesific Fertility Rate and Total Fertility Rate, 1958 – 2013, Malaysia (cont’d)
TahunYear
Kadar Kesuburan Umur Tertentu Kadar Kesuburan Jumlah
Age–Spesific Fertility Rate ( ASFR ) Total Fertility Rate (TFR)
15 – 19 20 – 24 25 – 29 30 – 34 35 – 39 40 – 44 45 – 49
1990 29 139 209 172 104 40 5 3,490
1991 28 139 208 170 102 38 4 3,447
1992 28 140 209 172 103 38 5 3,473
1993 27 140 212 172 101 37 4 3,466
1994 26 134 205 168 98 35 4 3,353
1995 23 131 203 165 96 34 4 3,278
1996 23 129 199 164 95 32 4 3,226
1997 21 123 196 159 92 30 3 3,125
1998 19 116 183 151 90 30 3 2,971
1999 17 102 181 153 92 31 4 2,896
2000 15 95 184 159 95 33 4 2,926
2001 15 88 168 146 90 31 4 2,709
2002 13 81 163 145 86 30 4 2,609
2003 13 76 157 139 83 27 3 2,494
2004 13 72 154 138 81 27 3 2,450
2005 12 69 149 136 79 25 3 2,362
2006 12 66 145 134 76 25 3 2,299
2007 12 63 142 135 76 23 3 2,274
2008 13 64 139 137 76 24 2 2,274
2009 14 63 135 137 76 23 2 2,245
2010 14 58 128 131 73 21 2 2,136
2011 14 57 129 135 76 22 2 2,174
2012 14 56 130 136 78 22 2 2,188
2013p 13 50 121 122 72 20 2 1,994
258
Nota / Notes :1958 – 1969 : Semenanjung Malaysia/ Peninsular Malaysia1970 – 2013 : Malaysia