Embed Size (px)
Citation preview

Performance andFinancial Statements
63 ..........................2012/2013 Performance Statement68 ..................................Independent Auditor’s Report71 ..............................................Financial Performance80 .......................................................Financial Report85..........................................Notes to Financial Report
While Council’s performance is measured against its four goals—Sustainable Living, Community Wellbeing, Sustainable Environment and Infrastructure, and Responsible Governance—so too is it measured on our ability to balance our various income streams against operating costs to ensure we deliver a strong and diverse local economy.
62M
acedon Ranges Shire Council
2012/13

2012/2013PerformanceStatement
PERFORMANCE AND FINANCIAL STATEMENTS
In accordance with Section 132 of the Local Government Act 1989 this Statement has been prepared, identifying those Actions (Key Strategic Activities) that Council included in the 2012/2013 Budget and details the extent to which it achieved these Actions.
2012/2013 PerformanceStatement
Our Key Outcomes1. Sustainable Living1.2 Appropriate development enhancing our lifestyle and community.......................... 1
1.2.1.10 Advance Kyneton Structure Plan
1.3 A community that is safe to live in............................................................................... 1
1.3.1.2 Implement stage 1 of the Smoke Free Outdoor Areas Policy
1.3.1.5 Conduct two microchipping sessions in accordance with Domestic Animal Management Plan
2. Community Wellbeing2.1 Engaged and connected community……………………..………………..…................. 2
2.1.2.14 Support youth activities in conjunction with other agencies
2.2 Improved quality of life for our community................................................................. 2
2.2.1.48 Continue planning for early years services
3. Sustainable Environment and Infrastructure3.1 Enhanced and protected natural environment ………..........................….................. 3
3.1.1.9 Continue to implement the natural environment strategic initiatives
3.1.3.2 Measure the effectiveness of the introduction of integrated waste management services
3.2 Sustainable asset management……………………………………………….................. 3
3.2.1.2 Review and revise Open Space and Drainage Asset Management Plans by 30 June 2013
4. Responsible Governance4.1 Democratic governance…………………..…………………………………….................. 4
4.1.2.9 Promote Council Meetings and ensure that all information regarding Council agendas and minutes are available to the public in a timely manner.
4.3 Responsible financial stewardship.............................................................................. 4
4.3.1.1 Complete Audit Committee self-assessment and Annual Report
Mac
edon
Ran
ges
Sh
ire C
ounc
il63
2012/13
w
2012/2013 Performance
Statement
1. Sustainable Living1.1 Outcome: Appropriate development enhancing our lifestyle and community
1.1.1 Strategic Action:
Develop appropriate Strategic Land Use Policies that enhance the liveability and sustainability of our communities and support diversity of housing options.
Key Action: Advance Kyneton Structure Plan.
Indicator: Structure Plan completed by 30 June 2013.
Result: Achieved.
Comment: Kyneton Structure Plan adopted at Council Meeting on 26 June 2013.
1.2 Outcome: A community that is safe to live in
1.2.1 Strategic Action:
Continue to promote and improve the health and safety of the community in the areas of water treatment, immunisation, building design and regulation and domestic animal control.
Key Action: Implement Stage 1 of the Smoke Free Outdoor Areas Policy.
Indicator: Stage 1 of the policy implemented.
Result: Achieved.
Comment:Four businesses have joined the voluntary alfresco dining program, signage has been delivered and promotion of businesses is occurring.
1.3 Outcome: A community that is safe to live in
1.3.1 Strategic Action:
Continue to promote and improve the health and safety of the community in the areas of water treatment, immunisation, building design and regulation and domestic animal control.
Key Action: Conduct two microchipping sessions in accordance with the Domestic Animal Management Plan.
Indicator: Two microchipping sessions conducted.
Result: Achieved.
Comment: Two microchipping sessions were held in partnership with local vets in Gisborne and Kyneton.
Macedon Ranges Shire C
ouncil64
2012/13
w
2012/2013 Performance Statement
PERFORMANCE AND FINANCIAL STATEMENTS
2. Community Wellbeing2.1 Outcome: Engaged and connected community
2.1.1 Strategic Action:
Provide appropriate, inclusive and sustainable facilities for active and passive participation in community life.
Key Action: Support youth activities in conjunction with other agencies
Indicator: Develop a three year Youth Development Strategy by 30 June 2013
Result: Achieved.
Comment: A Youth Strategy was developed and circulated for public consultation by 30 June 2013.
2.2 Outcome: Improved quality of life for our community
2.2.1 Strategic Action: Advocate and plan for improved family and children’s services.
Key Action: Continue planning for early years services.
Indicator:Review the Gisborne Early Years Feasibility Study and present options to Council for the future of the Grant Avenue Kindergarten service by 30 June 2013.
Result: Achieved.
Comment:Reports were presented to Council at the August 2012 and March 2013 Ordinary Council Meetings regarding an Early Years Hub.
Mac
edon
Ran
ges
Sh
ire C
ounc
il65
2012/13

2012/2013 Performance
Statement
3. Engaged and connected community3.1 Outcome: Enhanced and protected natural environment
3.1.1 Strategic Action: Encourage sustainable land management practices
Key Action: Continue to implement the natural environment strategic initiatives.
Indicator: Adopt two new Reserve Management Plans.
Result: Achieved.
Comment:
Management Plans adopted for: Woodend Racecourse Grassland; Bald Hill Bushland Reserve; Sandy Creek Road, Riddells Creek; Hobbs Road Reserve, Bullengarook; Barringo Reserve; and Mount Gisborne Reserve.
3.2 Outcome: Enhanced and protected natural environment
3.2.1 Strategic Action: Provide effective and integrated waste management services.
Key Action: Measure the effectiveness of the introduction of integrated waste management services.
Indicator: 5% percentage increase in recycling diverted from the waste stream.
Result: Achieved.
Comment:
The measured increase in recycling diverted from the waste stream is greater than 5%. This is mainly due to the introduction of the green garden bin service. It has increased from 32% to 45%.
3.3 Outcome: Sustainable asset management
3.3.1 Strategic Action:
Plan for the management of infrastructure in a sustainable manner.
Key Action: Review and revise Open Space and Drainage Asset Management Plans by 30 June 2013.
Indicator: Plans to be completed by 30 June 2013 for the purposes of public consultation.
Result: Achieved.
Comment: Both plans have been reviewed and redrafted for the purposes of public consultation
Macedon Ranges Shire C
ouncil66
2012/13
2012/2013 PerformanceStatement
PERFORMANCE AND FINANCIAL STATEMENTS
4. Responsible Governance2.1 Outcome: Democratic governance
2.1.1 Strategic Action: Ensure accountable, transparent and honest decision-making.
Key Action:Promote Council Meetings and ensure that all information regarding Council agendas and minutes are available to the public in a timely manner.
Indicator:Notice papers available online from 12.00noon on the Monday prior to each meeting. Minutes available online within five working days of the meeting.
Result: Achieved.
Comment: Established timeframes met with regard to notice paper and minute distribution.
2.2 Outcome: Responsible financial stewardship
2.2.1 Strategic Action: Increase the transparency of financial management
Key Action: Complete Audit Committee self-assessment and Annual Report.
Indicator: Report submitted to Council by 31 December 2012.
Result: Achieved.
Comment:
The Audit Committee self-assessment was undertaken on 27 November 2012 and the Annual Report (including the results of the Committee’s self-assessment) was presented to the Council Meeting on 12 December 2012 by the Audit Committee Chairman, Brian Collins.
ConclusionFor the purposes of sections 127(d) and 132 of the Local Government Act, Council places significant emphasis on the selection of Key Strategic Activities (from its Council Plan) to be included in the Performance Statement and has successfully completed all of the identified actions for the 2012/2013 Council year.
Mac
edon
Ran
ges
Sh
ire C
ounc
il67
2012/13

w
IndependentAuditor’s
Report
Macedon Ranges Shire C
ouncil68
2012/13

w
Independent Auditor’s Report
PERFORMANCE AND FINANCIAL STATEMENTS
Mac
edon
Ran
ges
Sh
ire C
ounc
il69
2012/13

w
IndependentAuditor’s
Report
Macedon Ranges Shire C
ouncil70
2012/13
w
A Guide to the Financial StatementsThe following guide may be useful for gaining an understanding of Council’s financial position.
Council’s audited Financial Statements for the year ended 30 June 2013, on the following pages, are prepared in accordance with the Accounting Standards and the requirements of the Local Government Act 1989 and Local Government (Finance and Reporting) Regulations 2004.
The statements have been approved in principle by Council, audited by the Auditor-General’s agents, MDHC Audit Assurance, and approved by the Victorian Auditor General.
The financial statements comprise the Comprehensive Income Statement, the Balance Sheet, the Statement of Changes in Equity and the Cash Flow Statement. The following is a brief summary of these Statements.
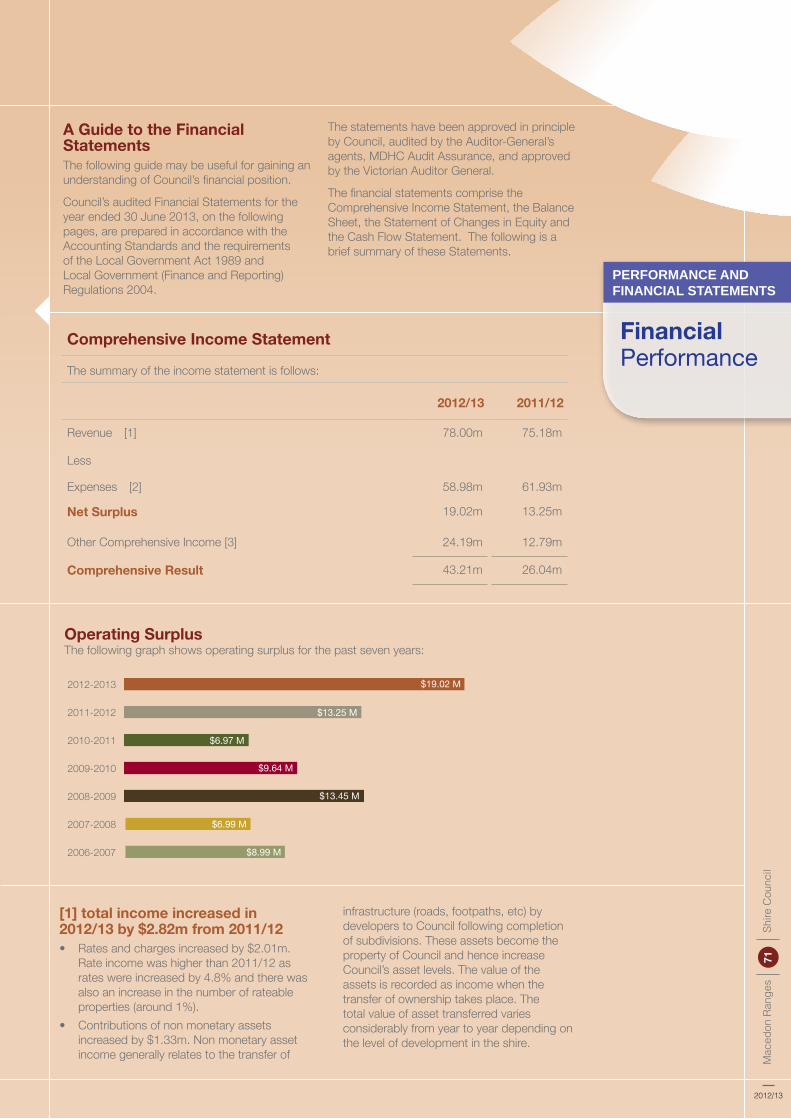
Comprehensive Income Statement
The summary of the income statement is follows:
2012/13 2011/12
Revenue [1] 78.00m 75.18m
Less
Expenses [2] 58.98m 61.93m
Net Surplus 19.02m 13.25m
Other Comprehensive Income [3] 24.19m 12.79m
Comprehensive Result 43.21m 26.04m
[1] total income increased in 2012/13 by $2.82m from 2011/12• Rates and charges increased by $2.01m.
Rate income was higher than 2011/12 as rates were increased by 4.8% and there was also an increase in the number of rateable properties (around 1%).
• Contributions of non monetary assets increased by $1.33m. Non monetary asset income generally relates to the transfer of
infrastructure (roads, footpaths, etc) by developers to Council following completion of subdivisions. These assets become the property of Council and hence increase Council’s asset levels. The value of the assets is recorded as income when the transfer of ownership takes place. The total value of asset transferred varies considerably from year to year depending on the level of development in the shire.
2012-2013
2011-2012
2010-2011
2009-2010
2008-2009
2007-2008
2006-2007
$19.02 M
$13.25 M
$6.97 M
$9.64 M
$13.45 M
$6.99 M
$8.99 M
Operating Surplus The following graph shows operating surplus for the past seven years:
Financial Performance
PERFORMANCE AND FINANCIAL STATEMENTS
Mac
edon
Ran
ges
Sh
ire C
ounc
il71
2012/13

w
• Statutory Fees and Fines increased by $0.99m. The increase is mainly due to higher Planning contributions ($0.53m) and the sale of valuation data to the State Revenue Office ($0.23m). The income from the State Revenue Office is received every two years after the general valuation is completed.
Partly offsetting these increases was lower grant income:
Grants were $1.93m lower than 2012/13:
• Recurrent grants were $1.33m lower than 2011/12. The main reason for the decrease in grants was due to the timing of the payment of the Grants Commission allocations. In 2011/12 Council received three quarters of the 11/12 Grants Commission allocation and half of the 12/13 allocation. In 2012/13 Council has received half of the 2012/13 allocation and half of the 2013/14 allocation. So effectively Council received one year and a quarter of payments
in 2011/12 and one year of payments in 2012/13. This decrease is partly offset by higher kindergarten grants due Council taking over the management of two new kindergartens during the year. As a result of this and increases in kindergarten hours grants for this program were $0.35m higher than 2011/12. Non recurrent grants have also decreased by $0.76m. The level of non recurrent grants varies from year to year depending on Council projects and the availability of funding. Some of the larger grants received in 2012/13 were for the Romsey Sports Precinct ($1.30m) and kindergarten building works grants ($0.70m). In 2011/12 funding of $1.92m was received in relation to flood restoration works (most of the flood damage occurred in 2010/11). Other large grants received in 2011/12 were Neighbourhood Safer Places Grant ($0.86m) and Kyneton Mechanics Institute Restoration Grant ($0.61m).
[2] Total expenses decreased in 2012/13 by $2.95m• Employee benefits decreased by $2.55m.
The 2011/12 expense included a liability of $3.82m related to the shortfall in Local Authorities Superannuation Fund Defined Benefit Plan. The Plan’s shortfall impacted all Victorian Councils. With
this liability removed, employee costs increased by $1.31m. This is mainly a result of the salary increase included in the EBA of 3.7% (approx $0.91m) and staff increases resulting from Council taking over management of two additional kindergartens during the year ($0.20m impact). There were also some other staff increases included in the budget.
The following graph provides a breakdown of Council’s income sources for 2012/13:
FinancialPerformance
Rates and charges: 45%
Other income: 2%Grants: non-recurrent: 8%
Contributions: non-monetary: 18%
Statutory fees and fines: 4%Contributions: cash: 1%
User fees: 7%
Grants: recurrent: 15%
Macedon Ranges Shire C
ouncil72
2012/13
w
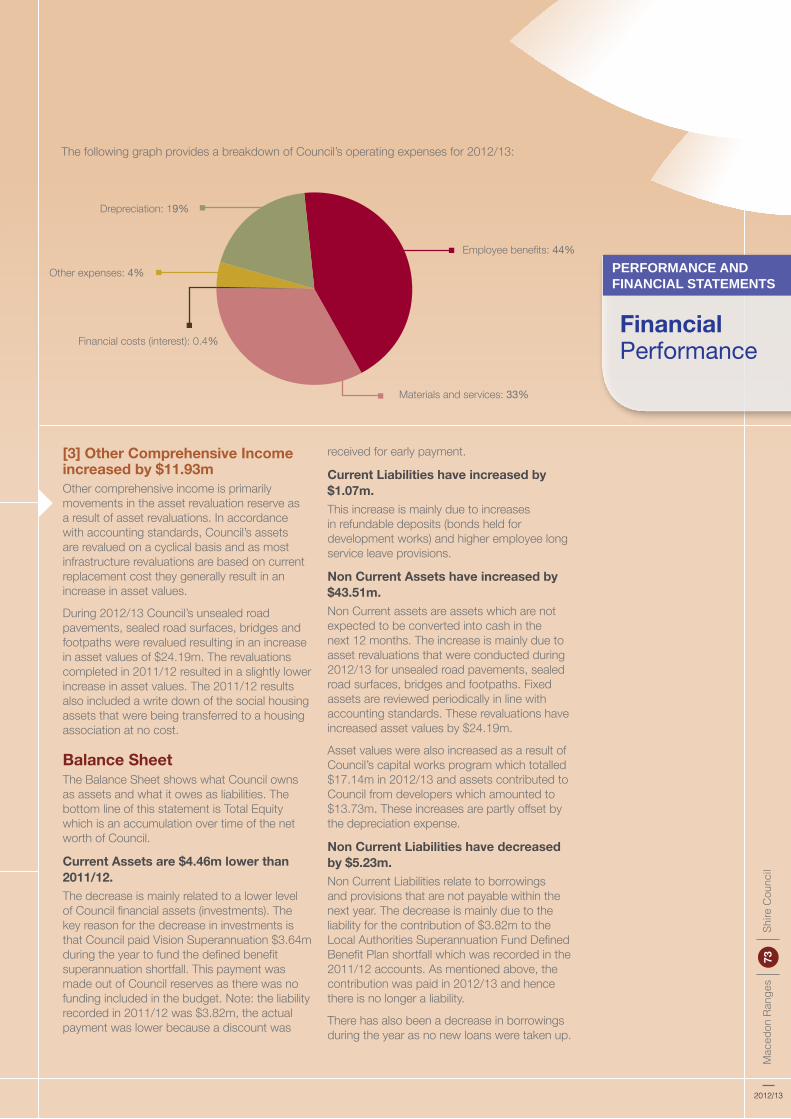
[3] Other Comprehensive Income increased by $11.93mOther comprehensive income is primarily movements in the asset revaluation reserve as a result of asset revaluations. In accordance with accounting standards, Council’s assets are revalued on a cyclical basis and as most infrastructure revaluations are based on current replacement cost they generally result in an increase in asset values.
During 2012/13 Council’s unsealed road pavements, sealed road surfaces, bridges and footpaths were revalued resulting in an increase in asset values of $24.19m. The revaluations completed in 2011/12 resulted in a slightly lower increase in asset values. The 2011/12 results also included a write down of the social housing assets that were being transferred to a housing association at no cost.
Balance SheetThe Balance Sheet shows what Council owns as assets and what it owes as liabilities. The bottom line of this statement is Total Equity which is an accumulation over time of the net worth of Council.
Current Assets are $4.46m lower than 2011/12. The decrease is mainly related to a lower level of Council financial assets (investments). The key reason for the decrease in investments is that Council paid Vision Superannuation $3.64m during the year to fund the defined benefit superannuation shortfall. This payment was made out of Council reserves as there was no funding included in the budget. Note: the liability recorded in 2011/12 was $3.82m, the actual payment was lower because a discount was
received for early payment.
Current Liabilities have increased by $1.07m.This increase is mainly due to increases in refundable deposits (bonds held for development works) and higher employee long service leave provisions.
Non Current Assets have increased by $43.51m.Non Current assets are assets which are not expected to be converted into cash in the next 12 months. The increase is mainly due to asset revaluations that were conducted during 2012/13 for unsealed road pavements, sealed road surfaces, bridges and footpaths. Fixed assets are reviewed periodically in line with accounting standards. These revaluations have increased asset values by $24.19m.
Asset values were also increased as a result of Council’s capital works program which totalled $17.14m in 2012/13 and assets contributed to Council from developers which amounted to $13.73m. These increases are partly offset by the depreciation expense.
Non Current Liabilities have decreased by $5.23m. Non Current Liabilities relate to borrowings and provisions that are not payable within the next year. The decrease is mainly due to the liability for the contribution of $3.82m to the Local Authorities Superannuation Fund Defined Benefit Plan shortfall which was recorded in the 2011/12 accounts. As mentioned above, the contribution was paid in 2012/13 and hence there is no longer a liability.
There has also been a decrease in borrowings during the year as no new loans were taken up.
The following graph provides a breakdown of Council’s operating expenses for 2012/13:
Materials and services: 33%
Employee benefits: 44%
Drepreciation: 19%
Other expenses: 4%
Financial costs (interest): 0.4%Financial Performance
PERFORMANCE AND FINANCIAL STATEMENTS
Mac
edon
Ran
ges
Sh
ire C
ounc
il73
2012/13
w
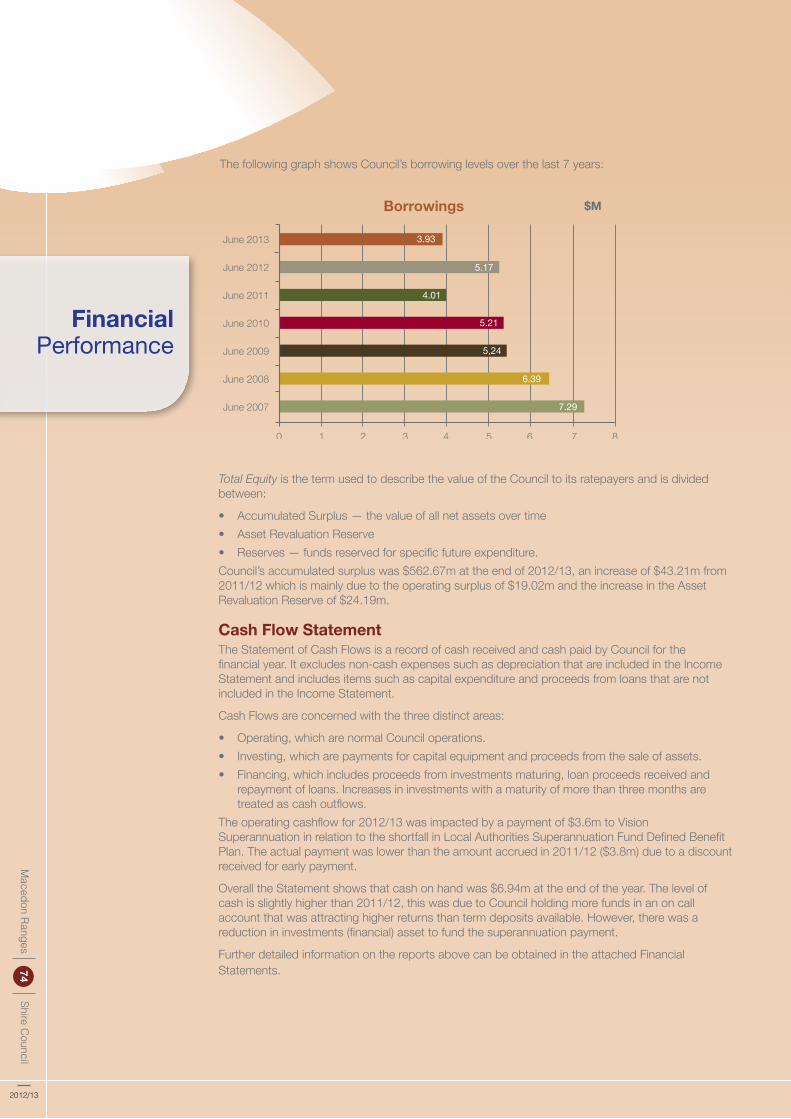
The following graph shows Council’s borrowing levels over the last 7 years:
Total Equity is the term used to describe the value of the Council to its ratepayers and is divided between:
• Accumulated Surplus — the value of all net assets over time• Asset Revaluation Reserve• Reserves — funds reserved for specific future expenditure.Council’s accumulated surplus was $562.67m at the end of 2012/13, an increase of $43.21m from 2011/12 which is mainly due to the operating surplus of $19.02m and the increase in the Asset Revaluation Reserve of $24.19m.
Cash Flow StatementThe Statement of Cash Flows is a record of cash received and cash paid by Council for the financial year. It excludes non-cash expenses such as depreciation that are included in the Income Statement and includes items such as capital expenditure and proceeds from loans that are not included in the Income Statement.
Cash Flows are concerned with the three distinct areas:
• Operating, which are normal Council operations.• Investing, which are payments for capital equipment and proceeds from the sale of assets.• Financing, which includes proceeds from investments maturing, loan proceeds received and
repayment of loans. Increases in investments with a maturity of more than three months are treated as cash outflows.
The operating cashflow for 2012/13 was impacted by a payment of $3.6m to Vision Superannuation in relation to the shortfall in Local Authorities Superannuation Fund Defined Benefit Plan. The actual payment was lower than the amount accrued in 2011/12 ($3.8m) due to a discount received for early payment.
Overall the Statement shows that cash on hand was $6.94m at the end of the year. The level of cash is slightly higher than 2011/12, this was due to Council holding more funds in an on call account that was attracting higher returns than term deposits available. However, there was a reduction in investments (financial) asset to fund the superannuation payment.
Further detailed information on the reports above can be obtained in the attached Financial Statements.
June 2013
June 2012
June 2011
June 2010
June 2009
June 2008
June 2007
3.93
5.17
4.01
5.21
5,24
6.39
7.29
0 2 4 6 8
$M
1 3 5 7
Borrowings
FinancialPerformance
Macedon Ranges Shire C
ouncil74
2012/13

w
Capital WorksThe Standard Statement of Capital Works indicates the level of expenditure incurred on capital works areas. Further information is provided on this expenditure by the type of capital works. The statement indicates that expenditure on capital works amounted to $17.14m for the year.
Some of the key areas of capital works were roads ($4.96m), Romsey sports precinct ($2.68m), plant ($1.78m, including replacement of 3 graders), kindergarten improvement works ($0.97m), footpaths ($0.72m) and bridges ($0.63m).
Capital expenditure fluctuates from year to year due to the scheduling of major one-off projects and the availability of grant funding. The following graph shows the level of capital expenditure over the last seven years.
Financial RatiosFinancial ratios and their trend over time can provide an indication of the financial health of an organisation and its medium to longer term financial sustainability.
Debt Commitment Ratio(Debt Servicing and Redemption / Rate Revenue)
The debt commitment ratio illustrates the amount of income required to fund Council’s debt for the year. Council’s borrowings have reduced over the last five years and hence the debt commitment ratio has also reduced.
6.0%
5.0%
4.0%
3.0%
2.0%
1.0%
0.0%2008/09 2009/10 2010/11 2011/12 2012/13
2012-2013
2011-2012
2010-2011
2009-2010
2008-2009
2007-2008
2006-2007
17.14
18.48
11.50
19.97
9.41
13.48
15.22
0 5 10 15 20
$MCapital Works ExpenditureFinancial Performance
PERFORMANCE AND FINANCIAL STATEMENTS
Mac
edon
Ran
ges
Sh
ire C
ounc
il75
2012/13

w
FinancialPerformance
Revenue Ratio(Rate Revenue / Total Revenue)
The revenue ratio measures Council’s dependence on rates to fund its annual budget. The ratio is heavily dependent on the level of grant funding received; the level of grants can vary significantly from year to year. Council’s reliance on rate revenue increased slightly in 2012/13 due to a lower level of grants than 2011/12.
Debt Exposure Ratio (Total Liabilities / Total Realisable Assets)The debt exposure identifies Council’s exposure to debt and is an indicator of its solvency. In the past four years Council’s debt ratio has remained at similar levels, the increase in 2011/12 was mainly due to the contribution Council was required make as a result of the shortfall in the Local Authorities Superannuation Fund Defined Benefit Plan ($3.82m). The exposure reduced again in 2012/13 after the contribution was paid. Council’s debt exposure remains at a modest level.
25.0%
20.0%
15.0%
10.0%
5.0%
0.0%2008/09 2009/10 2010/11 2011/12 2012/13
52.0%
50.0%
48.0%
46.0%
44.0%
42.0%
40.0%2008/09 2009/10 2010/11 2011/12 2012/13
Working Capital (Current Assets / Current Liabilities)
Working capital ratio is a liquidity measure and provides and assessment of the number of times Council is able to meet its current commitments. Council’s working capital ratio has remained above 150% for the last five years which indicates that Council has no immediate issues in meeting its financial obligations.
Macedon Ranges Shire C
ouncil76
2012/13

w
Financial Performance
Notes to the AccountsWhen reading the financial statements, the accompanying notes provide detailed information to assisting in understanding how figures are comprised and why they have been included. The notes are in accordance with the requirements of the accounting standards.
A reference number is contained within the financial tables and these point the reader to the relevant note.
The notes should be read in conjunction with the financial statements to get a clear picture of the accounts.
Standard StatementsThe Standard Statements are a requirement of the Local Government Act, they are prepared on a basis consistent with the Financial Statements but are not required to meet all the reporting requirements of accounting standards and other mandatory professional reporting requirements.
140%
120%
100%
80%
60%
40%
20%
0%2008/09 2009/10 2010/11 2011/12 2012/13
250%
200%
150%
100%
50%
0%2008/09 2009/10 2010/11 2011/12 2012/13
Investment Gap Ratio (Capital expend on Asset Renewal and Upgrades/Depreciation)
The investment gap ratio provides an indicator as to whether capital spending is sufficient to replace aging assets. On average Council’s capital works renewal expenditure has matched depreciation over the past five years.
PERFORMANCE AND FINANCIAL STATEMENTS
Mac
edon
Ran
ges
Sh
ire C
ounc
il77
2012/13

w
FinancialPerformance
The Standard Statements comprise of:
• Standard Statement of Financial Performance• Standard Statement of Financial Position• Standard Statement of Cash Flows• Standard Statement of Capital Works• Notes to the Standard StatementsStandard Statements provide a comparison between the 2012/13 approved budget and the end of year results.
Most of the Standard Statements are similar to those in the Financial Statements as outlined in Section 2 of this report; however, the Financial Statements do not include a detailed Capital Works report.
Towards Financial SustainabilityThe Annual Financial Statements are a component of Council’s strategic planning and reporting framework.
Long TermPlanning
Medium TermPlanning andSustainability
Short TermPlanning
Accountability
Vision 2025 andStrategis Resource
Plan
Council Plan
Budget
Annual Report andQuarterly Reports
VisionMissionValuesLong term asset andresource planning
ObjectivesStrategiesActionsIndicators
Budget StatementsRecurrent ActivitiesNew InitiativesKey Strategic ActivitiesCapital WorksRates and Charges
Audited StatementsFinancial StatementsPerformance StatementProgress Report
Macedon Ranges Shire C
ouncil78
2012/13
w
Long Term Financial Planning Council’s longer term financial planning is guided by its Strategic Resource Plan. The Strategic Resource Plan (SRP) provides a sound financial framework for Council to formulate annual budgets and assists with its decision-making on major issues and projects.
Council reviews its SRP annually to ensure that Council’s finances are in a state to support the strategic goals and outcomes defined in the Council Plan.
Financial assumptions are also revisited and refined to ensure they continue to reflect the current directions of the Council Plan, together with the latest financial results.
While the 2012/13 results are slightly ahead of the forecast in the SRP, there is no material impact on Council’s long term financial assumptions and there are no significant changes in Council’s operations that impact the long term plan.
2012/13 BudgetEach year Council prepares and adopts an annual budget. The 2012/13 budget was the culmination of considerable input from Councillors, the management team, staff and the community. The draft budget was displayed for public feedback for 28 days. Following a review of the feedback, the final budget was approved by Council on 13 June 2012.
One of Council’s key objectives in the budget process is not to make a large surplus but rather to prepare a balanced budget and then work throughout the year to deliver this result.
Regular Reporting to the CommunityCouncil continued to report to the community through its Quarterly Reports, which are presented to open meetings of Council and are published on Council’s website.
The report includes summary financial statements along with more detailed financial reporting on performance at the department level in respect to operating budget and capital works. The Quarterly Report also includes updates on Council Plan actions and other non-financial performance reports.
The Annual Financial Statements provide detailed information of Council’s financial performance for year.
Financial Performance
PERFORMANCE AND FINANCIAL STATEMENTS
Mac
edon
Ran
ges
Sh
ire C
ounc
il79
2012/13
w
For the Year Ended 30 June 2013
FINANCIAL REPORT
Macedon Ranges Shire C
ouncil80
2012/13
Table of Contents
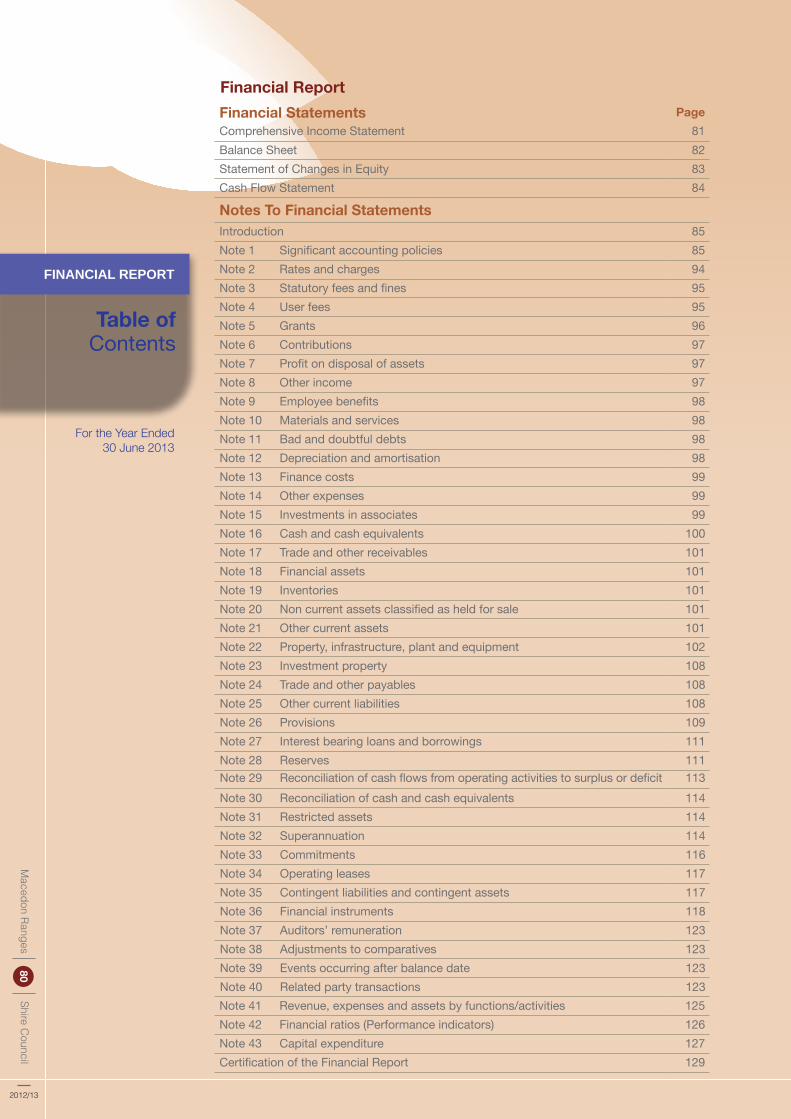
Financial ReportFinancial Statements PageComprehensive Income Statement 81Balance Sheet 82Statement of Changes in Equity 83Cash Flow Statement 84
Notes To Financial StatementsIntroduction 85Note 1 Significant accounting policies 85Note 2 Rates and charges 94Note 3 Statutory fees and fines 95Note 4 User fees 95Note 5 Grants 96Note 6 Contributions 97Note 7 Profit on disposal of assets 97Note 8 Other income 97Note 9 Employee benefits 98Note 10 Materials and services 98Note 11 Bad and doubtful debts 98Note 12 Depreciation and amortisation 98Note 13 Finance costs 99Note 14 Other expenses 99Note 15 Investments in associates 99Note 16 Cash and cash equivalents 100Note 17 Trade and other receivables 101Note 18 Financial assets 101Note 19 Inventories 101Note 20 Non current assets classified as held for sale 101Note 21 Other current assets 101Note 22 Property, infrastructure, plant and equipment 102Note 23 Investment property 108Note 24 Trade and other payables 108Note 25 Other current liabilities 108Note 26 Provisions 109Note 27 Interest bearing loans and borrowings 111Note 28 Reserves 111Note 29 Reconciliation of cash flows from operating activities to surplus or deficit 113Note 30 Reconciliation of cash and cash equivalents 114Note 31 Restricted assets 114Note 32 Superannuation 114Note 33 Commitments 116Note 34 Operating leases 117Note 35 Contingent liabilities and contingent assets 117Note 36 Financial instruments 118Note 37 Auditors’ remuneration 123Note 38 Adjustments to comparatives 123Note 39 Events occurring after balance date 123Note 40 Related party transactions 123Note 41 Revenue, expenses and assets by functions/activities 125Note 42 Financial ratios (Performance indicators) 126Note 43 Capital expenditure 127Certification of the Financial Report 129

w
Mac
edon
Ran
ges
Sh
ire C
ounc
il81
2012/13
PERFORMANCE AND FINANCIAL STATEMENTS
For the Year Ended 30 June 2013
ComprehensiveIncomeStatement
Comprehensive Income Statement
Note 2013 $’000
2012 $’000
IncomeRates and charges 2 35,092 33,077
Statutory fees and fines 3 3,185 2,194
User fees 4 5,720 5,549
Contributions - cash 6 (a) 906 758
Contributions - non-monetary assets 6 (b) 13,729 12,398
Grants - recurrent 5 11,414 12,586
Grants - non-recurrent 5 6,101 6,864 Net gain on disposal of property, infrastructure, plant and equipment 7 - 60
Other income 8 1,686 1,690 Share of net profits of associates and joint ventures accounted for by the equity method
15 45 -
Decrease in provision for landfill liability 26 25 -Fair value adjustments for investment property 23 99 -
Total income 78,002 75,176
ExpensesEmployee benefits 9 (25,968) (28,519)
Materials and services 10 (19,208) (19,169)
Bad and doubtful debts 11 (35) (3)
Depreciation and amortisation 12 (10,926) (10,422)
Finance costs 13 (275) (225)
Other expenses 14 (2,414) (2,241)Net loss on disposal of property, infrastructure, plant and equipment 7 (154) -
Share of net losses of associates and joint ventures accounted for by the equity method
15 - (106)
Fair value adjustments for investment property 23 - (263)
Increase in provision for landfill liability 26 - (978)
Total expenses (58,980) (61,926)
Surplus 19,022 13,250
Other comprehensive incomeItems that will not be reclassified to surplus or deficitNet asset revaluation increment(decrement) 28(a) 24,186 15,794
Impairment losses 28(a) - (3,000)
Comprehensive result 43,208 26,044
The above comprehensive income statement should be read in conjunction with the accompanying notes.

w
For the Year Ended 30 June 2013
FINANCIAL REPORT
Macedon Ranges Shire C
ouncil82
2012/13
BalanceSheet
Balance Sheet
Note 2013 $’000
2012 $’000
AssetsCurrent assetsCash and cash equivalents 16 6,935 5,918
Trade and other receivables 17 5,589 5,413
Other financial assets 18 9,290 14,855
Inventories 19 5 5Non-current assets classified as held for sale 20 1,450 1,586
Other current assets 21 309 261
Total current assets 23,578 28,036
Non-current assetsOther financial assets 18 21 21
Investments in associates accounted for using the equity method 15 1,457 1,413
Property, Infrastructure, Plant and Equipment 22 556,883 513,408
Investment property 23 3,349 3,363
Total non-current assets 561,710 518,205
Total assets 585,288 546,241
LiabilitiesCurrent liabilitiesTrade and other payables 24 5,471 5,188
Provisions 26 5,068 4,646
Interest-bearing loans and borrowings 27 1,057 1,241
Other current liabilities 25 4,003 3,457
Total current liabilities 15,599 14,532
Non-current liabilitiesTrade and other payables 24 - 3,822
Provisions 26 4,148 4,497
Interest-bearing loans and borrowings 27 2,875 3,932
Total non-current liabilities 7,023 12,251
Total liabilities 22,622 26,783
Net Assets 562,666 519,458
EquityAccumulated surplus 262,784 244,093
Reserves 28 299,882 275,365
Total Equity 562,666 519,458
The above balance sheet should be read in conjunction with the accompanying notes.

w
Mac
edon
Ran
ges
Sh
ire C
ounc
il83
2012/13
PERFORMANCE AND FINANCIAL STATEMENTS
For the Year Ended 30 June 2013
Statement ofChanges in Equity
Statement of Changes in Equity
2013 Note Total 2013 $’000
Accumulated Surplus 2013
$’000
Asset Revalua tion
Reserve 2013 $’000
Other Reserves
2013 $’000
Balance at beginning of the financial year
519,458 244,093 269,040 6,325
Comprehensive result 28(a) 43,208 19,022 24,186 -
Transfers to other reserves 28(b) - (2,728) - 2,728
Transfers from other reserves 28(b) - 2,397 - (2,397)
Balance at end of the financial year
562,666 262,784 293,226 6,656
2012 Note 2012 $’000
Accumu lated Surplus 2012
$’000
Asset Revalua tion
Reserve 2012 $’000
Other Reserves
2012 $’000
Balance at beginning of the financial year
493,414 231,476 256,246 5,692
Comprehensive result 28(a) 26,044 13,250 12,794 -
Transfers to other reserves 28(b) - (3,487) - 3,487
Transfers from other reserves 28(b) - 2,854 - (2,854)
Balance at end of the financial year
519,458 244,093 269,040 6,325
The above statement of changes in equity should be read with the accompanying notes.

w
For the Year Ended 30 June 2013
FINANCIAL REPORT
Macedon Ranges Shire C
ouncil84
2012/13
Cash Flow Statement
Cash Flow Statement
Note
2013 Inflows/
(Outflows) $’000
2012 Inflows/
(Outflows) $’000
Cash flows from operating activitiesRates 34,813 32,709
User charges 10,173 9,774
Grants 18,068 20,961
Interest 1,005 1,131
Other receipts 3,391 4,390
Payments to suppliers (19,350) (18,600)
Payments to employees (25,720) (24,184)
Payout of superannuation defined benefits (3,638) -Other payments (5,004) (6,022)
Net cash provided by (used in) operating activities 29 13,738 20,159
Cash flows from investing activities
Payments for property, infrastructure, plant and equipment 43 (17,269) (18,253)
Proceeds from sale of property, infrastructure, plant and equipment 518 1,613
Net cash provided by (used in) investing activities (16,751) (16,640)
Cash flows from financing activities
Finance costs (293) (242)Net (increase)/decrease in longer term investments 5,565 (4,339)
Proceeds from interest bearing loans and borrowings - 2,440
Repayment of interest bearing loans and borrowings (1,242) (1,271)
Net cash provided by (used in) financing activities 4,030 (3,412)
Net increase (decrease) in cash and cash equivalents 1,017 107
Cash and cash equivalents at the beginning of the financial year 5,918 5,811
Cash and cash equivalents at the end of the financial year 30 6,935 5,918
Financing arrangements 27
Restrictions on cash assets 31
The above cash flow statement should be read with the accompanying notes.
w
Mac
edon
Ran
ges
Sh
ire C
ounc
il85
2012/13
PERFORMANCE AND FINANCIAL STATEMENTS
Notes to the Financial Report
For the Year Ended 30 June 2013
Introduction(a) The Macedon Ranges Shire Council was constituted in January 1995 following the amalgamation of the former shires of Gisborne, Romsey, Newham and Woodend and Kyneton. The Council’s main office is located at 129 Mollison Street Kyneton, Victoria.
(b) Other details in relation to the Macedon Ranges Shire Council are as follows:
External Auditor - Auditor-General of Victoria
Internal Auditor - WHK Horwath
Solicitor - Maddocks
Banker - National Australia Bank
Website address - www.mrsc.vic.gov.au
This financial report is a general purpose financial report that consists of a Comprehensive Income Statement, Balance Sheet, Statement of Changes in Equity, Cash Flow Statement, and notes accompanying these financial statements. The general purpose financial report complies with Australian Accounting Standards, other authoritative pronouncements of the Australian Accounting Standards Board, the Local Government Act 1989, and the Local Government (Finance and Reporting) Regulations 2004.
Note 1 Significant Accounting Policies(a) Basis of accounting This financial report has been prepared on the accrual and going concern bases.
This financial report has been prepared under the historical cost convention, except where specifically stated in notes 1(h), 1(k), 1(s) and 1(t).
Unless otherwise stated, all accounting policies are consistent with those applied in the prior year. Where appropriate, comparative figures have been amended to accord with current presentation, and disclosure has been made of any material changes to comparatives.
(b) Change in accounting policies There has been no significant change in accounting policy during 2012/13. However, it should be noted that the Debt Management Policy was reviewed and updated during the year and this resulted in a minor change to the calculation of doubtful debts.
(c) Revenue recognitionRates, grants and contributions Rates, grants and contributions (including developer contributions) are recognised as revenues when the Council obtains control over the assets comprising these receipts.
Control over assets acquired from rates is obtained at the commencement of the rating year as it is an enforceable debt linked to the rateable property or, where earlier, upon receipt of the rates.
A provision for doubtful debts on rates has not been established as unpaid rates represents a charge against the rateable property that will be recovered when the property is next sold.
Control over granted assets is normally obtained upon their receipt (or acquittal) or upon earlier notification that a grant has been secured, and are valued at their fair value at the date of transfer.
Income is recognised when the Council obtains control of the contribution or the right to receive the contribution, it is probable that the economic benefits comprising the contribution will flow to the Council and the amount of the contribution can be measured reliably.
Where grants or contributions recognised as revenues during the financial year were obtained on condition that they be expended in a particular manner or used over a particular period and those conditions were undischarged at balance date, the unused grant or contribution is disclosed in note 5. The note also discloses the amount of unused grant or contribution from prior years that was expended on Council’s operations during the current year.

w
For the Year Ended 30 June 2013
Notes to the Financial
Report
FINANCIAL REPORT
Macedon Ranges Shire C
ouncil86
2012/13
User fees and fines User fees and fines (including parking fees and fines) are recognised as revenue when the service has been provided, the payment is received, or when the penalty has been applied, whichever first occurs.
A provision for doubtful debts is recognised when collection in full is no longer probable. The method used to calculate doubtful debts is in accordance with Council’s Debt Management Policy.
Sale of property, plant and equipment, infrastructure The profit or loss on sale of an asset is determined when control of the asset has irrevocably passed to the buyer.
Rental Rents are recognised as revenue when the payment is due or the payment is received, whichever first occurs. Rental payments received in advance are recognised as a prepayment until they are due.
Interest Interest is recognised progressively as it is earned.
(d) Trade and other receivables and inventoriesTrade and other receivables Receivables are carried at cost. A provision for doubtful debts is recognised when there is evidence that an impairment has occurred.
Property: PeriodLand
land improvements Unlimited landfill 30 years
Buildings buildings 50 years building improvements 50 years
Leasehold improvementsPlant and Equipment
plant, machinery and equipment 7 - 25 years fixtures, fittings and furniture 4 - 20 years
EquipmentOtherInfrastructure:Roads
road formation, pavements and seals 50 - 100 years Bridges 80 - 100 years
Footpaths & cycleway Footpaths, kerbs and channels 30 - 50 years
Drainage Drainage 100 years
Note 1 Significant accounting policies (cont.) Inventories Inventories held for distribution are measured at cost.
(e) Depreciation and amortisation of property, plant and equipment, infrastructure, intangibles Buildings, land improvements, plant and equipment, infrastructure, and other assets having limited useful lives are systematically depreciated over their useful lives to the Council in a manner which reflects consumption of the service potential embodied in those assets. Estimates of remaining useful lives and residual values are made on a regular basis with major asset classes reassessed over a three year cycle. Depreciation rates and methods are reviewed within the same cycle.
Road earthworks are not depreciated.
Artworks are not depreciated.
Straight line depreciation is charged based on the residual useful life as determined each year.
Major depreciation periods used are listed below and are consistent with the prior year unless otherwise stated:

w
Mac
edon
Ran
ges
Sh
ire C
ounc
il87
2012/13
PERFORMANCE AND FINANCIAL STATEMENTS
Notes to the Financial Report
For the Year Ended 30 June 2013
(f) Repairs and maintenanceRoutine maintenance, repair costs, and minor renewal costs are expensed as incurred. Where the repair relates to the replacement of a component of an asset and the cost exceeds the capitalisation threshold the cost is capitalised and depreciated. The carrying value of the replaced asset is expensed. Capitalised costs include an appropriate share of employee costs and plant hire charges, where applicable.
(g) Borrowing costsBorrowing costs are recognised as an expense in the period in which they are incurred.
Property: threshold limitLand
land and improvements $ 10,000 land under roads $ 10,000
Buildings buildings and improvements $ 10,000
Plant and Equipment plant, machinery and equipment $ 1,000 fixtures, fittings and furniture $ 1,000 computers and telecommunications $ 1,000 motor vehicles $ 1,000 artworks $ 1,000
Infrastructure:Roads
road formation, pavements and seals $ 10,000 Bridges $ 10,000Footpaths, kerbs and channels $ 10,000Drainage $ 10,000
Note 1 Significant accounting policies (cont.)(h) Recognition and measurement of assetsAcquisitionThe purchase method of accounting is used for all acquisitions of assets, being the fair value of assets provided as consideration at the date of acquisition plus any incidental costs attributable to the acquisition. The vast majority of Council’s purchased assets are recorded at their purchase price.
Where assets are constructed by Council, cost includes all materials used in construction, direct labour costs incurred during construction and an appropriate share of directly attributable variable overheads.
In accordance with Council’s policy, the threshold limits detailed below have applied when recognising assets within an applicable asset class and unless otherwise stated are consistent with the prior year:

w
For the Year Ended 30 June 2013
Notes to the Financial
Report
FINANCIAL REPORT
Macedon Ranges Shire C
ouncil88
2012/13
(h) Recognition and measurement of assets (cont.)RevaluationSubsequent to the initial recognition of assets, non-current physical assets, other than plant and equipment, motor vehicles and office furniture and equipment, are measured at their fair value, being the amount for which the assets could be exchanged between knowledgeable willing parties in an arms length transaction. For assets that cannot be exchanged eg; roads, replacement cost is generally used as the basis for valuation. At balance date, Council reviewed the carrying value of selected classes of assets measured at fair value to ensure that each asset materially approximated its fair value. Where the carrying value materially differed from the fair value at balance date the class of asset was revalued.
In addition, Council undertakes a formal revaluation of land, buildings, and infrastructure assets on a regular basis generally ranging from 2 to 3 years. The valuation is performed either by experienced council officers or independent experts.
Where the assets are revalued, the revaluation increments are credited directly to the asset revaluation surplus except to the extent that an increment reverses a prior year decrement for that class of asset that had been recognised as an expense in which case the increment is recognised as revenue up to the amount of the expense. Revaluation decrements are recognised as an expense except where prior increments are included in the asset revaluation surplus for that class of asset in which case the decrement is taken to the reserve to the extent of the remaining increments. Within the same class of assets, revaluation increments and decrements within the year are offset.
Land under roadsLand under roads acquired after 30 June 2008 are brought to account using the fair value basis. Council does not recognise land under roads that it controlled prior to that period in its financial report.
(i) Cash and cash equivalentsFor the purposes of the cash flow statement, cash and cash equivalents include cash on hand, deposits at call, and other highly liquid investments with original maturities of three months or less.
(j) Financial assetsThe financial assets, including investments, are valued at cost.
(k) Accounting for investments in associatesCouncil’s investment in the North Central Goldfields Library Corporation is accounted for by the equity method as the Council has the ability to influence rather than control the operations of the entity. The investment is initially recorded at the cost of acquisition and adjusted thereafter for post-acquisition changes in the Council’s share of the net assets of the entities. The Council’s share of the financial result of the Library Corporation is recognised in the comprehensive income statement.
(l) DepositsAmounts received as asset protection bonds, tender deposits and retention amounts controlled by Council are recognised as Trust funds until they are returned or forfeited (refer to note 25).
(m) Employee benefitsWages and SalariesLiabilities for wages and salaries, time in lieu and rostered days off are recognised and measured as the amount unpaid at balance date and include appropriate oncosts such as workers compensation and payroll costs.
Annual leaveAnnual leave entitlements are accrued on a pro rata basis in respect of services provided by employees up to balance date.
Annual leave expected to be paid within 12 months is measured at nominal value based on the amount, including appropriate oncosts, expected to be paid when settled.
Long service leaveLong service leave entitlements payable are assessed at balance date having regard to expected employee remuneration rates on settlement, employment related oncosts and other factors including accumulated years of employment, on settlement, and experience of employee departure per year of service.
All long service leave (current and non current) has been measured at the present value of the estimated future cash outflows to be made for these accrued entitlements. Commonwealth bond rates are used for discounting future cash flows.
Note 1 Significant accounting policies (cont.)

w
Mac
edon
Ran
ges
Sh
ire C
ounc
il89
2012/13
PERFORMANCE AND FINANCIAL STATEMENTS
Notes to the Financial Report
For the Year Ended 30 June 2013
Classification of employee benefitsAn employee benefit liability is classified as a current liability if the Council does not have an unconditional right to defer settlement of the liability for at least 12 months after the end of the period. This includes all annual leave and unconditional long service leave entitlements.
SuperannuationThe amount charged to the Comprehensive Operating Statement in respect of superannuation represents contributions made or due by the Council to the relevant superannuation plans in respect to the services of the Council’s staff (both past and present). Superannuation contributions are made to the plans based on the relevant rules of each plan and any relevant compulsory superannuation requirements the Council is required to comply with.
Sick LeaveNo provision is made in respect of employee entitlements for sick leave because it is non-vesting and the anticipated pattern of future sick leave to be taken indicates that accumulated non-vesting sick leave will never be taken.
(n) LeasesOperating leasesLease payments for operating leases are required by the accounting standard to be recognised on a straight line basis, rather than expensed in the years in which they are incurred.
(o) Allocation between current and non-currentIn the determination of whether an asset or liability is current or non-current, consideration is given to the time when each asset or liability is expected to be settled. The asset or liability is classified as current if it is expected to be settled within the next twelve months, being the Council’s operational cycle, or if the Council does not have an unconditional right to defer settlement of a liability for at least 12 months after the reporting date.
(p) Goods and Services Tax (GST)Revenues, expenses and assets are recognised net of the amount of GST, except in the rare event where the amount
of GST incurred is not recoverable from the Australian Tax Office. In these circumstances the GST is recognised as part of the cost of acquisition of the asset or as part of an item of the expense. Receivables and payables in the balance sheet are shown inclusive of GST.
Cash flows are presented in the cash flow statement on a gross basis, except for the GST component of investing and financing activities, which are disclosed as operating cash flows.
(q) Impairment of assetsAt each reporting date, the Council reviews the carrying value of its asset classes to determine whether there is any indication that these assets have been materially impaired. If such an indication exists, the recoverable amount of the asset, being the higher of the asset’s fair value less costs to sell and value in use, is compared to the assets carrying value. Any excess of the assets carrying value over its recoverable amount is expensed to the comprehensive income statement, unless the asset is carried at the revalued amount in which case, the impairment loss is recognised directly against the revaluation surplus in respect of the same class of asset to the extent that the impairment loss does not exceed the amount in the revaluation surplus for that same class of asset.
(r) RoundingUnless otherwise stated, amounts in the financial report have been rounded to the nearest thousand dollars.
(s) Non-current assets held for saleA non-current asset held for sale is measured at the lower of its carrying amount and fair value less costs to sell, and are not subject to depreciation. Non current assets are treated as current and classified as held for sale if their carrying amount will be recovered through a sale transaction rather than through continuing use. This condition is regarded as met only when the sale is highly probable and the asset’s sale is expected to be completed within 12 months from the date of classification.
Note 1 Significant accounting policies (cont.)
w
For the Year Ended 30 June 2013
Notes to the Financial
Report
FINANCIAL REPORT
Macedon Ranges Shire C
ouncil90
2012/13
(t) Investment propertyCouncil has a small amount of investment properties, these properties were measured initially at cost, including transaction costs. Costs incurred subsequent to initial acquisition are capitalised when it is probable that future economic benefit in excess of the originally assessed performance of the asset will flow to the Council. Subsequent to initial recognition at cost, investment property is carried at fair value, determined annually by the municipal valuer or independent valuers. Changes to fair value are recorded in the comprehensive income statement in the period that they arise. Rental income from the leasing of investment properties is recognised in the comprehensive income statement.
(u) Financial guaranteesWhere they exist, material financial guarantee contracts are recognised as a liability at the time the guarantee is issued. The liability is initially measured at fair value, and if there is material increase in the likelihood that the guarantee may have to be exercised, at the higher of the amount determined in accordance with AASB 137 Provisions, Contingent Liabilities and Contingent Assets and the amount initially recognised less cumulative amortisation, where appropriate. In the determination of fair value,
consideration is given to factors including the probability of default by the guaranteed party and the likely loss to Council in the event of default. At balance date Council did not have any material financial guarantees in place.
(v) Contingent assets and contingent liabilities and commitmentsContingent assets and contingent liabilities are not recognised in the Balance Sheet, but are disclosed by way of a note and, if quantifiable, are measured at nominal value. Contingent assets and liabilities are presented inclusive of GST receivable or payable respectively.
Commitments are not recognised in the Balance Sheet. Commitments are disclosed at their nominal value and inclusive of the GST payable.
(w) Pending Accounting StandardsThe following Australian Accounting Standards have been issued or amended and are applicable to the Council but are not yet effective.
They have not been adopted in preparation of the financial statements at reporting date.
Note 1 Significant accounting policies (cont.)

w
Mac
edon
Ran
ges
Sh
ire C
ounc
il91
2012/13
PERFORMANCE AND FINANCIAL STATEMENTS
Notes to the Financial Report
For the Year Ended 30 June 2013
Pronouncement What’s new? Impact/Action Transition Effective date
AASB 9 Financial Instruments
AASB 9 standard is one of a series of amendments that are expected to eventually completely replace AASB 139. During 2010-11, the standard will be expanded to include new rules on measurement of financial liabilities and hedge accounting. Currently the existing provisions of AASB 139 will continue to apply in these areas. AASB 9 simplifies the classifications of financial assets into those to be carried at amortised cost and those to be carried at fair value – the ‘available for sale’ and ‘held-to-maturity’ categories no longer exists. AASB 9 also simplifies requirements for embedded derivatives and removes the tainting rules associated with held-to-maturity assets. The new categories of financial assets are:
The impact is not likely to be extensive in the local government sector and unlikely to impact Macedon Ranges Shire Council. Although it will vary considerably between entities. While the rules are less complex than those of AASB 139, the option to show equity instruments at cost has been largely removed, which is likely to lead to greater volatility within the income statement. However it may also lead to an improved financial position for some entities. This will also create a requirement to measure some instruments annually that has not previously existed.
Transitional arrangements are extensive – in general retrospective restatement is required, but there are exceptions. Early-adoption of the standard before 1 January 2014 removes the requirement for restatement of comparatives
Periods beginning on or after 1 January 2015. The standard was amended in 2012 to delay the effective date by two years (previously 1 January 2013).
• Amortised cost – those assets with ‘basic’ loan features’.• Fair value through other comprehensive income - this treatment is optional for equity
instruments not held for trading (this choice is made at initial recognition and is irrevocable).• Fair Value through profit and Loss - everything that does not fall into the above two
categories.The following changes also apply:• Investments in unquoted equity instruments must be measured at fair value. However,
cost may be the appropriate measure of fair value where there is insufficient more recent information available to determine a fair value.
• There is no longer any requirement to consider whether ‘significant or prolonged’ decline in the value of financial assets has occurred. The only impairment testing will be on those assets held at amortised cost, and all impairments will be eligible for reversal.
• Similarly, all movements in the fair value of a financial asset now go to the income statement, or, for equity instruments not held for trading, other comprehensive income. There is no longer any requirement to book decrements through the income statement, and increments through equity.
AASB 10 Consolidated Financial Statements
The standard introduces a single model of control, which is used to determine whether an investee must be consolidated. The existence of control is determined based on:
• Power to direct the activities of an investee (irrespective of whether such power is exercised).
• Exposure, or rights, to variable returns from its involvement with the investee.
• The ability to use its power over the investee to affect the amount of the investor’s returns.
The definition of ‘control’ is based on various factors, and is wider than just those entities in which an investee holds greater than 50% of the voting rights. While the effects of this standard are not expected to be significant in the local government sector, there may be some increase in the number of entities required to be consolidated as subsidiaries. This change is unlikely to impact Macedon Ranges Shire Council.
Early adoption is permitted, but AASB 10, AASB 11, AASB 12, AASB 127 (revised) and AASB 128 (revised) must all be adopted simultaneously.
Periods beginning on or after 1 January 2013
Note 1 Significant accounting policies (cont.)
w
For the Year Ended 30 June 2013
Notes to the Financial
Report
FINANCIAL REPORT
Macedon Ranges Shire C
ouncil92
2012/13
Pronouncement What’s new? Impact/Action Transition Effective date
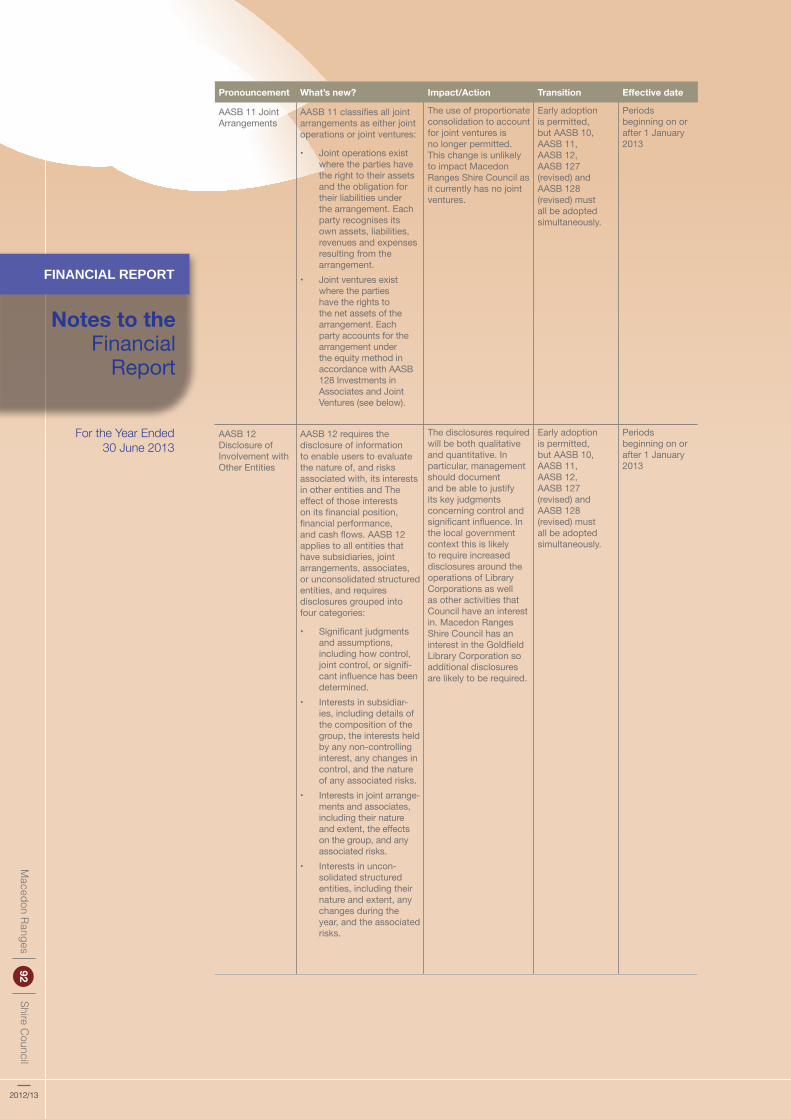
AASB 11 Joint Arrangements
AASB 11 classifies all joint arrangements as either joint operations or joint ventures:
• Joint operations exist where the parties have the right to their assets and the obligation for their liabilities under the arrangement. Each party recognises its own assets, liabilities, revenues and expenses resulting from the arrangement.
• Joint ventures exist where the parties have the rights to the net assets of the arrangement. Each party accounts for the arrangement under the equity method in accordance with AASB 128 Investments in Associates and Joint Ventures (see below).
The use of proportionate consolidation to account for joint ventures is no longer permitted. This change is unlikely to impact Macedon Ranges Shire Council as it currently has no joint ventures.
Early adoption is permitted, but AASB 10, AASB 11, AASB 12, AASB 127 (revised) and AASB 128 (revised) must all be adopted simultaneously.
Periods beginning on or after 1 January 2013
AASB 12 Disclosure of Involvement with Other Entities
AASB 12 requires the disclosure of information to enable users to evaluate the nature of, and risks associated with, its interests in other entities and The effect of those interests on its financial position, financial performance, and cash flows. AASB 12 applies to all entities that have subsidiaries, joint arrangements, associates, or unconsolidated structured entities, and requires disclosures grouped into four categories:
• Significant judgments and assumptions, including how control, joint control, or signifi-cant influence has been determined.
• Interests in subsidiar-ies, including details of the composition of the group, the interests held by any non-controlling interest, any changes in control, and the nature of any associated risks.
• Interests in joint arrange-ments and associates, including their nature and extent, the effects on the group, and any associated risks.
• Interests in uncon-solidated structured entities, including their nature and extent, any changes during the year, and the associated risks.
The disclosures required will be both qualitative and quantitative. In particular, management should document and be able to justify its key judgments concerning control and significant influence. In the local government context this is likely to require increased disclosures around the operations of Library Corporations as well as other activities that Council have an interest in. Macedon Ranges Shire Council has an interest in the Goldfield Library Corporation so additional disclosures are likely to be required.
Early adoption is permitted, but AASB 10, AASB 11, AASB 12, AASB 127 (revised) and AASB 128 (revised) must all be adopted simultaneously.
Periods beginning on or after 1 January 2013
w
Mac
edon
Ran
ges
Sh
ire C
ounc
il93
2012/13
PERFORMANCE AND FINANCIAL STATEMENTS
Notes to the Financial Report
For the Year Ended 30 June 2013
Pronouncement What’s new? Impact/Action Transition Effective date
AASB 13 Fair Value Measurement
AASB 13 replaces the existing IFRS guidance on fair value measurement and disclosure. It applies whenever another standard permits or requires the use of fair value measurements. It sets out a fair value hierarchy for such measurements:
• Level 1 – quoted prices in active markets for identical assets and liabilities, which can be accessed at the measurement date.
• Level 2 – inputs other than quoted market prices included within Level 1, which are observable for the asset or liability, either directly or indirectly.
• Level 3 – unobservable inputs for the asset or liability.
There are also extensive disclosure requirements relating to each of the three levels within the hierarchy.
The standard determines ‘how to’ rather than ‘when’ in respect of fair value measurements, and summarises the existing IFRS guidance in one place. This standard may assist those councils that have equity investments that are no longer able to be held at cost.
Early adoption is permitted.
Periods beginning on or after 1 January 2013
AASB 119 Employee Benefits, AASB 2011-10 Amendments to Australian Accounting Standards arising from AASB 119 and AASB 2011-11 Amendments to AASB 119 (September 2011) arising from Reduced Disclosure Requirements
The standards require the recognition of all re-measurements of defined benefit liabilities/assets immediately in other comprehensive income (removal of the so-called “corridor” method), the immediate recognition of all past service cost in profit or loss and the calculation of a net interest expense or income by applying the discount rate to the net defined benefit liability or asset.
Where adequate information is available, the entity will apply the new standard from 1 July 2013 when the new standard applies to Macedon Ranges Shire Council.
1 January 2013/1 July 2013

w
For the Year Ended 30 June 2013
Notes to the Financial
Report
FINANCIAL REPORT
Macedon Ranges Shire C
ouncil94
2012/13
Note 2 Rates and charges2013
$’0002012
$’000Council uses capital improved value as the basis of valuation of all properties within the municipal district. The capital improved value of a property is its estimated market value at the date of valuation.
The valuation base used to calculate general rates for 2012/13 was $9,902 million (2011/12 $8,366 million). The 2012/13 general rate in the capital improved value dollar was $0.002704 (2011/12, $0.003028).
General 22,668 21,384
Business 1,596 1,645
Agricultural 1,875 1,992
Municipal Charge 3,596 3,382
No building 3 4
Cultural and recreational land 20 21
Landfill recovery 189 186
EPA landfill levy 431 336
Garbage charge 3,803 3,491 Garbage bin service charge 438 320 Not For Profit Housing 47 41 Supplementary 426 274
Total rates and charges 35,092 33,077
The date of the latest general revaluation of land for rating purposes within the municipal district was 1 January 2012, and the valuation was first applied in the rating year commencing 1 July 2012.
The date of the previous general revaluation of land for rating purposes within the municipal district was 1 January 2010, and the valuation was applied to the rating period commencing 1 July 2010.

w
Mac
edon
Ran
ges
Sh
ire C
ounc
il95
2012/13
PERFORMANCE AND FINANCIAL STATEMENTS
Notes to the Financial Report
For the Year Ended 30 June 2013
Note 3 Statutory fees and fines2013
$’0002012
$’000Town planning and building fees 141 494
Roads and infrastructure fees 1,475 546
Animal control fees 535 507
Permits 478 442
Infringements and costs 106 42
Other statutory fees 450 163
Total statutory fees and fines 3,185 2,193
Note 4 User fees2013
$’0002012
$’000Property rentals 590 644
Gravel pit sales 323 268
Waste management 410 419
Cultural activities 99 47
Community, aquatic and leisure centres 2,381 2,430
Hanging Rock Reserve 370 348
Family and childrens services 487 394
Community development 2 16
Aged and disabled services 529 481
Saleyards 292 259
Debt recovery 129 121 Planning and building services 19 20 Other fees and charges 88 102
Total user fees 5,720 5,549

w
For the Year Ended 30 June 2013
Notes to the Financial
Report
FINANCIAL REPORT
Macedon Ranges Shire C
ouncil96
2012/13
Note 5 Grants2013
$’0002012
$’000(a) Grants were received in respect of the following:
Corporate Services
Grants commission 4,395 5,445
Assets & Operations
Roads 4,608 5,837
Infrastructure 274 1,135
Community safety 730 1,341
Other 12 112
Community Wellbeing
Aged and disability services 1,954 1,919
Family and childrens services 2,372 1,269 Community development 721 727 Recreational and cultural services 2,309 1,486
Planning & Environment
Planning and building - 14
Environmental services 104 112
Economic development 36 53
Total Grants 17,515 19,450
Summary of grantsRecurrent grants 11,414 12,586
Non-recurrent grants 6,101 6,864
Total 17,515 19,450
Recurrent grants are inclusive of Roads to Recovery and Victoria Grants Commission Road grants.Conditions on grants:
There were grants totalling $4.946million ($5.33 million in 2011/12) recognised as revenue during the current reporting year which had attached special conditions and were not expended as at the reporting date.
Included in the above grants was the following major grant which was received in the latter part of the reporting year but which relates to the 2012/13 year. 50% of the 2013/14 grant was received in advance in 2012/13 as was the case in the previous financial year.
Grants commission instalment 3,320 3,231
Total 3,320 3,231
w
Mac
edon
Ran
ges
Sh
ire C
ounc
il97
2012/13
PERFORMANCE AND FINANCIAL STATEMENTS
Notes to the Financial Report
For the Year Ended 30 June 2013
Note 6 Contributions2013
$’0002012
$’000(a) Cash
Roads and infrastructure 203 197
Recreation, culture, aquatic and leisure 377 178
Family and childrens services 19 9
Aged and disabled services 4 3
Legal recoveries - 20
Plant and park operations 70 65
Town development and streetscapes - 195
Other cash contributions 234 90
Total 906 758
(b) Non-monetary assetsLand under roads 1,420 927 Infrastructure 12,309 11,471
Total 13,729 12,398
Total contributions 14,635 13,156
Note 7 Net gain/(loss) on disposal of property, infrastructure, plant and equipment
2013 $’000
2012 $’000
Proceeds of sale 518 1,613
Written down value of assets disposed (672) (1,553)
Total (154) 60
Note 8 Other income2013
$’0002012
$’000Interest 711 941
Interest on rates 175 140
Insurance recoveries 223 301
Merchandise and material sales 164 140
Other income 413 168
Total other income 1,686 1,690

w
For the Year Ended 30 June 2013
Notes to the Financial
Report
FINANCIAL REPORT
Macedon Ranges Shire C
ouncil98
2012/13
Note 9 Employee benefits2013
$’0002012
$’000Wages and salaries 21,246 19,880
Annual leave and long service leave 1,243 1,347
Superannuation 1,748 1,764
Superannuation - additional call* - 3,822
Other oncosts 1,731 1,705
Total employee benefits 25,968 28,519
* During the prior period (2012) Council was required to make an additional contribution to Vision Super to meet our obligations in relation to members of the defined benefit plan
Note 10 Materials and Services2013
$’0002012
$’000Administration 2,038 2,103
Operations 5,534 5,275
Utilities 1,745 1,518
Contracts and consultants 9,892 10,273
Total materials and services 19,208 19,169
Note 11 Bad and doubtful debts2013
$’0002012
$’000Other debtors 35 3
Total bad and doubtful debts 35 3
Note 12 Depreciation and amortisation2013
$’0002012
$’000Property
Land
Landfill assets 173 173
Buildings
Buildings and improvements 1,463 1,502
Plant and Equipment
Plant and equipment 468 370
Furniture and equipment 447 411
Motor vehicles 19 18
w
Mac
edon
Ran
ges
Sh
ire C
ounc
il99
2012/13
PERFORMANCE AND FINANCIAL STATEMENTS
Notes to the Financial Report
For the Year Ended 30 June 2013
Note 12 Depreciation and amortisation (cont.)2013
$’0002012
$’000Infrastructure
Roads 6,648 6,315
Bridges 298 290
Footpaths, kerbs and channels 573 543
Drainage 389 384
Other infrastructure 448 416
Total depreciation and amortisation 10,926 10,422
Note 14 Other expenses2013
$’0002012
$’000Auditors’ remuneration 81 82
Councillors’ allowances 268 262
Operating lease rentals 707 593
Contributions and donations 1,358 1,304
Total other expenses 2,414 2,241
Note 15 Investment in associates2013
$’0002012
$’000Investments in associates accounted for by the equity method are:
- North Central Goldfields Regional Library Corporation1,457 1,413
Total 1,457 1,413
North Central Goldfields Regional Library CorporationBackground
The Macedon Ranges Shire Council has an equity interest in the North Central Goldfields Regional Library Corporation. The equity share in the Corporation as at 30 June 2013 was $1,457,294.
Note 13 Finance costs2013
$’0002012
$’000Interest - Borrowings 275 225
Total 275 225

w
For the Year Ended 30 June 2013
Notes to the Financial
Report
FINANCIAL REPORT
Macedon Ranges Shire C
ouncil100
2012/13
Note 15 Investment in associates (cont.)2013
$’0002012
$’000The equity holders in the Regional Library Corporation and their relevant holdings are;
Macedon Ranges Shire Council 21.25%
Greater Bendigo City Council 61.75%
Loddon Shire Council 5.60%
Mount Alexander Shire Council 11.39%
Council’s share of accumulated surplus(deficit)
Council’s share of accumulated surplus(deficit) at start of year 322 579
Adjustment arising from change to equity share 13 11
Reported surplus(deficit) for year (13) (136)
Transfers (to) from reserves (57) (132)
Council’s share of accumulated surplus(deficit) at end of year 265 322
Council’s share of reserves
Council’s share of reserves at start of year 575 434
Adjustment arising from change to equity share 23 9
Transfers (to) from reserves 57 132
Council’s share of reserves at end of year 655 575
Movement in carrying value of specific investment
Carrying value of investment at start of year 1,413 1,519
Adjustment arising from change to equity share 57 30
Share of surplus(deficit) for year (13) (136)
Carrying value of investment at end of year 1,457 1,413
(Council’s share of equity as per the un-audited 30 June 2013 financial statements of the Library Service)
Note 16 Cash and cash equivalents2013
$’0002012
$’000Cash on hand 8 8
Cash at bank 2,296 5,666
Money market call account 4,032 244
Term deposits 600 -
Total cash and cash equivalents 6,935 5,918
Councils cash and cash equivalents are subject to a number of internal and external restrictions that limit amounts available for discretionary or future use. These include:
Restricted funds
Reserve funds allocated for specific future purposes (Note 28) 3,239 2,308
Total restricted funds 3,239 2,308
Total unrestricted cash and cash equivalents 3,696 3,610
w
Mac
edon
Ran
ges
Sh
ire C
ounc
il10
1
2012/13
PERFORMANCE AND FINANCIAL STATEMENTS
Notes to the Financial Report
For the Year Ended 30 June 2013
Note 17 Trade and other receivables2013
$’0002012
$’000Current
Rates debtors 2,101 1,822
Other sundry debtors 2,567 2,571
Provision for doubtful debts - other debtors (86) (74)
Net GST receivable 1,007 1,094
Total trade and other receivables 5,589 5,413
Note 18 Other financial assets2013
$’0002012
$’000Current
Term deposits 9,290 14,855
Total current other financial assets 9,290 14,855
Non-current Shares in Lancefield Community Bank - at cost 12 12 Shares in Gisborne Community Bank - at cost 9 9
21 21
Total other financial assets 9,311 14,877
Note 19 Inventories2013
$’0002012
$’000Inventories held for distribution 5 3
Total inventories 5 3
Note 20 Non-current assets classified as held for sale2013
$’0002012
$’000Land held for sale - at fair value as at 30 June 2013 ** 1,450 -
Land held for sale - at fair value as at 30 June 2012 ** - 1,586
Total non-current asets classified as held for sale 1,450 1,586
** The land was valued by Hayley Drummond AAPI, Municipal Valuer, and is net of anticipated selling costs.
Note 21 Other current assets2013
$’0002012
$’000Prepayments 309 261
Total other current assets 309 261
w
For the Year Ended 30 June 2013
Notes to the Financial
Report
FINANCIAL REPORT
Macedon Ranges Shire C
ouncil102
2012/13
Note 22 Property, infrastructure, plant and equipment2013
$’0002012
$’000Summaryat cost 63,352 55,099Less accumulated depreciation 8,382 7,382
54,970 47,717
at fair value as at 30 June 2013 147,224 -Less accumulated depreciation 42,435 -
104,789 -
at fair value as at 30 June 2012 384,094 389,794Less accumulated depreciation 74,712 70,220Less accumulated impairment losses - 3,000
309,382 316,574
at fair value as at 30 June 2011 38,043 38,043Less accumulated depreciation 10,506 10,125
27,537 27,918
at fair value as at 30 June 2010 67,814 96,794Less accumulated depreciation 8,406 18,571
59,408 78,223
at fair value as at 30 June 2009 - 68,554Less accumulated depreciation - 26,614
- 41,940
at fair value as at 30 June 2004 3,394 3,394Less accumulated depreciation 2,597 2,358
797 1,036
Total 556,883 513,408
PropertyLandat cost 320 -at fair value as at 30 June 2012 55,718 57,353Less accumulated impairment losses - 1,603
56,038 55,750
Land under roadsat Council valuation at 30 June 2013 1,420 -at Council valuation at 30 June 2012 2,666 2,666
4,086 2,666
Landfillat cost 5,179 5,179Less accumulated depreciation 1,350 1,178
3,829 4,001Total Land 63,953 62,417
w
Mac
edon
Ran
ges
Sh
ire C
ounc
il10
3
2012/13
PERFORMANCE AND FINANCIAL STATEMENTS
Notes to the Financial Report
For the Year Ended 30 June 2013
Note 22 Property, infrastructure, plant and equipment (cont.)
2013 $’000
2012 $’000
Buildings and improvementsat cost 2,432 1,323Less accumulated depreciation 26 -
2,406 1,323
at fair value as at 30 June 2012 71,832 73,230Less accumulated depreciation 1,437 -Less accumulated impairment losses - 1,397
70,395 71,833Total Buildings 72,801 73,156
Total Property 136,754 135,573
Valuation of land (including land under roads) and buildings were undertaken by Hayley Drummond AAPI, Municipal Valuer. The valuation of buildings is at fair value based on current replacement cost less accumulated depreciation at the date of valuation. The valuation of land is at fair value, being market value based on highest and best use permitted by relevant land planning provisions.
Land under roads is valued at fair value. Fair value is based on Council valuations at 30 June 2013 and 30 June 2012 for land under roads in existence at that date and at the date acquired for subsequent acquisitions using site values adjusted for englobo (undeveloped and/or unserviced) characteristics, access rights and private interests of other parties and entitlements of infrastructure assets and services.
Plant and Equipmentat cost 7,413 6,417Less accumulated depreciation 2,273 2,091
Total Plant and Equipment 5,140 4,326
Furniture and Equipmentat cost 5,216 4,605Less accumulated depreciation 3,089 2,641
Total Furniture and Equipment 2,127 1,964
Other AssetsMotor vehiclesat cost 195 135Less accumulated depreciation 12 40
183 95
Library booksat cost 100 100Less accumulated depreciation 100 100
- -
Art worksat cost 300 300Less accumulated depreciation 7 7
293 293
Total Other Assets 475 388

w
For the Year Ended 30 June 2013
Notes to the Financial
Report
FINANCIAL REPORT
Macedon Ranges Shire C
ouncil104
2012/13
Note 22 Property, infrastructure, plant and equipment (cont.)
2013 $’000
2012 $’000
InfrastructureSealed Roadsat cost 14,461 11,008Less accumulated depreciation 414 279
14,047 10,729at fair value (1) (5) (9) (10) (11) 335,182 326,351Less accumulated depreciation 92,094 86,532
243,088 239,819
Unsealed Roadsat cost 712 2,262Less accumulated depreciation - 40
712 2,222at fair value (2) (9) (12) 49,716 40,287Less accumulated depreciation 6,397 8,584
43,319 31,703
Bridgesat cost 488 3,036Less accumulated depreciation - 49
488 2,987at fair value as at 30 June 2013 (3) 31,188 -Less accumulated depreciation 12,611 -
18,577at fair value as at 30 June 2010 (8) - 25,378Less accumulated depreciation - 10,559
- 14,819
Footpaths, Kerbs and Channelsat cost 2,499 3,808Less accumulated depreciation - 65
2,499 3,743at fair value as at 30 June 2013 (4) 51,411 -Less accumulated depreciation 13,014 -
38,397 -at fair value as at 30 June 2009 (13) - 29,877Less accumulated depreciation - 9,730
- 20,147
Drainageat cost 1,271 891Less accumulated depreciation 13 4
1,258 887at fair value as at 30 June 2011 (6) 38,043 38,043Less accumulated depreciation 10,506 10,125
27,537 27,918
w
Mac
edon
Ran
ges
Sh
ire C
ounc
il10
5
2012/13
PERFORMANCE AND FINANCIAL STATEMENTS
Notes to the Financial Report
For the Year Ended 30 June 2013
Note 22 Property, infrastructure, plant and equipment (cont.)2013
$’0002012
$’000Other Infrastructure Assetsat cost 16,582 13,841Less accumulated depreciation 1,098 888
15,484 12,953at fair value as at 30 June 2004 (14) 3,394 3,394Less accumulated depreciation 2,597 2,358
797 1,036
Total Infrastructure 406,203 368,963
[1] The revaluation of the surface category of sealed roads urban and rural was undertaken on 30 June 2013 by an external consultant and council officers.[2] The revaluation of the pavement category of unsealed roads was undertaken on 30 June 2013 by an external consultant and council officers.[3] The revaluation of bridges was undertaken on 30 June 2013 by an external consultant.[4] The revaluation of footpaths, kerbs and channels was undertaken on 30 June 2013 by an external consultant and council officers.[5] The revaluation of the pavement category of sealed roads urban and rural was undertaken on 30 June 2012 by an external consultant and council officers.[6] The revaluation of drainage was undertaken on 30 June 2011 by an external consultant.[7] The revaluation of drainage was undertaken on 30 June 2010 by council officers utilising an industry building index rate.[8] The revaluation of bridges was undertaken on 30 June 2010 by an external consultant.[9] The revaluation of the formation category of sealed roads urban and rural and unsealed roads was undertaken on 30 June 2010 by an external consultant.[10] The revaluation of the surface category of sealed roads urban and rural was undertaken on 30 June 2009 by an external consultant.[11] The revaluation of the pavement category of sealed roads urban and rural was undertaken on 30 June 2008 by an external consultant.[12] The revaluation of the pavement category of unsealed roads was undertaken on 30 June 2009 by an external consultant.[13] The revaluation of footpaths, kerbs and channels was undertaken on 30 June 2009 by an external consultant.[14] The revaluation of other infrastructure assets was undertaken on 30 June 2004 by council officers.The external consultant appointed for the above revaluations was Mr Peter Maloney, Dip.CE., M.I.E. of Maloney Asset Management Services.Works in progressBuildings at cost 3,750 -Other infrastructure at cost 2,282 2,117 Other at cost 152 77 Total Works in progress 6,184 2,194
Total property, infrastructure, plant and equipment 556,883 513,407

FINANCIAL REPORT
w
Note 22 Property, infrastructure, plant and equipment (cont.)
2013
Balance at beginning
of financial year
Acquisition of assets
Revaluation increments
(decrements)
Depreciation and
amortisation
Written down value
of disposals
Impairment losses Transfers
Balance at end of financial
year(note 28) (note 12)
$’000 $’000 $’000 $’000 $’000 $’000 $’000 $’000
Propertyland 55,750 320 - - 6 - (26) 56,038land under roads 2,666 1,420 - - - - - 4,086landfill 4,001 - - 173 - - - 3,829Total land 62,417 1,740 - 173 6 - (26) 63,953buildings and improvements 73,156 1,109 - 1,463 - - (1) 72,801
Total property 135,573 2,849 - 1,636 6 - (28) 136,754plant and equipment 4,326 1,582 - 468 300 - - 5,140furniture and equipment 1,964 534 - 447 - - 77 2,127
motor vehicles 95 194 - 19 87 - - 183artworks 293 - - - - - - 293Sub total 6,678 2,310 - 934 387 - 77 7,743
Infrastructureroads 284,473 9,051 14,289 6,648 - - - 301,166bridges 17,806 63 1,494 298 - - - 19,065footpaths, kerbs and channels 23,890 9,177 8,402 573 - - - 40,896
drainage 28,805 379 - 389 - - - 28,795other infrastructure 13,989 714 - 448 - - 2,026 16,281Total infrastructure 368,963 19,385 24,185 8,356 - - 2,026 406,203
Works in progressbuildings - 3,750 - - - - - 3,750other infrastructure 2,117 2,190 - - - - (2,025) 2,282other 77 152 - - - - (77) 152Total works in progress 2,194 6,093 - - - - (2,102) 6,184
Total property, plant and equipment, infrastructure
513,408 30,636 24,186 10,926 393 - (26) 556,883
Macedon Ranges Shire C
ouncil106
2012/13
w
(a) Impairment losses
Impairment losses are recognised in the comprehensive income statement under Other Comprehensive Income.
Note 22 Property, infrastructure, plant and equipment (cont.)
2012
Balance at beginning
of financial
year
Acquisition of assets
Revaluation increments
(decrements)
Depreciation and
amortisation
Written down
value of disposals
Impairment losses Transfers
Balance at end
of financial
year(note 28) (note 12) (a)
$’000 $’000 $’000 $’000 $’000 $’000 $’000 $’000
Propertyland 49,763 10 7,695 - - 1,603 (116) 55,750land under roads 1,739 927 - - - - - 2,666landfill 4,174 - - 173 - - - 4,001Total land 55,676 937 7,695 173 - 1,603 (116) 62,417buildings and improvements 73,959 4,438 (3,423) 1,502 - 1,397 1,081 73,156
Total property 129,635 5,375 4,273 1,676 - 3,000 965 135,573plant and equipment 3,479 1,292 - 370 75 - - 4,326furniture and equipment 1,247 643 - 411 - - 485 1,964
motor vehicles 131 - - 18 18 - - 95artworks 293 - - - - - - 293Sub total 5,150 1,935 - 799 93 - 485 6,678
Infrastructureroads 263,420 15,876 11,492 6,315 - - - 284,473bridges 17,289 807 - 290 - - - 17,806footpaths, kerbs and channels 22,675 1,758 - 543 - - - 23,890
drainage 28,663 526 - 384 - - - 28,805other infrastructure 12,369 1,676 - 416 - - 360 13,989Total infrastructure 344,416 20,643 11,492 7,948 - - 360 368,963
Works in progressbuildings 1,259 - - - - - (1,259) 0other infrastructure 686 1,792 - - - - (361) 2,117other 485 77 - - - - (485) 77Total works in progress 2,430 1,869 - - - - (2,105) 2,194
Total property, plant and equipment, infrastructure
481,631 29,822 15,765 10,423 93 3,000 (294) 513,408
Mac
edon
Ran
ges
Sh
ire C
ounc
il10
7
2012/13

w
For the Year Ended 30 June 2013
Notes to the Financial
Report
FINANCIAL REPORT
Macedon Ranges Shire C
ouncil108
2012/13
Note 23 Investment property2013
$’0002012
$’000Balance at beginning of financial year 3,363 3,331Acquisitions/(disposals) (113) 295Fair value adjustments 99 (263)
Balance at end of financial year 3,349 3,363Valuation of investment property has been determined at fair value by the Municipal Valuer Hayley Drummond AAPI.
Note 24 Trade and other payables2013
$’0002012
$’000CurrentCreditors 4,295 4,256Accrued loan interest 19 38Employee costs:
Salaries and wages 1,016 763Rostered days off 114 104Time-in-lieu 27 27
Total current trade and other payables 5,471 5,188
Non-currentAccrued Superannuation Defined Benefits Liability - 3,822
Total non-current trade and other payables - 3,822
Note 25 Other current liabilities2013
$’0002012
$’000Prepaid income 1,250 1,208Refundable deposits 2,607 2,074Trust monies 146 175
Total trust funds and deposits 4,003 3,457

w
Mac
edon
Ran
ges
Sh
ire C
ounc
il10
9
2012/13
PERFORMANCE AND FINANCIAL STATEMENTS
Notes to the Financial Report
For the Year Ended 30 June 2013
Note 26 Provisions
Employee benefits2013
Annual leave
$ ‘000
Long service leave
$ ‘000
Total$ ‘000
Balance at beginning of the financial year 1,366 3,424 4,790Additional provisions 1,361 776 2,138Amounts used (1,267) (375) (1,643)Increase/(decrease)in the discounted amount arising because of time and the effect of any change in the discount rate
- (63) (63)Balance at the end of the financial year 1,460 3,762 5,222
2012Balance at beginning of the financial year 1,282 2,995 4,277Additional provisions 1,248 562 1,810Amounts used (1,164) (310) (1,474)Increase in the discounted amount arising because of time and the effect of any change in the discount rate
- 177 177Balance at the end of the financial year 1,366 3,424 4,790
Other provisions
2013
Landfill restoration
$ ‘000
Land Sale Rebates
$ ‘000
Total$ ‘000
Balance at beginning of the financial year 3,953 400 4,353Additional provisions - 50 50Amounts used (233) (150) (383)Increase/(decrease)in the discounted amount arising because of time and the effect of any change in the discount rate
(25) - (25)Balance at the end of the financial year 3,695 300 3,994
2012Balance at beginning of the financial year 4,002 200 4,202Additional provisions - 200 200Amounts used (1,027) - (1,027)Increase in the discounted amount arising because of time and the effect of any change in the discount rate
978 - 978Balance at the end of the financial year 3,953 400 4,353
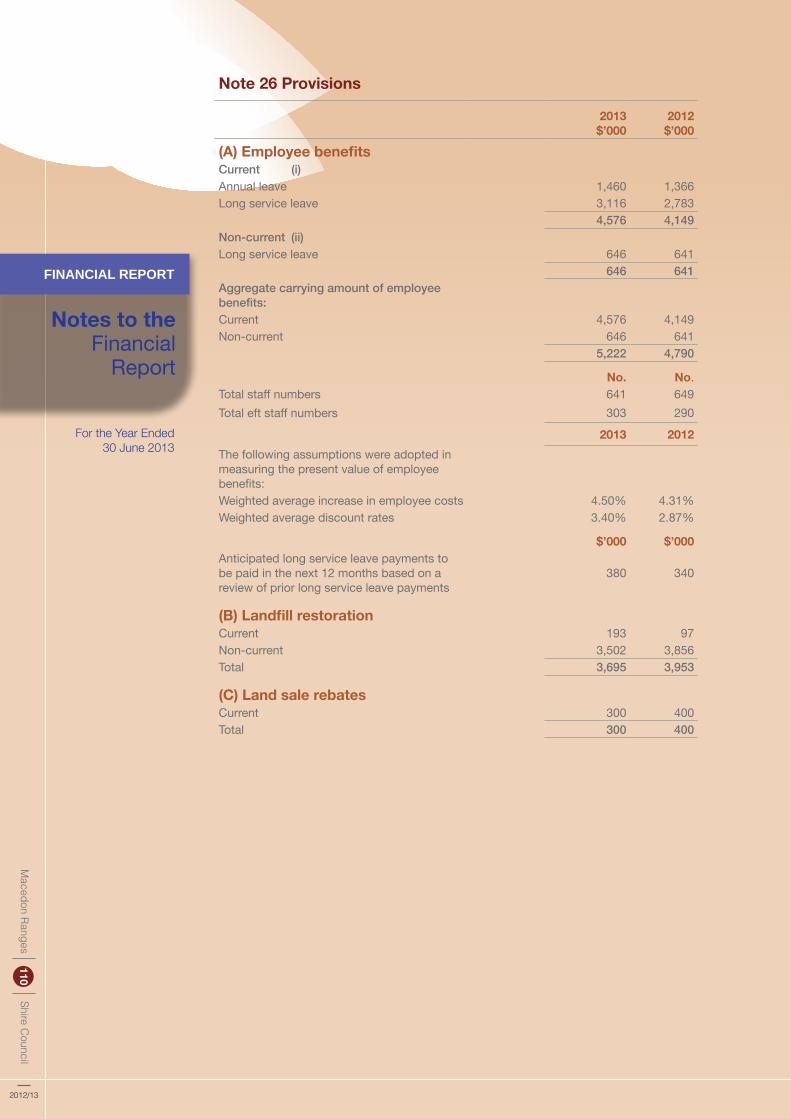
w
For the Year Ended 30 June 2013
Notes to the Financial
Report
FINANCIAL REPORT
Macedon Ranges Shire C
ouncil110
2012/13
Note 26 Provisions
2013$’000
2012$’000
(A) Employee benefitsCurrent (i)Annual leave 1,460 1,366Long service leave 3,116 2,783
4,576 4,149Non-current (ii)Long service leave 646 641
646 641Aggregate carrying amount of employee benefits:Current 4,576 4,149Non-current 646 641
5,222 4,790
No. No.Total staff numbers 641 649Total eft staff numbers 303 290
2013 2012The following assumptions were adopted in measuring the present value of employee benefits:Weighted average increase in employee costs 4.50% 4.31%Weighted average discount rates 3.40% 2.87%
$’000 $’000Anticipated long service leave payments to be paid in the next 12 months based on a review of prior long service leave payments
380 340
(B) Landfill restorationCurrent 193 97Non-current 3,502 3,856Total 3,695 3,953
(C) Land sale rebatesCurrent 300 400Total 300 400

w
Mac
edon
Ran
ges
Sh
ire C
ounc
il11
1
2012/13
PERFORMANCE AND FINANCIAL STATEMENTS
Notes to the Financial Report
For the Year Ended 30 June 2013
Note 27 Interest-bearing loans and borrowings2013
$’0002012
$’000CurrentBorrowings - secured 1,057 1,241
1,057 1,241Non-currentBorrowings - secured 2,875 3,932Total 3,932 5,173
The maturity profile for Council's borrowings is:Not later than one year 1,057 1,241Later than one year and not later than five years 1,421 2,090Later than five years 1,454 1,842
Total 3,932 5,173
Security for borrowingsThe bank loans are secured over the general rates of the Council.
FinancingUnrestricted access was available at the reporting date to the following lines of credit:Credit cards 50 50Bank loans 3,932 5,173Total facilities 3,982 5,223Used at reporting date:Bank loans 3,932 5,173
3,932 5,173Unused at reporting date:Credit cards 50 50
50 50Note 28 Reserves
Balance at beginning
of reporting period
Impairment Loss Recognised in the
Comprehensive Income Statement
Increment (decrement)
Balance at end of reporting
period
(A) Asset revaluation reserve2013
$’000 $’000 $’000 $’000
Land and buildings 64,377 - - 64,377Infrastructure 204,235 - 24,186 228,421Non-current assets classified as held for sale 29 - - 29
Artworks 250 - - 250Equity in Regional Library Corporation 149 - - 149
Total asset revaluation reserve
269,040 - 24,186 293,226
2012Land and buildings 63,104 (3,000) 4,273 64,377Infrastructure 192,743 - 11,492 204,235Non-current assets classified as held for sale - - 29 29
Artworks 250 - - 250Equity in Regional Library Corporation 149 - - 149
Total asset revaluation reserve
256,246 (3,000) 15,794 269,040
The asset revaluation reserve was established to capture the movements in asset valuations upon the periodic revaluation of Council’s assets.
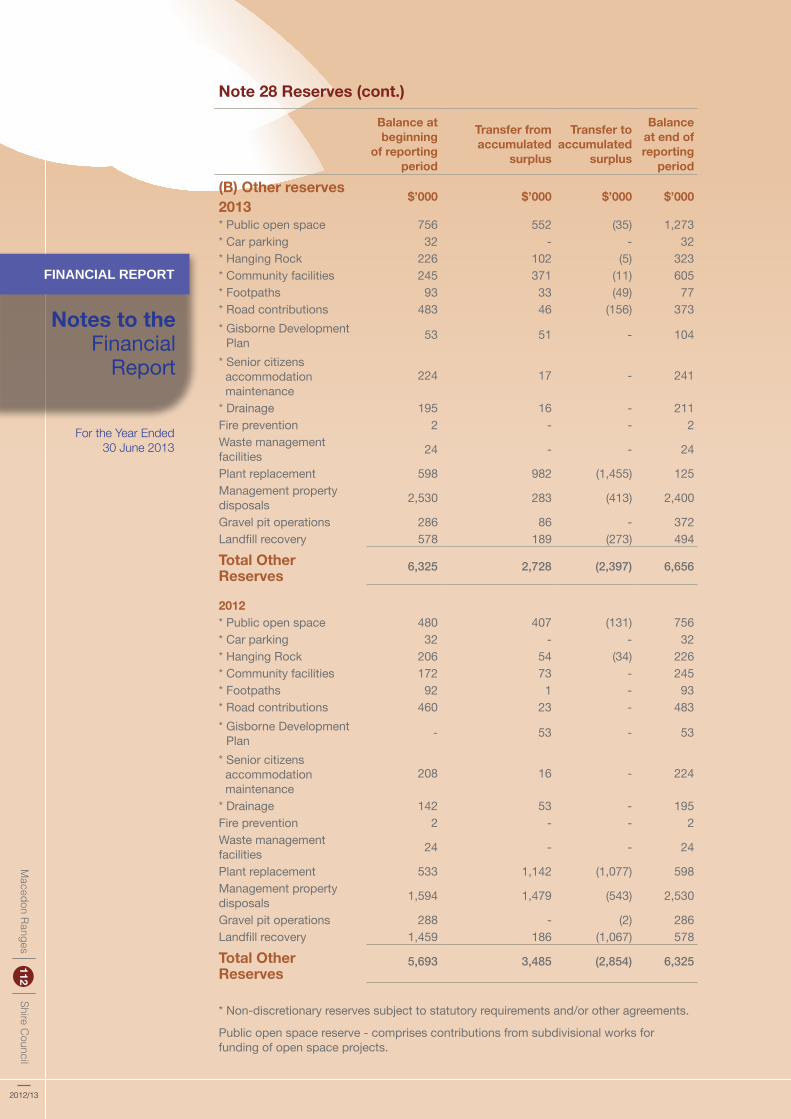
w
For the Year Ended 30 June 2013
Notes to the Financial
Report
FINANCIAL REPORT
Macedon Ranges Shire C
ouncil112
2012/13
Note 28 Reserves (cont.)
Balance at beginning
of reporting period
Transfer from accumulated
surplus
Transfer to accumulated
surplus
Balance at end of reporting
period
(B) Other reserves2013
$’000 $’000 $’000 $’000
* Public open space 756 552 (35) 1,273* Car parking 32 - - 32* Hanging Rock 226 102 (5) 323* Community facilities 245 371 (11) 605* Footpaths 93 33 (49) 77* Road contributions 483 46 (156) 373* Gisborne Development Plan 53 51 - 104
* Senior citizens accommodation maintenance
224 17 - 241
* Drainage 195 16 - 211Fire prevention 2 - - 2Waste management facilities 24 - - 24
Plant replacement 598 982 (1,455) 125Management property disposals 2,530 283 (413) 2,400
Gravel pit operations 286 86 - 372Landfill recovery 578 189 (273) 494
Total Other Reserves
6,325 2,728 (2,397) 6,656
2012* Public open space 480 407 (131) 756* Car parking 32 - - 32* Hanging Rock 206 54 (34) 226* Community facilities 172 73 - 245* Footpaths 92 1 - 93* Road contributions 460 23 - 483* Gisborne Development Plan - 53 - 53
* Senior citizens accommodation maintenance
208 16 - 224
* Drainage 142 53 - 195Fire prevention 2 - - 2Waste management facilities 24 - - 24
Plant replacement 533 1,142 (1,077) 598Management property disposals 1,594 1,479 (543) 2,530
Gravel pit operations 288 - (2) 286Landfill recovery 1,459 186 (1,067) 578
Total Other Reserves
5,693 3,485 (2,854) 6,325
* Non-discretionary reserves subject to statutory requirements and/or other agreements.
Public open space reserve - comprises contributions from subdivisional works for funding of open space projects.

w
Mac
edon
Ran
ges
Sh
ire C
ounc
il11
3
2012/13
PERFORMANCE AND FINANCIAL STATEMENTS
Notes to the Financial Report
For the Year Ended 30 June 2013
Note 28 Reserves (cont.)
Car parking reserve – comprises developer contributions for car parking projects.
Hanging Rock reserve – comprises surplus funding from Hanging Rock operations directed towards capital works.
Community facilities reserve – comprises developer contributions for community facilities projects.
Footpaths reserve – comprises developer contributions for footpath works.
Road contributions reserve – comprises developer contributions for roadworks.
Gisborne Development Plan reserve – comprises developer contributions for development projects in the outer areas of Gisborne.
Senior citizens accommodation maintenance reserve – comprises occupants’ contributions towards maintenance of accommodation units.
Drainage reserve – comprises developer contributions for drainage works.
Fire prevention reserve – comprises funding towards fire prevention works.
Waste management facilities reserve – comprises funding for development of waste management facilities.
Plant replacement reserve – comprises surplus funding from plant operations directed towards capital replacements.
Management property disposals reserve – comprises proceeds of property sales directed towards funding of capital works.
Gravel pit operations reserve – comprises surplus funding from gravel pit operations directed towards capital works.
Landfill recovery reserve – comprises funding from landfill recovery charge for landfill rehabilitation and transfer stations.
Note 29 Reconciliation of cash flows from operating activities to surplus
2013 $’000
2012 $’000
Surplus 19,022 13,250
Depreciation/amortisation 10,926 10,422Net (gain)/loss on disposal of property, infrastructure, plant and equipment 154 (60)
Share of net (profits)/losses of associates and joint ventures (45) 106Increase/(decrease) in provision for landfill liability - 978Fair value adjustments for investment property (99) 263Contributions - Non-monetary assets (13,729) (12,398)Financing activity - Interest paid 293 242
Change in assets and liabilities:(Increase)/decrease in trade and other receivables (176) 2,041(Increase)/decrease in prepayments (48) (31)Increase/(decrease) in trade and other payables (3,520) 4,231Increase/(decrease) in other current liabilities 546 618Increase/(decrease) in employee benefits 432 513Increase/(decrease) in interest payable (19) (16)
Net cash provided by/(used in) operating activities
13,738 20,159

w
For the Year Ended 30 June 2013
Notes to the Financial
Report
FINANCIAL REPORT
Macedon Ranges Shire C
ouncil114
2012/13
Note 30 Reconciliation of cash and cash equivalents2013
$’0002012
$’000Cash and cash equivalents (see note 16) 6,935 5,918
Total reconciliation of cash and cash equivalents
6,935 5,918
Note 31 Restricted assets2013
$’0002012
$’000Council has cash and cash equivalents (note16) that are subject to restrictions. As at the reporting date, Council had legislative restrictions in relation to reserve funds (non-discretionary).
Reserve funds (note 28) 3,239 2,308
Total restricted assets 3,239 2,308
Note 32 Superannuation Council makes the majority of its employer superannuation contributions in respect of its employees to the Local Authorities Superannuation Fund (the Fund). This Fund has two categories of membership, accumulation and defined benefit, each of which is funded differently. The defined benefit section provides lump sum benefits based on years of service and final average salary. The defined contribution section receives fixed contributions from the Council and the Council’s legal or constructive obligation is limited to these contributions.
Obligations for contributions to the Fund are recognised as an expense in the Comprehensive Operating Statement when they are due.
The Fund’s accumulation category, Vision Super Saver, receives both employer and employee contributions on a progressive basis. Employer contributions are normally based on a fixed percentage of employee earnings (for the year ended 30 June 2013, this was 9% required under Superannuation Guarantee Legislation). No further liability accrues to the employer as the superannuation benefits accruing to employees are represented by their share of the net assets of the Fund.
Effective from 1 July 2013, the Superannuation Guarantee contribution rate will increase to 9.25%, and will progressively increase to 12% by 2019.
Defined Benefit PlanThe Fund’s Defined Benefit Plan is a multi-employer sponsored plan. As the Plan’s assets and liabilities are pooled and are not allocated to each employer, the Actuary is unable to reliably allocate benefit liabilities, assets and costs between employers. As provided under Paragraph 32 (b) of AASB 119, Macedon Ranges Shire Council does not use defined benefit accounting for these defined benefit obligations.
Council makes employer contributions to the defined benefit category of the Fund at rates determined by the Trustee on the advice of the Fund’s Actuary. On the basis of the results of the most recent full actuarial investigation conducted by the Fund’s Actuary as at 31 December 2011, Council makes employer contributions to the Fund’s Defined Benefit category at rates determined by the Fund’s Trustee. This rate is currently 9.25% of members’ salaries (9.25% in 2011/12).
In addition, the Council reimburses the Fund to cover the excess of the benefits paid as a consequence of retrenchment above the funded resignation or retirement benefit (the funded resignation or retirement benefit is calculated by the VBI multiplied by the benefit).
The Council is also required to make additional contributions to cover the contribution tax payable on the contributions referred to above.
Employees are also required to make member contributions to the Fund. As such, assets accumulate in the Fund to meet member benefits, as defined in the Trust Deed, as they accrue.
Shortfall amountsThe Local Authorities Superannuation Fund latest actuarial investigation as at 31 December 2011 identified an unfunded liability of $406 million (excluding the contributions tax) in the
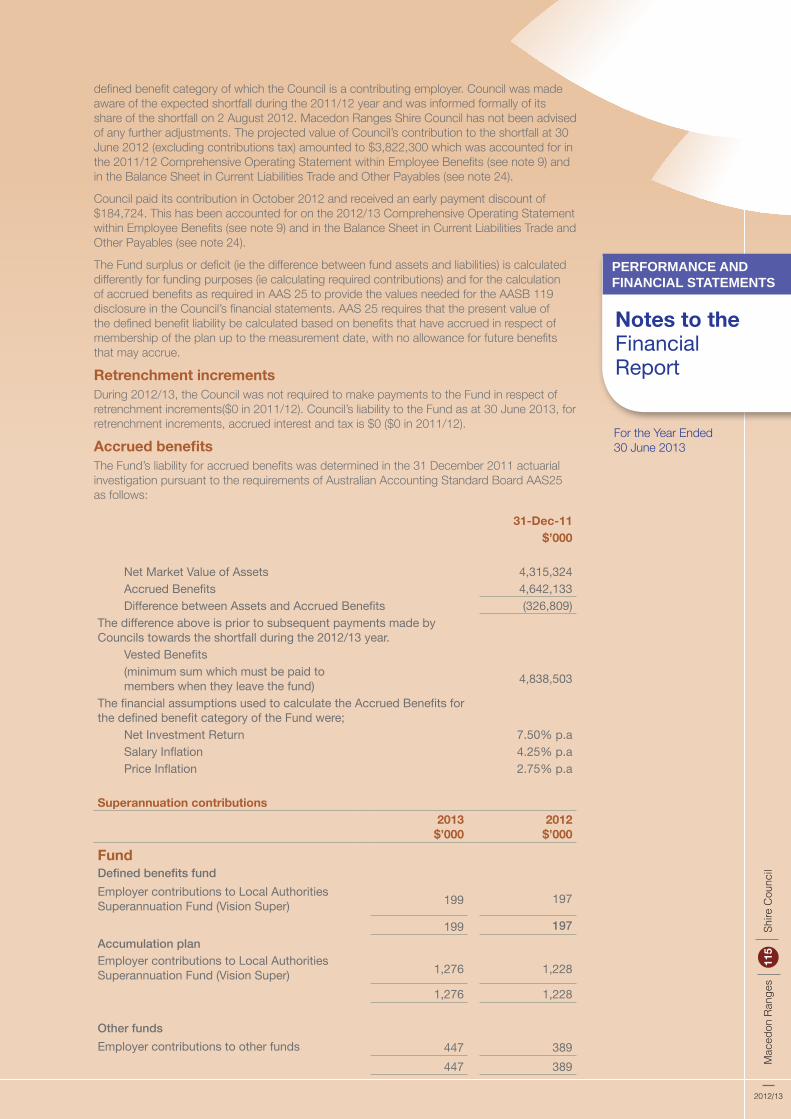
w
Mac
edon
Ran
ges
Sh
ire C
ounc
il11
5
2012/13
PERFORMANCE AND FINANCIAL STATEMENTS
Notes to the Financial Report
For the Year Ended 30 June 2013
defined benefit category of which the Council is a contributing employer. Council was made aware of the expected shortfall during the 2011/12 year and was informed formally of its share of the shortfall on 2 August 2012. Macedon Ranges Shire Council has not been advised of any further adjustments. The projected value of Council’s contribution to the shortfall at 30 June 2012 (excluding contributions tax) amounted to $3,822,300 which was accounted for in the 2011/12 Comprehensive Operating Statement within Employee Benefits (see note 9) and in the Balance Sheet in Current Liabilities Trade and Other Payables (see note 24).
Council paid its contribution in October 2012 and received an early payment discount of $184,724. This has been accounted for on the 2012/13 Comprehensive Operating Statement within Employee Benefits (see note 9) and in the Balance Sheet in Current Liabilities Trade and Other Payables (see note 24).
The Fund surplus or deficit (ie the difference between fund assets and liabilities) is calculated differently for funding purposes (ie calculating required contributions) and for the calculation of accrued benefits as required in AAS 25 to provide the values needed for the AASB 119 disclosure in the Council’s financial statements. AAS 25 requires that the present value of the defined benefit liability be calculated based on benefits that have accrued in respect of membership of the plan up to the measurement date, with no allowance for future benefits that may accrue.
Retrenchment incrementsDuring 2012/13, the Council was not required to make payments to the Fund in respect of retrenchment increments($0 in 2011/12). Council’s liability to the Fund as at 30 June 2013, for retrenchment increments, accrued interest and tax is $0 ($0 in 2011/12).
Accrued benefitsThe Fund’s liability for accrued benefits was determined in the 31 December 2011 actuarial investigation pursuant to the requirements of Australian Accounting Standard Board AAS25 as follows:
31-Dec-11$’000
Net Market Value of Assets 4,315,324Accrued Benefits 4,642,133Difference between Assets and Accrued Benefits (326,809)
The difference above is prior to subsequent payments made by Councils towards the shortfall during the 2012/13 year.
Vested Benefits(minimum sum which must be paid to members when they leave the fund) 4,838,503
The financial assumptions used to calculate the Accrued Benefits for the defined benefit category of the Fund were;
Net Investment Return 7.50% p.aSalary Inflation 4.25% p.aPrice Inflation 2.75% p.a
Superannuation contributions2013
$’0002012
$’000
FundDefined benefits fundEmployer contributions to Local Authorities Superannuation Fund (Vision Super) 199 197
199 197 Accumulation planEmployer contributions to Local Authorities Superannuation Fund (Vision Super) 1,276 1,228
1,276 1,228
Other fundsEmployer contributions to other funds 447 389
447 389
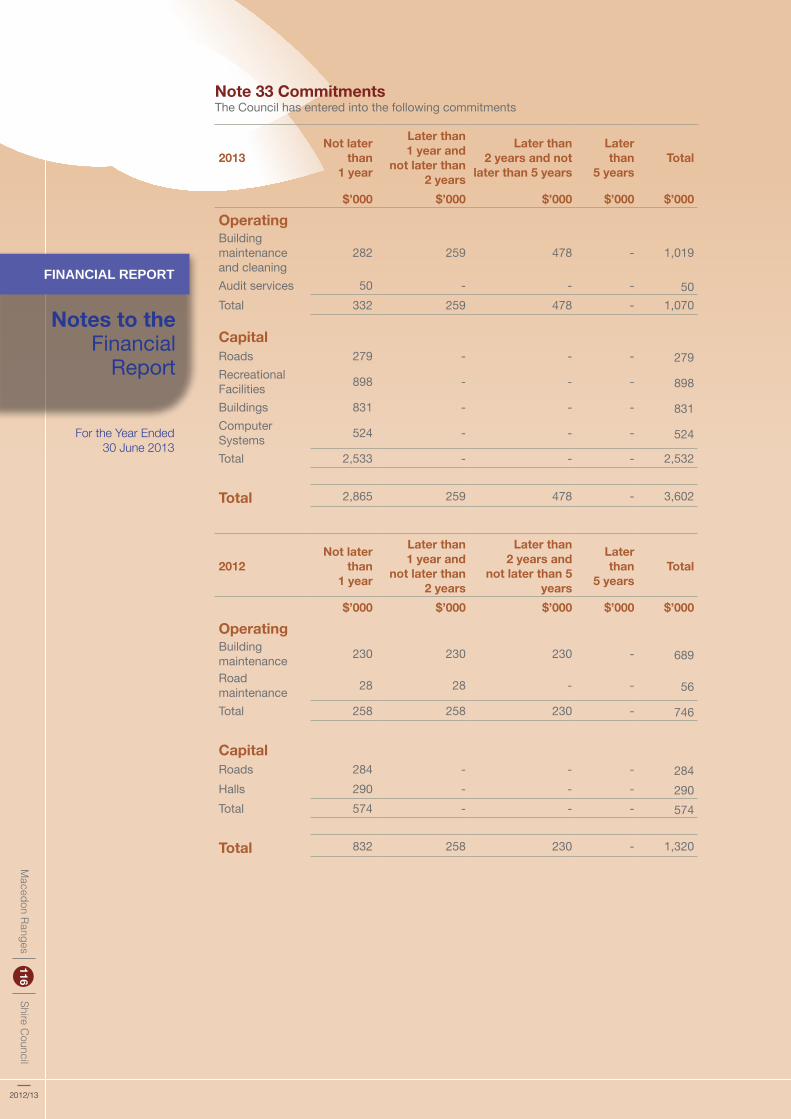
w
For the Year Ended 30 June 2013
Notes to the Financial
Report
FINANCIAL REPORT
Macedon Ranges Shire C
ouncil116
2012/13
Note 33 Commitments The Council has entered into the following commitments
2013Not later
than 1 year
Later than 1 year and
not later than 2 years
Later than 2 years and not
later than 5 years
Later than
5 yearsTotal
$’000 $’000 $’000 $’000 $’000
OperatingBuilding maintenance and cleaning
282 259 478 - 1,019
Audit services 50 - - - 50 Total 332 259 478 - 1,070
CapitalRoads 279 - - - 279 Recreational Facilities 898 - - - 898 Buildings 831 - - - 831 Computer Systems 524 - - - 524 Total 2,533 - - - 2,532
Total 2,865 259 478 - 3,602
2012Not later
than 1 year
Later than 1 year and
not later than 2 years
Later than 2 years and
not later than 5 years
Later than
5 yearsTotal
$’000 $’000 $’000 $’000 $’000
OperatingBuilding maintenance 230 230 230 - 689 Road maintenance 28 28 - - 56 Total 258 258 230 - 746
CapitalRoads 284 - - - 284 Halls 290 - - - 290 Total 574 - - - 574
Total 832 258 230 - 1,320

w
Mac
edon
Ran
ges
Sh
ire C
ounc
il11
7
2012/13
PERFORMANCE AND FINANCIAL STATEMENTS
Notes to the Financial Report
For the Year Ended 30 June 2013
Note 34 Operating Leases2013 2012$’000 $’000
(A) Operating Lease CommitmentsAt the reporting date, the Council had the following obligations under non-cancellable operating leases for the lease of equipment and land and buildings for use within Council’s activities (these obligations are not recognised as liabilities):
Not later than one year 745 650 Later than one year and not later than five years 1,422 1,299 Later than five years 1,405 1,598
3,572 3,547
(B) Operating Lease ReceivablesThe Council has entered into commercial property leases on its investment property, consisting of surplus freehold office complexes. These properties held under operating leases have remaining non-cancellable lease terms of between 1 and 15 years. All leases include a CPI based revision of the rental charge annually.
Future minimum rentals receivable under non-cancellable operating leases are as follows:
Not later than one year 56 91
Later than one year and not later than five years 140 147
Later than five years 235 257
431 495
Note 35 Contingent liabilities and contingent assets
Contingent LiabilitiesThe Council is presently involved in some minor legal matters, which are being conducted through Council’s solicitors.
As these matters are yet to be finalised, and the financial outcomes are unable to be reliably estimated, no allowance for these contingencies has been made in the financial report. However, the outcome of these matters is unlikely to have a material impact on Council’s finances.
Contingent AssetsThere were no known contingent assets at balance date.

w
For the Year Ended 30 June 2013
Notes to the Financial
Report
FINANCIAL REPORT
Macedon Ranges Shire C
ouncil118
2012/13
Note 36 Financial Instruments
(A) Accounting Policy, terms and conditions
Recognised financial instruments
Note Accounting Policy Terms and Conditions
Financial AssetsCash and cash equivalents
16 Cash on hand and at bank is valued at face value. Interest is recognised as it accrues. Investments and bills are valued at cost. Investments are held to maximise interest returns of surplus cash.
On call deposits returned interest rates of between 2.25% and 4.3% (3.0% to 5.6% in 2011/2012). The interest rates at balance date were 2.25%, 2.75%, 3.70% and 4.25% (3.0%, 3.5% and 4.3% in 2011/2012).
Funds returned fixed interest rate of between 3.8% and 6.0% (4.4% and 7.0% in 2011/2012).
Trade and other receivables Other debtors
17 Receivables are carried at face value. A provision for doubtful debts is recognised when there is objective evidence that an impairment loss has occurred. Collectability of overdue accounts is assessed on an ongoing basis.
General debtors are unsecured and interest free.
Financial Liabilities
Trade and other payables
24 Liabilities are recognised for amounts to be paid in the future for goods and services provided to Council as at balance date whether or not invoices have been received.
General Creditors are unsecured, not subject to interest charges and are normally settled within 28 days of invoice receipt.
Interest-bearing loans and borrowings
27 Loans are carried at their principal amounts, which represent the present value of future cash flows associated with servicing the debt. Interest is accrued over the period it becomes due and recognised as part of payables.
Borrowings are secured by way of mortgages over the general rates of the Council. The interest rate for individual loans is fixed for the period of the loan. Loans are repayable in equal instalments comprising principal and interest. Interest is payable in arrears. Interest rates for loans are in the range of 5.48% to 7.603% (5.48% to 7.603% in 2011/2012).
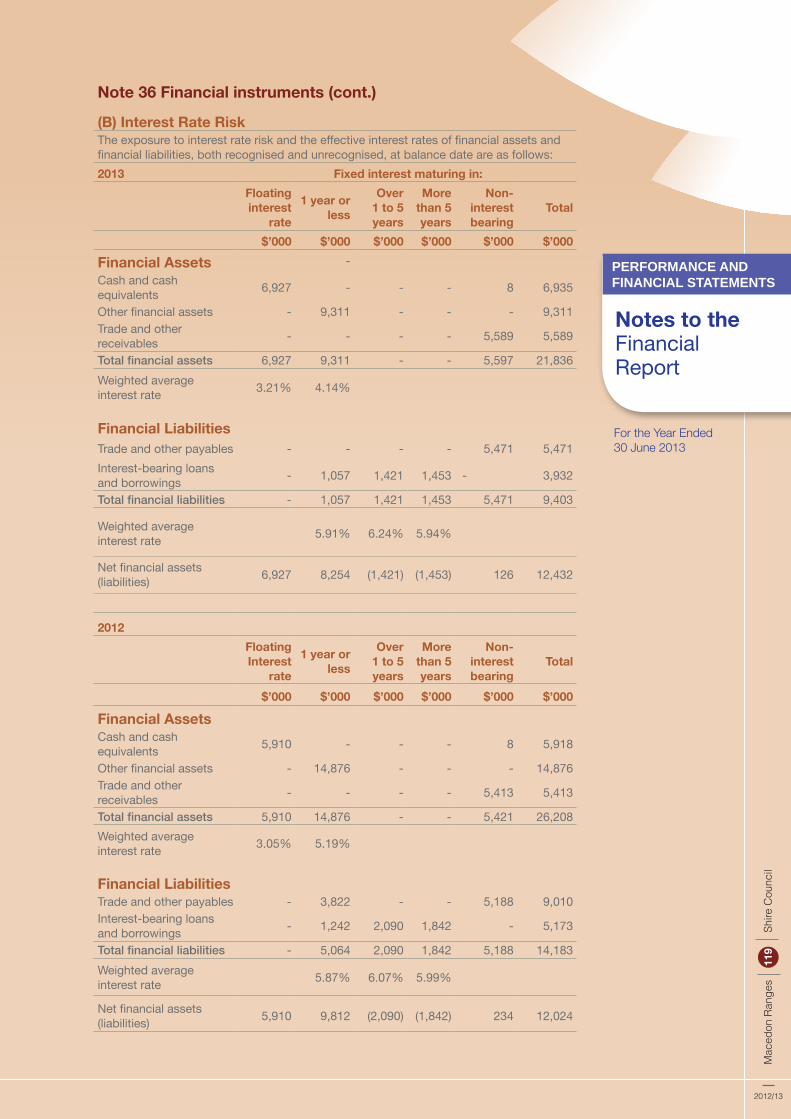
w
Mac
edon
Ran
ges
Sh
ire C
ounc
il11
9
2012/13
PERFORMANCE AND FINANCIAL STATEMENTS
Notes to the Financial Report
For the Year Ended 30 June 2013
Note 36 Financial instruments (cont.)
(B) Interest Rate RiskThe exposure to interest rate risk and the effective interest rates of financial assets and financial liabilities, both recognised and unrecognised, at balance date are as follows:2013 Fixed interest maturing in:
Floating interest
rate
1 year or less
Over 1 to 5 years
More than 5 years
Non-interest bearing
Total
$’000 $’000 $’000 $’000 $’000 $’000
Financial Assets -Cash and cash equivalents 6,927 - - - 8 6,935
Other financial assets - 9,311 - - - 9,311 Trade and other receivables - - - - 5,589 5,589
Total financial assets 6,927 9,311 - - 5,597 21,836 Weighted average interest rate 3.21% 4.14%
Financial LiabilitiesTrade and other payables - - - - 5,471 5,471 Interest-bearing loans and borrowings - 1,057 1,421 1,453 - 3,932
Total financial liabilities - 1,057 1,421 1,453 5,471 9,403
Weighted average interest rate 5.91% 6.24% 5.94%
Net financial assets (liabilities) 6,927 8,254 (1,421) (1,453) 126 12,432
2012Floating Interest
rate
1 year or less
Over 1 to 5 years
More than 5 years
Non-interest bearing
Total
$’000 $’000 $’000 $’000 $’000 $’000
Financial AssetsCash and cash equivalents 5,910 - - - 8 5,918
Other financial assets - 14,876 - - - 14,876 Trade and other receivables - - - - 5,413 5,413
Total financial assets 5,910 14,876 - - 5,421 26,208 Weighted average interest rate 3.05% 5.19%
Financial LiabilitiesTrade and other payables - 3,822 - - 5,188 9,010 Interest-bearing loans and borrowings - 1,242 2,090 1,842 - 5,173
Total financial liabilities - 5,064 2,090 1,842 5,188 14,183 Weighted average interest rate 5.87% 6.07% 5.99%
Net financial assets (liabilities) 5,910 9,812 (2,090) (1,842) 234 12,024

w
For the Year Ended 30 June 2013
Notes to the Financial
Report
FINANCIAL REPORT
Macedon Ranges Shire C
ouncil120
2012/13
Note 36 Financial Instruments (cont.)
(C) Net Fair ValuesThe aggregate net fair values of financial assets and financial liabilities, both recognised and unrecognised, at balance date are as follows:
Financial Instruments
Financial AssetsCash and cash equivalentsOther financial assetsTrade and other receivablesTotal financial assets
Financial LiabilitiesTrade and other payablesTrust funds and depositsInterest-bearing loans and borrowingsTotal financial liabilities
(D) Credit RiskThe maximum exposure to credit risk at balance date in relation to each class of recognised financial asset is represented by the carrying amount of those assets as indicated in the Balance Sheet.
(E) Risks and mitigationThe risks associated with our main financial instruments and our policies for minimising these risks are detailed below.
Market riskMarket risk is the risk that the fair value or future cash flows of our financial instruments will fluctuate because of changes in market prices. The Council’s exposures to market risk are primarily through interest rate risk with only insignificant exposure to other price risks and no exposure to foreign currency risk. Components of market risk to which we are exposed are discussed below.
Interest rate riskInterest rate risk refers to the risk that the value of a financial instrument or cash flows associated with the instrument will fluctuate due to changes in market interest rates. Interest rate risk arises from interest bearing financial assets and liabilities that we use. Non derivative interest bearing assets are predominantly short term liquid assets. Our interest rate liability risk arises primarily from long term loans and borrowings at fixed rates which exposes us to fair value interest rate risk.Our loan borrowings are sourced from major Australian banks by an inquiry process. We manage interest rate risk on our net debt portfolio by reducing risks of refinancing by managing in cash in accordance with targets and by setting prudential limits on interest repayments as a percentage of rate revenue.We manage the interest rate exposure on our debt portfolio by appropriate budgeting strategies and obtaining approval for borrowings from the Department of Planning and Community Development each year.Investment of surplus funds is made with approved financial institutions under the Local Government Act 1989. We manage interest rate risk by adopting an investment policy and process that ensures:
- conformity with State and Federal regulations and standards,
- capital protection,
- appropriate liquidity,
- diversification by credit rating and financial institution,
- monitoring of return on investment,
- comparison of returns with budget.
Total carrying amount as per Balance Sheet
Aggregate net fair value
2013 2012 2013 2012$’000 $’000 $’000 $’000
6,935 5,918 6,935 5,9189,311 14,876 9,311 14,8765,589 5,413 5,589 5,413
21,836 26,208 21,836 26,208
5,471 9,010 5,471 9,0102,753 2,249 2,753 2,2493,932 5,172 3,932 5,172
12,156 16,431 12,156 16,431

w
Mac
edon
Ran
ges
Sh
ire C
ounc
il12
1
2012/13
PERFORMANCE AND FINANCIAL STATEMENTS
Notes to the Financial Report
For the Year Ended 30 June 2013
Note 36 Financial Instruments (cont.)Maturity will be staggered to provide for interest rate variations and to minimise interest rate risk.
Credit RiskCredit risk is the risk that a contracting entity will not complete its obligations under a financial instrument and cause us to make a financial loss. We have exposure to credit risk on some financial assets included in our balance sheet. To help manage this risk: - we only invest surplus funds with financial institutions which have a recognised credit rating specified in our investment policy; and - we may require collateral where appropriate.Trade and other receivables consist of a large number of customers, spread across the consumer, business and government sectors. Credit risk associated with the Council’s financial assets is minimal because the main debtor is the Victorian Government. Apart from the Victorian Government we do not have any significant credit risk exposure to a single customer or groups of customers. Ongoing credit evaluation is performed on the financial condition of our customers and, where appropriate, an allowance for doubtful debts is raised.
Movement in Provisions for Doubtful Debts2013 2012
$’000 $’000Balance at the beginning of the year 73 170 New Provisions recognised during the year 43 37 Amounts already provided for and written off as uncollectible (22) (104)
Amounts provided for but recovered during the year (8) (30)Balance at end of year 86 73
Ageing of Trade and Other Receivables
At balance date other debtors representing financial assets were past due but not impaired. These amounts relate to a number of independent customers for whom there is no recent history of default. The ageing of the Council’s Trade & Other Receivables was:
2013 2012$’000 $’000
Current (not yet due) 2,281 2,210 Past due between 31 and 60 days 1,147 1,348 Past due between 60 and 90 days 1 50 Past due between 90 and 120 days 5 8 Past due by more than 120 days 52 1 Total Trade & Other Receivables 3,486 3,617
Notes: The aging above does not include rate debtors.
Ageing of individually impaired trade and other receivablesAt balance date, other debtors representing financial assets with a nominal value of $86k (2011-2012 $73k) were impaired. The amount of the provision raised against these debtors was $86k (2011-2012: $73k). The individually impaired debtors relate to general and sundry debtors and have been impaired as a result of their doubtful collection. Many of the long outstanding past due amounts have been lodged with Council’s debt collectors or are on payment arrangements.
The ageing of Trade and Other Receivables that have been individually determined as impaired at reporting date was:
2013 2012$’000 $’000
Current (not yet due) 2 -
Past due by up to 30 days 1 -
Past due between 31 and 150 days 11 11
Past due between 151 and 365 days 47 23 Past due by more than 1 year 27 39 Total Trade & Other Receivables 86 73
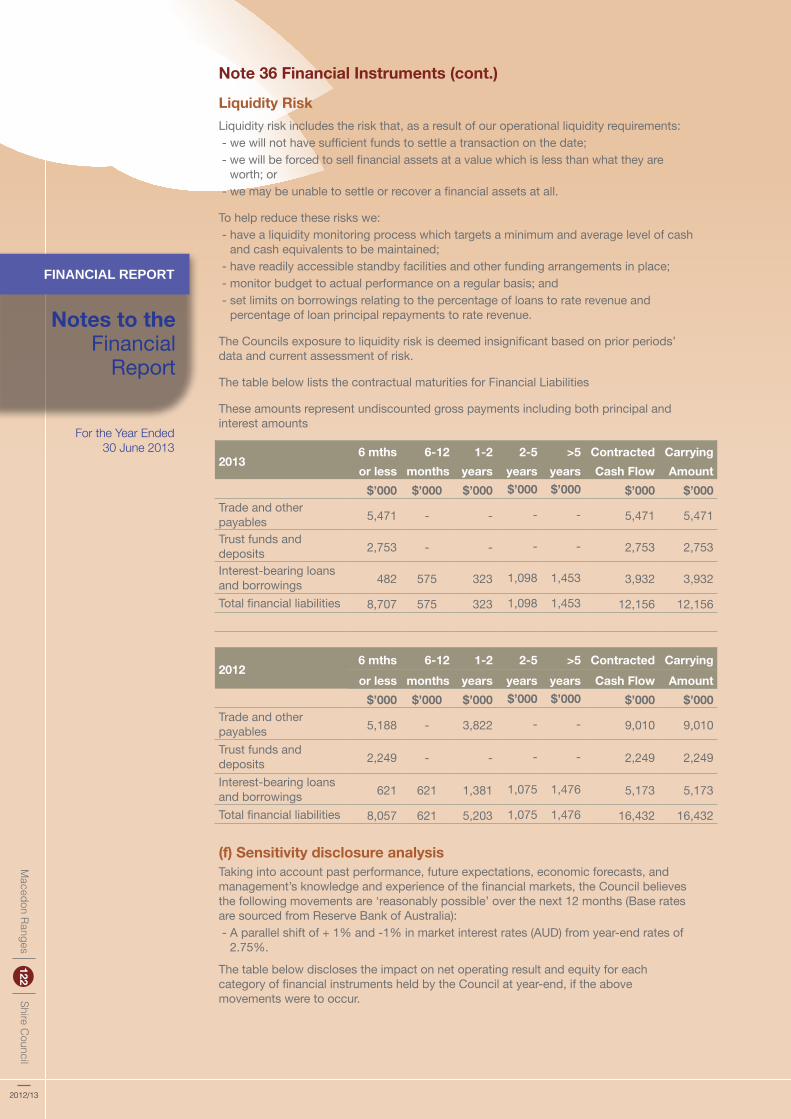
w
For the Year Ended 30 June 2013
Notes to the Financial
Report
FINANCIAL REPORT
Macedon Ranges Shire C
ouncil122
2012/13
Note 36 Financial Instruments (cont.)
Liquidity RiskLiquidity risk includes the risk that, as a result of our operational liquidity requirements: - we will not have sufficient funds to settle a transaction on the date; - we will be forced to sell financial assets at a value which is less than what they are
worth; or - we may be unable to settle or recover a financial assets at all.
To help reduce these risks we: - have a liquidity monitoring process which targets a minimum and average level of cash
and cash equivalents to be maintained; - have readily accessible standby facilities and other funding arrangements in place; - monitor budget to actual performance on a regular basis; and - set limits on borrowings relating to the percentage of loans to rate revenue and
percentage of loan principal repayments to rate revenue.
The Councils exposure to liquidity risk is deemed insignificant based on prior periods’ data and current assessment of risk.
The table below lists the contractual maturities for Financial Liabilities
These amounts represent undiscounted gross payments including both principal and interest amounts
20136 mths 6-12 1-2 2-5 >5 Contracted Carryingor less months years years years Cash Flow Amount
$’000 $’000 $’000 $’000 $’000 $’000 $’000Trade and other payables 5,471 - - - - 5,471 5,471
Trust funds and deposits 2,753 - - - - 2,753 2,753
Interest-bearing loans and borrowings 482 575 323 1,098 1,453 3,932 3,932
Total financial liabilities 8,707 575 323 1,098 1,453 12,156 12,156
20126 mths 6-12 1-2 2-5 >5 Contracted Carryingor less months years years years Cash Flow Amount
$’000 $’000 $’000 $’000 $’000 $’000 $’000Trade and other payables 5,188 - 3,822 - - 9,010 9,010
Trust funds and deposits 2,249 - - - - 2,249 2,249
Interest-bearing loans and borrowings 621 621 1,381 1,075 1,476 5,173 5,173
Total financial liabilities 8,057 621 5,203 1,075 1,476 16,432 16,432
(f) Sensitivity disclosure analysisTaking into account past performance, future expectations, economic forecasts, and management’s knowledge and experience of the financial markets, the Council believes the following movements are ‘reasonably possible’ over the next 12 months (Base rates are sourced from Reserve Bank of Australia): - A parallel shift of + 1% and -1% in market interest rates (AUD) from year-end rates of
2.75%.
The table below discloses the impact on net operating result and equity for each category of financial instruments held by the Council at year-end, if the above movements were to occur.

w
Mac
edon
Ran
ges
Sh
ire C
ounc
il12
3
2012/13
PERFORMANCE AND FINANCIAL STATEMENTS
Notes to the Financial Report
For the Year Ended 30 June 2013
Note 36 Financial Instruments (cont.) Interest rate risk -1 % +1 % -100 basis points +100 basis points Profit Equity Profit Equity2013 $’000 $’000 $’000 $’000 $’000FINANCIAL ASSETS: Cash and cash equivalents 6,935 (69) (69) 69 69Other financial assets 9,311 (93) (93) 93 93FINANCIAL LIABILITIES: Interest-bearing loans and borrowings 3,932 39 39 (39) (39)
Note 37 Auditors’ Remuneration 2013 2012
$’000 $’000Audit fee to conduct external audit - Victorian Auditor-General 31 29Internal audit fees - Crowe Horwath 50 53
81 82
Note 38 Adjustment to ComparativesAdjustments to comparatives have in previous years occurred following a revaluation of infrastructure assets. There are no adjustments required to 2011/12 comparatives in respect to revaluations of infrastructure assets undertaken in the 2012/13 year.
Note 39 Events Occurring after Balance Date No matters have occurred after balance date that require disclosure in the financial report.
Note 40 Related party transactions
(i) Responsible PersonsNames of persons holding the position of a Responsible Person at the Council at any time during the year are:CouncillorsCr Henry McLaughlin 1/07/2012 - 30/06/2013 (Mayor 1/07/2012 - 27/10/2013)Cr Roger Jukes 1/07/2012 - 30/06/2013 (Mayor 14/11/2012 - 30/06/2013)Cr Helen Relph 1/07/2012 - 27/10/2013Cr Henryka Benson 1/07/2012 - 27/10/2013Cr Joan Donovan 1/07/2012 - 27/10/2013Cr Joe Morabito 1/07/2012 - 30/06/2013Cr John Letchford 1/07/2012 - 30/06/2013 Cr Neil Manning 1/07/2012 - 27/10/2013
Cr Rob Guthrie 1/07/2012 - 27/10/2013Cr Graham Hackett 31/10/2012 - 30/06/2013Cr Jennifer Anderson 31/10/2012 - 30/06/2013Cr John Connor 31/10/2012 - 30/06/2013Cr Russell Mowatt 31/10/2012 - 30/06/2013Cr Sally Piper 31/10/2012 - 30/06/2013
Note - the commencement date for new Councillors elected during 2012/13 is taken to be the date that they were sworn in.
Chief Executive OfficerPeter Johnston 1/07/2012 - 30/06/2013
2012 $’000 $’000 $’000 $’000 $’000FINANCIAL ASSETS: Cash and cash equivalents 5,918 (59) (59) 59 59Other financial assets 14,876 (149) (149) 149 149FINANCIAL LIABILITIES: Interest-bearing loans and borrowings 5,172 52 52 (52) (52)
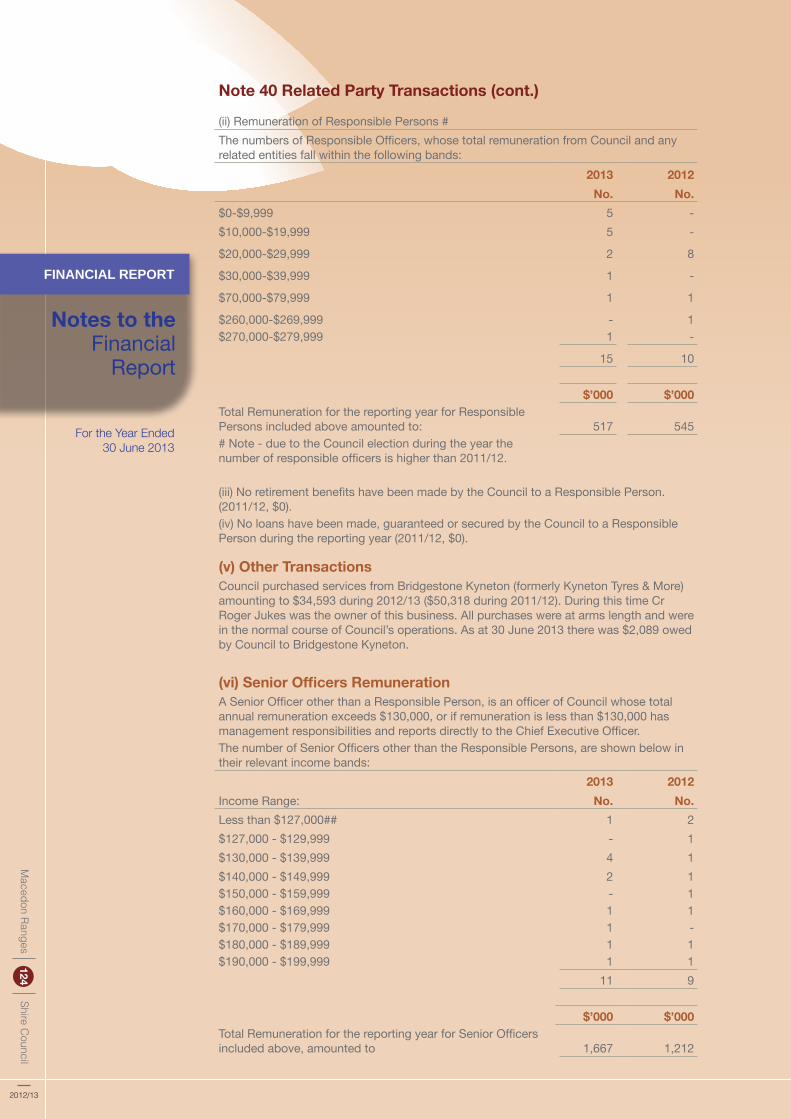
w
For the Year Ended 30 June 2013
Notes to the Financial
Report
FINANCIAL REPORT
Macedon Ranges Shire C
ouncil124
2012/13
Note 40 Related Party Transactions (cont.)
(ii) Remuneration of Responsible Persons #The numbers of Responsible Officers, whose total remuneration from Council and any related entities fall within the following bands:
2013 2012No. No.
$0-$9,999 5 - $10,000-$19,999 5 -
$20,000-$29,999 2 8
$30,000-$39,999 1 -
$70,000-$79,999 1 1
$260,000-$269,999 - 1 $270,000-$279,999 1 -
15 10
$’000 $’000Total Remuneration for the reporting year for Responsible Persons included above amounted to: 517 545# Note - due to the Council election during the year the number of responsible officers is higher than 2011/12.
(iii) No retirement benefits have been made by the Council to a Responsible Person. (2011/12, $0).(iv) No loans have been made, guaranteed or secured by the Council to a Responsible Person during the reporting year (2011/12, $0).
(v) Other TransactionsCouncil purchased services from Bridgestone Kyneton (formerly Kyneton Tyres & More) amounting to $34,593 during 2012/13 ($50,318 during 2011/12). During this time Cr Roger Jukes was the owner of this business. All purchases were at arms length and were in the normal course of Council’s operations. As at 30 June 2013 there was $2,089 owed by Council to Bridgestone Kyneton.
(vi) Senior Officers RemunerationA Senior Officer other than a Responsible Person, is an officer of Council whose total annual remuneration exceeds $130,000, or if remuneration is less than $130,000 has management responsibilities and reports directly to the Chief Executive Officer. The number of Senior Officers other than the Responsible Persons, are shown below in their relevant income bands:
2013 2012Income Range: No. No.Less than $127,000## 1 2$127,000 - $129,999 - 1$130,000 - $139,999 4 1 $140,000 - $149,999 2 1 $150,000 - $159,999 - 1 $160,000 - $169,999 1 1 $170,000 - $179,999 1 - $180,000 - $189,999 1 1 $190,000 - $199,999 1 1
11 9
$’000 $’000 Total Remuneration for the reporting year for Senior Officers included above, amounted to 1,667 1,212
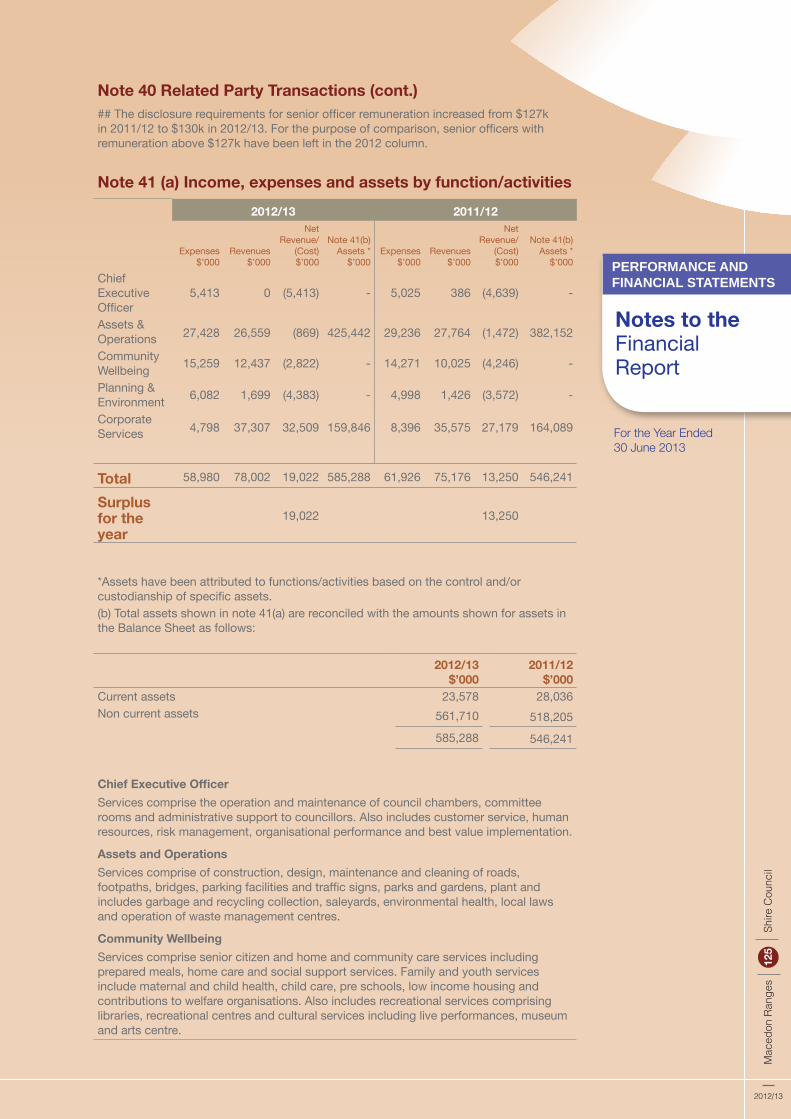
w
Mac
edon
Ran
ges
Sh
ire C
ounc
il12
5
2012/13
PERFORMANCE AND FINANCIAL STATEMENTS
Notes to the Financial Report
For the Year Ended 30 June 2013
Note 41 (a) Income, expenses and assets by function/activities2012/13 2011/12
Expenses $’000
Revenues $’000
Net Revenue/
(Cost) $’000
Note 41(b) Assets *
$’000Expenses
$’000Revenues
$’000
Net Revenue/
(Cost) $’000
Note 41(b) Assets *
$’000
Chief Executive Officer
5,413 0 (5,413) - 5,025 386 (4,639) -
Assets & Operations 27,428 26,559 (869) 425,442 29,236 27,764 (1,472) 382,152
Community Wellbeing 15,259 12,437 (2,822) - 14,271 10,025 (4,246) -
Planning & Environment 6,082 1,699 (4,383) - 4,998 1,426 (3,572) -
Corporate Services 4,798 37,307 32,509 159,846 8,396 35,575 27,179 164,089
Total 58,980 78,002 19,022 585,288 61,926 75,176 13,250 546,241
Surplus for the year
19,022 13,250
2012/13 $’000
2011/12 $’000
Current assets 23,578 28,036Non current assets 561,710 518,205
585,288 546,241
*Assets have been attributed to functions/activities based on the control and/or custodianship of specific assets.(b) Total assets shown in note 41(a) are reconciled with the amounts shown for assets in the Balance Sheet as follows:
Chief Executive OfficerServices comprise the operation and maintenance of council chambers, committee rooms and administrative support to councillors. Also includes customer service, human resources, risk management, organisational performance and best value implementation.
Assets and OperationsServices comprise of construction, design, maintenance and cleaning of roads, footpaths, bridges, parking facilities and traffic signs, parks and gardens, plant and includes garbage and recycling collection, saleyards, environmental health, local laws and operation of waste management centres.
Community WellbeingServices comprise senior citizen and home and community care services including prepared meals, home care and social support services. Family and youth services include maternal and child health, child care, pre schools, low income housing and contributions to welfare organisations. Also includes recreational services comprising libraries, recreational centres and cultural services including live performances, museum and arts centre.
Note 40 Related Party Transactions (cont.)## The disclosure requirements for senior officer remuneration increased from $127k in 2011/12 to $130k in 2012/13. For the purpose of comparison, senior officers with remuneration above $127k have been left in the 2012 column.

w
For the Year Ended 30 June 2013
Notes to the Financial
Report
FINANCIAL REPORT
Macedon Ranges Shire C
ouncil126
2012/13
Planning and EnvironmentServices comprise town planning and strategic planning services, building approval and inspection services and environmental services. Also includes economic development, tourism and promotion services.Corporate ServicesServices comprise administration of Council's finances, information and communication services, revenue collection, records management, valuations, rates, fleet management and management of council properties.
Note 41 (a) Income, expenses and assets by function/activities (Cont.)
Note 42 Financial ratios (Performance indicators)2013 $’000
2013 (%)
2012 $’000
2012 (%)
2011 $’000
2011 (%)
(a) Debt servicing ratio (to identify the capacity of Council to service its outstanding debt)Debt servicing costs 275 = 0.35%
225= 0.30%
296= 0.49%
Total revenue 78,002 75,176 59,975
Debt servicing costs refer to the payment of interest on loan borrowings, finance lease, and bank overdraft. The ratio expresses the amount of interest paid as a percentage of Council's total revenue.
(b) Debt commitment ratio (to identify Council’s debt redemption strategy)
Debt servicing & redemption costs 1,517 = 4.32% 1,497 = 4.53% 1,498 = 4.91%Rate revenue 35,092 33,077 30,530
The ratio expresses the percentage of rate revenue utilised to pay interest and redeem debt principal.
(c) Revenue ratio (to identify Council’s dependence on non-rate income)Rate revenue 35,092 = 44.99%
33,077= 44.00%
30,530= 50.90%
Total revenue 78,002 75,176 59,975
The level of Council’s reliance on rate revenue is determined by assessing rate revenue as a proportion of the total revenue of Council.
(d) Debt exposure ratio (to identify Council’s exposure to debt)Total indebtedness 19,383 = 14.64%
26,783= 20.35%
17,466= 13.54%
Total realisable assets 132,440 131,610 128,969
Any liability represented by a restricted asset (note 31) is excluded from total indebtedness.
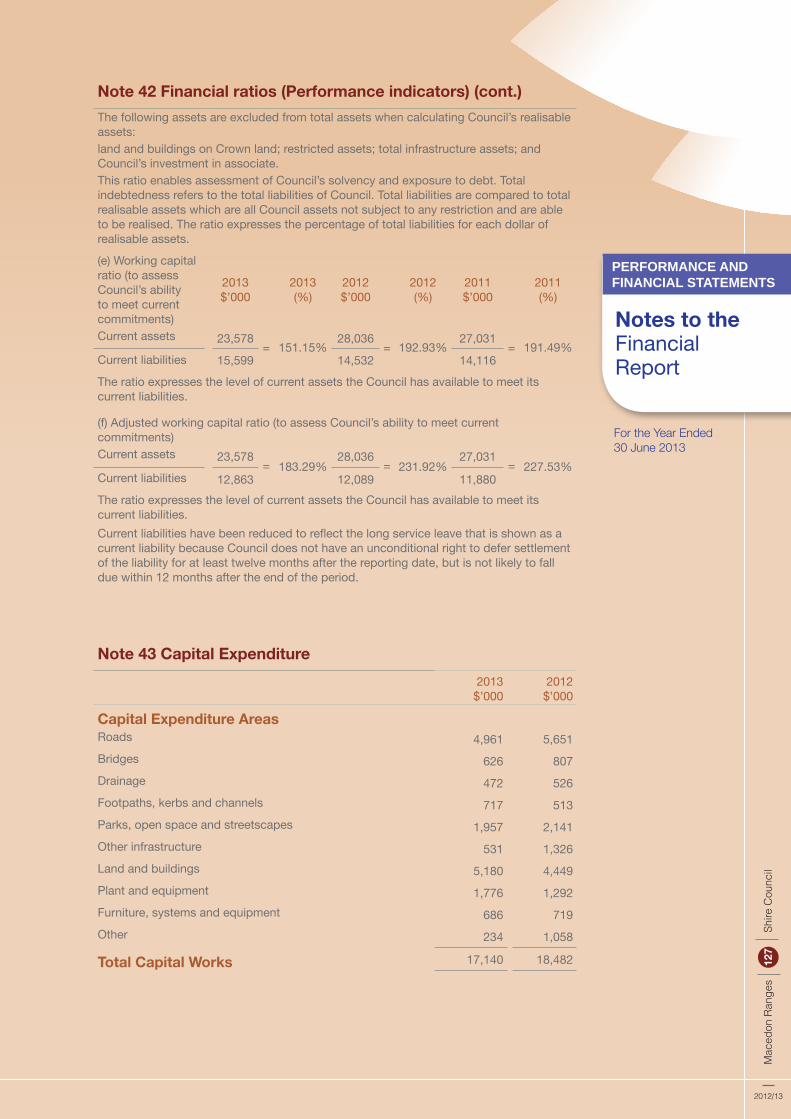
w
Mac
edon
Ran
ges
Sh
ire C
ounc
il12
7
2012/13
PERFORMANCE AND FINANCIAL STATEMENTS
Notes to the Financial Report
For the Year Ended 30 June 2013
Note 42 Financial ratios (Performance indicators) (cont.)The following assets are excluded from total assets when calculating Council’s realisable assets:land and buildings on Crown land; restricted assets; total infrastructure assets; and Council’s investment in associate.This ratio enables assessment of Council’s solvency and exposure to debt. Total indebtedness refers to the total liabilities of Council. Total liabilities are compared to total realisable assets which are all Council assets not subject to any restriction and are able to be realised. The ratio expresses the percentage of total liabilities for each dollar of realisable assets.
(e) Working capital ratio (to assess Council’s ability to meet current commitments)
2013 $’000
2013 (%)
2012 $’000
2012 (%)
2011 $’000
2011 (%)
Current assets 23,578= 151.15%
28,036= 192.93%
27,031= 191.49%
Current liabilities 15,599 14,532 14,116The ratio expresses the level of current assets the Council has available to meet its current liabilities.
(f) Adjusted working capital ratio (to assess Council’s ability to meet current commitments)Current assets 23,578
= 183.29%28,036
= 231.92%27,031
= 227.53%Current liabilities 12,863 12,089 11,880The ratio expresses the level of current assets the Council has available to meet its current liabilities.Current liabilities have been reduced to reflect the long service leave that is shown as a current liability because Council does not have an unconditional right to defer settlement of the liability for at least twelve months after the reporting date, but is not likely to fall due within 12 months after the end of the period.
Note 43 Capital Expenditure2013
$’0002012
$’000
Capital Expenditure AreasRoads 4,961 5,651 Bridges 626 807 Drainage 472 526 Footpaths, kerbs and channels 717 513 Parks, open space and streetscapes 1,957 2,141 Other infrastructure 531 1,326 Land and buildings 5,180 4,449 Plant and equipment 1,776 1,292 Furniture, systems and equipment 686 719 Other 234 1,058
Total Capital Works 17,140 18,482
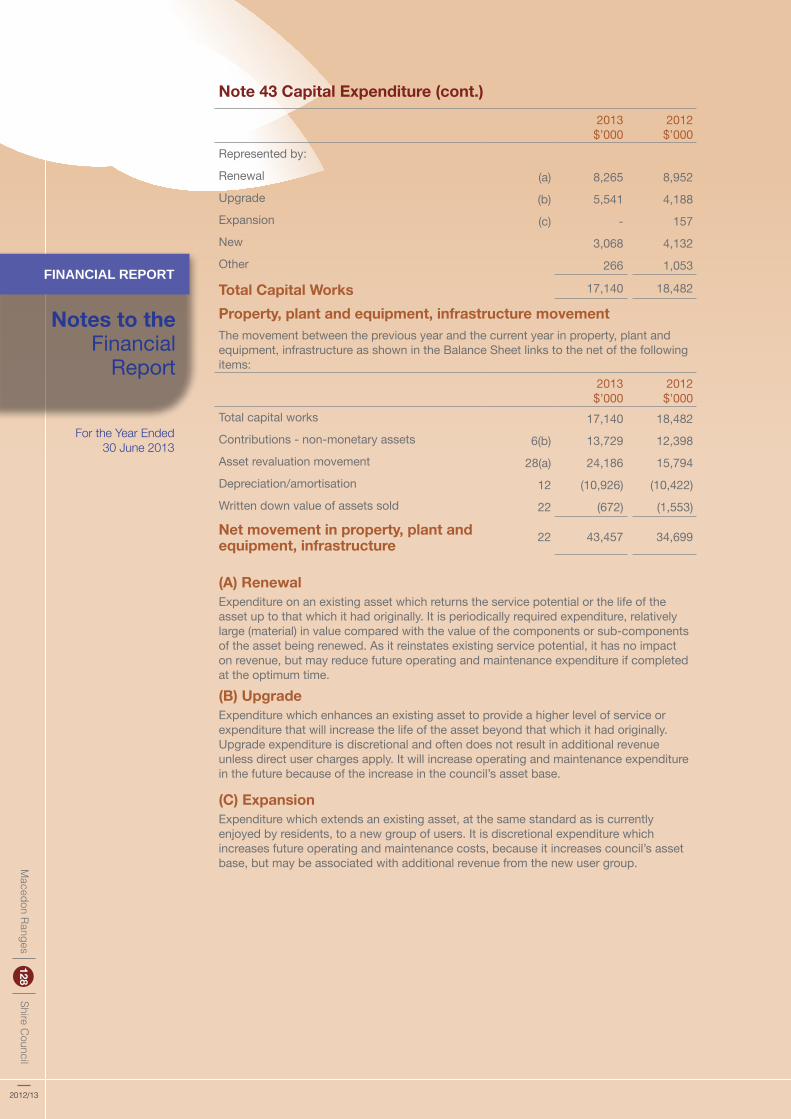
w
For the Year Ended 30 June 2013
Notes to the Financial
Report
FINANCIAL REPORT
Macedon Ranges Shire C
ouncil128
2012/13
Note 43 Capital Expenditure (cont.)2013
$’0002012
$’000Represented by:
Renewal (a) 8,265 8,952 Upgrade (b) 5,541 4,188 Expansion (c) - 157 New 3,068 4,132 Other 266 1,053
Total Capital Works 17,140 18,482
Property, plant and equipment, infrastructure movement The movement between the previous year and the current year in property, plant and equipment, infrastructure as shown in the Balance Sheet links to the net of the following items:
2013 $’000
2012 $’000
Total capital works 17,140 18,482 Contributions - non-monetary assets 6(b) 13,729 12,398 Asset revaluation movement 28(a) 24,186 15,794 Depreciation/amortisation 12 (10,926) (10,422)Written down value of assets sold 22 (672) (1,553)
Net movement in property, plant and equipment, infrastructure 22 43,457 34,699
(A) Renewal Expenditure on an existing asset which returns the service potential or the life of the asset up to that which it had originally. It is periodically required expenditure, relatively large (material) in value compared with the value of the components or sub-components of the asset being renewed. As it reinstates existing service potential, it has no impact on revenue, but may reduce future operating and maintenance expenditure if completed at the optimum time.
(B) UpgradeExpenditure which enhances an existing asset to provide a higher level of service or expenditure that will increase the life of the asset beyond that which it had originally. Upgrade expenditure is discretional and often does not result in additional revenue unless direct user charges apply. It will increase operating and maintenance expenditure in the future because of the increase in the council’s asset base.
(C) ExpansionExpenditure which extends an existing asset, at the same standard as is currently enjoyed by residents, to a new group of users. It is discretional expenditure which increases future operating and maintenance costs, because it increases council’s asset base, but may be associated with additional revenue from the new user group.

w
Mac
edon
Ran
ges
Sh
ire C
ounc
il12
9
2012/13
PERFORMANCE AND FINANCIAL STATEMENTS
Notes to the Financial Report
For the Year Ended 30 June 2013
w
For the Year Ended 30 June 2013
FINANCIAL REPORT
Macedon Ranges Shire C
ouncil130
2012/13
1. Basis of preparation of Standard StatementsCouncil is required to prepare and include audited Standard Statements within its Annual Report. Four Statements are required - a Standard Statement of Financial Performance, Standard Statement of Financial Position, Standard Statement of Cash Flows, and a Standard Statement of Capital Works, together with explanatory notes.
These statements and supporting notes from a special purpose financial report prepared to meet the requirements of the Local Government Act 1989 and Local Government (Finance and Reporting) Regulations 2004.
The Standard Statements have been prepared on accounting bases consistent with those used for General Purpose Financial Statements and the Budget. The result reported in these statements are consistent with those reported in the General Purpose Financial Statements.
The Standard Statements are not a substitute for the General Purpose Financial Statements, which are included on pages 66 to 97 of the Annual Report. They have not been prepared in accordance with all Australian Accounting Standards or other authoritative professional pronouncements.
The Standard Statements compare council’s financial plan, expressed through its budget, with actual performance. The Local Government Act 1989 requires explanation of any material variances. The Council has adopted a materiality threshold of ten per cent. Explanations have not been provided for variations below the materiality threshold unless the variance is considered to be material because of its nature.
The budget figures included in the Statements are those adopted by Council on 13 June 2012. The budget was based on assumptions that were relevant at the time of adoption of the budget. The Council set guidelines and parameters for revenue and expense targets in this budget in order to meet council’s business plan and financial performance targets for both the short and long term.
Detailed information on the actual financial results are contained in the General Purpose Financial Statements on pages 80 to 129. The detailed budget can be obtained by contacting council or through the council’s website. The Standard Statements must be read with reference to these documents.
Notes to the Standard
Statements
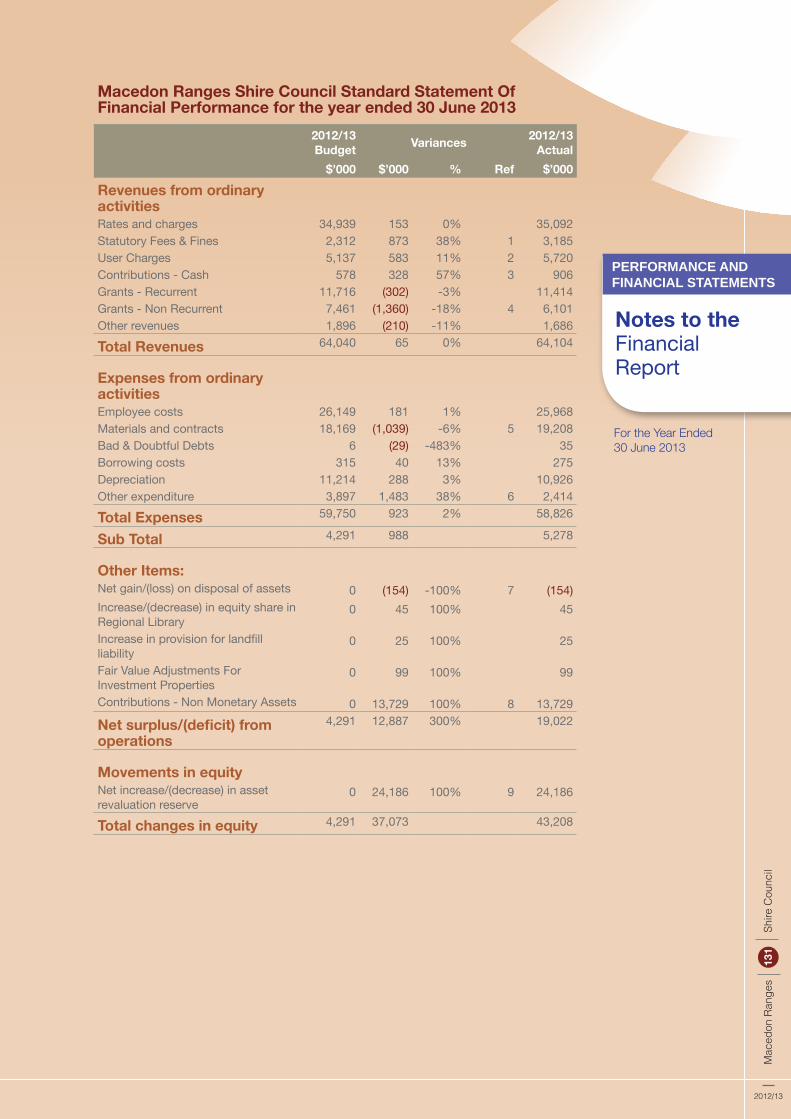
w
Mac
edon
Ran
ges
Sh
ire C
ounc
il13
1
2012/13
PERFORMANCE AND FINANCIAL STATEMENTS
Notes to the Financial Report
For the Year Ended 30 June 2013
Macedon Ranges Shire Council Standard Statement Of Financial Performance for the year ended 30 June 2013 2012/13
Budget Variances 2012/13 Actual
$’000 $’000 % Ref $’000
Revenues from ordinary activities
Rates and charges 34,939 153 0% 35,092Statutory Fees & Fines 2,312 873 38% 1 3,185User Charges 5,137 583 11% 2 5,720Contributions - Cash 578 328 57% 3 906Grants - Recurrent 11,716 (302) -3% 11,414Grants - Non Recurrent 7,461 (1,360) -18% 4 6,101Other revenues 1,896 (210) -11% 1,686
Total Revenues 64,040 65 0% 64,104
Expenses from ordinary activities
Employee costs 26,149 181 1% 25,968Materials and contracts 18,169 (1,039) -6% 5 19,208Bad & Doubtful Debts 6 (29) -483% 35Borrowing costs 315 40 13% 275Depreciation 11,214 288 3% 10,926Other expenditure 3,897 1,483 38% 6 2,414
Total Expenses 59,750 923 2% 58,826
Sub Total 4,291 988 5,278
Other Items:
Net gain/(loss) on disposal of assets 0 (154) -100% 7 (154)Increase/(decrease) in equity share in Regional Library
0 45 100% 45
Increase in provision for landfill liability
0 25 100% 25
Fair Value Adjustments For Investment Properties
0 99 100% 99
Contributions - Non Monetary Assets 0 13,729 100% 8 13,729
Net surplus/(deficit) from operations
4,291 12,887 300% 19,022
Movements in equity
Net increase/(decrease) in asset revaluation reserve
0 24,186 100% 9 24,186
Total changes in equity 4,291 37,073 43,208
w
For the Year Ended 30 June 2013
Notes to the Financial
Report
FINANCIAL REPORT
Macedon Ranges Shire C
ouncil132
2012/13
Comments in relation to key budget variances*: 1. Statutory fees & finesThe favourable budget variance is mainly due to higher than expected statutory planning contributions ($0.772m favourable to budget). Planning contributions are generally received from developers as part of a subdivision. This income will be used in future years to assist in funding infrastructure requirements.
2. User Charges User charges were above budget in several areas including gravel pit sales ($0.207k), leisure centres ($0.11m), Hanging Rock ($0.098m) and aquatic facilities ($0.074m).
3. Contributions - CashThis income arises from contributions received from Community groups, clubs and other groups towards Council projects. The income is higher than expected due to unbudgeted contributions received from a bordering Council towards a road project and a contribution to the Romsey Sports Precinct project.
4. Non Recurrent GrantsNon recurrent grants are generally one off capital grants to fund specific projects. The main reason for the budget variance is that grants received for the Romsey Sport Field project were $2m lower than expected. This is a timing issue and the grant will now be received in 2013/14. Partly offsetting this variance was a higher than expected level of grant funding received for blackspot road works
5. Materials & Contracts Expenditure on materials and contracts was higher than expected expenditure across a range of areas including waste management ($0.30m), road maintenance costs ($0.14m), building department contractors to backfill staff vacancies ($0.16m), strategic planning consulting works carried over from 2011/12 ($0.1m) and leisure facility costs ($0.08m). In some cases these additional costs were offset by either higher income or lower salary expenditure.
6. Other expenditure The main reason for the budget variance is that budget included a project contribution towards the Gisborne Indoor Stadium. It is expected that the contribution will now be made in 2013/14. Partly offsetting this variance is higher than expected equipment hire costs.
7. Net loss on disposal of assetsDuring the year a number of plant items were replaced. The equipment being replaced was either sold at auction or traded in. The funds received from the disposal of these assets was lower than the carry value of the assets. This resulted in a net loss being recorded. The budgeted assumption was than the assets would be disposed of at the carrying value.
8. Contributions of Non Monetary Assets This income is mainly related to new roads contributed to Council by developers when new subdivisions are completed. Council does not budget for these contributions as the level of income varies considerably from year to year and cannot be accurately forecast.
9. Net asset revaluation increment Council’s assets are revalued on a cyclical basis. In 2012/13 unsealed road pavements, sealed road surfaces, bridges and footpaths were revalued resulting in an increase in asset values. Under accounting standards the increase in values following a revaluation need to be recorded as income in the Comprehensive Income Statement. The other side of this adjustment is an increase in the related asset values (see Statement of Financial Position).
*For the purposes of this document a significant budget variance is taken to be a variance of more than 10 per cent and $0.25m. However, a comment may be included where an item does not meet the threshold if the nature of the item warrants explanation.

w
Mac
edon
Ran
ges
Sh
ire C
ounc
il13
3
2012/13
PERFORMANCE AND FINANCIAL STATEMENTS
Notes to the Financial Report
For the Year Ended 30 June 2013
Macedon Ranges Shire Council Standard Statement Of Financial Position as at 30 June 2013
2012/13 Budget Variances 2012/13
Actual $’000 $’000 % Ref $’000
Current assets
Cash 3,110 3,825 123.0 1 6,935Other financial assets 11,200 (1,910) -17.1 1 9,290Receivables 7,787 (2,198) -28.2 2 5,589Other current assets 241 73 30.3 314Non-current assets held for resale 0 1,450 100.0 3 1,450
Total current assets 22,338 23,578
Non-current assets
Other financial assets 21 0 0.0 21Investment in Regional Library 1,519 (62) -4.1 1,457Land 53,747 10,206 19.0 4 63,953Buildings 79,241 (6,440) -8.1 5 72,801Infrastructure 354,556 51,647 14.6 6 406,203Furniture, systems and equipment 2,397 (270) -11.3 7 2,127
Plant and equipment 3,835 1,305 34.0 8 5,140Other 416 59 14.2 475Works in progress 0 6,184 100.0 9 6,184Investment Properties 3,331 18 0.5 3,349
Total non-current assets 499,063 561,710
Total Assets 521,401 585,288
Current liabilities
Payables 4,948 523 10.6 10 5,471Employee benefits 4,606 (30) -0.6 4,576Provisions 100 392 391.7 11 492Interest bearing liabilities 1,113 (56) -5.0 1,057Other current liabilities 2,973 1,030 34.6 12 4,003
Total current liabilities 13,740 15,599
Non-current liabilities
Payables 0 0 0.0 0Employee benefits 642 4 0.6 646Provisions 2,644 858 32.5 13 3,502Interest bearing liabilities 3,801 (926) -24.4 14 2,875
Total non-current liabilities 7,087 7,023
Total Liabilities 20,827 22,622
Net Assets 500,574 562,666
Equity
Accumulated surplus 237,831 24,953 10.5 15 262,784Asset revaluation reserve 256,246 36,980 14.4 16 293,226Reserves 6,497 159 2.4 6,656
Total Equity 500,574 562,666

w
For the Year Ended 30 June 2013
Notes to the Financial
Report
FINANCIAL REPORT
Macedon Ranges Shire C
ouncil134
2012/13
Comments in relation to key budget variances*: 1. Cash and Financial Assets Cash includes cash on hand and short-term investments of less than 3 months. Financial assets are investments held for more than 3 months. The key reason for the higher cash balance was due to a higher level of funds being held in shorter term investments to take advantage of higher returns offered. Overall the cash and financial asset balances are higher than expected as some capital works projects were incomplete at year end and funding was not required before the end of the year. These projects will be completed in 2013/14.
2. ReceivablesReceivables were lower than budget at the end of the year. The budget assumed a higher level of accrued income based on the 2011/12 forecast. The level of accrued income can vary considerably each year depending on the timing of grant invoicing.
3. Non current assets held for resale The balance mainly relates to the Council land for sale in the New Gisborne Industrial Estate. The budget assumption was that all lots would be sold by the end of the financial year, however, a number of lots remain in Council’s ownership.
4. Land The value of land assets were higher than budget mainly as a result of asset revaluation. Council land and buildings are revalued every two years in line with the General Valuation. The 2011/12 valuation resulted in increases in the recorded value of Council land. The valuation was not completed when the 2012/13 budget was adopted and hence were not sufficiently factored in to the budget.
5. Buildings The value of Council buildings was lower than expected due to some incomplete building works at year end that were classified as works in progress (see note 8) and a slight reduction is building values following the revaluation which occurred in late 2011/12 (see note 4).
6. Infrastructure assets This asset category includes Council roads, bridges, drainage and footpath assets. The budget variance is mainly due to a revaluation of assets which was not adequately factored in to the adopted budget. Council’s assets are revalued on a cyclical basis with most infrastructure assets being valued at current replacement cost which results in the revaluation increasing the asset values. A revaluation of sealed pavements (a component of roads) was completed in late 2011/12, the review resulted in an increase in recorded asset values of $11.5m. The review was completed after the budget was adopted. Further asset revaluations were undertaken in 2012/13 of Unsealed road pavements, sealed road surfaces, bridges and footpaths which resulted in an increase in asset values of $24.2m. Also increasing the asset values were infrastructure contributions from developers following subdivisions ($12.3m) and infrastructure capital works ($8.3m) completed during the year. Partly offsetting these increases was the depreciation expense on existing assets.
7. Furniture, systems and equipment This category is below budget due to lower than expected expenditure on a systems project that commenced during the year. The Finance and Human Resources system project is being implemented over two financial years and expenditure in year one (2012/13) was lower than expected. The new system will be implemented in 2013/14.
8. Plant & equipmentThe higher plant asset values is due to the purchase of three new graders during the year. The old graders were leased and the these leases expired during the year. Rather than lease the new equipment it was determined that it would be financially beneficial to buy new graders instead. The additional expenditure was funded from the plant reserve.
9. Capital works in progress A number of projects were in progress at the end of the year including the Romsey Sports Precinct and works at several of Council’s Kindergartens. These projects will be completed early in 2013/14.
10. Payables Payables were slightly higher than expected due to a higher level of unpaid invoices on hand at the end of the year. The timing of the receipt and payment of invoices can vary from year to year.

w
Mac
edon
Ran
ges
Sh
ire C
ounc
il13
5
2012/13
PERFORMANCE AND FINANCIAL STATEMENTS
Notes to the Financial Report
For the Year Ended 30 June 2013
11. Current provisionsThe variance mainly relates to a higher level of current provisions in relation to landfill rehabilitation. Council owns three former landfill sites and under accounting standards a provision must be maintained for future rehabilitation works. The increase in the current landfill provision is due to expected works that will be undertaken in 2013/14. The level of 2013/14 works has been revised since the 2012/13 budget was adopted.
12. Other current liabilitiesOther current liabilities includes income received in advance and refundable bonds and deposits. The higher than expected level of other liabilities mainly relates to a higher volume of refundable deposits at the end of the year. Most of these deposits are paid to Council by developers when subdivision works are undertaken. If works are completed in accordance with permits then the deposits are refunded. The level of deposits held varies in accordance with the level of subdivisional works undertaken.
13. Non Current ProvisionsThis provision represents the non current component of the landfill liability which was mentioned above. Overall the landfill provision is higher than expected as some restoration works are yet to be undertaken.
14. Non current borrowings Borrowings are lower than expected as the budget included loans to fund the Gisborne indoor Stadium ($0.500m) and some other smaller capital loans ($0.350m). These loans were not taken up as the related projects did not commence or were incomplete at year end. It is expected that the loans will be taken up in 2013/14.
15. Accumulated SurplusThe accumulated represents the value of all net assets less reserves that have accumulated over time. The higher than budgeted balance is mainly a result of higher levels of non monetary assets received in 2011/12 and 2012/13. See the Income Statement for details of income received from non monetary asset transfers.
16. The asset revaluation reserve Council’s assets are revalued on a cyclical basis. In 2012/13 Council revalued its unsealed road pavements, sealed road surfaces, bridges and footpaths which resulted in an increase in asset values of $24.2m. These revaluations resulted in an increase in the value of these assets and as result of this revaluation $24.2m was transferred to the asset revaluation reserve. Other asset revaluations were completed in late 2011/12. As mentioned above the revaluation was completed after the budget was adopted.
*For the purposes of this document a significant budget variance is taken to be a variance of more than 10 per cent and $0.25m.
w
For the Year Ended 30 June 2013
Notes to the Financial
Report
FINANCIAL REPORT
Macedon Ranges Shire C
ouncil136
2012/13
Macedon Ranges Shire Council Standard Statement Of Cash Flows for the year ended 30 June 2013
2012/13 Budget Variances 2012/13
Actual $’000 $’000 % Ref $’000
Cash Flows from Operating Activities
Receipts General Rates and Charges 34,866 (53) -0.2 34,813Government Grants Received 19,168 (1,100) -5.7 18,068User Charges & Contributions 7,847 2,326 29.6 1 10,173Interest Received 1,079 (74) -6.9 1,005Other Receipts 3,018 373 12.4 2 3,391
Total Receipts 65,978 1,472 67,450
Payments Payments to Suppliers (18,225) (1,125) 6.2 3 (19,350)Payments to Employees (25,948) (3,410) 13.1 4 (29,358)Other Payments (4,597) (407) 8.9 5 (5,004)
Total Payments (48,769) (4,943) (53,712)
Net cash flows from operating activities 17,209 (3,471) 13,738
Cash flows from investing activities
Payments for property, plant and equipment
(17,441) 172 -1.0 (17,269)
Proceeds from sale of property, plant and equipment
1,777 (1,259) -70.8 6 518
Net cash flows used in investing activities (15,664) (1,087) (16,751)
Cash flows from financing activities Increased/(Decreased) Borrowings (420) (822) 195.7 7 (1,242)Net (increase)/decrease in long-term investments
(400) 5,965 -1491.3 8 5,565
Interest Paid (331) 38 -11.5 (293)
Net cash flows provided by financing activities (1,151) 5,181 4,030
Net increase /(decrease) in cash held 394 623 158.1 1,017
Cash at the beginning of the year 2,716 3,202 117.9 9 5,918
Cash at the end of the year 3,110 3,825 6,935

w
Mac
edon
Ran
ges
Sh
ire C
ounc
il13
7
2012/13
PERFORMANCE AND FINANCIAL STATEMENTS
Notes to the Financial Report
For the Year Ended 30 June 2013
Comments in relation to key budget variances*: 1. User charges & contributions Receipts from user charges and contributions were higher than expected mainly due to a higher level of Statutory Planning contributions. Planning contributions are generally received from developers as part of a subdivision. This income will be used in future years to assist in funding infrastructure requirements. User charges and project contributions were also higher than budget.
2. Other receiptsOther receipts includes GST refunds from the Australian Tax Office of $2.6m, these receipts were slightly higher than expected. As there is no GST on rates Council receives a net refund on the GST from the Australian Tax Office, ie the amount of GST paid to suppliers is more than the GST on Council’s income. There is an offsetting amount in GST outflows (see note 4).
3. Payments to SuppliersPayments to suppliers were higher than expected due to above budget costs across a range of Council departments (see Income Statement note 5). In some cases the higher expenditure was offset by higher income or lower salary costs.
4. Payments to Employees Payments to employees were higher than budget due to a payment of $3.6m to Vision Superannuation to fund the shortfall in the Local Authorities Superannuation Fund Defined Benefit Plan. An actuarial review completed in 2011/12 found that there were insufficient funds to cover the superannuation liability due to the weaker share market. All Victorian Council’s are required to contribute additional funds to address the shortfall. Council was not advised the amount of the shortfall until late in 2011/12 so the payment was not factored into the budget. The liability was recorded in the 2011/12 accounts and hence there was no impact on the expenses recorded in 2012/13 Income Statement. The impact of the superannuation contribution was partly offset by lower than expected salary expenses.
5. Other payments Other payments include net GST paid by Council to suppliers of $2.6m which were above budget. These amounts are refunded by the tax office (see note 2).
6. Proceeds from sale of property, plant and equipment Council has a number of lots (land) for sale in the New Gisborne Industrial Estate. When the budget was prepared it was assumed that all of these lots would be sold during the year and the related sale funds would be received, however, only one lot was actually sold in 2012/13, as a result the proceeds are below budget.
7. Borrowings This item represents loan repayments made less any new loans taken up. The 2012/13 budget included $1.27m of loan repayments and the take up of several loans totalling ($0.85m), the largest of these was $0.5m for Council’s contribution to the Gisborne Indoor Sports Centre. As this project did not commence in 2012/13 the loan funds were not taken up. As a result of this net borrowing decreased during the year.
8. Longer Term Investments The level of longer term investments can vary considerably from year to year depending on the timing of investment maturity and the availability of funds to invest. The decrease in longer term investments was mainly due to the payment of Council’s contribution to the Defined Benefit Superannuation shortfall (see Note 4 above). Council was not advised of the amount of the contribution until after the 2012/13 budget was adopted, hence the payment was not factored into the budget.
9. Cash at the beginning of the year The level of cash on hand at the end of 2011/12 was higher than expected following the receipt of several large grants at the end of the year.
*For the purposes of this document a significant budget variance is taken to be a variance of more than 10 per cent or $0.25m.

w
For the Year Ended 30 June 2013
Notes to the Financial
Report
FINANCIAL REPORT
Macedon Ranges Shire C
ouncil138
2012/13
Macedon Ranges Shire Council Standard Statement Of Capital Works For the year ended 30 June 2013
2012/13 Budget Variances 2012/13
Actual $’000 $’000 % Ref $’000
Capital Works Areas
Roads and streets 4,955 6 0.1 4,961Bridges 755 (129) -17.1 1 626Drainage 670 (198) -29.6 2 472Footpaths, kerbs and channels 577 140 24.3 3 717Parks and recreation facilities 5,982 (4,025) -67.3 4 1,957Other infrastructure 714 (183) -25.6 5 531Land and buildings 2,384 2,796 117.3 6 5,180Plant and equipment 767 1,009 131.6 7 1,776IT Systems, Furniture and equipment 651 35 5.4 686Other 0 234 100.0 8 234
Total Capital Works 17,454 17,140
Types of Capital Works
Renewal 8,787 (522) -5.9 8,265Upgrade 3,510 2,031 57.9 5,541Expansion 0 0 100.0 0New assets 5,157 (2,089) -40.5 3,068Other 0 266 100.0 266
Total Capital Works 17,454 17,140
Property, Plant & Equipment movement Reconciliation Worksheet The movement between the previous year and the current year in property, plant and equipment as shown in the Statement of Financial Position links to the net of the following items:
Total capital works: 17,454 17,140Asset revaluation movement 0 24,186Depreciation (11,214) (10,926)Written down value of assets sold (1,777) (672)Contributed Assets 0 13,729Other items 0 0
Net movement in property, plant & equipment
4,463 43,457
w
Mac
edon
Ran
ges
Sh
ire C
ounc
il13
9
2012/13
PERFORMANCE AND FINANCIAL STATEMENTS
Notes to the Financial Report
For the Year Ended 30 June 2013
Comments in relation to key budget variances*: 1. Bridges Capital expenditure on bridges was $0.129m lower than expected. Some planned works are now scheduled for completion early in the 2013/14 year.
2. Drainage Capital expenditure on drainage was $0.198m lower than expected. The budget variance mainly relates to a drainage project contribution that Council is required to make. It was expected that the contribution would be paid in 2012/13 but it will now be paid in the next financial year.
3. Footpaths, kerbs and channelsCapital expenditure on Footpaths, kerbs and channels was $0.14m higher than expected. The budget variance mainly relates to a some works that were originally budgeted in 2011/12 but the projects were completed in 2013/14. This higher expenditure is offset by lower expenditure last year.
4. Parks and recreation expenditureThe main reason for the budget variance was is that the Romsey Sports Precinct budget ($3.2m) was included in this category. Upon review the most of the budget should have been included under the Land and Buildings category (see note 6). In addition some other budgeted projects were incomplete at year end, these projects will now been completed in 2013/14.
5. Other infrastructure expenditure The budget variance mainly relates to planning works that were budgeted in relation to the Gisborne Early years hub. The project has been deferred and is now expected to commence in 2013/14.
6. Land & buildings capital expenditure Land and buildings capital expenditure was $2.8m higher than budget. As outlined in Note 4, the budget for this category did not include the Romsey Sports Precinct project. Expenditure for this project totalled $2.1m in 2012/13 with some works now carrying over into 2013/14. Land for car parking was purchased in Kyneton ($0.32m) which was not included in he budget, this purchase is funded in the 2013/14 budget. Council also received an unbudgeted grant for the On Our Way project ($0.25m) and has undertaken the related capital works at a number of Council facilities.
7. Plant & Equipment expenditure The above budget expenditure on plant was due to the purchase of three new graders during the year. The old graders were leased and the these leases expired during the year. Rather than lease the new equipment it was determined that it would be financially beneficial to buy new graders instead. The additional expenditure was funded from the plant reserve.
8. Other Capital Works This category includes landfill rehabilitation works which totalled $0.23m in 2012/13. Council undertook some additional restoration works during the year which were a flow on from the works conducted in the previous two years.
*For the purposes of this document a significant budget variance is taken to be a variance of more than 10 per cent or $0.25m.

w
Independent Auditor’s Report
Macedon Ranges Shire C
ouncil140
2012/13
For the Year Ended 30 June 2013
Notes to the Financial
Report
FINANCIAL REPORT
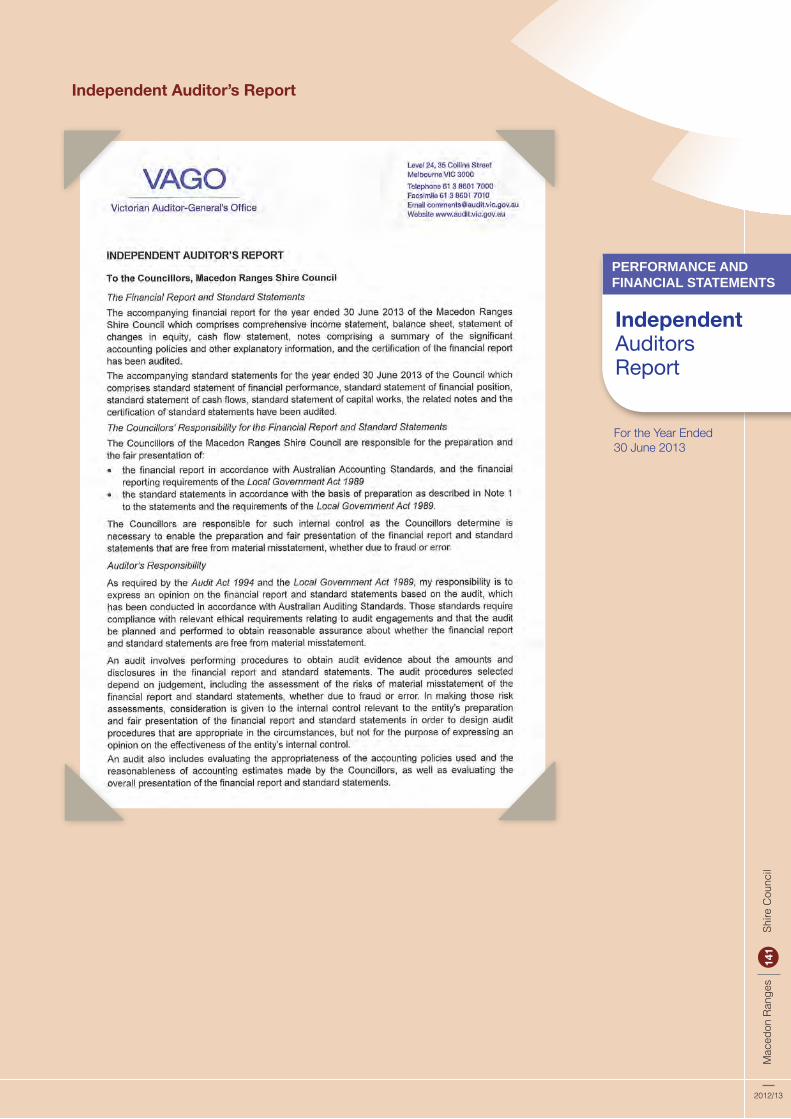
w
Independent Auditor’s Report
For the Year Ended 30 June 2013
2012/13
Mac
edon
Ran
ges
Sh
ire C
ounc
il14
1
PERFORMANCE AND FINANCIAL STATEMENTS
Independent Auditors Report

For the Year Ended 30 June 2013
Independent Auditor’s Report
Macedon Ranges Shire C
ouncil142
2012/13
Notes to the Financial
Report
FINANCIAL REPORT

AAdvisory Committees....................50, 51
Aged and Disability Services................22
Animals..............................................43
Aquatic Facilities..................................31
Arts and Culture.........................4, 22, 34
Asset Management...........42, 43, 62, 66
Audit Committee.................................66
Auditors Report...................................68
Australia Day...................................6, 52
BBuilding Services...................................9
CCapital Works.....8, 10, 45, 73, 75, 78, 79
Chief Executive Officer...................10, 16
Children’s Services....................8, 10, 34
Community Development..........8, 29, 32
Community Funding Scheme.................. 6, 7, 8, 48, 52
Community Register............................22
Community Satisfaction Survey.............. 10, 29, 39, 45, 50, 59
Council Meetings.................................50
Council Plan...................4, 10, 11, 20, 48
Council Offices......................Back Cover
Councillors.........................13–15, 48, 50
Cultural Development..........................34
Customer Service................................48
DDirectors...........................................16
Disability Services................................22
Donations....................................52–57
EEconomic Development.......................25
Emergency Management.....................43
Employees..................................16–19
Environment........................22, 27, 40–45
Environmental Health...........................42
Events..............................................6–7
Executive...........................................16
Expenditure................................8–9, 127
FFacilities.........................................31, 44
Families and Children...........................36
Financial Performance...................71–79
Fire Prevention................................4, 43
Floods..................................................4
Footpaths.............................9, 10, 42, 45
Freedom of Information.......................61
Future Directions...............29, 39, 45, 49
GGoals...............................i, 2, 23–57, 62
Governance................................2, 46 –55
Grants and Donations...................52–57
HHanging Rock.............3, 6, 7, 11, 27, 35
Highlights...................................4–5
Housing........................................32
Human Resources...............................20
IImmunisation.....................................42
Indoor Aquatic Centre..........................31
Indoor Sports Facilities........................31
Information and Communications........48
Infrastructure.................................41, 44
KKyneton Mechanics Institute............5, 35
Kyneton Museum.......................4, 22, 35
LLeisure facilities....................................31
Libraries.....................................8, 22, 37
Live4Life....................................7, 22, 37
Local Laws..........................................43
MMajor Projects.....................................41
Maps...............................................33
Maternal and Child Health...............8, 36
Mayor..............................................11
Mission.............................................i
OOccupational Health and Safety...........20
Organisation Structure...................18–21
PParks and gardens..............................43
Performance Statement.................63–67
Pets...............................................43
Planning (land use).........................27, 28
Planning framework (corporate planning).. 51
Population Figures..................................3
Privacy..........................................61
Public Relations..............................48–49
UUniversal Access.................................33
RRates..............................8–9, 60, 71, 72,
Recreation..........................8, 22, 31, 37
Reporting Cycle...................................51
Risk Management .................................20
Roads......................................44, 45, 59
SSaleyards.......................................44, 51
Service Awards....................................17
Settlement Strategy...................5, 11, 27
Shire Profile............................................3
Sport................................................31
Staff..............................................16–21
Statutory Information.....................59–61
Sustainable Living..........................24–29
TTourism..................................9, 11, 22, 29
Transport............................22, 32, 33, 34
UUnderstanding the Financial Statements.. 71
VValues..............................................i
Vision...............................................i
Volunteers...................................22
Victorian Local Government Indicators.... 60
WWard maps..............................13, 14, 15
Waste............................................45, 59
Water................................28, 37, 41, 43
Weeds....................................25, 26, 28
Whistleblowers Protection...................61
YYouth.............................4, 7, 22, 37, 38
Administration CentresKyneton—129 Mollison Street Hours: Mon–Fri 8.30am–5pmGisborne—40 Robertson Street Hours: Mon–Fri 8.30am–5pm
Service CentresRomsey Community Hub—96–100 Main Street Hours: Mon, Tues, Wed, Fri 9.30am–5pm, Thurs 9.30am–6pmWoodend Library—Corner High and Forest Streets Hours: Mon, Tues, Thurs, Fri 9.30am–5pm, Wed 9.30am–6pm
Town Hall Kyneton–Box OfficeTel: 1300 888 802
Visitor Information CentresWoodend—Tel: (03) 5427 2033Kyneton—Tel: (03) 5422 6110 Further copies, or more detailed information relating to matters contained in this report, is available by contacting Council on (03) 5422 0333 or email [email protected]
Designed & produced by 2 dam creative • www.2damcreative.com
Macedon Ranges Shire CouncilAll mail and tenders to:PO Box 151, Kyneton 3444Tel: (03) 5422 0333Fax: (03) 5422 3623Email: [email protected]: mrsc.vic.gov.au