Embed Size (px)
Citation preview

Performance Measures
for Making Pavement
Preservation Decisions
David Luhr
Pavement Management Engineer
Washington State DOT
1

2
Performance Measures as Tools
•Project Decision Support- Where, When, and How for pavement decisions
•Accountability & Communication- achieving standards, reports to legislature & public
- stewardship, protecting infrastructure investment
•Forecasting Needs & Risks- funding needs, evaluation of risk
•Learning- continual improvement of methods & procedures

3
Performance Measures within what Context?
•Historical?•Future Projection?
•Project Level?•Network Level?
•Agency Perspective?•User Perspective?

Pavement Performance Measures
What is current physical condition of pavement?
•Distress (cracking, rutting, raveling, faulting, etc.)
•Profile - Roughness (IRI)
•Friction (Skid Number, macrotexture)
•Structure (deflection, seismic response)
Pavement Performance Measures
How is road performing for users?
•Roughness (IRI)
•User cost (user delay, user operating cost)
•Freight damage
•Safety (pavement related)

6
Performance Management in MAP-21
Title 23, U.S.C.

Cost-Effectiveness
•Evaluates the cost of acceptable pavement performance ($/lane-mile/year)
•Simpler than Benefit/Cost analysis, since difficult to express benefit of pavement performance in terms of dollars

Cost-Effectiveness
“…the most efficient investment…”
• Annual Cost ($ / lane-mile / year of life)
• Historical Cost of Acceptable Pavement Performance• Actual historical cost ($/LMY)
• Expected Cost of Future Pavement Rehab• Projected LCCA ($ /LMY)
8
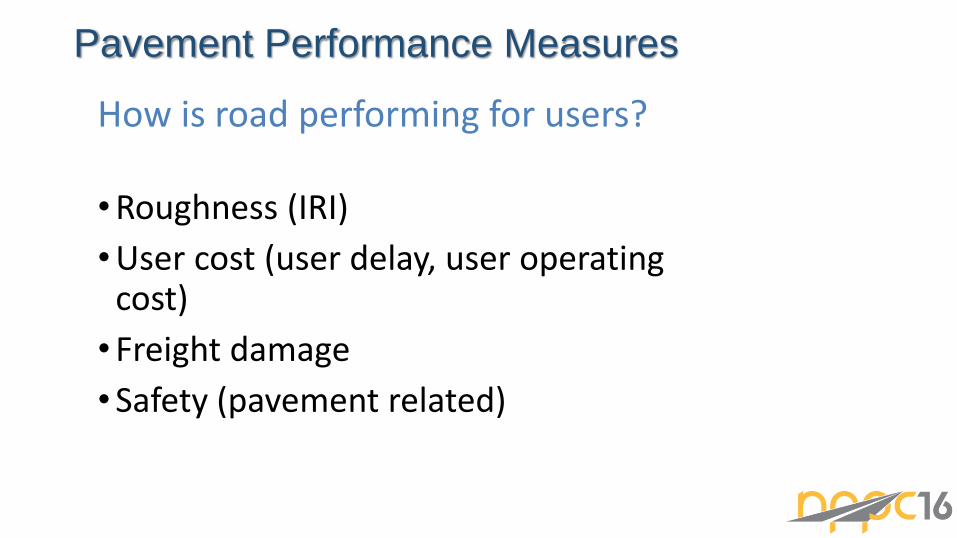
Equivalent Uniform Annual Cost (EUAC)
EUAC = P i (1+i)n
(1+i)n -1
where
P = Present Value of all costs
i = Discount Rate
n = number of years
P
n
years
EUAC
NPV
=

Advantages of EUAC
1) A simple measure that can be directly compared with a different project, or statewide average
2) Easier to calculate (no need to add multiple performance periods)
3) Salvage Value does not need to be considered
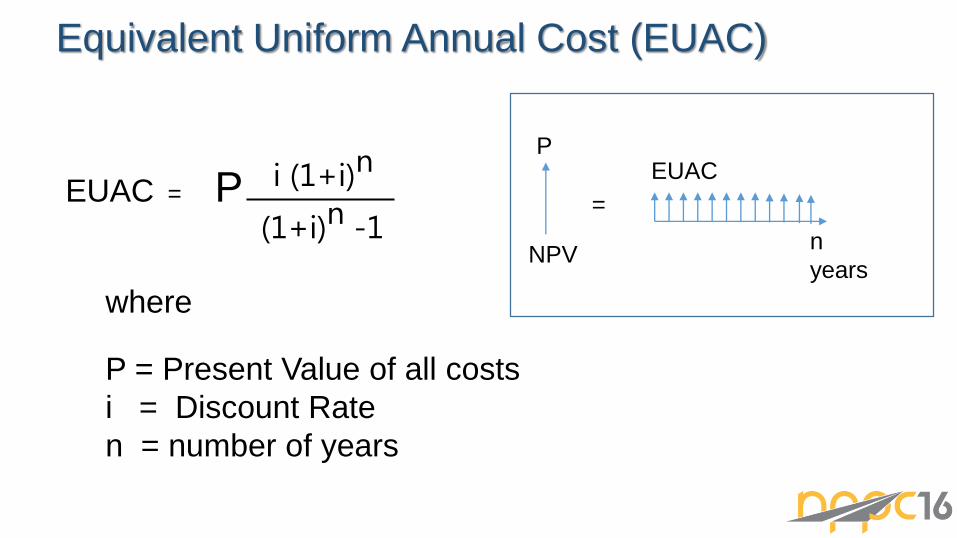
Typical Cost-Effectiveness Comparison
Pavement
Type
Treatment
CategoryTreatments
Agency Cost
($/LM )
Life
Extension
(years )
EUAC0%
($/LMY )
EUAC4%
($/LMY )
Maint. Crack sealing, patching $2,500 2 $1,250 $1,325
Rehab Resurfacing $45,000 9 $5,000 $6,052
Reconst. Rebuild $200,000 14 $14,286 $18,934
Maint. Crack sealing, patching $5,000 3 $1,667 $1,802
Rehab Resurfacing $225,000 15 $15,000 $20,237
Reconst. Remove & Replace $1,000,000 20 $50,000 $73,582
Rehab Grinding, slab replacement $400,000 15 $26,667 $35,976
Reconst. Remove & Replace $2,500,000 50 $50,000 $116,376
Concrete
Chip Seal
Asphalt

LCCA: Asphalt and Chip Seal
Reconstruction ?? ($$$$$$)
Rehab ($$$)??
Years
Co
nd
itio
n
Ind
exes
0
100
Optimum time for Rehab
Excessive Vehicle Operating Costs
Excessive Agency Construction Costs
Do Nothing ??
Index value 45 ~ 50
Preservation ($) ??

Replacement Analysis
Decision Analysis to consider:• Do Nothing (no replacement)• Maintenance• Rehabilitation• Reconstruction
If proposed alternative results in lower annual cost, then make decision for replacement

$0
$20
$40
$60
$80
$100
$120
$140
0 5 10 15 20
EUA
CTh
ou
san
ds
Year
Replacement AnalysisEUAC RehabConstruction
EUAC Maintenance
Lowest Total Annual Cost is time for

$250 k
12 years 12 years
$26,638/yr=
$250 k
15 years 15 years
$23,538/yr
$5 k $15 k
=
10
Calculation of EUAC for an asphalt pavement resurfacing
($250k for 12 year period).
Spending additional $5k on maintenance in year 10 and $15k in year 15
results in EUAC that is $3.1k less (12% reduction in annual cost).
(Assumed Discount Rate 4%)
Analysis of Alternatives
$250 k
12 years 12 years
$26,638/yr=
10
$250 k
years 15
years
$26,638/yr
$5 k
Breakeven
???=
13
$71.2 k
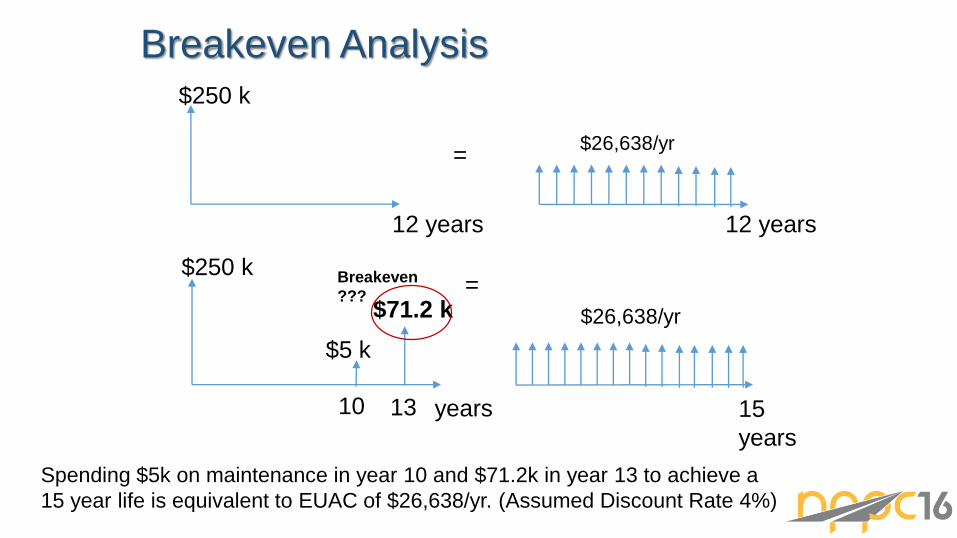
Spending $5k on maintenance in year 10 and $71.2k in year 13 to achieve a
15 year life is equivalent to EUAC of $26,638/yr. (Assumed Discount Rate 4%)
Breakeven Analysis
17
Performance Measures as tools in Pavement Management
• Decision Support- Where, When, and How for pavement decisions
• Accountability & Communication- achieving targets, reports to legislature & public
- stewardship, protecting infrastructure investment
• Forecasting Needs & Risks- funding needs, evaluation of risk
• Learning- continual improvement of methods & procedures

18
19


Pavement Performance Measures- Network Level
How well is infrastructure being managed (past and future)?
• Remaining Service Life (RSL)
• Asset Sustainability Ratio
• Accrued cost of deferred maintenance/rehabilitation (Deferred Preservation Liability)
21

Remaining Service Life (RSL)
• Measures the pavement life (years until due for rehabilitation) of each section over the entire network (expressed as % of typical pavement life)
• Healthy system has remaining service life of 40 – 60 percent• In an ideal system, the entire system would have an average
remaining service life equal to 50% of the total average pavement life
22

If Planned Funding continues
Remaining Service Life plunges
23

Asset Sustainability Ratio
• Measures how well WSDOT’s pavement replenishment is keeping up with pavement wear.
• Illustrates how much life was put back into the pavement system verses how much was consumed in a given year (units of lane-mile years).
• Consumption (for WSDOT flexible pavements) is 16,000 lane-mile years (per year)
• Target is Ratio of 1.0
24

25

Deferred Preservation Liability
• Is an estimate of the funding necessary to address the backlog of deferred pavement rehabilitation
• Takes into consideration higher costs as pavement condition gets worse (and needs more extensive repair)
26

27

Future Historic ProjectLevel
Network Level
Decision Support
• Pavement Condition
• Cost-Effectiveness
• Remaining Service Life
Forecast Needs & Risks
• Pavement Condition
• Remaining Service Life
• Deferred Preservation
Liability
Accountability & Communication
• Pavement Condition
• Asset Sustainability Ratio
• Cost-Effectiveness
Learning
• Cost-Effectiveness
• Remaining Service Life
• Pavement Condition28