Embed Size (px)
Citation preview
Aus der Klinik für Anästhesie und Intensivtherapie
Direktor: Prof. Dr. H. Wulf
des Fachbereichs Medizin der Philipps-Universität Marburg
in Zusammenarbeit mit dem Universitätsklinikum Gießen und Marburg GmbH, Standort Marburg
Pharmacokinetics of paracetamol (Perfalgan®) following different infusion protocols in a porcine model.
Inaugural-Dissertation zur Erlangung des Doktorgrades der gesamten Humanmedizin
dem Fachbereich Medizin der Philipps-Universität Marburg vorgelegt
von Sohail Ahmed Sheikh
aus Lahore, Pakistan
Marburg 2008
2
Angenommen vom Fachbereich Medizin
der Philipps-Universität Marburg
am 06.10.2008
Gedruckt mit Genehmigung des Fachbereichs
Dekan: Prof. Dr. med. M. Rothmund
Referent: Prof. Dr. med. H. Wulf
1. Korreferent: Prof. Dr. med. T. Gudermann
2. Korreferent: Prof. Dr. rer. nat. Dr. med. J. Krieglstein

3
Meinen Eltern in Liebe und Dankbarkeit
4
TABLE OF CONTENTS
1. INTRODUCTION ………………………………………………7
1.1 Non-opioid analgesics ………………………………………….8 1.2 History…………………………………………………………….10 1.3 Chemical Structure……………………………………………..11 1.4 Indications and applications………………………………….12 1.5 Side effects………………………………………………………13 1.6 Mechanism of action…………………………………………..14 1.7 Pharmacokinetics………………………………………………16 1.8 Current literature………………………………………………..17 1.9 Aim of the trial…………………………………………………..18 2. METHODS………………………………………………………19 2.1 Animals…………………………………………………………..19 2.2 Pre medication and anaesthesia………………………….....19 2.3 Infusion protocol…………………………………………….....19 2.4 Laboratory Methods……………………………………………20
2.4.1 Analytic range………………………………………………. 21
2.4.2 Sensitivity……………………………………………………. 21
2.4.3 Specificity……………………………………………………. 21 2.5 Pharmacokinetics……………………………………………….22
5
2.5.1 Pharmacokinetic model…………………………………… 22
2.5.2 Weighting and goodness-of-fit…………………………... 22
2.5.3 Measured parameters……………………………………… 22 3. RESULTS ……………………………………………………….23 3.1 Age, gender and body weights……………………………….23 3.3 Plasma Levels of Paracetamol…………………………….....23
3.3.1 Individual Plasma Levels in 15-min-group…………… ..23 3.3.2 Individual Plasma Levels in 60-min-group…………… ..24 3.3.3 Mean Plasma Levels……………………………………….. 24
3.4 CSF Level of Paracetamol…………………………………… .26
3.4.1. Individual CSF Levels in 15-min-group………………… ..26 3.4.2. Individual CSF Levels in 60-min-group…… ……………………26 3.4.3 Mean CSF Levels……………………………………………………. 27 3.5 Pharmacokinetics …………………………………………………28 4. DISSCUSSION ………………………………………………..41 4.1 Summary of the Results……………………………………….41 4.2 Comparison with current literature……………………..... ....41 4.3 Impact of the results…………………………………………....44 4.4 Limitations………………………………………………………..45 4.5 Conclusion and perspectives………………………………...46 5 ABSTRACT………………………………………………………47 6 Reference List………………………………………..................49
6
ABBREVIATIONS ACTM Acetaminophen AUC Area Under the Curve C(max) maximum plasma concentration CB Cannabinoid Cl(t) total clearance CNS Central nervous system COX Cyclooxygenase COX-2 Cyclooxygenase-2 COX2- inhibitors Cyclooxgenase-2- inhibitors CSF Cerebrospinal fluid i.v Intravenous MRT-tot Mean Resident Time total NMDA N-methyl D-aspartate NO Nitric oxide NSAIDs Non-steroidal anti-inflammatory drugs PBD Particle-bound drug pKa dissociation constant SD Standard Deviation t 1/2 alpha distribution half-life Teq equilibration half-time TopFit Thomae Optimized Pharmacokinetic Fitting Program Vd(ss) Volume of distribution at equilibrium

7
1. Introduction
Adequate treatment of pain in the post operative period is essential to avoid
unnecessary distress and to minimise the potential complications
(Mackintosh, 2007).
There have always been attempts to improve the management of pain
treatment but, the management of post operative pain still needs
improvement. Clinical, psychological and institutional consequences may
arise from inadequate pain management (Hutchison, 2007). The
unsatisfactory treatment of post operative pain can be the result of a
unimodal therapy (Kehlet & Dahl, 1993). By combining pharmacological
management and other measures, strategies should be developed to ensure
maximum pain relief for each patient (Mackintosh, 2007). A multimodal or
“balanced analgesia” appears to be the key for successful transition between
anaesthesia and post-operative analgesia (Joris et al., 2001). The intra-
operative use of various adjuvant therapies that reduce the need for opioid
and/or post-operative pain severity is an important part of balanced
analgesia. The application of opioid- and non-opioid analgesics according to
their pharmacokinetic characteristics, facilitate the transition from
anaesthesia to analgesia (Joris et al., 2001). The advantages of balanced
analgesia are based upon the fact that due to the additive or synergetic
effects of different analgesics, an optimal analgesia can be achieved with
minimal doses of individual therapeutic agents; it leads to the reduction of
side effects (Kehlet & Dahl, 1993). A combination of opioid and non-opioid
analgesics e.g. paracetamol is usually used as balanced analgesia.
Paracetamol is an active metabolite of phenacetin and belongs to the group
of non opioid analgesics. It exerts its analgesic effects by the peripheral and
central inhibition of prostaglandins. The mechanism of action of paracetamol
analgesia is not clearly understood but, it involves multiple factors. It is a
potent inhibitor of prostaglandin synthesis with in the central nervous system
(Piletta et al., 1990). Similarly it interferes with nociception associated with
spinal NMDA (Bjorkman, 1995) receptor activation. This effect involves the

8
inhibitory action on spinal nitric oxide (NO) mechanisms (Bjorkman, 1995).
Paracetamol is available as an oral, rectal and newly developed as an
intravenous (Hahn et al., 2003) applicable form. The i.v. application of
paracetamol avoids variability associated with gastric absorption and first-
pass hepatic metabolism (Back & Rogers, 1987), resulting in higher plasma
concentration and greater analgesic efficacy than orally administered drug.
The oral administration results in an unpredictable variation in plasma
concentration compared with i.v. administration (Holmer et al., 2004).
Moreover after a number of surgical procedures (intestinal, head and neck
surgeries etc.), enteral application of analgesics is not possible. In such
cases i.v. paracetamol is a good alternative to non-steroidal anti-
inflammatory drugs (Graham et al., 1999) and other non-opioid analgesics.
Intra-operative administration of paracetamol has been shown to decrease
pain with a morphine sparing effect (Binhas et al., 2004).
There are two intravenous inject able forms of Paracetamol. The water
soluble, inject able form Propacetamol; that is rapidly hydrolyzed to
acetaminophen (paracetamol) in the blood by the enzymatic action of
esterases. Hydrolysis of 2 g Propacetamol yields 1 g paracetamol
(Bannwarth et al., 1992d; Flouvat et al., 2004).
The second inject able form is a direct intravenous inject able form of
paracetamol (e.g. Perfalgan®).1g of Paracetamol administered as
Perfalgan®
10 mg/ml is bioequivalent to 2 g Propacetamol with a better local safety.
Perfalgan® is a ready-to-use formulation and must not be reconstituted in to
a solution as Propacetamol (Flouvat et al., 2004).
These studies indicate an optimal bioavailability of paracetamol by
intravenous application and the synergetic effects to Cyclooxgenase-2-
inhibitors (COX2- inhibitors) are reported which can be partly replaced by
paracetamol and the low incidence of side effects makes i.v. paracetamol a
good alternative drug for other analgesics.

9
The recommended dosage for the intravenous application of Perfalgan® is
an infusion of 1g over 15 minutes. The aim of our study was to evaluate the
pharmacokinetics of i.v. paracetamol after different infusion rates and in view
of the results the optimization of dosage and mode of i.v. application of
paracetamol.
1.1 Non-opioid analgesics
Antipyretic analgesic were developed about a hundred years ago and
divided in to two groups; the acidic (aspirin-like drugs) and non-acidic
(acetaminophen-phenazone-like) compounds (Brune & Neubert, 2001). The
analgesics having a pKa-value (that is the pH- value at which the 50 % of the
substance is found to be in dissociated form) of less than 5 are called acidic-
antipyretic-analgesics and those with a pka value of more than 5 are the
non-acidic analgesic-antipyretics.
Acidic- and non-acidic antipyretic analgesics possess different
pharmacokinetic properties. The acidic-antipyretic-analgesics achieve high
concentrations in tissues with low pH like inflamed tissue, which is assumed
to account for their superior anti-inflammatory potency and also reach
comparatively high concentrations in the stomach wall, kidney cortex and
blood, resulting in the well-known side effects that occur with acidic
compounds but not with paracetamol and phenazone (Brune & Neubert,
2001).
The non-acidic-group is further divided into chemical groups of pyrazolinone
and aniline. The example of pyrazolinone includes Metamizol; and
paracetamol belongs to the aniline group.
Another group of non-narcotic-antipyretic-analgesics includes the
cyclooxygenase- (COX-) 2-inhibitors. The examples include Celecoxib,
Etoricoxib and Parecoxib.
10
1.2 History
In the ancient history from Egypt and Greece, the analgesic and antipyretic
effects of willow bark are known for centuries. The modern era of salicylates
starts from 1758 with a report by Edward Stone (“an account of the success
of the bark of willow in the cure of agues”) sent to The Royal Society in
London. The active ingredient of willow bark “salicine” was first isolated in
1828 by Joseph Buchner, then by Henri Leroux, and also prepared from the
oil of wintergreen (Gualtheria) and meadowsweet (Spirea ulmaria) by
J.W.Lowig 1833, called “Spirsaure” which was already pure acetylsalicylic
acid. It was also synthetised 1853 by Ch. Gerhardt and finally 1897 in
Bayer´s laboratories by Felix Hoffmann, who also demonstrated its anti-
inflammatory efficacy(Jerie, 2006).
The prototypes of antiphlogistic analgesics include acetylsalicylic acid
(aspirin), acetanilide (the forerunner of acetaminophen), and phenazone.
Advances in the knowledge of chemical structure of drugs in 19th-20th
century along with the attempts to improve the effects and reduce the side
effects of analgesics-antipyretics led to the development of other aspirin-like
drugs called non-steroidal anti-inflammatory drugs (Brune & Niederweis,
2007).
Most of the NSAIDs were initially organic acids, but later non-acidic
compounds were discovered. The drug discovery of NSAIDs can be divided
in to two periods the time span from the post-World War 2 till the 1970´s was
the pre-prostaglandin period and thereafter up to the later part of the last
century was the period in which the effects on the production of
prostaglandin were considered during the drug-discovery process
(Rainsford, 2007).
In 1946, the Institute for the Study of Analgesic and Sedative Drugs awarded
a grant to the New York City Department of Health to study the problems
associated with analgesic agents. Bernard Brodie and Julius Axelrod were
11
assigned to investigate why non-aspirin agents were associated with the
development of methemoglobinemia, a condition that decreases the oxygen-
carrying capacity of blood and is potentially lethal. In 1948, Brodie and
Axelrod linked the use of acetanilide with methemoglobinemia and
determined that the analgesic effect of acetanilide was due to its active
metabolite paracetamol. They advocated the use of paracetamol, since it did
not have the toxic effects of acetanilide (Brodie & Axelrod, 1948).
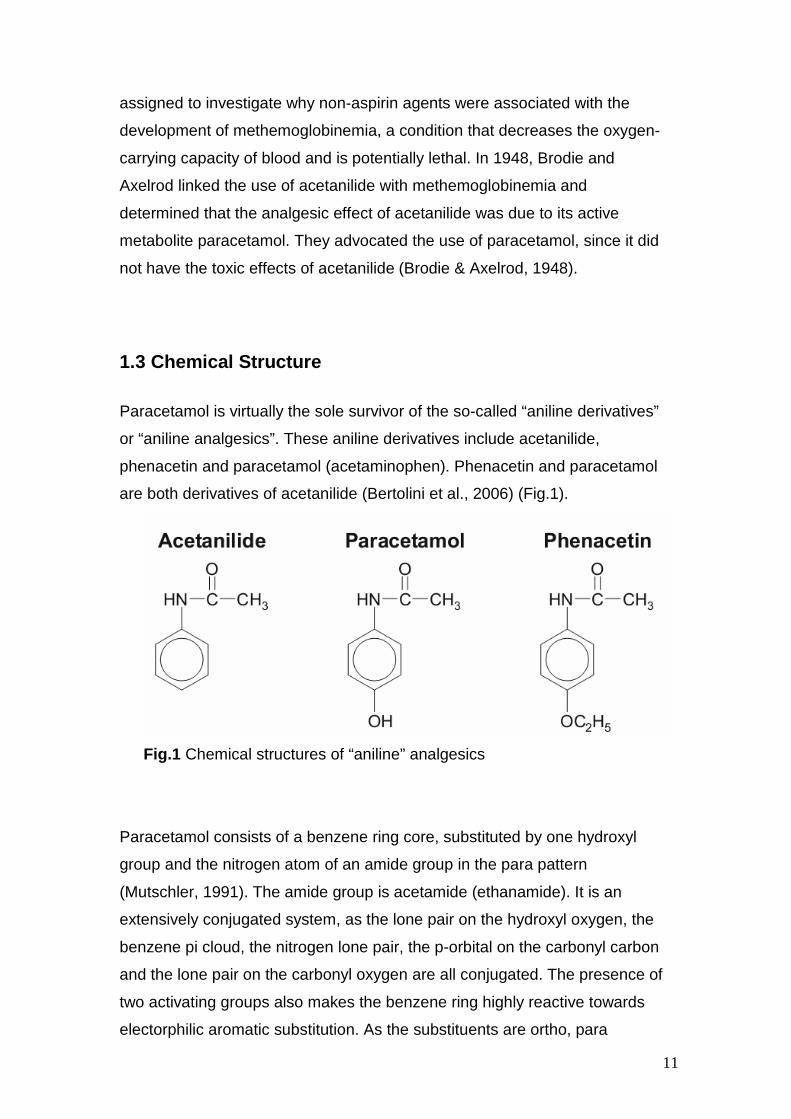
1.3 Chemical Structure
Paracetamol is virtually the sole survivor of the so-called “aniline derivatives”
or “aniline analgesics”. These aniline derivatives include acetanilide,
phenacetin and paracetamol (acetaminophen). Phenacetin and paracetamol
are both derivatives of acetanilide (Bertolini et al., 2006) (Fig.1).
Fig.1 Chemical structures of “aniline” analgesics
Paracetamol consists of a benzene ring core, substituted by one hydroxyl
group and the nitrogen atom of an amide group in the para pattern
(Mutschler, 1991). The amide group is acetamide (ethanamide). It is an
extensively conjugated system, as the lone pair on the hydroxyl oxygen, the
benzene pi cloud, the nitrogen lone pair, the p-orbital on the carbonyl carbon
and the lone pair on the carbonyl oxygen are all conjugated. The presence of
two activating groups also makes the benzene ring highly reactive towards
electorphilic aromatic substitution. As the substituents are ortho, para

12
directing and para with respect to each other, all positions on the ring are
more or less equally activated. The conjugation also greatly reduces the
basicity of the oxygen and the nitrogen, while making the hydroxyl acidic
through delocalisation of charge developed on the phenoxide anion.
1.4 Indications and applications
In view of its proven efficacy and low toxicity paracetamol is used on a
worldwide basis. The analgesic and antipyretic effects of paracetamol are
accepted to be of therapeutic significance, while its anti-inflammatory and
anti-rheumatic activities are negligible (Clissold, 1986).
The spectrum of indications includes from the discomforts of the common
cold over the post operative pain to the pain associated with malignancy.
The analgesic efficacy of paracetamol is equivalent to that of aspirin, and its
plasma levels required for the analgesic activity are higher than those
needed for the antipyretic activity (Beck et al., 2000).
As an analgesic and antipyretic paracetamol replaces aspirin especially in
cases where aspirin is contraindicated. It has a broad tolerability and is of
particular value in the treatment of patients in whom non-steroidal-anti-
inflammatory drugs (Graham et al., 1999) are contraindicated such as
aspirin-sensitive asthmatics and people at risk of gastrointestinal
complications (Prescott, 2000).
Paracetamol is available in oral, rectal and intravenous applicable forms.
Oral administration of paracetamol as part of multimodal pain management
immediately post-operatively resulted in a huge and unpredictable variation
in plasma concentration compared with the intravenous administration
(Holmer et al., 2004). Intravenous administration of paracetamol either as
intravenous acetaminophen or Propacetamol avoids variability associated
with gastric absorption and first-pass hepatic metabolism, resulting in higher
plasma concentrations and greater analgesic efficacy than orally
administered drug (Jarde O & Boccard E, 1997).
Propacetamol (Pro-Dafalgan® or Pro-Efferalgan®), inject able prodrug of
paracetamol, is in many European countries the first inject able paracetamol-
13
formula brought in the market. Perfalgan® is a newly developed intravenous
applicable paracetamol of second generation.
In reference to anaesthesiological pain management in peri-operative
(Kehlet & Dahl, 1993) as well as in special (adjunctive) pain treatment,
paracetamol is indicated as follows:
• Treatment of moderate pain especially as an additive to other
measurements.
• As an opioid sparing drug to reduce the side effects associated
with opioid analgesics (e.g. respiratory depression).
• Treatment of fever for adults and children over 10 kg body weight.
Apart from that the drug is indicated by patients with known pseudo allergy
against Metamizol by patients with blood disorders (agranulocytosis by
Metamizol), especially by children(Hedenmalm & Spigset, 2002).
Lastly the i.v. analgesics like Prerfalgan® cover the gap created by the
removal of COX2-inhibitors from the market.
1.5 Side effects
Paracetamol is a safe drug at appropriate dosage with a therapeutic index of
approximately 10. The therapeutic dosage of paracetamol is 10-15mg/kg,
and a dose of 7.5g in an adult or 150 mg/kg in a child are considered as the
lowest acute dose capable of causing toxicity.
The very low level of paracetamol binding to plasma proteins, together with
its hepatic metabolism, mainly through glucuronide or sulphate conjugation,
account for the low risk of drug interactions with paracetamol, particularly
with antivitamin K. When added to a traditional NSAID, paracetamol
enhances the analgesic effect or allows the use of lower doses (Bannwarth &
Pehourcq, 2003).
The safety of paracetamol was reported in patients with stable chronic liver
disease showing no evidence of accumulation or hepatotoxicity after the
administration of the drug in therapeutic doses (Benson, 1983).
14
A clinical significant damage of liver cells is rare after therapeutic doses of
paracetamol however; the incidence of acute liver failure is reported even
after therapeutic doses (Pearce & Grant, 2008).
The side effects of paracetamol are usually associated with its overdoses but
rare incidence of anaphalctoid reaction after therapeutic doses of
paracetamol is also reported (Ayonrinde & Saker, 2000)
Acute renal failure is not uncommon in paracetamol poisoning and appears
to be unrelated to the degree of liver injury (Mour et al., 2005). However,
there are many conditions which might play a role as influencing factor in
causing renal complications after paracetamol overdoses; they include
concomitant ingestion of nephrotoxic drugs, dehydration, chronic excessive
dosing (von Mach et al., 2005) of acetaminophen, pre-existing renal or liver
disease and multiple organ failure (von Mach et al., 2005).
1.6 Mechanism of action
The mechanism of action of paracetamol analgesia is not fully understood
but involves multiple factors. It is a potent inhibitor of prostaglandin synthesis
within the central nervous system (Piletta et al., 1991).
The prostaglandins are lipid mediators. The formation of prostaglandins is
catalysed by the enzyme cyclooxygenase (COX). COX is a bifunctional
enzyme having both cyclooxygenase and peroxydase activities.
Prostaglandins are involved in physiological functions of the body such as
protection of the stomach mucosa, aggregation of platelets and regulation of
kidney functions however; they also have pathological functions and involve
in the processes of inflammation, pain and fever. In 1971, Sir John Vane
demonstrated for the first time that the mechanism of action of aspirin and
other non-steroidal anti-inflammatory drugs (Graham et al., 1999) is via
inhibition of COX. A second cyclooxygenase (Brune & Neubert, 2001) was
identified in 1991 by Simmon and his colleagues. The inflammatory
mediators upregulate COX-2, increasing prostaglandin formation that
intensify the inflammatory response(Botting, 2006). A third variant of COX

15
designated by some authors as COX-3 has been reported. This enzyme is
produced by cyclooxygenase-1 gene, but retains intron 1 after transcription
and translates into a cyclooxygenase enzyme with 34 additional amino acids.
It is experimented in specific tissues and shows a high concentration in brain
and heart. It is selectively inhibited by analgesic/antipyretic agents like
paracetamol and NSAIDs, however not through COX-2-selective inhibitors.
This enzyme is possibly a central mechanism for the analgesic/antipyretic
effects of paracetamol (Chandrasekharan et al., 2002).
The results obtained from paracetamol could not show systemically an
effective inhibition of peripheral COX. A few positive results were obtained
from in vitro tests (COX-1/COX-2-inhibition) on intact cells or human full
blood. However as opposed to this finding, in vivo tests the peripheral COX-
2-inhibition through paracetamol should be very limited. This difference of in-
vivo- and in-vitro-effects can be due to the higher concentration of peroxides
in inflamed tissue (Ouellet & Percival, 2001).
Some reports suggest the modulation of the serotoninergic system as a
possible mechanism of paracetamol antinociceptive activity and indicate that
the drug may stimulate the activity of descending 5-HT pathways that inhibit
the nociceptive signal transmission in the spinal cord (Bonnefont et al.,
2003). Other studies suggest a supraspinal target for acetaminophen's
antinociceptive action and a central serotonergic mechanism of action for
acetaminophen that is not stimulus-dependent (Pickering et al., 2007).
The central mechanism of action of paracetamol is supported by the
observations that paracetamol crosses the blood-brain barrier rapidly leading
to a high concentration of the drug in cerebrospinal fluid (CSF) and a parallel
time-course of paracetamol concentration in CSF and its analgesic effect
(Bannwarth et al., 1992)
Paracetamol also acts peripherally by blocking impulse generation within the
bradykinin-sensitive chemo receptors responsible for the generation of
nociceptive impulses.
16
Paracetamol is thought to have an analgesic effect by antagonising NMDA
and substance P in the spinal cord. Analgesic effect also involves an
inhibitory action on spinal nitric oxide mechanisms (Clissold, 1986; Piletta et
al., 1991; Bjorkman, 1995).
It is also reported that the analgesic effects of paracetamol involve the
indirect activation of cannabinoid (CB) receptors; and in the central nervous
system (CNS) paracetamol after its deacetylation to its primary amine (p-
aminophenol), conjugate with arachidonic acid to form N-
arachidonoylphenolamine. N-arachidonoylphenolamine is known to act as an
endogenous CB. Thus paracetamol act as a pro-drug and the active form
being the CB (Hogestatt et al., 2005; Bertolini et al., 2006).
1.7 Pharmacokinetics
Paracetamol is rapidly absorbed after oral administration; peak plasma
concentrations are reached in 30-60 minutes. The plasma half life of
paracetamol with therapeutic doses is 2-4 hours but with toxic doses it may
be extended to 4-8 hours. Paracetamol is rather evenly distributed in most of
the body fluids. It is weakly bounded to the plasma proteins, and even in
toxic doses only 20% - 50% of the substance is in a bounded form. By
therapeutic doses, 90% -100% of the substance is found in the urine on first
day of administration. Paracetamol is inactivated in liver, being conjugated to
glucuronic acid (60%), sulphuric acid (35%) and cystines (3%). Minute
quantities of hydroxylated and desacylated metabolites can also be detected.
A small part of paracetamol is by cytochrom-450-dependant N-hydroxylation
metabolised, that leads to the formation of N-acytylbenzochinonimin, a very
reactive intermediate metabolite. This metabolite reacts normally with
sulphydryl groups of glutathione, however after high doses of paracetamol,
the glutathione stores of liver are used up. Under these conditions N-
acytlybenzochinonimin reacts with the sulphydryl groups of liver proteins in
such an extent that liver necrosis can develop (Paul A.Insel, 1940).

17
Studies have shown oral paracetamol to be very effective and good tolerable
for post operative pain management (Weil et al., 2007). However the use of
paracetamol is limited to the treatment of mild to moderate pain or as a
second-line-therapy many days after the operation. At an oral dose of
1000mg paracetamol reaches its ceiling effect in adults. No increase in
analgesic activity occurs by further increasing the doses (Woodbury DM.,
1965), but it does increase the toxicity.
After oral doses the absorption of paracetamol is not uniform but after an i.v.
administration the plasma concentration is predictable.
After an infusion of paracetamol the maximum plasma concentration is much
higher than that after oral doses, so that more of the substance can cross the
blood-brain barrier. It can also explain the lack of Ceiling-Effect(Skoglund &
Pettersen, 1991) after intravenous application of up to 2g of paracetamol.
Intravenous acetaminophen exerted a dose-dependent central
antinociceptive effect (Piguet et al., 1998).
1.8 Current literature
The pharmacologic effects of paracetamol are not directly related to the
concentration of the drug in plasma but they are related rather to an effect
compartment. The concentrations of the effect compartment equate
approximately to cerebrospinal fluid (CSF) (Anderson & Gibb, 2007a). The
time and CSF concentration of paracetamol show a correlation with its
antipyretic effect (Kozer et al., 2007).
Paracetamol permeates readily into the CSF of children. This enables the
rapid central analgesic and antipyretic action of intravenous paracetamol
(Kumpulainen et al., 2007).
Intravenous paracetamol crosses the blood-brain barrier rapidly and the
elimination half-life of paracetamol was shorter in plasma than in CSF.
Antipyretic and probably analgesic effects of Paracetamol are at least in part
centrally mediated. The time-course of paracetamol in CSF may parallel that
of analgesic effect (Bannwarth et al., 1992).
18
Gregoire (Gregoire et al., 2007) showed that after repeated doses of
paracetamol with a maximum dose of 4g/day, the plasma concentrations
remained under the toxic range, indicating the absence of accumulation.
In a study performed on children from neonates to adolescents to determine
the age related changes in plasma and CSF equilibration half-time (Teq) of
paracetamol showed that size rather than blood-brain-barrier maturation
determines Teq changes with age in children (van der Marel et al., 2003).
1.9 Aim of the trial
The aim of the trial was to evaluate, whether similar or comparable
efficacious CSF levels of Perfalgan® could be obtained after an infusion of
1g over 60 minutes as compared to an infusion of 1g over 15 minutes in a
porcine model.

19
2. Methods
2.1 Animals
This experimental procedure was performed on 10 female German domestic
pigs. The approval of the experimental procedure was obtained from the
local Animal Investigation Committee (Regierungspräsidium, Gießen) before
starting the trial. The pigs were kept for one week under a phase of
observation and familiarization, before the start of the experiment, in the
animal experimental lab of the Philipps-University-Marburg.
The pigs were randomized by a computerized random-number generator
either in the group which received the Perfalgan® infusion in 15 minutes or
in the group receiving the Perfalgan® infusion in 60 minutes.
2.2 Pre medication and anaesthesia
The pre medication was done with an intramuscular application of diazepam
1mg/kg, ketamin 20mg/kg and atropine 0.2mg/kg bodyweight.
An intravenous line was taken in one of the dorsal ear veins with a 20 gauge
canula. The induction of anaesthesia was performed with an intravenous
injection of disoprivan 2mg/kg and fentanil 0.5µg/kg bodyweight as repetitive
bolus, followed by tracheal intubation. The animals were ventilated with a
Dräger anaesthesia machine (Sulla 808 V) and an intermittent positive
pressure ventilation mode with a mixture of oxygen in air at an inspiratory
concentration (FiO2) of 50% was used. The anaesthesia was maintained
with a continuous infusion of Disoprivan (Propofol®) 1% at a rate of
10mg/kg/h and sufentanil 1µg/kg/h. No muscle relaxant was used.
2.3 Infusion protocol
The pigs were randomized in two groups. Group one (n=5) received an
infusion of 1g Perfalgan over 15 minutes. In this group (15-min-group),
plasma and CSF samples were taken at 15, 30, 60, 90, 120, 150, 180, and
210 minutes after starting the infusion.
20
Group two (n=5) received an infusion of one gram of Perfalgan over 60
minutes. In this group (60-min-group), the first plasma sample was taken 60
minutes after starting the infusion and repeated after every 30 minutes up to
210 minutes. The CSF samples in this group (60-min-group) were obtained
at 90, 120, 150, 180, and 210 minutes after starting the infusion.
Plasma samples were taken through a central venous catheter. In order to
obtain the CSF, we performed a lumber puncture at the levels of second,
third or fourth lumber vertebra with a 25 gauge spinal needle (Quincke
needle 25G) and kept the needle in place.
The samples were collected into tubes with no additives and transported to
the central laboratory of the University Hospital Marburg immediately after
the procedure.
2.4 Laboratory Methods
The laboratory measurement of paracetamol was performed with Synchron®
- System(s) (Beckman Coulter, Inc.) with the help of acetaminophen (ACTM)
reagent. ACTM reagent is used to measure ACTM concentration by a
particle enhanced turbidimetric inhibition immunoassay method (Newman et
al., 1992). A Particle-bound drug (PBD) binds to the analyte specific antibody
(Ab) resulting in the formation of insoluble aggregates causing light scatter.
Non particle-bound analyte in the patient sample competes with the PBD for
the antibody binding sites, inhibiting the formation of insoluble aggregates.
The System monitors the aggregate formation by measuring the change in
the absorbance at 340 nanometers. This change in absorbance is inversely
proportional to the concentration of ACTM based on a multi-point calibration
curve. The same methods were applied for the measurements of
paracetamol concentrations in plasma and CSF.
The chemical reaction can be shown by the following equation.
Acetaminophen (sample)+PBD+Ab → PBD–Ab(aggregates)+Acetaminophen(sample)- Ab

21
2.4.1 Analytic range
The method for the determination of this analyte provides the following
analytic range.
Table1.
Sample Type Conventional Units S.I. Units
Serum or Plasma 10 – 300 µg/mL 66 – 1986 µmol/L
Legends: S.I.: Standard International; mL: milliliters; µg: microgram; µmol/L: micromole per
liter
2.4.2 Sensitivity
Sensitivity is defined as the lowest measurable concentration which can be
distinguished from zero with 95% confidence.
Sensitivity for ACTM determination is 2.5 µg/mL (16 µmol/L).
2.4.3 Specificity
Most of the substances added at the concentrations from 50 µg/mL to 1000
µg/mL to separate aliquots of a serum pool containing 40 µg/mL
acetaminophen produced no significant interference (within ± 8%).
2.5 Pharmacokinetics
A compartmental analysis of the pharmacokinetic estimates was performed
using the software packet TopFit (Thomae Optimized Pharmacokinetic
Fitting Program), Version 2.0 (Heinzel G. et al., 1993).
2.5.1 Pharmacokinetic model
A two compartment model with first-order elimination and i.v. bolus dosing
was used where plasma is the central compartment and brain is the
peripheral compartment. The two compartment model fits better and is in
accordance with the literature; moreover a three compartment model did not
fit to the data.
22
2.5.2 Weighting and goodness-of-fit
The goodness-of-fit was evaluated by visual inspection of predicted vs.
observed data and from plots of residuals. The individual weighting was
performed for each measured value by the use of the mathematical
algorithm from TopFit.
2.5.3 Measured parameters
Elimination half-life (t 1/2 beta), total clearance (Cl(t)), mean resident time
(MRT), area under the curve (AUC) and volume of distribution at equilibrium
(Vd(ss)) were calculated.
The significance of the values was calculated by using the Mann-Whitney U
test.
23
3. Results
3.1 Age, gender and body weights
This experiment was performed on female pigs. The age of the animals in
both groups were on an average about twelve weeks, with no relevant
difference between the groups. The bodyweights of the animals in both of
the groups were also comparable. The age and bodyweights of the subjects
are shown in the following table below.
Table 2. Age and weight of animals.
Group Age of the animals Weight of the animals
15-min 11 – 13 weeks 38.8 kg – 41.7 kg
60-min 11 – 14 weeks 38.5 kg – 41.9 kg
Legends: kg: kilogram; min: minutes.
3.3 Plasma Levels of paracetamol
The plasma levels of paracetamol were measured in individual animals at
regular intervals.
3.3.1 Individual Plasma Levels in 15-min-group
The values of plasma concentration of Paracetamol obtained from individual
animals in 15-min-group are shown in table 3.

24
Table3. Individual levels of Paracetamol observed in 15-min-group.
Animal
No.
Plasma Levels [mg/l] 15-min-group
15min 30min 60min 90min 120min 150min 180min 210min
1. 32.5 16.0 10.4 10.0
2. 28.7 24.7 22.6 18.7 14.0 14.5 11.8
3. 33.1 27.8 23.2 18.1 16.5 13.0 117
4. 77.3 32.4 24.5 20.2 17.2 14.6
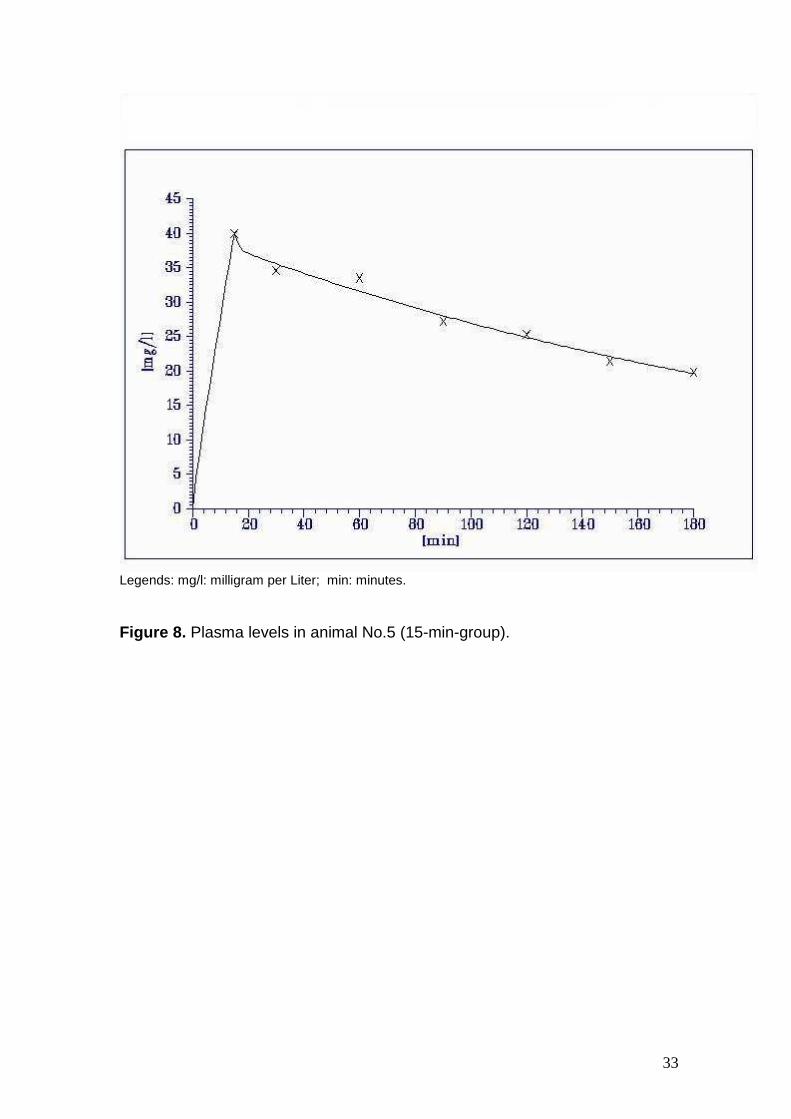
5. 40.0 34.6 33.5 27.2 25.3 21.4 19.8
Legends: min: minutes; mg/l: milligram per liter; No.: Number.
3.3.2 Individual Plasma Levels in 60-min-group.
The plasma levels of paracetamol in individual subjects in the 60-min-group are
listed in table 4.
Table 4. Individual plasma levels of paracetamol in 60-min-group.
Animal
No.
Plasma Levels [mg/l] 60-min-group
15min 30min 60min 90min 120min 150min 180min 210min
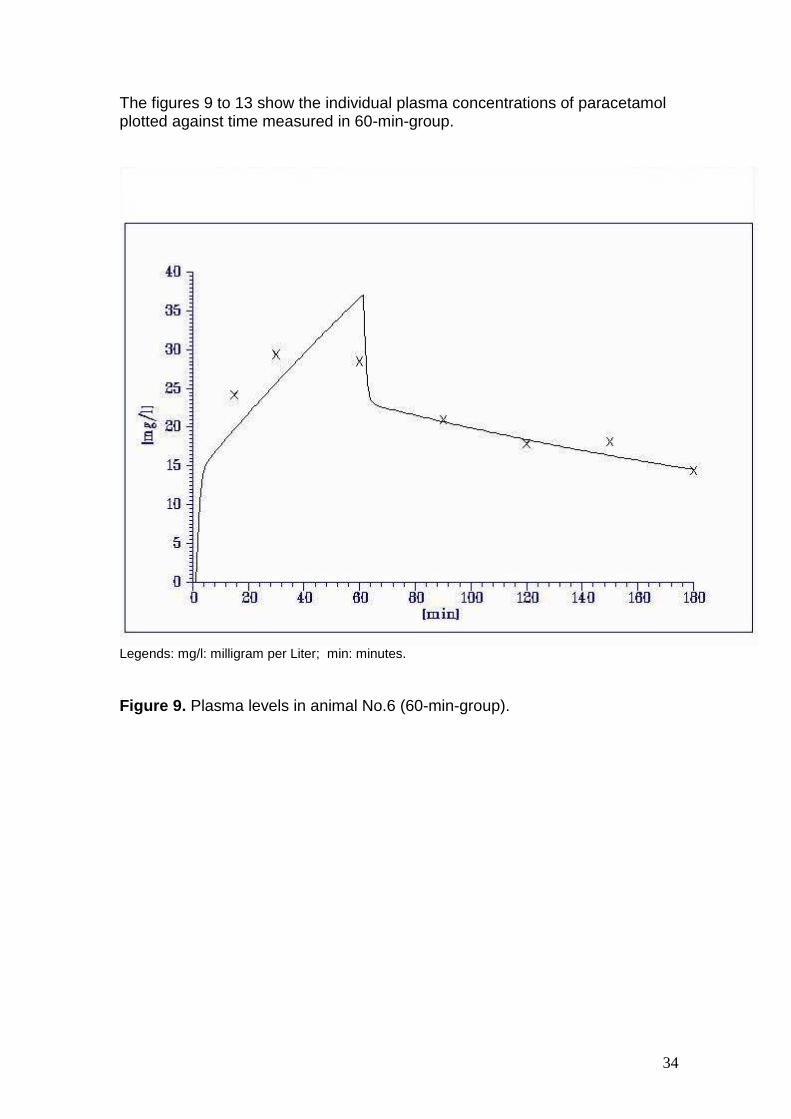
6. 24.2 29.4 28.5 21.0 17.9 18.1 14.4
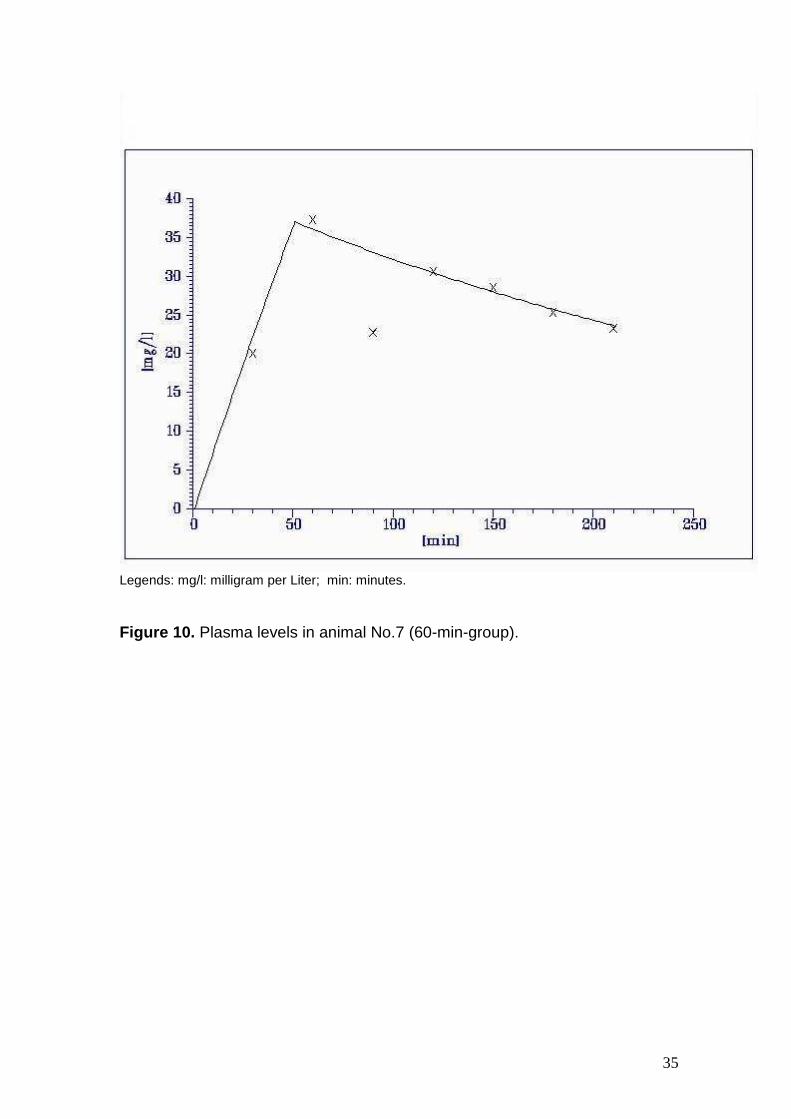
7. 20.1 37.3 22.8 30.6 28.6 25.3 23.3
8. 33.4 37.1 27.0 23.2 20.2 19.2
9. 18.7 24.2 17.2 24.2 20.8 19.2 17.8
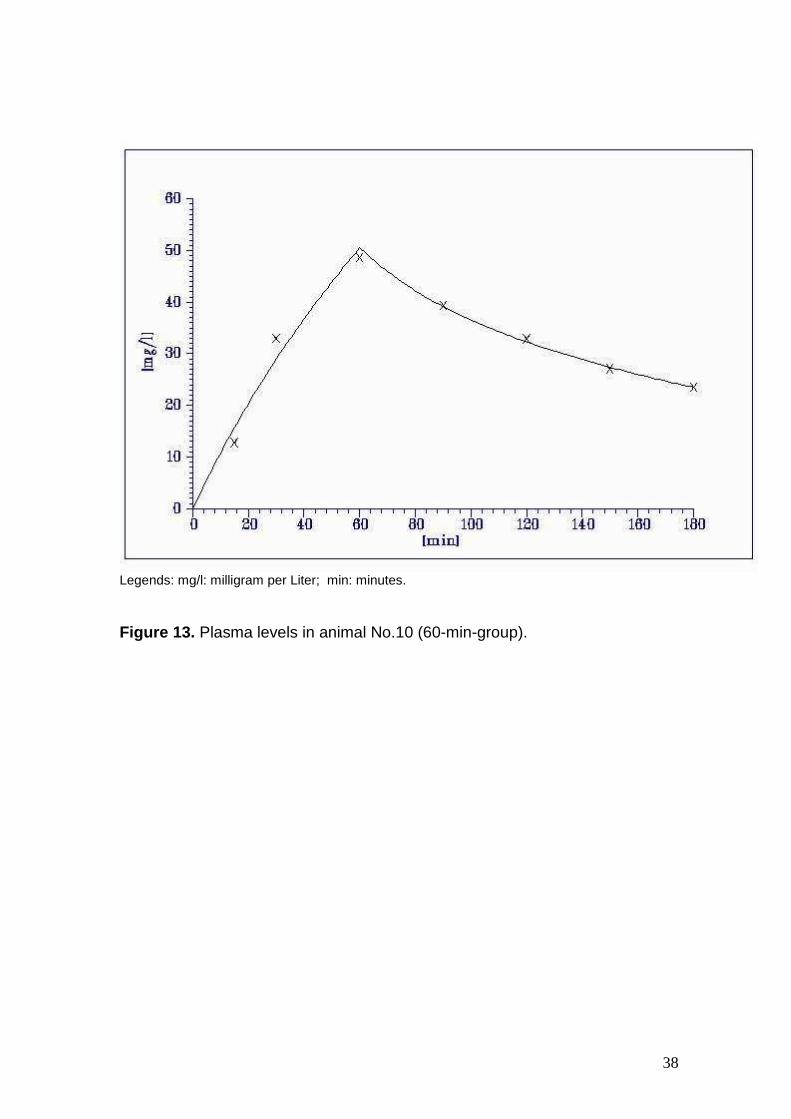
10. 12.8 33.0 48.7 39.4 32.9 27.1 23.5
Legends: min: minutes; mg/l: milligram per liter; No.: Number.
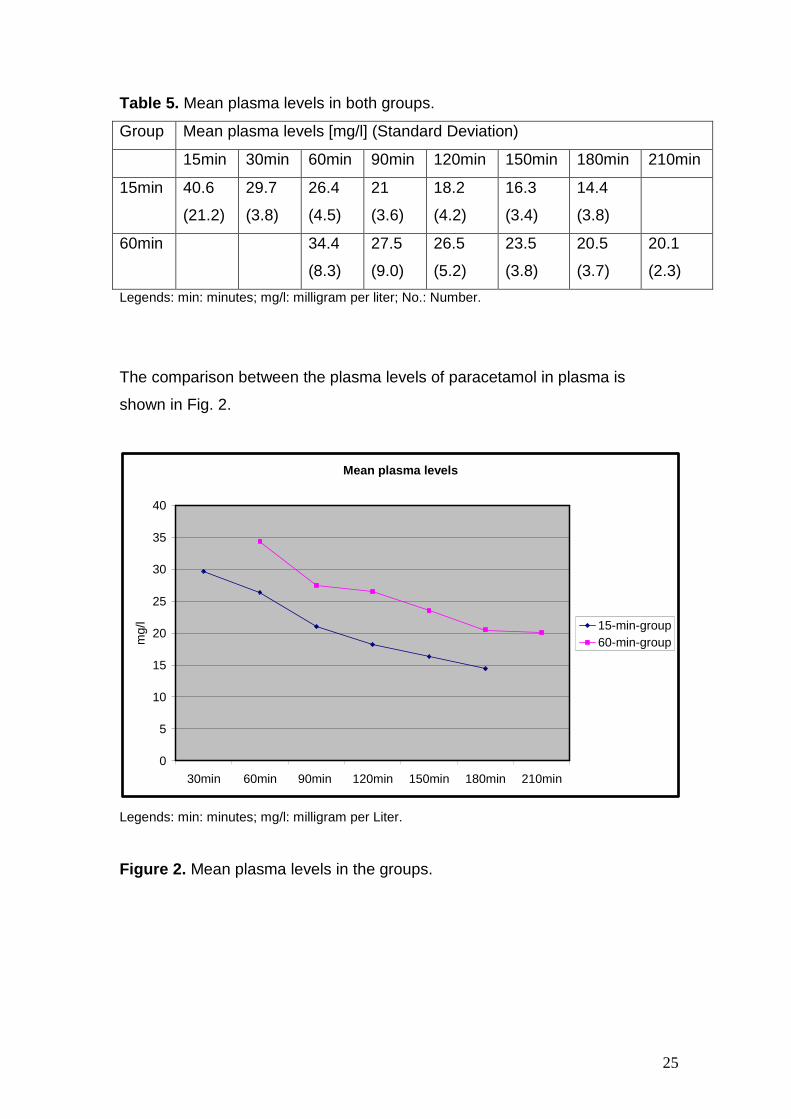
3.3.3 Mean Plasma Levels
The mean plasma levels were higher in 60-min-group as compared to those in
the 15-min-group. The obtained data is listed in the table 5.
25
Table 5. Mean plasma levels in both groups.
Group Mean plasma levels [mg/l] (Standard Deviation)
15min 30min 60min 90min 120min 150min 180min 210min
15min
40.6
(21.2)
29.7
(3.8)
26.4
(4.5)
21
(3.6)
18.2
(4.2)
16.3
(3.4)
14.4
(3.8)
60min
34.4
(8.3)
27.5
(9.0)
26.5
(5.2)
23.5
(3.8)
20.5
(3.7)
20.1
(2.3)
Legends: min: minutes; mg/l: milligram per liter; No.: Number.
The comparison between the plasma levels of paracetamol in plasma is
shown in Fig. 2.
Mean plasma levels
0
5
10
15
20
25
30
35
40
30min 60min 90min 120min 150min 180min 210min
mg/
l 15-min-group60-min-group
Legends: min: minutes; mg/l: milligram per Liter.
Figure 2. Mean plasma levels in the groups.
26
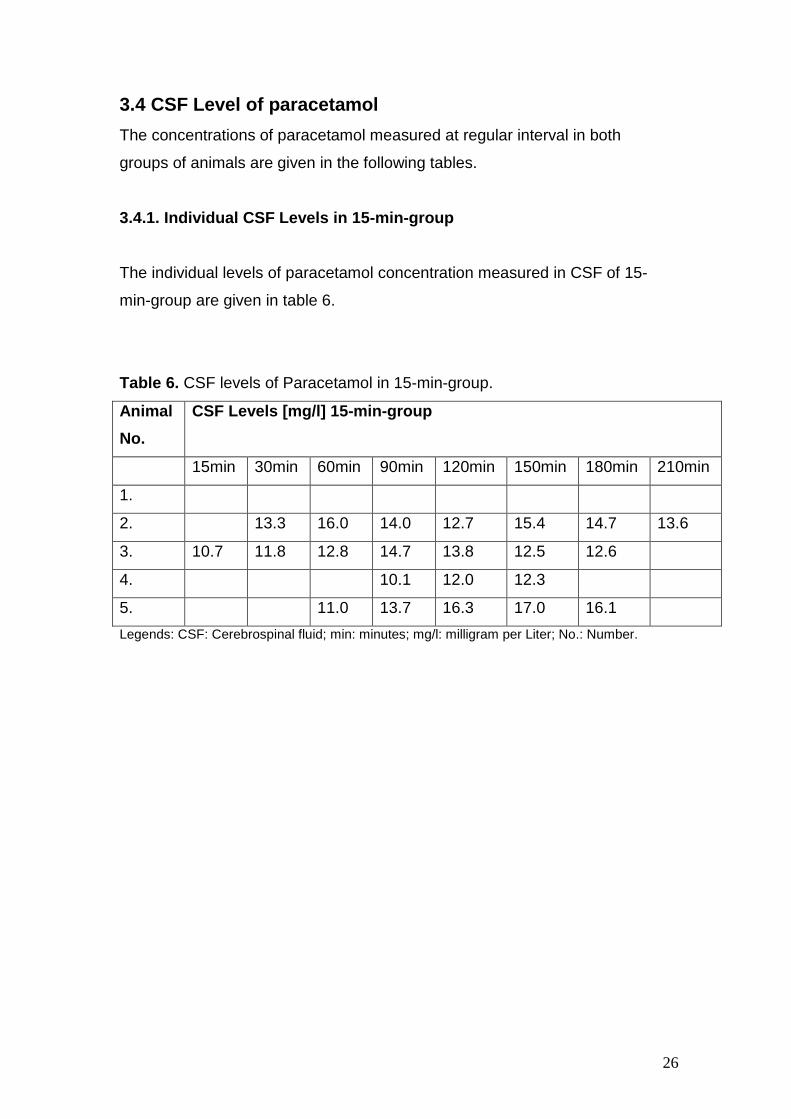
3.4 CSF Level of paracetamol
The concentrations of paracetamol measured at regular interval in both
groups of animals are given in the following tables.
3.4.1. Individual CSF Levels in 15-min-group
The individual levels of paracetamol concentration measured in CSF of 15-
min-group are given in table 6.
Table 6. CSF levels of Paracetamol in 15-min-group.
Animal
No.
CSF Levels [mg/l] 15-min-group
15min 30min 60min 90min 120min 150min 180min 210min
1.
2. 13.3 16.0 14.0 12.7 15.4 14.7 13.6
3. 10.7 11.8 12.8 14.7 13.8 12.5 12.6
4. 10.1 12.0 12.3
5. 11.0 13.7 16.3 17.0 16.1
Legends: CSF: Cerebrospinal fluid; min: minutes; mg/l: milligram per Liter; No.: Number.
27
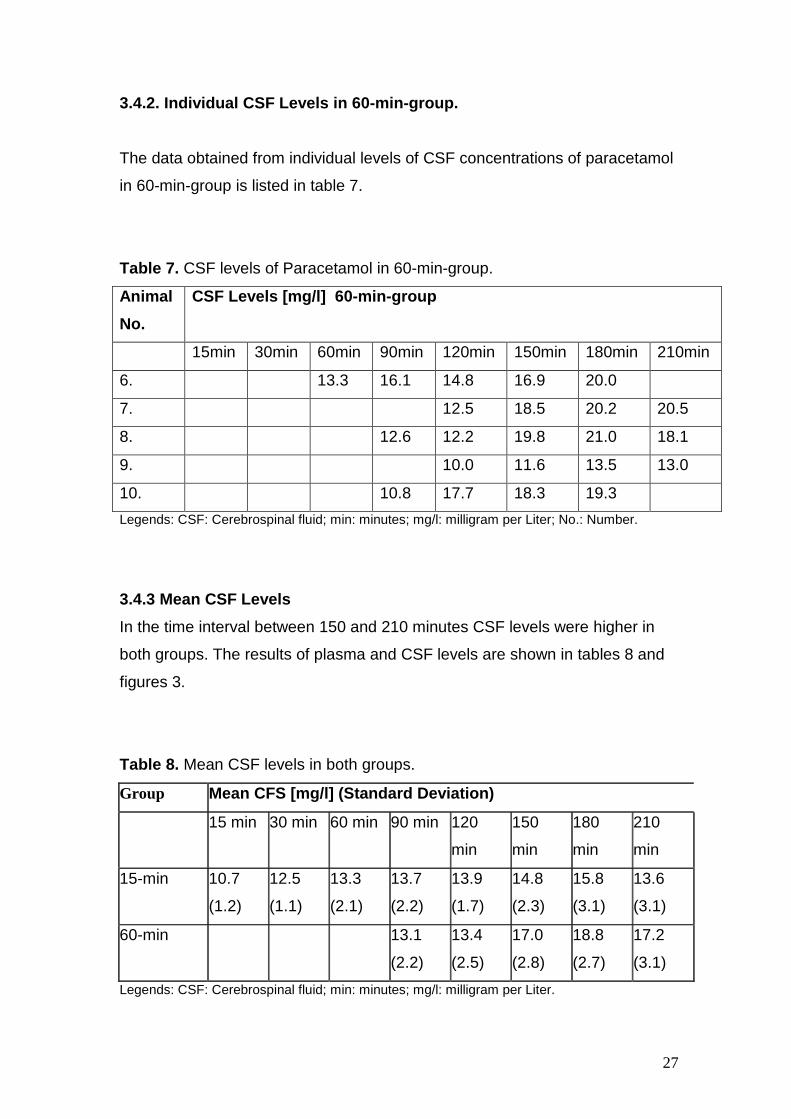
3.4.2. Individual CSF Levels in 60-min-group.
The data obtained from individual levels of CSF concentrations of paracetamol
in 60-min-group is listed in table 7.
Table 7. CSF levels of Paracetamol in 60-min-group.
Animal
No.
CSF Levels [mg/l] 60-min-group
15min 30min 60min 90min 120min 150min 180min 210min
6. 13.3 16.1 14.8 16.9 20.0
7. 12.5 18.5 20.2 20.5
8. 12.6 12.2 19.8 21.0 18.1
9. 10.0 11.6 13.5 13.0
10. 10.8 17.7 18.3 19.3
Legends: CSF: Cerebrospinal fluid; min: minutes; mg/l: milligram per Liter; No.: Number.
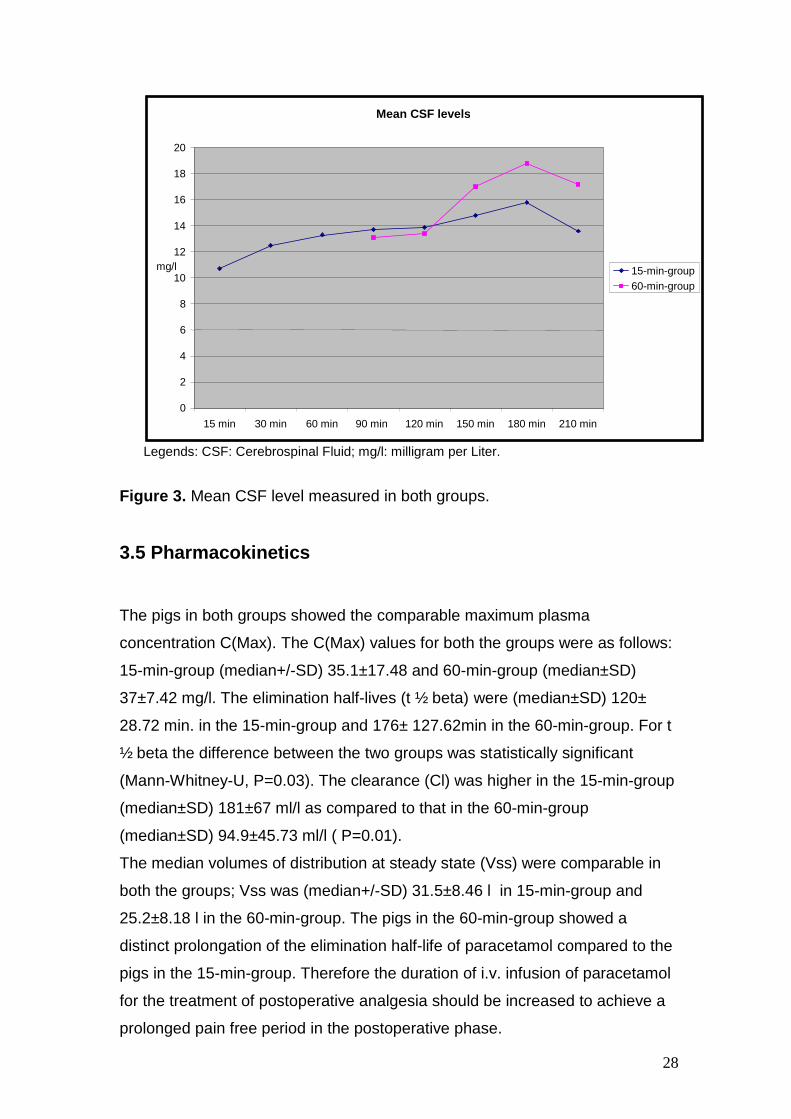
3.4.3 Mean CSF Levels
In the time interval between 150 and 210 minutes CSF levels were higher in
both groups. The results of plasma and CSF levels are shown in tables 8 and
figures 3.
Table 8. Mean CSF levels in both groups.
Group Mean CFS [mg/l] (Standard Deviation)
15 min 30 min 60 min 90 min 120
min
150
min
180
min
210
min
15-min 10.7
(1.2)
12.5
(1.1)
13.3
(2.1)
13.7
(2.2)
13.9
(1.7)
14.8
(2.3)
15.8
(3.1)
13.6
(3.1)
60-min 13.1
(2.2)
13.4
(2.5)
17.0
(2.8)
18.8
(2.7)
17.2
(3.1)
Legends: CSF: Cerebrospinal fluid; min: minutes; mg/l: milligram per Liter.
28
Legends: CSF: Cerebrospinal Fluid; mg/l: milligram per Liter.
Figure 3. Mean CSF level measured in both groups.
3.5 Pharmacokinetics
The pigs in both groups showed the comparable maximum plasma
concentration C(Max). The C(Max) values for both the groups were as follows:
15-min-group (median+/-SD) 35.1±17.48 and 60-min-group (median±SD)
37±7.42 mg/l. The elimination half-lives (t ½ beta) were (median±SD) 120±
28.72 min. in the 15-min-group and 176± 127.62min in the 60-min-group. For t
½ beta the difference between the two groups was statistically significant
(Mann-Whitney-U, P=0.03). The clearance (Cl) was higher in the 15-min-group
(median±SD) 181±67 ml/l as compared to that in the 60-min-group
(median±SD) 94.9±45.73 ml/l ( P=0.01).
The median volumes of distribution at steady state (Vss) were comparable in
both the groups; Vss was (median+/-SD) 31.5±8.46 l in 15-min-group and
25.2±8.18 l in the 60-min-group. The pigs in the 60-min-group showed a
distinct prolongation of the elimination half-life of paracetamol compared to the
pigs in the 15-min-group. Therefore the duration of i.v. infusion of paracetamol
for the treatment of postoperative analgesia should be increased to achieve a
prolonged pain free period in the postoperative phase.
Mean CSF levels
0
2
4
6
8
10
12
14
16
18
20
15 min 30 min 60 min 90 min 120 min 150 min 180 min 210 min
mg/l 15-min-group 60-min-group
29
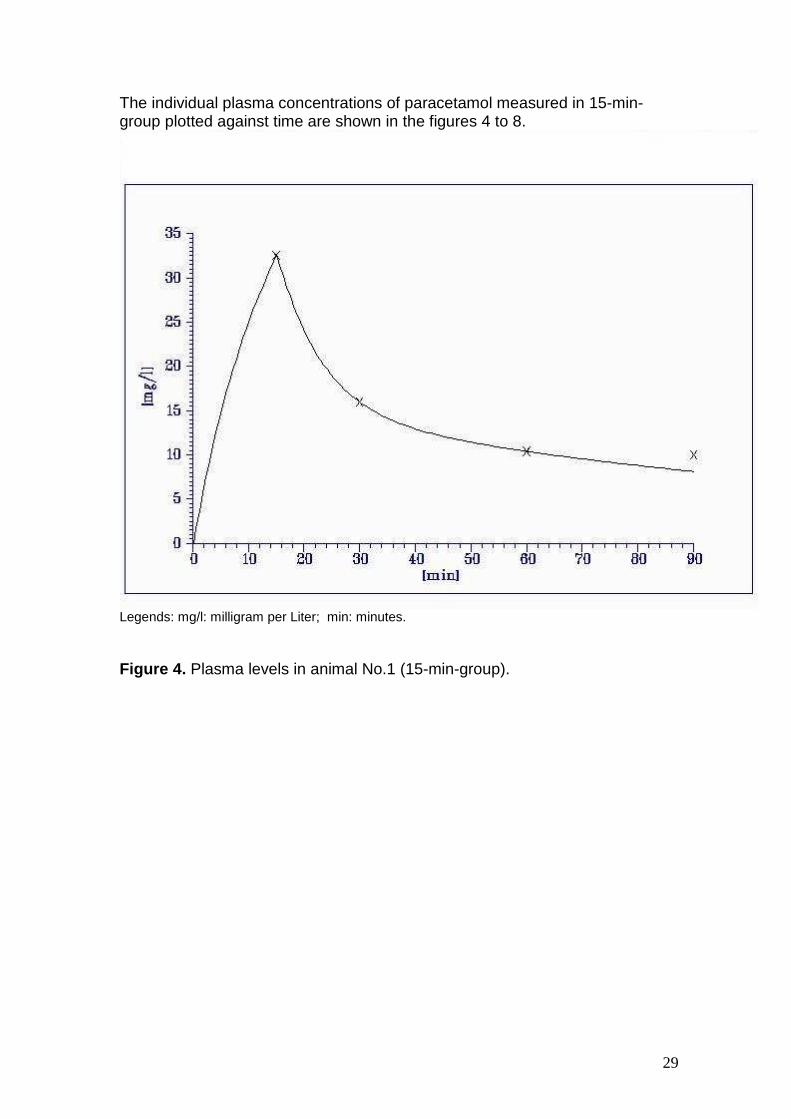
The individual plasma concentrations of paracetamol measured in 15-min-group plotted against time are shown in the figures 4 to 8.
Legends: mg/l: milligram per Liter; min: minutes.
Figure 4. Plasma levels in animal No.1 (15-min-group).
30
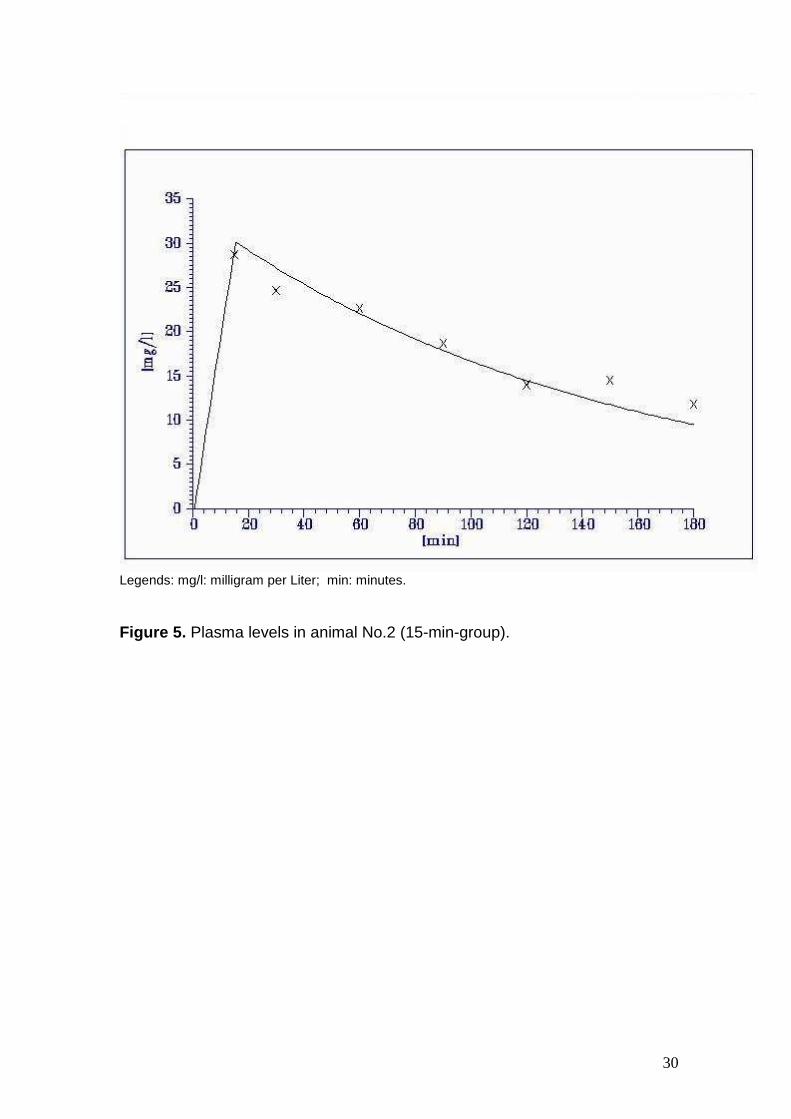
Legends: mg/l: milligram per Liter; min: minutes.
Figure 5. Plasma levels in animal No.2 (15-min-group).

31
Legends: mg/l: milligram per Liter; min: minutes.
Figure 6. Plasma levels in animal No.3 (15-min-group).
32
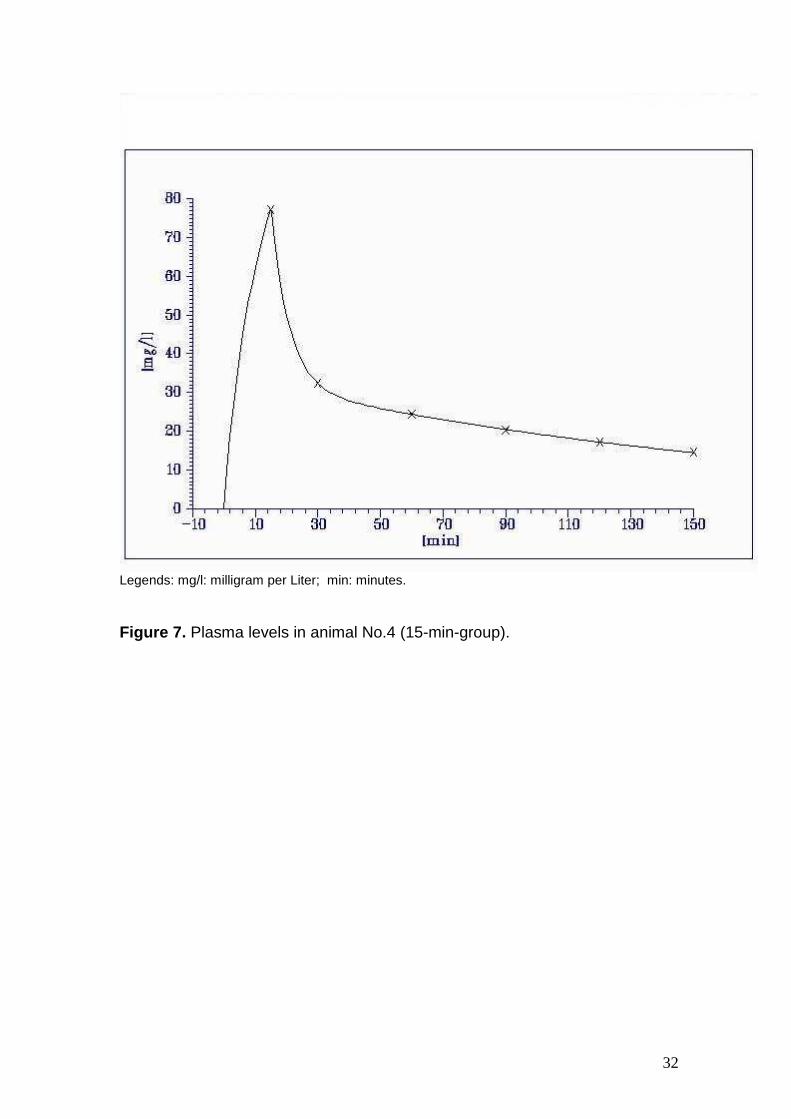
Legends: mg/l: milligram per Liter; min: minutes.
Figure 7. Plasma levels in animal No.4 (15-min-group).
33
Legends: mg/l: milligram per Liter; min: minutes.
Figure 8. Plasma levels in animal No.5 (15-min-group).
34
The figures 9 to 13 show the individual plasma concentrations of paracetamol plotted against time measured in 60-min-group.
Legends: mg/l: milligram per Liter; min: minutes.
Figure 9. Plasma levels in animal No.6 (60-min-group).
35
Legends: mg/l: milligram per Liter; min: minutes.
Figure 10. Plasma levels in animal No.7 (60-min-group).

36
Legends: mg/l: milligram per Liter; min: minutes.
Figure 11. Plasma levels in animal No.8 (60-min-group).

37
Legends: mg/l: milligram per Liter; min: minutes.
Figure 12. Plasma levels in animal No.9 (60-min-group).
38
Legends: mg/l: milligram per Liter; min: minutes.
Figure 13. Plasma levels in animal No.10 (60-min-group).
39
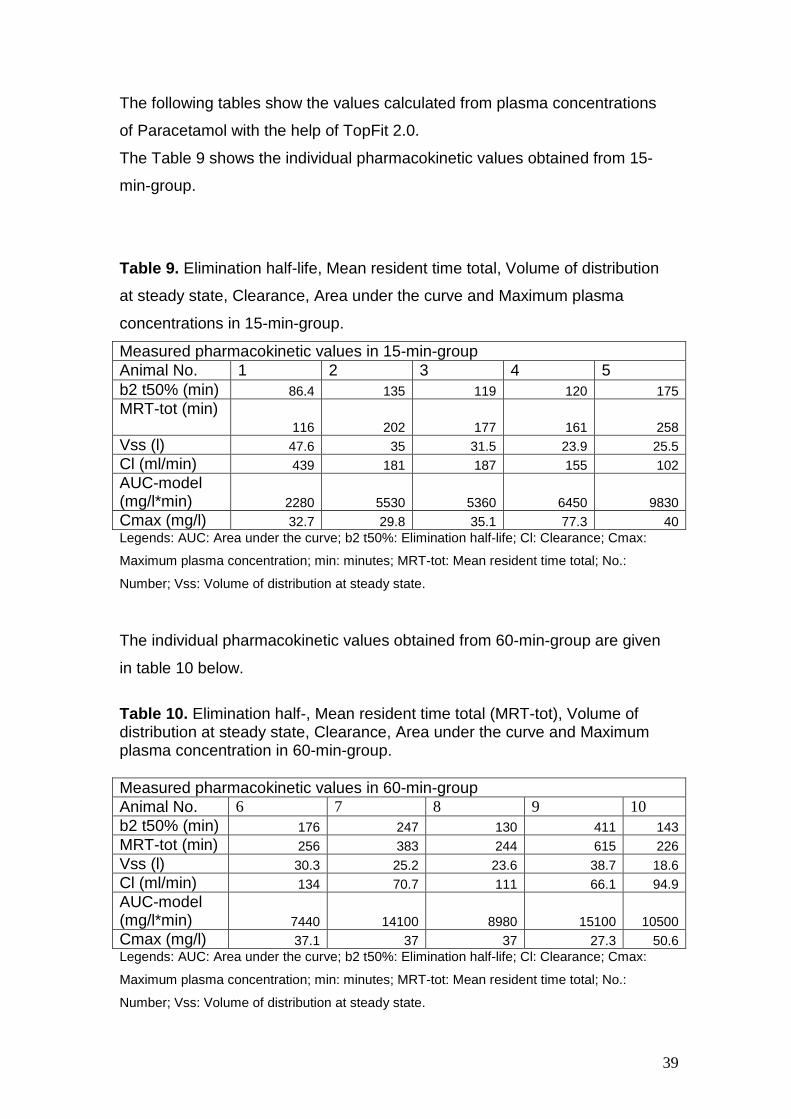
The following tables show the values calculated from plasma concentrations
of Paracetamol with the help of TopFit 2.0.
The Table 9 shows the individual pharmacokinetic values obtained from 15-
min-group.
Table 9. Elimination half-life, Mean resident time total, Volume of distribution
at steady state, Clearance, Area under the curve and Maximum plasma
concentrations in 15-min-group.
Measured pharmacokinetic values in 15-min-group Animal No. 1 2 3 4 5 b2 t50% (min) 86.4 135 119 120 175 MRT-tot (min)
116 202 177 161 258 Vss (l) 47.6 35 31.5 23.9 25.5 Cl (ml/min) 439 181 187 155 102 AUC-model (mg/l*min) 2280 5530 5360 6450 9830 Cmax (mg/l) 32.7 29.8 35.1 77.3 40 Legends: AUC: Area under the curve; b2 t50%: Elimination half-life; Cl: Clearance; Cmax:
Maximum plasma concentration; min: minutes; MRT-tot: Mean resident time total; No.:
Number; Vss: Volume of distribution at steady state.
The individual pharmacokinetic values obtained from 60-min-group are given
in table 10 below.
Table 10. Elimination half-, Mean resident time total (MRT-tot), Volume of distribution at steady state, Clearance, Area under the curve and Maximum plasma concentration in 60-min-group. Measured pharmacokinetic values in 60-min-group Animal No. 6 7 8 9 10 b2 t50% (min) 176 247 130 411 143 MRT-tot (min) 256 383 244 615 226 Vss (l) 30.3 25.2 23.6 38.7 18.6 Cl (ml/min) 134 70.7 111 66.1 94.9 AUC-model (mg/l*min) 7440 14100 8980 15100 10500 Cmax (mg/l) 37.1 37 37 27.3 50.6 Legends: AUC: Area under the curve; b2 t50%: Elimination half-life; Cl: Clearance; Cmax:
Maximum plasma concentration; min: minutes; MRT-tot: Mean resident time total; No.:
Number; Vss: Volume of distribution at steady state.
40
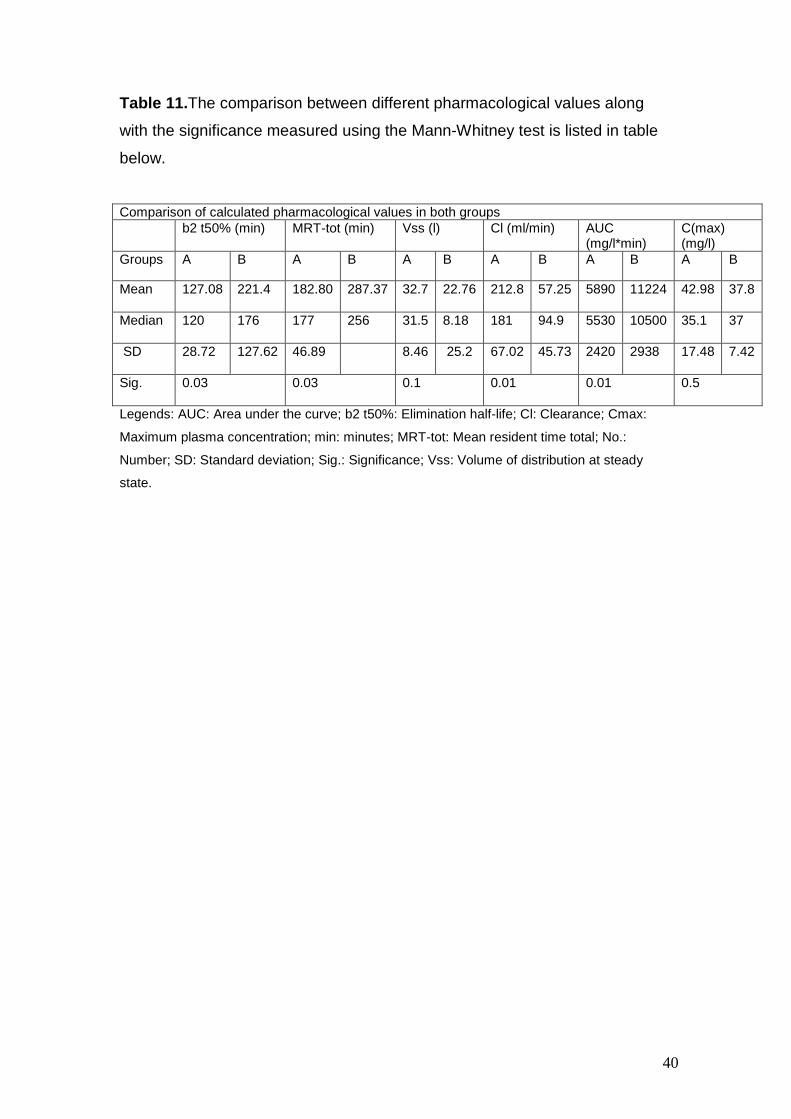
Table 11.The comparison between different pharmacological values along
with the significance measured using the Mann-Whitney test is listed in table
below.
Comparison of calculated pharmacological values in both groups b2 t50% (min) MRT-tot (min) Vss (l) Cl (ml/min) AUC
(mg/l*min) C(max) (mg/l)
Groups A B A B A B A B A B A B
Mean 127.08 221.4
182.80 287.37
32.7 22.76
212.8 57.25
5890 11224
42.98 37.8
Median 120 176
177 256
31.5 8.18
181 94.9
5530 10500
35.1 37
SD 28.72 127.62
46.89 8.46 25.2
67.02 45.73
2420 2938
17.48 7.42
Sig.
0.03 0.03 0.1 0.01 0.01 0.5
Legends: AUC: Area under the curve; b2 t50%: Elimination half-life; Cl: Clearance; Cmax:
Maximum plasma concentration; min: minutes; MRT-tot: Mean resident time total; No.:
Number; SD: Standard deviation; Sig.: Significance; Vss: Volume of distribution at steady
state.

41
4. Discussion
4.1 Summary of the Results
We studied the pharmacokinetics of intravenous paracetamol using different
infusion rates. One of the two groups (n=5) received 1g of paracetamol over
15 minutes and the other group (n=5) over 60 minutes.
The results show that in the time interval between 60 and 180 minutes after
starting the infusion, the plasma levels of paracetamol were found to be higher
in the 60-min-group as compared to those in the 15-min-group. Similarly the
levels of paracetamol in CSF in the time interval between 150 to 210 minutes
were higher in the 60-min-group as compared to those in the 15-min-group.
The elimination half-life of the drug was found to be longer (median+/-SD)
176± 127.62min in 60-minutes-group as compared to 120± 28.72 min in 15-
min-group (p<0.03). The maximum plasma concentration (C max) was
(median+/-SD) 35.1± 17.48mg/lin the 15-min-group and 37± 7.42 mg/l in the
60-min-group (p<0.5). The clearance (Cl) was higher in the 15-min-group
[(median±SD) 181+/-67.02 ml/l] as compared to that in the 60-min-group
[94.9±45.73 ml/l]. The difference between the clearance was significant
(p<0.01). The volumes of distribution at steady state (Vss) were (median±SD)
31.5±8.46 l in 15-min-group and 25.2±8.18 l in the 60-min-group (p<0.1).
4.2 Comparison with current literature
The response to the administration of paracetamol is not directly related to the
concentrations of the drug in blood but rather to an effect compartment. There
exists a time delay before the drug reaches the effect compartment and the
equilibration half-time (Teq) is approximately 1h. The effect compartment does
not have real measurable concentrations, but concentrations equate
approximately to those observed in the CSF. The speed of onset may be
shortened by giving a lager initial dose or improving the absorption
characteristics (Anderson & Gibb, 2007b). In our experiment after the i.v.
42
application of 1g paracetamol the elimination half-life of paracetamol in plasma
was 120± 28.72 min. and after the application of the drug (1g) over 60 minutes
it increased to 176±127.62min.The increase in the elimination half-life achieved
after an intravenous infusion of paracetamol applied over a longer period of
time results in a prolonged presence of the drug in plasma and effect
compartment leading to an increased duration of its effect.
A recent study (Juhl et al., 2006) performed to demonstrate the analgesic
efficacy of intravenous paracetamol 2 g as compared to the recommended
dose of 1 g reports that the analgesic efficacy of a 2 g starting dose of IV
paracetamol was superior over the recommended dose of 1 g in terms of
magnitude and duration of analgesic effect for postoperative pain following
third molar surgery, with no significant difference between groups regarding
safety. Beck (Beck et al., 2000) also demonstrated that after the rectal
application of paracetamol the analgesic doses of paracetamol can only be
achieved after administration of twice the conventional dose. The application
of higher doses results in higher levels of the drug in plasma and also in the
effect compartment. That may result in a longer elimination half-life leading to
the required analgesic effects.
The results obtained from our study indicate that the dosage and time of
application of i.v. paracetamol to achieve higher and prolonged concentrations
of the substance in plasma and effect compartment needs optimization.
Increasing the initial dose of i.v. paracetamol followed by increased repeated
doses is reported to be beneficial for the immediate postoperative period.
In a study Gregoire (Gregoire et al., 2007) and colleagues demonstrated that a
higher dose could be of interest in the immediate postoperative period when
the pain is maximal. They used an initial dose of 2g i.v. paracetamol followed
by 1g doses every 6 h, leading to a total of 5 g in 24 h. Following the first 15-
min i.v. administration of paracetamol 2 g, plasma concentrations ranged from
67.9±21.8 µ/ml (peak plasma concentration (C(max)) at the end of infusion) to
6.2±2.3 µ/ml (trough plasma concentration (C(min)) measured just before the
next infusion). After the repeated 1g infusions, the plasma concentrations were
approximately 35% lower than that measured after 2g,
43
In our study the median values of C(max) were 35,1mg/l in the 15-min-group
and 37mg/l in the 60-min-group. The median values of C(max) of paracetamol
in both groups were comparable and we used a similar dose of 1g in both the
groups and the mode of application was i.v. infusion. The administration of the
drug as multiple bolus doses or as an infusion over longer period of time may
result in the presence of the drug in plasma for a prolonged time.
Previous reports indicate that the analgesic effects of paracetamol correlate
with an effect compartment rather than to the plasma levels of the drug.
Bannwarth and colleagues (Bannwarth et al., 1992) measured the plasma and
CSF concentrations of paracetamol after a short intravenous infusion of
Propacetamol. The maximum CSF concentrations were observed at the 4th
hour and the elimination half-life was calculated to be shorter in plasma (2.4h)
than in CSF (3.2h), suggesting a possible parallel time course of the drug in
CSF to the analgesic effect.
Our results also support an effect compartment and fit in a two compartment
model for the pharmacokinetics of paracetamol and the maximum CSF
concentrations of paracetamol were observed at the 3rd hour. The mean
elimination half-life of the drug in plasma was found to be 2.1h and 3.6h in 15-
min-group and 60-min-group respectively.
Bannwarth applied a single dose of 1g paracetamol (Propacetamol 2g) over a
period of 3 minutes and plasma and CSF samples were taken from 20
minutes to 12hours. Although we used a different infusion rate and the
experiment was carried out on animals, but comparable results were obtained.
According to our results the application of i.v. paracetamol over 60 minutes
instead of 15 minutes results in the presence of the drug in the effect
compartment for a prolonged period and may produce a better pain
management in the postoperative phase.
44
4.3 Impact of the results
The adequacy of postoperative pain control is one of the most important
factors in determining when a patient can be safely discharged from the
outpatient facility ((Chung et al., 1997).
The opioid analgesics have been the main drugs used for the treatment of peri
operative pain. However, large doses of opioid analgesics can be associated
with an increased incidence of the postoperative complications e.g. respiratory
depression, sedation, postoperative nausea and vomiting, pruritus, difficulty
voiding, and ileus. It results in a delayed discharge from the hospital and with
that associated increased total cost of treatment. The intraoperative use of
large bolus doses or continuous infusions of potent short-acting opioid
analgesics (e.g., alfentanil and remifentanil) may actually increase
postoperative pain as a result of their rapid elimination and the development of
acute tolerance (Guignard et al., 2000).
Therefore the use of non-opioid analgesics as an adjuvant or as a mono
therapy during the perioperative period is getting increasing popularity among
the anaesthesiologists practicing in the ambulatory environment.
The inadequate treatment of postoperative pain contributes to the patients
suffering and may prevent rapid recovery and rehabilitation. An understanding
and application of the basic principles of pain management can provide
adequate analgesia for the majority of postoperative patients (d'Amours &
Ferrante, 1996). The optimisation of postoperative pain treatment is therefore
an important part of the therapeutic management.
Considerations regarding the side effects of the individual analgesics like
nausea, and respiratory depression lead to the inadequate doses of
analgesics resulting in unnecessary patient suffering. In a French study
performed in 96 clinics it was noted that 46.4% of postoperative patients
suffered from severe pain; due partly to the sub therapeutic doses of opioid
analgesics in at least 10% of patients and over half of the patients the interval
between doses was too long (Poisson-Salomon et al., 1996).
45
The onset of analgesic action is an important factor when characterizing the
clinical efficacy of analgesics, especially in the management of postoperative
pain (Laska et al., 1991).
The improvement in the management of postoperative pain leads to the
reduction of postoperative morbidity. By reducing the complications
associated with inadequate postoperative pain management, the hospital stay
and the total cost of treatment can be reduced (d'Amours & Ferrante, 1996;
Kehlet, 1997).
The presently available data includes the studies showing the optimization of
postoperative pain management. However, none of them show the
optimization of analgesia through different infusion protocols. The studies
concerned with the pharmacokinetics of paracetamol are still to be confirmed
in human and animal models.
The evaluation of the pharmacokinetics of i.v. paracetamol in our study show
that the application of 1g of the drug as an intravenous infusion over 60
minutes as compared to that over15 minutes is associated with a prolonged
elimination half-life of the drug in plasma and higher levels of the drug in CSF.
As current studies suggest CSF to be the effect compartment for the analgesic
effects of paracetamol (Bannwarth et al 1992); optimisation of the intravenous
application to obtain an increased CSF concentration may be of value for a
better utilization of pharmacological effects of the drug after intravenous
application; especially for postoperative analgesia.
4.4 Limitations
The study did not include the measurement of analgesic or antipyretic effects
and the results obtained from an animal experiment model may not be applied
to a human model but the data obtained from animal experiments may be
beneficial for further studies in human.
The flow of CSF was reduced to a very low level after 210 minutes that no
further collection of CSF samples was possible. Similarly the samples of

46
plasma were not taken for a longer period than 210 minutes. The
concentration of paracetamol measured with this method was not possible
under the limit of the used procedure.
For the most exact calculation of half-life kinetics long lasting measures of
blood concentrations of the drug till it reaches the limits of the detection are
useful.
4.5 Conclusion and perspectives
The infusion of 1g i.v. paracetamol over a 60 minutes period instead of
recommended time of 15 minutes results in a higher plasma and CSF
concentration. Pharmacokinetic suggests that, the analgesic effect of i.v.
paracetamol for an infusion over 60 minutes is superior to the recommended
infusion over 15 minutes. The infusion protocol for patients´ treatment should
be scrutinized in randomized clinical trials.
According to the results obtained from our study, the application of i.v.
paracetamol for a longer duration of time for example over 2 hours instead of
15 minutes may result in a longer period of analgesia. Increasing the dose of
paracetamol from 1g to 2g may also produce better pain management.
Further randomized clinical studies in humans should be performed to confirm
the results achieved from animal trials.

47
5 Abstract
Introduction:
Perfalgan® is a newly developed; direct inject able form of paracetamol. The
recommended infusion rate for Perfalgan® is 1g over 15 minutes. This
recommendation is based on the rationale that paracetamol acts centrally and
to achieve an efficacious cerebrospinal fluid (CSF) level of paracetamol a high
gradient between plasma and liquor is essential.
Aim of the trial:
Aim of the present investigation was to evaluate, whether similar efficacious
CSF levels of Perfalgan® could be obtained after an infusion rate of 1g over 60
minutes.
Methods:
Experiments were performed in 10 anaesthetized female German domestic
pigs. The pigs were randomized either in the group with an infusion rate of 15
minutes (n=5) or 60 minutes (n=5). In the 15-minutes-group plasma and CSF
samples were taken 15, 30, 60, 90 120, 150, 180, and 210 minutes after
starting the infusion. In the 60-minutes-group plasma samples were taken 60
minutes after starting the infusion and every 30 minutes up to 210 minutes.
CSF samples were obtained after 90, 120, 150, 180, and 210 minutes.
Results:
There were no differences between the groups regarding age (15-min-group:
11 - 13 weeks; 60-min-group: 11 - 14 weeks) and body weight (15-min-group:
38.8 – 41.7 kg; 60-min-group: 38.5 – 41.9 kg).
The elimination half-life (t ½ beta) of the drug was found to be longer in 60-
minutes-group [(median±SD) 176± 127.62min] as compared to that in 15-min-
group [120± 28.72 min]. The clearance (Cl) was lower in the 60-min-group
[(median±SD) 94.9±45.73 ml/l)] as compared to that in the15-min-group
[181±67 ml/l]. The values of maximum plasma concentration (C max) were
(median±SD) 35.1± 17.48 in the 15-min-group and 37± 7.42 mg/l in the 60-
min-group. The volumes of distribution at steady state (Vss) were (median+/-
SD) 31.5±8.46 l in 15-min-group and 25.2±8.18 l in the 60-min-group.
Our results indicate that plasma levels are higher in the 60-minutes-group as
compared to that in 15-minutes-group in the time interval between 60 and 180
48
minutes after starting the infusion. In the time interval between 90 and 210
minutes CSF levels were similar in both groups.
Conclusion:
The intravenous infusion of 1g paracetamol over a period of 60 minutes
instead of recommended duration of 15 minutes results in higher plasma and
CSF concentrations. Pharmacokinetics suggests that, the analgesic effect of
paracetamol for an infusion over 60 minutes is superior to the recommended
infusion over 15 minutes. The infusion protocol for patients´ treatment should
be scrutinized in randomized clinical trial
49
Reference List
Anderson BJ & Gibb IA (2007) Paracetamol (acetaminophen) pharmacodynamics; interpreting the plasma concentration. Arch Dis Child.
Ayonrinde OT & Saker BM (2000) Anaphylactoid reactions to paracetamol. Postgrad Med J 76, 501-502.
Back DJ & Rogers SM (1987) Review: first-pass metabolism by the gastrointestinal mucosa. Aliment Pharmacol Ther 1, 339-357.
Bannwarth B, Netter P, Lapicque F, Gillet P, Pere P, Boccard E, Royer RJ & Gaucher A (1992b) Plasma and cerebrospinal fluid concentrations of paracetamol after a single intravenous dose of propacetamol. Br J Clin Pharmacol 34, 79-81.
Bannwarth B & Pehourcq F (2003) [Pharmacologic basis for using paracetamol: pharmacokinetic and pharmacodynamic issues]. Drugs 63 Spec No 2 , 5-13.
Beck DH, Schenk MR, Hagemann K, Doepfmer UR & Kox WJ (2000a) The pharmacokinetics and analgesic efficacy of larger dose rectal acetaminophen (40 mg/kg) in adults: a double-blinded, randomized study. Anesth Analg 90, 431-436.
Benson GD (1983) Acetaminophen in chronic liver disease. Clin Pharmacol Ther 33, 95-101.
Bertolini A, Ferrari A, Ottani A, Guerzoni S, Tacchi R & Leone S (2006) Paracetamol: new vistas of an old drug. CNS Drug Rev 12, 250-275.
Binhas M, Decailliot F, Rezaiguia-Delclaux S, Suen P, Dumerat M, Francois V, Combes X & Duvaldestin P (2004) Comparative effect of intraoperative propacetamol versus placebo on morphine consumption after elective reduction mammoplasty under remifentanil-based anesthesia: a randomized control trial [ISRCTN71723173]. BMC Anesthesiol 4, 6.
Bjorkman R (1995) Central antinociceptive effects of non-steroidal anti-inflammatory drugs and paracetamol. Experimental studies in the rat. Acta Anaesthesiol Scand Suppl 103, 1-44.
Bonnefont J, Courade JP, Alloui A & Eschalier A (2003) [Antinociceptive mechanism of action of paracetamol]. Drugs 63 Spec No 2 , 1-4.
Botting RM (2006) Inhibitors of cyclooxygenases: mechanisms, selectivity and uses. J Physiol Pharmacol 57 Suppl 5 , 113-124.
Brodie BB & Axelrod J (1948) THE FATE OF ACETANILIDE IN MAN. J Pharmacol Exp Ther 94, 29-38.
50
Brune K & Neubert A (2001) Pharmacokinetic and pharmacodynamic aspects of the ideal COX-2 inhibitor: a pharmacologist's perspective. Clin Exp Rheumatol 19, S51-S57.
Brune K & Niederweis U (2007) [From willow bark to the coxibs. Development of antiphlogistic analgesics]. Schmerz 21, 318, 320-318, 330.
Chandrasekharan NV, Dai H, Roos KL, Evanson NK, Tomsik J, Elton TS & Simmons DL (2002) COX-3, a cyclooxygenase-1 variant inhibited by acetaminophen and other analgesic/antipyretic drugs: cloning, structure, and expression. Proc Natl Acad Sci U S A 99, 13926-13931.
Chung F, Ritchie E & Su J (1997) Postoperative pain in ambulatory surgery. Anesth Analg 85, 808-816.
Clissold SP (1986) Paracetamol and phenacetin. Drugs 32 Suppl 4 , 46-59.
d'Amours RH & Ferrante FM (1996) Postoperative pain management. J Orthop Sports Phys Ther 24, 227-236.
Flouvat B, Leneveu A, Fitoussi S, hotal-Landes B & Gendron A (2004) Bioequivalence study comparing a new paracetamol solution for injection and propacetamol after single intravenous infusion in healthy subjects. Int J Clin Pharmacol Ther 42, 50-57.
Graham GG, Day RO, Milligan MK, Ziegler JB & Kettle AJ (1999) Current concepts of the actions of paracetamol (acetaminophen) and NSAIDs. Inflammopharmacology 7, 255-263.
Gregoire N, Hovsepian L, Gualano V, Evene E, Dufour G & Gendron A (2007) Safety and pharmacokinetics of paracetamol following intravenous administration of 5 g during the first 24 h with a 2-g starting dose. Clin Pharmacol Ther 81, 401-405.
Guignard B, Bossard AE, Coste C, Sessler DI, Lebrault C, Alfonsi P, Fletcher D & Chauvin M (2000) Acute opioid tolerance: intraoperative remifentanil increases postoperative pain and morphine requirement. Anesthesiology 93, 409-417.
Hahn TW, Mogensen T, Lund C, Jacobsen LS, Hjortsoe NC, Rasmussen SN & Rasmussen M (2003) Analgesic effect of i.v. paracetamol: possible ceiling effect of paracetamol in postoperative pain. Acta Anaesthesiol Scand 47, 138-145.
Hedenmalm K & Spigset O (2002) Agranulocytosis and other blood dyscrasias associated with dipyrone (metamizole). Eur J Clin Pharmacol 58, 265-274.
Heinzel G., Woloszczak R. & Thomann P. (1993) TopFit 2.0- Pharmacokinetic and Pharmacodynamic Data Analysis System for the PC. Gustav Fischer Verlag/VCH Publishers: 220 East 23rd Street, Suite 909, New York, New York 10010; Gustav Fisher Verlag: Wollgrasweg 49, D-7000 Stuttgart 70 (Hohenheim),Germany.

51
Hogestatt ED, Jonsson BA, Ermund A, Andersson DA, Bjork H, Alexander JP, Cravatt BF, Basbaum AI & Zygmunt PM (2005) Conversion of acetaminophen to the bioactive N-acylphenolamine AM404 via fatty acid amide hydrolase-dependent arachidonic acid conjugation in the nervous system. J Biol Chem 280, 31405-31412.
Holmer PP, Owall A & Jakobsson J (2004a) Early bioavailability of paracetamol after oral or intravenous administration. Acta Anaesthesiol Scand 48, 867-870.
Hutchison RW (2007) Challenges in acute post-operative pain management. Am J Health Syst Pharm 64, S2-S5.
Jarde O & Boccard E (1997) Parenteral versus oral route increases paracetamol efficacy. pp. 474-481.
Jerie P (2006) [Milestones of cardivascular pharmacotherapy: salicylates and aspirin]. Cas Lek Cesk 145, 901-904.
Joris J, Kaba A & Lamy M (2001) Transition between anesthesia and post-operative analgesia: relevance of intra-operative administration of analgesics. Acta Anaesthesiol Belg 52, 271-279.
Juhl GI, Norholt SE, Tonnesen E, Hiesse-Provost O & Jensen TS (2006) Analgesic efficacy and safety of intravenous paracetamol (acetaminophen) administered as a 2 g starting dose following third molar surgery. European Journal of Pain 10, 371-377.
Kehlet H (1997) [Accelerated course of operations--why and how?]. Ugeskr Laeger 159, 6495.
Kehlet H & Dahl JB (1993) The value of "multimodal" or "balanced analgesia" in postoperative pain treatment. Anesth Analg 77, 1048-1056.
Kozer E, Hahn Y, Berkovitch M, Chaim AB, Brandriss N, Verjee Z, Mor A & Goldman M (2007) The Association Between Acetaminophen Concentrations in the Cerebrospinal Fluid and Temperature Decline in Febrile Infants. Ther Drug Monit 29, 819-823.
Kumpulainen E, Kokki H, Halonen T, Heikkinen M, Savolainen J & Laisalmi M (2007) Paracetamol (acetaminophen) penetrates readily into the cerebrospinal fluid of children after intravenous administration. Pediatrics 119, 766-771.
Laska EM, Siegel C & Sunshine A (1991) Onset and duration: measurement and analysis. Clin Pharmacol Ther 49, 1-5.
Mackintosh C (2007) Assessment and management of patients with post-operative pain. Nurs Stand 22, 49-55.
Mour G, Feinfeld DA, Caraccio T & McGuigan M (2005) Acute renal dysfunction in acetaminophen poisoning. Ren Fail 27, 381-383.
52
Mutschler E (1991) Arzneimittelwirkungen, 6 ed. Stuttgart: Wissenschaftliche Verlagsgesellschaft mbH.
Newman DJ, Henneberry H & Price CP (1992) Particle Enhanced Light Scattering Immunoassay. Ann Clin Biochem 29, 42.
Ouellet M & Percival MD (2001) Mechanism of acetaminophen inhibition of cyclooxygenase isoforms. Arch Biochem Biophys 387, 273-280.
Paul A.Insel (1940) ANALGETISCHE, ANTIPYRETISCHE UND ANTIPHLOGISTISHE SUBSTANZEN UND ARZNEISTOFFE ZUR BEHANDLUNG DER GICHT. In GOODMAN & GILMAN " Pharmakologische Grundlagen der Arzneimitteltherapie" 9. Auflage, pp. 633-649: McGraw-Hill International (UK) Ltd.
Pearce B & Grant IS (2008) Acute liver failure following therapeutic paracetamol administration in patients with muscular dystrophies. Anaesthesia 63, 89-91.
Pickering G, Esteve V, Loriot MA, Eschalier A & Dubray C (2007) Acetaminophen Reinforces Descending Inhibitory Pain Pathways. Clin Pharmacol Ther.
Piguet V, Desmeules J & Dayer P (1998) Lack of acetaminophen ceiling effect on R-III nociceptive flexion reflex. Eur J Clin Pharmacol 53, 321-324.
Piletta P, Porchet HC & Dayer P (1990) [Central analgesic effect of paracetamol]. Schweiz Med Wochenschr 120, 1950-1951.
Piletta P, Porchet HC & Dayer P (1991) Central analgesic effect of acetaminophen but not of aspirin. Clin Pharmacol Ther 49, 350-354.
Poisson-Salomon AS, Brasseur L, Lory C, Chauvin M & Durieux P (1996) [Audit of the management of postoperative pain]. Presse Med 25, 1013-1017.
Prescott LF (2000) Paracetamol: past, present, and future. Am J Ther 7, 143-147.
Rainsford KD (2007) Anti-inflammatory drugs in the 21st century. Subcell Biochem 42, 3-27.
Skoglund LA & Pettersen N (1991) Effects of acetaminophen after bilateral oral surgery: double dose twice daily versus standard dose four times daily. Pharmacotherapy 11, 370-375.
van der Marel CD, Anderson BJ, Pluim MA, de Jong TH, Gonzalez A & Tibboel D (2003) Acetaminophen in cerebrospinal fluid in children. Eur J Clin Pharmacol 59, 297-302.
von Mach MA, Hermanns-Clausen M, Koch I, Hengstler JG, Lauterbach M, Kaes J & Weilemann LS (2005) Experiences of a poison center network

53
with renal insufficiency in acetaminophen overdose: an analysis of 17 cases. Clin Toxicol (Phila) 43, 31-37.
Weil K, Hooper L, Afzal Z, Esposito M, Worthington HV, van Wijk AJ & Coulthard P (2007) Paracetamol for pain relief after surgical removal of lower wisdom teeth. Cochrane Database Syst Rev, CD004487.
Woodbury DM. (1965) Analgesics and Antipyretics. In Goodman LS and Gilman A. The Pharmacological Basis of Therapeutics 3rd edition., pp. 312-344.
54
Verzeichnis der akademischen Lehrer Meine akademischen Lehrer waren die Damen und Herre n in Lahore, Pakistan: Ahmad, Ahsan Siddiqui,Gardezi, Iftikhar, Khan, Latif, Naru, Nawaz, Qudsia, Ullah, Ul-Hassan, Ul-Haq, Waheed. in Marburg: Lennartz, Wulf, Maisch, Rothmund.

55
Danksagung
Mein besonderer Dank gilt meiner Familie, ohne deren Unterstützung und
Vertrauen diese Arbeit nicht möglich gewesen wäre.
Herrn Prof. Dr. med. H. Wulf, Direktor der Klinik für Anästhesie und
Intensivtherapie des Universitätsklinikums Marburg, gilt mein Dank für die
Überlassung des Themas und seine wissenschaftliche und materielle
Unterstützung, durch die diese Arbeit erst ermöglicht wurde.
Herrn Prof. Dr. med. U. Kroh und Herrn Dr. med. T. Vassiliou möchte ich
meinen besonderen Dank aussprechen, da sie diese Arbeit stets durch ihre
organisatorische, kompetente, wissenschaftliche Anleitung und fruchtbare
Diskussion gefördert und begleitet haben.
Ich danke Frau Dr. med. univ. C. Rolfes und Herrn Prof. Dr. med. L. Eberhart
für ihre Diskussions- und Hilfsbereitschaft.
Des Weiteren danke ich insbesondere Herrn Dr. med. T. Steinfeldt und Herrn
A. Gockel für ihre Hilfsbereitschaft bei der Durchführung und Umsetzung der
Arbeit.