Embed Size (px)
Citation preview
U N I V E R S I T Y O F C O P E N H A G E N
F A C U L T Y O F S C I E N C E
F R E S H W A T E R B I O L O G I C A L L A B O R A T O R Y
PhD thesis Mikkel Madsen-Østerbye
Sources and fate of dissolved organic matterin lakes Light penetration and the importance of UV-mediated bacterial mineralisation
Academic Supervisors: Professor Ole Pedersen and Professor Kaj Sand-Jensen
Submitted on: 21. December 2018
Name of department:
Author(s):
Title and subtitle:
Supervisor:
Supervisor:
Committee:
Submitted on:
Cover photo:
Department of Biology
Mikkel Madsen-Østerbye, Bsc. & Msc.
Sources and faith of dissolved organic matter in lakes Light penetration and importance of UV-mediated bacterial mineralisation
Ole Pedersen, Professor
Kaj Sand-Jensen, Professor
Jens Borum, Associated Professor (Chair) Freshwater Biological Laboratory University of Copenhagen Denmark
Tenna Riis, Associated Professor Department of Bioscience – Aquatic Biology Aarhus University Denmark
Jan Karlsson, Professor Department of Ecology and Environmental Sciences Umeå University Sweden
21. December 2018.
Lake Tvorup in Thy National Park, Denmark, August 2015. Photo: Mikkel Madsen-Østerbye.
This thesis has been submitted to the PhD school of The Faculty of Science, University of
Copenhagen
I
Preface This Ph.D. thesis represents four years of work ranging from September 2014 to December 2018,
of which one year was dedicated to teaching and course activities. The thesis was prepared at the
Freshwater Biology Laboratory (FBL) at the University of Copenhagen, Denmark, and was
funded by the Villum Kann Rasmussen Foundation. Furthermore, this Ph.D. followed the 4 + 4
scheme, meaning that the Ph.D. was four years long and divided into two parts. The first part
involved an examination which was held in December 2016. This exam represented the ending
of my master, and I received my master’s degree, Cand.scient. The second part of the Ph.D. ends
with this thesis. The motivation behind the Ph.D. project was to study the decline in the
abundance and colonisation of the pristine lake isoetid vegetation of small rosette species
threatened by increased brownification over the past 30-50 years. The thesis includes four
manuscripts (two published and two submitted for publication) of which I am the first author on
three of them. The emphasis of the manuscripts was on the input, concentrations and in particular
on the degradation of Coloured Dissolved Organic Matter (CDOM); the compound resulting in
the brownish colour of the waters. Hence, this thesis encompasses studies investigating the effect
of vegetation types on CDOM input, but also the interaction between light attenuation
parameters in the water. It is my hope that the work of this thesis will add to the current
knowledge of CDOM dynamics in aquatic systems as well as the management of brownification.
Copenhagen, Denmark, December 2018
Mikkel Madsen-Østerbye
II
Acknowledgements I have many people to thank for enabling me to hand in this thesis. First of all, I would like to
thank my two supervisors, Ole Pedersen and Kaj Sand-Jensen, for their unconditional support,
supervision and guidance throughout all aspects of my Ph.D. I am grateful for the support and
help when faced with challenges in the everyday life of a Ph.D. student. A huge thanks to Kaj for
always taking the time to discuss and give scientific feedback on even the busiest days and
weekends and for helping when I was facing challenges reaching beyond the everyday problems
in a Ph.D. student’s life.
My sincere thanks to Emma Kritzberg for scientific inputs and for hosting me at the Section for
Aquatic Ecology at Lund University. Visiting the section in Lund was a great experience that I
will never forget. Further thanks go out to all the good people I met at Lund University.
Special thanks go to Theis Kragh for introducing me to the world of freshwater ecology and
accepting me as a confused bachelor student back in 2012. Your participation as a co-supervisor
has meant the world for me and my project. Thanks for always finding the time to give me
scientific feedback and helping me through all kinds of hurdles from experimental designs, field
work, equipment, modelling, writing or even getting my first fishing rod. Thanks for introducing
me to the world of pike fishing and letting me finish my time at the Freshwater Biology
Laboratory (FBL) by accompanying Kenneth, Emil and you during the field work at Lake Mjels;
I will probably never catch a bigger fish than I did on that trip in November 2018 (121 cm and
12.7 kg).
Since my first steps as a bachelor student and afterwards as a Ph.D. student in the hallways at
FBL, nothing has been more important than the daily interactions with all the friendly people
from scientific personal to bachelor students. Thank you Anders, Dennis and Max, also known as
“the Wheat Boys”, for always making me laugh and trying to convince me of the awesome world
of gas film science. Thanks to Kathrine H. for always convincing me of the quality of my own
work and scientific progress. Thanks to Mikkel R. for being the only other person at the section
being into heavy metal music and for many fun hours spend together on Öland and at various
concerts. The biggest of thanks to all the guys who have been part of my Post.doc/Ph.D. office
for the last four years. You made every single day at the office a lot of fun and even at the worst
of times you could always put a smile on my face. Thanks to Lars I. and Jos for being a constant
scientific inspiration and for convincing me to get my own aquarium. Thanks to Kenneth for
III

being so patient with me when we were out fishing. A huge thank to Emil for countless of hours
spend at CrossFit convincing each other that everybody can do three more burpees. Sincere
thanks to the laboratory technicians Ayoe and Anne, for guidance and help. Special thanks to
Ayoe; if it were not for you, this department would not be the same in sense of your incredible
support both on and off the field.
Finally, thanks go out to all the members of DRK! for trying to convince everybody they meet
that I conduct research in ‘shrimps and mud’. Thanks to Kenneth Sømark and the rest of
“Skomagerbanden” for always finding the time to a good laugh and supporting each other in our
time at UCPH, even though some of you did not find ecology all that exciting. Thanks to my
girlfriend, Rebecca, for moral support and for coping with my changing moods when I was
facing challenges during my Ph.D. Finally, I would like to thank my parents for supporting me in
every step along the way from my start at Biology and especially throughout the last four years
as a Ph.D. student.
IV
Table of Content
PREFACE………………………………………………………………………………………... II
ACKNOWLEDGEMENTS…………………………………………………………………..... III
TABLE OF CONTENT………………………………………………………………….……..... 1
ABSTRACT……………………………………………………………………………………..... 2
DANSKE RESUMÉ…………………………………………………………...………………..... 3
THESIS INTRODUCTION………………………………………………...………………….... 4
THESIS AIMS………………………………………………………………………………....…. 9
WORK INCLUDED IN THIS CURRENT THESIS………………………………………..... 10
CONCLUSSION AND IMPLICATIONS…………………………………………………...… 14
LITERATURE CITED IN THE INTRODUCTION………………………………………..... 16
CHAPTER 1: COUPLED UV-EXPOSURE AND MICROBIAL DECOMPOSITION
IMPROVES MEASURES OF ORGANIC MATTER DEGRDATION AND LIGHT
MODELS IN HUMIC LAKE…………………………………………………………...……… 19
CHAPTER 2: HIGH REMOVAL OF DISSOLVED ORGANIC MATTER UNDER
COMBINED PHOTOCHEMICAL AND MICROBIAL DEGRDADATION AS A
RESPONSE TO UV LIGHT INTENSITIES………………………………………………...... 30
CHAPTER 3: CATCHMENT TRACERS REVEAL DISCHARGE, RECHARGE AND
SOURCES OF GROUNDWATER-BORNE POLLUTANTS IN NOVEL LAKE
MODELLING APPROACH………………………………………………………………......... 47
CHAPTER 4: LIGHT CLIMATE AND SUBMERGED PLANTS IN A LARGE RE-
ESTABLISHED LAKE ON AGRICULTURAL LAND………………………………....……. 62
SUPPORTING INFORMATION TO CHAPTER 1 AND 3………………………….....…….. 82
1
Abstract
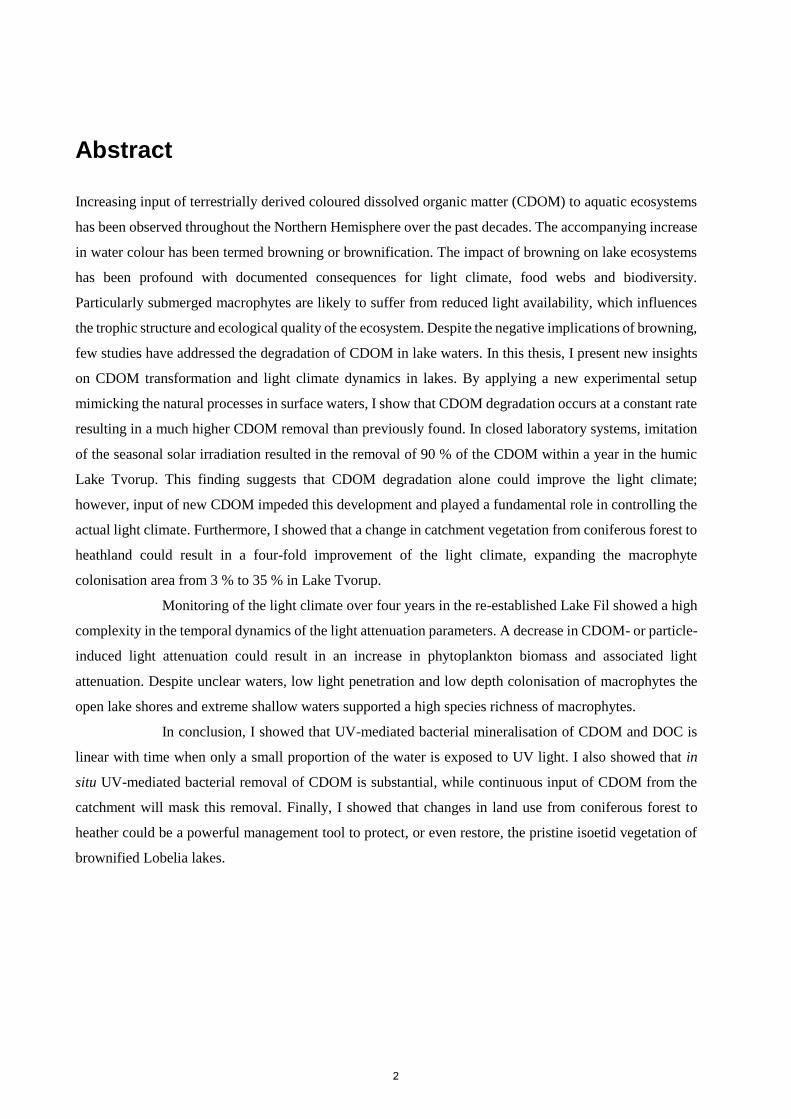
Increasing input of terrestrially derived coloured dissolved organic matter (CDOM) to aquatic ecosystems
has been observed throughout the Northern Hemisphere over the past decades. The accompanying increase
in water colour has been termed browning or brownification. The impact of browning on lake ecosystems
has been profound with documented consequences for light climate, food webs and biodiversity.
Particularly submerged macrophytes are likely to suffer from reduced light availability, which influences
the trophic structure and ecological quality of the ecosystem. Despite the negative implications of browning,
few studies have addressed the degradation of CDOM in lake waters. In this thesis, I present new insights
on CDOM transformation and light climate dynamics in lakes. By applying a new experimental setup
mimicking the natural processes in surface waters, I show that CDOM degradation occurs at a constant rate
resulting in a much higher CDOM removal than previously found. In closed laboratory systems, imitation
of the seasonal solar irradiation resulted in the removal of 90 % of the CDOM within a year in the humic
Lake Tvorup. This finding suggests that CDOM degradation alone could improve the light climate;
however, input of new CDOM impeded this development and played a fundamental role in controlling the
actual light climate. Furthermore, I showed that a change in catchment vegetation from coniferous forest to
heathland could result in a four-fold improvement of the light climate, expanding the macrophyte
colonisation area from 3 % to 35 % in Lake Tvorup.
Monitoring of the light climate over four years in the re-established Lake Fil showed a high
complexity in the temporal dynamics of the light attenuation parameters. A decrease in CDOM- or particle-
induced light attenuation could result in an increase in phytoplankton biomass and associated light
attenuation. Despite unclear waters, low light penetration and low depth colonisation of macrophytes the
open lake shores and extreme shallow waters supported a high species richness of macrophytes.
In conclusion, I showed that UV-mediated bacterial mineralisation of CDOM and DOC is
linear with time when only a small proportion of the water is exposed to UV light. I also showed that in
situ UV-mediated bacterial removal of CDOM is substantial, while continuous input of CDOM from the
catchment will mask this removal. Finally, I showed that changes in land use from coniferous forest to
heather could be a powerful management tool to protect, or even restore, the pristine isoetid vegetation of
brownified Lobelia lakes.
2
Dansk resumé
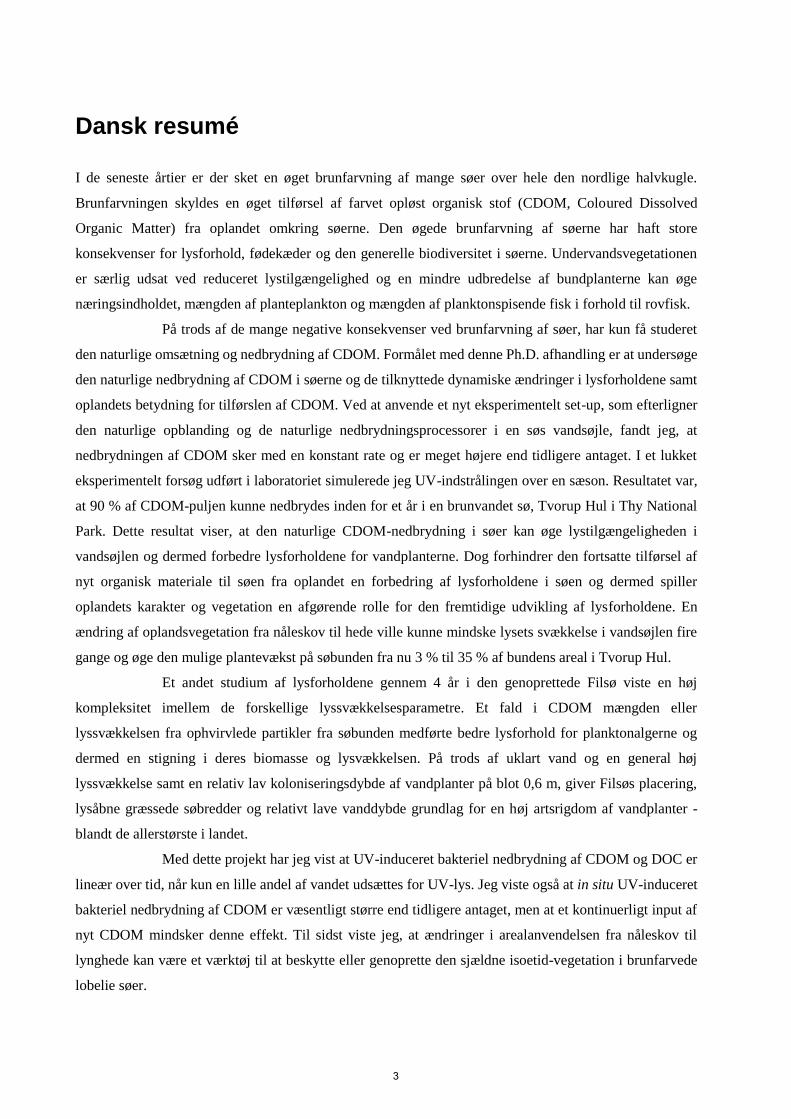
I de seneste årtier er der sket en øget brunfarvning af mange søer over hele den nordlige halvkugle.
Brunfarvningen skyldes en øget tilførsel af farvet opløst organisk stof (CDOM, Coloured Dissolved
Organic Matter) fra oplandet omkring søerne. Den øgede brunfarvning af søerne har haft store
konsekvenser for lysforhold, fødekæder og den generelle biodiversitet i søerne. Undervandsvegetationen
er særlig udsat ved reduceret lystilgængelighed og en mindre udbredelse af bundplanterne kan øge
næringsindholdet, mængden af planteplankton og mængden af planktonspisende fisk i forhold til rovfisk.
På trods af de mange negative konsekvenser ved brunfarvning af søer, har kun få studeret
den naturlige omsætning og nedbrydning af CDOM. Formålet med denne Ph.D. afhandling er at undersøge
den naturlige nedbrydning af CDOM i søerne og de tilknyttede dynamiske ændringer i lysforholdene samt
oplandets betydning for tilførslen af CDOM. Ved at anvende et nyt eksperimentelt set-up, som efterligner
den naturlige opblanding og de naturlige nedbrydningsprocessorer i en søs vandsøjle, fandt jeg, at
nedbrydningen af CDOM sker med en konstant rate og er meget højere end tidligere antaget. I et lukket
eksperimentelt forsøg udført i laboratoriet simulerede jeg UV-indstrålingen over en sæson. Resultatet var,
at 90 % af CDOM-puljen kunne nedbrydes inden for et år i en brunvandet sø, Tvorup Hul i Thy National
Park. Dette resultat viser, at den naturlige CDOM-nedbrydning i søer kan øge lystilgængeligheden i
vandsøjlen og dermed forbedre lysforholdene for vandplanterne. Dog forhindrer den fortsatte tilførsel af
nyt organisk materiale til søen fra oplandet en forbedring af lysforholdene i søen og dermed spiller
oplandets karakter og vegetation en afgørende rolle for den fremtidige udvikling af lysforholdene. En
ændring af oplandsvegetation fra nåleskov til hede ville kunne mindske lysets svækkelse i vandsøjlen fire
gange og øge den mulige plantevækst på søbunden fra nu 3 % til 35 % af bundens areal i Tvorup Hul.
Et andet studium af lysforholdene gennem 4 år i den genoprettede Filsø viste en høj
kompleksitet imellem de forskellige lyssvækkelsesparametre. Et fald i CDOM mængden eller
lyssvækkelsen fra ophvirvlede partikler fra søbunden medførte bedre lysforhold for planktonalgerne og
dermed en stigning i deres biomasse og lysvækkelsen. På trods af uklart vand og en general høj
lyssvækkelse samt en relativ lav koloniseringsdybde af vandplanter på blot 0,6 m, giver Filsøs placering,
lysåbne græssede søbredder og relativt lave vanddybde grundlag for en høj artsrigdom af vandplanter -
blandt de allerstørste i landet.
Med dette projekt har jeg vist at UV-induceret bakteriel nedbrydning af CDOM og DOC er
lineær over tid, når kun en lille andel af vandet udsættes for UV-lys. Jeg viste også at in situ UV-induceret
bakteriel nedbrydning af CDOM er væsentligt større end tidligere antaget, men at et kontinuerligt input af
nyt CDOM mindsker denne effekt. Til sidst viste jeg, at ændringer i arealanvendelsen fra nåleskov til
lynghede kan være et værktøj til at beskytte eller genoprette den sjældne isoetid-vegetation i brunfarvede
lobelie søer.
3
Thesis introduction
Aquatic macrophytes play a fundamental role in ecosystem functioning, and their development depends on
a variety of parameters (Hilt et al. 2017; Kirk 1994). The most fundamental of these parameters is the light
availability. However, in the last decades increasing deterioration of the light climate has taken place in
many lakes in the Northern Hemisphere due to increasing inputs of terrestrial coloured dissolved organic
matter (CDOM, (Solomon et al. 2015)). This Ph.D.-thesis deals with the dynamics of CDOM and the
probability of natural improvement of the light climate in CDOM-rich lakes and the effect on future
macrophyte colonisation.
Oligotrophic soft water lakes
Oligotrophic soft water lakes are widely distributed all over the Northern Hemisphere (Murphy 2002). Their
waters are low in nutrients and dissolved inorganic carbon (DIC) because they receive most of their water
through precipitation or groundwater from nutrient- and carbonate-poor catchments (Smolders et al. 2002).
The low concentration of available CO2 (≈ 18 µM), nutrients (phosphorus < 10 µg l-1) and bicarbonate (<0.5
mM) in oligotrophic soft water lakes are insufficient to sustain high biomass of phytoplankton and the
existence of macrophytes depends mainly on nutrient and carbon supply from the water column. This
situation has resulted in lakes with clear waters and extensive colonisation of a diverse group of rosette
plants, so-called isoetids. These small plants have a short-leaf rosette with an extensive root system. They
grow in the littoral zone where light is available, and they exploit nutrients and CO2 from the sediment. The
shallow lakes often have a low organic content in the sediment due to oligotrophic conditions and the
continuous release of oxygen by the isoetids facilitates mineralisation of organic material in the sediment
(Møller and Sand‐Jensen 2011). Furthermore, the oxygenation of the sediment results in strong absorption
and precipitation of phosphorus by oxidized iron (Christensen and Andersen 1996). Thus, isoetid vegetation
is important for maintaining the oligotrophic state in many aquatic systems. The iconic isoetid species
Lobelia dortmanna has been used to name the lakes Lobelia lakes.
Threats to Lobelia lakes
Unfortunately, during the last century, the isoetid vegetation has decline considerably in many lakes across
the Northern Hemisphere (Murphy 2002). Many of these previous oligotrophic waters have received high
amounts of nutrients, organic matter and DIC through increased anthropogenic activities from agricultural
and urban areas as well as drainage and deforestation of catchment vegetation (Arts 2002; Jeppesen et al.
2005; Smolders et al. 2002). Systems enriched by nutrients and DIC have experienced algae blooms and
fast-growing elodeid macrophyte species shifting the systems towards light limitations (Smolders et al.
2002). Even Lobelia lakes with restricted anthropogenic activity in the catchment have experienced
4
deterioration of the light climate. This is mainly due to increasing inputs of CDOM making the lakes
increasingly more brownish; a tendency which was already recognised in the 1980’s (Forsberg 1992).
Dissolved organic matter in lakes
There are two main sources of dissolved organic carbon (DOC) and coloured dissolved organic matter
(CDOM) in inland waters. It may derive internally from primary production within the lake (autochthonous)
or from external input (allochthonous) from the surrounding terrestrial environment (Kragh and
Sondergaard 2004). The allochthonous input is frequently the main contributor to DOC and CDOM in small
lakes due to the large contact zone with the terrestrial surroundings compared to the lake surface (Sand-
Jensen and Staehr 2007).
What is CDOM?
Although DOC mineralisation occurs in the soil environments of the catchment, substantial amounts of
DOC are exported to the freshwater systems (Kritzberg 2017; Mulholland 2003). The mineralisation of
DOC in soils alters the chemical composition resulting in a mixture of diverse molecular sizes, ages and
biological availabilities in the soils (Neff and Asner 2001). The increased water colour associated with
increasing DOC concentrations is due to the increased export of CDOM primarily from the terrestrial
environment via surface waters or groundwaters (Xiao et al. 2015). A large fraction of this terrestrially
derived CDOM consists of humic and fulvic substances (also referred to as humic substances (McDonald
et al. 2004)). These component are relatively resistant to microbial degradation due to their complex
molecular composition and high C:P and/or C:N ratios (McKnight and Aiken 1998).
CDOM effects on lakes
High CDOM concentrations in inland waters have profound effect on lake ecosystems, organism
communities and human utilisation of lakes. CDOM affects lake ecosystems by reducing the downward
penetration of solar radiation in the water column. This light reduction causes a decrease in lake productivity
as well as secondary effects through changes of food webs and population structure of plants and fish
(Jansson et al. 2007; Karlsson et al. 2009). The increased organic carbon has also resulted in an increase of
organic carbon available for bacterial mineralisation intensifying freshwater CO2 outgassing (Lapierre et
al. 2013). Moreover, CDOM also affects the physical structure of the water column by absorbing heat in
the surface waters and decreasing the extension of the mixed epilimnion with phytoplankton in the water
surface (Solomon et al. 2015).
Nutrient limitation has been the common paradigm for understanding lake ecosystem
behaviour. However, the brownification of lakes in the boreal region has resulted in lakes with high
background light attenuation making these systems light limited rather than nutrient limited (Jones et al.
5
1996; Karlsson et al. 2009). The low-light conditions induced by CDOM absorbance reduce the depth
colonisation of submerged macrophytes (Søndergaard et al. 2013). Especially the isoetid vegetation is
vulnerable to deterioration of the light climate because of high light requirements. A reduction in the
macrophyte abundance could further change the ecosystem due to is structural effect on habitats and their
diversity (Hilt et al. 2017).
Increasing DOC and CDOM and the reasons behind
During the last decades, concentrations of DOC and CDOM have increased dramatically all over the
Northern Hemisphere in the boreal regions (Monteith et al. 2007; Winterdahl et al. 2014). The increase of
DOC has been followed by a parallel increase in water colour (CDOM) often referred to as browning or
brownification (Kritzberg and Ekstrom 2012; Roulet and Moore 2006). The increase of DOC and CDOM
concentrations in surface waters have been widely discussed and attributed to a combination of many
different factors (Clark et al. 2010). Some drivers are directly linked to the increasing temperatures on a
global scale (Pagano et al. 2014). The increasing temperatures have resulted in an associated increase in
precipitation and runoff, leading to higher DOC and CDOM leaching from the catchment via both surface
waters and ground water (Fasching et al. 2016; Weyhenmeyer et al. 2012). In addition, the increasing
atmospheric CO2 and global temperatures have increased plant growth and prolonged growing seasons
referred to as “greening” and resulted in increased production of terrestrial organic matter in the catchment
(Finstad et al. 2016).
Furthermore, changes in land-use, land management and afforestation have contributed to
the increasing DOC and CDOM concentrations (Kritzberg 2017; Meyer-Jacob et al. 2015). Another
proposed driver, which has gained attention in recent years, is the long-termed change in atmospheric
deposition in which the strong reduction in anthropogenic sulfur (S) emission has allowed for recovery
from acidification and low soil pH, thereby increasing the solubility and leaching of soil organic matter
(Ekstrom et al. 2011; Monteith et al. 2007). This change in solubility by higher soil pH, could have resulted
in a loss of organic matter in the terrestrial soils now being dissolved and leached to the aquatic system.
The relative importance of different factors for the increasing brownification is hard to separate because
they occur simultaneously and interact within the ecosystems (Clark et al. 2010; Evans et al. 2006; Roulet
and Moore 2006).
Variation in catchment vegetation and soil management practices affect production and
transport of DOC (Stanley et al. 2012; Wilson and Xenopoulos 2008). This notion is supported by the
findings that the proportion of coniferous boreal forest in the catchment is the best predictor for DOC
concentrations on a global scale (Sobek et al. 2007). Shifting land-use to coniferous forest induces an
increase over time in the soil organic carbon pool (Guo and Gifford 2002) resulting in a higher terrestrial
input over time to the freshwater system. The importance of riparian vegetation as a source of DOC (Bishop
6
et al. 2004) and the effect of vegetation type and cover (Kritzberg 2017; Larsen et al. 2011) suggest that
controlling and understanding of water input associated with catchment vegetation should play a main role
in predicting the change in browning of lakes.
UV-induced degradation of CDOM
It is commonly recognised that degradation of DOC and CDOM in inland waters is accelerated by UV-
radiation. UV-induced DOC and CDOM mineralisation can play an important role in lakes as well as in
running waters (Cory et al. 2014; Koehler et al. 2014). Especially the more recalcitrant coloured fraction
originating from the terrestrial vegetation (CDOM) has a high solar absorbance (Kirk 1994).
The UV-mediated degradation and colour removal, also referred to as photo-mineralisation,
transforms CDOM to more labile non-coloured DOC compounds which are more assessible to bacterial
remineralisation (Kragh et al. 2008; Moran and Zepp 1997; Obernosterer and Benner 2004). Bacteria alone
do mineralise some coloured humic substances at low rates in the aquatic systems (Tranvik 1988).
Photobleaching in itself by UV-irradiation is also known to have an effect on colour removal (Obernosterer
and Benner 2004). However, it is the combined effect of UV-irradiation and microbial mineralisation that
results in the highest turnover of DOC and CDOM. This makes sunlight and UV-exposure an important
factor in CDOM degradation and subsequent colour removal (Cory et al. 2014).
Ecological effects and CDOM removal
Given the fundamental ecological influence of brownification on environmental conditions, metabolism
and food webs (Jansson et al. 2007; Karlsson et al. 2009; Sand-Jensen and Staehr 2007), it is important to
understand the processes behind the internal colour removal and DOC turnover in lakes. In the past,
freshwaters were considered as passive transport systems for DOC to the ocean. However, in recent years
it has been recognised that a major fraction of the organic matter is processed and lost during transport
through the freshwaters to the ocean (Battin et al. 2009; Cole et al. 2007; Tranvik et al. 2009). The
freshwater conduit plays a much more important role in the global carbon cycle than previous assumed
(Tranvik et al. 2009). This notion is supported by Catalán et al. (2016) who showed a much faster turnover
of organic carbon in freshwaters compared to terrestrial soils and marine waters.
Turnover of organic carbon in inland waters is driven by two fundamental processes. The
first process is the microbial degradation converting DOC to carbon dioxide (CO2), which is then released
to the atmosphere (Fasching et al. 2014; Lapierre et al. 2013). The second process consists of the production
of organic aggregates sinking and accumulating in the sediment (Cole et al. 2007). Previous research has
mainly focused on CO2 production and outgassing to the atmosphere, but little is known regarding the
removal of water colour. Surprisingly few studies have addressed the combined effect of UV-exposure and
microbial degradation in the circulating water column waters.
7
Traditionally, the UV-degradation experiments have been carried out in different ways but
with a common design that involved a high initial UV-treatment followed by bacterial degradation. Bacteria
were added after UV-exposure due to the harmful effect of UV irradiation on organisms (Häder and Sinha
2005). Some experiments involved an initial UV-exposure until a certain proportion of CDOM had
vanished due to bleaching (Moran et al. 2000), UV-exposure for a pre-determined time-period (Helms et
al. 2008; Vachon et al. 2017) or a continued UV-exposure throughout the experiment to the entire sample
volume has also been applied (Helms et al. 2014; Obernosterer and Benner 2004). The single dose approach
has led to transformation of a certain pool of recalcitrant DOC to more labile compounds leading to the
general understanding that decomposition of DOC and CDOM follows a first order decay (Weyhenmeyer
et al. 2012). The more labile components are utilised first leaving more recalcitrant compounds in the water
(Vachon et al. 2017). These previous experimental designs correspond poorly to the natural scenario in
which water is constantly circulated from UV-exposure at the surface to no-exposure in the deeper layers
of the water column and back again to the surface. This prompted me to develop a setup resembling a
natural degradation scenario by having the upper 5% simulating the surface waters exposed to UV-radiation
and the remaining 95% in darkness simulating bottom waters in a diurnal light scheme. The continuous
mixing and transporting of compounds form “surface” water yielded a more continues transformation of
refractory CDOM to labile compounds supporting a continuous bacterial mineralisation and associated with
an increase in colour removal.
The motivation behind this study
The primary motivation behind this project was the observed reduction of isoetid vegetation in the small
oligotrophic softwater lakes dispersed throughout the Thy National Park in north western Jutland, Denmark.
These lakes have experienced a major deterioration of the light climate due to browning and experienced
large-scale changes in the catchment vegetation going from heathland to mainly coniferous forest. The lack
of ecological knowledge regarding natural colour removal and associated light climate recovery in these
small aquatic systems have prevented the development of management schemes to secure the survival and
colonisation of isoetids, and equally important, secure the ecological quality and diversity of flora and fauna
of these small oligotrophic soft water lakes.
8
Thesis aims
The overall aim of this Ph.D.-thesis was to determine changes in the light climate as a response to changes
in CDOM-induced light attenuations. The main focus was on UV-induced CDOM turnover and changes of
CDOM inputs, but also the interaction with other light attenuation parameters were included to evaluate
light climate development over time.
I attempted to achieve these goals by:
1) Investigating the effect of continuous CDOM turnover in circulating water between UV-exposure
and darkness in a new experimental setup.
2) Investigating the effect of CDOM, derived from specific catchment vegetation, on the light climate
in a natural lake.
3) Investigating the effect of different UV intensities on CDOM turnover to provide a better
understanding of changes on seasonal and annual scales.
4) Testing and developing a new tool for tracking CDOM-rich groundwater input to a natural lake.
5) Investigating the natural interaction between different light attenuation parameters (CDOM,
suspended particles and phytoplankton) to evaluate light climate development in a new lake.
My hope is that these results will result in new and better understanding of light regulation and carbon
cycling from CDOM and DOC in freshwater lakes. I hope my contribution will enable better understanding
management of the lakes in Thy National Park in order to secure the survival and colonisation of the pristine
macrophyte vegetation.
9
Work included in the current thesis
Chapter 1 – Madsen-Østerbye, M., Kragh, T., Pedersen, O., & Sand-Jensen, K. 2018.
Coupled UV-exposure and microbial decomposition improves measures of organic degradation and light
models in humic lakes
Ecological Engineering, volume 118, August 2018 Pages 191-200
Rare and pristine isoetids communities have been diminished due to increased browning by coloured
dissolved organic matter (CDOM) and dissolved organic carbon (DOC) in softwater lakes around the
Northern hemisphere. To examine the degradation of CDOM and DOC, we tested the effect of combined
UV and microbial degradation in our new experimental setup, which mimics the natural water column
circulation. We were especially motivated to see the extent of possible colour removal in the case of photo-
mineralisation. Also, the study focuses on CDOM concentrations leaching from two specific vegetation
types, heathland and coniferous forest, since these were the dominant vegetation surrounding the lakes in
the focus habitat – Thy National Park. Our new experimental setup showed that DOC and CDOM
degradation took place at a slow, but constant rate over 30 days. The traditional single dose design followed
a 1st order decay with falling degradation rates over time and cessation of DOC degradation after 20 days.
DOC concentration in the new experimental setup reached the same level after 30 days.
In regard to CDOM, we found that 84 % of the CDOM derived from heathland and 20 %
derived from coniferous forest were removed in the new experimental setup compared to an average of
only 3.5 % in the single dose design. This highlighted that especially CDOM degradation could be much
more profound than previously assumed. Degradation rates of CDOM found in the new experimental design
showed that a new steady state in water colour would be reached within 1-2 years. This finding indicated
that the main delay to attain a new steady state in the light climate would be degradation of soil organic
pools and rate of leaching from groundwater magazines. Furthermore, model estimates of the change in
CDOM input, caused by a shift in the dominant catchment vegetation from coniferous to heathland
vegetation, showed that the theoretical colonisation depth of macrophytes would increase from 0.6 m to 2.5
m, improving plant cover from 3 % to 35 %.
10
Chapter 2 – Madsen-Østerbye, M., Sand-Jensen, K., Kristensen, E., Pedersen, O., &
Kragh, T. 2018.
High removal of dissolved organic matter under integrated photochemical and microbial degradation as a
response to UV-intensities
Submitted to Biogeochemistry
This experimental study was conducted to further investigate the high CDOM removal highlighted in
chapter 1. We investigated CDOM degradation as a response to increasing UV-intensities to evaluate the
seasonal removal of CDOM. We hypothesised that the increase in UV-irradiation should result in a higher
carbon turnover due to a transformation of recalcitrant organic matter to more labile compounds. In
addition, we used the newly found relative degradation of CDOM as a response to UV-intensity to estimate
annual changes of CDOM in the focus lake, Lake Tvorup. We found a linear relationship between UV-
intensities and CDOM degradation up to a UV-intensity of 0.36 W m-2, while saturation of CDOM
degradation occurred at higher intensities corresponding to in situ summer UV-values. In contrast, DOC
degradation did not show the same tendency to saturate as a response to increasing UV-intensities. As a
consequence, we found systematic changes in the ratio between DOC and CDOM at high UV-intensities
which did not occur at low intensities. Relating CDOM degradation to seasonal irradiation, we estimated
that 92 % of colour could be removed in a closed system with no additional CDOM input. However, in situ
water sample only showed a reduction in water colour of 22 % from winter to summer because of
continuous CDOM input. We were able to model the seasonal pattern found in in situ water samples by
accounting for CDOM input driven by precipitation and subsequent groundwater input. Overall, the results
showed that colour removal is much more dynamic than hitherto believed and it has probably been
underestimated due to the continuous input of new material to the system.
11
Chapter 3 – Kristensen, E., Madsen-Østerbye, M., Massicotte, P., Pedersen, O.,
Markager, S., & Kragh, T. 2018.
Catchment tracers reveal discharge, recharge and source of groundwater-borne pollutants in a novel lake
modelling approach
Biogeosciences, 15, 1203-1216, 2018
Groundwater fed lakes offer complex challenges to evaluate inputs of nutrients and organic carbon. We
developed a new experimental approach for fast hydrological surveys using multiple groundwater-borne
conservative and non-conservative tracers such as CDOM, DOC, nutrients, δ18O/ δ16O ratios and
Fluorescent Dissolved Organic Matter (FDOM) components derived from Parallel Factor Analysis
(PARAFAC). All tracers were found in water samples taken directly from the focus lake (Lake Tvorup)
and in a network of temporary groundwater wells surrounding the lake. By using the δ18O/ δ16O ratios and
FDOM component as tracers, we were available to estimate the recharge areas of water flowing from the
lake. Discharge areas and fraction of water deriving from discrete recharge points were estimated using the
community Assembly via Trait Selection Model (CATS). The CATS model utilises tracer measurements
from the different groundwater samples related to lake components of tracers. A direct comparison between
the sample concentrations was possible as degradation rates of each used tracer were considered and related
to a range of water retention times. By using this new approach, we were able to pinpoint five groundwater
discharge areas and estimate a maximum water retention time of 2 years.
12
Chapter 4 – Madsen-Østerbye, M., Kragh, T., Kristensen, E., & Sand-Jensen, K. 2018.
Light climate and submerged plants in a large re-established lake on agricultural land
Submitted to Aquatic Sciences
Four years of continuous data enabled us to examine the interaction between light attenuation parameters
in the re-established Lake Fil on former agricultural land. We investigated the interaction between
light attenuation parameters controlling the light climate in the lake and compared it to macrophyte
colonisation. Our results revealed a highly dynamic system with a complex interaction between
light attenuation components. Daily vertical attenuation coefficients ranged from 0.45 to 35.2 m-1
with seasonal means between 2.7 to 10.2 m-1 with lowest values in spring. The two main parameters
contributing to the total attenuation were CDOM and suspended particles (30.5 % and 64.7 %,
respectively), while phytoplankton attenuation only contributed with 4.8 %. Modest phytoplankton
blooms were initiated by declining background attenuation, especially the decline of suspended
particles, during calm weather. The high light attenuation only allowed continuous macrophyte
colonisation to at water depth of 0.6 m, while scattered vegetation to 1.2 m was established during clear-
water periods.
13
Conclusions and implications
Several important results have emerged from this Ph.D.-thesis. By applying an experimental setup
mimicking circulation in the water column with periodic UV-exposure at the surface I was able to show
that degradation of DOC and CDOM followed a linear decline over time and not a 1st order decay as
previously shown. However, due to carbon limitation over time, the system would probably move towards
a 1st order decay over time if no replenishment of organic matter takes place. This time course aspect of the
carbon depletion with time, as revealed by the novel experimental setup, should be further investigated.
The work supports that exposure to sunlight with UV is important for DOC and CDOM
degradation in the aquatic environment. However, it is a new insight that colour removal by CDOM
degradation was so profound in my experiments. This was simply due to the continuous interaction between
UV-exposure and generation of labile compounds followed by microbial degradation. Furthermore, the
results of this Ph.D. suggest that colour removal could be much more profound than previously assumed
and that observed colour degradation in situ is underestimated due to the continuous input of new material
from the catchment. The saturation in CDOM degradation shown in Chapter 2, was carried out on a single
type of water source. However, the point of saturation in water with different humic concentrations remains
unknown, and similarly, it is not known if the molecular composition of the humic compounds affects the
saturation point.
Investigating CDOM leaching from different catchment vegetation surrounding the focus
lake, Lake Tvorup, supports the conclusion that changes in vegetation and land-use play a pivotal role in
the brownification of lakes. CDOM deriving from coniferous forest had 4-fold higher concentration
compared to CDOM deriving from heathland vegetation. Changing the dominant vegetation type in the
catchment could remarkably improve the light climate when a new steady state of CDOM concentrations
in the system was obtained. This Ph.D project focussed on the two most important vegetation types
(coniferous forest and heathland) located in Thy National Park. However, I find it highly relevant to assess
the influence of other types of vegetation and land use each resulting in different specific CDOM
concentration and compositions. Addressing CDOM from these different land uses and vegetation types
could strengthen future management of areas with a high CDOM input.
The monitoring data from Lake Fil supported the notion that light attenuation parameters
interacted in a complex system. A decrease in CDOM or particle attenuation could allow phytoplankton to
grow and thereby cause higher light attenuation. A decline in CDOM as a result of UV-induced
mineralisation could also result in an increase in phytoplankton biomass and chlorophyll-induced light
attenuation.
This thesis has implication for conservation, ecology and land-use management on a broad
scale. I show that colour removal of lakes could be much more profound than previously assumed.
14
Furthermore, I show that different vegetation types in the catchment are important for the magnitude of
CDOM input into lakes. Using the new developed methodology to trace groundwater, I was able to find the
most important recharge and discharge areas of the focus lake. This could add to an improved management
strategy of drainage to reduce nutrient and organic input to lakes. My focus on groundwater sources made
it possible to estimate water retention time in lakes in which traditional hydrological approaches could not
be applied. Following improvement of the light climate, re-colonisation of macrophytes would still depend
on the suitability of the sediment. So even though a natural improvement of the light climate could take
place due to combined photo- and bacterial mineralisation of organic matter, many years may still pass
before mineralisation of high pools of organic matter in the sediments has rendered them suitable for
macrophyte colonisation.
It’s is my hope that the results of this thesis may be an inspiration for general management
of lakes colonised by the pristine isoetid vegetation by providing better understanding of catchment
vegetation and hydrology and UV-effects on CDOM input and degradation and the resulting light
conditions in these systems.
15
Literature cited in the introduction
Arts GHP (2002) Deterioration of atlantic soft water macrophyte communities by acidification,
eutrophication and alkalinisation. Aquat Bot 73:373-393 doi:Pii S0304-3770(02)00031-1
Doi 10.1016/S0304-3770(02)00031-1
Battin TJ, Luyssaert S, Kaplan LA, Aufdenkampe AK, Richter A, Tranvik LJ (2009) The
boundless carbon cycle. Nat Geosci 2:598-600 doi:10.1038/ngeo618
Bishop K, Seibert J, Köhler S, Laudon H (2004) Resolving the double paradox of rapidly
mobilized old water with highly variable responses in runoff chemistry. Hydrol Process
18:185-189
Catalán N, Marcé R, Kothawala DN, Tranvik LJ (2016) Organic carbon decomposition rates
controlled by water retention time across inland waters. Nat Geosci 9:501-504
Christensen KK, Andersen FØ (1996) Influence of Littorella uniflora on phosphorus retention in
sediment supplied with artificial porewater. Aquat Bot 55:183-197
Clark J et al. (2010) The importance of the relationship between scale and process in
understanding long-term DOC dynamics. Sci Total Environ 408:2768-2775
Cole JJ et al. (2007) Plumbing the global carbon cycle: Integrating inland waters into the
terrestrial carbon budget. Ecosystems 10:171-184 doi:10.1007/s10021-006-9013-8
Cory RM, Ward CP, Crump BC, Kling GW (2014) Sunlight controls water column processing of
carbon in arctic fresh waters. Science 345:925-928
Ekstrom SM, Kritzberg ES, Kleja DB, Larsson N, Nilsson PA, Graneli W, Bergkvist B (2011)
Effect of acid deposition on quantity and quality of dissolved organic matter in soil-
water. Environ Sci Technol 45:4733-4739 doi:10.1021/es104126f
Evans CD, Chapman PJ, Clark JM, Monteith DT, Cresser MS (2006) Alternative explanations
for rising dissolved organic carbon export from organic soils. Global Change Biology
12:2044-2053 doi:10.1111/j.1365-2486.2006.01241.x
Fasching C, Behounek B, Singer GA, Battin TJ (2014) Microbial degradation of terrigenous
dissolved organic matter and potential consequences for carbon cycling in brown-water
streams. Sci Rep-Uk 4 doi:ARTN 4981 10.1038/srep04981
Fasching C, Ulseth AJ, Schelker J, Steniczka G, Battin TJ (2016) Hydrology controls dissolved
organic matter export and composition in an Alpine stream and its hyporheic zone.
Limnol Oceanogr 61:558-571 doi:10.1002/lno.10232
Finstad AG et al. (2016) From greening to browning: Catchment vegetation development and
reduced S-deposition promote organic carbon load on decadal time scales in Nordic
lakes. Sci Rep-Uk 6
Forsberg C (1992) Will an increased greenhouse impact in Fennoscandia give rise to more humic
and coloured lakes? In: Dissolved organic matter in lacustrine ecosystems. Springer, pp
51-58
Guo LB, Gifford R (2002) Soil carbon stocks and land use change: a meta analysis. Global
change biology 8:345-360
Helms JR, Mao JD, Stubbins A, Schmidt-Rohr K, Spencer RGM, Hernes PJ, Mopper K (2014)
Loss of optical and molecular indicators of terrigenous dissolved organic matter during
long-term photobleaching. Aquat Sci 76:353-373 doi:10.1007/s00027-014-0340-0
Helms JR, Stubbins A, Ritchie JD, Minor EC, Kieber DJ, Mopper K (2008) Absorption spectral
slopes and slope ratios as indicators of molecular weight, source, and photobleaching of
chromophoric dissolved organic matter. Limnol Oceanogr 53:955-969 doi:DOI
10.4319/lo.2008.53.3.0955
16
Hilt S, Brothers S, Jeppesen E, Veraart AJ, Kosten S (2017) Translating regime shifts in shallow
lakes into changes in ecosystem functions and services. Bioscience 67:928-936
Häder D-P, Sinha RP (2005) Solar ultraviolet radiation-induced DNA damage in aquatic
organisms: potential environmental impact. Mutation Research/Fundamental and
Molecular Mechanisms of Mutagenesis 571:221-233
Jansson M, Persson L, De Roos AM, Jones RI, Tranvik LJ (2007) Terrestrial carbon and
intraspecific size-variation shape lake ecosystems. Trends Ecol Evol 22:316-322
doi:10.1016/j.tree.2007.02.015
Jeppesen E et al. (2005) Lake responses to reduced nutrient loading–an analysis of contemporary
long‐term data from 35 case studies. Freshwater Biol 50:1747-1771
Jones R, Young J, Hartley A, Bailey‐Watts A (1996) Light limitation of phytoplankton
development in an oligotrophic lake‐Loch Ness, Scotland. Freshwater Biol 35:533-543
Karlsson J, Bystrom P, Ask J, Ask P, Persson L, Jansson M (2009) Light limitation of nutrient-
poor lake ecosystems. Nature 460:506-U580 doi:10.1038/nature08179
Kirk JTO (1994) Light & Photosynthesis in Aquatic Ecosystems Second Edition edn.,
Koehler B, Landelius T, Weyhenmeyer GA, Machida N, Tranvik LJ (2014) Sunlight‐induced
carbon dioxide emissions from inland waters. Global Biogeochem Cy 28:696-711
Kragh T, Sondergaard M (2004) Production and bioavailability of autochthonous dissolved
organic carbon: effects of mesozooplankton. Aquat Microb Ecol 36:61-72 doi:DOI
10.3354/ame036061
Kragh T, Sondergaard M, Tranvik L (2008) Effect of exposure to sunlight and phosphorus-
limitation on bacterial degradation of coloured dissolved organic matter (CDOM) in
freshwater. Fems Microbiol Ecol 64:230-239 doi:10.1111/j.1574-6941.2008.00449.x
Kritzberg ES (2017) Centennial‐long trends of lake browning show major effect of afforestation.
Limnology and Oceanography Letters 2:105-112
Kritzberg ES, Ekstrom SM (2012) Increasing iron concentrations in surface waters - a factor
behind brownification? Biogeosciences 9:1465-1478 doi:10.5194/bg-9-1465-2012
Lapierre JF, Guillemette F, Berggren M, del Giorgio PA (2013) Increases in terrestrially derived
carbon stimulate organic carbon processing and CO2 emissions in boreal aquatic
ecosystems. Nat Commun 4 doi:ARTN 2972 10.1038/ncomms3972
Larsen S, Andersen T, Hessen DO (2011) Predicting organic carbon in lakes from climate
drivers and catchment properties. Global Biogeochem Cy 25
McDonald S, Bishop AG, Prenzler PD, Robards K (2004) Analytical chemistry of freshwater
humic substances. Anal Chim Acta 527:105-124
McKnight DM, Aiken GA (1998) Aquatic Humic Substances: Ecology and Biogeochemistry.
Sources and age of aquatic humus. Springer-Verlag, Berlin.,
Meyer-Jacob C, Tolu J, Bigler C, Yang H, Bindler R (2015) Early land use and centennial scale
changes in lake-water organic carbon prior to contemporary monitoring. Proceedings of
the National Academy of Sciences:201501505
Monteith DT et al. (2007) Dissolved organic carbon trends resulting from changes in
atmospheric deposition chemistry. Nature 450:537-U539 doi:10.1038/nature06316
Moran MA, Sheldon WM, Zepp RG (2000) Carbon loss and optical property changes during
long-term photochemical and biological degradation of estuarine dissolved organic
matter. Limnol Oceanogr 45:1254-1264
Moran MA, Zepp RG (1997) Role of photoreactions in the formation of biologically labile
compounds from dissolved organic matter. Limnol Oceanogr 42:1307-1316
Mulholland P (2003) Large-scale patterns in dissolved organic carbon concentration, flux, and
sources. In: Aquatic Ecosystems. Elsevier, pp 139-159
17
Murphy KJ (2002) Plant communities and plant diversity in softwater lakes of northern Europe.
Aquat Bot 73:287-324 doi:Pii S0304-3770(02)00028-1
Doi 10.1016/S0304-3770(02)00028-1
Møller CL, Sand‐Jensen K (2011) High sensitivity of Lobelia dortmanna to sediment oxygen
depletion following organic enrichment. New Phytologist 190:320-331
Neff JC, Asner GP (2001) Dissolved organic carbon in terrestrial ecosystems: synthesis and a
model. Ecosystems 4:29-48
Obernosterer I, Benner R (2004) Competition between biological and photochemical processes
in the mineralization of dissolved organic carbon. Limnol Oceanogr 49:117-124
Pagano T, Bida M, Kenny JE (2014) Trends in levels of allochthonous dissolved organic carbon
in natural water: A review of potential mechanisms under a changing climate. Water
6:2862-2897
Roulet N, Moore TR (2006) Environmental chemistry - Browning the waters. Nature 444:283-
284 doi:10.1038/444283a
Sand-Jensen K, Staehr PA (2007) Scaling of pelagic metabolism to size, trophy and forest cover
in small Danish lakes. Ecosystems 10:127-141 doi:10.1007/s10021-006-9001-z
Smolders AJP, Lucassen ECHET, Roelofs JGM (2002) The isoetid environment:
biogeochemistry and threats. Aquat Bot 73:325-350 doi:Pii S0304-3770(02)00029-3
Doi 10.1016/S0304-3770(02)00029-3
Sobek S, Tranvik LJ, Prairie YT, Kortelainen P, Cole JJ (2007) Patterns and regulation of
dissolved organic carbon: An analysis of 7,500 widely distributed lakes. Limnol
Oceanogr 52:1208-1219
Solomon CT et al. (2015) Ecosystem consequences of changing inputs of terrestrial dissolved
organic matter to lakes: Current knowledge and future challenges. Ecosystems 18:376-
389 doi:10.1007/s10021-015-9848-y
Stanley EH, Powers SM, Lottig NR, Buffam I, Crawford JT (2012) Contemporary changes in
dissolved organic carbon (DOC) in human‐dominated rivers: is there a role for DOC
management? Freshwater Biol 57:26-42
Søndergaard M et al. (2013) Maximum growing depth of submerged macrophytes in European
lakes. Hydrobiologia 704:165-177
Tranvik LJ (1988) Availability of Dissolved Organic-Carbon for Planktonic Bacteria in
Oligotrophic Lakes of Differing Humic Content. Microbial Ecol 16:311-322 doi:Doi
10.1007/Bf02011702
Tranvik LJ et al. (2009) Lakes and reservoirs as regulators of carbon cycling and climate. Limnol
Oceanogr 54:2298-2314
Vachon D, Prairie YT, Guillemette F, del Giorgio PA (2017) Modeling Allochthonous Dissolved
Organic Carbon Mineralization Under Variable Hydrologic Regimes in Boreal Lakes.
Ecosystems 20:781-795 doi:10.1007/s10021-016-0057-0
Weyhenmeyer GA, Froberg M, Karltun E, Khalili M, Kothawala D, Temnerud J, Tranvik LJ
(2012) Selective decay of terrestrial organic carbon during transport from land to sea.
Global Change Biology 18:349-355 doi:10.1111/j.1365-2486.2011.02544.x
Wilson HF, Xenopoulos MA (2008) Ecosystem and seasonal control of stream dissolved organic
carbon along a gradient of land use. Ecosystems 11:555-568
Winterdahl M, Erlandsson M, Futter MN, Weyhenmeyer GA, Bishop K (2014) Intra‐annual
variability of organic carbon concentrations in running waters: Drivers along a climatic
gradient. Global Biogeochem Cy 28:451-464
Xiao YH, Raike A, Hartikainen H, Vahatalo AV (2015) Iron as a source of color in river waters.
Sci Total Environ 536:914-923 doi:10.1016/j.scitotenv.2015.06.092
18
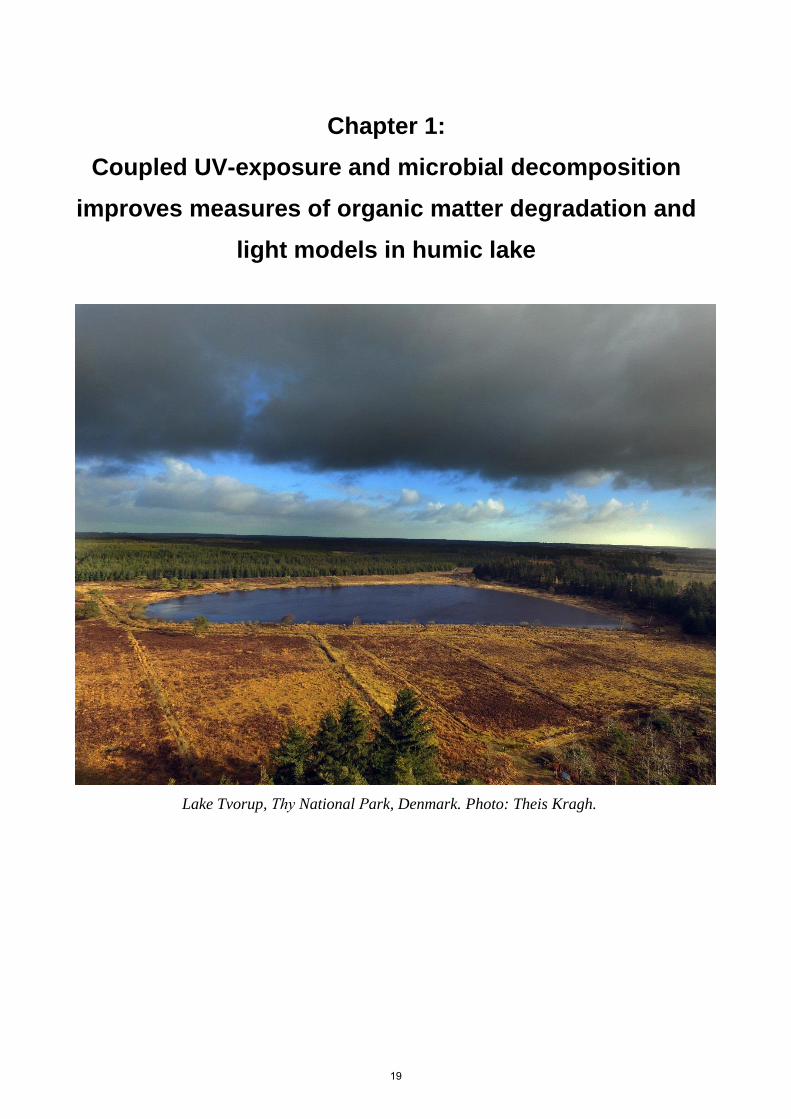
Chapter 1:
Coupled UV-exposure and microbial decomposition
improves measures of organic matter degradation and
light models in humic lake
Lake Tvorup, Thy National Park, Denmark. Photo: Theis Kragh.
19
Contents lists available at ScienceDirect
Ecological Engineering
journal homepage: www.elsevier.com/locate/ecoleng
Coupled UV-exposure and microbial decomposition improves measures oforganic matter degradation and light models in humic lake
Mikkel Madsen-Østerbyea,⁎, Theis Kragha, Ole Pedersena,b, Kaj Sand-Jensena
a Freshwater Biological Laboratory, Department of Biology, University of Copenhagen, Universitetsparken 4, 3rd Floor, 2100 Copenhagen, Denmarkb School of Agriculture and Environment, Faculty of Science, The University of Western Australia, 35 Stirling Highway, Crawley 6009, WA, Australia
A R T I C L E I N F O
Keywords:BrownificationDOCGroundwaterPhoto-bleachingLake restorationPlant recovery
A B S T R A C T
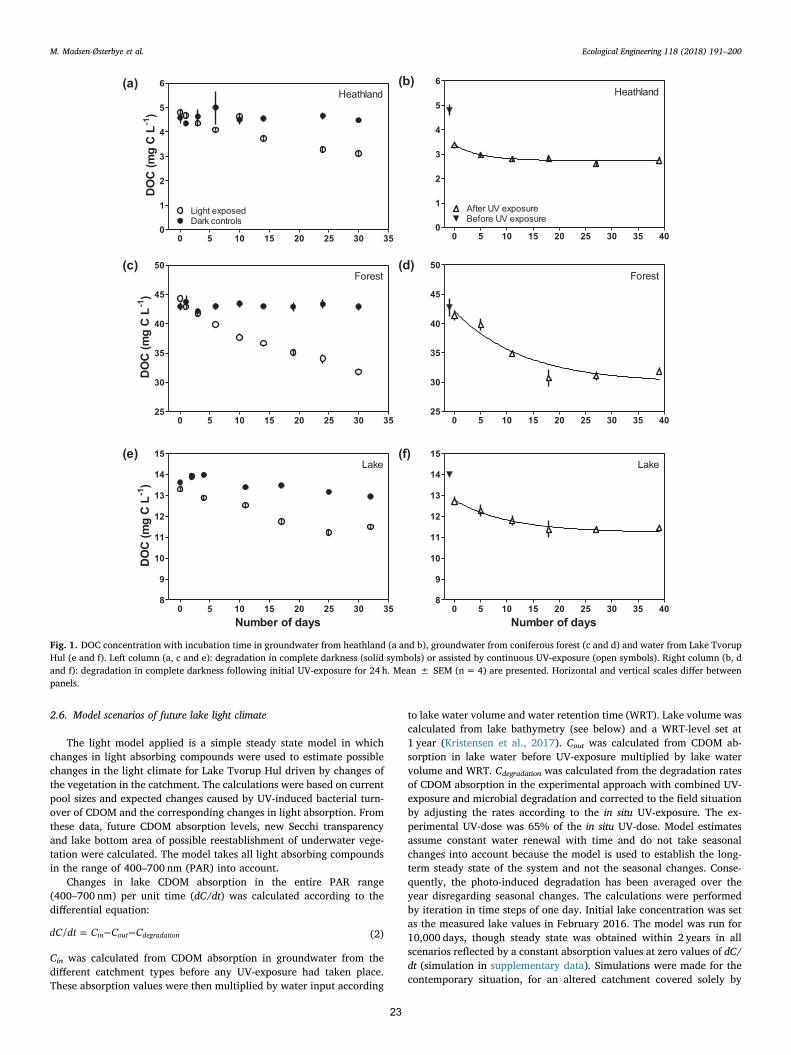
Increasing terrestrial input of colored dissolved organic matter (CDOM) to temperate softwater lakes has reducedtransparency, distribution of pristine rosette plants and overall biodiversity in recent decades. We examinedmicrobial and UV-induced reduction of absorption by CDOM and dissolved organic carbon pools (DOC) in humicwater from a groundwater-fed softwater lake as well as groundwater received from surrounding heathland andconiferous forest. An experimental setup that mimics naturally coupled continuous UV-exposure and microbialdegradation was introduced and compared with experiments applying a single initial or no UV-exposure. Wefound that decreases of CDOM and DOC concentrations were negligible in groundwater and very small in lakewater over 30 days in the absence of UV-exposure. Initial UV-exposure increased degradation rates, but furtherdegradation ceased after 20 days preventing determination of the natural time course of degradation. Coupledcontinuous UV-exposure and microbial degradation showed high and constant degradation of CDOM (340 nm)over 30 days removing 87% of the initial absorption in heathland groundwater, and 20% in forest groundwaterand lake water. Declines in DOC concentrations over 30 days were 34%, 28% and 13% of the initial levels inheathland groundwater, forest groundwater and lake water, respectively. Model estimates showed that a shift inland use from a forest dominated to a heathland dominated catchment could increase lake transparency from 0.6to 2.5 m. and expand plant-covered area from 3 to 35%. The main time delay to a new steady state of better lightclimate would be degradation of soil organic pools and exchange of groundwater magazines, while the delay inthe lake water after a complete shift to inflow of CDOM-poorer groundwater would last only 1–2 years.Consequently, changes in CDOM levels in groundwater input should have relatively rapid and marked influenceon light conditions and plant distribution in shallow softwater lakes.
1. Introduction
Dissolved organic carbon (DOC) in lake water originates from pri-mary production within the lake (autochthonous) and external input(allochthonous) from the surrounding terrestrial environment (Kraghand Sondergaard, 2004; Lampert, 1978; Sondergaard et al., 2000). Thepool of autochthonous DOC in lakes is mainly of recent origin con-taining small amounts of structural material and more labile com-pounds resulting in faster turnover rates compared to allochthonouscompounds (Sondergaard and Middelboe, 1995). Allochthonous inputis frequently the main contributor to the DOC content in small lakeshaving a large contact zone with the terrestrial surroundings relative tolake surface area and a fast renewal of the lake water (Sand-Jensen andStaehr, 2007). Allochthonous DOC input derives from terrestrial pri-mary producers and has undergone photochemical changes (Opsahl andBenner, 1998; Wetzel et al., 1995) as well as biological transformations
(Agren et al., 2008; Marín-Spiotta et al., 2014; McCallister and Giorgio, 2008) before entering the lake via groundwater or surface water. The DOC input to groundwater fed lakes has primarily undergone biological transformation due to the lack of UV-exposure in soil water.
DOC undergoes all kinds of production, transformation and de-gradation processes in the terrestrial-aquatic continuum. It has a strong impact on the physiochemical and biological characteristics of lakes. The pool of DOC in lakes is rarely constant and particularly the labile DOC compounds undergo marked temporal variations, for example, as a result of bursts of release from phytoplankton blooms followed by fast degradation of labile compounds (Baines and Pace, 1991; Sondergaard et al., 2000). Much of the DOC pool in lakes (commonly 50–70%) is composed of colored organic material (Gelbstoff or CDOM; (Aiken et al., 1985)), which is primarily refractory complex substances of low N and P content deriving from partial soil degradation of cellulose, hemicellulose and lignin from terrestrial plants before entering the lake.
https://doi.org/10.1016/j.ecoleng.2018.04.018Received 7 December 2017; Received in revised form 28 March 2018; Accepted 19 April 2018
⁎ Corresponding author.E-mail address: [email protected] (M. Madsen-Østerbye).
Ecological Engineering 118 (2018) 191–200
Available online 14 May 20180925-8574/ © 2018 Published by Elsevier B.V.
T
20
The inverse relationship between the concentration of each compoundand its rate of degradation (Hopkinson et al., 2002; Ogura, 1972;Sondergaard et al., 1995) reflects that the degradation rate is an es-sential determinant of the resulting concentration.
CDOM is very important for the light climate and thermal structurein lakes (Jones, 1998; Williamson et al., 1999). CDOM components areresponsible for shielding organisms against harmful UV-exposure(Arrigo and Brown, 1996; Bricaud et al., 1981) and CDOM competeswith pigment absorption in photoautotrophs for primary production(Krause-Jensen and Sand-Jensen, 1998). Brown-colored lake watershave a very restricted photic zone for pelagic and benthic photo-autotrophs (Jones, 1992), and high nutrient levels are required forphytoplankton to form high biomasses capable of absorbing a sub-stantial proportion of the incoming light (Krause-Jensen and Sand-Jensen, 1998). Moreover, refractory allochthonous CDOM promotessedimentation of fine flocculent particles (von Wachenfeldt andTranvik, 2008) that can further reduce growth and survival of rootedplants by smothering their surfaces (Barko et al., 1991).
During the recent decades, an increase in DOC has been observed infreshwaters across Europe and North America (Freeman et al., 2001;Monteith et al., 2007). Increasing water color and DOC concentrationhave been correlated with higher precipitation (Hongve et al., 2004),but climatic factors alone cannot be the main driver behind this changein CDOM and DOC (Evans et al., 2006). Studies have documented thathigh acid deposition and low soil pH can change the molecular size oforganic compounds and make them less aromatic and hydrophobic,thereby decreasing the content and mobility of CDOM compounds(Ekstrom et al., 2011; Evans et al., 2012). These processes contributedto reduced CDOM leaching and the development of more transparentwaters in acidified catchment soils (Hultberg and Grennfelt, 1986).Recent detailed evaluations have documented, however, the prominentinfluence of changes in land use, catchment vegetation and drainagehave showed profound effect on the CDOM in lakes (Kristensen et al.,2017; Kritzberg, 2017). In particular, coniferous forest plantations leadto high groundwater concentrations of CDOM (Kristensen et al., 2017).This increase in terrestrially derived CDOM, known as brownification,has occurred to the extent that light limitation presently reduces theabundance of submerged lake vegetation (Sondergaard et al., 2013) andinduces profound changes of food webs (Seekell et al., 2015; Solomonet al., 2015). This development has also taken place in low-alkalinelakes (< 1meq. L−1, Arts (2002)) located on sandy sediments withconifers or heathland vegetation along the West coast of Denmark andthe Netherlands (Brouwer et al., 2002) leading to deterioration of someof the few oligotrophic lakes with a pristine vegetation of small rosettespecies in the two countries. For ecosystem ecology and nature con-servation it is, therefore, essential to evaluate sources to brownificationand processes reducing it.
In the present study, a new experimental design was applied toobtain a better understanding of the interaction between photo-bleaching and microbial degradation of CDOM in a mixed watercolumn. Traditionally these experiments have involved an initial UV-exposure until a certain proportion of CDOM-absorbance had vanished(Moran et al., 2000). UV-exposure for a specific time period (Helmset al., 2008; Vachon et al., 2017) or a continued UV exposurethroughout the study (Helms et al., 2014; Obernosterer and Benner,2004) to the entire sample volume have also been applied. The tradi-tional approach with UV-exposure followed by gradual microbial de-gradation in darkness of the generated degradable carbon results in firstorder degradation kinetics. In our novel design, however, a smallfraction of the water was exposed to UV-light and circulated directly toa reservoir chamber for bacterial mineralization in a continuous loop tomimic the natural situation with water constantly being transportedfrom deeper layer to UV-exposure at the surface. This approach yields acontinuous input of degradable carbon from the large pool of refractoryCDOM and may result in different degradation kinetics over the 30-daysexperiments. Jones et al. (2016) also used a recirculation approach, but
used high UV-exposure and ran experiments over a short period of onlyfour days. Furthermore, our design used water circulation and UV-ex-posure estimated from in situ measurements in a dose that is notharmful for the bacteria.
The experiment was carried out on lake water and on groundwaterbelow the two main vegetation types in the catchment, coniferous forestand heathland. While DOC mineralization in groundwater is restrictedto microbial degradation due to lack of UV-exposure, lake water isexposed to UV-light enhancing the degradation of CDOM by photo-bleaching (Del Vecchio and Blough, 2002; Goldstone et al., 2004).When CDOM absorbs UV-light, the molecular and optical propertieschange (Bertilsson and Tranvik, 2000) resulting in transformation ofrefractory CDOM to more labile DOC as well as lesser refractory CDOMenhancing microbial degradation (Kragh et al., 2008; Mopper, 2002;Moran and Zepp, 1997). The new experimental design offers a betterunderstanding of how color absorption decreases in a lake, whereconstant input of previously none UV-exposed water releases labilecompounds for bacterial degradation, compared to most previous ex-periment applying a single, initial UV-dose.
Our objective was to study the decrease in DOC concentrations andspectral light absorption of CDOM in the two main groundwater inputsand in the water of a humic softwater lake by using the new experi-mental design and comparing it with results obtained with a single orno UV-exposure. The obtained degradation rates were used in a theo-retical model to estimate future scenarios for the light environment inthe lake in which the main input of CDOM-rich coniferous groundwateris shifted to CDOM-poorer heathland groundwater and, thereby, po-tentially improves the vertical light penetration and cover of submergedvegetation.
2. Materials and methods
2.1. Study site and water sampling
Lake water and groundwater was collected in Lake Tvorup Hul andin the surrounding catchment in Nationalpark Thy in NW-Jutland,Denmark (56°91′N, 8°46′E). Lake Tvorup Hul is a mainly groundwaterfed small (surface area 4 ha), shallow lake (mean depth 2.5m, max-imum depth 7.5m) with a water retention time of about 1 year(Kristensen et al., 2017). Lake Tvorup Hul is an oligotrophic kettle lake,which before 1990 had transparent waters and a high diversity ofsubmerged rosette species, including the nationally threatened species,Isoetes echinospora and Subularia aquatica (Naturstyrelsen, 2011). Overthe past three decades, the lake has experienced increasing inputs ofCDOM from the surrounding coniferous forest and heathland leading toprofound brownification, decline of depth penetration and richness ofsubmerged plants as well as loss of the above-mentioned nationallythreatened species.
To reduce brownification, the Danish Nature Agency restructuredditches and closed surface drainage inlets to the lake already in 1992and by-passed the former surface inflow of humic-rich water. The watersources to the lake today are small amount of surface water duringsnow melt and exceptional high rainfall and a greater amount ofgroundwater with high concentrations of humic substances from thetwo main vegetation types, coniferous forest and heathland in thecatchment.
Water was collected at 1m depth in the lake and in groundwaterwells below the coniferous forest and heathland. The groundwater wascollected in autumn 2015 and the lake water in February 2016 beforethe spring development of phytoplankton. Groundwater was collectedfrom wells with water inflow at 2m depth that were emptied twicebefore sampling to ensure that only “fresh” groundwater was retrieved.All samples were kept in darkness, at low temperatures (5 °C) in large,acid-rinsed containers (10 L) for less than 6months until start of eachexperimental run. Experimental water consisted of 90% GF/F (0.7 µmnominal pore size GF/F) filtered water to remove all heterotrophic
M. Madsen-Østerbye et al. Ecological Engineering 118 (2018) 191–200
21
flagellates and microalgae and an inoculum of 10% GF/C (nominal poresize 1.2 µm) filtered water from the same source to secure the presencesof bacteria (Kragh et al., 2008). The procedure ensured the same initialproportion of water with an inoculum of bacteria in the experimentalwater. Changes in DOC are linked to the quality rather than the size ofthe inoculum (Kragh and Sondergaard, 2004). Bacteria have no pro-blem rebuilding their biomass after an inoculum of this magnitude fromboth soils, streams and lakes (Kragh et al., 2008; Risse-Buhl et al.,2013). The experimental bottles chosen for the experimental chambersin this experiment are large (0.75 L) and showed no “bottle effect” onthe concentration of bacteria (Kragh et al., 2008; Risse-Buhl et al.,2013).
2.2. Experimental design
The novel experimental design was constructed to mimic naturalconditions in the water column, where only a certain proportion of thewater is exposed to UV-irradiance during the day, due to the low pe-netration depth of UV light in the humic-rich waters. In this design, thesurface water is simulated by UV-exposure, while deep water withoutUV exposure is simulated by circulating the water to a dark reservoirchamber with only bacterial degradation. This ensures a constant inputof labile organic material, generated by UV-exposure in the lightchamber, into the dark chamber. The experimental setup consisted of awater reservoir (0.75 L) and a quartz-glass container (0.05 L) connectedin a closed circuit by inert PTFE Teflon tubes. UV-exposure of watertook place in the quartz container, while the reservoir was kept indarkness (see details below). A parallel experimental setup was kept incomplete darkness or with only an initial 24-h UV-exposure to assessmicrobial degradation in the absence of constant UV-exposure. All ex-periments were run in four replicates. To correct for possible con-tamination and artifacts such as adsorption to container walls andtubing, control experiments were also run with Milli-Q water (MilliporeMilli-Q academic water system, France) with no dissolved organicmatter and in sterile water with known initial DOC concentration. Thecontrols with Milli-Q water showed no systematic contaminationthroughout the 30-days experiments and there was no change in DOCconcentration in the DOC controls. Water was circulated by a BT1000-Lmulti-channel peristaltic pump (Langer Instruments, USA) at a ratecorresponding to a renewal time of 24 h. The renewal time on 24 h inthe experimental setup was selected based on the average “PistonVelocity”. The Piston Velocity was estimated by wind speed measure-ments by a weather station located next to the lake. The piston velocityis a measure of the turnover of the water in the lake. As of that theaverage exposure time to UV light in the surface water is determined bythe piston velocity. Higher piston velocity causes shorter exposure of asingle molecule in the surface. However, the whole water column willbe exposed to UV more frequent compared to a system with low pistonvelocity.
After each sampling, which slightly reduced the water volume, flowrate of the peristaltic pump was adjusted to maintain an unaltered re-newal time in the circuit. Water in the quartz-glass container was ex-posed at a distance of 15 cm to UV-light from a Q-Panel UVA-340 lamp(Q-LAB, USA) in a 12–12 light/dark cycle. The emission flux and wa-velength spectrum of the UV-light panel were measured with aStellarNet Inc. Black-Comet UV–VIS spectrometer model CXR(280–900 nm) and analyzed with SpectraWizz Spectroscopy software,light intensity 0.13Wm−2 measured at 340 nm. The light intensity wasmeasured over a year by the lake and the proportion of UVA in relationto total irradiance was established (details in UV-dose section). Theexperimental dose from the UVA-340 lamp (0.13Wm−2) correspondsto the average daily UV-dose on the lake.
Degradation experiments with the three water sources were per-formed over 30 days with 8 sampling points during the period. Watersamples were analyzed for DOC and CDOM (see below). The traditionalsingle dose design was a 24-h UV exposure followed by 39 days of
microbial degradation in darkness.
2.3. Analyses
CDOM absorbance was measured on newly GF/F (0.7 µm nominalpore size) filtered water on a UV-1800 SHIMADZU UV-spectro-photometer fitted with a 1 cm cuvette at 440 and 340 nm. Absorbanceat 440 nm has traditionally been used to describe water color infreshwater and light absorbance from CDOM (Cuthbert and Del Giorgio,1992). Absorbance is also presented at 340 nm as this was the wave-length of the emission peak from the UV-lamp. Absorbance values wereconverted to absorption coefficient at a given wavelength, α (λ), (unitm−1) by the relationship (Kirk, 1994):
= ∗α λ In A λ I( ) (10) ( )/ (1)
in which A(λ) is the absorbance at the given wavelength and I is thelight path (1 cm) through the cuvette in the spectrophotometer.
DOC samples were GF/F-filtered and conserved with 150 µL 2MHCl per 15mL sample to prevent degradation of organic matter. AllDOC samples were analyzed on a Shimadzu Total Organic CarbonAnalyzer according to methods of Kragh and Sondergaard (2004). Allsamples were visually checked and homogenized (whirl mixing andultrasonic bath) to dissolve any colloids before measurements as de-scribed by Kragh et al. (2008). DOC concentrations were measured bythe Non-Purgeable Organic Carbon method (NPOC) with a 3-point ca-libration curve (r2= 0.998) and with at least 3 injections for each watersample. For each sample run, a standard series and blanks were in-cluded. The accuracy of the analytic method is± 1%.
2.4. UV-dose
The dose of UV-exposure in the experiments was adjusted con-servatively to mimic natural conditions during an average day in thelake. Incoming UV-light on the lake at 340 nm was measured directlywith a black-comet spectrometer (StellarNet Inc., Tampa, Florida, US)in August 2016. UV data was related to simultaneous in situ measure-ments of the total PAR irradiance (400–700 nm) from January toDecember. Assuming a constant proportion of UV to PAR irradianceenabled calculation of the annual mean incoming UV-light on the lake.The incoming UV-light from the Q-Panel UVA-340 lamp in the experi-mental setup was adjusted to 65% of the annual mean UV-340 nm ra-diation in situ. To confirm that all UV-light was absorbed in the ex-periment, like in the lake, light measurements were performed showingthat less than 1% was left at a depth of 5 cm, which was the depth of thequarts bottle exposed to UV-light. The single dose design received a UV-dose of 0.65Wm−2 (as in Kragh et al., 2008; Vachon et al., 2017) andcorresponded to the accumulated UV-dose received over 30 days in theexperimental design.
2.5. Statistical analysis
The statistical analysis was made with GraphPad Prism 6.1. Thetools were linear and non-linear regression for comparisons of rates ofchange with time in the different experiments and at different wave-length. Figures show means ± SEM unless specified otherwise.Traditionally, the decrease of CDOM and DOC are modeled as simplefirst-orders degradations processes (Hanson et al., 2014; Hanson et al.,2011; Molot and Dillon, 1997; Stets et al., 2010), where more labilecompounds are degraded first, leaving more refractory DOC behindover time (Weyhenmeyer et al., 2012). First order degradation kineticsaccording to an exponential decline were used in the experiment with asingle UV-dose, while 0 order kinetics according to linear regressionprovided the best fit in the new experimental design due to constantinput of newly transformed compounds from continuous UV-exposure.
M. Madsen-Østerbye et al. Ecological Engineering 118 (2018) 191–200
22
2.6. Model scenarios of future lake light climate
The light model applied is a simple steady state model in whichchanges in light absorbing compounds were used to estimate possiblechanges in the light climate for Lake Tvorup Hul driven by changes ofthe vegetation in the catchment. The calculations were based on currentpool sizes and expected changes caused by UV-induced bacterial turn-over of CDOM and the corresponding changes in light absorption. Fromthese data, future CDOM absorption levels, new Secchi transparencyand lake bottom area of possible reestablishment of underwater vege-tation were calculated. The model takes all light absorbing compoundsin the range of 400–700 nm (PAR) into account.
Changes in lake CDOM absorption in the entire PAR range(400–700 nm) per unit time (dC/dt) was calculated according to thedifferential equation:
= − −dC dt C C C/ in out degradation (2)
Cin was calculated from CDOM absorption in groundwater from thedifferent catchment types before any UV-exposure had taken place.These absorption values were then multiplied by water input according
to lake water volume and water retention time (WRT). Lake volume wascalculated from lake bathymetry (see below) and a WRT-level set at1 year (Kristensen et al., 2017). Cout was calculated from CDOM ab-sorption in lake water before UV-exposure multiplied by lake watervolume and WRT. Cdegradation was calculated from the degradation ratesof CDOM absorption in the experimental approach with combined UV-exposure and microbial degradation and corrected to the field situationby adjusting the rates according to the in situ UV-exposure. The ex-perimental UV-dose was 65% of the in situ UV-dose. Model estimatesassume constant water renewal with time and do not take seasonalchanges into account because the model is used to establish the long-term steady state of the system and not the seasonal changes. Conse-quently, the photo-induced degradation has been averaged over theyear disregarding seasonal changes. The calculations were performedby iteration in time steps of one day. Initial lake concentration was setas the measured lake values in February 2016. The model was run for10,000 days, though steady state was obtained within 2 years in allscenarios reflected by a constant absorption values at zero values of dC/dt (simulation in supplementary data). Simulations were made for thecontemporary situation, for an altered catchment covered solely by
0 5 10 15 20 25 30 350
1
2
3
4
5
6
Dark controls
(a)
Light exposed
Heathland
DO
C (m
g C
L-1
)
0 5 10 15 20 25 30 35 400
1
2
3
4
5
6(b)
After UV exposureBefore UV exposure
Heathland
0 5 10 15 20 25 30 3525
30
35
40
45
50(c)Forest
DO
C (m
g C
L-1
)
0 5 10 15 20 25 30 35 4025
30
35
40
45
50(d)Forest
0 5 10 15 20 25 30 358
9
10
11
12
13
14
15(e)Lake
Number of days
DO
C (m
g C
L-1
)
0 5 10 15 20 25 30 35 408
9
10
11
12
13
14
15(f)Lake
Number of days
Fig. 1. DOC concentration with incubation time in groundwater from heathland (a and b), groundwater from coniferous forest (c and d) and water from Lake TvorupHul (e and f). Left column (a, c and e): degradation in complete darkness (solid symbols) or assisted by continuous UV-exposure (open symbols). Right column (b, dand f): degradation in complete darkness following initial UV-exposure for 24 h. Mean ± SEM (n=4) are presented. Horizontal and vertical scales differ betweenpanels.
M. Madsen-Østerbye et al. Ecological Engineering 118 (2018) 191–200
23
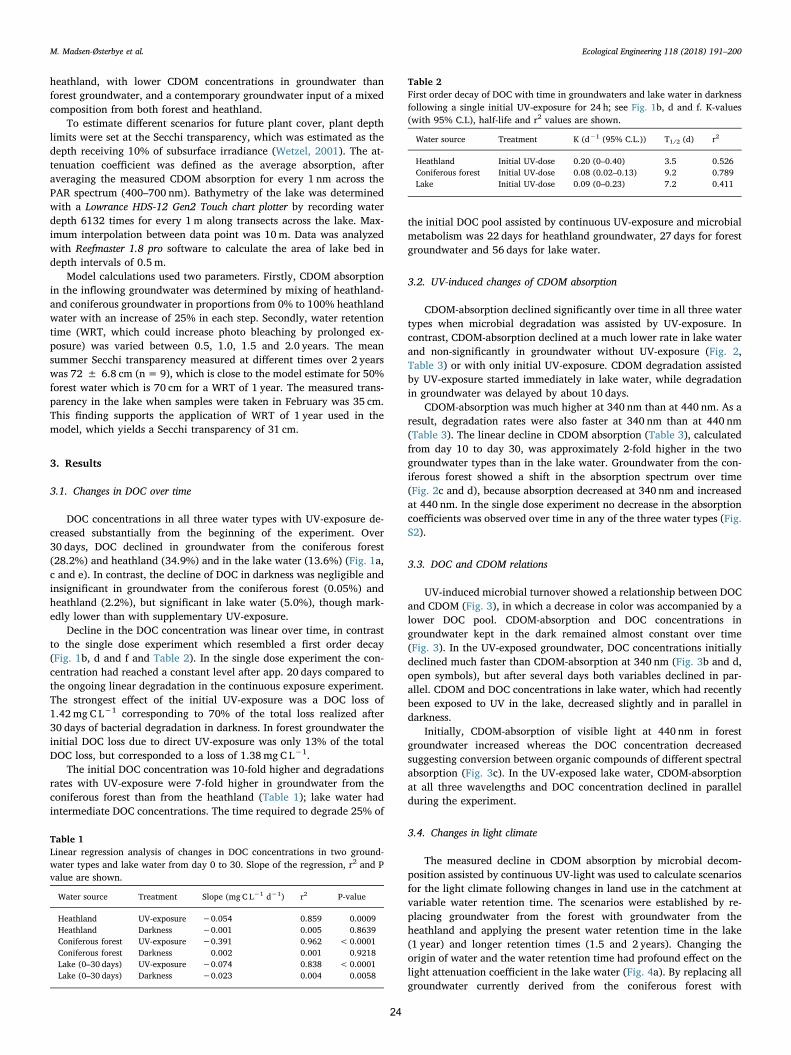
heathland, with lower CDOM concentrations in groundwater thanforest groundwater, and a contemporary groundwater input of a mixedcomposition from both forest and heathland.
To estimate different scenarios for future plant cover, plant depthlimits were set at the Secchi transparency, which was estimated as thedepth receiving 10% of subsurface irradiance (Wetzel, 2001). The at-tenuation coefficient was defined as the average absorption, afteraveraging the measured CDOM absorption for every 1 nm across thePAR spectrum (400–700 nm). Bathymetry of the lake was determinedwith a Lowrance HDS-12 Gen2 Touch chart plotter by recording waterdepth 6132 times for every 1m along transects across the lake. Max-imum interpolation between data point was 10m. Data was analyzedwith Reefmaster 1.8 pro software to calculate the area of lake bed indepth intervals of 0.5 m.
Model calculations used two parameters. Firstly, CDOM absorptionin the inflowing groundwater was determined by mixing of heathland-and coniferous groundwater in proportions from 0% to 100% heathlandwater with an increase of 25% in each step. Secondly, water retentiontime (WRT, which could increase photo bleaching by prolonged ex-posure) was varied between 0.5, 1.0, 1.5 and 2.0 years. The meansummer Secchi transparency measured at different times over 2 yearswas 72 ± 6.8 cm (n=9), which is close to the model estimate for 50%forest water which is 70 cm for a WRT of 1 year. The measured trans-parency in the lake when samples were taken in February was 35 cm.This finding supports the application of WRT of 1 year used in themodel, which yields a Secchi transparency of 31 cm.
3. Results
3.1. Changes in DOC over time
DOC concentrations in all three water types with UV-exposure de-creased substantially from the beginning of the experiment. Over30 days, DOC declined in groundwater from the coniferous forest(28.2%) and heathland (34.9%) and in the lake water (13.6%) (Fig. 1a,c and e). In contrast, the decline of DOC in darkness was negligible andinsignificant in groundwater from the coniferous forest (0.05%) andheathland (2.2%), but significant in lake water (5.0%), though mark-edly lower than with supplementary UV-exposure.
Decline in the DOC concentration was linear over time, in contrastto the single dose experiment which resembled a first order decay(Fig. 1b, d and f and Table 2). In the single dose experiment the con-centration had reached a constant level after app. 20 days compared tothe ongoing linear degradation in the continuous exposure experiment.The strongest effect of the initial UV-exposure was a DOC loss of1.42mg C L−1 corresponding to 70% of the total loss realized after30 days of bacterial degradation in darkness. In forest groundwater theinitial DOC loss due to direct UV-exposure was only 13% of the totalDOC loss, but corresponded to a loss of 1.38mg C L−1.
The initial DOC concentration was 10-fold higher and degradationsrates with UV-exposure were 7-fold higher in groundwater from theconiferous forest than from the heathland (Table 1); lake water hadintermediate DOC concentrations. The time required to degrade 25% of
the initial DOC pool assisted by continuous UV-exposure and microbialmetabolism was 22 days for heathland groundwater, 27 days for forestgroundwater and 56 days for lake water.
3.2. UV-induced changes of CDOM absorption
CDOM-absorption declined significantly over time in all three watertypes when microbial degradation was assisted by UV-exposure. Incontrast, CDOM-absorption declined at a much lower rate in lake waterand non-significantly in groundwater without UV-exposure (Fig. 2,Table 3) or with only initial UV-exposure. CDOM degradation assistedby UV-exposure started immediately in lake water, while degradationin groundwater was delayed by about 10 days.
CDOM-absorption was much higher at 340 nm than at 440 nm. As aresult, degradation rates were also faster at 340 nm than at 440 nm(Table 3). The linear decline in CDOM absorption (Table 3), calculatedfrom day 10 to day 30, was approximately 2-fold higher in the twogroundwater types than in the lake water. Groundwater from the con-iferous forest showed a shift in the absorption spectrum over time(Fig. 2c and d), because absorption decreased at 340 nm and increasedat 440 nm. In the single dose experiment no decrease in the absorptioncoefficients was observed over time in any of the three water types (Fig.S2).
3.3. DOC and CDOM relations
UV-induced microbial turnover showed a relationship between DOCand CDOM (Fig. 3), in which a decrease in color was accompanied by alower DOC pool. CDOM-absorption and DOC concentrations ingroundwater kept in the dark remained almost constant over time(Fig. 3). In the UV-exposed groundwater, DOC concentrations initiallydeclined much faster than CDOM-absorption at 340 nm (Fig. 3b and d,open symbols), but after several days both variables declined in par-allel. CDOM and DOC concentrations in lake water, which had recentlybeen exposed to UV in the lake, decreased slightly and in parallel indarkness.
Initially, CDOM-absorption of visible light at 440 nm in forestgroundwater increased whereas the DOC concentration decreasedsuggesting conversion between organic compounds of different spectralabsorption (Fig. 3c). In the UV-exposed lake water, CDOM-absorptionat all three wavelengths and DOC concentration declined in parallelduring the experiment.
3.4. Changes in light climate
The measured decline in CDOM absorption by microbial decom-position assisted by continuous UV-light was used to calculate scenariosfor the light climate following changes in land use in the catchment atvariable water retention time. The scenarios were established by re-placing groundwater from the forest with groundwater from theheathland and applying the present water retention time in the lake(1 year) and longer retention times (1.5 and 2 years). Changing theorigin of water and the water retention time had profound effect on thelight attenuation coefficient in the lake water (Fig. 4a). By replacing allgroundwater currently derived from the coniferous forest with
Table 1Linear regression analysis of changes in DOC concentrations in two ground-water types and lake water from day 0 to 30. Slope of the regression, r2 and Pvalue are shown.
Water source Treatment Slope (mg C L−1 d−1) r2 P-value
Heathland UV-exposure −0.054 0.859 0.0009Heathland Darkness −0.001 0.005 0.8639Coniferous forest UV-exposure −0.391 0.962 <0.0001Coniferous forest Darkness 0.002 0.001 0.9218Lake (0–30 days) UV-exposure −0.074 0.838 <0.0001Lake (0–30 days) Darkness −0.023 0.004 0.0058
Table 2First order decay of DOC with time in groundwaters and lake water in darknessfollowing a single initial UV-exposure for 24 h; see Fig. 1b, d and f. K-values(with 95% C.L), half-life and r2 values are shown.
Water source Treatment K (d−1 (95% C.L.)) T1/2 (d) r2
Heathland Initial UV-dose 0.20 (0–0.40) 3.5 0.526Coniferous forest Initial UV-dose 0.08 (0.02–0.13) 9.2 0.789Lake Initial UV-dose 0.09 (0–0.23) 7.2 0.411
M. Madsen-Østerbye et al. Ecological Engineering 118 (2018) 191–200
24
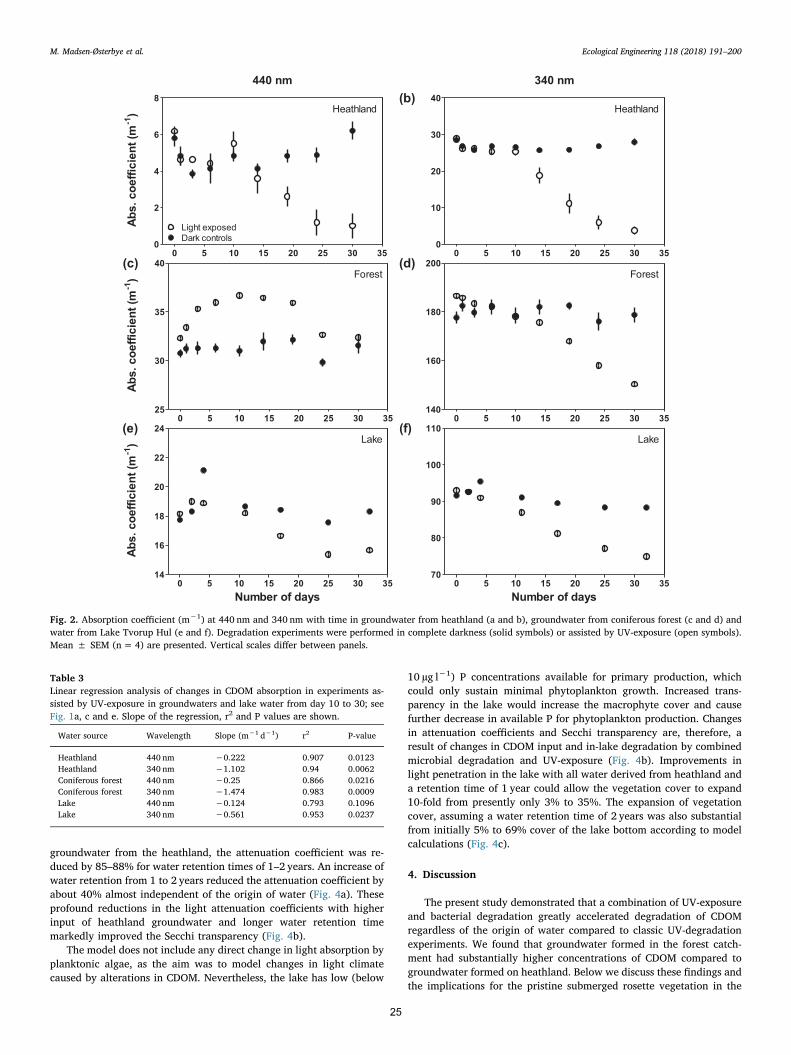
groundwater from the heathland, the attenuation coefficient was re-duced by 85–88% for water retention times of 1–2 years. An increase ofwater retention from 1 to 2 years reduced the attenuation coefficient byabout 40% almost independent of the origin of water (Fig. 4a). Theseprofound reductions in the light attenuation coefficients with higherinput of heathland groundwater and longer water retention timemarkedly improved the Secchi transparency (Fig. 4b).
The model does not include any direct change in light absorption byplanktonic algae, as the aim was to model changes in light climatecaused by alterations in CDOM. Nevertheless, the lake has low (below
10 µg l−1) P concentrations available for primary production, whichcould only sustain minimal phytoplankton growth. Increased trans-parency in the lake would increase the macrophyte cover and causefurther decrease in available P for phytoplankton production. Changesin attenuation coefficients and Secchi transparency are, therefore, aresult of changes in CDOM input and in-lake degradation by combinedmicrobial degradation and UV-exposure (Fig. 4b). Improvements inlight penetration in the lake with all water derived from heathland anda retention time of 1 year could allow the vegetation cover to expand10-fold from presently only 3% to 35%. The expansion of vegetationcover, assuming a water retention time of 2 years was also substantialfrom initially 5% to 69% cover of the lake bottom according to modelcalculations (Fig. 4c).
4. Discussion
The present study demonstrated that a combination of UV-exposureand bacterial degradation greatly accelerated degradation of CDOMregardless of the origin of water compared to classic UV-degradationexperiments. We found that groundwater formed in the forest catch-ment had substantially higher concentrations of CDOM compared togroundwater formed on heathland. Below we discuss these findings andthe implications for the pristine submerged rosette vegetation in the
440 nm
0 5 10 15 20 25 30 350
2
4
6
8
Dark controlsLight exposed
Heathland
Abs.
coe
ffici
ent (
m-1
)
340 nm
0 5 10 15 20 25 30 350
10
20
30
40(b)Heathland
0 5 10 15 20 25 30 3525
30
35
40(c)Forest
Abs.
coe
ffici
ent (
m-1
)
0 5 10 15 20 25 30 35140
160
180
200(d)Forest
0 5 10 15 20 25 30 3514
16
18
20
22
24(e)Lake
Number of days
Abs.
coe
ffici
ent (
m-1
)
0 5 10 15 20 25 30 3570
80
90
100
110(f)Lake
Number of days
Fig. 2. Absorption coefficient (m−1) at 440 nm and 340 nm with time in groundwater from heathland (a and b), groundwater from coniferous forest (c and d) andwater from Lake Tvorup Hul (e and f). Degradation experiments were performed in complete darkness (solid symbols) or assisted by UV-exposure (open symbols).Mean ± SEM (n=4) are presented. Vertical scales differ between panels.
Table 3Linear regression analysis of changes in CDOM absorption in experiments as-sisted by UV-exposure in groundwaters and lake water from day 10 to 30; seeFig. 1a, c and e. Slope of the regression, r2 and P values are shown.
Water source Wavelength Slope (m−1 d−1) r2 P-value
Heathland 440 nm −0.222 0.907 0.0123Heathland 340 nm −1.102 0.94 0.0062Coniferous forest 440 nm −0.25 0.866 0.0216Coniferous forest 340 nm −1.474 0.983 0.0009Lake 440 nm −0.124 0.793 0.1096Lake 340 nm −0.561 0.953 0.0237
M. Madsen-Østerbye et al. Ecological Engineering 118 (2018) 191–200
25
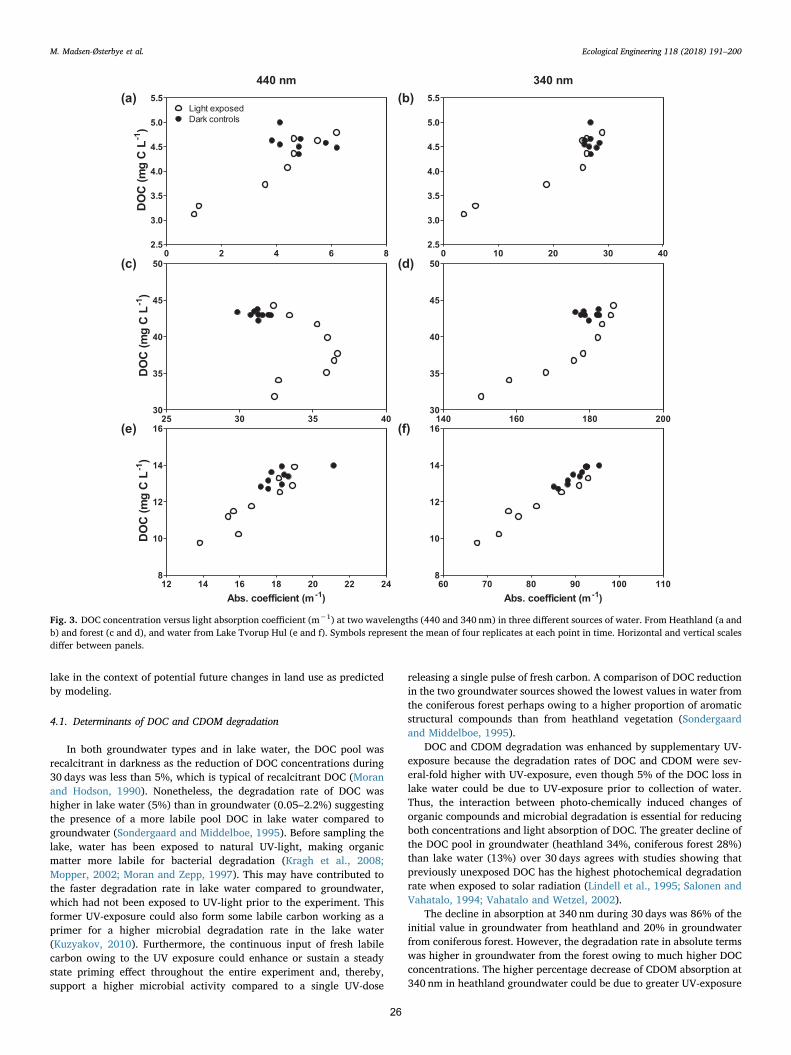
lake in the context of potential future changes in land use as predictedby modeling.
4.1. Determinants of DOC and CDOM degradation
In both groundwater types and in lake water, the DOC pool wasrecalcitrant in darkness as the reduction of DOC concentrations during30 days was less than 5%, which is typical of recalcitrant DOC (Moranand Hodson, 1990). Nonetheless, the degradation rate of DOC washigher in lake water (5%) than in groundwater (0.05–2.2%) suggestingthe presence of a more labile pool DOC in lake water compared togroundwater (Sondergaard and Middelboe, 1995). Before sampling thelake, water has been exposed to natural UV-light, making organicmatter more labile for bacterial degradation (Kragh et al., 2008;Mopper, 2002; Moran and Zepp, 1997). This may have contributed tothe faster degradation rate in lake water compared to groundwater,which had not been exposed to UV-light prior to the experiment. Thisformer UV-exposure could also form some labile carbon working as aprimer for a higher microbial degradation rate in the lake water(Kuzyakov, 2010). Furthermore, the continuous input of fresh labilecarbon owing to the UV exposure could enhance or sustain a steadystate priming effect throughout the entire experiment and, thereby,support a higher microbial activity compared to a single UV-dose
releasing a single pulse of fresh carbon. A comparison of DOC reductionin the two groundwater sources showed the lowest values in water fromthe coniferous forest perhaps owing to a higher proportion of aromaticstructural compounds than from heathland vegetation (Sondergaardand Middelboe, 1995).
DOC and CDOM degradation was enhanced by supplementary UV-exposure because the degradation rates of DOC and CDOM were sev-eral-fold higher with UV-exposure, even though 5% of the DOC loss inlake water could be due to UV-exposure prior to collection of water.Thus, the interaction between photo-chemically induced changes oforganic compounds and microbial degradation is essential for reducingboth concentrations and light absorption of DOC. The greater decline ofthe DOC pool in groundwater (heathland 34%, coniferous forest 28%)than lake water (13%) over 30 days agrees with studies showing thatpreviously unexposed DOC has the highest photochemical degradationrate when exposed to solar radiation (Lindell et al., 1995; Salonen andVahatalo, 1994; Vahatalo and Wetzel, 2002).
The decline in absorption at 340 nm during 30 days was 86% of theinitial value in groundwater from heathland and 20% in groundwaterfrom coniferous forest. However, the degradation rate in absolute termswas higher in groundwater from the forest owing to much higher DOCconcentrations. The higher percentage decrease of CDOM absorption at340 nm in heathland groundwater could be due to greater UV-exposure
440 nm
0 2 4 6 82.5
3.0
3.5
4.0
4.5
5.0
5.5(a)Dark controlsLight exposed
DO
C (m
g C
L-1
)
340 nm
0 10 20 30 402.5
3.0
3.5
4.0
4.5
5.0
5.5(b)
25 30 35 4030
35
40
45
50(c)
DO
C (m
g C
L-1
)
140 160 180 20030
35
40
45
50(d)
12 14 16 18 20 22 248
10
12
14
16(e)
Abs. coefficient (m-1)
DO
C (m
g C
L-1
)
60 70 80 90 100 1108
10
12
14
16(f)
Abs. coefficient (m-1)
Fig. 3. DOC concentration versus light absorption coefficient (m−1) at two wavelengths (440 and 340 nm) in three different sources of water. From Heathland (a andb) and forest (c and d), and water from Lake Tvorup Hul (e and f). Symbols represent the mean of four replicates at each point in time. Horizontal and vertical scalesdiffer between panels.
M. Madsen-Østerbye et al. Ecological Engineering 118 (2018) 191–200
26
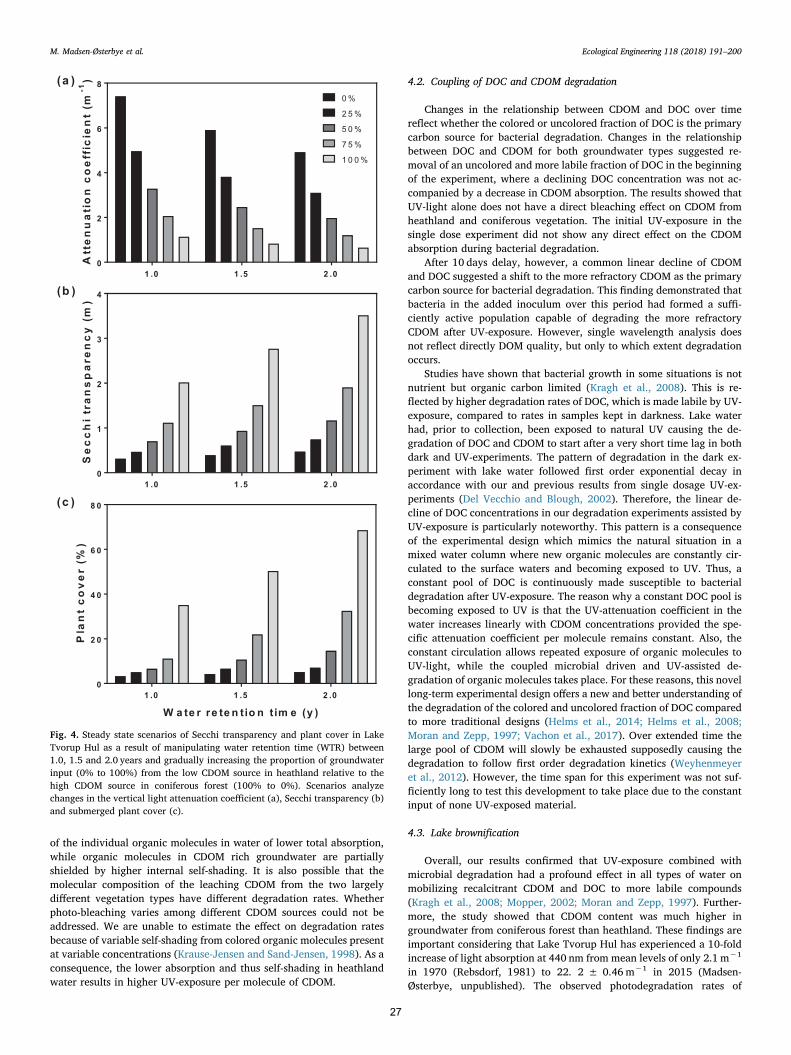
of the individual organic molecules in water of lower total absorption,while organic molecules in CDOM rich groundwater are partiallyshielded by higher internal self-shading. It is also possible that themolecular composition of the leaching CDOM from the two largelydifferent vegetation types have different degradation rates. Whetherphoto-bleaching varies among different CDOM sources could not beaddressed. We are unable to estimate the effect on degradation ratesbecause of variable self-shading from colored organic molecules presentat variable concentrations (Krause-Jensen and Sand-Jensen, 1998). As aconsequence, the lower absorption and thus self-shading in heathlandwater results in higher UV-exposure per molecule of CDOM.
4.2. Coupling of DOC and CDOM degradation
Changes in the relationship between CDOM and DOC over timereflect whether the colored or uncolored fraction of DOC is the primarycarbon source for bacterial degradation. Changes in the relationshipbetween DOC and CDOM for both groundwater types suggested re-moval of an uncolored and more labile fraction of DOC in the beginningof the experiment, where a declining DOC concentration was not ac-companied by a decrease in CDOM absorption. The results showed thatUV-light alone does not have a direct bleaching effect on CDOM fromheathland and coniferous vegetation. The initial UV-exposure in thesingle dose experiment did not show any direct effect on the CDOMabsorption during bacterial degradation.
After 10 days delay, however, a common linear decline of CDOMand DOC suggested a shift to the more refractory CDOM as the primarycarbon source for bacterial degradation. This finding demonstrated thatbacteria in the added inoculum over this period had formed a suffi-ciently active population capable of degrading the more refractoryCDOM after UV-exposure. However, single wavelength analysis doesnot reflect directly DOM quality, but only to which extent degradationoccurs.
Studies have shown that bacterial growth in some situations is notnutrient but organic carbon limited (Kragh et al., 2008). This is re-flected by higher degradation rates of DOC, which is made labile by UV-exposure, compared to rates in samples kept in darkness. Lake waterhad, prior to collection, been exposed to natural UV causing the de-gradation of DOC and CDOM to start after a very short time lag in bothdark and UV-experiments. The pattern of degradation in the dark ex-periment with lake water followed first order exponential decay inaccordance with our and previous results from single dosage UV-ex-periments (Del Vecchio and Blough, 2002). Therefore, the linear de-cline of DOC concentrations in our degradation experiments assisted byUV-exposure is particularly noteworthy. This pattern is a consequenceof the experimental design which mimics the natural situation in amixed water column where new organic molecules are constantly cir-culated to the surface waters and becoming exposed to UV. Thus, aconstant pool of DOC is continuously made susceptible to bacterialdegradation after UV-exposure. The reason why a constant DOC pool isbecoming exposed to UV is that the UV-attenuation coefficient in thewater increases linearly with CDOM concentrations provided the spe-cific attenuation coefficient per molecule remains constant. Also, theconstant circulation allows repeated exposure of organic molecules toUV-light, while the coupled microbial driven and UV-assisted de-gradation of organic molecules takes place. For these reasons, this novellong-term experimental design offers a new and better understanding ofthe degradation of the colored and uncolored fraction of DOC comparedto more traditional designs (Helms et al., 2014; Helms et al., 2008;Moran and Zepp, 1997; Vachon et al., 2017). Over extended time thelarge pool of CDOM will slowly be exhausted supposedly causing thedegradation to follow first order degradation kinetics (Weyhenmeyeret al., 2012). However, the time span for this experiment was not suf-ficiently long to test this development to take place due to the constantinput of none UV-exposed material.
4.3. Lake brownification
Overall, our results confirmed that UV-exposure combined withmicrobial degradation had a profound effect in all types of water onmobilizing recalcitrant CDOM and DOC to more labile compounds(Kragh et al., 2008; Mopper, 2002; Moran and Zepp, 1997). Further-more, the study showed that CDOM content was much higher ingroundwater from coniferous forest than heathland. These findings areimportant considering that Lake Tvorup Hul has experienced a 10-foldincrease of light absorption at 440 nm from mean levels of only 2.1m−1
in 1970 (Rebsdorf, 1981) to 22. 2 ± 0.46m−1 in 2015 (Madsen-Østerbye, unpublished). The observed photodegradation rates of
1 .0 1 .5 2 .00
2 0
4 0
6 0
8 0(c )
W a te r re te n tio n tim e (y )
Pla
nt
co
ve
r(%
)
1 .0 1 .5 2 .00
2
4
6
80 %
2 5 %
5 0 %
7 5 %
1 0 0 %
(a )A
tte
nu
ati
on
co
eff
icie
nt
(m-1
)
1 .0 1 .5 2 .00
1
2
3
4(b )
Se
cc
hi
tra
ns
pa
ren
cy
(m)
Fig. 4. Steady state scenarios of Secchi transparency and plant cover in LakeTvorup Hul as a result of manipulating water retention time (WTR) between1.0, 1.5 and 2.0 years and gradually increasing the proportion of groundwaterinput (0% to 100%) from the low CDOM source in heathland relative to thehigh CDOM source in coniferous forest (100% to 0%). Scenarios analyzechanges in the vertical light attenuation coefficient (a), Secchi transparency (b)and submerged plant cover (c).
M. Madsen-Østerbye et al. Ecological Engineering 118 (2018) 191–200
27
leached CDOM imply that the light climate in Lake Tvorup Hul, andother similar lakes, can be improved and the depth limit for growth ofrosette species expanded if input of brown-colored substances is re-duced.
Lake recovery could be accelerated by reducing input of CDOM-richgroundwater and by increasing lake water retention time allowing moretime for combined UV-mobilization and bacterial degradation of therecalcitrant CDOM to take place. Those effects would be most pro-nounced in shallow water bodies such as dune slacks, which areabundant in Nationalpark Thy, compared to deeper lakes such as LakeTvorup Hul where only the upper 5 cm of the water column experiencesubstantial UV-exposure.
The vegetation type in the catchment is crucial for lake brownifi-cation because CDOM absorption was 5-fold higher in forest thanheathland groundwater reaching the lake which further supports thestrong effect of land use and catchment vegetation on CDOM content infreshwaters (Kritzberg, 2017). Historically, these differences in CDOMabsorption between groundwater from heathland and coniferous forestcould have contributed to increase brownification of waters in Natio-nalpark Thy through the replacement of heathland by coniferous forestfrom 1870 and onwards. Considering that the profound changes ofbrownification took place from 1970 to 2015, however, changes incatchment vegetation are probably not the only reason for the observedchanges, though gradual formation of larger organic soil pools overcenturies may increase the impact. It seems likely that increasing pre-cipitation and drainage of the forest soils as well as reduced atmo-spheric deposition of acids during the last decades (Driscoll et al., 2001;Kristensen et al., 2017; Kritzberg, 2017; Stoddard et al., 1999) haveplayed an additional role in the more recent brownification.
4.4. Deforestation and modeled future lake climate
According to the differences of absorption characteristics betweengroundwater from coniferous forest and heathland, the effect of repla-cing coniferous forest with heathland vegetation in the catchment couldbe a 6.5-fold decline of light absorption in the water entering LakeTvorup Hul. This difference corresponds to changes to water with aSecchi transparency of 1.18m in heathland groundwater compared to0.35m in forest groundwater. The time needed for a 50% decrease ofthe light absorbing CDOM is five times longer for the forest ground-water (64 days) than the heathland groundwater (13 days). However,these linear degradations rates estimated during the 30-days long ex-periments would probably slow down during extended degradationwith rates changing in proportion to falling concentrations, thoughincreasing UV-exposure of individual organic molecules at lower con-centrations could extend the period of linear decline beyond the ex-perimental period of 30 for all three water sources.
Model estimates for Lake Tvorup Hul result in an average Secchitransparency of 0.31m with the present input of brown-colored waterand a water retention time of one year. Changing the entire catchmentto heathland vegetation, Secchi transparency could reach a new steadystate level of 2.0m with the current water retention of 1 year. In ascenario where water retention time was 2 years and the catchmentonly consisted of heathland, the Secchi transparency could reach almost3.5 m. As much as 69% of the lake area has water depths below 3.5 m.Such strong effect on the light climate is the result of much longer timeavailable for photo-induced degradation to take place. Also, with thecurrent vegetation in the catchment, the Secchi transparency could riseto 1.2m solely if retention time in Lake Tvorup Hul increased to 2 years.
An increase of the Secchi transparency to 2m in the scenario withthe present water retention time of 1 year and complete heathlandcover would lead to expansion of the possible plant covered area from3% to 35% of the lake bottom. The time delay for obtaining this newsteady-state of light penetration in the lake depends on the time framefor depletion of the terrestrial soil organic carbon pool and leaching ofCDOM from the soils. Studies show that the immediate effect of clear-
cutting of the catchment vegetation could be a 2 to 5-fold increase ofleaching of DOC and CDOM from former forest soils (Kreutzweiseret al., 2008) associated with an increased input of nutrients that couldaffect phytoplankton and bacterial growth and, thus, DOC and CDOMdynamics (Nieminen, 2004). This initial input could then be followedby a reduction after three-five years, while the soil pools are graduallybeing depleted (Hinton et al., 1997; Startsev et al., 1998). A new steady-state of reduced leaching could be attained after about 10 years (Murtyet al., 2002).
Consequently, after clear-cutting and establishment of heathlandvegetation, Lake Tvorup Hul could ideally reach a new steady state ofhigh light penetration after 11–13 years assuming that no major phy-toplankton production develops. With the short water retention time inthe lake in mind, the determining factor for improvement of light pe-netration would be depletion of the pool of soil organic matter andassociated nutrients in the catchment. The depletion would be influ-enced by precipitation causing leaching of soil water (Evans et al.,2006; Roulet and Moore, 2006; Worrall and Burt, 2007). This aspect isrelevant for future measurements and modelling considering the on-going increase in precipitation which affects both leaching of soil or-ganic pools and retention time and organic degradation in the lakes.
Managing a lake to optimize conditions for one single organismgroup, in this case the pristine rosette species, would affect other spe-cies differently (some negatively et al., positively) and overall lakeecology would change. However, expanding the cover of rosette specieswould reduce internal nutrient loading through plant uptake and rootoxidation of sediments, enhancing denitrification and phosphorus(Frandsen et al., 2012; Petersen and Jensen, 1997) providing habitatand shelter for invertebrates and fish (Jeppesen et al., 2012) andthereby, have a general beneficial influence on lake ecology.
Acknowledgements
We thank The Villum Kann Rasmussen Foundation for financialsupport to the Centre of Excellence for Research on Lake Restoration(CLEAR) making this study possible. The logistical support byNationalpark Thy and Naturstyrelsen is greatly appreciated.
We thank Anne Jacobsen for technical assistance in the laboratory.
Appendix A. Supplementary data
Supplementary data associated with this article can be found, in theonline version, at http://dx.doi.org/10.1016/j.ecoleng.2018.04.018.
References
Agren, A., Berggren, M., Laudon, H., Jansson, M., 2008. Terrestrial export of highlybioavailable carbon from small boreal catchments in spring floods. Freshwater Biol.53, 964–972.
Aiken, G.R., McKnight, D.M., Wershaw, R.L., MacCarthy, P.E., 1985. Humic substances insoil, sediment, and water – Geochemistry, isolation and characterization. John Weily& Sons, New York.
Arrigo, K.R., Brown, C.W., 1996. Impact of chromophoric dissolved organic matter on UVinhibition of primary productivity in the sea. Mar. Ecol. Prog. Ser. 140, 207–216.
Arts, G.H., 2002. Deterioration of Atlantic soft water macrophyte communities by acid-ification, eutrophication and alkalinisation. Aquat. Bot. 73, 373–393.
Baines, S.B., Pace, M.L., 1991. The production of dissolved organic-matter by phyto-plankton and its importance to bacteria – Patterns across marine and fresh-watersystems. Limnol. Oceanogr. 36, 1078–1090.
Barko, J.W., Gunnison, D., Carpenter, S.R., 1991. Sediment interactions with submersedmacrophyte growth and community dynamics. Aquat. Bot. 41, 41–65.
Bertilsson, S., Tranvik, L.J., 2000. Photochemical transformation of dissolved organicmatter in lakes. Limnol. Oceanogr. 45, 753–762.
Bricaud, A., Morel, A., Prieur, L., 1981. Absorption by dissolved organic-matter of the sea(yellow substance) in the UV and visible domains. Limnol. Oceanogr. 26, 43–53.
Brouwer, E., Bobbink, R., Roelofs, J.G.M., 2002. Restoration of aquatic macrophyte ve-getation in acidified and eutrophied softwater lakes: an overview. Aquat. Bot. 73,405–431.
Cuthbert, I.D., Del Giorgio, P., 1992. Toward a standard method of measuring color infresh-water. Limnol. Oceanogr. 37, 1319–1326.
Del Vecchio, R., Blough, N.V., 2002. Photobleaching of chromophoric dissolved organicmatter in natural waters: kinetics and modeling. Mar. Chem. 78, 231–253.
Driscoll, C.T., Lawrence, G.B., Bulger, A.J., Butler, T.J., Cronan, C.S., Eagar, C., Lambert,
M. Madsen-Østerbye et al. Ecological Engineering 118 (2018) 191–200
28
K.F., Likens, G.E., Stoddard, J.L., Weathers, K.C., 2001. Acidic deposition in thenortheastern United States: sources and inputs, ecosystem effects, and managementstrategies. Bioscience 51, 180–198.
Ekstrom, S.M., Kritzberg, E.S., Kleja, D.B., Larsson, N., Nilsson, P.A., Graneli, W.,Bergkvist, B., 2011. Effect of acid deposition on quantity and quality of dissolvedorganic matter in soil-water. Environ. Sci. Technol. 45, 4733–4739.
Evans, C.D., Chapman, P.J., Clark, J.M., Monteith, D.T., Cresser, M.S., 2006. Alternativeexplanations for rising dissolved organic carbon export from organic soils. Glob.Change Biol. 12, 2044–2053.
Evans, C.D., Jones, T.G., Burden, A., Ostle, N., Zielinski, P., Cooper, M.D.A., Peacock, M.,Clark, J.M., Oulehle, F., Cooper, D., Freeman, C., 2012. Acidity controls on dissolvedorganic carbon mobility in organic soils. Glob. Change Biol. 18, 3317–3331.
Frandsen, M., Nilsson, B., Engesgaard, P., Pedersen, O., 2012. Groundwater seepage sti-mulates the growth of aquatic macrophytes. Freshwater Biol. 57, 907–921.
Freeman, C., Evans, C.D., Monteith, D.T., Reynolds, B., Fenner, N., 2001. Export of or-ganic carbon from peat soils. Nature 412 785–785.
Goldstone, J.V., Del Vecchio, R., Blough, N.V., Voelker, B.M., 2004. A multicomponentmodel of chromophoric dissolved organic matter photobleaching. Photochem.Photobiol. 80, 52–60.
Hanson, P.C., Buffam, I., Rusak, J.A., Stanley, E.H., Watras, C., 2014. Quantifying lakeallochthonous organic carbon budgets using a simple equilibrium model. Limnol.Oceanogr. 59, 167–181.
Hanson, P.C., Hamilton, D.P., Stanley, E.H., Preston, N., Langman, O.C., Kara, E.L., 2011.Fate of allochthonous dissolved organic carbon in lakes: a quantitative approach.PLoS One 6, e21884.
Helms, J.R., Mao, J.D., Stubbins, A., Schmidt-Rohr, K., Spencer, R.G.M., Hernes, P.J.,Mopper, K., 2014. Loss of optical and molecular indicators of terrigenous dissolvedorganic matter during long-term photobleaching. Aquat. Sci. 76, 353–373.
Helms, J.R., Stubbins, A., Ritchie, J.D., Minor, E.C., Kieber, D.J., Mopper, K., 2008.Absorption spectral slopes and slope ratios as indicators of molecular weight, source,and photobleaching of chromophoric dissolved organic matter. Limnol. Oceanogr.53, 955–969.
Hinton, M.J., Schiff, S.L., English, M.C., 1997. The significance of storms for the con-centration and export of dissolved organic carbon from two Precambrian Shieldcatchments. Biogeochemistry 36, 67–88.
Hongve, D., Riise, G., Kristiansen, J.F., 2004. Increased colour and organic acid con-centrations in Norwegian forest lakes and drinking water – a result of increasedprecipitation? Aquat. Sci. 66, 231–238.
Hopkinson, C.S., Vallino, J.J., Nolin, A., 2002. Decomposition of dissolved organic matterfrom the continental margin. Deep-Sea Res. 49, 4461–4478.
Hultberg, H., Grennfelt, P., 1986. Gardsjon project – Lake acidification, chemistry incatchment runoff, lake liming and microcatchment manipulations. Water Air SoilPoll. 30, 31–46.
Jeppesen, E., Sondergaard, M., Sondergaard, M., Christofferson, K., 2012. The structuringrole of submerged macrophytes in lakes. Springer Science & Business Media.
Jones, R.I., 1992. The influence of humic substances on lacustrine planktonic food-chains.Hydrobiologia 229, 73–91.
Jones, R.I., 1998. 1998. Phytoplankton, primary production and nustrient cycling. In:Hessen, D.O., Tranvik, L.J. (Eds.), Aquatic Humic Substances: Ecology andBiogeochemistry. Springer-Verlag, pp. 145–195.
Jones, T.G., Evans, C.D., Jones, D.L., Hill, P.W., Freeman, C., 2016. Transformations inDOC along a source to sea continuum; impacts of photo-degradation, biologicalprocesses and mixing. Aquat. Sci. 78, 433–446.
Kirk, J.T.O., 1994. Light and Photosynthesis in Aquatic Ecosystems, 2nd edition.Cambridge University Press.
Kragh, T., Sondergaard, M., 2004. Production and bioavailability of autochthonous dis-solved organic carbon: effects of mesozooplankton. Aquat. Microb. Ecol. 36, 61–72.
Kragh, T., Sondergaard, M., Tranvik, L., 2008. Effect of exposure to sunlight and phos-phorus-limitation on bacterial degradation of coloured dissolved organic matter(CDOM) in freshwater. FEMS Microbiol. Ecol. 64, 230–239.
Krause-Jensen, D., Sand-Jensen, K., 1998. Light attenuation and photosynthesis of aquaticplant communities. Limnol. Oceanogr. 43, 396–407.
Kreutzweiser, D.P., Hazlett, P.W., Gunn, J.M., 2008. Logging impacts on the bio-geochemistry of boreal forest soils and nutrient export to aquatic systems: a review.Environ. Rev. 16, 157–179.
Kristensen, E., Madsen-Østerbye, M., Massicotte, P., Pedersen, O., Markager, S., Kragh, T.,2017. Catchment tracers reveal discharge, recharge and sources of groundwater-borne pollutants in a novel lake modelling approach. Biogeosci. Discuss 1–19, 2017.
Kritzberg, E.S., 2017. Centennial-long trends of lake browning show major effect of af-forestation. Limnol. Oceanogr. Lett. 2, 105–112.
Kuzyakov, Y., 2010. Priming effects: interactions between living and dead organic matter.Soil Biol. Biochem. 42, 1363–1371.
Lampert, W., 1978. Release of dissolved organic carbon by grazing zooplankton. Limnol.Oceanogr. 23, 831–834.
Lindell, M.J., Graneli, W., Tranvik, L.J., 1995. Enhanced bacterial-growth in response tophotochemical transformation of dissolved organic-matter. Limnol. Oceanogr. 40,195–199.
Marín-Spiotta, E., Gruley, K., Crawford, J., Atkinson, E., Miesel, J., Greene, S., Cardona-Correa, C., Spencer, R., 2014. Paradigm shifts in soil organic matter research affectinterpretations of aquatic carbon cycling: transcending disciplinary and ecosystemboundaries. Biogeochemistry 117, 279–297.
McCallister, S.L., Giorgio, P.A.D., 2008. Direct measurement of the d13C signature ofcarbon respired by bacteria in lakes: linkages to potential carbon sources, ecosystembaseline metabolism, and CO2 fluxes. Limnol. Oceanogr. 53, 1204.
Molot, L.A., Dillon, P.J., 1997. Photolytic regulation of dissolved organic carbon innorthern lakes. Global Biogeochem. Cycles 11, 357–365.
Monteith, D.T., Stoddard, J.L., Evans, C.D., de Wit, H.A., Forsius, M., Hogasen, T.,Wilander, A., Skjelkvale, B.L., Jeffries, D.S., Vuorenmaa, J., Keller, B., Kopacek, J.,
Vesely, J., 2007. Dissolved organic carbon trends resulting from changes in atmo-spheric deposition chemistry. Nature 450, 537–U539.
Mopper, K.D.J.K., 2002. Marine photochemistry and its impact on carbon cycling. In: Theeffect of UV Radiation in the Marine Environment, 2002, pp. 101–129.
Moran, M.A., Hodson, R.E., 1990. Bacterial production on humic and nonhumic com-ponents of dissolved organic carbon. Limnol. Oceanogr. 35, 1744–1756.
Moran, M.A., Sheldon, W.M., Zepp, R.G., 2000. Carbon loss and optical property changesduring long-term photochemical and biological degradation of estuarine dissolvedorganic matter. Limnol. Oceanogr. 45, 1254–1264.
Moran, M.A., Zepp, R.G., 1997. Role of photoreactions in the formation of biologicallylabile compounds from dissolved organic matter. Limnol. Oceanogr. 42, 1307–1316.
Murty, D., Kirschbaum, M.U.F., McMurtrie, R.E., McGilvray, A., 2002. Does conversion offorest to agricultural land change soil carbon and nitrogen? a review of the literature.Glob. Change Biol. 8, 105–123.
Naturstyrelsen, 2011. http://naturstyrelsen.dk/media/nst/89781/Tvorup_131213_Web.pdf.
Nieminen, M., 2004. Export of dissolved organic carbon, nitrogen and phosphorus fol-lowing clear-cutting of three Norway spruce forests growing on drained peatlands insouthern Finland. Silva Fenn. 2, 123–132.
Obernosterer, I., Benner, R., 2004. Competition between biological and photochemicalprocesses in the mineralization of dissolved organic carbon. Limnol. Oceanogr. 49,117–124.
Ogura, N., 1972. Rate and extent of decomposition of dissolved organic-matter in surfaceseawater. Marine Biol. 13, 89.
Opsahl, S., Benner, R., 1998. Photochemical reactivity of dissolved lignin in river andocean waters. Limnol. Oceanogr. 43, 1297–1304.
Petersen, N.R., Jensen, K., 1997. Nitrification and denitrification in the rhizosphere of theaquatic macrophyte Lobelia dortmanna L. Limnol. Oceanogr. 42, 529–537.
Risse-Buhl, U., Hagedorn, F., Dümig, A., Gessner, M.O., Schaaf, W., Nii-Annang, S.,Gerull, L., Mutz, M., 2013. Dynamics, chemical properties and bioavailability of DOCin an early successional catchment. Biogeosciences 10, 4751.
Roulet, N., Moore, T.R., 2006. Environmental chemistry – Browning the waters. Nature444, 283–284.
Salonen, K., Vahatalo, A., 1994. Photochemical mineralization of dissolved organic-matter in Lake Skjervatjern. Environ. Int. 20, 307–312.
Sand-Jensen, K., Staehr, P.A., 2007. Scaling of pelagic metabolism to size, trophy andforest cover in small Danish lakes. Ecosystems 10, 127–141.
Seekell, D.A., Lapierre, J.F., Ask, J., Bergstrom, A.K., Deininger, A., Rodriguez, P.,Karlsson, J., 2015. The influence of dissolved organic carbon on primary productionin northern lakes. Limnol. Oceanogr. 60, 1276–1285.
Solomon, C.T., Jones, S.E., Weidel, B.C., Buffam, I., Fork, M.L., Karlsson, J., Larsen, S.,Lennon, J.T., Read, J.S., Sadro, S., Saros, J.E., 2015. Ecosystem consequences ofchanging inputs of terrestrial dissolved organic matter to lakes: current knowledgeand future challenges. Ecosystems 18, 376–389.
Sondergaard, M., Hansen, B., Markager, S., 1995. Dynamics of dissolved organic-carbonlability in a eutrophic lake. Limnol. Oceanogr. 40, 46–54.
Sondergaard, M., Middelboe, M., 1995. A cross-system analysis of labile dissolved or-ganic-carbon. Mar. Ecol. Prog. Ser. 118, 283–294.
Sondergaard, M., Phillips, G., Hellsten, S., Kolada, A., Ecke, F., Maemets, H., Mjelde, M.,Azzella, M.M., Oggioni, A., 2013. Maximum growing depth of submerged macro-phytes in European lakes. Hydrobiologia 704, 165–177.
Sondergaard, M., Williams, P.J.L., Cauwet, G., Riemann, B., Robinson, C., Terzic, S.,Woodward, E.M.S., Worm, J., 2000. Net accumulation and flux of dissolved organiccarbon and dissolved organic nitrogen in marine plankton communities. Limnol.Oceanogr. 45, 1097–1111.
Startsev, N.A., McNabb, D.H., Startsev, A.D., 1998. Soil biological activity in recentclearcuts in west-central Alberta. Can. J. Soil Sci. 78, 69–76.
Stets, E.G., Striegl, R.G., Aiken, G.R., 2010. Dissolved organic carbon export and internalcycling in small, headwater lakes. Global Biogeochem. Cycles 24.
Stoddard, J.L., Jeffries, D.S., Lukewille, A., Clair, T.A., Dillon, P.J., Driscoll, C.T., Forsius,M., Johannessen, M., Kahl, J.S., Kellogg, J.H., Kemp, A., Mannio, J., Monteith, D.T.,Murdoch, P.S., Patrick, S., Rebsdorf, A., Skjelkvale, B.L., Stainton, M.P., Traaen, T.,van Dam, H., Webster, K.E., Wieting, J., Wilander, A., 1999. Regional trends inaquatic recovery from acidification in North America and Europe. Nature 401,575–578.
Vachon, D., Prairie, Y.T., Guillemette, F., del Giorgio, P.A., 2017. Modeling allochthonousdissolved organic carbon mineralization under variable hydrologic regimes in boreallakes. Ecosystems 20, 781–795.
Vahatalo, A.V., Wetzel, R.G., 2002. Photochemical decomposition of chromophoric dis-solved organic matter in surface water: spectral dependence and environmental rates.Abstr. Pap. Am. Chem. Soc. 223 U517 U517.
von Wachenfeldt, E., Tranvik, L.J., 2008. Sedimentation in boreal lakes – The role offlocculation of allochthonous dissolved organic matter in the water column.Ecosystems 11, 803–814.
Wetzel, Wetzel, 2001. Limnology: lake and river ecosystems, 3rd edition. GulfProfessional Publishing.
Wetzel, R.G., Hatcher, P.G., Bianchi, T.S., 1995. Natural photolysis by ultraviolet irra-diance of recalcitrant dissolved organic matter to simple substrates for rapid bacterialmetabolism. Limnol. Oceanogr. 40, 1369–1380.
Weyhenmeyer, G.A., Froberg, M., Karltun, E., Khalili, M., Kothawala, D., Temnerud, J.,Tranvik, L.J., 2012. Selective decay of terrestrial organic carbon during transportfrom land to sea. Glob. Change Biol. 18, 349–355.
Williamson, C.E., Morris, D.P., Pace, M.L., Olson, A.G., 1999. Dissolved organic carbonand nutrients as regulators of lake ecosystems: resurrection of a more integratedparadigm. Limnol. Oceanogr. 44, 795–803.
Worrall, F., Burt, T.P., 2007. Trends in DOC concentration in Great Britain. J. Hydrol.346, 81–92.
M. Madsen-Østerbye et al. Ecological Engineering 118 (2018) 191–200
29
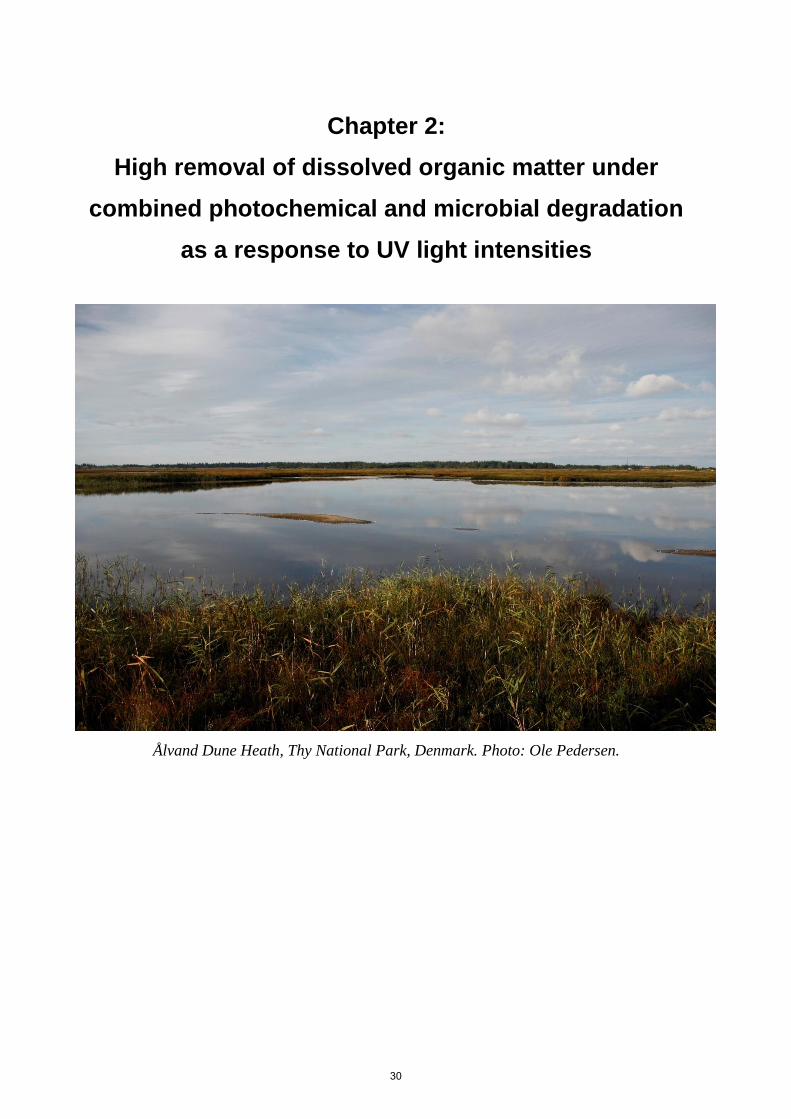
Chapter 2:
High removal of dissolved organic matter under
combined photochemical and microbial degradation
as a response to UV light intensities
Ålvand Dune Heath, Thy National Park, Denmark. Photo: Ole Pedersen.
30
High removal of dissolved organic matter under combined photochemical
and microbial degradation as a response to UV light intensities
Mikkel Madsen-Østerbye, Kaj Sand-Jensen, Emil Kristensen, Ole Pedersen and Theis Kragh
Freshwater Biological Laboratory, Department of Biology, University of Copenhagen,
Universitetsparken 4, 3rd floor, 2100 Copenhagen, Denmark
Keywords: DOC, Biodegradation, Carbon cycling, Brownification, Boreal lakes,
allochthonous, Photobleaching
Submitted to Biogeochemistry.
Abstract
Throughout the freshwater continuum, Dissolved Organic Carbon (DOC) and the coloured fraction,
Coloured Dissolved Organic Material (CDOM) are continuously being added, removed and
transformed resulting in changes in colour and lability over time. Our objectives were to examine
experimentally the effect of increasing UV intensities on the combined photochemical and microbial
degradation of CDOM and DOC over 37 days in a simulated mixed water column. We found a linear
relationship between the degradation of CDOM and UV intensities up to UV intensities of 0.36 W m-
2, while degradation saturated at higher intensities both at specific wavelengths and for broader
intervals. After 37 days at high UV intensity, CDOM absorption had been reduced by 41%, while
DOC degradation continued to increase at higher UV intensities reaching a total removal of 48%. The
two high UV intensities systematically changed the ratio between DOC and CDOM throughout the 37
days. In situ estimation of UV intensity suggested that up to 92% of the inherent CDOM could
possibly be removed annually by combined photochemical conversion and bacterial degradation in
the humic lake in which the water was collected. The results confirmed that CDOM degradation can
be remarkably higher in lakes than previously thought and that high CDOM levels are maintained by
continuous input of new terrestrial CDOM.
31
Introduction
Concentrations of Dissolved Organic Carbon
(DOC) in surface waters have increased over
the past 30 years throughout the Northern
Hemisphere (Monteith et al. 2007). This
increase in DOC has been accompanied by a
parallel increase in Coloured Dissolved
Organic Material (CDOM) exported primarily
from the terrestrial catchment (Xiao et al.
2015). The process is often referred to as
browning or brownification of the water
(Kritzberg and Ekstrom 2012; Roulet and
Moore 2006).
Increasing CDOM concentration has
been attributed to a combination of mainly
three different factors (Clark et al. 2010).
These are: (i) the warmer climate (Pagano et
al. 2014) and the associated increasing
precipitation and runoff from land (Fasching et
al. 2016; Weyhenmeyer et al. 2012), (ii) the
recovery from decades of acidification in the
1970-1980s now resulting in higher pH and
increased mobility of DOC in the catchment
soils (Ekstrom et al. 2011; Monteith et al.
2007), and (iii) changes in catchment
vegetation driven both by climate-induced
“greening” (Finstad et al. 2016) and
afforestation (Kritzberg 2017). The importance
of these three factors for the increasing
brownification is hard to separate because they
occur simultaneously and interact within the
ecosystems (Clark et al. 2010; Roulet and
Moore 2006).
The input of CDOM and DOC to the
lakes can have a profound effect on the
ecosystem. Brownification impairs the light
climate in the water and thus reduces the
primary production potential and distribution
of submerged aquatic plants in the affected
lakes (Karlsson et al. 2009; Sondergaard et al.
2013). Increasing DOC input also increases
the inorganic nutrient pool through
photochemical and microbial degradation
(Berggren et al. 2015). Given the fundamental
ecological influence of brownification on
environmental conditions, metabolism and
food webs (Jansson et al. 2007; Sand-Jensen
and Staehr 2007) it is imperative to understand
the processes behind the internal colour
removal in lakes and wetlands.
In the near past, freshwaters were
considered as passive transport systems for
DOC to the ocean. In the last decade it has
been recognised, however, that a major
fraction of the organic carbon exported from
land is processed and lost on its way through
the freshwater conduit (Battin et al. 2009; Cole
et al. 2007; Tranvik et al. 2009), emphasising
that inland waters play a much more important
role in the global carbon cycle than hitherto
acknowledged (Tranvik et al. 2009). As an
example, Catalán et al. (2016) showed a much
faster turnover of organic carbon in
freshwaters than in terrestrial soils and marine
waters. Two fundamental processes remove or
transform DOC in inland waters. Part of the
DOC is degraded microbially and converted to
carbon dioxide (CO2), which is released to the
atmosphere (Fasching et al. 2014; Lapierre et
al. 2013), while another part forms aggregates
that sink to the lake sediment where it
becomes buried (Cole et al. 2007). The latter
32
process can contribute to 30% of the total
DOC removal (Vachon et al. 2017).
Degradation processes in the water are
accelerated by UV radiation, which can play
an important role in DOC mineralisation –
particularly in shallow streams and lakes in
which the UV impacted surface waters
represent a high proportion of the total water
volume (Cory et al. 2014; Koehler et al. 2014).
The UV mediated degradation, also referred to
as photobleaching, transforms CDOM to more
labile non-coloured DOC compounds, which
are more assessible for bacterial
remineralisation (Del Vecchio and Blough
2002; Moran and Zepp 1997). However,
formation of reactive oxygen species (ROS)
can impede bacterial DOC degradation to
some extent (Scully et al. 2003). The actual
lake concentration of DOC is thus influenced
by a combination of in-lake processes related
to the variable magnitude and composition of
DOC input, lake water depth as well as water
retention time (Kohler et al. 2013).
Previous studies on DOC degradation
have mainly focused on the formation of CO2
and emission to the atmosphere, but less so on
the removal of coloured components. Bacteria
mainly utilise the uncoloured fraction of DOC,
which does not have a significant influence on
colour removal in itself (Madsen-Østerbye et
al. 2018). This makes sunlight and UV
exposure of CDOM a main factor in the
degradation and colour removal (Cory et al.
2014).
Few studies have addressed the direct
effect of UV intensity on the loss of CDOM in
a circulating lake water column. Madsen-
Østerbye et al. (2018) showed a linear CDOM
degradation over time under simulated natural
conditions with coupled UV exposure and
microbial degradation. However, the influence
of increasing UV intensity on the colour
removal and CDOM lability is not known.
Changes in the ratio between non-coloured
DOC and CDOM express which fraction is
mainly utilised by bacteria over time. An
increase in the ratio over time reflects a higher
loss of non-coloured DOC compared to
coloured DOC and vice versa.
We have introduced an experimental
approach in order to quantify the coupled
degradation of DOC and CDOM by UV light
and microbial degradation over weekly
periods. We use this experimental system to
quantify degradation of DOC and CDOM as
well as unravel the possible shifts in the ratio
between DOC and CDOM, as organic
molecules are degraded and transformed over
time. We evaluate the relevance of our results
further by estimating the degradation and
resulting CDOM concentrations in comparison
with measured CDOM concentrations over a
year in the humic lake from which the
experimental water derives.
Materials and methods
Sample collection
Experimental water was collected from 2 m
depth in the humic Lake Tvorup located in
Thy National Park in north west Jutland,
Denmark (56°91’N, 8°46’E) in February 2017.
The lake has no surface inlets and is
surrounded by conifer plantations and
33
heathland and resembles humic lakes in the
Scandinavian boreal zone (Algesten et al.
2004; Verpoorter et al. 2012). The lake water
was aged in darkness for six months at 4°C to
reduce labile DOC compounds prior to the
experiment. For each experimental replicate,
90% of the initial water volume was passed
through a Whatman GF/F filter (nominal pore
size 0.7 µm) to retain all heterotrophic
flagellates and microalgae. 10% of the water
volume was passed through a GF/C filter
(nominal pore size 1.2 µm) in order to act as
an inoculum with bacteria. Previously, it has
been shown that bacteria from an inoculum of
this filtered size range can rebuild their
biomass within 0-7 days in similar
experimental setups (Kragh et al. 2008; Risse-
Buhl et al. 2013).
Experimental design
In order to quantify the effect of combined
UV- and microbial degradation of CDOM and
DOC, we conducted an experiment in which
lake water was subjected to different UV
intensities while maintaining the ongoing
microbial degradation. The experimental set-
up was designed to mimic the slow vertical
mixing of a natural water column with only
organic matter in surface waters being
exposed to UV radiation (Morris et al. 1995)
and subsequently being transported to deeper
layers while undergoing microbial
degradation. The circulating system was
designed according to Madsen-Østerbye et al.
(2018) and consisted of three replicates and a
control at each UV intensity.
In brief, the system included a small
quarts-vial (0.05 L) connected to a larger water
reservoir (1 L) by an inert PTFE Teflon tubing
in a closed circulation driven by a BT100-L
multi-channel peristaltic pump (Langer
Instruments, USA) at a rate corresponding to
100% water exchange within 24 hours. Each
sampling slightly reduced the water volume
and the flow rate was adjusted to maintain an
unaltered exposure time to UV radiation. The
water in the quarts-vials was exposed to UV
radiation in a 12/12 day-night cycle by a Q-
Panel UVA-340 lamp (Q-LAB, USA), which
provided a spectral composition similar to
natural sunlight in the wavelength region 295-
365 nm (Q-lab 2012). This spectral range from
395-365 nm is the most important for
environmental photoreactions of DOC
(Stubbins et al. 2010). The water circulated
from the UV chamber to the larger water
reservoir, which was maintained in complete
darkness for microbial degradation of labile
compounds produced by UV radiation. Thus,
5% of the water was exposed at any point
corresponding to a circulating water column,
in which the upper 5% of the water column
received UV light. The selected reservoirs for
microbial degradation had no bottle effect with
respect to abundance and maintenance of the
bacterial biomass (Kragh et al. 2008; Risse-
Buhl et al. 2013) and, thereby, did not affect
the DOC degradation. All equipment was acid
rinsed before use and the experiment was
conducted at 20°C.
The choice of UV intensities in the
experiment was based on a comparison
between the light spectrum of the Q-Panel
34
UVA-340 lamp and a field measurement using
a Black Comet UV-VIS spectrometer model
CXR (StellarNet Inc., USA). UV intensities
were extrapolated to a whole year using field
measurements from a stationary HOBO PAR
sensor (400-700 nm): S-LIA-M003, Onset
Computers. The highest measured summer UV
radiation was 0.62 W m-2, which was close to
the maximum dose in previous studies using
0.65 and 0.68 W m-2 (Kragh et al. 2008;
Vachon et al. 2017). Our experimental lamp
design and setup restricted maximum UV
exposure to a UV dose of 0.58 W m-2, which
was used as the maximum summer intensity.
The highest and lowest spring UV radiation
was used as well, which corresponded to 0.16
and 0.36 W m-2 as these periods seem
especially important for the CDOM
degradation (Gonsior et al. 2013). The UV
intensity of 0.1 W m-2 corresponded to winter
radiation. A set of replicates was kept in
complete darkness to measure microbial
degradation without UV exposure.
Analyses and sampling
The experiment lasted for 37 days and water
samples were retrieved every week and
analysed for DOC and CDOM after having
been filtered through pre-combusted GF/F
filters. Combusted GF/F filters, although with
a nominal pore size of 0,7 µm, have shown
indications of reducing the effective pore size
to 0.3 µm thereby retaining even smaller
particles (Nayar and Chou 2003). CDOM
absorbance was measured on a UV-1800
spectrophotometer (Shimadzu instruments,
USA) fitted with a 1 cm quartz-cuvette across
the spectrum 300-750 nm with scanning
intervals of 1 nm. Absorbance values were
converted to the Napierian absorption
coefficients (αCDOM (λ) by multiplying the
absorbance at wavelength λ (nm) by 2.303 (i.e.
ln(10)) and dividing with the path length of the
cuvette in meters (Stedmon and Markager
2001). CDOM absorption is presented at 340
and 440 nm, which corresponds to the highest
UV intensity at 340 nm, while 440 nm is often
used as a reference wavelength of water colour
(Cuthbert and Del Giorgio 1992). CDOM
absorption was also calculated for the
photosynthetically active spectrum (PAR, 400-
700 nm) and the entire analysed spectrum,
300-700 nm, which is suitable to evaluate the
effect of changes in size of organic molecules.
DOC samples were conserved with
150 µL 2 M HCL per 15 mL sample and
measured on a Total Organic Carbon Analyser
(Shimadzu instruments, USA) and analysed
according to Kragh and Sondergaard (2004).
DOC was measured using the non-purgeable
organic carbon method with a 3-point
calibration curve (r2 = 0.998) and with at least
three technical replicates/injections of each
DOC sample to ensure statistical confidence.
Standard series and blanks were included for
each experimental run and showed an accuracy
of the analytical method of ±1%. All DOC
samples were checked for colloids created by
changes in pH and treated in an ultrasonic bath
and whirl mixed to separate them (Kragh et al.
2008).
Also, DOC and CDOM data were used
to assess the CDOM aromaticity by
normalising the CDOM absorption coefficients
35
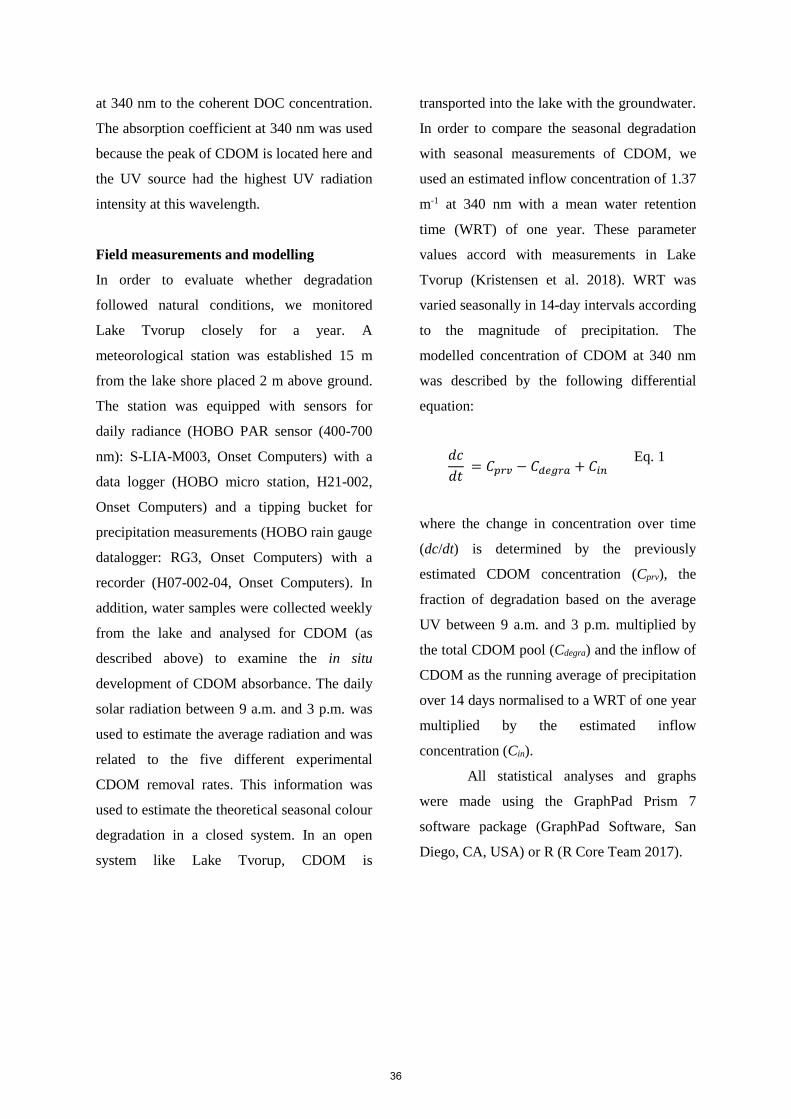
at 340 nm to the coherent DOC concentration.
The absorption coefficient at 340 nm was used
because the peak of CDOM is located here and
the UV source had the highest UV radiation
intensity at this wavelength.
Field measurements and modelling
In order to evaluate whether degradation
followed natural conditions, we monitored
Lake Tvorup closely for a year. A
meteorological station was established 15 m
from the lake shore placed 2 m above ground.
The station was equipped with sensors for
daily radiance (HOBO PAR sensor (400-700
nm): S-LIA-M003, Onset Computers) with a
data logger (HOBO micro station, H21-002,
Onset Computers) and a tipping bucket for
precipitation measurements (HOBO rain gauge
datalogger: RG3, Onset Computers) with a
recorder (H07-002-04, Onset Computers). In
addition, water samples were collected weekly
from the lake and analysed for CDOM (as
described above) to examine the in situ
development of CDOM absorbance. The daily
solar radiation between 9 a.m. and 3 p.m. was
used to estimate the average radiation and was
related to the five different experimental
CDOM removal rates. This information was
used to estimate the theoretical seasonal colour
degradation in a closed system. In an open
system like Lake Tvorup, CDOM is
transported into the lake with the groundwater.
In order to compare the seasonal degradation
with seasonal measurements of CDOM, we
used an estimated inflow concentration of 1.37
m-1 at 340 nm with a mean water retention
time (WRT) of one year. These parameter
values accord with measurements in Lake
Tvorup (Kristensen et al. 2018). WRT was
varied seasonally in 14-day intervals according
to the magnitude of precipitation. The
modelled concentration of CDOM at 340 nm
was described by the following differential
equation:
𝑑𝑐
𝑑𝑡 = 𝐶𝑝𝑟𝑣 − 𝐶𝑑𝑒𝑔𝑟𝑎 + 𝐶𝑖𝑛
Eq. 1
where the change in concentration over time
(dc/dt) is determined by the previously
estimated CDOM concentration (Cprv), the
fraction of degradation based on the average
UV between 9 a.m. and 3 p.m. multiplied by
the total CDOM pool (Cdegra) and the inflow of
CDOM as the running average of precipitation
over 14 days normalised to a WRT of one year
multiplied by the estimated inflow
concentration (Cin).
All statistical analyses and graphs
were made using the GraphPad Prism 7
software package (GraphPad Software, San
Diego, CA, USA) or R (R Core Team 2017).
36
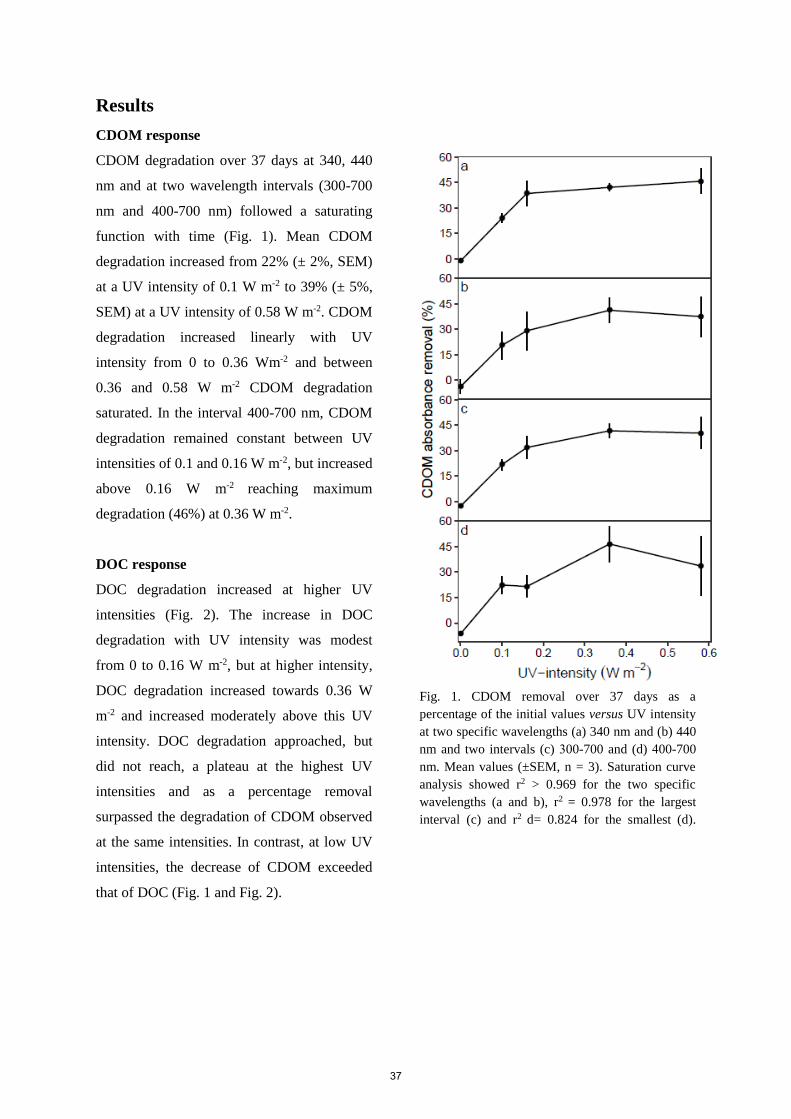
Results
CDOM response
CDOM degradation over 37 days at 340, 440
nm and at two wavelength intervals (300-700
nm and 400-700 nm) followed a saturating
function with time (Fig. 1). Mean CDOM
degradation increased from 22% (± 2%, SEM)
at a UV intensity of 0.1 W m-2 to 39% (± 5%,
SEM) at a UV intensity of 0.58 W m-2. CDOM
degradation increased linearly with UV
intensity from 0 to 0.36 Wm-2 and between
0.36 and 0.58 W m-2 CDOM degradation
saturated. In the interval 400-700 nm, CDOM
degradation remained constant between UV
intensities of 0.1 and 0.16 W m-2, but increased
above 0.16 W m-2 reaching maximum
degradation (46%) at 0.36 W m-2.
DOC response
DOC degradation increased at higher UV
intensities (Fig. 2). The increase in DOC
degradation with UV intensity was modest
from 0 to 0.16 W m-2, but at higher intensity,
DOC degradation increased towards 0.36 W
m-2 and increased moderately above this UV
intensity. DOC degradation approached, but
did not reach, a plateau at the highest UV
intensities and as a percentage removal
surpassed the degradation of CDOM observed
at the same intensities. In contrast, at low UV
intensities, the decrease of CDOM exceeded
that of DOC (Fig. 1 and Fig. 2).
Fig. 1. CDOM removal over 37 days as a
percentage of the initial values versus UV intensity
at two specific wavelengths (a) 340 nm and (b) 440
nm and two intervals (c) 300-700 and (d) 400-700
nm. Mean values (±SEM, n = 3). Saturation curve
analysis showed r2 > 0.969 for the two specific
wavelengths (a and b), r2 = 0.978 for the largest
interval (c) and r2 d= 0.824 for the smallest (d).
37
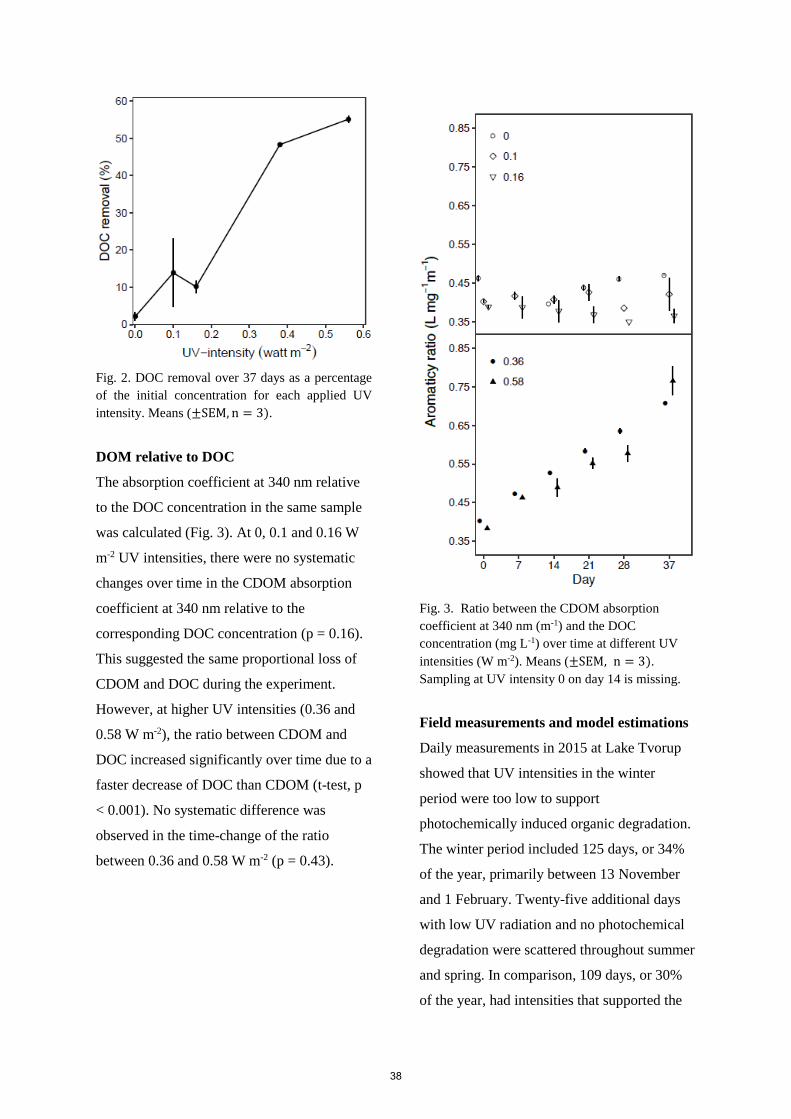
Fig. 2. DOC removal over 37 days as a percentage
of the initial concentration for each applied UV
intensity. Means (±SEM, n = 3).
DOM relative to DOC
The absorption coefficient at 340 nm relative
to the DOC concentration in the same sample
was calculated (Fig. 3). At 0, 0.1 and 0.16 W
m-2 UV intensities, there were no systematic
changes over time in the CDOM absorption
coefficient at 340 nm relative to the
corresponding DOC concentration (p = 0.16).
This suggested the same proportional loss of
CDOM and DOC during the experiment.
However, at higher UV intensities (0.36 and
0.58 W m-2), the ratio between CDOM and
DOC increased significantly over time due to a
faster decrease of DOC than CDOM (t-test, p
< 0.001). No systematic difference was
observed in the time-change of the ratio
between 0.36 and 0.58 W m-2 (p = 0.43).
Fig. 3. Ratio between the CDOM absorption
coefficient at 340 nm (m-1) and the DOC
concentration (mg L-1) over time at different UV
intensities (W m-2). Means (±SEM, n = 3).
Sampling at UV intensity 0 on day 14 is missing.
Field measurements and model estimations
Daily measurements in 2015 at Lake Tvorup
showed that UV intensities in the winter
period were too low to support
photochemically induced organic degradation.
The winter period included 125 days, or 34%
of the year, primarily between 13 November
and 1 February. Twenty-five additional days
with low UV radiation and no photochemical
degradation were scattered throughout summer
and spring. In comparison, 109 days, or 30%
of the year, had intensities that supported the
38
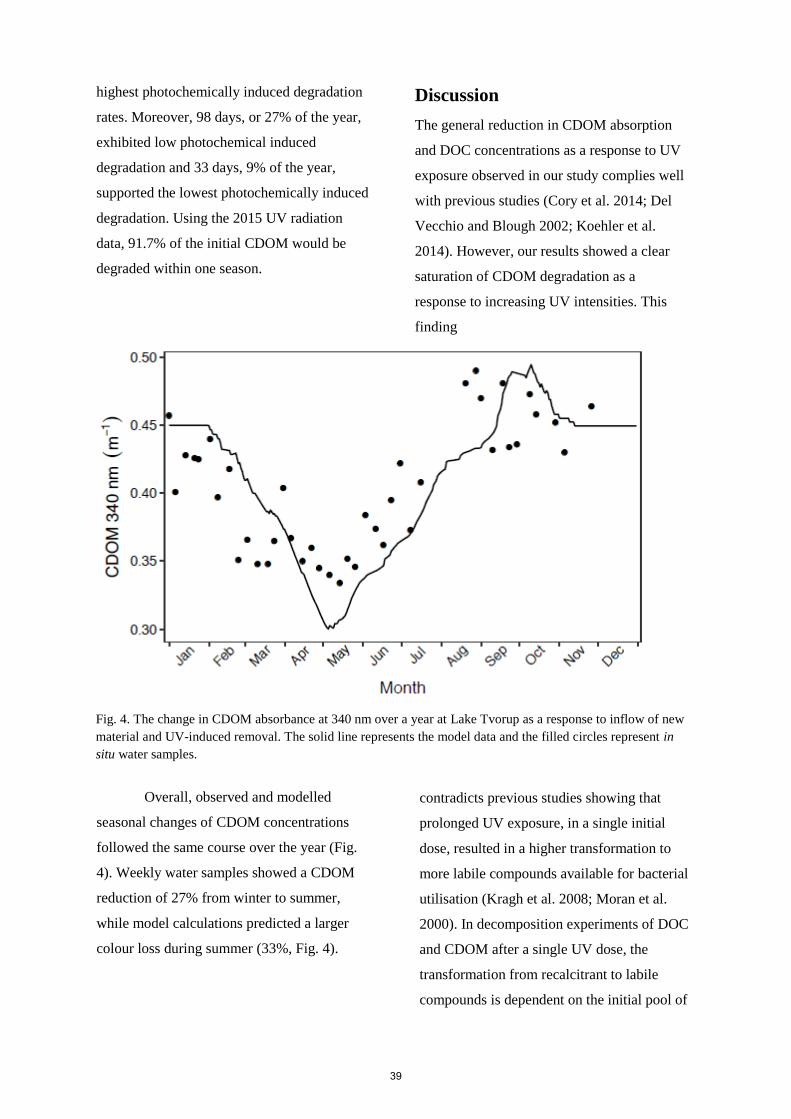
highest photochemically induced degradation
rates. Moreover, 98 days, or 27% of the year,
exhibited low photochemical induced
degradation and 33 days, 9% of the year,
supported the lowest photochemically induced
degradation. Using the 2015 UV radiation
data, 91.7% of the initial CDOM would be
degraded within one season.
Overall, observed and modelled
seasonal changes of CDOM concentrations
followed the same course over the year (Fig.
4). Weekly water samples showed a CDOM
reduction of 27% from winter to summer,
while model calculations predicted a larger
colour loss during summer (33%, Fig. 4).
Fig. 4. The change in CDOM absorbance at 340 nm over a year at Lake Tvorup as a response to inflow of new
material and UV-induced removal. The solid line represents the model data and the filled circles represent in
situ water samples.
Discussion
The general reduction in CDOM absorption
and DOC concentrations as a response to UV
exposure observed in our study complies well
with previous studies (Cory et al. 2014; Del
Vecchio and Blough 2002; Koehler et al.
2014). However, our results showed a clear
saturation of CDOM degradation as a
response to increasing UV intensities. This
finding
contradicts previous studies showing that
prolonged UV exposure, in a single initial
dose, resulted in a higher transformation to
more labile compounds available for bacterial
utilisation (Kragh et al. 2008; Moran et al.
2000). In decomposition experiments of DOC
and CDOM after a single UV dose, the
transformation from recalcitrant to labile
compounds is dependent on the initial pool of
39
humic substances in the water. Consequently,
the initial UV decomposition is not linear with
dose (Kragh et al. 2008), as water with high
humic content has a higher pool of recalcitrant
DOC available for transformation to labile
compounds compared to water with low humic
content.
The UV accumulated dose in our experiment
simulated spring conditions and corresponded
to the intensity used in a previous study by
Kragh et al. (2008). Compared to Kragh et al.
(2008) , who found a total DOC loss of 27%,
we found a remarkably higher loss exceeding
47% at 0.36 W m-2. This suggests that DOC
turnover is higher in an experimental setup
that mimics a circulating water column
compared to the single initial dose design.
However, Madsen-Østerbye et al. (2018)
showed similar DOC loses in three different
water sources when comparing the single dose
experimental design to the continuous mixing
design while the same radiation intensities
were used (0.65 W m-2). In both experimental
setups, DOC losses were 28% in coniferous
forest groundwater, 35% in heathland
groundwater and 14% in lake water. In
contrast, different CDOM degradation was
found between the two experimental designs.
In the single dose experiment, the initial UV
exposure resulted in a decline in CDOM
absorption at 340 nm of only 2.7% in
heathland groundwater, 5.8% in lake water and
1.5% in forest groundwater. The continuous
mixing system resulted in a decline in CDOM
absorption of 87% in heathland water and 20%
in forest and lake water. This result supported
the notion that UV induced CDOM turnover
could be much higher in lake waters than
previously assumed.
No previous studies have, to our
knowledge, shown a saturation of CDOM
degradation with increasing UV intensities
under natural conditions as mimicked in our
experiment. In an experimental setup
resembling our approach, Jones et al. (2016)
showed an increase in CDOM removal
(ABS254) over four days in response to
accumulated UV exposure. However, the
percentage loss depended largely on the initial
amounts of light absorbing humic compounds
and, thereby, on the water source. Compared
to our study, Jones et al. (2016) did not show
saturation of colour removal in DOC-rich
peatland water, which almost had the same
initial DOC concentration as our experimental
water. This result is likely due to the fact that
Jones et al. (2016) use much shorter
experimental time in which 25% of the water
volume (including bacteria) was exposed to
continuous UV radiation for four days instead
of UV exposure of 5% of the water in a 12/12
light dark cycle over 37 days, as is the case in
the present study.
In contrast to the positive effect of UV
radiation on bio-availability of CDOM and
DOC, which results in higher bacteria
utilisation of the organic carbon, some studies
have reported a negative effect of solar
radiation on bacterial growth with marine
derived DOC (Benner and Biddanda 1998;
Obernosterer et al. 1999). This difference in
response to UV exposure is reported to be a
result of DOC quality and the amount of
40
humic compounds in the water (Tranvik and
Bertilsson 2001). Water with a high humic
content has a higher pool of recalcitrant DOC
compared to waters with low humic content.
The recalcitrant pool of DOC reacts to UV
exposure and results in transformation to more
labile compounds available for bacterial
degradation. In contrast, waters more dilute in
humic substances, but high in labile DOC,
respond to UV exposure with transformation
of a higher proportion of labile compounds to
more refractory compounds (Scully et al.
2003). The transformation from labile to more
refractory compounds by UV exposure is the
effect observed in the marine waters (Benner
and Biddanda 1998; Obernosterer et al. 1999).
We suggest that the high CDOM removal in
the present study at high UV intensities could
have created a similar effect over time
resulting in the observed saturation of CDOM
degradation, but with an ongoing degradation
of non-coloured DOC.
Bacterial inhibition by high UV
intensities could also be a reason for the
observed saturation of total CDOM
degradation. The transport of bacterial biomass
to the UV exposed quartz chamber would
impair the bacteria due to high UV exposure
above 0.36 W m-2, since UV is harmful for
organismal DNA (Häder and Sinha 2005).
This could limit the bacterial biomass to a
certain degree thus making it unable to utilise
the extra pool of carbon made available by the
UV exposure. If so, a higher loss of the total
DOC pool would be observed at the high UV
intensities if the samples were transferred to
darkness for further bacterial degradation after
the experiment. Besides the harmful UV
radiation, increased production of free oxygen
radicals at high UV intensities could limit
bacterial activity (Blough and Zepp 1995).
While radicals have a negative effect on
bacterial growth, they can react with
recalcitrant non-coloured DOC transforming it
into more labile components. This results in a
higher consumption of non-coloured DOC,
which could be the main reason for the
observed change in the ratio between the
coloured fraction and the total DOC pool at
higher UV intensities (Fig 3). Co-precipitation
could also contribute to the higher DOC
removal rates at increasing initial UV dosage.
Co-metabolism is reported from terrestrial
environments (Fontaine et al. 2007) and occurs
when an increase in the availability of
substrate for microbial degradation induces
enzyme production or increased enzyme
activity, which leads to higher decomposition
of DOC (Kuzyakov 2010).
Interpretation of the degradation rates
obtained in the present study was done by
relating these to in situ measurements of
CDOM in the lake from which the samples
originated. Firstly, we evaluated the
degradation in the lake for a situation where no
new CDOM was added to the lake and found
that 91.7% of the coloured substances would
be removed during the year as a response to
UV-induced degradation. The high removal
illustrates how extensive the removal is if no
new CDOM is added to the lake. In a more
realistic scenario, which also considered lake
water retention time, precipitation, UV
intensity mediated degradation and the
41
concentration of inflowing CDOM, we were
able to closely predict the annual temporal
course of CDOM absorption in the lake. Small
differences between observed and predicted
values are likely related to wind induced
mixing and the effect of temperature on
microbial degradation that are not considered
in our model.
We found that low UV intensities did
not support photochemical degradation during
the winter months in Lake Tvorup. Together
with higher precipitation and intensified
groundwater input and surface runoff from the
catchment, the winter is often characterised by
a net input of new organic material leading to
higher in-lake CDOM concentration compared
to summer (Fasching et al. 2016;
Weyhenmeyer et al. 2012). Previous studies
have shown a higher photodegradation in early
spring (Gonsior et al. 2013) as also supported
by our in situ CDOM samples in Lake Tvorup.
No photodegradation takes place during
winter, which results in accumulation of
otherwise photo-labile CDOM. Consequently,
the same UV intensities can result in higher
degradation rates in spring compared to
summer. Nonetheless, when UV intensity is
increased with the same parent material,
degradation rates increase in both spring and
summer. This response is most important in
the summer time when UV intensities are
highest. The colour loss found in the collected
water samples and by the model corresponded
with the removal range of 25-50% estimated
by Muller et al. (2014). However, the higher
CDOM loss in our combined laboratory model
study compared to in situ colour loss, could
indicate that lakes are much more dynamic
regarding CDOM degradation than previously
assumed. In situ colour degradation is masked
by the constant input of new material often
associated with rain events (Raymond and
Saiers 2010). In addition, a lake such as Lake
Tvorup is highly susceptible to major water
pulses due to the short water retention time,
which means that the entire pool of CDOM
can be renewed over a short period (Berggren
et al. 2018). Such pulses of water adding new
material to the lake could explain some of the
observed variation of CDOM absorbance in
the collected water samples.
Catchment vegetation and water
retention time that influenced input and
degradation of CDOM, respectively, are
essential when forecasting future CDOM
levels and optical conditions (Madsen-
Østerbye et al. 2018). Establishing a correct
response of CDOM and DOC degradation to
increased UV radiation is another important
step towards improved modelling of carbon
dynamics in aquatic systems. Further work on
the combined effect of water column mixing
and temperature can increase our
understanding of the carbon cycle in humic
lakes.
In summary, we showed a clear
saturation of CDOM degradation as a response
to increasing UV intensities in an experiment,
which mimicked vertical circulation of the
water column. We suggest that colour removal
is markedly higher compared to previous
findings because of ongoing UV exposure.
Our study supports the notion that large
proportions of organic carbon are processed
42
and lost during transport through freshwater
systems.
Acknowledgement
We thank The Villum Kann Rasmussen
Foundation for financial support to the Centre
of Excellence for Research on Lake
Restoration (CLEAR), which made this study
possible. Mikkel Østerbye-Madsen is deeply
indebted to Emma Kritzberg, University of
Lund for making it possible to visit her group
and discuss many aspects of DOC and CDOM
dynamics during his Ph.D. study. We thank
Sara Schousboe for proofreading the English
language.
References
Algesten G, Sobek S, Bergstrom AK,
Agren A, Tranvik LJ, Jansson M
(2004) Role of lakes for organic
carbon cycling in the boreal zone.
Global Change Biology 10:141-
147 doi:DOI 10.1111/j.1365-
2486.2003.00721.x
Battin TJ, Luyssaert S, Kaplan LA,
Aufdenkampe AK, Richter A,
Tranvik LJ (2009) The boundless
carbon cycle. Nat Geosci 2:598-
600 doi:10.1038/ngeo618
Benner R, Biddanda B (1998)
Photochemical transformations of
surface and deep marine dissolved
organic matter: Effects on bacterial
growth. Limnol Oceanogr 43:1373-
1378
Berggren M, Klaus M, Selvam BP, Strom
L, Laudon H, Jansson M, Karlsson
J (2018) Quality transformation of
dissolved organic carbon during
water transit through lakes:
contrasting controls by
photochemical and biological
processes. Biogeosciences 15:457-
470 doi:10.5194/bg-15-457-2018
Berggren M, Sponseller RA, Alves Soares
AR, Bergström A-K (2015)
Toward an ecologically meaningful
view of resource stoichiometry in
DOM-dominated aquatic systems.
J Plankton Res 37:489-499
Blough NV, Zepp RG (1995) Reactive
oxygen species in natural waters.
In: Active oxygen in chemistry.
Springer, pp 280-333
Catalán N, Marcé R, Kothawala DN,
Tranvik LJ (2016) Organic carbon
decomposition rates controlled by
water retention time across inland
waters. Nat Geosci 9:501-504
Clark J et al. (2010) The importance of the
relationship between scale and
process in understanding long-term
DOC dynamics. Sci Total Environ
408:2768-2775
Cole JJ et al. (2007) Plumbing the global
carbon cycle: Integrating inland
waters into the terrestrial carbon
budget. Ecosystems 10:171-184
doi:10.1007/s10021-006-9013-8
Cory RM, Ward CP, Crump BC, Kling
GW (2014) Sunlight controls water
column processing of carbon in
arctic fresh waters. Science
345:925-928
Cuthbert ID, Del Giorgio P (1992) Toward
a standard method of measuring
color in fresh-water. Limnol
Oceanogr 37:1319-1326
Del Vecchio R, Blough NV (2002)
Photobleaching of chromophoric
dissolved organic matter in natural
waters: kinetics and modeling. Mar
Chem 78:231-253 doi:Pii S004-
4203(02)00036-1 Doi
10.1016/S0304-4203(02)00036-1
43
Ekstrom SM, Kritzberg ES, Kleja DB,
Larsson N, Nilsson PA, Graneli W,
Bergkvist B (2011) Effect of acid
deposition on quantity and quality
of dissolved organic matter in soil-
water. Environ Sci Technol
45:4733-4739
doi:10.1021/es104126f
Fasching C, Behounek B, Singer GA,
Battin TJ (2014) Microbial
degradation of terrigenous
dissolved organic matter and
potential consequences for carbon
cycling in brown-water streams.
Sci Rep-Uk 4 doi:ARTN 4981
10.1038/srep04981
Fasching C, Ulseth AJ, Schelker J,
Steniczka G, Battin TJ (2016)
Hydrology controls dissolved
organic matter export and
composition in an Alpine stream
and its hyporheic zone. Limnol
Oceanogr 61:558-571
doi:10.1002/lno.10232
Fontaine S, Barot S, Barré P, Bdioui N,
Mary B, Rumpel C (2007) Stability
of organic carbon in deep soil
layers controlled by fresh carbon
supply. Nature 450:277
Gonsior M, Schmitt-Kopplin P, Bastviken
D (2013) Depth-dependent
molecular composition and photo-
reactivity of dissolved organic
matter in a boreal lake under winter
and summer conditions.
Biogeosciences 10:6945-6956
Häder D-P, Sinha RP (2005) Solar
ultraviolet radiation-induced DNA
damage in aquatic organisms:
potential environmental impact.
Mutation Research/Fundamental
and Molecular Mechanisms of
Mutagenesis 571:221-233
Jansson M, Persson L, De Roos AM, Jones
RI, Tranvik LJ (2007) Terrestrial
carbon and intraspecific size-
variation shape lake ecosystems.
Trends Ecol Evol 22:316-322
doi:10.1016/j.tree.2007.02.015
Jones TG, Evans CD, Jones DL, Hill PW,
Freeman C (2016) Transformations
in DOC along a source to sea
continuum; impacts of photo-
degradation, biological processes
and mixing. Aquat Sci 78:433-446
doi:10.1007/s00027-015-0461-0
Karlsson J, Bystrom P, Ask J, Ask P,
Persson L, Jansson M (2009) Light
limitation of nutrient-poor lake
ecosystems. Nature 460:506-U580
doi:10.1038/nature08179
Koehler B, Landelius T, Weyhenmeyer
GA, Machida N, Tranvik LJ (2014)
Sunlight‐induced carbon dioxide
emissions from inland waters.
Global Biogeochem Cy 28:696-711
Kohler SJ, Kothawala D, Futter MN,
Liungman O, Tranvik L (2013) In-
Lake Processes Offset Increased
Terrestrial Inputs of Dissolved
Organic Carbon and Color to
Lakes. Plos One 8 doi:ARTN
e7059810.1371/journal.pone.00705
98
Kragh T, Sondergaard M (2004)
Production and bioavailability of
autochthonous dissolved organic
carbon: effects of
mesozooplankton. Aquat Microb
Ecol 36:61-72 doi:DOI
10.3354/ame036061
Kragh T, Sondergaard M, Tranvik L
(2008) Effect of exposure to
sunlight and phosphorus-limitation
on bacterial degradation of
coloured dissolved organic matter
(CDOM) in freshwater. Fems
Microbiol Ecol 64:230-239
doi:10.1111/j.1574-
6941.2008.00449.x
Kristensen E, Madsen-Østerbye M,
Massicotte P, Pedersen O,
Markager S, Kragh T (2018)
Catchment tracers reveal discharge,
recharge and sources of
groundwater-borne pollutants in a
novel lake modelling approach.
Biogeosciences 15:1203-1216
44
Kritzberg ES (2017) Centennial‐long
trends of lake browning show
major effect of afforestation.
Limnology and Oceanography
Letters 2:105-112
Kritzberg ES, Ekstrom SM (2012)
Increasing iron concentrations in
surface waters - a factor behind
brownification? Biogeosciences
9:1465-1478 doi:10.5194/bg-9-
1465-2012
Kuzyakov Y (2010) Priming effects:
Interactions between living and
dead organic matter. Soil Biol
Biochem 42:1363-1371
doi:10.1016/j.soilbio.2010.04.003
Lapierre JF, Guillemette F, Berggren M,
del Giorgio PA (2013) Increases in
terrestrially derived carbon
stimulate organic carbon
processing and CO2 emissions in
boreal aquatic ecosystems. Nat
Commun 4 doi:ARTN 2972
10.1038/ncomms3972
Madsen-Østerbye M, Kragh T, Pedersen
O, Sand-Jensen K (2018) Coupled
UV-exposure and microbial
decomposition improves measures
of organic matter degradation and
light models in humic lake. Ecol
Eng 118:191-200
Monteith DT et al. (2007) Dissolved
organic carbon trends resulting
from changes in atmospheric
deposition chemistry. Nature
450:537-U539
doi:10.1038/nature06316
Moran MA, Sheldon WM, Zepp RG
(2000) Carbon loss and optical
property changes during long-term
photochemical and biological
degradation of estuarine dissolved
organic matter. Limnol Oceanogr
45:1254-1264
Moran MA, Zepp RG (1997) Role of
photoreactions in the formation of
biologically labile compounds from
dissolved organic matter. Limnol
Oceanogr 42:1307-1316
Morris DP et al. (1995) The attenuation of
solar UV radiation in lakes and the
role of dissolved organic carbon.
Limnol Oceanogr 40:1381-1391
Muller RA, Kothawala DN, Podgrajsek E,
Sahlee E, Koehler B, Tranvik LJ,
Weyhenmeyer GA (2014) Hourly,
daily, and seasonal variability in
the absorption spectra of
chromophoric dissolved organic
matter in a eutrophic, humic lake. J
Geophys Res-Biogeo 119:1985-
1998 doi:10.1002/2014jg002719
Nayar S, Chou LM (2003) Relative
efficiencies of different filters in
retaining phytoplankton for
pigment and productivity studies.
Estuar Coast Shelf S 58:241-248
doi:10.1016/S0272-
7714(03)00075-1
Obernosterer I, Reitner B, Herndl GJ
(1999) Contrasting effects of solar
radiation on dissolved organic
matter and its bioavailability to
marine bacterioplankton. Limnol
Oceanogr 44:1645-1654
Pagano T, Bida M, Kenny JE (2014)
Trends in levels of allochthonous
dissolved organic carbon in natural
water: A review of potential
mechanisms under a changing
climate. Water 6:2862-2897
Q-lab (2012) Technical bulletin LI-8160:
A choice of lambs for the QUV
Accelerater Weathering tester.
R Core Team (2017) R: A language and
environment for statistical
computing. Vienna, Austria: R
Foundation for Statistical
Computing; 2017. ISBN3-900051-
07-0 https://www.R-project.org,
Raymond PA, Saiers JE (2010) Event
controlled DOC export from
forested watersheds.
Biogeochemistry 100:197-209
Risse-Buhl U et al. (2013) Dynamics,
chemical properties and
bioavailability of DOC in an early
successional catchment.
Biogeosciences 10:4751
45
Roulet N, Moore TR (2006)
Environmental chemistry -
Browning the waters. Nature
444:283-284 doi:10.1038/444283a
Sand-Jensen K, Staehr PA (2007) Scaling
of pelagic metabolism to size,
trophy and forest cover in small
Danish lakes. Ecosystems 10:127-
141 doi:10.1007/s10021-006-9001-
z
Scully NM, Cooper WJ, Tranvik LJ (2003)
Photochemical effects on microbial
activity in natural waters: the
interaction of reactive oxygen
species and dissolved organic
matter. Fems Microbiol Ecol
46:353-357 doi:10.1016/S0168-
6496(03)00198-3
Sondergaard M et al. (2013) Maximum
growing depth of submerged
macrophytes in European lakes.
Hydrobiologia 704:165-177
doi:10.1007/s10750-012-1389-1
Stedmon CA, Markager S (2001) The
optics of chromophoric dissolved
organic matter (CDOM) in the
Greenland Sea: An algorithm for
differentiation between marine and
terrestrially derived organic matter.
Limnol Oceanogr 46:2087-2093
doi:DOI
10.4319/lo.2001.46.8.2087
Stubbins A et al. (2010) Illuminated
darkness: Molecular signatures of
Congo River dissolved organic
matter and its photochemical
alteration as revealed by ultrahigh
precision mass spectrometry.
Limnol Oceanogr 55:1467-1477
doi:10.4319/lo.2010.55.4.1467
Tranvik LJ, Bertilsson S (2001)
Contrasting effects of solar UV
radiation on dissolved organic
sources for bacterial growth. Ecol
Lett 4:458-463 doi:DOI
10.1046/j.1461-0248.2001.00245.x
Tranvik LJ et al. (2009) Lakes and
reservoirs as regulators of carbon
cycling and climate. Limnol
Oceanogr 54:2298-2314 doi:DOI
10.4319/lo.2009.54.6_part_2.2298
Vachon D, Prairie YT, Guillemette F, del
Giorgio PA (2017) Modeling
Allochthonous Dissolved Organic
Carbon Mineralization Under
Variable Hydrologic Regimes in
Boreal Lakes. Ecosystems 20:781-
795 doi:10.1007/s10021-016-0057-
0
Verpoorter C, Kutser T, Tranvik L (2012)
Automated mapping of water
bodies using Landsat multispectral
data. Limnology and
Oceanography: Methods 10:1037-
1050
Weyhenmeyer GA, Froberg M, Karltun E,
Khalili M, Kothawala D,
Temnerud J, Tranvik LJ (2012)
Selective decay of terrestrial
organic carbon during transport
from land to sea. Global Change
Biology 18:349-355
doi:10.1111/j.1365-
2486.2011.02544.x
Xiao YH, Raike A, Hartikainen H,
Vahatalo AV (2015) Iron as a
source of color in river waters. Sci
Total Environ 536:914-923
doi:10.1016/j.scitotenv.2015.06.09
2
46
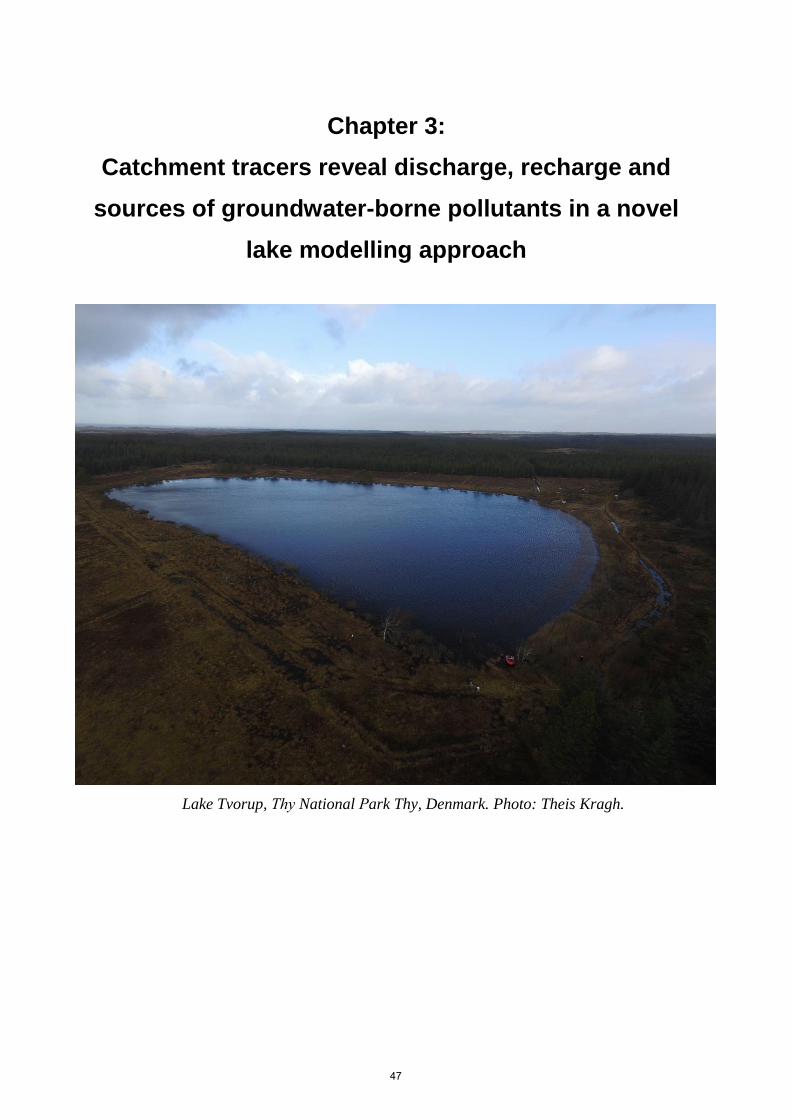
Chapter 3:
Catchment tracers reveal discharge, recharge and
sources of groundwater-borne pollutants in a novel
lake modelling approach
Lake Tvorup, Thy National Park Thy, Denmark. Photo: Theis Kragh.
47
Biogeosciences, 15, 1203–1216, 2018https://doi.org/10.5194/bg-15-1203-2018© Author(s) 2018. This work is distributed underthe Creative Commons Attribution 3.0 License.
Catchment tracers reveal discharge, recharge and sources ofgroundwater-borne pollutants in a novel lake modelling approachEmil Kristensen1, Mikkel Madsen-Østerbye1, Philippe Massicotte2, Ole Pedersen1, Stiig Markager2, andTheis Kragh1
1The Freshwater Biological Laboratory, Department of Biology, University of Copenhagen, Copenhagen, 2100, Denmark2Department of Bioscience, Aarhus University, 4000, Roskilde, Denmark
Correspondence: Emil Kristensen ([email protected])
Received: 23 May 2017 – Discussion started: 4 October 2017Revised: 23 January 2018 – Accepted: 25 January 2018 – Published: 28 February 2018
Abstract. Groundwater-borne contaminants such as nutri-ents, dissolved organic carbon (DOC), coloured dissolvedorganic matter (CDOM) and pesticides can have an impactthe biological quality of lakes. The sources of pollutants can,however, be difficult to identify due to high heterogeneity ingroundwater flow patterns. This study presents a novel ap-proach for fast hydrological surveys of small groundwater-fed lakes using multiple groundwater-borne tracers. Watersamples were collected from the lake and temporary ground-water wells, installed every 50 m within a distance of 5–45 m to the shore, were analysed for tracer concentrations ofCDOM, DOC, total dissolved nitrogen (TDN, groundwateronly), total nitrogen (TN, lake only), total dissolved phos-phorus (TDP, groundwater only), total phosphorus (TP, lakeonly), δ18O / δ16O isotope ratios and fluorescent dissolvedorganic matter (FDOM) components derived from parallelfactor analysis (PARAFAC). The isolation of groundwaterrecharge areas was based on δ18O measurements and areaswith a high groundwater recharge rate were identified usinga microbially influenced FDOM component. Groundwaterdischarge sites and the fractions of water delivered from theindividual sites were isolated with the Community Assemblyvia Trait Selection model (CATS). The CATS model utilizedtracer measurements of TDP, TDN, DOC and CDOM fromthe groundwater samples and related these to the tracer mea-surements of TN, TP, DOC and CDOM in the lake. A directcomparison between the lake and the inflowing groundwaterwas possible as degradation rates of the tracers in the lakewere taken into account and related to a range of water reten-tion times (WRTs) of the lake (0.25–3.5 years in 0.25-yearincrements). These estimations showed that WRTs above
2 years required a higher tracer concentration of inflowingwater than found in any of the groundwater wells around thelake. From the estimations of inflowing tracer concentration,the CATS model isolated groundwater discharge sites locatedmainly in the eastern part of the lake with a single site in thesouthern part. Observations from the eastern part of the lakerevealed an impermeable clay layer that promotes dischargeduring heavy precipitation events, which would otherwise bedifficult to identify using traditional hydrological methods. Incomparison to the lake concentrations, high tracer concentra-tions in the southern part showed that only a smaller fractionof water could originate from this area, thereby confirmingthe model results. A Euclidean cluster analysis of δ18O iso-topes identified recharge sites corresponding to areas adja-cent to drainage channels, and a cluster analysis of the mi-crobially influenced FDOM component C4 further identifiedfive sites that showed a tendency towards high groundwaterrecharge rate. In conclusion, it was found that this method-ology can be applied to smaller lakes within a short timeframe, providing useful information regarding the WRT ofthe lake and more importantly the groundwater recharge anddischarge sites around the lake. Thus, it is a tool for specificmanagement of the catchment.
1 Introduction
Most lakes are connected to the groundwater, which to somedegree defines their chemical and biological characteristics(Lewandowski et al., 2015). Particularly in smaller lakesand ponds, the groundwater contributes nutrients, dissolved
Published by Copernicus Publications on behalf of the European Geosciences Union.48
1204 E. Kristensen et al.: Catchment tracers reveal groundwater flow
organic carbon (DOC), coloured dissolved organic matter(CDOM) or other contaminants, which can have a negativeimpact on the biological quality of the lakes (for nitrogenand phosphorous, see review by Lewandowski et al., 2015).These inputs often result in unfavourable light conditionsfor submerged macrophytes due to either increased phyto-plankton biomass (Smith, 2003) or increased light absorptionfrom high CDOM concentrations. The negative impacts ofthe contaminants make the identification of pollutant sourcesan important management issue for lakes, which, however,is complicated for groundwater due to temporal and spatialdifferences in discharge and associated pollutant concentra-tions (e.g. Meinikmann et al., 2013). In addition, the lakehydrology itself may be important, particularly in small wa-ter bodies. For example, low or fluctuating water level canhave a large influence on the biodiversity of the lake (Chow-Fraser et al., 1998). This illustrates the need for approachesto quickly identify discharge (i.e. groundwater exfiltratingto the lake) and recharge (i.e. lake water infiltrating to thegroundwater) areas on the lake scale and thereby providethe necessary tools for an effective management strategy forponds and small lakes.
Groundwater discharge and recharge are traditionallyidentified and quantified by measurements of the hydraulichead through the installation of piezometers around the lakeand of the hydraulic conductivity in the sediments (Rosen-berry et al., 2015). This method is often combined with theuse of seepage meters, which quantify the water enteringor leaving through the lake bottom (Lee and Cherry, 1979).However, this method is challenged by the heterogeneousnature of groundwater seepage related to the specific hy-draulic conductivity of the lake bed sediments (Cherkauerand Nader, 1989; Kishel and Gerla, 2002; Rosenberry, 2005).Furthermore, these methods are also time-consuming as theyhave to be carried out several times throughout the sea-son. The heterogeneity and annual variability in groundwaterseepage call for a robust, easier and faster method to deter-mine groundwater inputs and influences.
Various conservative tracers have been used to achieveestimates of groundwater flow and water retention times(WRTs) in lakes. These tracers are divided into three maincategories: (1) environmental tracers (naturally derived trac-ers from the atmosphere or catchment that are transportedto the system), (2) historical tracers (anthropogenic tracerssuch as 3H or 36Cl from nuclear testing) or (3) applied trac-ers (tracers added to the system such as Br, Cl or fluorescentdyes) (Stets et al., 2010). Precipitation-derived environmen-tal tracers, such as the isotope δ18O (reported in the Vienna-standard mean ocean water (SMOW), where δsample ‰=1000((Rsample/Rsmow)− 1) and R is the δ18O / δ16O ratio(Turner et al., 1987)), have been used to trace the interac-tion between groundwater and surface water. As evapora-tion occurs in the surface water it becomes enriched withδ18O, producing a unique lake δ18O/δ16O ratio, which canbe traced in the areas with groundwater recharge (Krabben-
hoft et al., 1990). The isotopic composition can also be re-lated to evaporation lines (from the local evaporation linedescribing the δ18O and δ2H relationship) to estimate WRT(Gibson et al., 2002). Overall, these tracers provide informa-tion on flow patterns in the terrain or WRT, but they do notprovide information regarding discharge in specific areas orthe concentrations of the previously mentioned pollutants inthe discharging water. We propose a different approach uti-lizing both conservative and non-conservative tracers such asdissolved carbon and nutrients, which are partly transferredto the percolating groundwater on its way to the lake (Kid-mose et al., 2011) and have a direct influence on the lake’sbiological structure.
Some non-conservative tracers such as fluorescent dis-solved organic matter (FDOM), which can be determinedusing parallel factor analysis (PARAFAC), have been usedto trace DOM in aquatic environments (He et al., 2014; Mas-sicotte and Frenette, 2011; Stedmon et al., 2003; Stedmonand Markager, 2005b; Walker et al., 2009). PARAFAC anal-ysis is a modelling tool that can separate multiple FDOMsamples (emission and excitation matrices) into specific flu-orescent components (Stedmon et al., 2003). The fluores-cent components can be biologically produced proteins de-rived from bacteria or molecules from the degradation of ter-restrial organic material. These components have previouslybeen found visually using a single excitation emission ma-trix and the observed fluorescent peaks (Coble, 1996). Thedifferentiation between the fluorescent components are botha strength and a weakness as we can isolate many differentcomponents, but all of them can differ in both degradationand production rate in the lake and groundwater. Further-more, these FDOM components have not yet been investi-gated as tracers in groundwater-fed lakes, as they, just as therest of the non-conservative biological tracers, are volatile.
This is observed as a change in tracer concentrations (of-ten a decrease) after the groundwater is discharged to thelake. The speed at which the change in concentration occursis typically related to seasonal variations (e.g. temperature,mixing of the water column and UV radiation) and the WRTof the lake, e.g. the amount of time the tracer has been in thelake. The removal and degradation rates have been examinedin many instances, e.g. for phosphorus (Larsen and Mercier,1976; Vollenweider, 1975), nitrate (Harrison et al., 2009;Jensen et al., 1995), CDOM and DOC (Madsen-Østerbyeet al., 2018). In a modelling approach, these rates are impor-tant as they provide information about the change in tracerconcentration from the time when the tracer entered the lake.From this, it is possible to back-calculate the mixed inflowconcentration of specific tracers when they were dischargedto the lake. These estimations are crucial when working withnon-conservative tracers, as they enable a direct compari-son between the tracer concentration found in the catchmentand the estimated lake concentration before degradation tookplace, which originates from the mixed inflow of groundwa-ter.
Biogeosciences, 15, 1203–1216, 2018 www.biogeosciences.net/15/1203/2018/49
E. Kristensen et al.: Catchment tracers reveal groundwater flow 1205
As the concentrations of both conservative and non-conservative tracers in a groundwater-fed lake correspond tothe mixed concentrations of discharging groundwater, tak-ing degradation and atmospheric deposition into account, itis possible to utilize the Community Assembly via Trait Se-lection (CATS) approach. This model has been used to pre-dict the relative abundances of a set of species from measuresof community-aggregated trait values (average leaf area, rootlength, etc.) for all plant species at a site (Shipley, 2009;Shipley et al., 2006, 2011). The CATS model has three mainparameters: (1) it models the probabilities that (2) maximizethe entropy, which (3) is based on a set of constraints (Lalib-erté et al., 2014; Shipley et al., 2011). In reality, the model(1) predicts the relative abundances of species at a loca-tion from their (3) average trait values by (2) minimizingthe number of species that explain the mean trait values.Maximum entropy (2) is the maximizing of “new knowl-edge gained” related to plant communities. This means mov-ing from “all species have the same relative abundances” to“a few species have a high relative abundance”. When ap-plying the model to the lake–groundwater interaction, weuse the measured tracer concentrations at groundwater wellsites around the lake as the individual plant species and theestimated mixed lake concentration before degradation tookplace as the community-aggregated trait values.
Determining groundwater movement using both conserva-tive and non-conservative tracers found around the lake shoreovercomes some fundamental shortcomings related to tradi-tional sampling. Firstly, we often measure tracers, which donot have a direct impact on the lake ecosystem and there-fore do not provide meaningful information regarding theinflow of nutrients or CDOM. Furthermore, the sampling isonly performed in a few places throughout the catchment,which does not necessarily provide all the information on thegroundwater flow patterns or to which degree water entersthe lake and where. To overcome this, we measured conser-vative and relevant non-conservative tracers in and arounda small lake with the aim of developing a novel approach toidentify groundwater discharge and recharge areas on a highspatial scale. Thus areas that deliver pollutants to the lake,in which groundwater recharge happens and where rechargeoccurs with an increased flow rate, were pinpointed. The lat-ter can spark further investigations into the lake WRT. In-formation regarding the WRT of the lake is especially use-ful when investigating how the concentrations of pollutantsin the lake will develop after future restoration attempts. Inthe present study, the eight following tracers were measured:FDOM, CDOM, DOC, total dissolved phosphorus (TDP),total dissolved nitrogen (TDN), total phosphorus (TP), to-tal nitrogen (TN) and δ18O / δ16O isotope ratios. For thesetracers, we tested (1) if groundwater discharge sites andpollutant sources can be estimated with the CATS modelbased on tracer concentrations, (2) whether conservative andnon-conservative tracers can be used to detect groundwa-ter recharge areas as well as provide insights into which
areas possess a high groundwater recharge rate and (3) ifcatchment-derived tracer concentrations can be used to es-timate a range of WRTs, which can be used with the CATSmodel.
2 Materials and methods
A small groundwater-fed lake in the sandy northwestern partof Denmark was chosen for this study (Tvorup Hul, area:4 ha, mean depth: 2.4 m, 56◦91′ N, 8◦46′ E, UTM Zone 32).Coniferous forest and heathland dominate the catchment, al-though some agricultural activities are found in the easternpart of the catchment (Fig. 1a). Various isoetids including therare nationally threatened species Isoetes echinospora andSubularia aquatica inhabited the lake until some decadesago when brownification increased significantly (based onRebsdorf, 1981, and the present study), probably due to in-creasing soil pH (Ekström et al., 2011). This led to a restora-tion attempt in 1992; a channel was established to bypassthe stream going through the lake, thus making the lake fedby groundwater. CDOM, DOC and the hydrologic conditionsin the lake have since been investigated in several projects(Madsen-Østerbye et al., 2018; Solvang, 2016). This has re-sulted in extensive background data as well as estimationsof WRTs between 0.4 and 3.3 years based on water tableheights, hydraulic conductivity and seepage meter samplings(Solvang, 2016, and preliminary work Peter Engesgaard, per-sonal communications, 2017).
2.1 Sampling and laboratory analysis
A total of 30 groundwater samples were taken every 50 maround the lake within a distance of 5–45 m to the shorein temporary groundwater wells at 1.25 m depth in Febru-ary 2016. The data preparation, analysis and results are vi-sualized in Fig. 2. The water in the wells was replaced threetimes before transferring the sample water to an acid-rinsedcontainer. The samples were filtered through pre-combusted0.7 µm nominal pore size Whatman GF/F filters the sameday and kept cool and dark in hermetically sealed acid-rinsedBOD flasks until examination. Unfiltered samples were alsocollected from the lake.
DOC concentrations were measured using a total organiccarbon analyser (Shimadzu, Japan) in accordance with Kraghand Søndergaard (2004). The CDOM absorbance was mea-sured on a spectrophotometer (UV-1800, Shimadzu, Japan)between 240 and 750 nm in 1 nm intervals in a 1 cm quartzglass cuvette and expressed as the absorbance at 340 nm(ACDOM (340) cm−1). The samples were analysed for δ18Oand δ16O isotopes at the Department of Geosciences andNatural Resource Management (University of Copenhagen)using mass spectrometry in accordance with Appelo andPostma (2005). δ18O is presented in the standard δ notationV-SMOW as δ18O ‰ (Vienna Standard Mean Ocean Water)
www.biogeosciences.net/15/1203/2018/ Biogeosciences, 15, 1203–1216, 201850
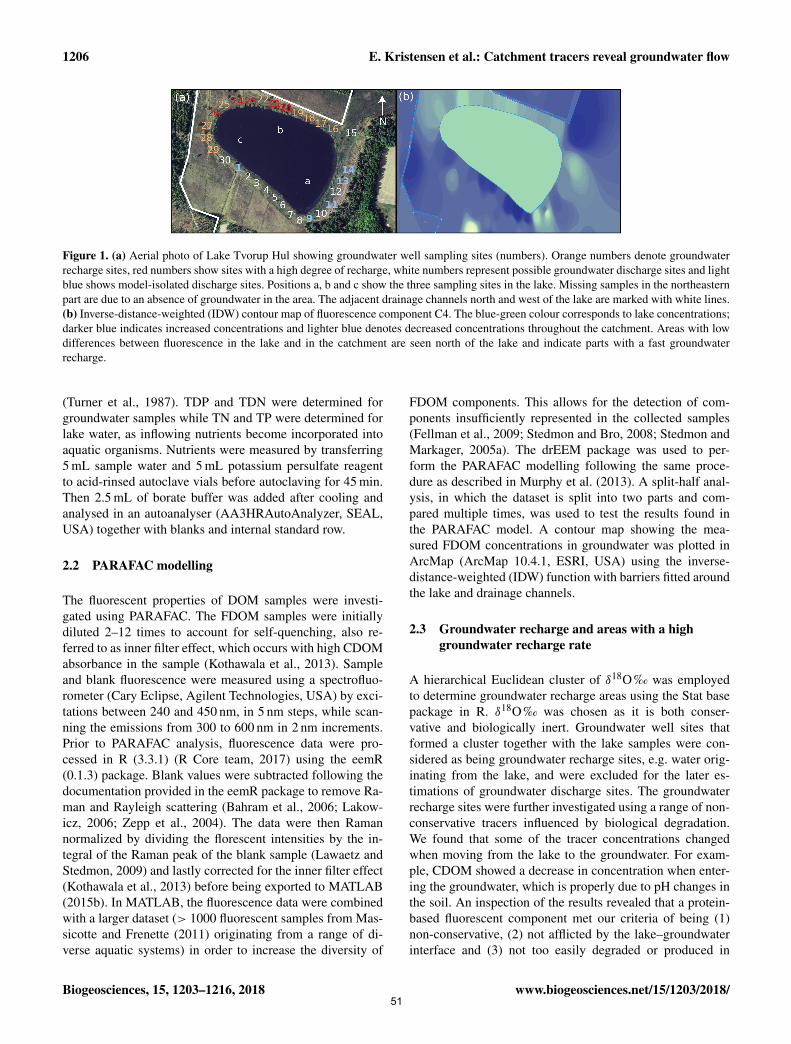
1206 E. Kristensen et al.: Catchment tracers reveal groundwater flow
Figure 1. (a) Aerial photo of Lake Tvorup Hul showing groundwater well sampling sites (numbers). Orange numbers denote groundwaterrecharge sites, red numbers show sites with a high degree of recharge, white numbers represent possible groundwater discharge sites and lightblue shows model-isolated discharge sites. Positions a, b and c show the three sampling sites in the lake. Missing samples in the northeasternpart are due to an absence of groundwater in the area. The adjacent drainage channels north and west of the lake are marked with white lines.(b) Inverse-distance-weighted (IDW) contour map of fluorescence component C4. The blue-green colour corresponds to lake concentrations;darker blue indicates increased concentrations and lighter blue denotes decreased concentrations throughout the catchment. Areas with lowdifferences between fluorescence in the lake and in the catchment are seen north of the lake and indicate parts with a fast groundwaterrecharge.
(Turner et al., 1987). TDP and TDN were determined forgroundwater samples while TN and TP were determined forlake water, as inflowing nutrients become incorporated intoaquatic organisms. Nutrients were measured by transferring5 mL sample water and 5 mL potassium persulfate reagentto acid-rinsed autoclave vials before autoclaving for 45 min.Then 2.5 mL of borate buffer was added after cooling andanalysed in an autoanalyser (AA3HRAutoAnalyzer, SEAL,USA) together with blanks and internal standard row.
2.2 PARAFAC modelling
The fluorescent properties of DOM samples were investi-gated using PARAFAC. The FDOM samples were initiallydiluted 2–12 times to account for self-quenching, also re-ferred to as inner filter effect, which occurs with high CDOMabsorbance in the sample (Kothawala et al., 2013). Sampleand blank fluorescence were measured using a spectrofluo-rometer (Cary Eclipse, Agilent Technologies, USA) by exci-tations between 240 and 450 nm, in 5 nm steps, while scan-ning the emissions from 300 to 600 nm in 2 nm increments.Prior to PARAFAC analysis, fluorescence data were pro-cessed in R (3.3.1) (R Core team, 2017) using the eemR(0.1.3) package. Blank values were subtracted following thedocumentation provided in the eemR package to remove Ra-man and Rayleigh scattering (Bahram et al., 2006; Lakow-icz, 2006; Zepp et al., 2004). The data were then Ramannormalized by dividing the florescent intensities by the in-tegral of the Raman peak of the blank sample (Lawaetz andStedmon, 2009) and lastly corrected for the inner filter effect(Kothawala et al., 2013) before being exported to MATLAB(2015b). In MATLAB, the fluorescence data were combinedwith a larger dataset (> 1000 fluorescent samples from Mas-sicotte and Frenette (2011) originating from a range of di-verse aquatic systems) in order to increase the diversity of
FDOM components. This allows for the detection of com-ponents insufficiently represented in the collected samples(Fellman et al., 2009; Stedmon and Bro, 2008; Stedmon andMarkager, 2005a). The drEEM package was used to per-form the PARAFAC modelling following the same proce-dure as described in Murphy et al. (2013). A split-half anal-ysis, in which the dataset is split into two parts and com-pared multiple times, was used to test the results found inthe PARAFAC model. A contour map showing the mea-sured FDOM concentrations in groundwater was plotted inArcMap (ArcMap 10.4.1, ESRI, USA) using the inverse-distance-weighted (IDW) function with barriers fitted aroundthe lake and drainage channels.
2.3 Groundwater recharge and areas with a highgroundwater recharge rate
A hierarchical Euclidean cluster of δ18O ‰ was employedto determine groundwater recharge areas using the Stat basepackage in R. δ18O ‰ was chosen as it is both conser-vative and biologically inert. Groundwater well sites thatformed a cluster together with the lake samples were con-sidered as being groundwater recharge sites, e.g. water orig-inating from the lake, and were excluded for the later es-timations of groundwater discharge sites. The groundwaterrecharge sites were further investigated using a range of non-conservative tracers influenced by biological degradation.We found that some of the tracer concentrations changedwhen moving from the lake to the groundwater. For exam-ple, CDOM showed a decrease in concentration when enter-ing the groundwater, which is properly due to pH changes inthe soil. An inspection of the results revealed that a protein-based fluorescent component met our criteria of being (1)non-conservative, (2) not afflicted by the lake–groundwaterinterface and (3) not too easily degraded or produced in
Biogeosciences, 15, 1203–1216, 2018 www.biogeosciences.net/15/1203/2018/51
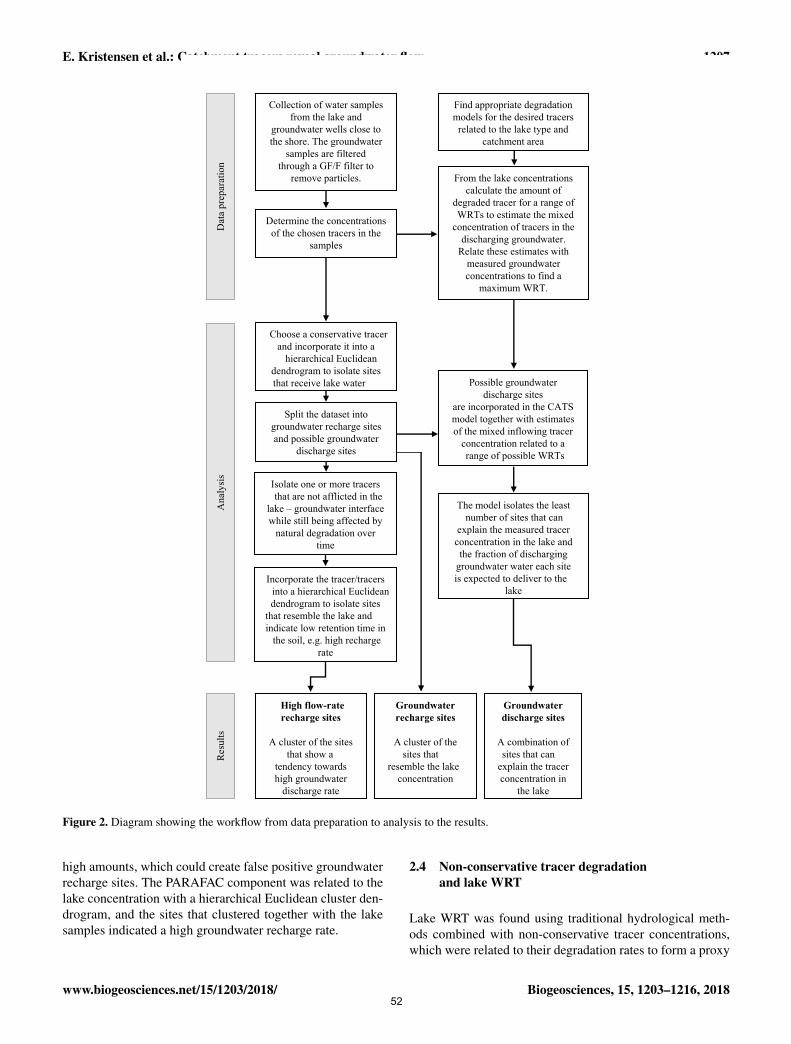
E. Kristensen et al.: Catchment tracers reveal groundwater flow 1207
From the lake concentrations calculate the amount of
degraded tracer for a range of WRTs to estimate the mixed
concentration of tracers in the discharging groundwater.
Relate these estimates with measured groundwater concentrations to find a
maximum WRT.
Possible groundwater discharge sites
are incorporated in the CATS model together with estimates of the mixed inflowing tracer
concentration related to a range of possible WRTs
Find appropriate degradation models for the desired tracers
related to the lake type and catchment area
The model isolates the least number of sites that can
explain the measured tracer concentration in the lake and the fraction of discharging
groundwater water each site is expected to deliver to the
lakeIncorporate the tracer/tracers
into a hierarchical Euclidean dendrogram to isolate sites
that resemble the lake and indicate low retention time in
the soil, e.g. high recharge rate
Choose a conservative tracer and incorporate it into a
hierarchical Euclidean dendrogram to isolate sites that receive lake water
Isolate one or more tracers that are not afflicted in the
lake – groundwater interface while still being affected by
natural degradation over time
Dat
a pr
epar
atio
n
Collection of water samples from the lake and
groundwater wells close to the shore. The groundwater
samples are filtered through a GF/F filter to
remove particles.
Ana
lysi
sR
esul
tsDetermine the concentrations
of the chosen tracers in the samples
Groundwater recharge sites
A cluster of the sites that
resemble the lake concentration
Groundwater discharge sites
A combination of sites that can
explain the tracer concentration in
the lake
High flow-rate recharge sites
A cluster of the sites that show a
tendency towards high groundwater
discharge rate
Split the dataset into groundwater recharge sites and possible groundwater
discharge sites
Figure 2. Diagram showing the workflow from data preparation to analysis to the results.
high amounts, which could create false positive groundwaterrecharge sites. The PARAFAC component was related to thelake concentration with a hierarchical Euclidean cluster den-drogram, and the sites that clustered together with the lakesamples indicated a high groundwater recharge rate.
2.4 Non-conservative tracer degradationand lake WRT
Lake WRT was found using traditional hydrological meth-ods combined with non-conservative tracer concentrations,which were related to their degradation rates to form a proxy
www.biogeosciences.net/15/1203/2018/ Biogeosciences, 15, 1203–1216, 201852
1208 E. Kristensen et al.: Catchment tracers reveal groundwater flow
for the maximum WRT. Previous hydrological models sug-gested that the lake had a WRT between 0.4 and 3.3 years. Tofurther narrow this range, we estimated WRT by relating theconcentrations found in the lake to their respective degrada-tion rates related to increasing WRT, e.g. by adding the esti-mated removed tracer since the groundwater entered the laketo the measured concentration in the lake. This enabled usto narrow the span of the WRT based on the estimated mixedinflowing tracer concentration related to the actual catchmentconcentrations. For example, if the estimated inflow concen-tration of a tracer is 100 µmolL−1 at a WRT of 2 years, andthe highest catchment tracer concentration is 50 µmolL−1,then the catchment does not support a WRT of 2 years. Inthis instance, we estimated lake tracer concentrations of TN,TP, CDOM and DOC for WRTs from 0.25 to 3.5 years in0.25-year increments following Eq. (1):
MIC=trlake
ret (frac), (1)
where MIC is the mixed inflow concentration, trlake is thetracer concentration found in the lake and ret (frac) is theretention fraction of the tracer at a known WRT. Retentionmodels used in this study were based on the lake type aswell as the geographical location of our lake. As there is notone model that can provide removal rates across all lakes,we encourage the readers to find models related to their spe-cific lake type. Thus, phosphorus equilibrium concentrationin this study was found using Eq. (2) modified from Larsenand Mercier (1976), which describes phosphor retention inlakes with low productivity:
retP (frac)= 1−1
1+√
WRT, (2)
where retP (frac) is the retention fraction of phosphorus andWRT is the water retention time in the lake. Similarly, nitrateinflow concentrations were estimated using a modified Dan-ish nitrate removal model derived from Jensen et al. (1995)describing retention for shallow lakes with a short WRT (0–6 years) Eq. (3):
retN (frac)=59 ·WRT0.29
100, (3)
where retN (frac) is the retention fraction of nitrate and WRTis the water retention time in the lake. The correspondingretention fractions removed at different WRTs were relatedto the lake concentrations to estimate what the mixed in-flow concentration must have been to produce the presentlake concentration. The combined summer UV radiation andbacterial degradation rates of DOC and CDOM in ground-water from the dominating catchment vegetation type of thelake (Madsen-Østerbye et al., 2018) were extrapolated to therest of the year. This was performed by relating the degra-dation rates to the mean monthly UV index (DMI, 2015)while assuming a linear relationship between the UV index
and degradation rates. Thus we were able to estimate the spe-cific removal of DOC and CDOM on a monthly basis relatedto the concentration measured in the lake at the time of sam-pling following Eq. (4):
trlake = trlakepm− trlakepm · degra (frac)− trlakepm ·mf+ trinflow ·mff, (4)
where trlake is the lake concentration in the specific month,trlakepm is the lake tracer concentration in the previous month,mff is the monthly flushing fraction (mff= 1/WRT/12), de-gra (frac) is the degradation fraction in the present month re-lated to UV radiation and trinflow is the inflowing tracer con-centration. Equation (4) was solved for trinflow and calculatedusing the same WRTs as the nitrate and phosphorus models.
2.5 The CATS model
Since the concentrations of both conservative and non-conservative tracers in a groundwater-fed lake correspondto the mixed concentrations of discharging groundwater,while taking degradation and atmospheric deposition intoaccount, it is possible to utilize the CATS model. In thepresent study, the concentrations of non-conservative trac-ers (DOC, CDOM, TDP and TDN) at groundwater wellsites around the lake acted as the individual plant species ata site and the equilibrium tracer concentrations derived fromEq. (1) (DOC, CDOM, TP and TN) acted as the community-aggregated trait values. When choosing tracers, it is impor-tant that there is differentiation between the concentrationsmeasured at the sites. This means that a higher number oftracers and higher uncorrelated concentration differences be-tween the sites result in a more secure determination ofgroundwater discharge sites. All tracers were investigated asa combined package, e.g. a single site is described by all thetracers mentioned above, and was run using the maxent func-tion in the FD (functional diversity) package in R to computethe CATS model (Laliberté et al., 2014). Further informationon the calculations can be found in the supplementary ma-terial for the FD package (Laliberté et al., 2014). From this,the model predicts the minimum number of groundwater wellsites along the lake shore, which explains the measured con-centrations in the recipient lake by maximizing the sites’ rel-ative contribution. The model also computes lambda valuesfrom the least-squares regression measuring which tracersare most influential on the relative fractions of water originat-ing from the groundwater well sites. Consequently, lambdavalues quantify how much the relative contribution from thesites change when one tracer is changed a unit while the restof the tracers are kept constant.
Biogeosciences, 15, 1203–1216, 2018 www.biogeosciences.net/15/1203/2018/53
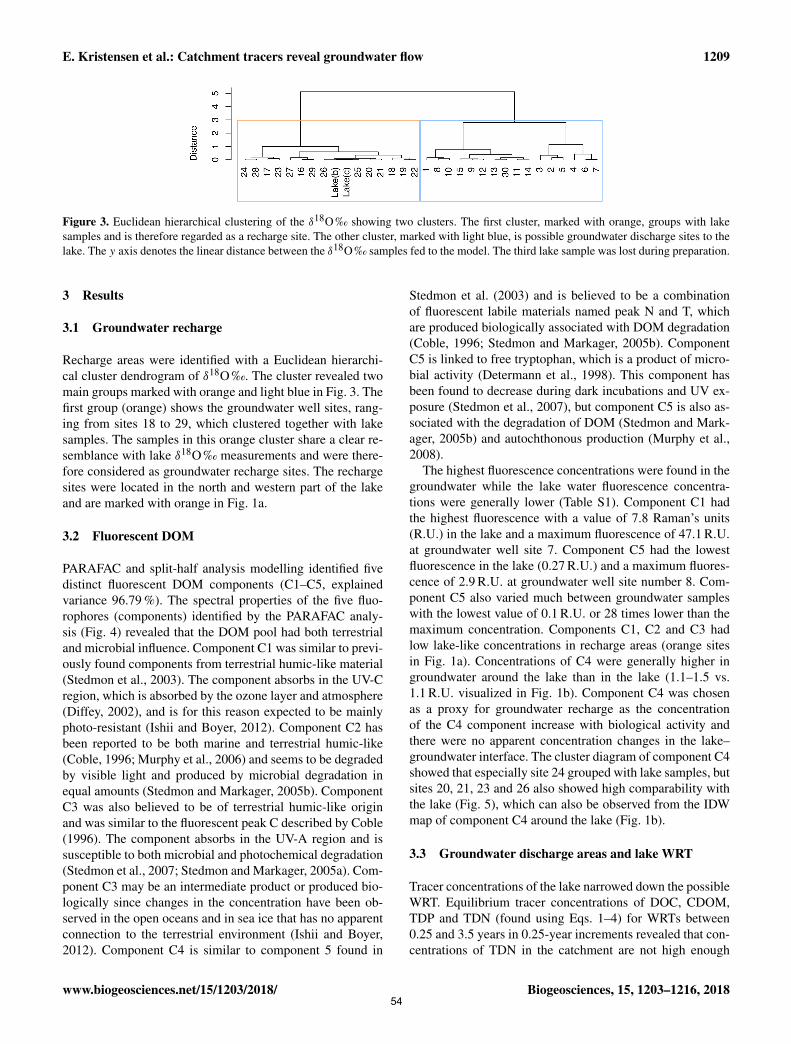
E. Kristensen et al.: Catchment tracers reveal groundwater flow 1209
Figure 3. Euclidean hierarchical clustering of the δ18O ‰ showing two clusters. The first cluster, marked with orange, groups with lakesamples and is therefore regarded as a recharge site. The other cluster, marked with light blue, is possible groundwater discharge sites to thelake. The y axis denotes the linear distance between the δ18O ‰ samples fed to the model. The third lake sample was lost during preparation.
3 Results
3.1 Groundwater recharge
Recharge areas were identified with a Euclidean hierarchi-cal cluster dendrogram of δ18O ‰. The cluster revealed twomain groups marked with orange and light blue in Fig. 3. Thefirst group (orange) shows the groundwater well sites, rang-ing from sites 18 to 29, which clustered together with lakesamples. The samples in this orange cluster share a clear re-semblance with lake δ18O ‰ measurements and were there-fore considered as groundwater recharge sites. The rechargesites were located in the north and western part of the lakeand are marked with orange in Fig. 1a.
3.2 Fluorescent DOM
PARAFAC and split-half analysis modelling identified fivedistinct fluorescent DOM components (C1–C5, explainedvariance 96.79 %). The spectral properties of the five fluo-rophores (components) identified by the PARAFAC analy-sis (Fig. 4) revealed that the DOM pool had both terrestrialand microbial influence. Component C1 was similar to previ-ously found components from terrestrial humic-like material(Stedmon et al., 2003). The component absorbs in the UV-Cregion, which is absorbed by the ozone layer and atmosphere(Diffey, 2002), and is for this reason expected to be mainlyphoto-resistant (Ishii and Boyer, 2012). Component C2 hasbeen reported to be both marine and terrestrial humic-like(Coble, 1996; Murphy et al., 2006) and seems to be degradedby visible light and produced by microbial degradation inequal amounts (Stedmon and Markager, 2005b). ComponentC3 was also believed to be of terrestrial humic-like originand was similar to the fluorescent peak C described by Coble(1996). The component absorbs in the UV-A region and issusceptible to both microbial and photochemical degradation(Stedmon et al., 2007; Stedmon and Markager, 2005a). Com-ponent C3 may be an intermediate product or produced bio-logically since changes in the concentration have been ob-served in the open oceans and in sea ice that has no apparentconnection to the terrestrial environment (Ishii and Boyer,2012). Component C4 is similar to component 5 found in
Stedmon et al. (2003) and is believed to be a combinationof fluorescent labile materials named peak N and T, whichare produced biologically associated with DOM degradation(Coble, 1996; Stedmon and Markager, 2005b). ComponentC5 is linked to free tryptophan, which is a product of micro-bial activity (Determann et al., 1998). This component hasbeen found to decrease during dark incubations and UV ex-posure (Stedmon et al., 2007), but component C5 is also as-sociated with the degradation of DOM (Stedmon and Mark-ager, 2005b) and autochthonous production (Murphy et al.,2008).
The highest fluorescence concentrations were found in thegroundwater while the lake water fluorescence concentra-tions were generally lower (Table S1). Component C1 hadthe highest fluorescence with a value of 7.8 Raman’s units(R.U.) in the lake and a maximum fluorescence of 47.1 R.U.at groundwater well site 7. Component C5 had the lowestfluorescence in the lake (0.27 R.U.) and a maximum fluores-cence of 2.9 R.U. at groundwater well site number 8. Com-ponent C5 also varied much between groundwater sampleswith the lowest value of 0.1 R.U. or 28 times lower than themaximum concentration. Components C1, C2 and C3 hadlow lake-like concentrations in recharge areas (orange sitesin Fig. 1a). Concentrations of C4 were generally higher ingroundwater around the lake than in the lake (1.1–1.5 vs.1.1 R.U. visualized in Fig. 1b). Component C4 was chosenas a proxy for groundwater recharge as the concentrationof the C4 component increase with biological activity andthere were no apparent concentration changes in the lake–groundwater interface. The cluster diagram of component C4showed that especially site 24 grouped with lake samples, butsites 20, 21, 23 and 26 also showed high comparability withthe lake (Fig. 5), which can also be observed from the IDWmap of component C4 around the lake (Fig. 1b).
3.3 Groundwater discharge areas and lake WRT
Tracer concentrations of the lake narrowed down the possibleWRT. Equilibrium tracer concentrations of DOC, CDOM,TDP and TDN (found using Eqs. 1–4) for WRTs between0.25 and 3.5 years in 0.25-year increments revealed that con-centrations of TDN in the catchment are not high enough
www.biogeosciences.net/15/1203/2018/ Biogeosciences, 15, 1203–1216, 201854
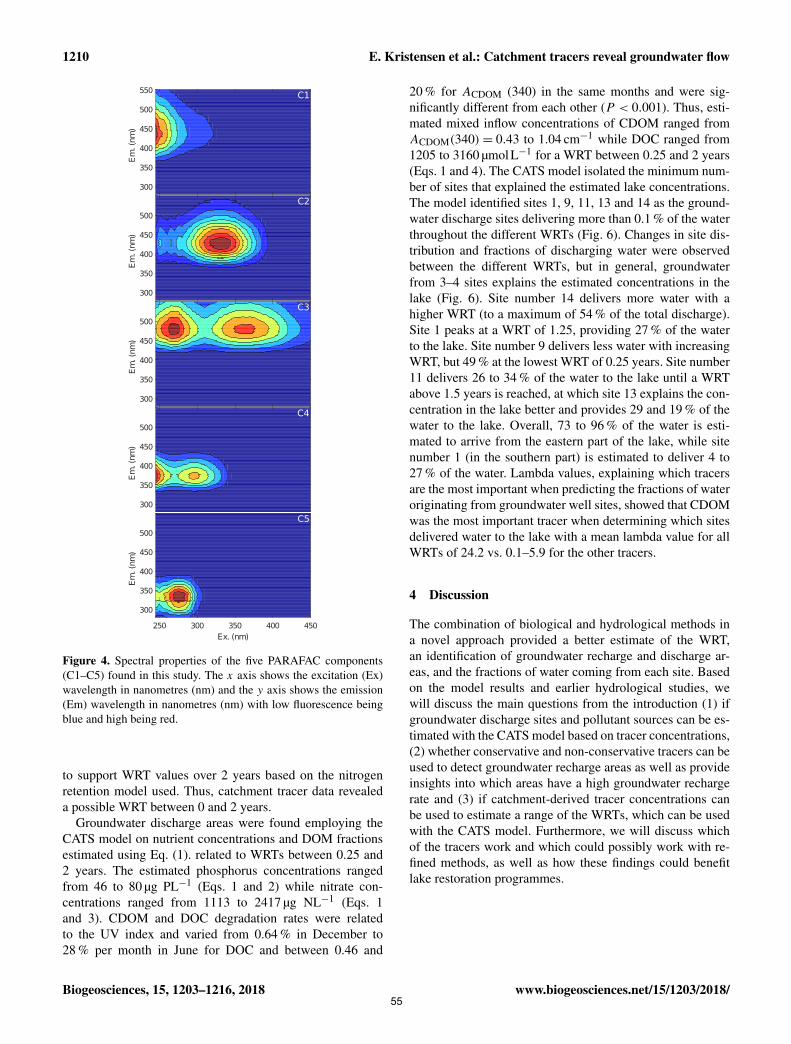
1210 E. Kristensen et al.: Catchment tracers reveal groundwater flow
Comp 1300
350
400
450
500
550
Em
. (nm
)
Comp 2300
350
400
450
500
Comp 3300
350
400
450
500
Comp 4300
350
400
450
500
Em
. (nm
)
Comp 5
250 300 350 400 450Ex. (nm)
300
350
400
450
500
Em
. (nm
)E
m. (
nm)
Em
. (nm
)
C1
C3
C2
C5
C4
Figure 4. Spectral properties of the five PARAFAC components(C1–C5) found in this study. The x axis shows the excitation (Ex)wavelength in nanometres (nm) and the y axis shows the emission(Em) wavelength in nanometres (nm) with low fluorescence beingblue and high being red.
to support WRT values over 2 years based on the nitrogenretention model used. Thus, catchment tracer data revealeda possible WRT between 0 and 2 years.
Groundwater discharge areas were found employing theCATS model on nutrient concentrations and DOM fractionsestimated using Eq. (1). related to WRTs between 0.25 and2 years. The estimated phosphorus concentrations rangedfrom 46 to 80 µg PL−1 (Eqs. 1 and 2) while nitrate con-centrations ranged from 1113 to 2417 µg NL−1 (Eqs. 1and 3). CDOM and DOC degradation rates were relatedto the UV index and varied from 0.64 % in December to28 % per month in June for DOC and between 0.46 and
20 % for ACDOM (340) in the same months and were sig-nificantly different from each other (P < 0.001). Thus, esti-mated mixed inflow concentrations of CDOM ranged fromACDOM(340)= 0.43 to 1.04 cm−1 while DOC ranged from1205 to 3160 µmol L−1 for a WRT between 0.25 and 2 years(Eqs. 1 and 4). The CATS model isolated the minimum num-ber of sites that explained the estimated lake concentrations.The model identified sites 1, 9, 11, 13 and 14 as the ground-water discharge sites delivering more than 0.1 % of the waterthroughout the different WRTs (Fig. 6). Changes in site dis-tribution and fractions of discharging water were observedbetween the different WRTs, but in general, groundwaterfrom 3–4 sites explains the estimated concentrations in thelake (Fig. 6). Site number 14 delivers more water with ahigher WRT (to a maximum of 54 % of the total discharge).Site 1 peaks at a WRT of 1.25, providing 27 % of the waterto the lake. Site number 9 delivers less water with increasingWRT, but 49 % at the lowest WRT of 0.25 years. Site number11 delivers 26 to 34 % of the water to the lake until a WRTabove 1.5 years is reached, at which site 13 explains the con-centration in the lake better and provides 29 and 19 % of thewater to the lake. Overall, 73 to 96 % of the water is esti-mated to arrive from the eastern part of the lake, while sitenumber 1 (in the southern part) is estimated to deliver 4 to27 % of the water. Lambda values, explaining which tracersare the most important when predicting the fractions of wateroriginating from groundwater well sites, showed that CDOMwas the most important tracer when determining which sitesdelivered water to the lake with a mean lambda value for allWRTs of 24.2 vs. 0.1–5.9 for the other tracers.
4 Discussion
The combination of biological and hydrological methods ina novel approach provided a better estimate of the WRT,an identification of groundwater recharge and discharge ar-eas, and the fractions of water coming from each site. Basedon the model results and earlier hydrological studies, wewill discuss the main questions from the introduction (1) ifgroundwater discharge sites and pollutant sources can be es-timated with the CATS model based on tracer concentrations,(2) whether conservative and non-conservative tracers can beused to detect groundwater recharge areas as well as provideinsights into which areas have a high groundwater rechargerate and (3) if catchment-derived tracer concentrations canbe used to estimate a range of the WRTs, which can be usedwith the CATS model. Furthermore, we will discuss whichof the tracers work and which could possibly work with re-fined methods, as well as how these findings could benefitlake restoration programmes.
Biogeosciences, 15, 1203–1216, 2018 www.biogeosciences.net/15/1203/2018/55
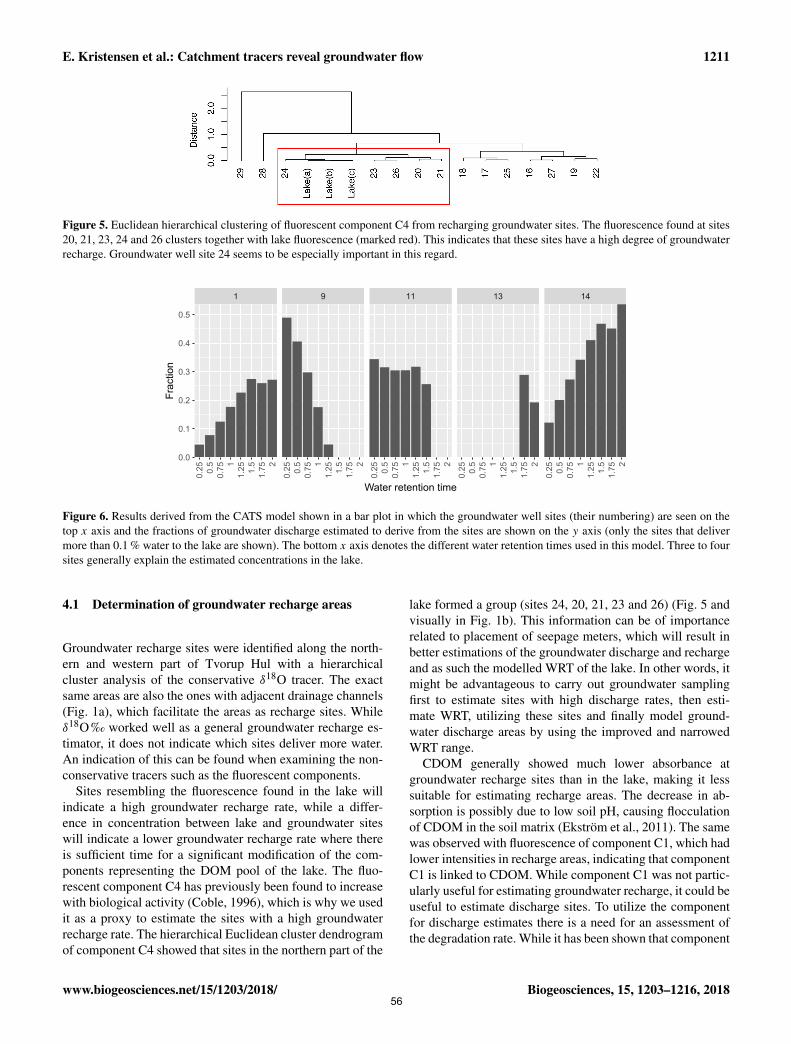
E. Kristensen et al.: Catchment tracers reveal groundwater flow 1211
Figure 5. Euclidean hierarchical clustering of fluorescent component C4 from recharging groundwater sites. The fluorescence found at sites20, 21, 23, 24 and 26 clusters together with lake fluorescence (marked red). This indicates that these sites have a high degree of groundwaterrecharge. Groundwater well site 24 seems to be especially important in this regard.
1 9 11 13 14
0.25 0.
50.
75 11.
25 1.5
1.75 2
0.25 0.
50.
75 11.
25 1.5
1.75 2
0.25 0.
50.
75 11.
25 1.5
1.75 2
0.25 0.
50.
75 11.
25 1.5
1.75 2
0.25 0.
50.
75 11.
25 1.5
1.75 2
0.0
0.1
0.2
0.3
0.4
0.5
Water retention time
Frac
tion
Figure 6. Results derived from the CATS model shown in a bar plot in which the groundwater well sites (their numbering) are seen on thetop x axis and the fractions of groundwater discharge estimated to derive from the sites are shown on the y axis (only the sites that delivermore than 0.1 % water to the lake are shown). The bottom x axis denotes the different water retention times used in this model. Three to foursites generally explain the estimated concentrations in the lake.
4.1 Determination of groundwater recharge areas
Groundwater recharge sites were identified along the north-ern and western part of Tvorup Hul with a hierarchicalcluster analysis of the conservative δ18O tracer. The exactsame areas are also the ones with adjacent drainage channels(Fig. 1a), which facilitate the areas as recharge sites. Whileδ18O ‰ worked well as a general groundwater recharge es-timator, it does not indicate which sites deliver more water.An indication of this can be found when examining the non-conservative tracers such as the fluorescent components.
Sites resembling the fluorescence found in the lake willindicate a high groundwater recharge rate, while a differ-ence in concentration between lake and groundwater siteswill indicate a lower groundwater recharge rate where thereis sufficient time for a significant modification of the com-ponents representing the DOM pool of the lake. The fluo-rescent component C4 has previously been found to increasewith biological activity (Coble, 1996), which is why we usedit as a proxy to estimate the sites with a high groundwaterrecharge rate. The hierarchical Euclidean cluster dendrogramof component C4 showed that sites in the northern part of the
lake formed a group (sites 24, 20, 21, 23 and 26) (Fig. 5 andvisually in Fig. 1b). This information can be of importancerelated to placement of seepage meters, which will result inbetter estimations of the groundwater discharge and rechargeand as such the modelled WRT of the lake. In other words, itmight be advantageous to carry out groundwater samplingfirst to estimate sites with high discharge rates, then esti-mate WRT, utilizing these sites and finally model ground-water discharge areas by using the improved and narrowedWRT range.
CDOM generally showed much lower absorbance atgroundwater recharge sites than in the lake, making it lesssuitable for estimating recharge areas. The decrease in ab-sorption is possibly due to low soil pH, causing flocculationof CDOM in the soil matrix (Ekström et al., 2011). The samewas observed with fluorescence of component C1, which hadlower intensities in recharge areas, indicating that componentC1 is linked to CDOM. While component C1 was not partic-ularly useful for estimating groundwater recharge, it could beuseful to estimate discharge sites. To utilize the componentfor discharge estimates there is a need for an assessment ofthe degradation rate. While it has been shown that component
www.biogeosciences.net/15/1203/2018/ Biogeosciences, 15, 1203–1216, 201856
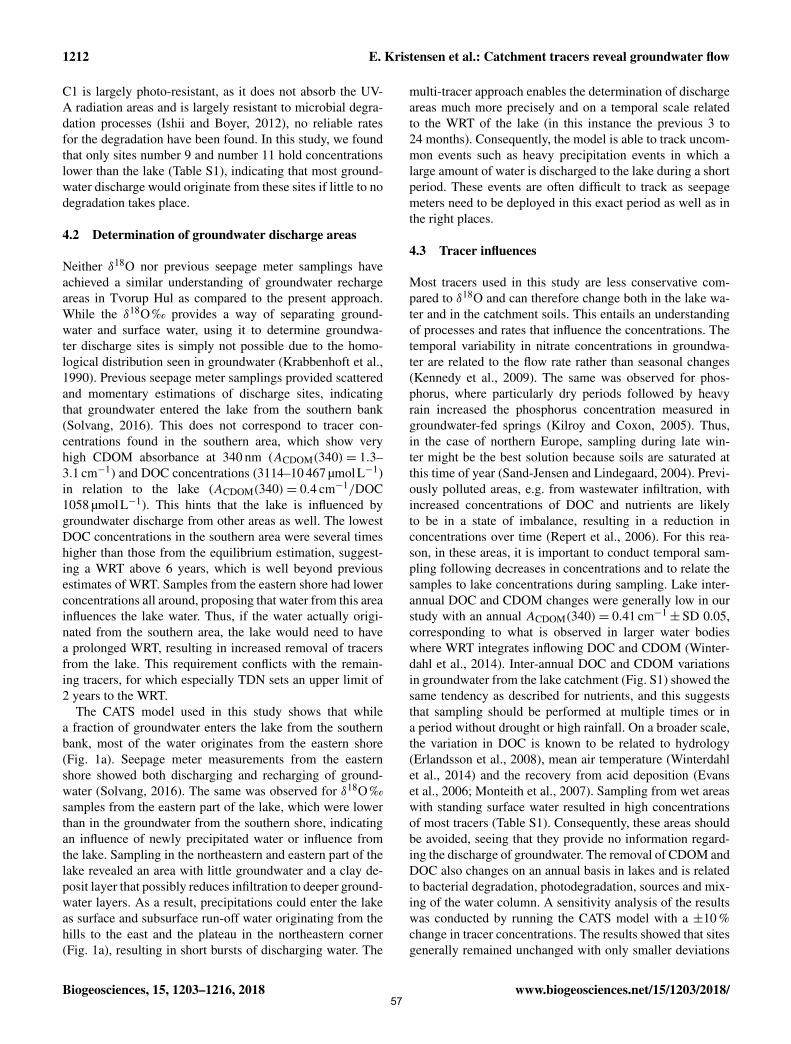
1212 E. Kristensen et al.: Catchment tracers reveal groundwater flow
C1 is largely photo-resistant, as it does not absorb the UV-A radiation areas and is largely resistant to microbial degra-dation processes (Ishii and Boyer, 2012), no reliable ratesfor the degradation have been found. In this study, we foundthat only sites number 9 and number 11 hold concentrationslower than the lake (Table S1), indicating that most ground-water discharge would originate from these sites if little to nodegradation takes place.
4.2 Determination of groundwater discharge areas
Neither δ18O nor previous seepage meter samplings haveachieved a similar understanding of groundwater rechargeareas in Tvorup Hul as compared to the present approach.While the δ18O ‰ provides a way of separating ground-water and surface water, using it to determine groundwa-ter discharge sites is simply not possible due to the homo-logical distribution seen in groundwater (Krabbenhoft et al.,1990). Previous seepage meter samplings provided scatteredand momentary estimations of discharge sites, indicatingthat groundwater entered the lake from the southern bank(Solvang, 2016). This does not correspond to tracer con-centrations found in the southern area, which show veryhigh CDOM absorbance at 340 nm (ACDOM(340)= 1.3–3.1 cm−1) and DOC concentrations (3114–10 467 µmol L−1)in relation to the lake (ACDOM(340)= 0.4 cm−1/DOC1058 µmolL−1). This hints that the lake is influenced bygroundwater discharge from other areas as well. The lowestDOC concentrations in the southern area were several timeshigher than those from the equilibrium estimation, suggest-ing a WRT above 6 years, which is well beyond previousestimates of WRT. Samples from the eastern shore had lowerconcentrations all around, proposing that water from this areainfluences the lake water. Thus, if the water actually origi-nated from the southern area, the lake would need to havea prolonged WRT, resulting in increased removal of tracersfrom the lake. This requirement conflicts with the remain-ing tracers, for which especially TDN sets an upper limit of2 years to the WRT.
The CATS model used in this study shows that whilea fraction of groundwater enters the lake from the southernbank, most of the water originates from the eastern shore(Fig. 1a). Seepage meter measurements from the easternshore showed both discharging and recharging of ground-water (Solvang, 2016). The same was observed for δ18O ‰samples from the eastern part of the lake, which were lowerthan in the groundwater from the southern shore, indicatingan influence of newly precipitated water or influence fromthe lake. Sampling in the northeastern and eastern part of thelake revealed an area with little groundwater and a clay de-posit layer that possibly reduces infiltration to deeper ground-water layers. As a result, precipitations could enter the lakeas surface and subsurface run-off water originating from thehills to the east and the plateau in the northeastern corner(Fig. 1a), resulting in short bursts of discharging water. The
multi-tracer approach enables the determination of dischargeareas much more precisely and on a temporal scale relatedto the WRT of the lake (in this instance the previous 3 to24 months). Consequently, the model is able to track uncom-mon events such as heavy precipitation events in which alarge amount of water is discharged to the lake during a shortperiod. These events are often difficult to track as seepagemeters need to be deployed in this exact period as well as inthe right places.
4.3 Tracer influences
Most tracers used in this study are less conservative com-pared to δ18O and can therefore change both in the lake wa-ter and in the catchment soils. This entails an understandingof processes and rates that influence the concentrations. Thetemporal variability in nitrate concentrations in groundwa-ter are related to the flow rate rather than seasonal changes(Kennedy et al., 2009). The same was observed for phos-phorus, where particularly dry periods followed by heavyrain increased the phosphorus concentration measured ingroundwater-fed springs (Kilroy and Coxon, 2005). Thus,in the case of northern Europe, sampling during late win-ter might be the best solution because soils are saturated atthis time of year (Sand-Jensen and Lindegaard, 2004). Previ-ously polluted areas, e.g. from wastewater infiltration, withincreased concentrations of DOC and nutrients are likelyto be in a state of imbalance, resulting in a reduction inconcentrations over time (Repert et al., 2006). For this rea-son, in these areas, it is important to conduct temporal sam-pling following decreases in concentrations and to relate thesamples to lake concentrations during sampling. Lake inter-annual DOC and CDOM changes were generally low in ourstudy with an annual ACDOM(340)= 0.41 cm−1
±SD 0.05,corresponding to what is observed in larger water bodieswhere WRT integrates inflowing DOC and CDOM (Winter-dahl et al., 2014). Inter-annual DOC and CDOM variationsin groundwater from the lake catchment (Fig. S1) showed thesame tendency as described for nutrients, and this suggeststhat sampling should be performed at multiple times or ina period without drought or high rainfall. On a broader scale,the variation in DOC is known to be related to hydrology(Erlandsson et al., 2008), mean air temperature (Winterdahlet al., 2014) and the recovery from acid deposition (Evanset al., 2006; Monteith et al., 2007). Sampling from wet areaswith standing surface water resulted in high concentrationsof most tracers (Table S1). Consequently, these areas shouldbe avoided, seeing that they provide no information regard-ing the discharge of groundwater. The removal of CDOM andDOC also changes on an annual basis in lakes and is relatedto bacterial degradation, photodegradation, sources and mix-ing of the water column. A sensitivity analysis of the resultswas conducted by running the CATS model with a ±10 %change in tracer concentrations. The results showed that sitesgenerally remained unchanged with only smaller deviations
Biogeosciences, 15, 1203–1216, 2018 www.biogeosciences.net/15/1203/2018/57
E. Kristensen et al.: Catchment tracers reveal groundwater flow 1213
in percent-wise distribution in discharge up to a WRT of1.25 years (Fig. S2). Above this point, there are some dif-ferences in sites, which change between sites number 11and number 13. In conclusion, even when changing multi-ple parameters in the model, the same five groundwater wellsare identified, explaining the measured lake concentrations.Future investigations into variation in tracers in groundwa-ter and degradation rates in lakes will likely strengthen thismodel.
The processes that influence changes in FDOM are still be-ing investigated (Ishii and Boyer, 2012). Tracing FDOM hasbeen conducted in both rivers and open waters (Baker, 2001,2002; Stedmon and Markager, 2005a), but only a few stud-ies have been conducted in groundwater. These studies havefocused on changes in FDOM from deep groundwater wells(Lapworth et al., 2008) or tracing FDOM using samples thatare collected very far apart (Chen et al., 2010). Specific fluo-rescence intensity of components showed large differencesamong sites in this study, up to a factor of 28, betweengroundwater well sites, with the lowest at site 11 and high-est at site 8, around the relatively small lake. These findingsillustrate the problem when applying FDOM as a tracer overlarge distances in groundwater. In addition to bio- and pho-todegradation of fluorescent components, absorption changeshave also been observed in relation to Fe(III) concentrations(Klapper et al., 2002). This might change the concentrationsof FDOM components as they travel from anoxic ground-water with reduced iron into the oxic lake water. Overall,PARAFAC components have the potential to work as ground-water tracers, but there is a need for a better understandingof the processes that cause changes in fluorescence character-istics of DOM and hence concentrations of FDOM compo-nents both in the lake and in the lake–groundwater interface.
4.4 Potential lake management influence
The determination of discharge sites can result in direct man-agement related to specific problematic areas. The modelused in this study showed that water entering the lake pri-marily originated from the catchment to the east of thelake. If water from this part were diverted around the lake,there would be a reduction in CDOM absorbance of 61–89 % based on calculations relating percent-wise discharge,its concentrations and WRTs from 0.25 to 2 years in 0.25-year increments. Conversely, diverting water around the lakeat site number 1 would only result in a lowered inflowingCDOM absorbance of 11–39 %. Moreover, in both cases,there would be an increase in photobleaching of presentCDOM in the lake caused by the increased WRT. Further-more, huge reductions would occur for TP and TN, with a de-crease of 82–96 % if diverting water from the eastern shore,in contrast to the southern shore with a modelled decrease of4–18 % in TP and TN. In the future, hydrology is likely tobe the main driver of variability in DOM (Erlandsson et al.,2008) with an estimated increase in CDOM by a factor of 4
in lakes with short WRT (Weyhenmeyer et al., 2016). Thismakes it critical to establish a modelling tool that is capableof pinpointing sites delivering pollutants to lakes and provideus with the ability to take action and reduce the impact on theecological state of lakes.
5 Conclusions
The present method and modelling tool can improve esti-mates of recharge and discharge areas as well as WRT insmaller lakes on a temporal scale. The model provides ac-curate estimates of discharge fractions, related to field mea-surements, and can be used for precise management of prob-lematic pollution areas. The hierarchical clustering can beused to estimate groundwater recharge sites, which can beincorporated as a guideline for a better estimation of WRTin lakes. Furthermore, the use of multiple tracers strengthensthe model and keeps a certain degree of freedom in regard tothe choice of tracers related to laboratory capabilities.
Data availability. The underlying data can be accessed in the Sup-plement (Table S1).
The Supplement related to this article is available onlineat https://doi.org/10.5194/bg-15-1203-2018-supplement.
Competing interests. The authors declare that they have no conflictof interest.
Acknowledgements. We are grateful to Naturstyrelsen (the Depart-ment for Nature and Conservation) for access to the study areain Nationalpark Thy. The study was partly supported by a grantto the Centre for Lake Restoration, a Villum Kann RasmussenCentre of Excellence. Peter Engesgaard and Ingeborg Solvang areacknowledged for their comments on the paper and for supplyingdata on oxygen isotopes.
Edited by: Florian WittmannReviewed by: two anonymous referees
References
Appelo, C. A. and Postma, D.: Geochemistry, Groundwater and Pol-lution, Balkema, 2005.
Bahram, M., Bro, R., Stedmon, C., and Afkhami, A.: Handling ofRayleigh and Raman scatter for PARAFAC modeling of fluo-rescence data using interpolation, J. Chemometr., 20, 99–105,https://doi.org/10.1002/cem.978, 2006.
www.biogeosciences.net/15/1203/2018/ Biogeosciences, 15, 1203–1216, 201858
1214 E. Kristensen et al.: Catchment tracers reveal groundwater flow
Baker, A.: Fluorescence excitation - Emission matrix characteriza-tion of some sewage-impacted rivers, Environ. Sci. Technol., 35,948–953, https://doi.org/10.1021/es000177t, 2001.
Baker, A.: Spectrophotometric discrimination of river dis-solved organic matter, Hydrol. Process., 16, 3203–3213,https://doi.org/10.1002/hyp.1097, 2002.
Chen, M., Price, R. M., Yamashita, Y., and Jaffé, R.: Com-parative study of dissolved organic matter from ground-water and surface water in the Florida coastal Ever-glades using multi-dimensional spectrofluorometry combinedwith multivariate statistics, Appl. Geochem., 25, 872–880,https://doi.org/10.1016/j.apgeochem.2010.03.005, 2010.
Cherkauer, D. S. and Nader, D. C.: Distribution of ground-water seepage to large surface-water bodies: the effectof hydraulic heterogeneities, J. Hydrol., 109, 151–165,https://doi.org/10.1016/0022-1694(89)90012-7, 1989.
Chow-Fraser, P., Lougheed, V., Le Thiec, V., Crosbie, B.,Simser, L., and Lord, J.: Long-term response of the bioticcommunity to fluctuating water levels and changes in wa-ter quality in Cootes Paradise Marsh, a degraded coastalwetland of Lake Ontario, Wetl. Ecol. Manag., 6, 19–42,https://doi.org/10.1023/A:1008491520668, 1998.
Coble, P. G.: Characterization of marine and terrestrial DOMin seawater using excitation-emission matrix spectroscopy,Mar. Chem., 51, 325–346, https://doi.org/10.1016/0304-4203(95)00062-3, 1996.
Determann, S., Lobbes, J. M., Reuter, R., and Rullkötter, J.:Ultraviolet fluorescence excitation and emission spectroscopyof marine algae and bacteria, Mar. Chem., 62, 137–156,https://doi.org/10.1016/S0304-4203(98)00026-7, 1998.
Diffey, B. L.: Sources and measurement of ultraviolet ra-diation, Methods, 28, 4–13, https://doi.org/10.1016/S1046-2023(02)00204-9, 2002.
DMI: UV-dose: DMI, available at: http://www.dmi.dk/vejr/sundhedsvejr/uv-indeks/uv-dose/ (last access: 12 May 2016),2015.
Ekström, S. M., Kritzberg, E. S., Kleja, D. B., Larsson, N.,Nilsson, P. A., Graneli, W., and Bergkvist, B.: Effect ofacid deposition on quantity and quality of dissolved organicmatter in soil water, Environ. Sci. Technol., 45, 4733–4739,https://doi.org/10.1021/es104126f, 2011.
Erlandsson, M., Buffam, I., Fölster, J., Laudon, H., Temnerud, J.,Weyhenmeyer, G. A., and Bishop, K.: Thirty-five years ofsynchrony in the organic matter concentrations of Swedishrivers explained by variation in flow and sulphate, Glob.Change Biol., 14, 1191–1198, https://doi.org/10.1111/j.1365-2486.2008.01551.x, 2008.
Evans, C. D., Chapman, P. J., Clark, J. M., Monteith, D. T., andCresser, M. S.: Alternative explanations for rising dissolved or-ganic carbon export from organic soils, Glob. Change Biol., 12,2044–2053, https://doi.org/10.1111/j.1365-2486.2006.01241.x,2006.
Fellman, J. B., Miller, M. P., Cory, R. M., D’Amore, D. V.,and White, D.: Characterizing dissolved organic matter usingPARAFAC modeling of fluorescence spectroscopy: a compar-ison of two models, Environ. Sci. Technol., 43, 6228–6234,https://doi.org/10.1021/es900143g, 2009.
Gibson, J. J., Prepas, E. E., and McEachern, P.: Quantita-tive comparison of lake throughflow, residency, and catch-
ment runoff using stable isotopes: modelling and results froma regional survey of Boreal lakes, J. Hydrol., 262, 128–144,https://doi.org/10.1016/S0022-1694(02)00022-7, 2002.
Harrison, J. A., Maranger, R. J., Alexander, R. B., Giblin, A. E.,Jacinthe, P. A., Mayorga, E., Seitzinger, S. P., Sobota, D. J., andWollheim, W. M.: The regional and global significance of nitro-gen removal in lakes and reservoirs, Biogeochemistry, 93, 143–157, https://doi.org/10.1007/s10533-008-9272-x, 2009.
He, X. S., Xi, B. D., Gao, R. T., Wang, L., Ma, Y., Cui, D. Y.,and Tan, W. B.: Using fluorescence spectroscopy coupledwith chemometric analysis to investigate the origin, compo-sition, and dynamics of dissolved organic matter in leachate-polluted groundwater, Environ. Sci. Pollut. R., 22, 8499–8506,https://doi.org/10.1007/s11356-014-4029-7, 2014.
Ishii, S. K. L. and Boyer, T. H.: Behavior of reoccurring parafaccomponents in fluorescent dissolved organic matter in naturaland engineered systems: a critical review, Environ. Sci. Technol.,46, 2006–2017, https://doi.org/10.1021/es2043504, 2012.
Jensen, J. P., Lauridsen, T. L., Søndergaard, M., Jeppesen, E.,Agerbo, E., and Sortkjær, L.: Ferske Vandområder – Søer, Vand-miljøplanens overvågningsprogram 1995, 96, 1995.
Kennedy, C. D., Genereux, D. P., Corbett, D. R., and Mi-tasova, H.: Spatial and temporal dynamics of coupledgroundwater and nitrogen fluxes through a streambed inan agricultural watershed, Water Resour. Res., 45, W09401,https://doi.org/10.1029/2008WR007397, 2009.
Kidmose, J., Engesgaard, P., Nilsson, B., Laier, T., andLooms, M. C.: Spatial distribution of seepage at a flow-throughlake: Lake Hampen, Western Denmark, Vadose Zone J., 10, 110–124, https://doi.org/10.2136/vzj2010.0017, 2011.
Kilroy, G. and Coxon, C.: Temporal variability of phosphorusfractions in Irish karst springs, Environ. Geol., 47, 421–430,https://doi.org/10.1007/s00254-004-1171-4, 2005.
Kishel, H. F. and Gerla, P. J.: Characteristics of preferential flow andgroundwater discharge to Shingobee Lake, Minnesota, USA, Hy-drol. Process., 16, 1921–1934, https://doi.org/10.1002/hyp.363,2002.
Klapper, L., McKnight, D. M., Fulton, J. R., Blunt-Harris, E. L.,Nevin, K. P., Lovley, D. R., and Hatcher, P. G.: Ful-vic acid oxidation state detection using fluorescencespectroscopy, Environ. Sci. Technol., 36, 3170–3175,https://doi.org/10.1021/es0109702, 2002.
Kothawala, D. N., Murphy, K. R., Stedmon, C. A., Weyhen-meyer, G. A., and Tranvik, L. J.: Inner filter correction of dis-solved organic matter fluorescence, Limnol. Oceanogr.-Meth.,11, 616–630, https://doi.org/10.4319/lom.2013.11.616, 2013.
Krabbenhoft, D. P., Bowser, C. J., Anderson, M. P., and Val-ley, J. W.: Estimating groundwater exchange with lakes: 1. Thestable isotope mass balance method, Water Resour. Res., 26,2445–2453, https://doi.org/10.1029/WR026i010p02445, 1990.
Kragh, T. and Søndergaard, M.: Production and bioavailabil-ity of autochthonous dissolved organic carbon: effectsof mesozooplankton, Aquat. Microb. Ecol., 36, 61–72,https://doi.org/10.3354/ame036061, 2004.
Lakowicz, J. R.: Principles of Fluorescence Spectroscopy, editedby: Lakowicz, J. R., Springer US, Boston, MA, 2006.
Laliberté, E., Legendre, P., and Shipley, B.: Measuring func-tional diversity from multiple traits, and other tools for func-tional ecology, available at: http://citeseerx.ist.psu.edu/viewdoc/
Biogeosciences, 15, 1203–1216, 2018 www.biogeosciences.net/15/1203/2018/59
E. Kristensen et al.: Catchment tracers reveal groundwater flow 1215
download?doi=10.1.1.494.7392&rep=rep1&type=pdf (last ac-cess: 6 April 2017), 2014.
Lapworth, D. J., Gooddy, D. C., Butcher, A. S., and Mor-ris, B. L.: Tracing groundwater flow and sources of organic car-bon in sandstone aquifers using fluorescence properties of dis-solved organic matter (DOM), Appl. Geochem., 23, 3384–3390,https://doi.org/10.1016/j.apgeochem.2008.07.011, 2008.
Larsen, D. P. and Mercier, H. T.: Phosphorus retention ca-pacity of lakes, J. Fish. Res. Board Can., 33, 1742–1750,https://doi.org/10.1139/f76-221, 1976.
Lawaetz, A. J. and Stedmon, C. A.: Fluorescence intensity calibra-tion using the Raman scatter peak of water, Appl. Spectrosc., 63,936–940, https://doi.org/10.1366/000370209788964548, 2009.
Lee, D. R. and Cherry, J. A.: A field exercise on groundwater flowusing seepage meters and mini-piezometers, J. Geol. Educ., 27,6–10, https://doi.org/10.5408/0022-1368-27.1.6, 1979.
Lewandowski, J., Meinikmann, K., Nützmann, G., and Rosen-berry, D. O.: Groundwater – the disregarded componentin lake water and nutrient budgets. Part 2: Effects ofgroundwater on nutrients, Hydrol. Process., 29, 2922–2955,https://doi.org/10.1002/hyp.10384, 2015.
Madsen-Østerbye, M., Kragh, T., Pedersen, O., and Sand-Jensen, K.: Coupled photochemical and microbial decompositionof dissolved organic carbon in humic Lake Tvorup and ground-water inflows, Ecol. Eng., under review, 2018.
Massicotte, P. and Frenette, J. J.: Spatial connectivity in a largeriver system: resolving the sources and fate of dissolved organicmatter, Ecol. Appl., 21, 2600–2617, https://doi.org/10.1890/10-1475.1, 2011.
Meinikmann, K., Lewandowski, J., and Nützmann, G.: La-custrine groundwater discharge: combined determination ofvolumes and spatial patterns, J. Hydrol., 502, 202–211,https://doi.org/10.1016/j.jhydrol.2013.08.021, 2013.
Monteith, D. T., Stoddard, J. L., Evans, C. D., de Wit, H. A.,Forsius, M., Høgåsen, T., Wilander, A., Skjelkvåle, B. L.,Jeffries, D. S., Vuorenmaa, J., Keller, B., Kopácek, J., andVesely, J.: Dissolved organic carbon trends resulting fromchanges in atmospheric deposition chemistry, Nature, 450, 537–540, https://doi.org/10.1038/nature06316, 2007.
Murphy, K. R., Ruiz, G. M., Dunsmuir, W. T. M., and Waite, T. D.:Optimized parameters for fluorescence-based verification of bal-last water exchange by ships, Environ. Sci. Technol., 40, 2357–2362, https://doi.org/10.1021/es0519381, 2006.
Murphy, K. R., Stedmon, C. A., Waite, T. D., and Ruiz, G. M.:Distinguishing between terrestrial and autochthonousorganic matter sources in marine environments usingfluorescence spectroscopy, Mar. Chem., 108, 40–58,https://doi.org/10.1016/j.marchem.2007.10.003, 2008.
Murphy, K. R., Stedmon, C. A., Graeber, D., and Bro, R.: Fluores-cence spectroscopy and multi-way techniques, PARAFAC, Anal.Methods-UK, 5, 6557, https://doi.org/10.1039/c3ay41160e,2013.
R Core team: R: A Language and Environment for Statistical Com-puting, R Found. Stat. Comput., Vienna, Austria, available at:https://www.r-project.org/ (last access: 2 December 2017), 2017.
Rebsdorf, A.: Miljøprojekter 38; Forsuringstruede danske søer– Rapport over undersøgelser af den kemiske status i nogleforsuringstruede danske Lobeliasøer i relation til sur nedbør,Miljøstyrelsen, 1981.
Repert, D. A., Barber, L. B., Hess, K. M., Keefe, S. H., Kent, D. B.,Leblanc, D. R., and Smith, R. L.: Long-term natural attenua-tion of carbon and nitrogen within a groundwater plume afterremoval of the treated wastewater source, Environ. Sci. Technol.,40, 1154–1162, https://doi.org/10.1021/es051442j, 2006.
Rosenberry, D. O.: Integrating seepage heterogeneity with the useof ganged seepage meters, Limnol. Oceanogr.-Meth., 3, 131–142, https://doi.org/10.4319/lom.2005.3.131, 2005.
Rosenberry, D. O., Lewandowski, J., Meinikmann, K., andNützmann, G.: Groundwater – the disregarded componentin lake water and nutrient budgets. Part 1: Effects ofgroundwater on hydrology, Hydrol. Process., 29, 2895–2921,https://doi.org/10.1002/hyp.10403, 2015.
Sand-Jensen, K. and Lindegaard, C.: Ferksvandsbiologi, Gyldendal,2004.
Shipley, B.: From Plant Traits to Vegetation Struc-ture: Chance and Selection in the Assembly of Eco-logical Communities, Cambridge University Press,https://doi.org/10.1017/CBO9780511806971, 2009.
Shipley, B., Vile, D., and Garnier, E.: From plant traits to plant com-munities: a statistical mechanistic approach to biodiversity, Sci-ence, 314, 812–814, https://doi.org/10.1126/science.1131344,2006.
Shipley, B., Laughlin, D. C., Sonnier, G., and Otfinowski, R.:A strong test of a maximum entropy model of trait-based community assembly, Ecology, 92, 507–517,https://doi.org/10.1890/10-0394.1, 2011.
Smith, V.: Eutrophication of freshwater and coastal marine ecosys-tems a global problem, Environ. Sci. Pollut. R., 10, 126–139,https://doi.org/10.1065/espr2002.12.142, 2003.
Solvang, I. S.: Groundwater and Surface Water Interaction in ThyNational Park, Master thesis, University of Copenhagen, 2016.
Stedmon, C. A. and Bro, R.: Characterizing dissolved organic mat-ter fluorescence with parallel factor analysis: a tutorial, Limnol.Oceanogr., 6, 572–579, https://doi.org/10.4319/lom.2008.6.572,2008.
Stedmon, C. A. and Markager, S.: Resolving the variability of dis-solved organic matter fluorescence in a temperate estuary andits catchment using PARAFAC analysis, Limnol. Oceanogr., 50,686–697, https://doi.org/10.4319/lo.2005.50.2.0686, 2005a.
Stedmon, C. A. and Markager, S.: Tracing the production and degra-dation of autochthonous fractions of dissolved organic matterusing fluorescence analysis, Limnol. Oceanogr., 50, 1415–1426,https://doi.org/10.4319/lo.2005.50.5.1415, 2005b.
Stedmon, C. A., Markager, S., and Bro, R.: Tracing dissolvedorganic matter in aquatic environments using a new ap-proach to fluorescence spectroscopy, Mar. Chem., 82, 239–254,https://doi.org/10.1016/S0304-4203(03)00072-0, 2003.
Stedmon, C. A., Markager, S., Tranvik, L., Kronberg, L.,Slätis, T., and Martinsen, W.: Photochemical produc-tion of ammonium and transformation of dissolved or-ganic matter in the Baltic Sea, Mar. Chem., 104, 227–240,https://doi.org/10.1016/j.marchem.2006.11.005, 2007.
Stets, E. G., Winter, T. C., Rosenberry, D. O., and Striegl, R. G.:Quantification of surface water and groundwater flows to open-and closed-basin lakes in a headwaters watershed using a de-scriptive oxygen stable isotope model, Water Resour. Res., 46,W03515, https://doi.org/10.1029/2009WR007793, 2010.
www.biogeosciences.net/15/1203/2018/ Biogeosciences, 15, 1203–1216, 201860
1216 E. Kristensen et al.: Catchment tracers reveal groundwater flow
Turner, J. V., Arad, A., and Johnston, C. D.: Environmental isotopehydrology of salinized experimental catchments, J. Hydrol., 94,89–107, https://doi.org/10.1016/0022-1694(87)90034-5, 1987.
Vollenweider, R. A.: Input-output models, Schweiz. Z. Hydrol., 37,53–84, https://doi.org/10.1007/BF02505178, 1975.
Walker, S. A., Amon, R. M. W., Stedmon, C., Duan, S., and Lou-chouarn, P.: The use of PARAFAC modeling to trace terrestrialdissolved organic matter and fingerprint water masses in coastalCanadian Arctic surface waters, J. Geophys. Res.-Biogeo., 114,G00F06, https://doi.org/10.1029/2009JG000990, 2009.
Weyhenmeyer, G. A., Müller, R. A., Norman, M., and Tran-vik, L. J.: Sensitivity of freshwaters to browning in responseto future climate change, Climatic Change, 134, 225–239,https://doi.org/10.1007/s10584-015-1514-z, 2016.
Winterdahl, M., Erlandsson, M., Futter, M. N., Weyhen-meyer, G. A., and Bishop, K.: Intra-annual variability of or-ganic carbon concentrations in running waters: drivers alonga climatic gradient, Global Biogeochem. Cy., 28, 451–464,https://doi.org/10.1002/2013GB004770, 2014.
Zepp, R. G., Sheldon, W. M., and Moran, M. A.: Dissolved or-ganic fluorophores in southeastern US coastal waters: correc-tion method for eliminating Rayleigh and Raman scatteringpeaks in excitation-emission matrices, Mar. Chem., 89, 15–36,https://doi.org/10.1016/j.marchem.2004.02.006, 2004.
Biogeosciences, 15, 1203–1216, 2018 www.biogeosciences.net/15/1203/2018/61
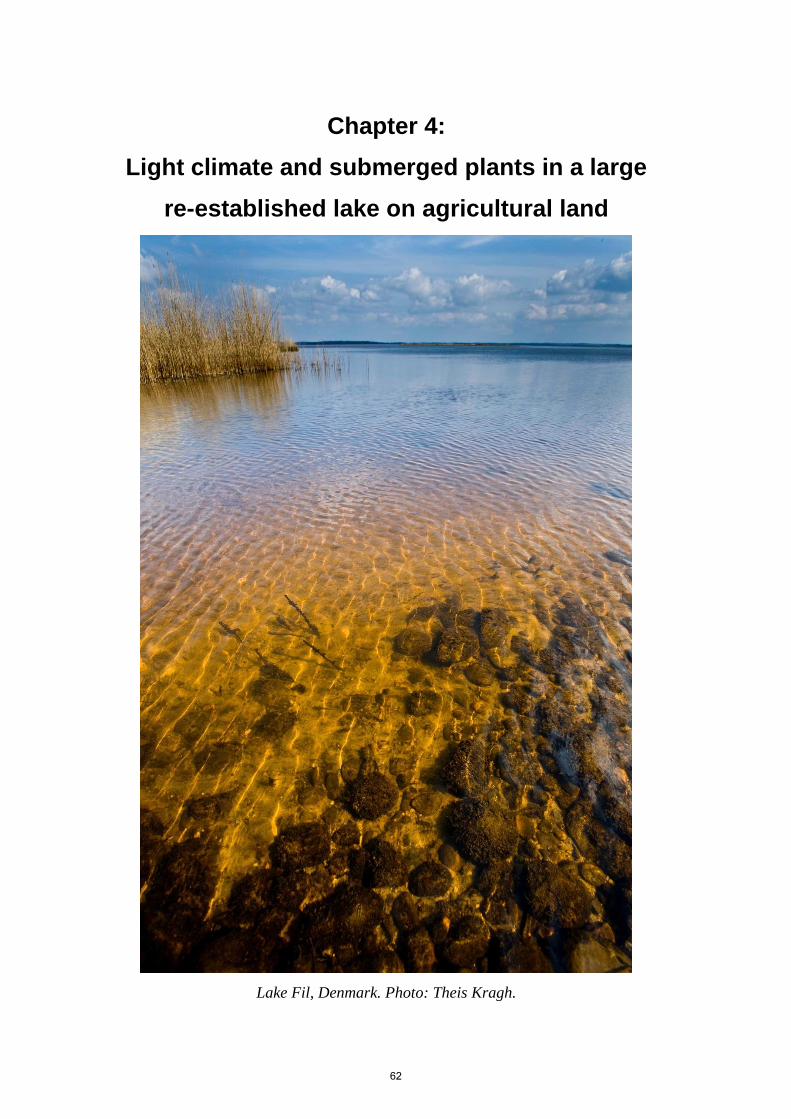
Chapter 4:
Light climate and submerged plants in a large
re-established lake on agricultural land
Lake Fil, Denmark. Photo: Theis Kragh.
62
Light climate and submerged plants in a large re-established lake on
agricultural land
Mikkel Madsen-Østerbye, Theis Kragh, Emil Kristensen and Kaj Sand-Jensen.
Freshwater Biological Laboratory, Department of Biology, University of Copenhagen,
Universitetsparken 4, 3rd floor, 2100 Copenhagen, Denmark.
Keywords: Lake re-establishment, Ecosystem restoration, Sediment resuspension, Light attenuation
parameters
Submitted to Aquatic Sciences
Abstract
Lake establishment on former agricultural fields is usually associated with high nutrient loading, high
phytoplankton biomass and limited colonisation of submerged macrophytes. In contrast, Lake Fil in
Denmark attained a remarkably high species richness immediately after establishment. Our objectives were
to examine the light climate and its regulation in Lake Fil and to evaluate whether transparent water could
account for the high macrophyte richness. Four years of measurements of light attenuation showed high daily
(0.45 to 35.2 m-1) and seasonal medians (2.7 to 10.2 m-1) with the lowest values in spring. Dissolved
coloured organic matter (CDOM) and suspended sediment particles were responsible for the largest mean
proportions of total light attenuation (30.5% and 64.7%, respectively), while the contribution of
phytoplankton was small (4.8%). CDOM had a particularly high attenuation in the first year following
establishment due to release from flooded soils and grain-stubbles left on the fields. Sediment particles
formed the main attenuation component because of frequent wind-induced resuspension in the shallow wind-
exposed lake. During calm periods, particle attenuation declined, and phytoplankton established higher
biomasses. Well-develop colonisation of macrophytes only reached 0.6 m depth at 2-21% subsurface light.
However, scattered macrophyte populations were established down to 1.2 m during clear water spring
periods and they survived turbid summer periods by extending their shoots into high light at the water
surface. Despite unclear waters and low depth penetration, macrophyte colonisation was successful on open
lake shores caused by physical exposure, water level fluctuation and cattle grazing.
63
Introduction
During the past 200 years, more than half of
Europe’s wetlands have been drained and
reclaimed for agriculture (Moreno-Mateos et al.
2012; Zedler and Kercher 2005). Especially small
shallow lakes and ponds have been lost in the
intensively cultivated European lowland regions
(Sand-Jensen 2001; Williams et al. 2001), but also
many large lakes have been drained and converted
to crop land (Hansen 2014). In Denmark alone,
more than 200 large lakes (> 10 ha) have vanished
by conversion to agricultural fields between 1780
and 1980 (Hansen 2014).
The long-term loss of wetlands, cultural
eutrophication of lakes and decline of biodiversity
have recently stimulated the interest in re-
establishing wetlands and lakes and improving
their ecological quality. These management
initiatives have had different objectives such as
reducing and retaining nutrients in the aquatic
continuum (Strand and Weisner 2013; Zedler and
Kercher 2005), improving aquatic biodiversity
(Mitsch et al. 1998) as well as generating
recreational areas to the public and stimulate their
appreciation of nature quality (Hoffmann and
Baattrup-Pedersen 2007). During the past two
decades, more than 50 larger lakes (>10 ha) have
been re-established in Denmark for these reasons
(Hansen 2014). In this paper, we examine the light
conditions that are essential determinants of
macrophyte colonisation and richness during four
years after re-establishment of Lake Fil, the
largest (970 ha) new lake in Denmark.
In re-established lakes on former agricultural land,
the large phosphorus pools in the former
cultivated soils may have a large impact on the
ecological quality (Pant and Reddy 2003;
Steinman and Ogdahl 2011). Because the organic
and nutrient soil pools usually are much richer
compared to the original lake sediment before
drainage, the new lakes may face high internal
nutrient loading and release of chromophoric
dissolved organic matter (CDOM) to the lake
water. Re-established lakes, mostly shallow, can
also experience a high wind-induced physical
stress on the sediments suspending particles into
the water column and, thereby, release
phosphorus, stimulate phytoplankton growth and
increase vertical light attenuation further
(Søndergaard et al. 2003).
Regulation of water clarity is complex (Kirk
1994). Vertical light penetration is reduced by
CDOM, suspended sediment particles and
phytoplankton pigments (Kirk 1994). Leaching of
CDOM from flooded terrestrial soils and
vegetation can cause strong light attenuation and
thus decrease the light availability for both
phytoplankton and benthic phototrophs (Karlsson
et al. 2009). However, the light-absorbing CDOM
initially released from flooded terrestrial soils may
decrease over time due to gradual reduction of
leaching from organic soil pools and ongoing
photochemical degradation and bacterial
mineralisation of CDOM in the lake water
(Madsen-Østerbye et al. 2018). Re-location of fine
soil particles from exposed shallow waters to
deeper waters with less physical shear may also
reduce the likelihood of particle resuspension over
64
time, depending on lake size and bathymetry
(Kragh et al. 2017). Phytoplankton development
in nutrient-rich lakes is dependent on the
magnitude of the other attenuation components
and phytoplankton may flourish and contribute
substantially to overall light attenuation when
CDOM and particle attenuation is low, while it
may be low when CDOM and particle attenuation
is high.
The submerged vegetation in lakes plays a key
role in ecosystem functioning when it reaches a
high areal cover (Hilt et al. 2017; Sand-Jensen and
Borum 1991). Macrophytes can form a refuge to
zooplankton grazers, reduce release of sediment
nutrients, enhance particle sedimentation and
compete directly with phytoplankton in shallow
waters for nutrients, thereby increasing water
clarity (Scheffer et al. 1993). Moreover, the
development of submerged vegetation is strongly
dependent on the light climate and, thus, on the
combined light attenuation of CDOM, particles
and phytoplankton in the water (Pérez et al. 2010).
These different components interact in such a way
that increased light attenuation results in declining
algae biomass and chlorophyll concentrations
(Pérez et al. 2013). The lower depth limit of
macrophyte growth is often close to the Secchi-
transparency at 8-15% of subsurface light
(Middelboe and Markager 1997). The key to
regulation of submerged macrophyte depth limits
and areal cover is lake bathymetry and water
transparency.
We examined the temporal dynamics of light
attenuation and related it to submerged vegetation
development over four years in the large, shallow
Lake Fil in Denmark following its re-
establishment on agricultural land in the winter of
2012-2013. Already two years after its re-
establishment, the lake has experienced rapid
development of a species-rich submerged
vegetation although high nutrient concentrations
in the water should support phytoplankton blooms
and restrict submerged plant growth (Baastrup-
Spohr et al. 2016). Our general objective was to
quantify the dynamics of CDOM, suspended
particles and phytoplankton, which controls the
light regime in Lake Fil and influences the
establishment of submerged vegetation. The
specific objectives were: 1) to determine the
temporal development of light attenuation over
four years following lake re-establishment, 2) to
determine the main parameters that control the
light attenuation coefficient in the water, and 3) to
examine the relationship between macrophyte
development and light climate.
Materials and Methods
Study site
The study was conducted in Lake Fil, which is
located 3 km behind the sand dunes in South West
Jutland facing the North Sea (55°42′N, 8°14′E).
Previously, Lake Fil was the second largest lake
in Denmark (2185 ha, before 1850), but it was
drained and reduced in size on several occasions
from 1852 and onwards, and finally totally
reclaimed for agriculture in 1952. Until 2012, the
reclaimed lake area was intensively cultivated and
received large amounts of inorganic fertilisers
65
and manure (Hansen 2014). The result was soil
with a high phosphorus content (Kragh et al.
2017).
Re-establishment of Lake Fil
In 2010, the area was purchased by Aage V.
Jensen Nature Foundation to re-establish the lake
and the surrounding meadows and grasslands. The
new Lake Fil was established in 2012 at
approximately one third of its original size (889
ha). The new lake is divided into a southern
(Søndersø) and northern (Mellemsø) basin of
approximately equal size. The catchment area is
104 km2, with the inlet located in the southern
basin and the outlet located in the northern basin.
The two basins are separated by a 7 m wide dam
and interconnected by a 5 m wide canal through
the dam. The lake is shallow (mean depth: 1.03 m;
maximum depth: 3.5 m). Mean nutrient
concentrations from weekly water samples were
102 µg L-1 of total phosphorus (P) and 1741 µg l-1
total nitrogen (N) and chlorophyll α
concentrations were 13.3 µg l-1 (n = 92) (Baastrup-
Spohr et al. 2016).
The lake is highly exposed to wind because of its
large surface area, shallow water and location
close to the windy North Sea resulting in a well-
mixed water column and frequent resuspension of
sediment particles (Kragh et al. 2017). Water
retention time averaged 70 days (range: 20-180
days). Prior to flooding in autumn 2012, grain-
stubbles were left on the fields to stabilise the
sediment and reduce resuspension of particles and
phosphorus release to the water immediately after
flooding.
Field measurements
Field measurements started in summer 2013,
approximately seven months after flooding was
commenced and continued through 2017, and
consequently we have data from four years. A
meteorological station was established on the lake
shores 2 m above the water surface. The station
was equipped with sensors for light (HOBO PAR
sensor (400-700 nm): S-LIA-M003, Onset
Computers), wind speed and wind direction
(HOBO anemometer and S-WSET-A, Onset
Computers). Data was stored on a data logger
(HOBO micro station, H21-002, Onset
Computers). Incident PAR and lux were also
logged separately (Odyssey PAR logger, Dataflow
Systems; HOBO UA-002-64, Onset Computers).
Due to technical problems in 2014, data was
retrieved from a neighbouring meteorological
station located at Skjern Enge 28 km from Lake
Fil. Comparisons of data between the two stations
were made when both stations were in operation
and were used to calibrate data from Skjern Enge
to Lake Fil in 2014.
At four open water sites (two in each basin), light
measuring stations were set up. Each station was
equipped with either two-five lux loggers (HOBO
UA-002-64, Onset Computers), two-three PAR
sensor (Odyssey PAR logger, Dataflow Systems)
or a combination of these two measuring systems
placed 50-100 cm apart from each other from the
lake bottom and up through the water column.
Daily measurements of water levels with 2 mm
precision were recorded by pressure differences
between a submerged water level data logger and
a similar one in air (HOBO U 20-001-04, Onset
66
Computers). The measured water level was
calibrated to current depth of deployment for each
light measuring station. Water level measurements
were used to determine the specific depth of lux
and PAR loggers at each site and specific time.
Calculations of vertical attenuation coefficients
from HOBO and PAR sensors yielded closely
similar results (F-test, p < 0.001). Continuous
light measurements were collected, except in cold
winter months with ice formation. Data was used
to calculate the daily mean vertical light
attenuation coefficient through the water column,
(k, unit m-1) by equation (1) (Kalff 2002).
𝑘 = ln(Iz
Io) / z (1)
Iz is the light at a given depth (z, unit m) and the
incoming light (I0) was adjusted to sub-surface
light assuming a 10% surface reflection (Kirk
1994).
Continuous measurements of phytoplankton
chlorophyll a fluorescence were measured in the
southern basin by a CYCLOPS-7 fluorescence
probe (Turner Design, CA, USA) placed 30 cm
below the water surface. The fluorescence signal
was calibrated against water samples analysed for
chlorophyll a by extraction in ethanol and
measurement on a Shimadzu UV-1800
spectrophotometer according to Jespersen and
Christoffersen (1987). Chlorophyll-specific light
attenuation coefficients were calculated assuming
a mean value of 10 m-1 (g chlorophyll a m-3)
according to Krause-Jensen and Sand-Jensen
(1998).
Vegetation surveys at Lake Fil showed a
remarkable species richness and colonisation
depths of 0.6 m in the summers of 2014 and 2015
(Baastrup-Spohr et al. 2016). Simultaneously with
our field campaign, macrophyte colonisation
zones in both basins were investigated by sonar
side scan according to Baastrup-Spohr et al.
(2016). The presence or absence of macrophytes
was controlled by sampling with a rake at the
specific depths.
Water sampling
Water samples were collected on a weekly basis
from the inlet, outlet and the channel connecting
the southern and northern basin. The channel
water represented the water in the southern basin
and the outlet water the northern basin. Water was
filtered through pre-combusted GF/F filters (0.7
µm) and CDOM absorbance in the filtered water
was scanned across the PAR spectrum (400-700
nm) on a spectrophotometer (UV-1800
Shimadzu). CDOM light attenuation coefficients
(m-1) were calculated according to Kirk (1994).
Gaps between data points were filled by linear
interpolation to estimate the daily CDOM light
attenuation coefficients in the lake. For POC
analysis, GF/F filters of water samples were dried
at 50°C and stored at room temperature until
analysis. Carbon content on filters were analysed
by high-temperature combustion using a system of
a Struers Carbolite Furnace set at 650°C, an ADC-
225-Mk3 NDIR IRGA analyser and a Picotech
ADC-20 data logger. The filters were not exposed
to HCL fumes prior to the analyses due to
insignificant carbonate content.
67
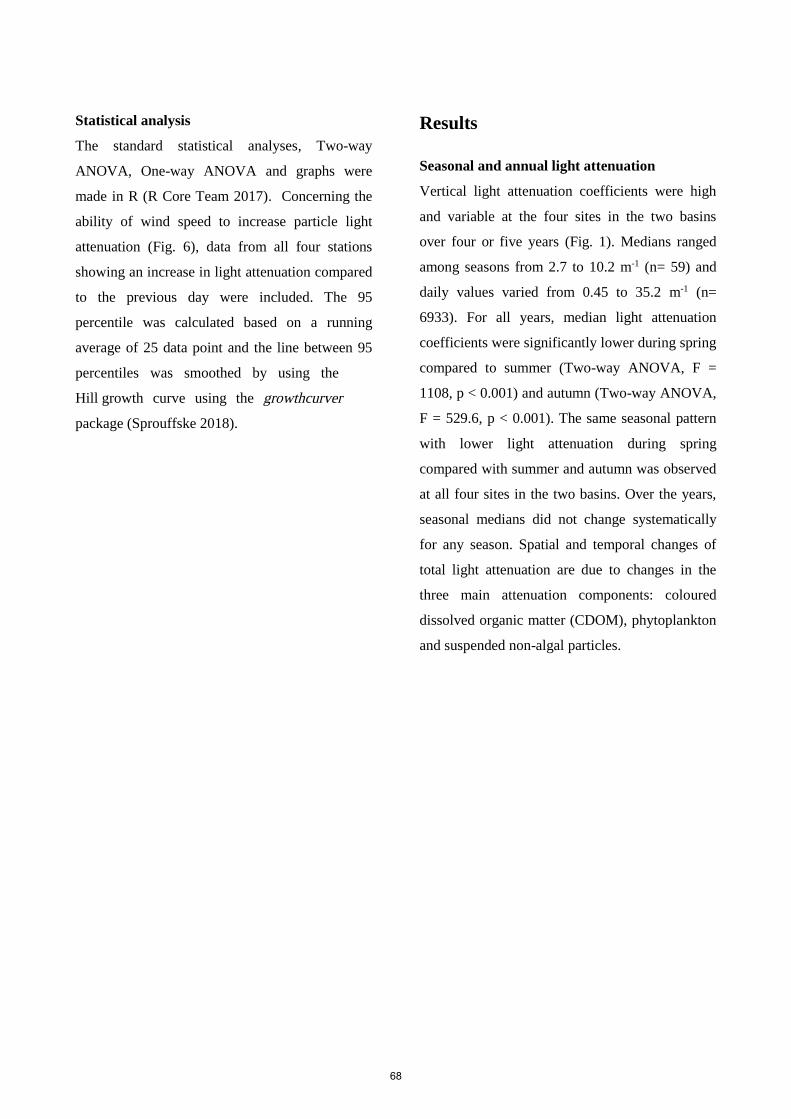
Statistical analysis
The standard statistical analyses, Two-way
ANOVA, One-way ANOVA and graphs were
made in R (R Core Team 2017). Concerning the
ability of wind speed to increase particle light
attenuation (Fig. 6), data from all four stations
showing an increase in light attenuation compared
to the previous day were included. The 95
percentile was calculated based on a running
average of 25 data point and the line between 95
percentiles was smoothed by using the
Hill growth curve using the growthcurver
package (Sprouffske 2018).
Results
Seasonal and annual light attenuation
Vertical light attenuation coefficients were high
and variable at the four sites in the two basins
over four or five years (Fig. 1). Medians ranged
among seasons from 2.7 to 10.2 m-1 (n= 59) and
daily values varied from 0.45 to 35.2 m-1 (n=
6933). For all years, median light attenuation
coefficients were significantly lower during spring
compared to summer (Two-way ANOVA, F =
1108, p < 0.001) and autumn (Two-way ANOVA,
F = 529.6, p < 0.001). The same seasonal pattern
with lower light attenuation during spring
compared with summer and autumn was observed
at all four sites in the two basins. Over the years,
seasonal medians did not change systematically
for any season. Spatial and temporal changes of
total light attenuation are due to changes in the
three main attenuation components: coloured
dissolved organic matter (CDOM), phytoplankton
and suspended non-algal particles.
68
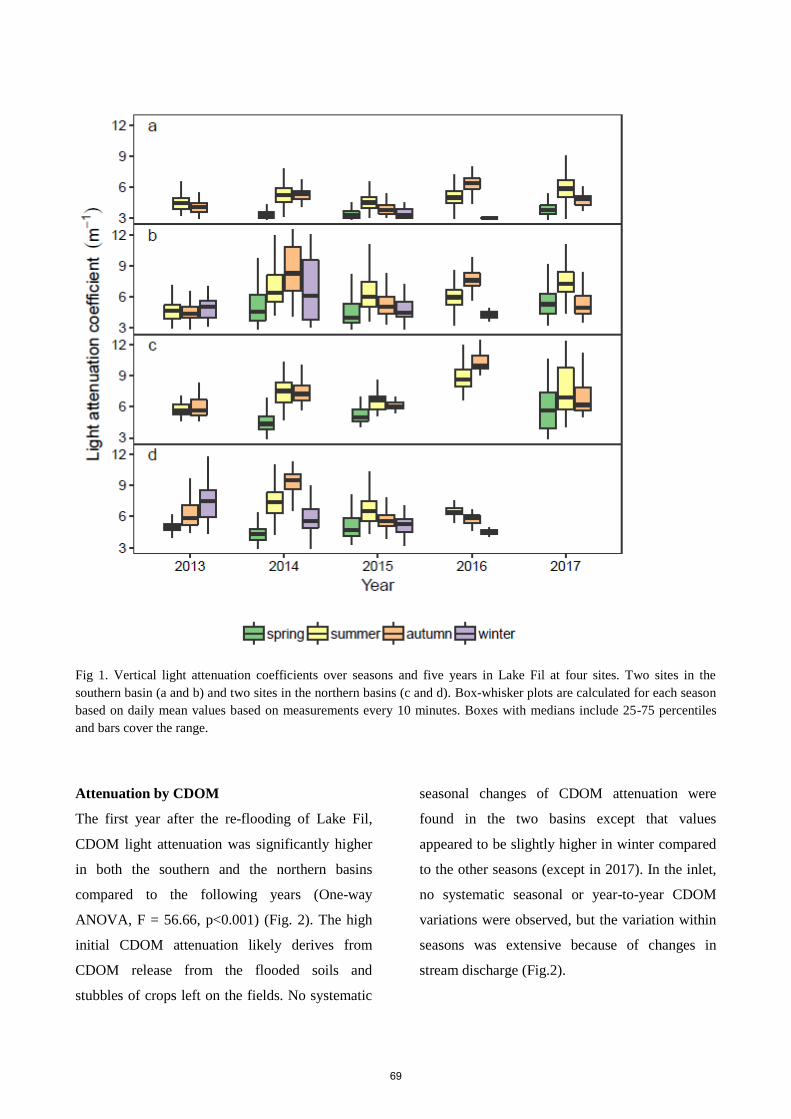
Fig 1. Vertical light attenuation coefficients over seasons and five years in Lake Fil at four sites. Two sites in the
southern basin (a and b) and two sites in the northern basins (c and d). Box-whisker plots are calculated for each season
based on daily mean values based on measurements every 10 minutes. Boxes with medians include 25-75 percentiles
and bars cover the range.
Attenuation by CDOM
The first year after the re-flooding of Lake Fil,
CDOM light attenuation was significantly higher
in both the southern and the northern basins
compared to the following years (One-way
ANOVA, F = 56.66, p<0.001) (Fig. 2). The high
initial CDOM attenuation likely derives from
CDOM release from the flooded soils and
stubbles of crops left on the fields. No systematic
seasonal changes of CDOM attenuation were
found in the two basins except that values
appeared to be slightly higher in winter compared
to the other seasons (except in 2017). In the inlet,
no systematic seasonal or year-to-year CDOM
variations were observed, but the variation within
seasons was extensive because of changes in
stream discharge (Fig.2).
69
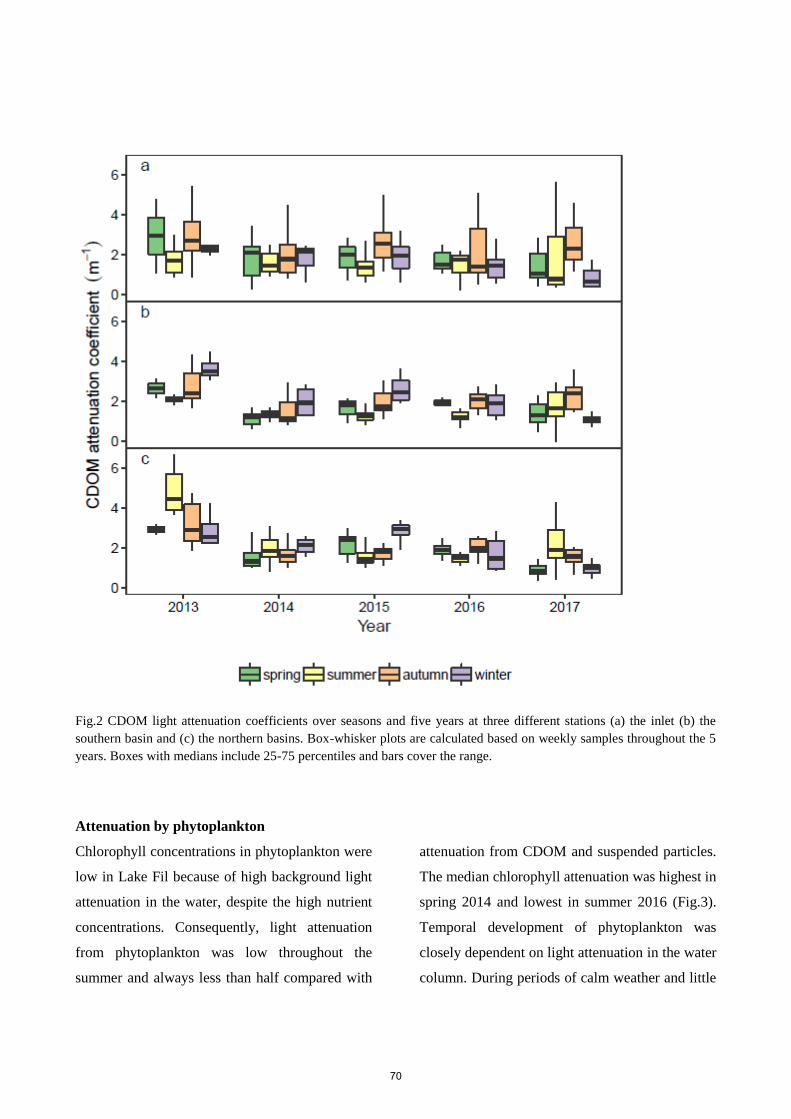
Fig.2 CDOM light attenuation coefficients over seasons and five years at three different stations (a) the inlet (b) the
southern basin and (c) the northern basins. Box-whisker plots are calculated based on weekly samples throughout the 5
years. Boxes with medians include 25-75 percentiles and bars cover the range.
Attenuation by phytoplankton
Chlorophyll concentrations in phytoplankton were
low in Lake Fil because of high background light
attenuation in the water, despite the high nutrient
concentrations. Consequently, light attenuation
from phytoplankton was low throughout the
summer and always less than half compared with
attenuation from CDOM and suspended particles.
The median chlorophyll attenuation was highest in
spring 2014 and lowest in summer 2016 (Fig.3).
Temporal development of phytoplankton was
closely dependent on light attenuation in the water
column. During periods of calm weather and little
70
sediment particle resuspension, the light
attenuation decreased by 1.25-1.5 m-1, thus
increasing the mean available light in the water
column. As a response, the phytoplankton
biomass and, thereby, the chlorophyll attenuation
increased by an average of 0.69 ± 0.29 m-1
(n= 14). Subsequently, the chlorophyll biomass
and chlorophyll light attenuation declined when
windy weather again took over, which caused
sediment resuspension and reduced light
availability in the water column (Fig. 4).
Fig. 3 Chlorophyll attenuation coefficient over seasons and five years in Lake Fil. Box-whisker plots are calculated for
each season based on continuous measurements of chlorophyll fluorescence in the southern basin. Boxes with median
include 25 -75 percentiles and bars cover the range.
71
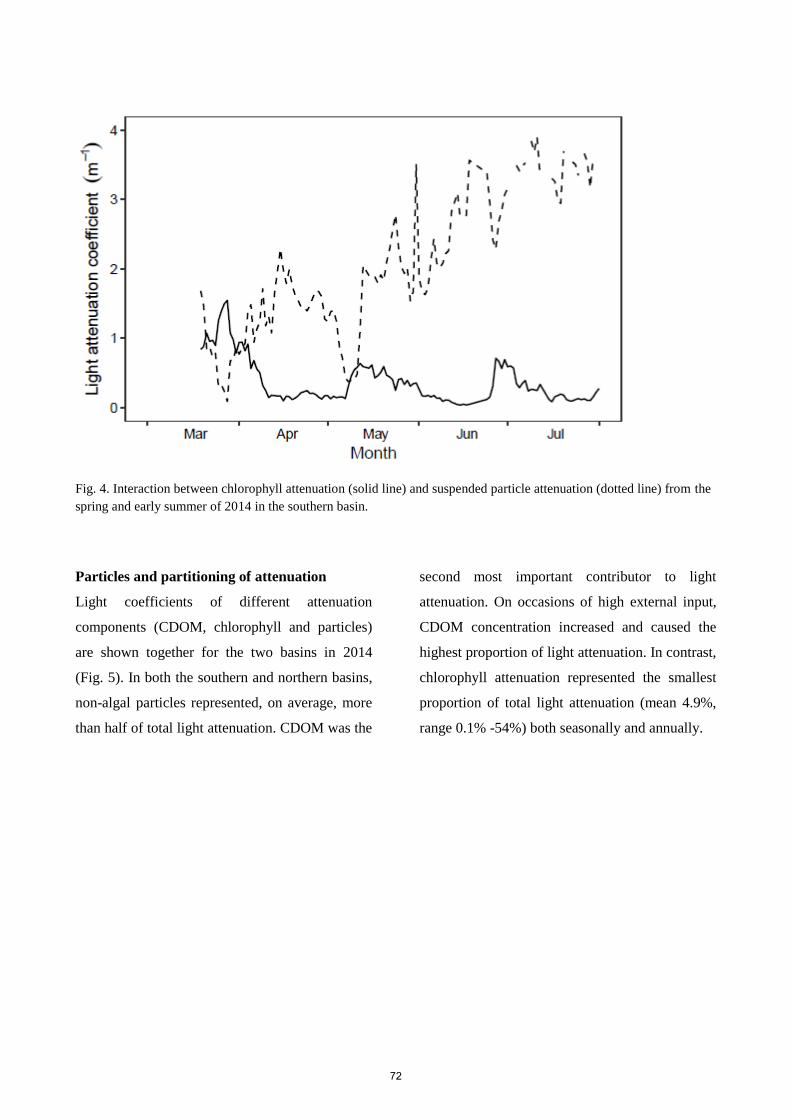
Fig. 4. Interaction between chlorophyll attenuation (solid line) and suspended particle attenuation (dotted line) from the
spring and early summer of 2014 in the southern basin.
Particles and partitioning of attenuation
Light coefficients of different attenuation
components (CDOM, chlorophyll and particles)
are shown together for the two basins in 2014
(Fig. 5). In both the southern and northern basins,
non-algal particles represented, on average, more
than half of total light attenuation. CDOM was the
second most important contributor to light
attenuation. On occasions of high external input,
CDOM concentration increased and caused the
highest proportion of light attenuation. In contrast,
chlorophyll attenuation represented the smallest
proportion of total light attenuation (mean 4.9%,
range 0.1% -54%) both seasonally and annually.
72
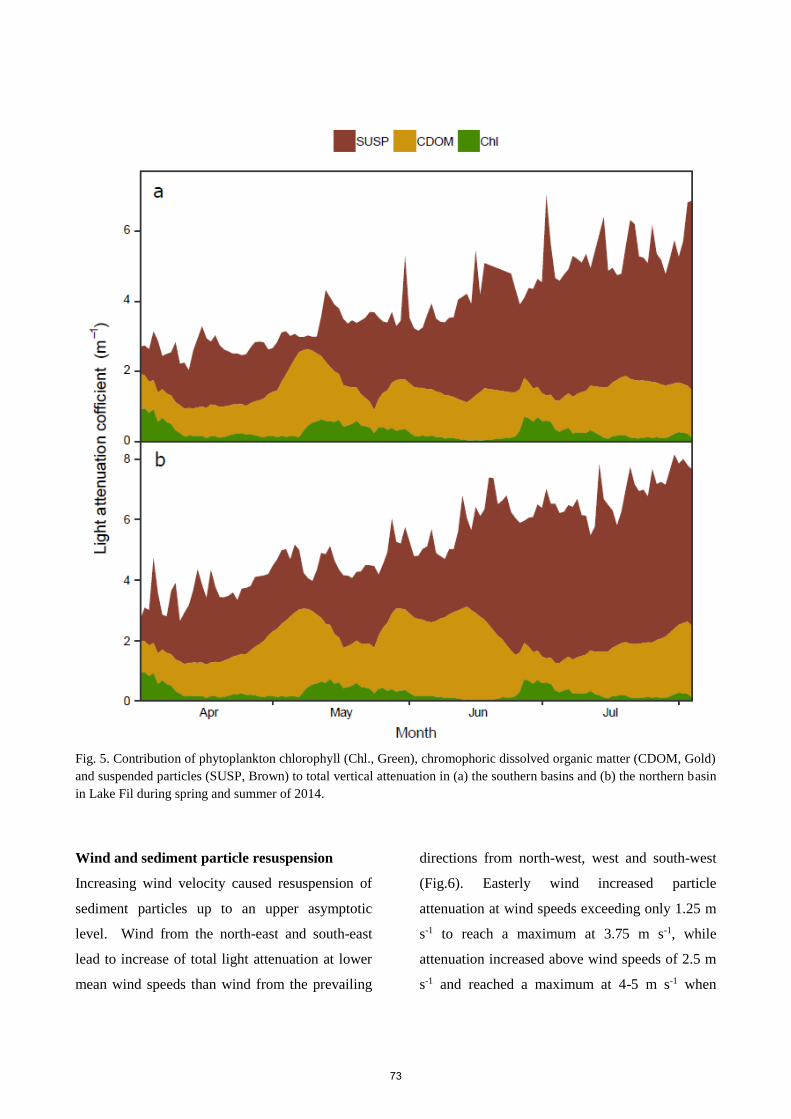
Fig. 5. Contribution of phytoplankton chlorophyll (Chl., Green), chromophoric dissolved organic matter (CDOM, Gold)
and suspended particles (SUSP, Brown) to total vertical attenuation in (a) the southern basins and (b) the northern basin
in Lake Fil during spring and summer of 2014.
Wind and sediment particle resuspension
Increasing wind velocity caused resuspension of
sediment particles up to an upper asymptotic
level. Wind from the north-east and south-east
lead to increase of total light attenuation at lower
mean wind speeds than wind from the prevailing
directions from north-west, west and south-west
(Fig.6). Easterly wind increased particle
attenuation at wind speeds exceeding only 1.25 m
s-1 to reach a maximum at 3.75 m s-1, while
attenuation increased above wind speeds of 2.5 m
s-1 and reached a maximum at 4-5 m s-1 when
73
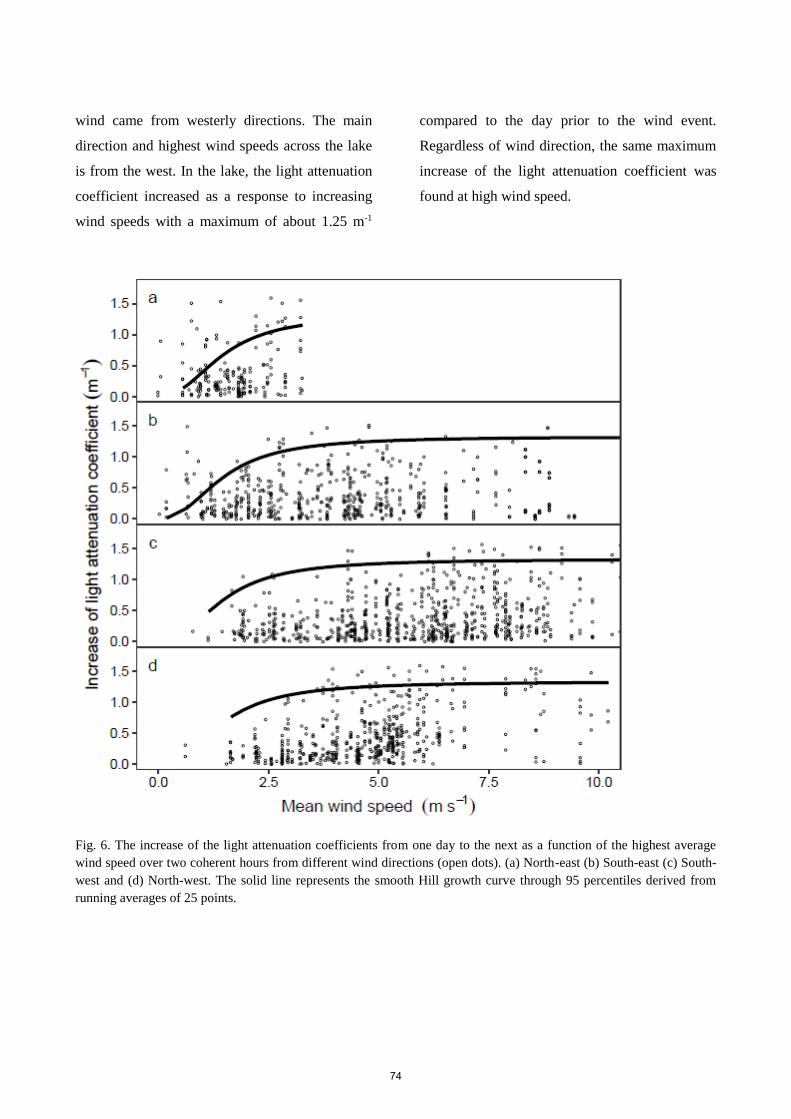
wind came from westerly directions. The main
direction and highest wind speeds across the lake
is from the west. In the lake, the light attenuation
coefficient increased as a response to increasing
wind speeds with a maximum of about 1.25 m-1
compared to the day prior to the wind event.
Regardless of wind direction, the same maximum
increase of the light attenuation coefficient was
found at high wind speed.
Fig. 6. The increase of the light attenuation coefficients from one day to the next as a function of the highest average
wind speed over two coherent hours from different wind directions (open dots). (a) North-east (b) South-east (c) South-
west and (d) North-west. The solid line represents the smooth Hill growth curve through 95 percentiles derived from
running averages of 25 points.
74
Macrophyte depth distribution
The majority of submerged macrophytes
penetrated to only 0.6 m depth in the lake during
low water levels in July. However, during March
to May water levels are 0.06-0.47 m higher and
the macrophyte colonisation depths are then
located at 0.66-1.08 m (Fig. 7). Consequently,
when calculating the irradiance at the lower depth
boundary it is essential to correct for the
variations in lake water level. If uncorrected, we
would grossly overestimate the available
irradiance at the depth boundary in March-May.
For all four years, we calculated median daily
irradiances over monthly periods between March
and September at the depth boundary which
receives between 0.95 and 6.31 mol m-2 d-1 (PAR,
400-700 nm) corresponding to 2.1-20.6% of
subsurface irradiance.
After macrophytes have sprouted and extended
into the water column, they will experience higher
irradiances closer to the water surface. Thus, if
plants manage to sprout at greater water depths
than 0.6 m during short periods of high
irradiances, like in May 2015, they can form
scattered populations at greater depths as observed
for the tall robust Potamogeton praelongus and
Potamogeton natans growing at 1.2 m in 2016
and 2017.
75
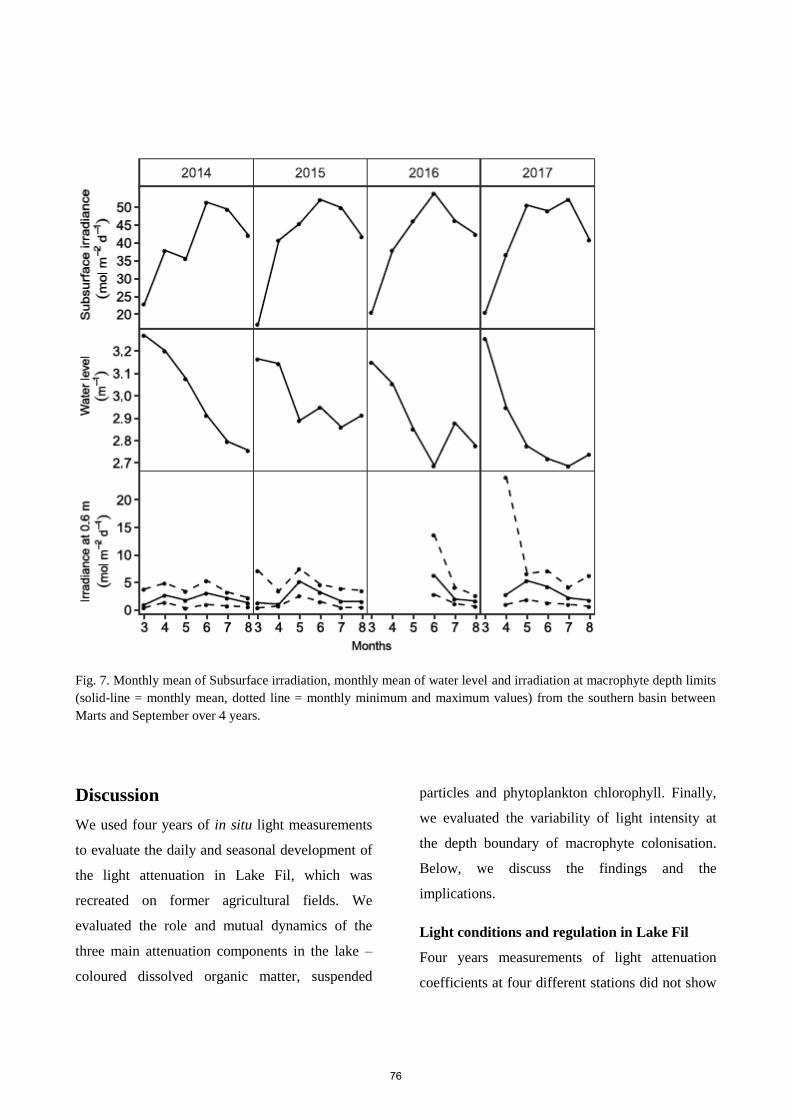
Fig. 7. Monthly mean of Subsurface irradiation, monthly mean of water level and irradiation at macrophyte depth limits
(solid-line = monthly mean, dotted line = monthly minimum and maximum values) from the southern basin between
Marts and September over 4 years.
Discussion
We used four years of in situ light measurements
to evaluate the daily and seasonal development of
the light attenuation in Lake Fil, which was
recreated on former agricultural fields. We
evaluated the role and mutual dynamics of the
three main attenuation components in the lake –
coloured dissolved organic matter, suspended
particles and phytoplankton chlorophyll. Finally,
we evaluated the variability of light intensity at
the depth boundary of macrophyte colonisation.
Below, we discuss the findings and the
implications.
Light conditions and regulation in Lake Fil
Four years measurements of light attenuation
coefficients at four different stations did not show
76
any systematic change of light conditions in Lake
Fil in the comparisons of median values for
different seasons over the years with one
exception. In 2013, the first year after flooding the
fields, CDOM absorbance in both basins was
remarkably higher compared to the following
years. This higher CDOM absorbance was likely a
result of the soil organic carbon and the grain-
stubbles left on the fields leaching humic
compounds to the water after flooding. Already in
the second year after flooding, the CDOM
absorbance was close to that measured in the inlet
water implying that the internal organic sources in
the stubbles and the former soils had markedly
declined and accumulated CDOM had been
flushed from the lake. Previous analysis supports
this finding, which shows rapid decline of organic
matter in surface sediments (0-9 cm) during the
first three years due to frequent sediment
resuspension in the shallow wind-exposed lake
(Kragh et al. 2017). Because of the short water
retention time between 20 and 120 days, CDOM
of terrestrial origin, which was received via the
inlet, becomes of much greater importance
compared to CDOM of internal aquatic origin.
Furthermore, terrestrial CDOM has a much higher
light absorbance and consequently represents a
higher background attenuation (Astoreca et al.
2009).
The grain-stubbles could have been
removed before flooding but were left to aid in
sediment stabilisation during the early phases of
the new lake. Also, the high external CDOM input
would still result in high background attenuation
irrespective of whether stubbles had been
removed before flooding or not. It is even likely
that removal of stubbles would have caused
higher light attenuation by suspended sediment
particles.
Resuspension of sediment material
often induces phytoplankton growth caused by the
release of nutrients (Schallenberg and Burns
2004). However, considering the large pool of
dissolved inorganic phosphate and nitrogen in the
lake due to the high external loading, this is not an
important mechanism for phytoplankton
development in Lake Fil (Kragh et al. 2017).
Phytoplankton biomass did not usually contribute
much to total light attenuation. Phytoplankton
growth is regulated by a fine balance between
light and nutrient availability (Jones et al. 1996).
Although nutrients are available in ample amounts
to support phytoplankton growth, it can be highly
restricted by light limitation when high
concentrations of coloured organic material form
a main background attenuation (Jones et al. 1996;
Karlsson et al. 2009). This is the case in Lake Fil
in which background light attenuation by CDOM
and suspended particles prevented the formation
of phytoplankton blooms. During periods of
reduced CDOM and particle attenuation, higher
phytoplankton biomass contributes to control
further phytoplankton development by self-
shading (Krause-Jensen and Sand-Jensen 1998).
Besides resulting in a release of
nutrients to the water, wind-driven resuspension
of sediment particles changes the light attenuation
(Schallenberg and Burns 2004). This is also the
case in Lake Fil because of its large surface area,
77
shallow depths and location close to the North Sea
(Kragh et al. 2017). Frequent sediment
resuspension in Lake Fil was closely related to
high wind speeds. Regardless of the wind
direction, the same maximal increase of particle-
induced light attenuation occurred. This finding
suggested that the pool of particles subjected to
resuspension was of a certain magnitude.
However, to reach the same particle light
attenuation, wind speeds must be higher from the
prevailing western rather than eastern directions.
Thus, we assume that more particles have
accumulated in the shelter along the western coast
and these particles are more easily resuspended
when the wind on rare occasions shifts from west
to east. Overall, when rapid changes in wind
directions occur, much lower wind speeds are
likely to cause resuspension of recently settled
and un-consolidated sediment particles.
The dynamic light climate in Lake Fil
Regulation of light attenuation in lakes is the
result of a complex interaction between CDOM,
suspended particles and phytoplankton pigments
(Kirk 1994; Van Duin et al. 2001). In Lake Fil,
this complex interaction is evident. Periods of low
wind exposure resulted in sedimentation of
particles. This will enhance the UV-induced
photochemical and microbial degradation of
CDOM (Madsen-Østerbye et al. 2018).
Furthermore, these periods with calm weather are
often associated with low precipitation and,
thereby, reduced input of CDOM via the inlet.
Subsequently, phytoplankton biomass can
increase and substitute for the decline in
background light attenuation until higher total
light attenuation reduces further biomass growth
(Krause-Jensen and Sand-Jensen 1998). This
scenario was supported by the fact that the
increase of attenuation from a growing
phytoplankton biomass did not exceed the decline
in particulate light attenuation. When background
attenuation from particles and CDOM increased
again in windy and wet weather, phytoplankton
biomass decreased because of stronger light
limitation. Thus, Lake Fil is a light-limited system
strongly controlled by background light
attenuation.
Macrophyte distribution in Lake Fil
Previous studies have estimated colonisation
depths of caulescent angiosperms to 4-10% of
subsurface irradiance (Middelboe and Markager
1997). In Lake Fil, mean irradiance was 2 -21% in
spring and summer months at the main
colonisation depth at 0.6 m. In 2016 and 2017,
scattered macrophyte colonisation to 1.2 m depth
had occurred, which suggested that periods with
lower light attenuation had been present in certain
areas of the lake. Rooney and Kalff (2000)
showed that biomass distribution was affected by
inter-annual changes between growing seasons.
Good light conditions early in the year resulted in
increasing macrophyte colonisation depths. If
macrophyte species can manage to sprout and
grow to a certain size in a period of higher light
early in the season, they can reach a better light
climate closer to the lake surface and survive
despite high background attenuation. By building
organic carbon reserves in rhizomes or bulbils in
sediments, they may even be able to exploit these
78
reserves to sprout and form elongated shoots next
spring despite insufficient light at the depth limit.
Increase of macrophyte cover may
play an important role for lake ecosystem
functioning (Hilt et al. 2017; Madsen et al. 2001;
Sand-Jensen and Borum 1991). Macrophyte cover
can reduce resuspension of particles and create
refuge for zooplankton controlling the
phytoplankton biomass and, thereby, reduce light
attenuation and increase macrophyte cover further
(Lauridsen and Lodge 1996; Madsen et al. 2001).
However, in a shallow and highly wind exposed
lake such as Lake Fil, the mechanical stress on the
surface sediment combined with the relatively
high and steady background attenuation from
CDOM via the inlet water and in-lake particle
resuspension can restrict further macrophyte
colonisation in the lake. Moreover, if CDOM and
particle attenuation decline, phytoplankton light
attenuation will increase in the nutrient-rich water.
Consequently, we suggest that the macrophytes
will have difficulty extending the main
colonisation depth much deeper than the present
0.6 m in the future. Nonetheless, the re-
established Lake Fil supports one of the highest
species richness of aquatic plants in the country
due to extensive and variable shallow zones kept
open by cattle grazing (Baastrup-Spohr et al.
2016).
Acknowledgement
We thank the Aage V. Jensen Nature Foundation
for grants to KSJ and TK to fund the study and
provide housing during field campaigns. We
thank the Villum Foundation for grants to KSJ via
the Center of Excellence for Lake Restoration
(CLEAR). We also thank the Center for
Hydrology, (HOBE, www.hobe.dk) for
supplementary weather data from nearby Skjern
Enge. Kenneth Martinsen helped with statistical
analysis and valuable support on calculations in R
studio. Sara Schousboe is thanked for correction
of the language.
Reference Astoreca R, Rousseau V, Lancelot C (2009)
Coloured dissolved organic matter
(CDOM) in Southern North Sea waters:
Optical characterization and possible
origin. Estuarine, Coastal and Shelf
Science 85:633-640
Baastrup-Spohr L, Kragh T, Petersen K,
Moeslund B, Schou JC, Sand-Jensen K
(2016) Remarkable richness of aquatic
macrophytes in 3-years old re-established
Lake Fil, Denmark. Ecol Eng 95:375-383
Hansen K (2014) People and Tales of the Lost
Land (in Danish). Narayana Press,Odder,
Denmark
Hilt S, Brothers S, Jeppesen E, Veraart AJ, Kosten
S (2017) Translating regime shifts in
shallow lakes into changes in ecosystem
functions and services. Bioscience
67:928-936
Hoffmann CC, Baattrup-Pedersen A (2007) Re-
establishing freshwater wetlands in
Denmark. Ecol Eng 30:157-166
Jespersen AM, Christoffersen K (1987)
Measurements of Chlorophyll-a from
Phytoplankton Using Ethanol as
Extraction Solvent. Arch Hydrobiol
109:445-454
Jones R, Young J, Hartley A, Bailey‐Watts A
(1996) Light limitation of phytoplankton
development in an oligotrophic lake‐Loch
Ness, Scotland. Freshwater Biol 35:533-
543
Kalff J (2002) Limnology: inland water
ecosystems. vol 504.45 KAL.
79
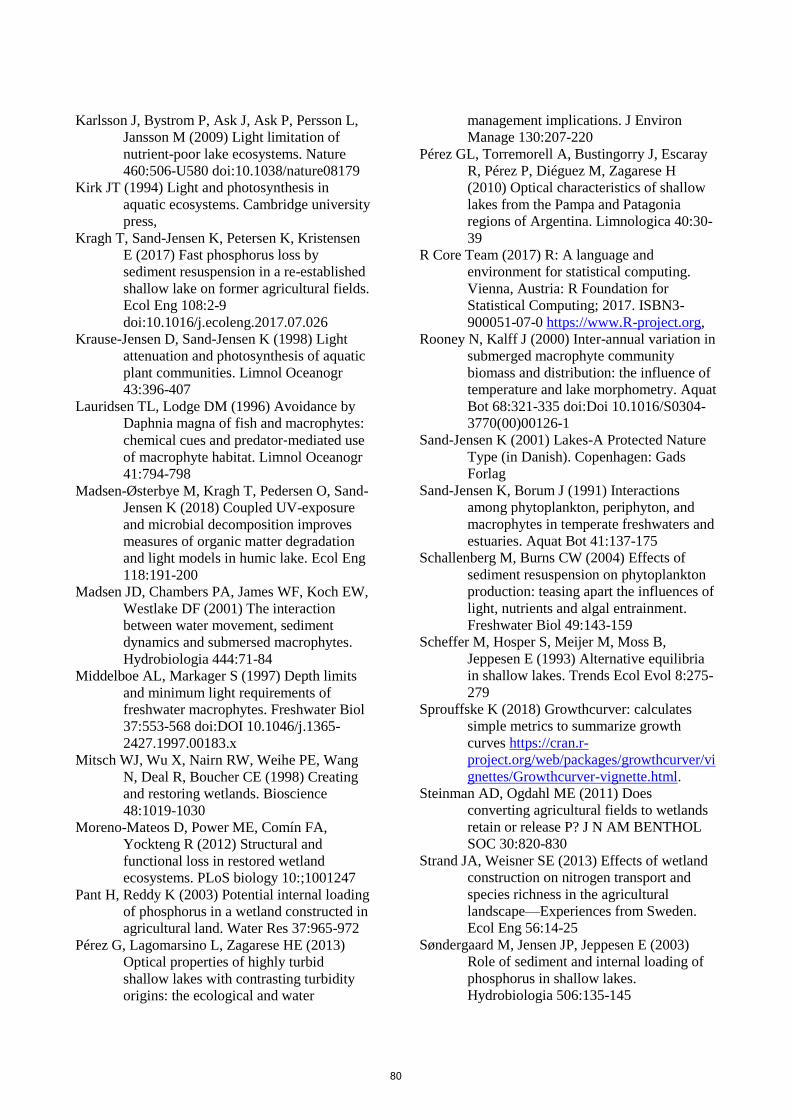
Karlsson J, Bystrom P, Ask J, Ask P, Persson L,
Jansson M (2009) Light limitation of
nutrient-poor lake ecosystems. Nature
460:506-U580 doi:10.1038/nature08179
Kirk JT (1994) Light and photosynthesis in
aquatic ecosystems. Cambridge university
press,
Kragh T, Sand-Jensen K, Petersen K, Kristensen
E (2017) Fast phosphorus loss by
sediment resuspension in a re-established
shallow lake on former agricultural fields.
Ecol Eng 108:2-9
doi:10.1016/j.ecoleng.2017.07.026
Krause-Jensen D, Sand-Jensen K (1998) Light
attenuation and photosynthesis of aquatic
plant communities. Limnol Oceanogr
43:396-407
Lauridsen TL, Lodge DM (1996) Avoidance by
Daphnia magna of fish and macrophytes:
chemical cues and predator‐mediated use
of macrophyte habitat. Limnol Oceanogr
41:794-798
Madsen-Østerbye M, Kragh T, Pedersen O, Sand-
Jensen K (2018) Coupled UV-exposure
and microbial decomposition improves
measures of organic matter degradation
and light models in humic lake. Ecol Eng
118:191-200
Madsen JD, Chambers PA, James WF, Koch EW,
Westlake DF (2001) The interaction
between water movement, sediment
dynamics and submersed macrophytes.
Hydrobiologia 444:71-84
Middelboe AL, Markager S (1997) Depth limits
and minimum light requirements of
freshwater macrophytes. Freshwater Biol
37:553-568 doi:DOI 10.1046/j.1365-
2427.1997.00183.x
Mitsch WJ, Wu X, Nairn RW, Weihe PE, Wang
N, Deal R, Boucher CE (1998) Creating
and restoring wetlands. Bioscience
48:1019-1030
Moreno-Mateos D, Power ME, Comín FA,
Yockteng R (2012) Structural and
functional loss in restored wetland
ecosystems. PLoS biology 10:;1001247
Pant H, Reddy K (2003) Potential internal loading
of phosphorus in a wetland constructed in
agricultural land. Water Res 37:965-972
Pérez G, Lagomarsino L, Zagarese HE (2013)
Optical properties of highly turbid
shallow lakes with contrasting turbidity
origins: the ecological and water
management implications. J Environ
Manage 130:207-220
Pérez GL, Torremorell A, Bustingorry J, Escaray
R, Pérez P, Diéguez M, Zagarese H
(2010) Optical characteristics of shallow
lakes from the Pampa and Patagonia
regions of Argentina. Limnologica 40:30-
39
R Core Team (2017) R: A language and
environment for statistical computing.
Vienna, Austria: R Foundation for
Statistical Computing; 2017. ISBN3-
900051-07-0 https://www.R-project.org,
Rooney N, Kalff J (2000) Inter-annual variation in
submerged macrophyte community
biomass and distribution: the influence of
temperature and lake morphometry. Aquat
Bot 68:321-335 doi:Doi 10.1016/S0304-
3770(00)00126-1
Sand-Jensen K (2001) Lakes-A Protected Nature
Type (in Danish). Copenhagen: Gads
Forlag
Sand-Jensen K, Borum J (1991) Interactions
among phytoplankton, periphyton, and
macrophytes in temperate freshwaters and
estuaries. Aquat Bot 41:137-175
Schallenberg M, Burns CW (2004) Effects of
sediment resuspension on phytoplankton
production: teasing apart the influences of
light, nutrients and algal entrainment.
Freshwater Biol 49:143-159
Scheffer M, Hosper S, Meijer M, Moss B,
Jeppesen E (1993) Alternative equilibria
in shallow lakes. Trends Ecol Evol 8:275-
279
Sprouffske K (2018) Growthcurver: calculates
simple metrics to summarize growth
curves https://cran.r-
project.org/web/packages/growthcurver/vi
gnettes/Growthcurver-vignette.html.
Steinman AD, Ogdahl ME (2011) Does
converting agricultural fields to wetlands
retain or release P? J N AM BENTHOL
SOC 30:820-830
Strand JA, Weisner SE (2013) Effects of wetland
construction on nitrogen transport and
species richness in the agricultural
landscape—Experiences from Sweden.
Ecol Eng 56:14-25
Søndergaard M, Jensen JP, Jeppesen E (2003)
Role of sediment and internal loading of
phosphorus in shallow lakes.
Hydrobiologia 506:135-145
80

Van Duin EH et al. (2001) Modeling underwater
light climate in relation to sedimentation,
resuspension, water quality and
autotrophic growth. Hydrobiologia
444:25-42
Williams P, Biggs J, Fox G, Nicolet P, Whitfield
M History, origins and importance of
temporary ponds. In: Freshwater Forum,
2001. vol 1.
Zedler JB, Kercher S (2005) Wetland resources:
status, trends, ecosystem services, and
restorability. Annu Rev Environ Resour
30:39-74
81

Supporting Information to Chapter 1 and 3
82
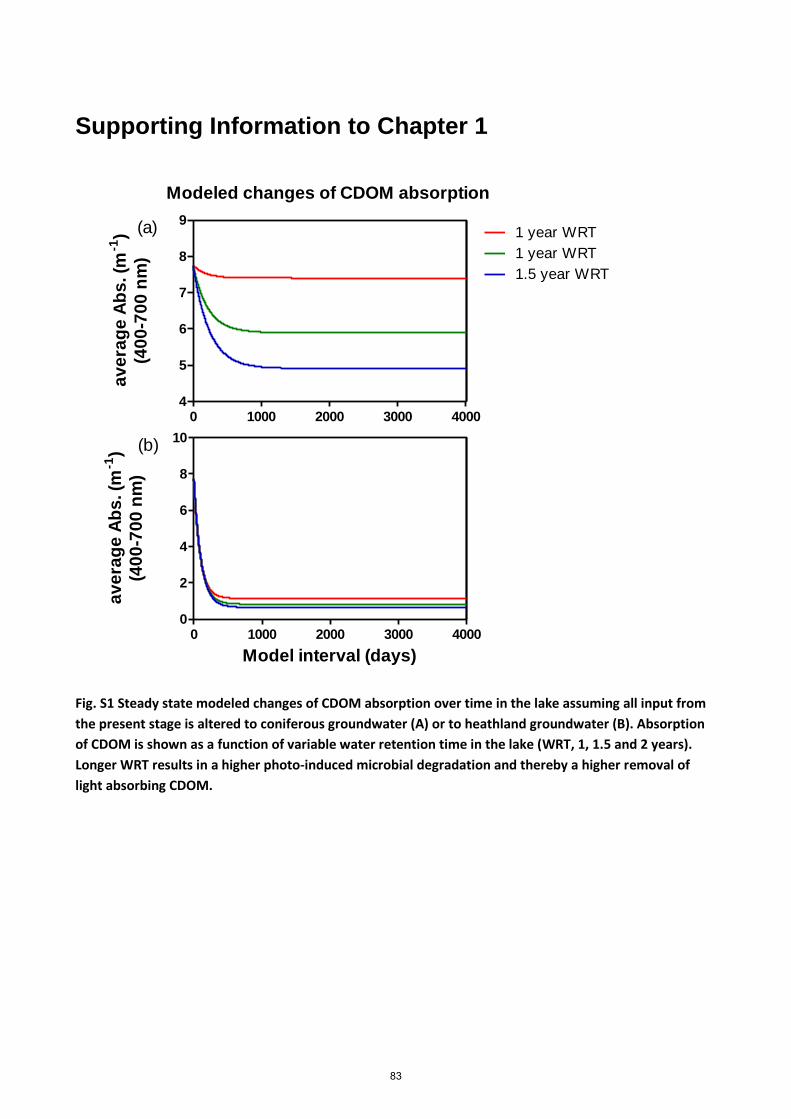
Supporting Information to Chapter 1
Modeled changes of CDOM absorption
0 1000 2000 3000 40004
5
6
7
8
9
1 year WRT
1.5 year WRT
(a) 1 year WRT
av
era
ge
Ab
s. (m
-1)
(40
0-7
00
nm
)
0 1000 2000 3000 40000
2
4
6
8
10(b)
Model interval (days)
av
era
ge
Ab
s. (m
-1)
(40
0-7
00
nm
)
Fig. S1 Steady state modeled changes of CDOM absorption over time in the lake assuming all input from
the present stage is altered to coniferous groundwater (A) or to heathland groundwater (B). Absorption
of CDOM is shown as a function of variable water retention time in the lake (WRT, 1, 1.5 and 2 years).
Longer WRT results in a higher photo-induced microbial degradation and thereby a higher removal of
light absorbing CDOM.
83
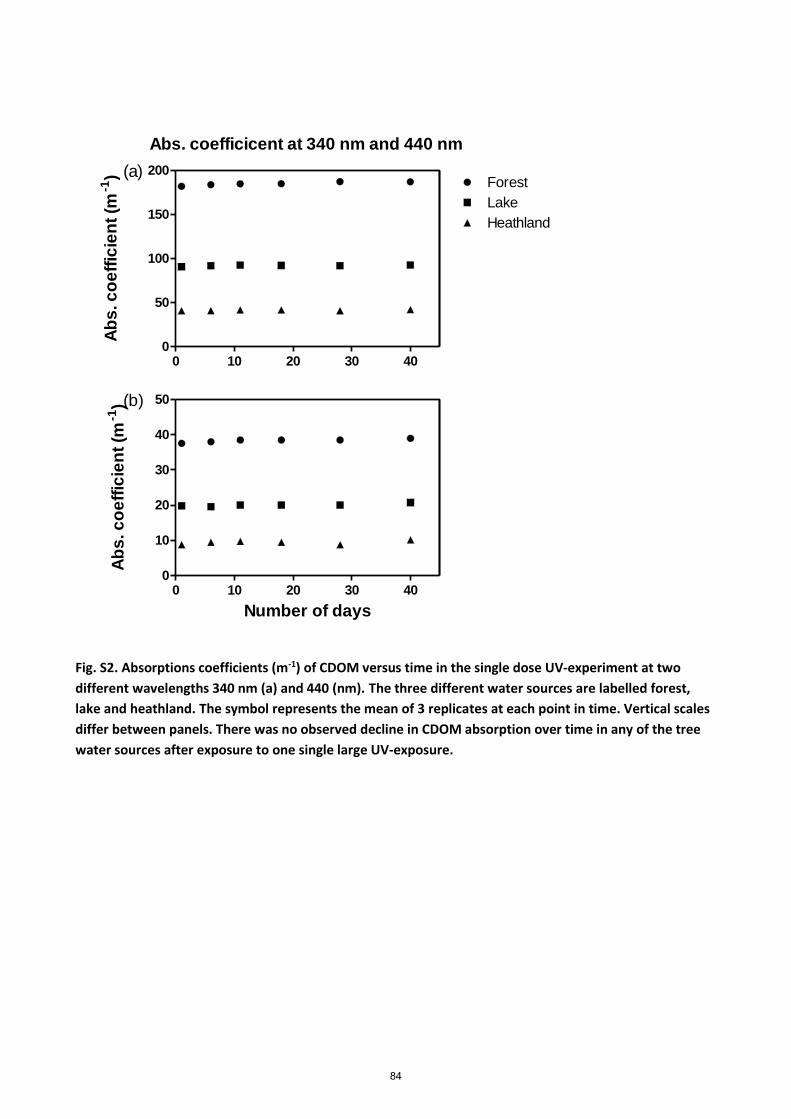
Abs. coefficicent at 340 nm and 440 nm
0 10 20 30 400
50
100
150
200Forest
Lake
Heathland
(a)
Ab
s. c
oe
ffic
ien
t (m
-1)
0 10 20 30 400
10
20
30
40
50(b)
Number of days
Ab
s. c
oe
ffic
ien
t (m
-1)
Fig. S2. Absorptions coefficients (m-1) of CDOM versus time in the single dose UV-experiment at two
different wavelengths 340 nm (a) and 440 (nm). The three different water sources are labelled forest,
lake and heathland. The symbol represents the mean of 3 replicates at each point in time. Vertical scales
differ between panels. There was no observed decline in CDOM absorption over time in any of the tree
water sources after exposure to one single large UV-exposure.
84
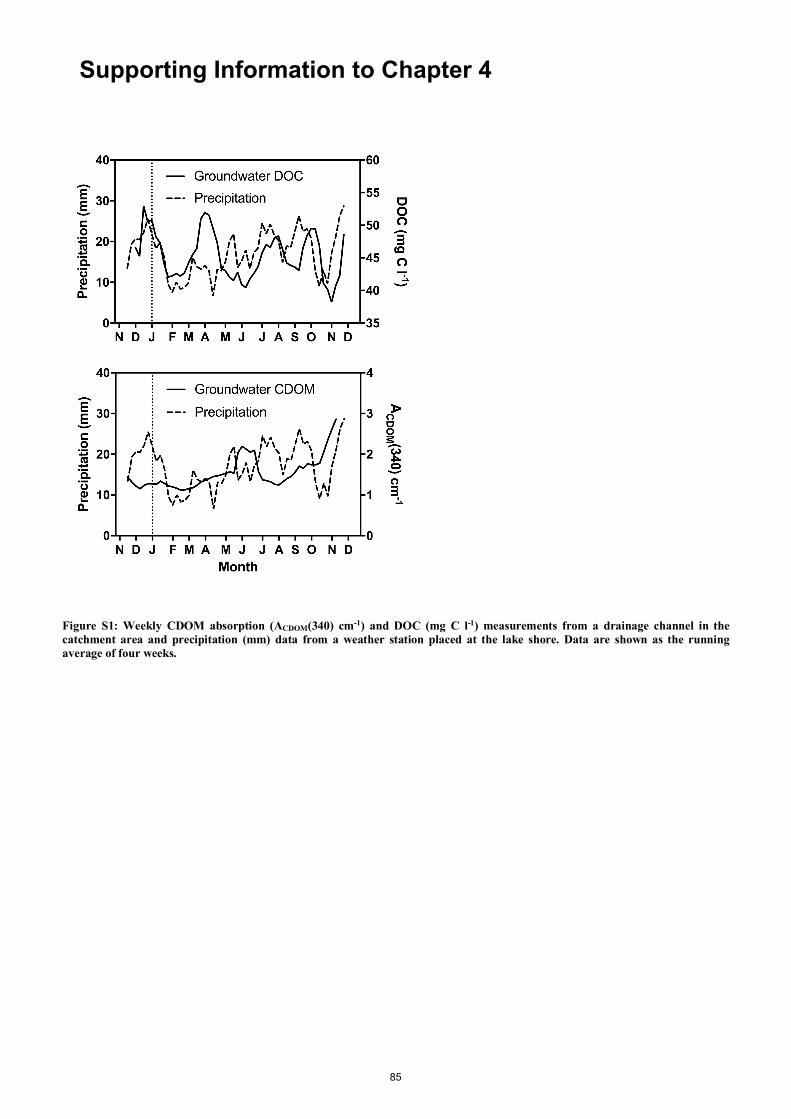
Figure S1: Weekly CDOM absorption (ACDOM(340) cm-1) and DOC (mg C l-1) measurements from a drainage channel in the catchment area and precipitation (mm) data from a weather station placed at the lake shore. Data are shown as the running average of four weeks.
Supporting Information to Chapter 4
85
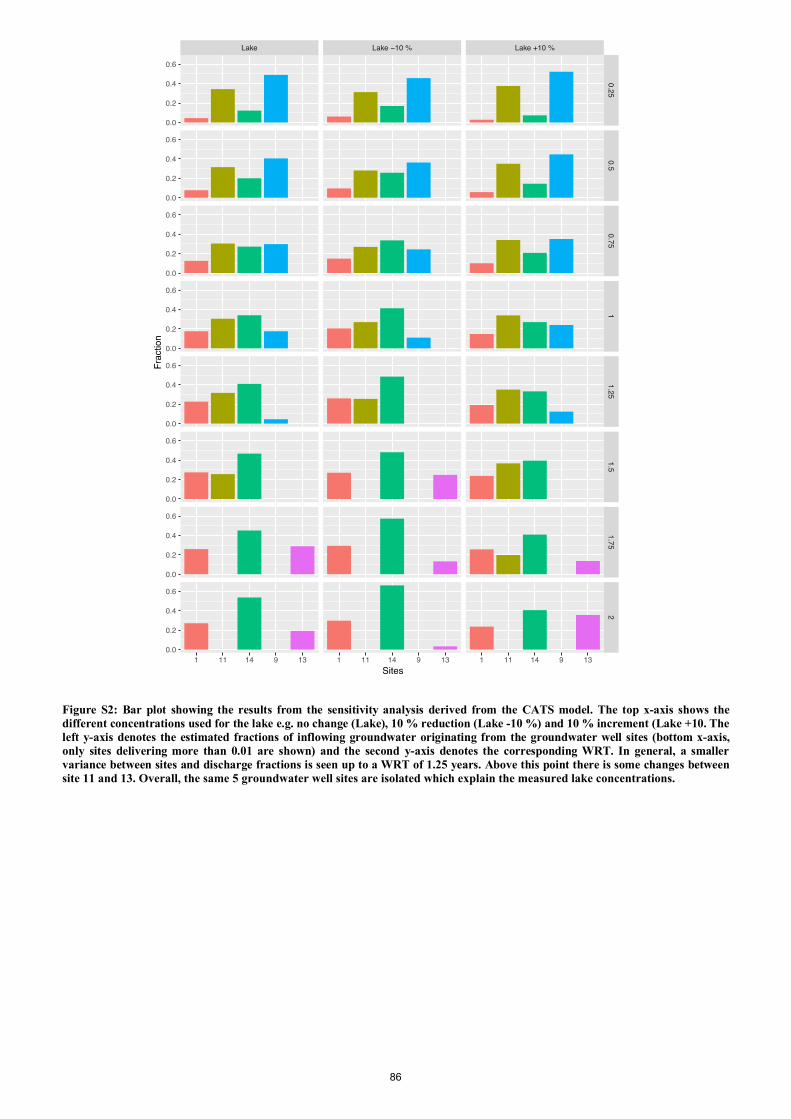
Figure S2: Bar plot showing the results from the sensitivity analysis derived from the CATS model. The top x-axis shows the different concentrations used for the lake e.g. no change (Lake), 10 % reduction (Lake -10 %) and 10 % increment (Lake +10. The left y-axis denotes the estimated fractions of inflowing groundwater originating from the groundwater well sites (bottom x-axis, only sites delivering more than 0.01 are shown) and the second y-axis denotes the corresponding WRT. In general, a smaller variance between sites and discharge fractions is seen up to a WRT of 1.25 years. Above this point there is some changes between site 11 and 13. Overall, the same 5 groundwater well sites are isolated which explain the measured lake concentrations.
Lake Lake −10 % Lake +10 %
0.250.5
0.751
1.251.5
1.752
1 11 14 9 13 1 11 14 9 13 1 11 14 9 13
0.0
0.2
0.4
0.6
0.0
0.2
0.4
0.6
0.0
0.2
0.4
0.6
0.0
0.2
0.4
0.6
0.0
0.2
0.4
0.6
0.0
0.2
0.4
0.6
0.0
0.2
0.4
0.6
0.0
0.2
0.4
0.6
Sites
Fraction
86
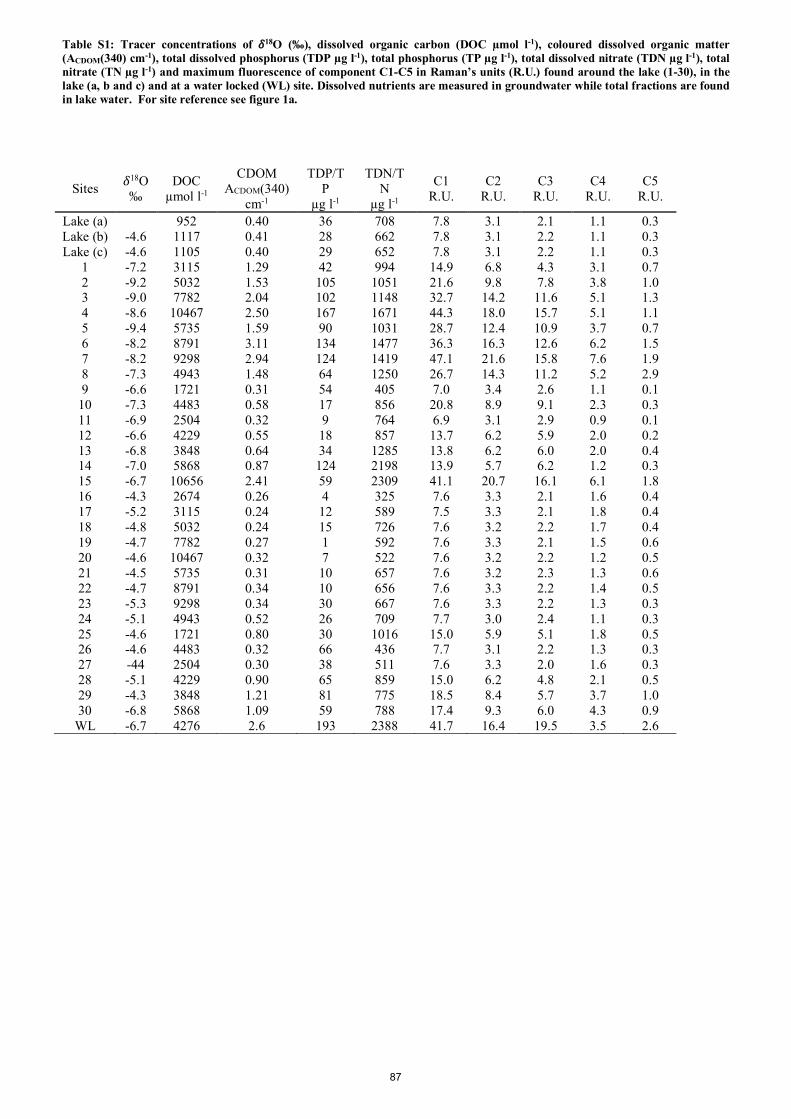
Table S1: Tracer concentrations of 𝛿18O (‰), dissolved organic carbon (DOC µmol l-1), coloured dissolved organic matter (ACDOM(340) cm-1), total dissolved phosphorus (TDP µg l-1), total phosphorus (TP µg l-1), total dissolved nitrate (TDN µg l-1), total nitrate (TN µg l-1) and maximum fluorescence of component C1-C5 in Raman’s units (R.U.) found around the lake (1-30), in the lake (a, b and c) and at a water locked (WL) site. Dissolved nutrients are measured in groundwater while total fractions are found in lake water. For site reference see figure 1a.
Sites 𝛿18O ‰
DOC µmol l-1
CDOM ACDOM(340)
cm-1
TDP/TP
µg l-1
TDN/TN µg l-1
C1 R.U.
C2 R.U.
C3 R.U.
C4 R.U.
C5 R.U.
Lake (a) 952 0.40 36 708 7.8 3.1 2.1 1.1 0.3 Lake (b) -4.6 1117 0.41 28 662 7.8 3.1 2.2 1.1 0.3 Lake (c) -4.6 1105 0.40 29 652 7.8 3.1 2.2 1.1 0.3
1 -7.2 3115 1.29 42 994 14.9 6.8 4.3 3.1 0.7 2 -9.2 5032 1.53 105 1051 21.6 9.8 7.8 3.8 1.0 3 -9.0 7782 2.04 102 1148 32.7 14.2 11.6 5.1 1.3 4 -8.6 10467 2.50 167 1671 44.3 18.0 15.7 5.1 1.1 5 -9.4 5735 1.59 90 1031 28.7 12.4 10.9 3.7 0.7 6 -8.2 8791 3.11 134 1477 36.3 16.3 12.6 6.2 1.5 7 -8.2 9298 2.94 124 1419 47.1 21.6 15.8 7.6 1.9 8 -7.3 4943 1.48 64 1250 26.7 14.3 11.2 5.2 2.9 9 -6.6 1721 0.31 54 405 7.0 3.4 2.6 1.1 0.1
10 -7.3 4483 0.58 17 856 20.8 8.9 9.1 2.3 0.3 11 -6.9 2504 0.32 9 764 6.9 3.1 2.9 0.9 0.1 12 -6.6 4229 0.55 18 857 13.7 6.2 5.9 2.0 0.2 13 -6.8 3848 0.64 34 1285 13.8 6.2 6.0 2.0 0.4 14 -7.0 5868 0.87 124 2198 13.9 5.7 6.2 1.2 0.3 15 -6.7 10656 2.41 59 2309 41.1 20.7 16.1 6.1 1.8 16 -4.3 2674 0.26 4 325 7.6 3.3 2.1 1.6 0.4 17 -5.2 3115 0.24 12 589 7.5 3.3 2.1 1.8 0.4 18 -4.8 5032 0.24 15 726 7.6 3.2 2.2 1.7 0.4 19 -4.7 7782 0.27 1 592 7.6 3.3 2.1 1.5 0.6 20 -4.6 10467 0.32 7 522 7.6 3.2 2.2 1.2 0.5 21 -4.5 5735 0.31 10 657 7.6 3.2 2.3 1.3 0.6 22 -4.7 8791 0.34 10 656 7.6 3.3 2.2 1.4 0.5 23 -5.3 9298 0.34 30 667 7.6 3.3 2.2 1.3 0.3 24 -5.1 4943 0.52 26 709 7.7 3.0 2.4 1.1 0.3 25 -4.6 1721 0.80 30 1016 15.0 5.9 5.1 1.8 0.5 26 -4.6 4483 0.32 66 436 7.7 3.1 2.2 1.3 0.3 27 -44 2504 0.30 38 511 7.6 3.3 2.0 1.6 0.3 28 -5.1 4229 0.90 65 859 15.0 6.2 4.8 2.1 0.5 29 -4.3 3848 1.21 81 775 18.5 8.4 5.7 3.7 1.0 30 -6.8 5868 1.09 59 788 17.4 9.3 6.0 4.3 0.9
WL -6.7 4276 2.6 193 2388 41.7 16.4 19.5 3.5 2.6
87