Embed Size (px)
Citation preview
Physics Potentials with the Second Hyper-Kamiokande Detector
in Korea
(Hyper-Kamiokande Proto-Collaboration)
K. Abe,57, 59 Ke. Abe,24 H. Aihara,59, 60 A. Aimi,18 R. Akutsu,58 C. Andreopoulos,28, 43
I. Anghel,21 L.H.V. Anthony,28 M. Antonova,20 Y. Ashida,25 M. Barbi,44 G.J. Barker,66
G. Barr,40 P. Beltrame,11 V. Berardi,16 M. Bergevin,3 S. Berkman,2 T. Berry,45
S. Bhadra,73 F.d.M. Blaszczyk,1 A. Blondel,12 S. Bolognesi,6 S.B. Boyd,66 A. Bravar,12
C. Bronner,59 M. Buizza Avanzini,10 F.S. Cafagna,16 A. Cole,50 R. Calland,59 S. Cao,25
S.L. Cartwright,50 M.G. Catanesi,16 C. Checchia,18 Z. Chen-Wishart,45 J.H. Choi,8
K. Choi,14 J. Coleman,28 G. Collazuol,18 G. Cowan,11 L. Cremonesi,48 T. Dealtry,27
G. De Rosa,17 C. Densham,43 D. Dewhurst,40 E.L. Drakopoulou,11 F. Di Lodovico,48
O. Drapier,10 P. Dunne,15 M. Dziewiecki,65 S. Emery,6 A. Esmaili,46 P. Fernandez,31
E. Fernandez-Martinez,31 T. Feusels,2 A. Finch,27 A. Fiorentini,73 M. Fitton,43
K. Frankiewicz,37 M. Friend,22 Y. Fujii,22 Y. Fukuda,33 D. Fukuda,38 K. Ganezer,5
M. Gonin,10 N. Grant,66 P. Gumplinger,62 D.R. Hadley,66 L. Haegel,12 D. Hamabe,61
B. Hartfiel,5 M. Hartz,59, 62 Y. Hayato,57, 59 K. Hayrapetyan,48 J. Hill,5 S. Hirota,25
S. Horiuchi,69 A.K. Ichikawa,25 T. Iijima,34, 35 M. Ikeda,57 J. Imber,10 K. Inoue,55, 59
J. Insler,30 R.A. Intonti,16 A. Ioannisian,72 T. Ishida,22 H. Ishino,38 M. Ishitsuka,61
Y. Itow,35, 36 K. Iwamoto,47 A. Izmaylov,20 B. Jamieson,68 H.I. Jang,52 J.S. Jang,13
S.H. Jeon,54 M. Jiang,25 P. Jonsson,15 K.K. Joo,7 A. Kaboth,43, 45 C. Kachulis,1
T. Kajita,58, 59 J. Kameda,57, 59 Y. Karadhzov,12 T. Katori,48 K. Kayrapetyan,48
E. Kearns,1, 59 M. Khabibullin,20 A. Khotjantsev,20 J.H. Kim,54 J.Y. Kim,7 S.B. Kim,51
S.Y. Kim,51 S. King,48 Y. Kishimoto,57, 59 P. Ko∗,23 T. Kobayashi,22 M. Koga,55, 59
A. Konaka,62 L.L. Kormos,27 Y. Koshio,38, 59 K.L. Kowalik,37 W.R. Kropp,4 Y. Kudenko,20
R. Kurjata,65 T. Kutter,30 M. Kuze,61 L. Labarga,31 J. Lagoda,37 P.J.J. Lasorak,48
M. Laveder,18 M. Lawe,27 J.G. Learned,14 I.T. Lim,7 T. Lindner,62 R. P. Litchfield,15
A. Longhin,18 P. Loverre,19 T. Lou,60 L. Ludovici,19 W. Ma,15 L. Magaletti,16 K. Mahn,32
M. Malek,50 L. Maret,12 C. Mariani,69 K. Martens,59 Ll. Marti,57 J.F. Martin,63 J. Marzec,65
∗ Author as part of the T2HKK interest group.
1
arX
iv:1
611.
0611
8v1
[he
p-ex
] 1
8 N
ov 2
016
S. Matsuno,14 E. Mazzucato,6 M. McCarthy,73 N. McCauley,28 K.S. McFarland,47
C. McGrew,53 A. Mefodiev,20 C. Metelko,28 M. Mezzetto,18 J. Migenda,50 P. Mijakowski,37
H. Minakata,71 A. Minamino,25 S. Mine,4 O. Mineev,20 M. Miura,57, 59 J. Monroe,45
D.H. Moon,7 S. Moriyama,57, 59 T. Mueller,10 F. Muheim,11 K. Murase,41 F. Muto,34
M. Nakahata,57, 59 Y. Nakajima,57 K. Nakamura,22, 59 T. Nakaya,25, 59 S. Nakayama,57, 59
C. Nantais,63 M. Needham,11 T. Nicholls,43 Y. Nishimura,58 E. Noah,12 F. Nova,43
J. Nowak,27 H. Nunokawa,46 Y. Obayashi,59 H.M. O’Keeffe,27 Y. Okajima,61
K. Okumura,58, 59 E. O’Sullivan,9 T. Ovsiannikova,20 R.A. Owen,48 Y. Oyama,22 J. Perez,31
M.Y. Pac,8 V. Palladino,17 J.L. Palomino,53 V. Paolone,42 W. Parker,45 S. Parsa,12
D. Payne,28 J.D. Perkin,50 E. Pinzon Guerra,73 S. Playfer,11 M. Posiadala-Zezula,64
J.-M. Poutissou,62 A. Pritchard,28 N.W. Prouse,48 P. Przewlocki,37 B. Quilain,25
M. Quinto,16 E. Radicioni,16 P.N. Ratoff,27 M.A. Rayner,12 F. Retiere,62 C. Riccio,17
B. Richards,48 E. Rondio,37 H.J. Rose,28 C. Rott,54 S.D. Rountree,69 A.C. Ruggeri,17
A. Rychter,65 R. Sacco,48 M. Sakuda,38 M.C. Sanchez,21 E. Scantamburlo,12
K. Scholberg,9, 59 M. Scott,62 Y. Seiya,39 T. Sekiguchi,22 H. Sekiya,57, 59 S.H. Seo,51
D. Sgalaberna,12 R. Shah,40 A. Shaikhiev,20 I. Shimizu,55 M. Shiozawa,57, 59 Y. Shitov,15, 45
S. Short,48 C. Simpson,40, 59 G. Sinnis,29 M.B. Smy,4, 59 S. Snow,66 J. Sobczyk,70
H.W. Sobel,4, 59 Y. Sonoda,57 T. Stewart,43 J.L. Stone,1, 59 Y. Suda,60 Y. Suwa,74
Y. Suzuki,59 A.T. Suzuki,24 R. Svoboda,3 R. Tacik,44 A. Takeda,57 A. Takenaka,57
A. Taketa,56 Y. Takeuchi,24, 59 V. Takhistov,4 H.A. Tanaka,63 H.K.M. Tanaka,56
H. Tanaka,57, 59 R. Terri,48 L.F. Thompson,50 M. Thorpe,43 S. Tobayama,2 T. Tomura,57, 59
C. Touramanis,28 T. Towstego,63 T. Tsukamoto,22 K.M. Tsui,58 M. Tzanov,30
Y. Uchida,15 M.R. Vagins,4, 59 G. Vasseur,6 C. Vilela,53 R.B. Vogelaar,69 J. Walding,45
C.W. Walter,9, 59 D. Wark,40, 43 M.O. Wascko,15 A. Weber,43 R. Wendell,25, 59 R.J. Wilkes,67
M.J. Wilking,53 J.R. Wilson,48 T. Xin,21 K. Yamamoto,39 C. Yanagisawa,53 T. Yano,24
S. Yen,62 N. Yershov,20 D.N. Yeum,51 M. Yokoyama,59, 60 T. Yoshida,61 I. Yu,54
M. Yu,73 J. Zalipska,37 K. Zaremba,65 M. Ziembicki,65 M. Zito,6 and S. Zsoldos48
(Hyper-Kamiokande proto-collaboration)
1Boston University, Department of Physics, Boston, Massachusetts, U.S.A.
2University of British Columbia, Department of Physics
2
and Astronomy, Vancouver, British Columbia, Canada
3University of California, Davis, Department of Physics, Davis, California, U.S.A.
4University of California, Irvine, Department of
Physics and Astronomy, Irvine, California, U.S.A.
5California State University, Department of Physics, Carson, California, U.S.A.
6IRFU, CEA Saclay, Gif-sur-Yvette, France
7Chonnam National University, Department of Physics, Gwangju, Korea
8Dongshin University, Basic Science Research Institute, Naju, Korea
9Duke University, Department of Physics, Durham, North Carolina, U.S.A.
10Ecole Polytechnique, IN2P3-CNRS, Laboratoire Leprince-Ringuet, Palaiseau, France
11University of Edinburgh, School of Physics and Astronomy, Edinburgh, United Kingdom
12University of Geneva, Section de Physique, DPNC, Geneva, Switzerland
13GIST College, Gwangju Institute of Science and Technology, Gwangju 500-712, Korea
14University of Hawaii, Department of Physics and Astronomy, Honolulu, Hawaii, U.S.A.
15Imperial College London, Department of Physics, London, United Kingdom
16INFN Sezione di Bari and Universita e Politecnico di
Bari, Dipartimento Interuniversitario di Fisica, Bari, Italy
17INFN Sezione di Napoli and Universita di Napoli, Dipartimento di Fisica, Napoli, Italy
18INFN Sezione di Padova and Universita di Padova, Dipartimento di Fisica, Padova, Italy
19INFN Sezione di Roma, Roma, Italy
20Institute for Nuclear Research of the Russian Academy of Sciences, Moscow, Russia
21Iowa State University, Department of Physics and Astronomy, Ames, Iowa, U.S.A.
22High Energy Accelerator Research Organization (KEK), Tsukuba, Ibaraki, Japan
23Korean Institute for Advanced Studies, Seoul, Korea
24Kobe University, Department of Physics, Kobe, Japan
25Kyoto University, Department of Physics, Kyoto, Japan
26Laboratori Nazionali di Frascati, Frascati, Italy
27Lancaster University, Physics Department, Lancaster, United Kingdom
28University of Liverpool, Department of Physics, Liverpool, United Kingdom
29Los Alamos National Laboratory, New Mexico, U.S.A.
30Louisiana State University, Department of Physics
and Astronomy, Baton Rouge, Louisiana, U.S.A.
3
31University Autonoma Madrid, Department of Theoretical Physics, Madrid, Spain
32Michigan State University, Department of Physics
and Astronomy, East Lansing, Michigan, U.S.A.
33Miyagi University of Education, Department of Physics, Sendai, Japan
34Nagoya University, Graduate School of Science, Nagoya, Japan
35Nagoya University, Kobayashi-Maskawa Institute for
the Origin of Particles and the Universe, Nagoya, Japan
36Nagoya University, Institute for Space-Earth Environmental Research, Nagoya, Japan
37National Centre for Nuclear Research, Warsaw, Poland
38Okayama University, Department of Physics, Okayama, Japan
39Osaka City University, Department of Physics, Osaka, Japan
40Oxford University, Department of Physics, Oxford, United Kingdom
41Pennsylvania State University, Department of Physics, University Park, PA 16802, U.S.A.
42University of Pittsburgh, Department of Physics
and Astronomy, Pittsburgh, Pennsylvania, U.S.A.
43STFC, Rutherford Appleton Laboratory, Harwell Oxford,
and Daresbury Laboratory, Warrington, United Kingdom
44University of Regina, Department of Physics, Regina, Saskatchewan, Canada
45Royal Holloway University of London, Department
of Physics, Egham, Surrey, United Kingdom
46Pontifıcia Universidade Catolica do Rio de Janeiro,
Departamento de Fısica, Rio de Janeiro, Brazil
47University of Rochester, Department of Physics
and Astronomy, Rochester, New York, U.S.A.
48Queen Mary University of London, School of
Physics and Astronomy, London, United Kingdom
49Universidade de Sao Paulo, Instituto de Fısica, Sao Paulo, Brazil
50University of Sheffield, Department of Physics and Astronomy, Sheffield, United Kingdom
51Seoul National University, Department of Physics, Seoul, Korea
52Seoyeong University, Department of Fire Safety, Gwangju, Korea
53State University of New York at Stony Brook, Department
of Physics and Astronomy, Stony Brook, New York, U.S.A.
4
54Sungkyunkwan University, Department of Physics, Suwon, Korea
55Research Center for Neutrino Science, Tohoku University, Sendai, Japan
56University of Tokyo, Earthquake Research Institute, Tokyo, Japan
57University of Tokyo, Institute for Cosmic Ray
Research, Kamioka Observatory, Kamioka, Japan
58University of Tokyo, Institute for Cosmic Ray Research,
Research Center for Cosmic Neutrinos, Kashiwa, Japan
59University of Tokyo, Kavli Institute for the Physics and Mathematics of the
Universe (WPI), Todai Institutes for Advanced Study, Kashiwa, Chiba, Japan
60University of Tokyo, Department of Physics, Tokyo, Japan
61Tokyo Institute of Technology, Department of Physics, Tokyo, Japan
62TRIUMF, Vancouver, British Columbia, Canada
63University of Toronto, Department of Physics, Toronto, Ontario, Canada
64University of Warsaw, Faculty of Physics, Warsaw, Poland
65Warsaw University of Technology, Institute of
Radioelectronics and Multimedia Technology, Warsaw, Poland
66University of Warwick, Department of Physics, Coventry, United Kingdom
67University of Washington, Department of Physics, Seattle, Washington, U.S.A.
68University of Winnipeg, Department of Physics, Winnipeg, Manitoba, Canada
69Virginia Tech, Center for Neutrino Physics, Blacksburg, Virginia, U.S.A.
70Wroclaw University, Faculty of Physics and Astronomy, Wroclaw, Poland
71Yachay Tech, Department of Physics, San Miguel de Urcuquı, Ecuador
72Yerevan Institute for Theoretical Physics and
Modeling, Halabian Str. 34; Yerevan 0036, Armenia
73York University, Department of Physics and Astronomy, Toronto, Ontario, Canada
74Kyoto University, Yukawa Institute for Theoretical Physics, Kyoto, Japan
5
Abstract
We have conducted sensitivity studies on an alternative configuration of the Hyper-Kamiokande
experiment by locating the 2nd Hyper-Kamiokande detector in Korea at ∼1100−1300 km baseline.
Having two detectors at different baselines improves sensitivity to leptonic CP violation, neutrino
mass ordering as well as nonstandard neutrino interactions. There are several candidate sites in
Korea with greater than 1 km high mountains ranged at an 1−3 degree off-axis angle. Thanks to
larger overburden of the candidate sites in Korea, low energy physics, such as solar and supernova
neutrino physics as well as dark matter search, is expected to be improved. In this paper sensitivity
studies on the CP violation phase and neutrino mass ordering are performed using current T2K
systematic uncertainties in most cases. We plan to improve our sensitivity studies in the near
future with better estimation of our systematic uncertainties.
6
I. MOTIVATION
The Hyper-Kamiokande (Hyper-K or HK) proposal [1] builds upon the highly successful
Super-Kamiokande (Super-K or SK) detector [2] by constructing water Cherenkov detectors
with nearly twenty times the fiducial volume of SK to pursue a rich program of neutrino
(astro)physics and proton decay. The current Hyper-K design calls for the staged construc-
tion of two 187 kt (fiducial volume mass) modules near the current Super-K site, 295 km
away and 2.5◦ off-axis (OA) from the J-PARC neutrino beam used by the T2K experiment.
The long baseline neutrino program at Hyper-K with the J-PARC neutrino beam aims for
a definitive observation of CP violation (CPV) in neutrino oscillations that may result from
an irreducible phase δCP in the neutrino mixing matrix. Hyper-K will make precise mea-
surements of other oscillation parameters, such as the mixing angle θ23 and ∆m232, and thus
will provide highly sensitive tests of the three-flavor mixing paradigm. These measurements
are valuable towards elucidating the new physics responsible for neutrino mass and mixing
and its potential connections to the mystery of the matter/antimatter asymmetry of the
universe.
In this document, we will explore the possibility of placing one of the two Hyper-K mod-
ules in Korea at a baseline of 1000−1300 km; we will refer to this as “T2HKK” in contrast
to the current default configuration with both detectors in Kamioka with 295 km baseline
(“T2HK”) . The T2HKK configuration, which provides measurements at two significantly
different baselines, will break degeneracies related to the unknown mass ordering, θ23, and
the CP-violating phase δCP . It will provide the opportunity to fully probe the oscillation
physics at the first and second oscillation maxima. The measurements at multiple baselines,
including near detectors at J-PARC, can serve to mutually reduce systematic uncertain-
ties across all the measurements. The study of non-standard neutrino interactions is also
expected to be significantly enhanced by the two-baseline configuration.
In Korea, the range of OA angle from J-PARC is 1 to 3 degree (see Fig. 1), and within this
range there are many mountains over 1 km height. This allows for the optimization of the OA
angle within this range based on physics sensitivities and systematic error considerations. It
also provides an enhanced program of low energy physics such as solar neutrino, supernova
and dark matter neutrino detection studies, and geophysics that would benefit from the large
overburden in the Korean site. Recent developments in gadolinium doping of water and
7
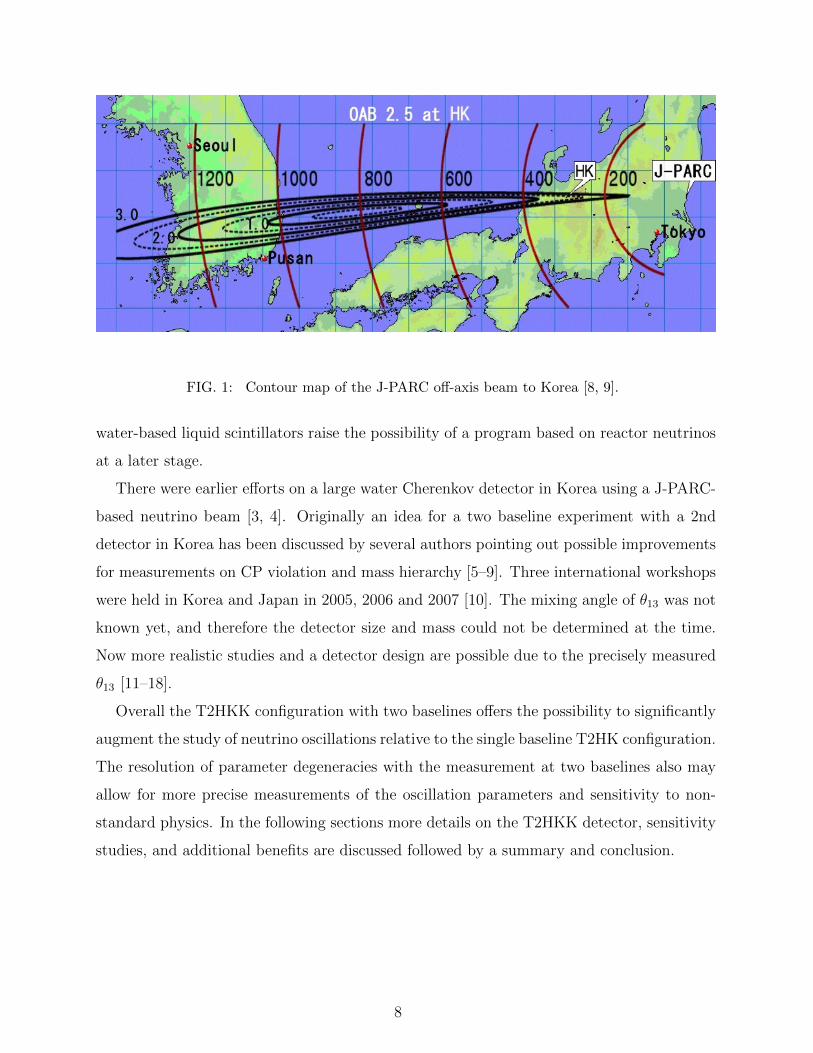
FIG. 1: Contour map of the J-PARC off-axis beam to Korea [8, 9].
water-based liquid scintillators raise the possibility of a program based on reactor neutrinos
at a later stage.
There were earlier efforts on a large water Cherenkov detector in Korea using a J-PARC-
based neutrino beam [3, 4]. Originally an idea for a two baseline experiment with a 2nd
detector in Korea has been discussed by several authors pointing out possible improvements
for measurements on CP violation and mass hierarchy [5–9]. Three international workshops
were held in Korea and Japan in 2005, 2006 and 2007 [10]. The mixing angle of θ13 was not
known yet, and therefore the detector size and mass could not be determined at the time.
Now more realistic studies and a detector design are possible due to the precisely measured
θ13 [11–18].
Overall the T2HKK configuration with two baselines offers the possibility to significantly
augment the study of neutrino oscillations relative to the single baseline T2HK configuration.
The resolution of parameter degeneracies with the measurement at two baselines also may
allow for more precise measurements of the oscillation parameters and sensitivity to non-
standard physics. In the following sections more details on the T2HKK detector, sensitivity
studies, and additional benefits are discussed followed by a summary and conclusion.
8
II. SECOND HYPER-KAMIOKANDE DETECTOR IN KOREA
In this chapter we present an experimental setup and physics sensitivities of the second
Hyper-K detector in Korea using the J-PARC neutrino beam.
A. J-PARC neutrino beam and Hyper-K detector
The J-PARC neutrino beam and the Hyper-K detector with the near and intermediate
detectors will be described in the next subsections.
1. J-PARC neutrino beam
The neutrino beam for Hyper-K is produced at J-PARC (Japan Proton Accelerator Re-
search Complex) located in Tokai Village, Ibaraki prefecture, on the east coast of Japan,
295 km from the Kamioka detector sites. The 30-GeV (kinetic energy) proton beam is ex-
tracted from the J-PARC Main Ring (MR) by single-turn fast extraction and transported to
the production target after being deflected about 90◦ by 28 superconducting combined func-
tion magnets to direct the beam towards Kamioka. The beam pulse consists of 8 bunches
spaced 581 ns apart to give a 4.2 µs total pulse length. The repetition period of the pulse
is 2.48 s as of 2016. The production target is a 26 mm diameter and 90 cm long graphite
rod (corresponding to 2 interaction lengths). About 80% of incoming protons interact in the
target. The secondary pions (and kaons) from the target are focused by three consecutive
electromagnetic horns operated by a 250 kA pulsed current. The focused pions and kaons
enter a 110 m length decay volume (DV) filled with helium gas and decay in flight into
neutrinos. The beam dump, which consists of graphite blocks of about 3.15 m thickness
followed by iron plates of 2.5 m total thickness, is placed at the end of the DV to absorb
remnant hadrons. Muon monitors (MUMONs) are placed just behind the beam dump to
monitor on a spill-by-spill basis the intensity and the profile of muons > 5 GeV which pass
through the beam dump.
The J-PARC neutrino beamline adopted the first ever off-axis scheme to produce a nar-
row energy neutrino spectrum centered at oscillation maximum to maximize the physics
sensitivity. The T2K experiment is now running at a 2.5 degree off-axis angle to the Super-
Kamiokande detector. The J-PARC neutrino beamline is designed to accommodate 2 ∼ 2.5◦
9
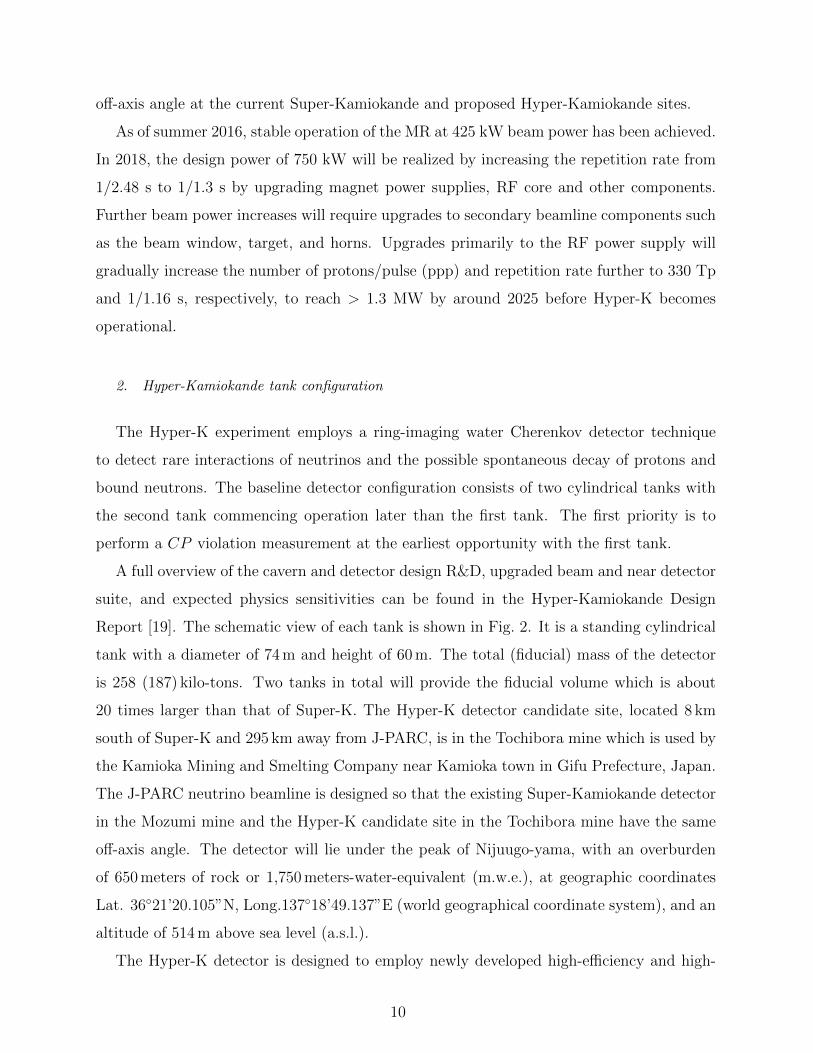
off-axis angle at the current Super-Kamiokande and proposed Hyper-Kamiokande sites.
As of summer 2016, stable operation of the MR at 425 kW beam power has been achieved.
In 2018, the design power of 750 kW will be realized by increasing the repetition rate from
1/2.48 s to 1/1.3 s by upgrading magnet power supplies, RF core and other components.
Further beam power increases will require upgrades to secondary beamline components such
as the beam window, target, and horns. Upgrades primarily to the RF power supply will
gradually increase the number of protons/pulse (ppp) and repetition rate further to 330 Tp
and 1/1.16 s, respectively, to reach > 1.3 MW by around 2025 before Hyper-K becomes
operational.
2. Hyper-Kamiokande tank configuration
The Hyper-K experiment employs a ring-imaging water Cherenkov detector technique
to detect rare interactions of neutrinos and the possible spontaneous decay of protons and
bound neutrons. The baseline detector configuration consists of two cylindrical tanks with
the second tank commencing operation later than the first tank. The first priority is to
perform a CP violation measurement at the earliest opportunity with the first tank.
A full overview of the cavern and detector design R&D, upgraded beam and near detector
suite, and expected physics sensitivities can be found in the Hyper-Kamiokande Design
Report [19]. The schematic view of each tank is shown in Fig. 2. It is a standing cylindrical
tank with a diameter of 74 m and height of 60 m. The total (fiducial) mass of the detector
is 258 (187) kilo-tons. Two tanks in total will provide the fiducial volume which is about
20 times larger than that of Super-K. The Hyper-K detector candidate site, located 8 km
south of Super-K and 295 km away from J-PARC, is in the Tochibora mine which is used by
the Kamioka Mining and Smelting Company near Kamioka town in Gifu Prefecture, Japan.
The J-PARC neutrino beamline is designed so that the existing Super-Kamiokande detector
in the Mozumi mine and the Hyper-K candidate site in the Tochibora mine have the same
off-axis angle. The detector will lie under the peak of Nijuugo-yama, with an overburden
of 650 meters of rock or 1,750 meters-water-equivalent (m.w.e.), at geographic coordinates
Lat. 36◦21’20.105”N, Long.137◦18’49.137”E (world geographical coordinate system), and an
altitude of 514 m above sea level (a.s.l.).
The Hyper-K detector is designed to employ newly developed high-efficiency and high-
10
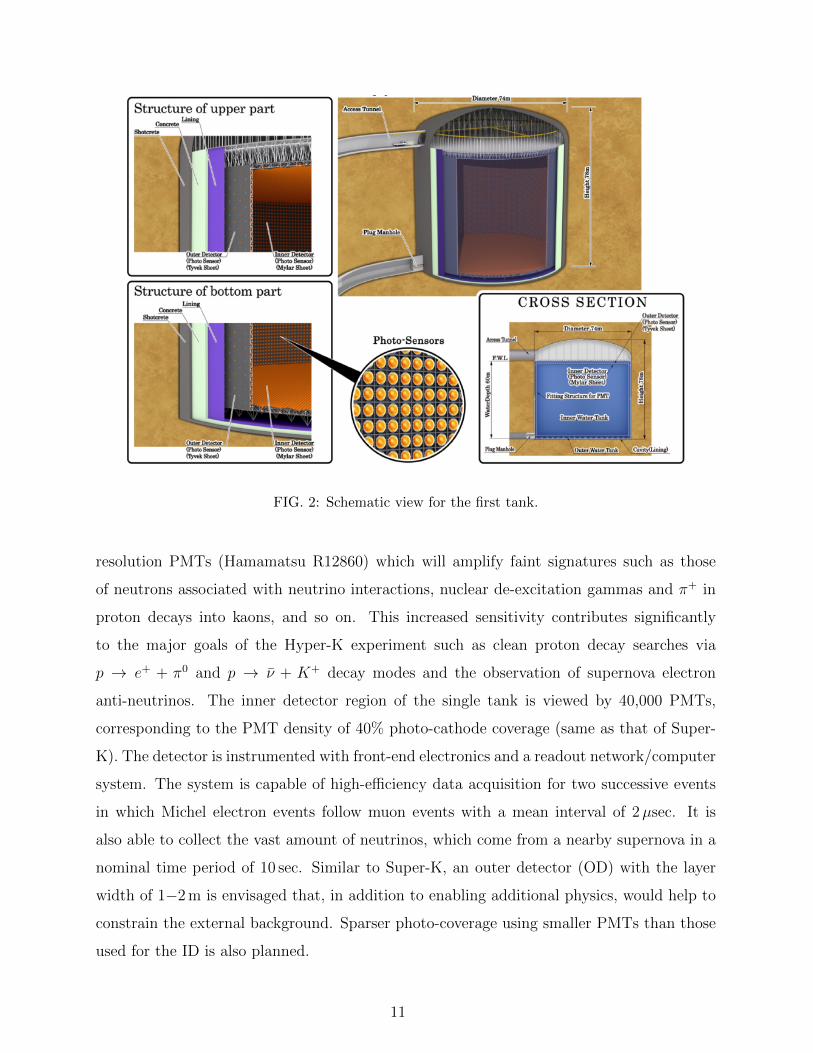
FIG. 2: Schematic view for the first tank.
resolution PMTs (Hamamatsu R12860) which will amplify faint signatures such as those
of neutrons associated with neutrino interactions, nuclear de-excitation gammas and π+ in
proton decays into kaons, and so on. This increased sensitivity contributes significantly
to the major goals of the Hyper-K experiment such as clean proton decay searches via
p → e+ + π0 and p → ν + K+ decay modes and the observation of supernova electron
anti-neutrinos. The inner detector region of the single tank is viewed by 40,000 PMTs,
corresponding to the PMT density of 40% photo-cathode coverage (same as that of Super-
K). The detector is instrumented with front-end electronics and a readout network/computer
system. The system is capable of high-efficiency data acquisition for two successive events
in which Michel electron events follow muon events with a mean interval of 2µsec. It is
also able to collect the vast amount of neutrinos, which come from a nearby supernova in a
nominal time period of 10 sec. Similar to Super-K, an outer detector (OD) with the layer
width of 1−2 m is envisaged that, in addition to enabling additional physics, would help to
constrain the external background. Sparser photo-coverage using smaller PMTs than those
used for the ID is also planned.
11
3. Near and intermediate detector complex
The neutrino flux and cross-section models can be constrained by data collected at near
detectors, situated close enough to the neutrino production point so that oscillation effects
are negligible. Their data addresses important uncertainties in the neutrino flux or cross-
section modeling.
The T2K ND280 detector suite comprises two detectors [20]: INGRID, which consists
of 16 iron-scintillator modules in a cross pattern centered on the neutrino beam axis, and
ND280, a multi-component detector at an angle of 2.5 degree from the beam direction. The
primary purpose of the INGRID detector is to constrain the neutrino beam direction, whilst
the off-axis detector is used to characterize the neutrino beam before oscillation. T2K has
successfully applied a method of fitting to ND280 data with parameterized models of the
neutrino flux and interaction cross-sections. Using the ND280 measurements, the systematic
uncertainties on the parts of the models constrained by ND280 have been reduced to 3%
on the Super-K (SK) predicted event rates. An upgrade of the current ND280 detector is
planned before the starting of Hyper-K.
Moreover, a water Cherenkov detector at about 1-2 km is proposed to be built possibly
before Hyper-K becomes operational [21]. A water Cherenkov near detector can be used to
measure the cross section on H2O directly, with the same solid angle acceptance as the far
detector with no need for a subtraction analysis. Additionally, water Cherenkov detectors
have shown excellent particle identification capabilities, allowing for the detection of pure νµ-
CC, νe-CC and NCπ0 samples. The CCπ0 rate and kaon production in neutrino interactions,
which are backgrounds to nucleon decay searches, can also be measured.
These additional water Cherenkov measurements are essential to achieve the low system-
atic errors required by Hyper-K, but are complemented by the ND280 magnetized track-
ing detector, which has the capabilities to track particles below the threshold to produce
Cherenkov light in water and to separate neutrino and antineutrino charged current inter-
actions via the lepton charge measurement. Hence a combination of a magnetized tracking
detector such as ND280 and the water Cherenkov detector should have the largest impact
to reduce systematic uncertainties.
12
B. T2HKK Experimental Setup and HKK Candidate Site
The axis of the J-PARC neutrino beam emerges upwards out of the sea between Japan
and Korea. The southern part of the Korean peninsula is exposed to the 1−3 degree off-axis
neutrino beams with baselines of 1000−1300 km as shown in Fig. 1. As mentioned earlier,
the T2HKK experiment consists of the first Hyper-K detector in Kamioka at 295 km baseline
and the second one in Korea at ∼1100 km. In this document, we assume that HKK will be
a 258 kt water Cherenkov detector identical to the Hyper-K in Kamioka.
The second oscillation maximum takes place near Eν = 0.6 GeV at the∼1100 km baseline.
The clear separation of different CP phases and mass orderings is observed at the second
oscillation maximum. The HKK can be the most sensitive to the CP phase determination
if it is placed at 2.5 degrees of off-axis angle, the same as Hyper-K in Kamioka. In that
case, the J-PARC neutrino beam spectrum peaks at Eν = 0.6 GeV with a narrow energy
band as shown in Fig. 3. Having identical off-axis angles of the J-PARC beam for HK and
HKK, a ratio measurement between HK and HKK would greatly reduce the uncertainties
of the neutrino beam flux and spectrum. On the other hand, the maximum sensitivity for
determining the neutrino mass ordering is possible by a neutrino beam of Eν > 1 GeV
where the first oscillation maximum takes place. The J-PARC neutrino beam spectrum
peaks above 1 GeV with a wider energy band when its off-axis angle is less than 1.5 degrees.
In this case, the neutrino flux becomes less in the energy region of the second-oscillation
maximum, but still remains enough for the satisfactory CP-phase sensitivity.
The Korean rocks are in general made of granite, hard enough to build a large cavern. A
search for mountains higher than 1000 m has been made to find several candidates for HKK
as listed in Table I. Mountains in the national or provincial parks are not considered in the
search. Two candidate sites are selected among those as shown in Fig. 4: Mt. Bisul at 1.3
degrees of off-axis angle and Mt. Bohyun at 2.2 degrees.
The Mt. Bisul is located at Dalseong in the city of Daegu, the third largest city in South
Korea as shown in Fig. 4. Its accessibility is excellent. It takes one and half hours to get to
Daegu from Seoul by a Korean bullet train, called KTX. The mountain is 1084 m high and
made of hard rocks, granite porphyry and andesitic breccia. HKK is expected to have at least
∼820 m overburden and to be exposed to a 1.3 degree off-axis neutrino beam. Its coordinates
are N35◦ 43’ 00” in latitude and E128◦ 31’ 28” in longitude. The baseline from J-PARC is
13
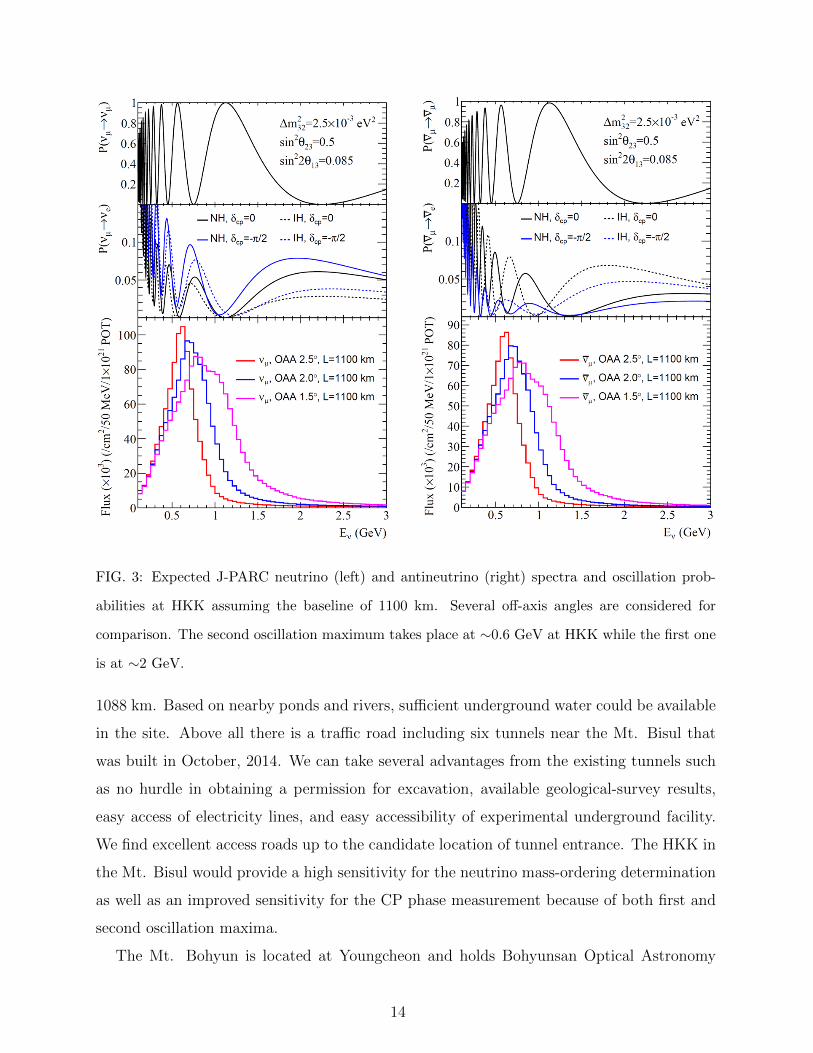
FIG. 3: Expected J-PARC neutrino (left) and antineutrino (right) spectra and oscillation prob-
abilities at HKK assuming the baseline of 1100 km. Several off-axis angles are considered for
comparison. The second oscillation maximum takes place at ∼0.6 GeV at HKK while the first one
is at ∼2 GeV.
1088 km. Based on nearby ponds and rivers, sufficient underground water could be available
in the site. Above all there is a traffic road including six tunnels near the Mt. Bisul that
was built in October, 2014. We can take several advantages from the existing tunnels such
as no hurdle in obtaining a permission for excavation, available geological-survey results,
easy access of electricity lines, and easy accessibility of experimental underground facility.
We find excellent access roads up to the candidate location of tunnel entrance. The HKK in
the Mt. Bisul would provide a high sensitivity for the neutrino mass-ordering determination
as well as an improved sensitivity for the CP phase measurement because of both first and
second oscillation maxima.
The Mt. Bohyun is located at Youngcheon and holds Bohyunsan Optical Astronomy
14
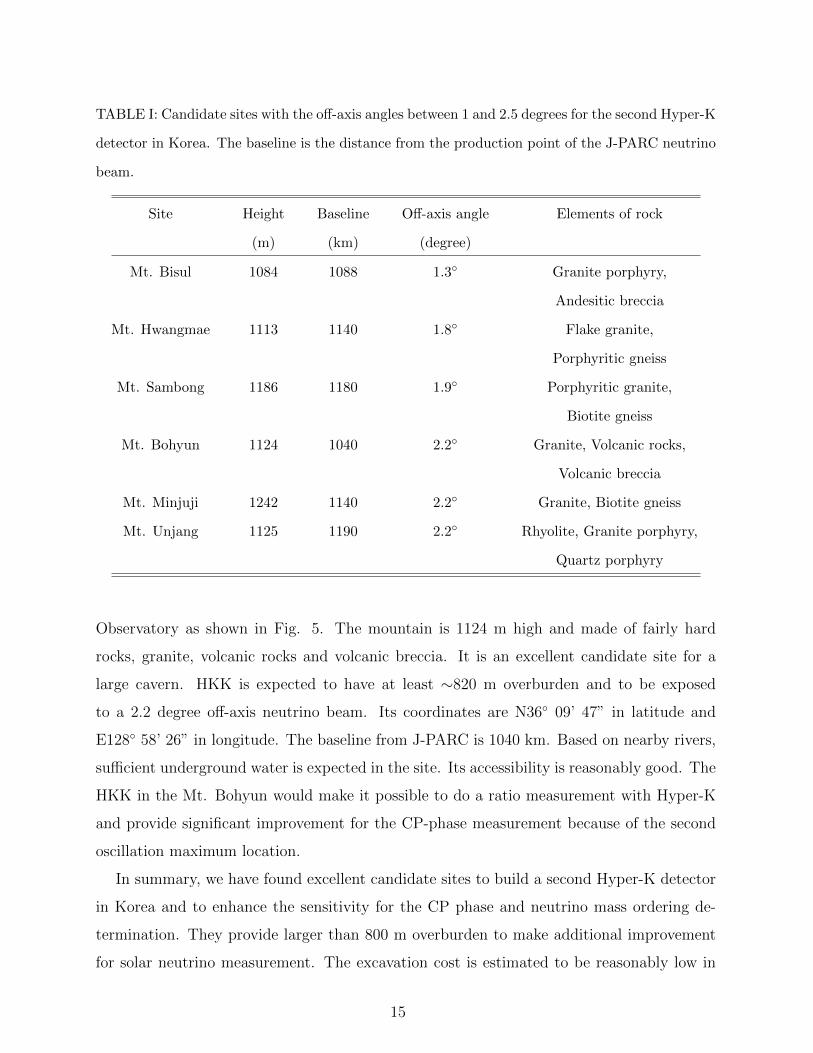
TABLE I: Candidate sites with the off-axis angles between 1 and 2.5 degrees for the second Hyper-K
detector in Korea. The baseline is the distance from the production point of the J-PARC neutrino
beam.
Site Height Baseline Off-axis angle Elements of rock
(m) (km) (degree)
Mt. Bisul 1084 1088 1.3◦ Granite porphyry,
Andesitic breccia
Mt. Hwangmae 1113 1140 1.8◦ Flake granite,
Porphyritic gneiss
Mt. Sambong 1186 1180 1.9◦ Porphyritic granite,
Biotite gneiss
Mt. Bohyun 1124 1040 2.2◦ Granite, Volcanic rocks,
Volcanic breccia
Mt. Minjuji 1242 1140 2.2◦ Granite, Biotite gneiss
Mt. Unjang 1125 1190 2.2◦ Rhyolite, Granite porphyry,
Quartz porphyry
Observatory as shown in Fig. 5. The mountain is 1124 m high and made of fairly hard
rocks, granite, volcanic rocks and volcanic breccia. It is an excellent candidate site for a
large cavern. HKK is expected to have at least ∼820 m overburden and to be exposed
to a 2.2 degree off-axis neutrino beam. Its coordinates are N36◦ 09’ 47” in latitude and
E128◦ 58’ 26” in longitude. The baseline from J-PARC is 1040 km. Based on nearby rivers,
sufficient underground water is expected in the site. Its accessibility is reasonably good. The
HKK in the Mt. Bohyun would make it possible to do a ratio measurement with Hyper-K
and provide significant improvement for the CP-phase measurement because of the second
oscillation maximum location.
In summary, we have found excellent candidate sites to build a second Hyper-K detector
in Korea and to enhance the sensitivity for the CP phase and neutrino mass ordering de-
termination. They provide larger than 800 m overburden to make additional improvement
for solar neutrino measurement. The excavation cost is estimated to be reasonably low in
15
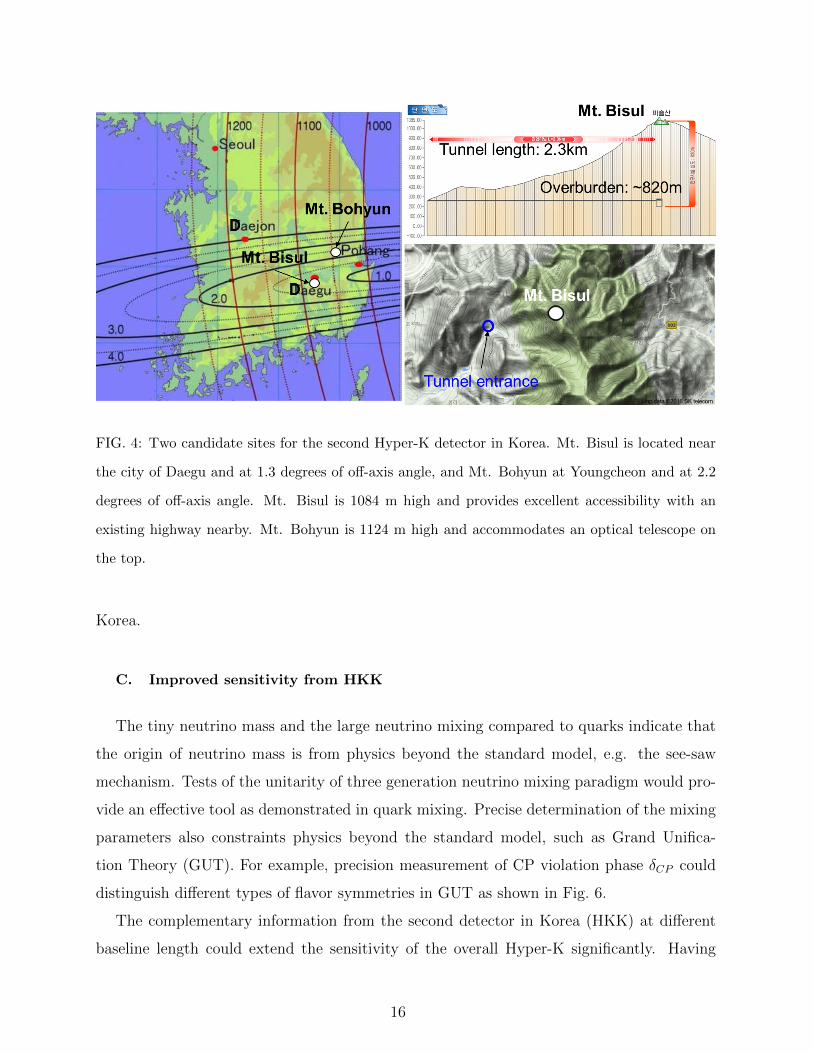
FIG. 4: Two candidate sites for the second Hyper-K detector in Korea. Mt. Bisul is located near
the city of Daegu and at 1.3 degrees of off-axis angle, and Mt. Bohyun at Youngcheon and at 2.2
degrees of off-axis angle. Mt. Bisul is 1084 m high and provides excellent accessibility with an
existing highway nearby. Mt. Bohyun is 1124 m high and accommodates an optical telescope on
the top.
Korea.
C. Improved sensitivity from HKK
The tiny neutrino mass and the large neutrino mixing compared to quarks indicate that
the origin of neutrino mass is from physics beyond the standard model, e.g. the see-saw
mechanism. Tests of the unitarity of three generation neutrino mixing paradigm would pro-
vide an effective tool as demonstrated in quark mixing. Precise determination of the mixing
parameters also constraints physics beyond the standard model, such as Grand Unifica-
tion Theory (GUT). For example, precision measurement of CP violation phase δCP could
distinguish different types of flavor symmetries in GUT as shown in Fig. 6.
The complementary information from the second detector in Korea (HKK) at different
baseline length could extend the sensitivity of the overall Hyper-K significantly. Having
16
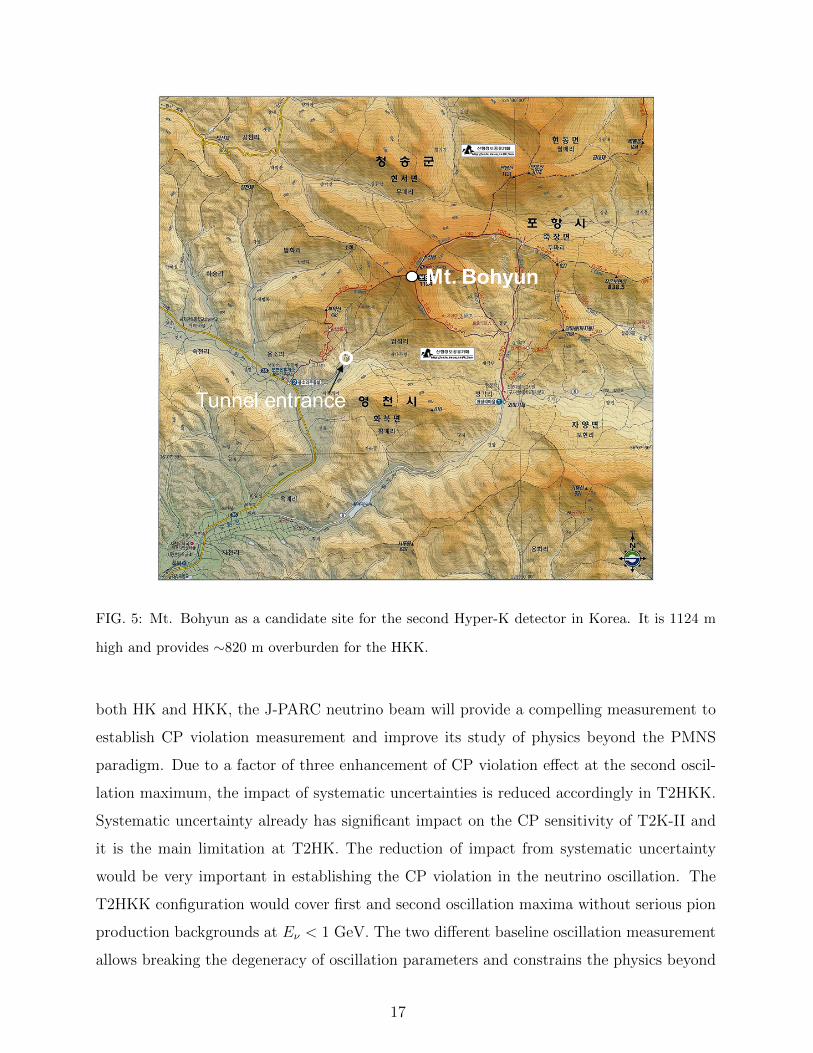
FIG. 5: Mt. Bohyun as a candidate site for the second Hyper-K detector in Korea. It is 1124 m
high and provides ∼820 m overburden for the HKK.
both HK and HKK, the J-PARC neutrino beam will provide a compelling measurement to
establish CP violation measurement and improve its study of physics beyond the PMNS
paradigm. Due to a factor of three enhancement of CP violation effect at the second oscil-
lation maximum, the impact of systematic uncertainties is reduced accordingly in T2HKK.
Systematic uncertainty already has significant impact on the CP sensitivity of T2K-II and
it is the main limitation at T2HK. The reduction of impact from systematic uncertainty
would be very important in establishing the CP violation in the neutrino oscillation. The
T2HKK configuration would cover first and second oscillation maxima without serious pion
production backgrounds at Eν < 1 GeV. The two different baseline oscillation measurement
allows breaking the degeneracy of oscillation parameters and constrains the physics beyond
17
-1.0 -0.5 0.0 0.5 1.00.0
0.2
0.4
0.6
0.8
1.0
cos ∆
Lik
elih
ood
@NO
DBMGRBTBMGRAHG
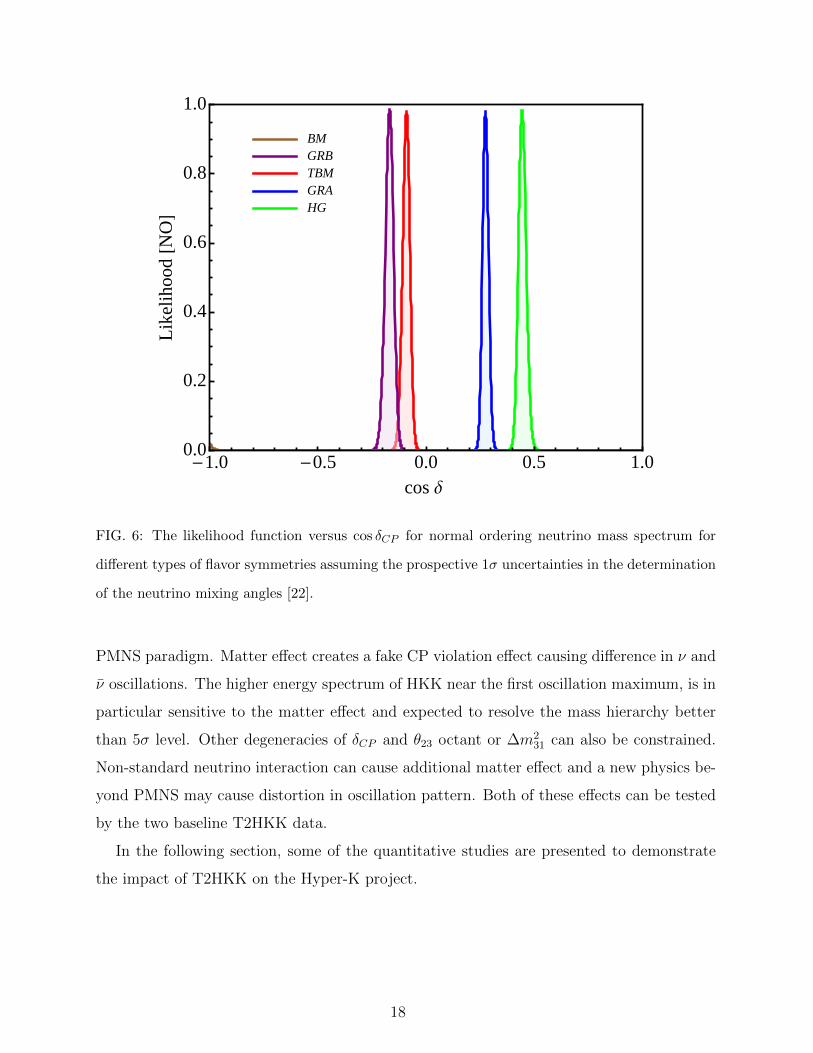
FIG. 6: The likelihood function versus cos δCP for normal ordering neutrino mass spectrum for
different types of flavor symmetries assuming the prospective 1σ uncertainties in the determination
of the neutrino mixing angles [22].
PMNS paradigm. Matter effect creates a fake CP violation effect causing difference in ν and
ν oscillations. The higher energy spectrum of HKK near the first oscillation maximum, is in
particular sensitive to the matter effect and expected to resolve the mass hierarchy better
than 5σ level. Other degeneracies of δCP and θ23 octant or ∆m231 can also be constrained.
Non-standard neutrino interaction can cause additional matter effect and a new physics be-
yond PMNS may cause distortion in oscillation pattern. Both of these effects can be tested
by the two baseline T2HKK data.
In the following section, some of the quantitative studies are presented to demonstrate
the impact of T2HKK on the Hyper-K project.
18
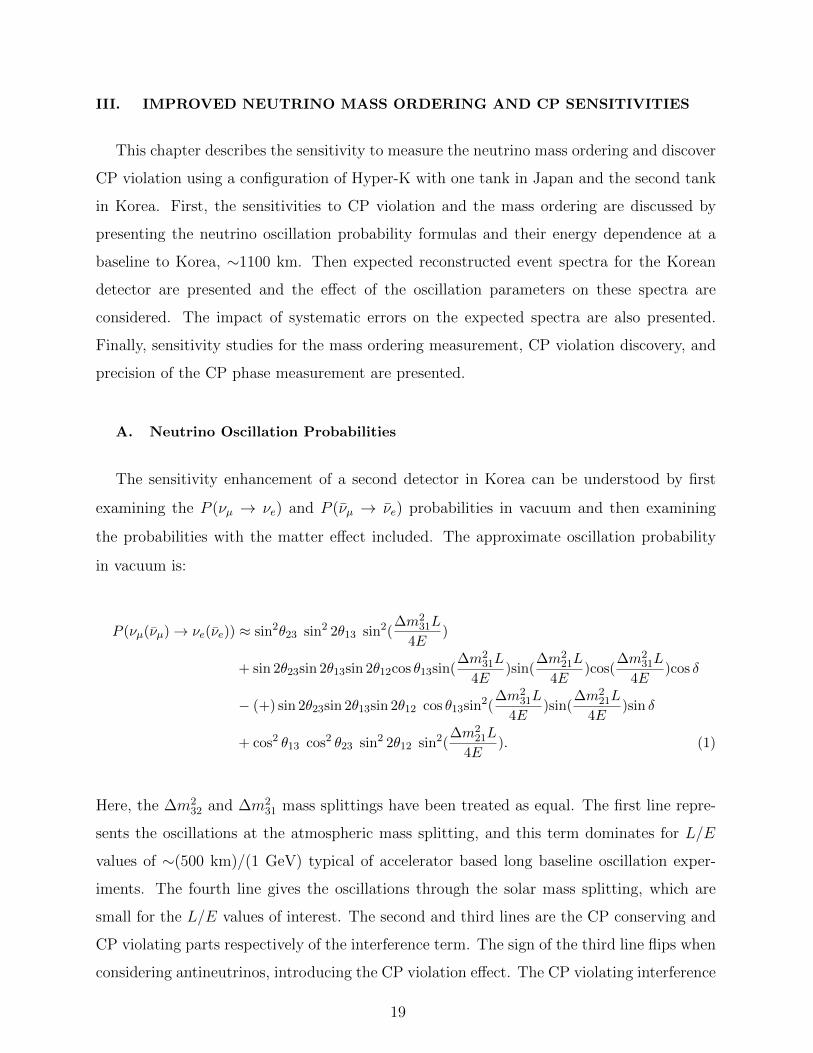
III. IMPROVED NEUTRINO MASS ORDERING AND CP SENSITIVITIES
This chapter describes the sensitivity to measure the neutrino mass ordering and discover
CP violation using a configuration of Hyper-K with one tank in Japan and the second tank
in Korea. First, the sensitivities to CP violation and the mass ordering are discussed by
presenting the neutrino oscillation probability formulas and their energy dependence at a
baseline to Korea, ∼1100 km. Then expected reconstructed event spectra for the Korean
detector are presented and the effect of the oscillation parameters on these spectra are
considered. The impact of systematic errors on the expected spectra are also presented.
Finally, sensitivity studies for the mass ordering measurement, CP violation discovery, and
precision of the CP phase measurement are presented.
A. Neutrino Oscillation Probabilities
The sensitivity enhancement of a second detector in Korea can be understood by first
examining the P (νµ → νe) and P (νµ → νe) probabilities in vacuum and then examining
the probabilities with the matter effect included. The approximate oscillation probability
in vacuum is:
P (νµ(νµ)→ νe(νe)) ≈ sin2θ23 sin2 2θ13 sin2(∆m2
31L
4E)
+ sin 2θ23sin 2θ13sin 2θ12cos θ13sin(∆m2
31L
4E)sin(
∆m221L
4E)cos(
∆m231L
4E)cos δ
− (+) sin 2θ23sin 2θ13sin 2θ12 cos θ13sin2(∆m2
31L
4E)sin(
∆m221L
4E)sin δ
+ cos2 θ13 cos2 θ23 sin2 2θ12 sin2(∆m2
21L
4E). (1)
Here, the ∆m232 and ∆m2
31 mass splittings have been treated as equal. The first line repre-
sents the oscillations at the atmospheric mass splitting, and this term dominates for L/E
values of ∼(500 km)/(1 GeV) typical of accelerator based long baseline oscillation exper-
iments. The fourth line gives the oscillations through the solar mass splitting, which are
small for the L/E values of interest. The second and third lines are the CP conserving and
CP violating parts respectively of the interference term. The sign of the third line flips when
considering antineutrinos, introducing the CP violation effect. The CP violating interference
19
(GeV)νE0.5 1 1.5 2 2.5 3
) eν→ µν
)-P(
eν→ µν
P(
-0.02
0
0.02
0.04
0.06
0.08
L=300 km
L=900 km
L=1100 km
=0.08513θ22sin
=0.523θ2sin2 eV-310×=2.532
2m∆/2π=3δ
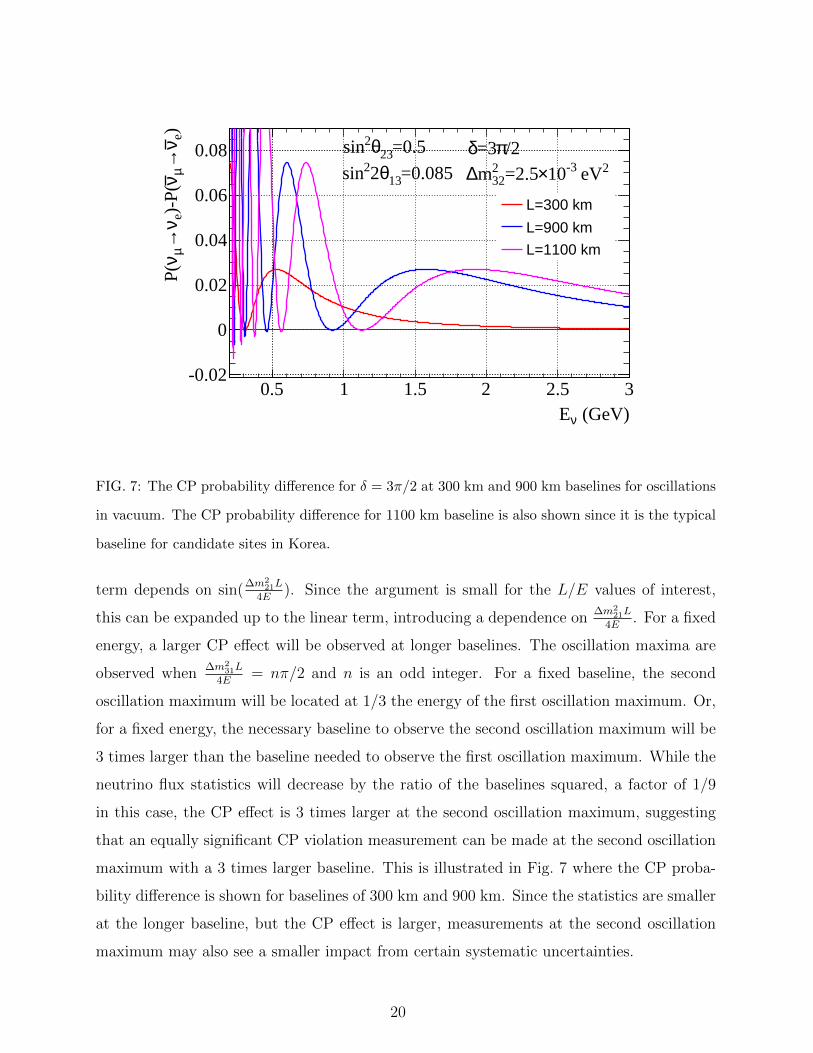
FIG. 7: The CP probability difference for δ = 3π/2 at 300 km and 900 km baselines for oscillations
in vacuum. The CP probability difference for 1100 km baseline is also shown since it is the typical
baseline for candidate sites in Korea.
term depends on sin(∆m2
21L
4E). Since the argument is small for the L/E values of interest,
this can be expanded up to the linear term, introducing a dependence on∆m2
21L
4E. For a fixed
energy, a larger CP effect will be observed at longer baselines. The oscillation maxima are
observed when∆m2
31L
4E= nπ/2 and n is an odd integer. For a fixed baseline, the second
oscillation maximum will be located at 1/3 the energy of the first oscillation maximum. Or,
for a fixed energy, the necessary baseline to observe the second oscillation maximum will be
3 times larger than the baseline needed to observe the first oscillation maximum. While the
neutrino flux statistics will decrease by the ratio of the baselines squared, a factor of 1/9
in this case, the CP effect is 3 times larger at the second oscillation maximum, suggesting
that an equally significant CP violation measurement can be made at the second oscillation
maximum with a 3 times larger baseline. This is illustrated in Fig. 7 where the CP proba-
bility difference is shown for baselines of 300 km and 900 km. Since the statistics are smaller
at the longer baseline, but the CP effect is larger, measurements at the second oscillation
maximum may also see a smaller impact from certain systematic uncertainties.
20
When neutrinos propagate in matter, the matter potential is added to the Hamiltonian
of the system, modifying the neutrino oscillation probabilities. The approximate oscillation
probability in matter can be written as [23]:
P (νµ(νµ)→ νe(νe)) ≈ sin2θ23 sin2 2θ13sin2(∆31 − (+)aL)
(∆31 − (+)aL)2∆2
31
+ sin 2θ23sin 2θ13sin 2θ12cos θ13sin(∆31 − (+)aL)
(∆31 − (+)aL)∆31
sin(aL)
aL∆21cos(∆32)cos δ
− (+) sin 2θ23sin 2θ13sin 2θ12cos θ13sin(∆31 − (+)aL)
(∆31 − (+)aL)∆31
sin(aL)
aL∆21sin(∆32)sin δ
+ cos2 θ13 cos2 θ23 sin2 2θ12sin2(aL)
(aL)2∆2
21. (2)
Here, ∆21 =∆m2
21L
4Eand ∆31 =
∆m231L
4E. The matter effect depends on a = GFNe/
√2, where
GF is Fermi’s constant and Ne is the number density of electrons in the matter. The sign
of the aL terms flip for antineutrinos, introducing an effect that can mimic CP violation
for some experimental configurations. It is clear from this formula that the introduction of
matter effects introduces a linear dependence on ∆31, allowing for the measurement of the
sign of ∆31, i.e. the mass ordering. The matter effect increases with baseline, so experiments
with longer baselines will have more sensitivity to determine the mass ordering.
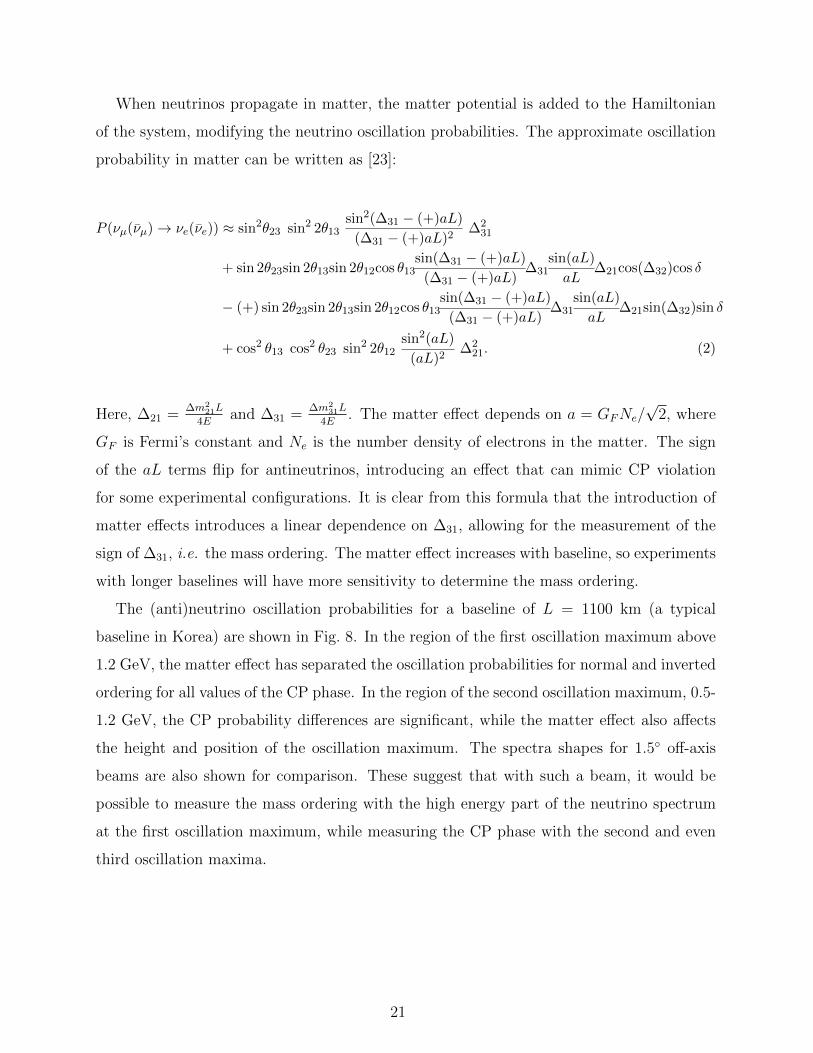
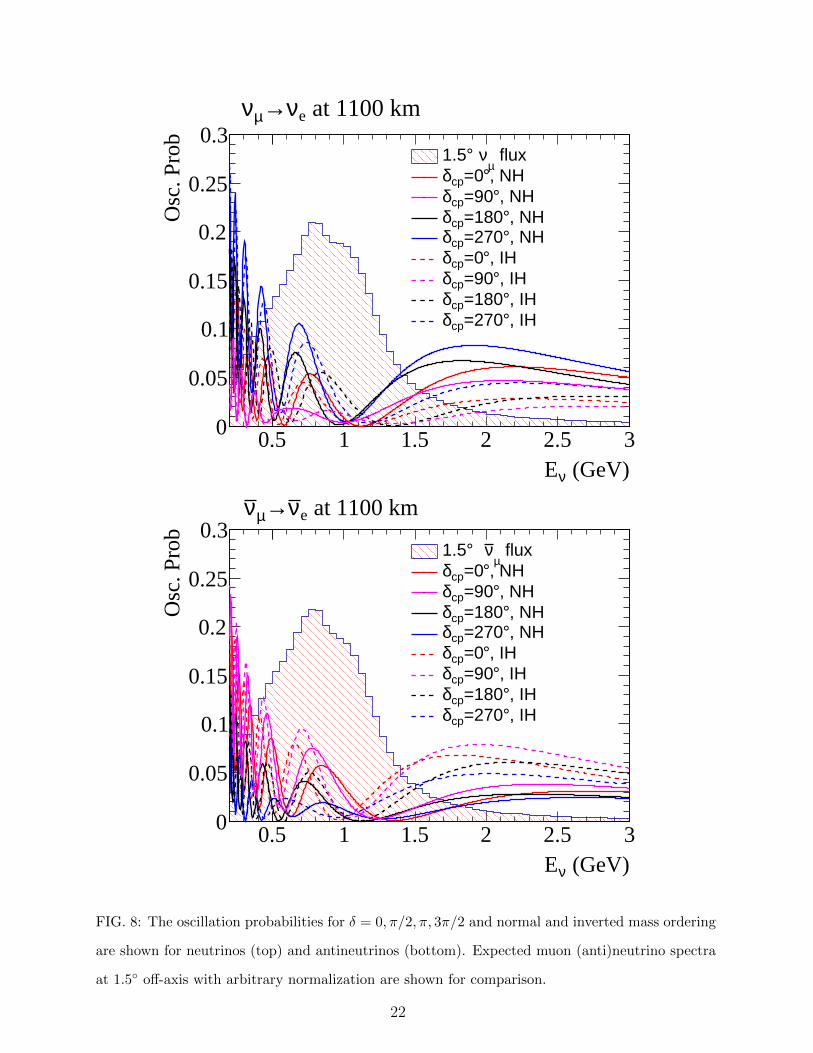
The (anti)neutrino oscillation probabilities for a baseline of L = 1100 km (a typical
baseline in Korea) are shown in Fig. 8. In the region of the first oscillation maximum above
1.2 GeV, the matter effect has separated the oscillation probabilities for normal and inverted
ordering for all values of the CP phase. In the region of the second oscillation maximum, 0.5-
1.2 GeV, the CP probability differences are significant, while the matter effect also affects
the height and position of the oscillation maximum. The spectra shapes for 1.5◦ off-axis
beams are also shown for comparison. These suggest that with such a beam, it would be
possible to measure the mass ordering with the high energy part of the neutrino spectrum
at the first oscillation maximum, while measuring the CP phase with the second and even
third oscillation maxima.
21
(GeV)νE0.5 1 1.5 2 2.5 3
Osc
. Pro
b
0
0.05
0.1
0.15
0.2
0.25
0.3 flux
µν °1.5
, NH°=0cpδ, NH°=90cpδ
, NH°=180cpδ, NH°=270cpδ
, IH°=0cpδ, IH°=90cpδ
, IH°=180cpδ, IH°=270cpδ
at 1100 kmeν→µν
(GeV)νE0.5 1 1.5 2 2.5 3
Osc
. Pro
b
0
0.05
0.1
0.15
0.2
0.25
0.3 flux
µν °1.5, NH°=0cpδ
, NH°=90cpδ, NH°=180cpδ, NH°=270cpδ
, IH°=0cpδ, IH°=90cpδ
, IH°=180cpδ, IH°=270cpδ
at 1100 kmeν→µν
FIG. 8: The oscillation probabilities for δ = 0, π/2, π, 3π/2 and normal and inverted mass ordering
are shown for neutrinos (top) and antineutrinos (bottom). Expected muon (anti)neutrino spectra
at 1.5◦ off-axis with arbitrary normalization are shown for comparison.
22
B. Event Rates at Korean Detectors
For the purpose of the sensitivity studies presented here, we consider generic detector
locations in South Korea at a baseline of 1100 km and an off-axis angle of 1.5◦, 2.0◦ or
2.5◦. The expected event rates are estimated using a NEUT [24] 5.3.2-based simulation of
the Super-K detector, where the fiducial mass has been scaled from 22.5 kton to 187 kton.
The simulated events are scaled to give good agreement with NEUT 5.1.4.2, which has been
tuned against T2K near detector data. Following the running plan of Hyper-K, an exposure
of (1.3 MW)×(10 × 107 sec) is assumed with a 3:1 ratio of antineutrino mode to neutrino
mode operation. Oscillation probabilities are calculated using Prob3++ [25], and a constant
matter density of 3.0 g/cm3 is assumed for the 1100 km baseline [26]. For each detector
configuration, reconstructed events are classified in 4 categories:
• Neutrino mode, 1Re: Single electron-like ring candidates collected in the neutrino
mode operation of the beam.
• Antineutrino mode, 1Re: Single electron-like ring candidates collected in the antineu-
trino mode operation of the beam.
• Neutrino mode, 1Rµ: Single muon-like ring candidates collected in the neutrino mode
operation of the beam.
• Antineutrino mode, 1Rµ: Single muon-like ring candidates collected in the antineu-
trino mode operation of the beam.
The selection cuts for these candidate samples are identical to the selection cuts used in re-
cent T2K oscillation measurements [27], except for the reconstructed energy, Erec <1.25 GeV
cut on the 1Re samples. This cut has been removed since the matter effect which constrains
the mass ordering is most strongly manifested in events with reconstructed energy greater
than 1.25 GeV.
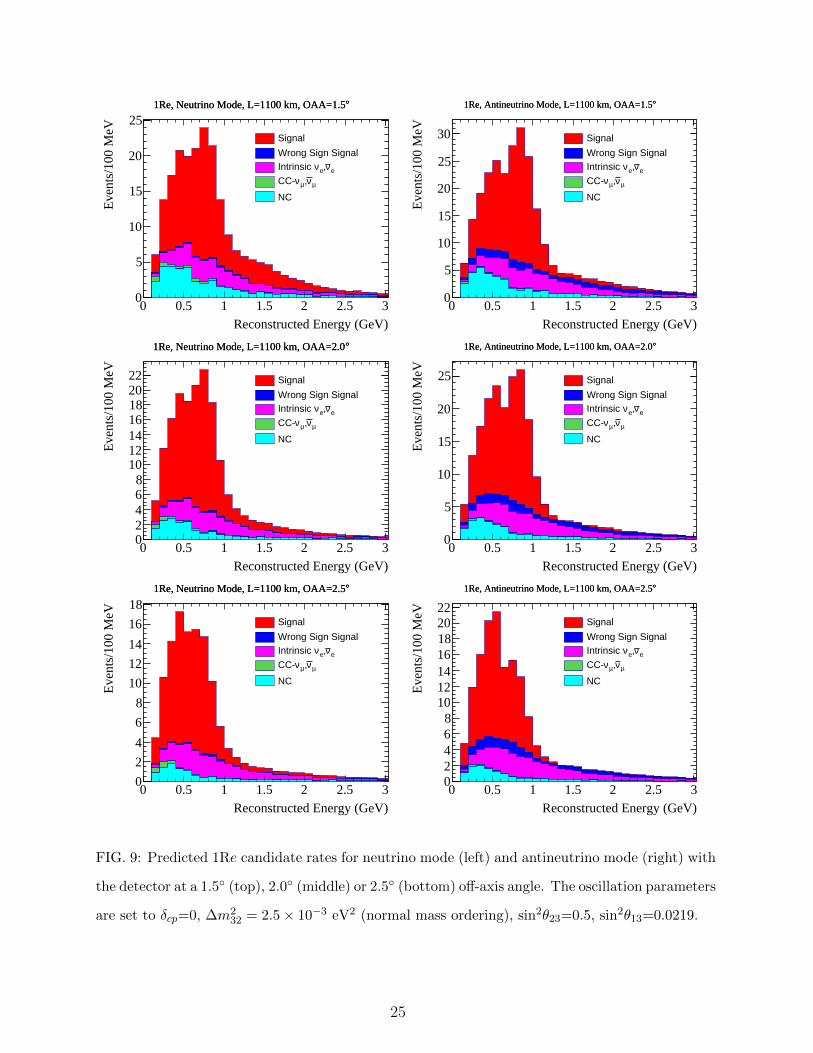
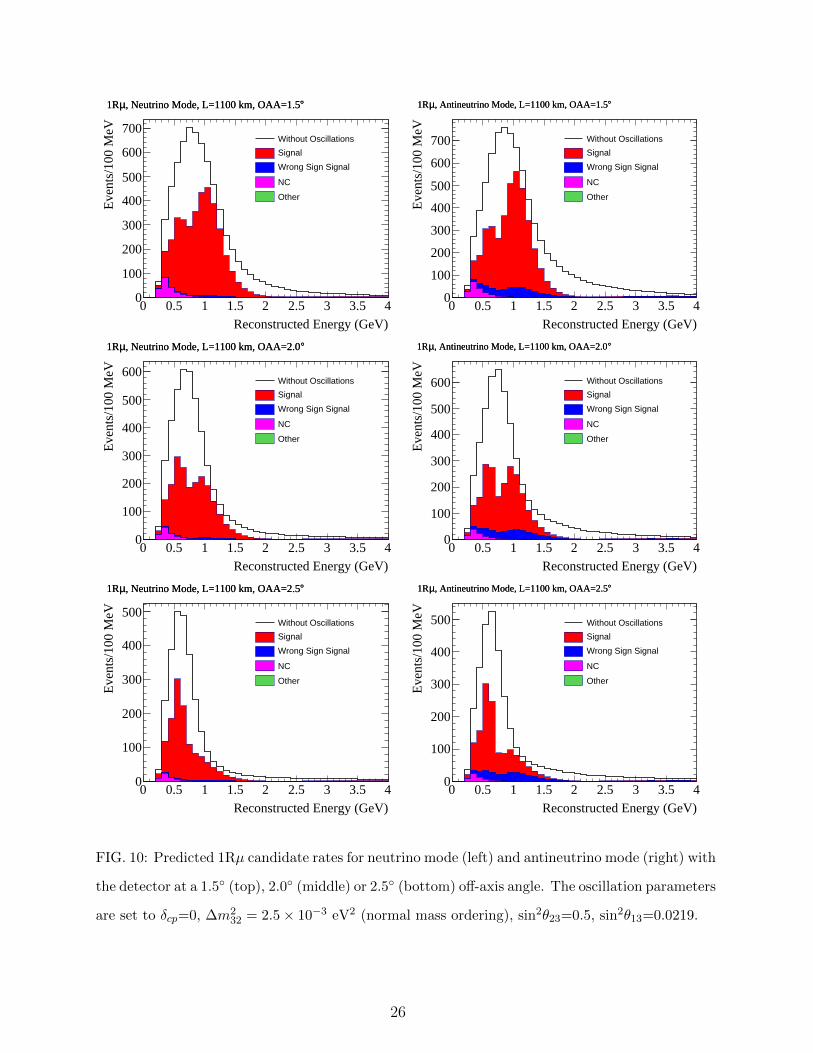
Predicted event rates for normal mass ordering and δcp=0 are shown for 1Re and 1Rµ
samples in Fig. 9/Table II and Fig. 10/Table III respectively. In Tables II, III, the predicted
event rates for the nominal Hyper-K tank location are shown for comparison. These differ
from those presented in the Hyper-K Design Report since the value for sin2 θ13 has been
updated to the 2015 PDG value, a new version of NEUT is used for the neutrino interaction
23
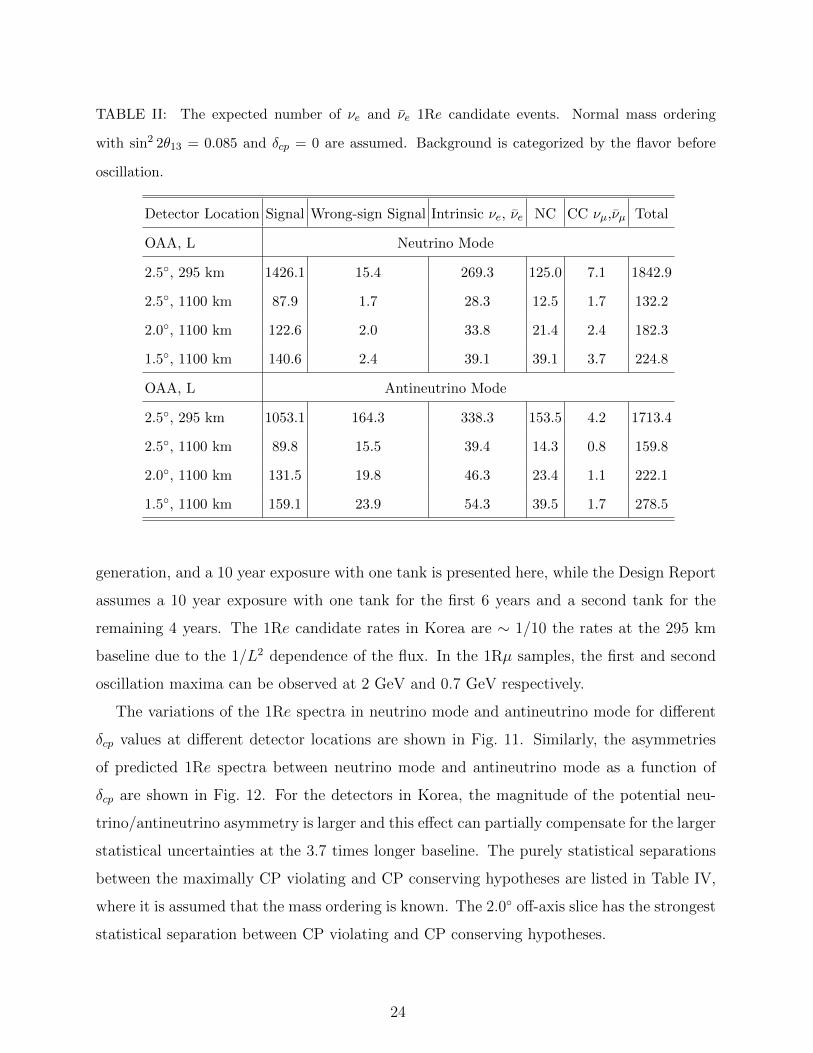
TABLE II: The expected number of νe and νe 1Re candidate events. Normal mass ordering
with sin2 2θ13 = 0.085 and δcp = 0 are assumed. Background is categorized by the flavor before
oscillation.
Detector Location Signal Wrong-sign Signal Intrinsic νe, νe NC CC νµ,νµ Total
OAA, L Neutrino Mode
2.5◦, 295 km 1426.1 15.4 269.3 125.0 7.1 1842.9
2.5◦, 1100 km 87.9 1.7 28.3 12.5 1.7 132.2
2.0◦, 1100 km 122.6 2.0 33.8 21.4 2.4 182.3
1.5◦, 1100 km 140.6 2.4 39.1 39.1 3.7 224.8
OAA, L Antineutrino Mode
2.5◦, 295 km 1053.1 164.3 338.3 153.5 4.2 1713.4
2.5◦, 1100 km 89.8 15.5 39.4 14.3 0.8 159.8
2.0◦, 1100 km 131.5 19.8 46.3 23.4 1.1 222.1
1.5◦, 1100 km 159.1 23.9 54.3 39.5 1.7 278.5
generation, and a 10 year exposure with one tank is presented here, while the Design Report
assumes a 10 year exposure with one tank for the first 6 years and a second tank for the
remaining 4 years. The 1Re candidate rates in Korea are ∼ 1/10 the rates at the 295 km
baseline due to the 1/L2 dependence of the flux. In the 1Rµ samples, the first and second
oscillation maxima can be observed at 2 GeV and 0.7 GeV respectively.
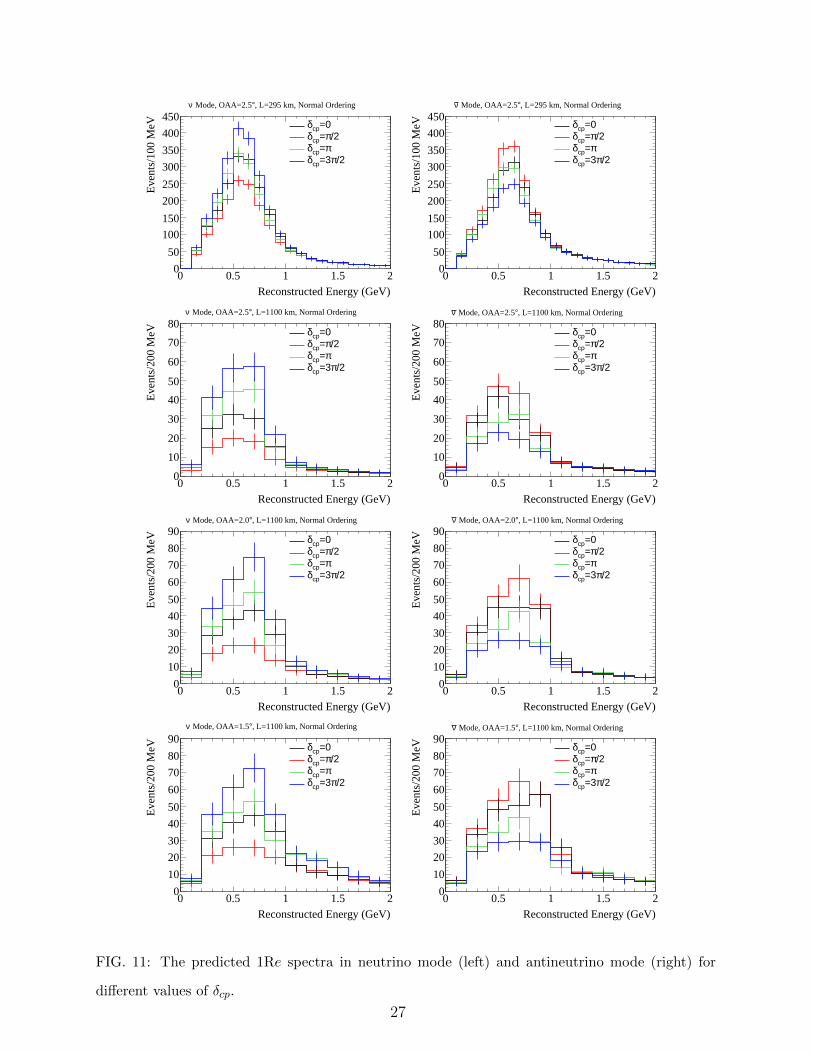
The variations of the 1Re spectra in neutrino mode and antineutrino mode for different
δcp values at different detector locations are shown in Fig. 11. Similarly, the asymmetries
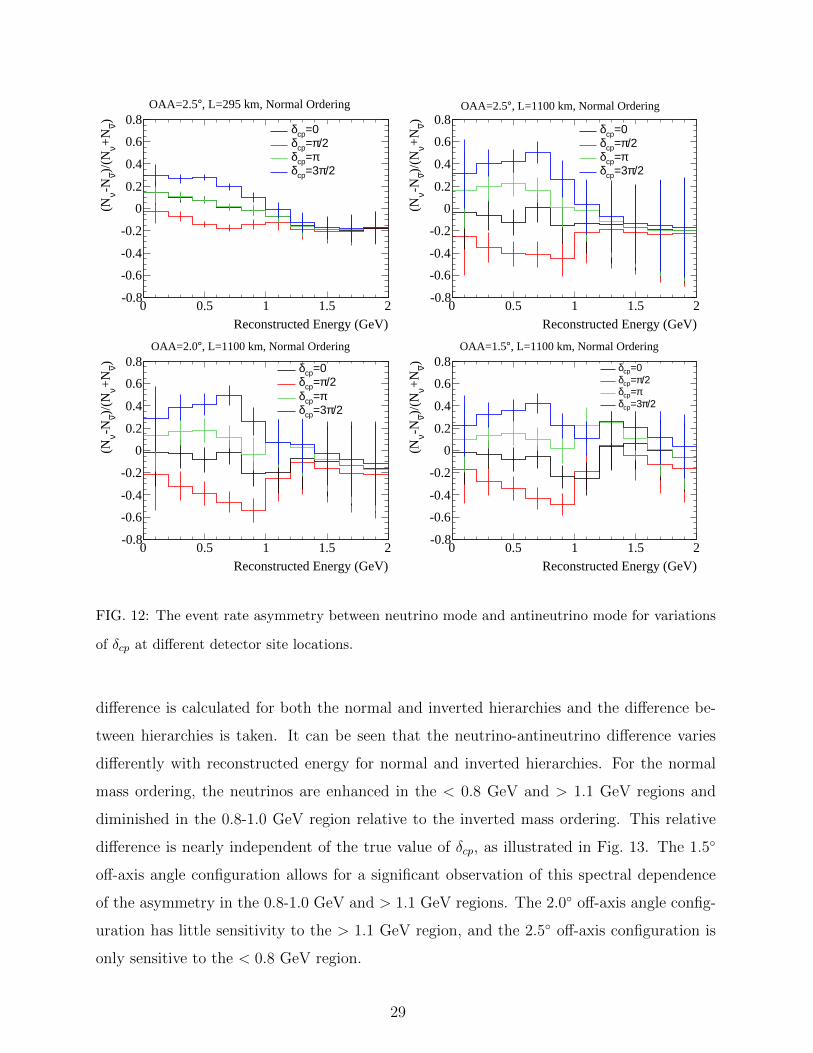
of predicted 1Re spectra between neutrino mode and antineutrino mode as a function of
δcp are shown in Fig. 12. For the detectors in Korea, the magnitude of the potential neu-
trino/antineutrino asymmetry is larger and this effect can partially compensate for the larger
statistical uncertainties at the 3.7 times longer baseline. The purely statistical separations
between the maximally CP violating and CP conserving hypotheses are listed in Table IV,
where it is assumed that the mass ordering is known. The 2.0◦ off-axis slice has the strongest
statistical separation between CP violating and CP conserving hypotheses.
24
Reconstructed Energy (GeV)0 0.5 1 1.5 2 2.5 3
Eve
nts/
100
MeV
0
5
10
15
20
25°1Re, Neutrino Mode, L=1100 km, OAA=1.5
Signal
Wrong Sign Signal
eν,eνIntrinsic
µν,µνCC-
NC
°1Re, Neutrino Mode, L=1100 km, OAA=1.5
Reconstructed Energy (GeV)0 0.5 1 1.5 2 2.5 3
Eve
nts/
100
MeV
0
5
10
15
20
25
30
°1Re, Antineutrino Mode, L=1100 km, OAA=1.5
Signal
Wrong Sign Signal
eν,eνIntrinsic
µν,µνCC-
NC
°1Re, Antineutrino Mode, L=1100 km, OAA=1.5
Reconstructed Energy (GeV)0 0.5 1 1.5 2 2.5 3
Eve
nts/
100
MeV
02468
10121416182022
°1Re, Neutrino Mode, L=1100 km, OAA=2.0
Signal
Wrong Sign Signal
eν,eνIntrinsic
µν,µνCC-
NC
°1Re, Neutrino Mode, L=1100 km, OAA=2.0
Reconstructed Energy (GeV)0 0.5 1 1.5 2 2.5 3
Eve
nts/
100
MeV
0
5
10
15
20
25
°1Re, Antineutrino Mode, L=1100 km, OAA=2.0
Signal
Wrong Sign Signal
eν,eνIntrinsic
µν,µνCC-
NC
°1Re, Antineutrino Mode, L=1100 km, OAA=2.0
Reconstructed Energy (GeV)0 0.5 1 1.5 2 2.5 3
Eve
nts/
100
MeV
0
2
4
6
8
10
12
14
16
18°1Re, Neutrino Mode, L=1100 km, OAA=2.5
Signal
Wrong Sign Signal
eν,eνIntrinsic
µν,µνCC-
NC
°1Re, Neutrino Mode, L=1100 km, OAA=2.5
Reconstructed Energy (GeV)0 0.5 1 1.5 2 2.5 3
Eve
nts/
100
MeV
02468
10121416182022
°1Re, Antineutrino Mode, L=1100 km, OAA=2.5
Signal
Wrong Sign Signal
eν,eνIntrinsic
µν,µνCC-
NC
°1Re, Antineutrino Mode, L=1100 km, OAA=2.5
FIG. 9: Predicted 1Re candidate rates for neutrino mode (left) and antineutrino mode (right) with
the detector at a 1.5◦ (top), 2.0◦ (middle) or 2.5◦ (bottom) off-axis angle. The oscillation parameters
are set to δcp=0, ∆m232 = 2.5× 10⁻³ eV2 (normal mass ordering), sin2θ23=0.5, sin2θ13=0.0219.
25
Reconstructed Energy (GeV)0 0.5 1 1.5 2 2.5 3 3.5 4
Eve
nts/
100
MeV
0
100
200
300
400
500
600
700
°, Neutrino Mode, L=1100 km, OAA=1.5µ1R
Without Oscillations
Signal
Wrong Sign Signal
NC
Other
°, Neutrino Mode, L=1100 km, OAA=1.5µ1R
Reconstructed Energy (GeV)0 0.5 1 1.5 2 2.5 3 3.5 4
Eve
nts/
100
MeV
0
100
200
300
400
500
600
700
°, Antineutrino Mode, L=1100 km, OAA=1.5µ1R
Without Oscillations
Signal
Wrong Sign Signal
NC
Other
°, Antineutrino Mode, L=1100 km, OAA=1.5µ1R
Reconstructed Energy (GeV)0 0.5 1 1.5 2 2.5 3 3.5 4
Eve
nts/
100
MeV
0
100
200
300
400
500
600
°, Neutrino Mode, L=1100 km, OAA=2.0µ1R
Without Oscillations
Signal
Wrong Sign Signal
NC
Other
°, Neutrino Mode, L=1100 km, OAA=2.0µ1R
Reconstructed Energy (GeV)0 0.5 1 1.5 2 2.5 3 3.5 4
Eve
nts/
100
MeV
0
100
200
300
400
500
600
°, Antineutrino Mode, L=1100 km, OAA=2.0µ1R
Without Oscillations
Signal
Wrong Sign Signal
NC
Other
°, Antineutrino Mode, L=1100 km, OAA=2.0µ1R
Reconstructed Energy (GeV)0 0.5 1 1.5 2 2.5 3 3.5 4
Eve
nts/
100
MeV
0
100
200
300
400
500
°, Neutrino Mode, L=1100 km, OAA=2.5µ1R
Without Oscillations
Signal
Wrong Sign Signal
NC
Other
°, Neutrino Mode, L=1100 km, OAA=2.5µ1R
Reconstructed Energy (GeV)0 0.5 1 1.5 2 2.5 3 3.5 4
Eve
nts/
100
MeV
0
100
200
300
400
500
°, Antineutrino Mode, L=1100 km, OAA=2.5µ1R
Without Oscillations
Signal
Wrong Sign Signal
NC
Other
°, Antineutrino Mode, L=1100 km, OAA=2.5µ1R
FIG. 10: Predicted 1Rµ candidate rates for neutrino mode (left) and antineutrino mode (right) with
the detector at a 1.5◦ (top), 2.0◦ (middle) or 2.5◦ (bottom) off-axis angle. The oscillation parameters
are set to δcp=0, ∆m232 = 2.5× 10⁻³ eV2 (normal mass ordering), sin2θ23=0.5, sin2θ13=0.0219.
26
Reconstructed Energy (GeV)0 0.5 1 1.5 2
Eve
nts/
100
MeV
0
50
100
150
200
250
300
350
400
450=0cpδ
/2π=cpδπ=cpδ
/2π=3cpδ
, L=295 km, Normal Ordering° Mode, OAA=2.5ν
Reconstructed Energy (GeV)0 0.5 1 1.5 2
Eve
nts/
100
MeV
0
50
100
150
200
250
300
350
400
450=0cpδ
/2π=cpδπ=cpδ
/2π=3cpδ
, L=295 km, Normal Ordering° Mode, OAA=2.5ν
Reconstructed Energy (GeV)0 0.5 1 1.5 2
Eve
nts/
200
MeV
0
10
20
30
40
50
60
70
80=0cpδ
/2π=cpδπ=cpδ
/2π=3cpδ
, L=1100 km, Normal Ordering° Mode, OAA=2.5ν
Reconstructed Energy (GeV)0 0.5 1 1.5 2
Eve
nts/
200
MeV
0
10
20
30
40
50
60
70
80=0cpδ
/2π=cpδπ=cpδ
/2π=3cpδ
, L=1100 km, Normal Ordering° Mode, OAA=2.5ν
Reconstructed Energy (GeV)0 0.5 1 1.5 2
Eve
nts/
200
MeV
0
10
20
30
40
50
60
70
80
90=0cpδ
/2π=cpδπ=cpδ
/2π=3cpδ
, L=1100 km, Normal Ordering° Mode, OAA=2.0ν
Reconstructed Energy (GeV)0 0.5 1 1.5 2
Eve
nts/
200
MeV
0
10
20
30
40
50
60
70
80
90=0cpδ
/2π=cpδπ=cpδ
/2π=3cpδ
, L=1100 km, Normal Ordering° Mode, OAA=2.0ν
Reconstructed Energy (GeV)0 0.5 1 1.5 2
Eve
nts/
200
MeV
0
10
20
30
40
50
60
70
80
90=0cpδ
/2π=cpδπ=cpδ
/2π=3cpδ
, L=1100 km, Normal Ordering° Mode, OAA=1.5ν
Reconstructed Energy (GeV)0 0.5 1 1.5 2
Eve
nts/
200
MeV
0
10
20
30
40
50
60
70
80
90=0cpδ
/2π=cpδπ=cpδ
/2π=3cpδ
, L=1100 km, Normal Ordering° Mode, OAA=1.5ν
FIG. 11: The predicted 1Re spectra in neutrino mode (left) and antineutrino mode (right) for
different values of δcp.
27
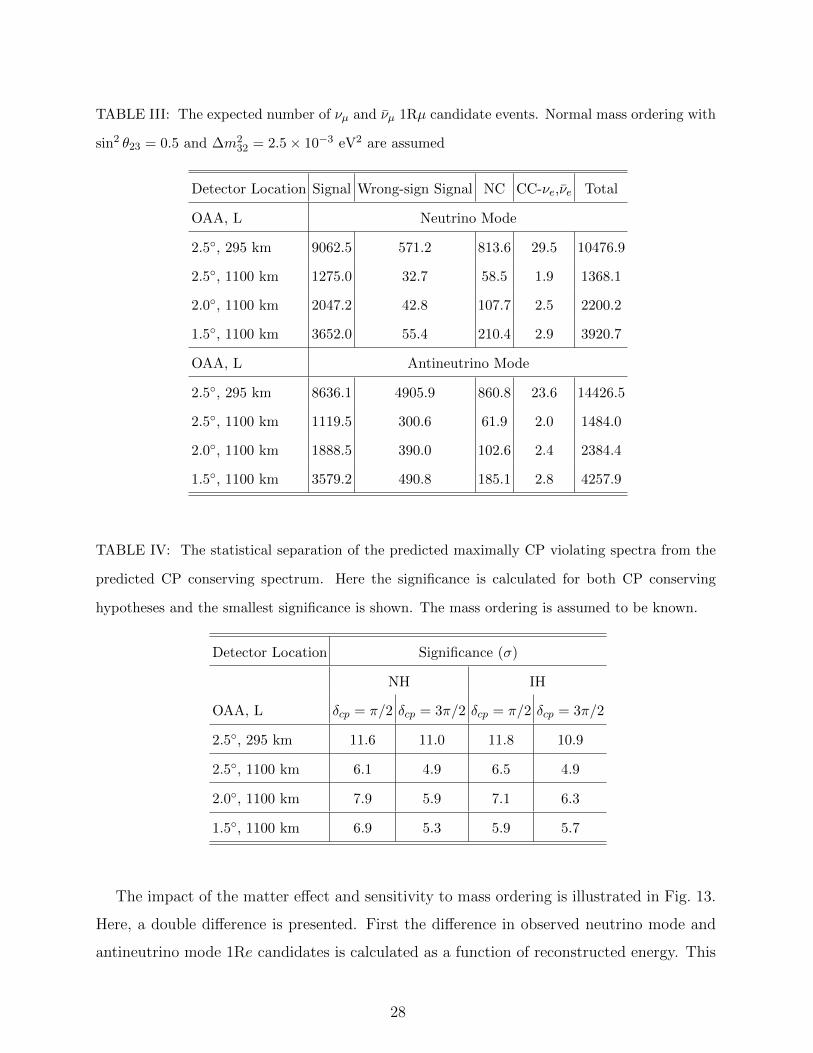
TABLE III: The expected number of νµ and νµ 1Rµ candidate events. Normal mass ordering with
sin2 θ23 = 0.5 and ∆m232 = 2.5× 10⁻³ eV2 are assumed
Detector Location Signal Wrong-sign Signal NC CC-νe,νe Total
OAA, L Neutrino Mode
2.5◦, 295 km 9062.5 571.2 813.6 29.5 10476.9
2.5◦, 1100 km 1275.0 32.7 58.5 1.9 1368.1
2.0◦, 1100 km 2047.2 42.8 107.7 2.5 2200.2
1.5◦, 1100 km 3652.0 55.4 210.4 2.9 3920.7
OAA, L Antineutrino Mode
2.5◦, 295 km 8636.1 4905.9 860.8 23.6 14426.5
2.5◦, 1100 km 1119.5 300.6 61.9 2.0 1484.0
2.0◦, 1100 km 1888.5 390.0 102.6 2.4 2384.4
1.5◦, 1100 km 3579.2 490.8 185.1 2.8 4257.9
TABLE IV: The statistical separation of the predicted maximally CP violating spectra from the
predicted CP conserving spectrum. Here the significance is calculated for both CP conserving
hypotheses and the smallest significance is shown. The mass ordering is assumed to be known.
Detector Location Significance (σ)
NH IH
OAA, L δcp = π/2 δcp = 3π/2 δcp = π/2 δcp = 3π/2
2.5◦, 295 km 11.6 11.0 11.8 10.9
2.5◦, 1100 km 6.1 4.9 6.5 4.9
2.0◦, 1100 km 7.9 5.9 7.1 6.3
1.5◦, 1100 km 6.9 5.3 5.9 5.7
The impact of the matter effect and sensitivity to mass ordering is illustrated in Fig. 13.
Here, a double difference is presented. First the difference in observed neutrino mode and
antineutrino mode 1Re candidates is calculated as a function of reconstructed energy. This
28
Reconstructed Energy (GeV)0 0.5 1 1.5 2
) ν+
Nν
)/(N
ν-N ν
(N
-0.8
-0.6
-0.4
-0.2
0
0.2
0.4
0.6
0.8=0cpδ
/2π=cpδπ=cpδ
/2π=3cpδ
, L=295 km, Normal Ordering°OAA=2.5
Reconstructed Energy (GeV)0 0.5 1 1.5 2
) ν+
Nν
)/(N
ν-N ν
(N
-0.8
-0.6
-0.4
-0.2
0
0.2
0.4
0.6
0.8=0cpδ
/2π=cpδπ=cpδ
/2π=3cpδ
, L=1100 km, Normal Ordering°OAA=2.5
Reconstructed Energy (GeV)0 0.5 1 1.5 2
) ν+
Nν
)/(N
ν-N ν
(N
-0.8
-0.6
-0.4
-0.2
0
0.2
0.4
0.6
0.8 =0cpδ/2π=cpδ
π=cpδ/2π=3cpδ
, L=1100 km, Normal Ordering°OAA=2.0
Reconstructed Energy (GeV)0 0.5 1 1.5 2
) ν+
Nν
)/(N
ν-N ν
(N
-0.8
-0.6
-0.4
-0.2
0
0.2
0.4
0.6
0.8 =0cpδ/2π=cpδ
π=cpδ/2π=3cpδ
, L=1100 km, Normal Ordering°OAA=1.5
FIG. 12: The event rate asymmetry between neutrino mode and antineutrino mode for variations
of δcp at different detector site locations.
difference is calculated for both the normal and inverted hierarchies and the difference be-
tween hierarchies is taken. It can be seen that the neutrino-antineutrino difference varies
differently with reconstructed energy for normal and inverted hierarchies. For the normal
mass ordering, the neutrinos are enhanced in the < 0.8 GeV and > 1.1 GeV regions and
diminished in the 0.8-1.0 GeV region relative to the inverted mass ordering. This relative
difference is nearly independent of the true value of δcp, as illustrated in Fig. 13. The 1.5◦
off-axis angle configuration allows for a significant observation of this spectral dependence
of the asymmetry in the 0.8-1.0 GeV and > 1.1 GeV regions. The 2.0◦ off-axis angle config-
uration has little sensitivity to the > 1.1 GeV region, and the 2.5◦ off-axis configuration is
only sensitive to the < 0.8 GeV region.
29
Reconstructed Energy (GeV)0 0.2 0.4 0.6 0.8 1 1.2 1.4 1.6 1.8 2
IH] ν-N ν
-[N
NH
] ν-N ν
[N
-25-20-15-10
-505
10152025
=0cpδ/2π=cpδ
π=cpδ/2π=3cpδ
, L=1100 km°OAA=1.5
Reconstructed Energy (GeV)0 0.2 0.4 0.6 0.8 1 1.2 1.4 1.6 1.8 2
IH] ν-N ν
-[N
NH
] ν-N ν
[N
-25-20-15-10
-505
10152025
=0cpδ/2π=cpδ
π=cpδ/2π=3cpδ
, L=1100 km°OAA=2.0
Reconstructed Energy (GeV)0 0.2 0.4 0.6 0.8 1 1.2 1.4 1.6 1.8 2
IH] ν-N ν
-[N
NH
] ν-N ν
[N
-25-20-15-10
-505
10152025
=0cpδ/2π=cpδ
π=cpδ/2π=3cpδ
, L=1100 km°OAA=2.5
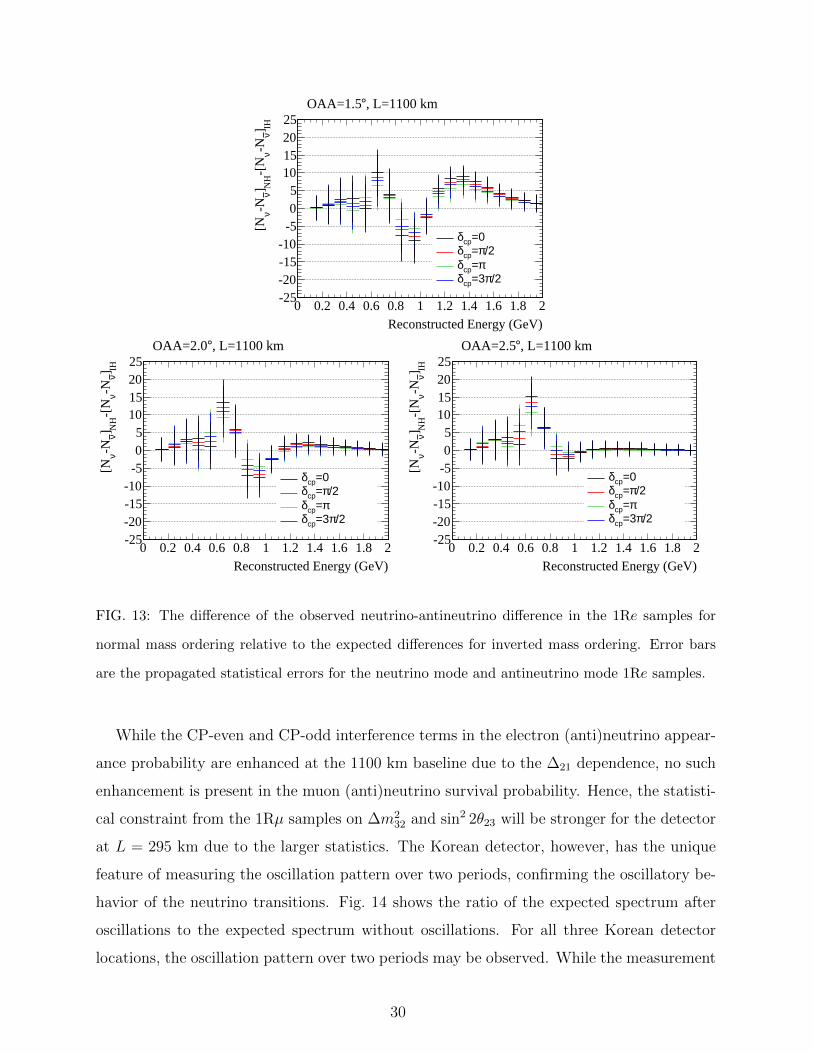
FIG. 13: The difference of the observed neutrino-antineutrino difference in the 1Re samples for
normal mass ordering relative to the expected differences for inverted mass ordering. Error bars
are the propagated statistical errors for the neutrino mode and antineutrino mode 1Re samples.
While the CP-even and CP-odd interference terms in the electron (anti)neutrino appear-
ance probability are enhanced at the 1100 km baseline due to the ∆21 dependence, no such
enhancement is present in the muon (anti)neutrino survival probability. Hence, the statisti-
cal constraint from the 1Rµ samples on ∆m232 and sin2 2θ23 will be stronger for the detector
at L = 295 km due to the larger statistics. The Korean detector, however, has the unique
feature of measuring the oscillation pattern over two periods, confirming the oscillatory be-
havior of the neutrino transitions. Fig. 14 shows the ratio of the expected spectrum after
oscillations to the expected spectrum without oscillations. For all three Korean detector
locations, the oscillation pattern over two periods may be observed. While the measurement
30
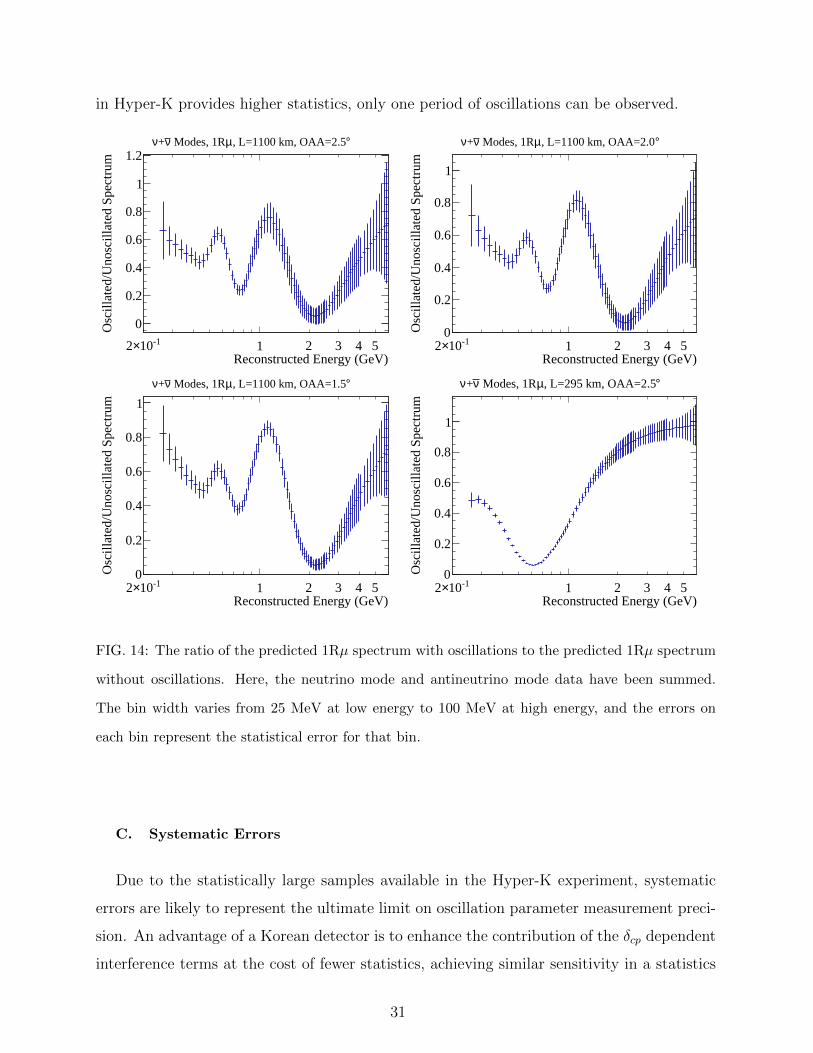
in Hyper-K provides higher statistics, only one period of oscillations can be observed.
Reconstructed Energy (GeV)
-110×2 1 2 3 4 5
Osc
illat
ed/U
nosc
illat
ed S
pect
rum
0
0.2
0.4
0.6
0.8
1
1.2°, L=1100 km, OAA=2.5µ Modes, 1Rν+ν
Reconstructed Energy (GeV)
-110×2 1 2 3 4 5
Osc
illat
ed/U
nosc
illat
ed S
pect
rum
0
0.2
0.4
0.6
0.8
1
°, L=1100 km, OAA=2.0µ Modes, 1Rν+ν
Reconstructed Energy (GeV)
-110×2 1 2 3 4 5
Osc
illat
ed/U
nosc
illat
ed S
pect
rum
0
0.2
0.4
0.6
0.8
1
°, L=1100 km, OAA=1.5µ Modes, 1Rν+ν
Reconstructed Energy (GeV)
-110×2 1 2 3 4 5
Osc
illat
ed/U
nosc
illat
ed S
pect
rum
0
0.2
0.4
0.6
0.8
1
°, L=295 km, OAA=2.5µ Modes, 1Rν+ν
FIG. 14: The ratio of the predicted 1Rµ spectrum with oscillations to the predicted 1Rµ spectrum
without oscillations. Here, the neutrino mode and antineutrino mode data have been summed.
The bin width varies from 25 MeV at low energy to 100 MeV at high energy, and the errors on
each bin represent the statistical error for that bin.
C. Systematic Errors
Due to the statistically large samples available in the Hyper-K experiment, systematic
errors are likely to represent the ultimate limit on oscillation parameter measurement preci-
sion. An advantage of a Korean detector is to enhance the contribution of the δcp dependent
interference terms at the cost of fewer statistics, achieving similar sensitivity in a statistics
31
limited measurement. To evaluate the impact of the Korean detector on the Hyper-K sensi-
tivities, it is necessary to implement a systematic error model that takes into account what
are expected to be the dominant systematic errors for Hyper-K. The systematic error model
should also account for any new systematic errors introduced by having a detector in Korea.
The systematic errors considered for the sensitivity studies presented in this paper are:
• σνe/σνµ and σνe/σνµ - The interaction cross sections for νe and νe are not currently
precisely measured with near detector data, although they may be more precisely
measured in the Hyper-K era. When extrapolating the measured νµ and νµ rates from
the near detectors, it is necessary to assign and uncertainty on the interaction cross
section ratios σνe/σνµ and σνe/σνµ . Here the T2K approach based on the work of Day
& McFarland [28] is taken. Separate normalization parameters are assigned to vary
σνe and σνe . The correlation between these parameters is assigned assuming there
is a 2% systematic effect that is uncorrelated between neutrinos and antineutrinos
and an additional 2% systematic effect with anticorrelation between neutrinos and
antineutrinos.
• Energy scale at the far detectors - The energy scale at Super-K is calibrated
using samples of Michel electrons, π0s and stopping cosmic muons. In T2K oscillation
analyses, the energy scale error is found to be 2.4% [27]. Here a 2.4% energy scale
uncertainty is applied to the reconstructed energy for events in Hyper-K and the
Korean detector. Independent parameters with no correlation are used for Hyper-
K and the Korean detector. 100% correlation between the 1Rµ and 1Re samples is
assumed.
• Matter density - For results presented here, a constant matter density of 3.0 g/cm3
is assumed for the path to the Korean detector. An uncertainty of 6% is assigned
based on previous estimates [26].
• The NCπ+ background - NCπ+ interactions are a significant background in the
1Rµ samples. Based on the approach taken by T2K [27], a 30% error is applied here.
• The intrinsic νe(νe) and NCπ0 backgrounds - The backgrounds for the 1Re sam-
ples are the intrinsic νe(νe) in the beam and NCπ0 interactions mistaken for an elec-
tron. It is expected that these backgrounds will be measured by an intermediate water
32
Cherenkov detector with similar νe(νe) and total fluxes to the far detector fluxes. Stud-
ies of this measurement with the NuPRISM detector show an expected statistical error
of 3%. A total error of 5% is considered to account for uncertainties in the different
efficiency and fluxes between the near and far detectors. 100% correlation is assumed
between Hyper-K and the Korean detector, but no correlation is assumed between the
neutrino and antineutrino beam modes.
• The CC non-quasielastic fraction - The fraction of non-quasielastic interactions in
the candidates samples affects the predicted normalization and reconstructed energy
distribution. In T2K near detector fits, the normalization of the non-quasielastic 2p-
2h component of the cross section is fitted with a 20% error. Here a 20% error is
applied to the normalization of the non-quasielastic interactions. An anticorrelated
parameter is applied to the quasielastic interactions, and its error is chosen such that
the normalization of the unoscillated event rate is conserved for variations of these
parameters. This approach models the effect of the near detector constraint.
• Near to far extrapolation - The T2K oscillation analysis [27] includes an uncer-
tainty from the flux and cross section model parameters that are constrained by near
detector data. This error includes the near detector measurement error and extrap-
olation uncertainties in the flux and cross section models that arise due to different
neutrino spectra at the near and far detectors. In principle, the extrapolation er-
ror includes the effect of the previously described uncertainty on the non-quasielastic
fraction. To model this uncertainty, the T2K errors are applied as an overall uncer-
tainty on the charged current event rate. To avoid double counting the error on the
non-quasielastic fraction, the T2K errors are corrected by subtracting in quadrature
the normalization uncertainty that is explicitly calculated from the non-quasielastic
uncertainty.
• Far detector modeling - In addition to the energy scale uncertainty, there are uncer-
tainties related to the modeling of efficiencies in the far detector. This uncertainty is
estimated based on the uncertainty evaluated for T2K. Since the far detector efficiency
model is tuned using atmospheric neutrino control samples, it is assumed that the un-
certainty will be reduced with the larger sample of atmospheric neutrinos available in
Hyper-K. For the studies presented here, the assumption is that 50% of the error is
33
reduced by a factor of 1/√
8.3, where 8.3 is the fiducial mass ratio between Hyper-K
and Super-K. The remaining 50% of the error remains unchanged under the assump-
tion the perfect agreement between the detector model and control samples may not
be achieved and systematic errors may be applied to cover any disagreement. For this
error source, there are no correlations between Hyper-K and the Korean detector.
For the purpose of this document, the above systematic error model is used in place of the
model adopted for the Hyper-K Design Report. This is done because the systematic errors
used in the Hyper-K design report are based on the T2K systematic error estimate for a
2.5◦ off-axis angle flux and a 1Re sample with a Erec < 1.25 GeV cut applied. The T2K
systematic error model has not yet been applied to the other off-axis angle positions and
1Re samples with the reconstructed energy cut removed.
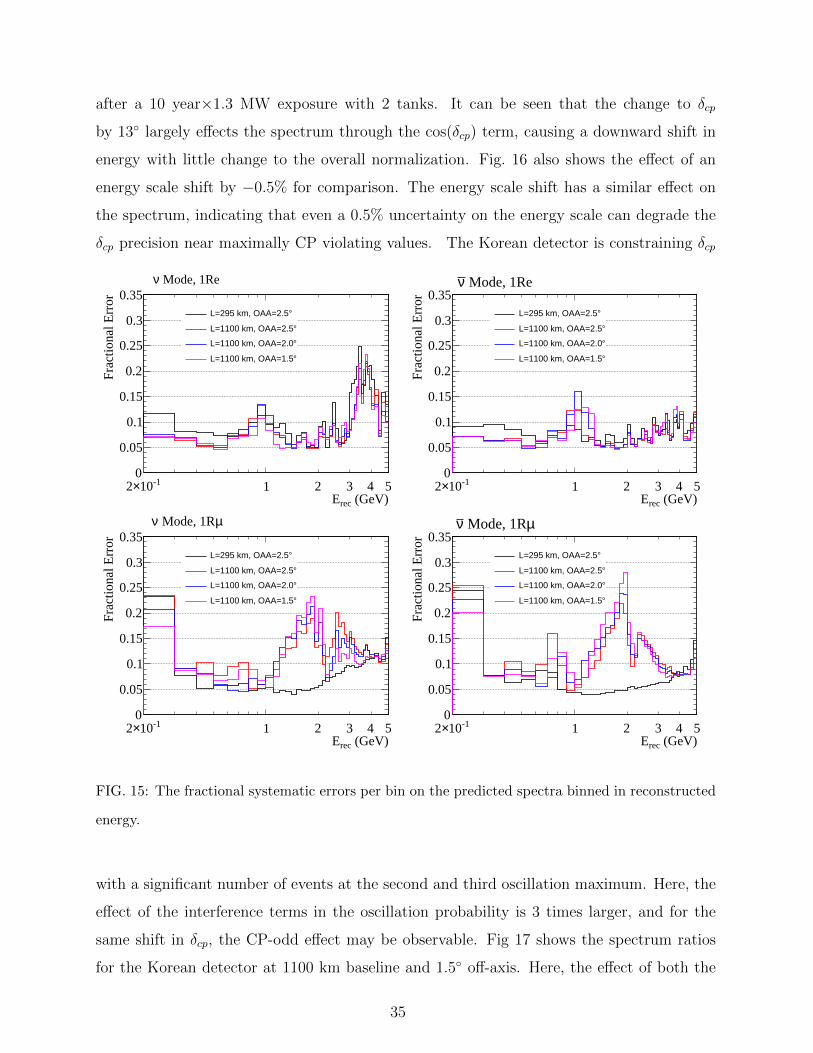
The effect of systematic errors propagated to the normalization uncertainties on the 1Rµ
and 1Re samples are summarized in Table V. The normalization uncertainties for individual
samples are in the 4-5% range. These uncertainties are slightly more conservative than those
presented in the Hyper-K design report, which included a total systematic error between
3% and 4% depending on the sample. The uncertainties for the more on-axis detector
locations appear marginally smaller because the broader spectrum tends to average over
shape uncertainties more. The fractional uncertainties as a function of reconstructed energy
are shown in Fig. 15. Here, the most prominent feature is the large uncertainty in the 1-
3 GeV region of the 1Rµ samples for the detector at L = 1100 km. This energy range is the
location of the first oscillation maximum and the large uncertainty arises from energy scale
and non-quasielastic fraction uncertainties that can cause feed-down or feed-up (in the case
of energy scale) into the region of the oscillation maximum.
The relationship between systematic uncertainties and the physics sensitivity with a Ko-
rean detector can be better understood by investigating a specific measurement, the precision
measurement of δcp when δcp is near a maximally CP violating value of π/2 or 3π/2. Near
these values, the derivative of sin(δcp) approaches zero, degrading the sensitivity to the CP
odd term in the oscillation probability. Here, the CP even term, which depends on cos(δcp)
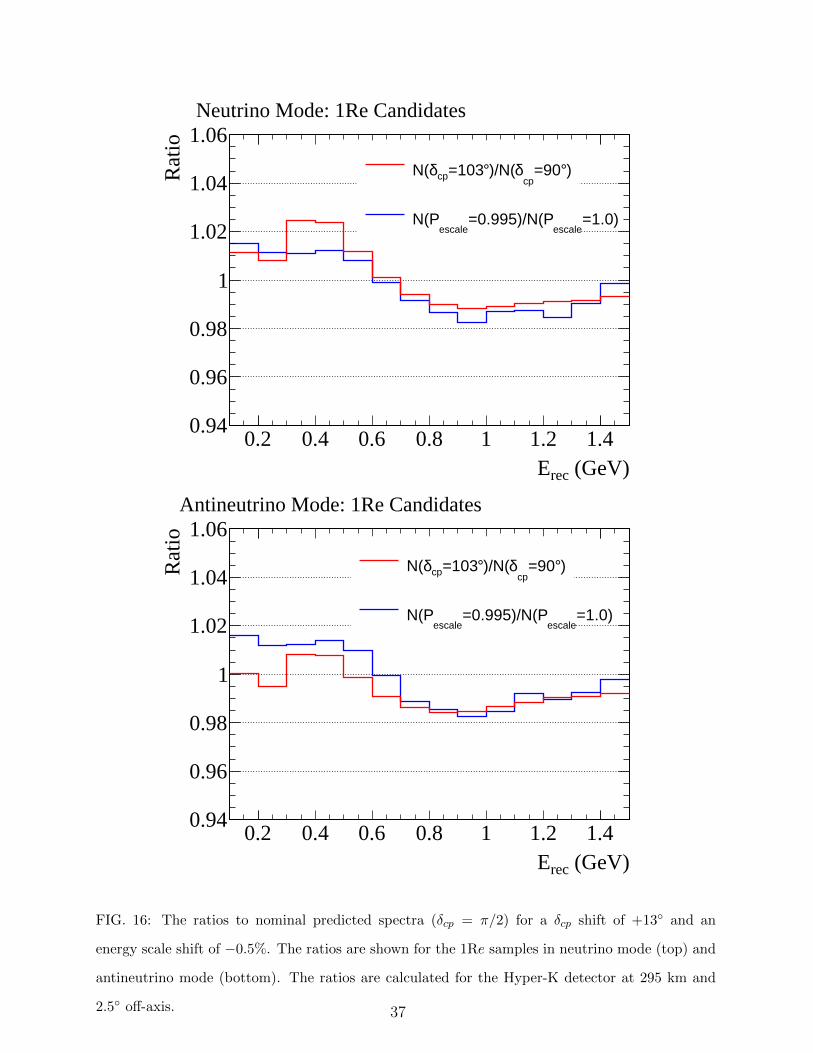
may contribute to the precision measurement of the phase. Fig. 16 shows the changes to
the spectra for a change in a δcp by +13◦ from an initial value of π/2 for the Hyper-K
detector. Here, 13◦ is chosen since it is expected to be the ultimate precision of Hyper-K
34
after a 10 year×1.3 MW exposure with 2 tanks. It can be seen that the change to δcp
by 13◦ largely effects the spectrum through the cos(δcp) term, causing a downward shift in
energy with little change to the overall normalization. Fig. 16 also shows the effect of an
energy scale shift by −0.5% for comparison. The energy scale shift has a similar effect on
the spectrum, indicating that even a 0.5% uncertainty on the energy scale can degrade the
δcp precision near maximally CP violating values. The Korean detector is constraining δcp
(GeV)recE-110×2 1 2 3 4 5
Frac
tiona
l Err
or
0
0.05
0.1
0.15
0.2
0.25
0.3
0.35°L=295 km, OAA=2.5
°L=1100 km, OAA=2.5
°L=1100 km, OAA=2.0
°L=1100 km, OAA=1.5
Mode, 1Reν
(GeV)recE-110×2 1 2 3 4 5
Frac
tiona
l Err
or
0
0.05
0.1
0.15
0.2
0.25
0.3
0.35°L=295 km, OAA=2.5
°L=1100 km, OAA=2.5
°L=1100 km, OAA=2.0
°L=1100 km, OAA=1.5
Mode, 1Reν
(GeV)recE-110×2 1 2 3 4 5
Frac
tiona
l Err
or
0
0.05
0.1
0.15
0.2
0.25
0.3
0.35°L=295 km, OAA=2.5
°L=1100 km, OAA=2.5
°L=1100 km, OAA=2.0
°L=1100 km, OAA=1.5
µ Mode, 1Rν
(GeV)recE-110×2 1 2 3 4 5
Frac
tiona
l Err
or
0
0.05
0.1
0.15
0.2
0.25
0.3
0.35°L=295 km, OAA=2.5
°L=1100 km, OAA=2.5
°L=1100 km, OAA=2.0
°L=1100 km, OAA=1.5
µ Mode, 1Rν
FIG. 15: The fractional systematic errors per bin on the predicted spectra binned in reconstructed
energy.
with a significant number of events at the second and third oscillation maximum. Here, the
effect of the interference terms in the oscillation probability is 3 times larger, and for the
same shift in δcp, the CP-odd effect may be observable. Fig 17 shows the spectrum ratios
for the Korean detector at 1100 km baseline and 1.5◦ off-axis. Here, the effect of both the
35
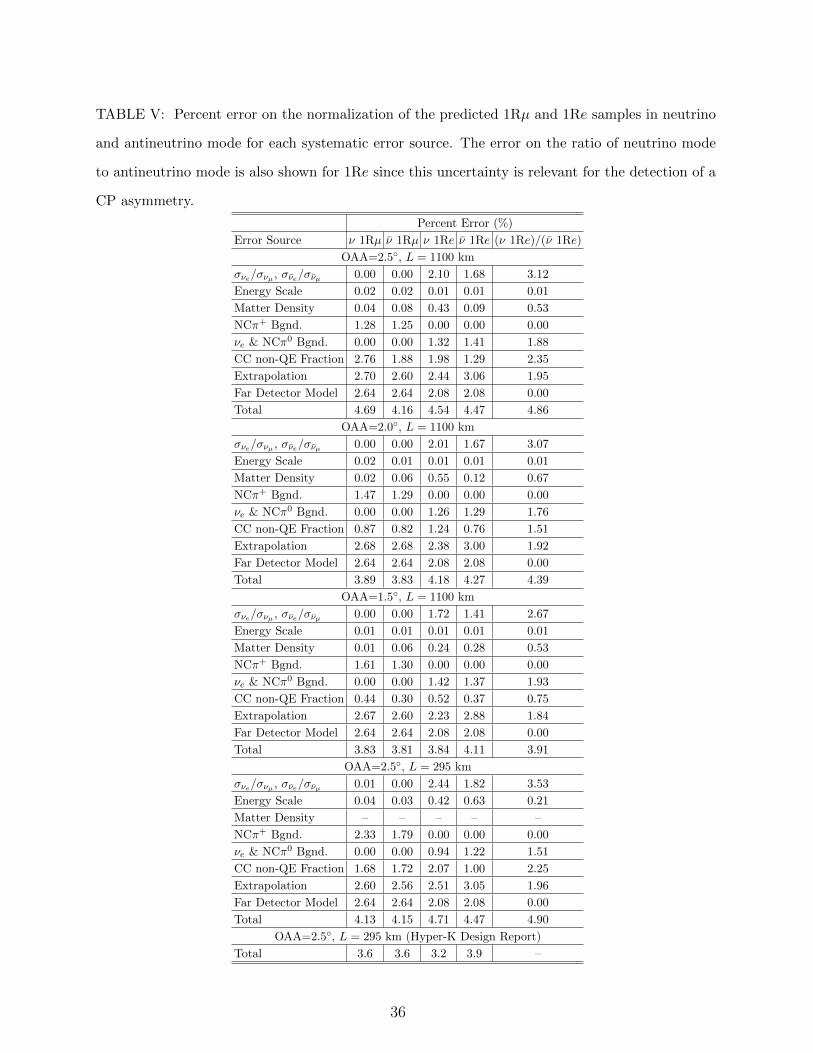
TABLE V: Percent error on the normalization of the predicted 1Rµ and 1Re samples in neutrino
and antineutrino mode for each systematic error source. The error on the ratio of neutrino mode
to antineutrino mode is also shown for 1Re since this uncertainty is relevant for the detection of a
CP asymmetry.
Percent Error (%)
Error Source ν 1Rµ ν 1Rµ ν 1Re ν 1Re (ν 1Re)/(ν 1Re)
OAA=2.5◦, L = 1100 km
σνe/σνµ , σνe/σνµ 0.00 0.00 2.10 1.68 3.12
Energy Scale 0.02 0.02 0.01 0.01 0.01
Matter Density 0.04 0.08 0.43 0.09 0.53
NCπ+ Bgnd. 1.28 1.25 0.00 0.00 0.00
νe & NCπ0 Bgnd. 0.00 0.00 1.32 1.41 1.88
CC non-QE Fraction 2.76 1.88 1.98 1.29 2.35
Extrapolation 2.70 2.60 2.44 3.06 1.95
Far Detector Model 2.64 2.64 2.08 2.08 0.00
Total 4.69 4.16 4.54 4.47 4.86
OAA=2.0◦, L = 1100 km
σνe/σνµ , σνe/σνµ 0.00 0.00 2.01 1.67 3.07
Energy Scale 0.02 0.01 0.01 0.01 0.01
Matter Density 0.02 0.06 0.55 0.12 0.67
NCπ+ Bgnd. 1.47 1.29 0.00 0.00 0.00
νe & NCπ0 Bgnd. 0.00 0.00 1.26 1.29 1.76
CC non-QE Fraction 0.87 0.82 1.24 0.76 1.51
Extrapolation 2.68 2.68 2.38 3.00 1.92
Far Detector Model 2.64 2.64 2.08 2.08 0.00
Total 3.89 3.83 4.18 4.27 4.39
OAA=1.5◦, L = 1100 km
σνe/σνµ , σνe/σνµ 0.00 0.00 1.72 1.41 2.67
Energy Scale 0.01 0.01 0.01 0.01 0.01
Matter Density 0.01 0.06 0.24 0.28 0.53
NCπ+ Bgnd. 1.61 1.30 0.00 0.00 0.00
νe & NCπ0 Bgnd. 0.00 0.00 1.42 1.37 1.93
CC non-QE Fraction 0.44 0.30 0.52 0.37 0.75
Extrapolation 2.67 2.60 2.23 2.88 1.84
Far Detector Model 2.64 2.64 2.08 2.08 0.00
Total 3.83 3.81 3.84 4.11 3.91
OAA=2.5◦, L = 295 km
σνe/σνµ , σνe/σνµ 0.01 0.00 2.44 1.82 3.53
Energy Scale 0.04 0.03 0.42 0.63 0.21
Matter Density – – – – –
NCπ+ Bgnd. 2.33 1.79 0.00 0.00 0.00
νe & NCπ0 Bgnd. 0.00 0.00 0.94 1.22 1.51
CC non-QE Fraction 1.68 1.72 2.07 1.00 2.25
Extrapolation 2.60 2.56 2.51 3.05 1.96
Far Detector Model 2.64 2.64 2.08 2.08 0.00
Total 4.13 4.15 4.71 4.47 4.90
OAA=2.5◦, L = 295 km (Hyper-K Design Report)
Total 3.6 3.6 3.2 3.9 –
36
(GeV)recE0.2 0.4 0.6 0.8 1 1.2 1.4
Rat
io
0.94
0.96
0.98
1
1.02
1.04
1.06
)°=90cp
δ)/N(°=103cpδN(
=1.0)escale
=0.995)/N(Pescale
N(P
Neutrino Mode: 1Re Candidates
(GeV)recE0.2 0.4 0.6 0.8 1 1.2 1.4
Rat
io
0.94
0.96
0.98
1
1.02
1.04
1.06
)°=90cp
δ)/N(°=103cpδN(
=1.0)escale
=0.995)/N(Pescale
N(P
Antineutrino Mode: 1Re Candidates
FIG. 16: The ratios to nominal predicted spectra (δcp = π/2) for a δcp shift of +13◦ and an
energy scale shift of −0.5%. The ratios are shown for the 1Re samples in neutrino mode (top) and
antineutrino mode (bottom). The ratios are calculated for the Hyper-K detector at 295 km and
2.5◦ off-axis. 37
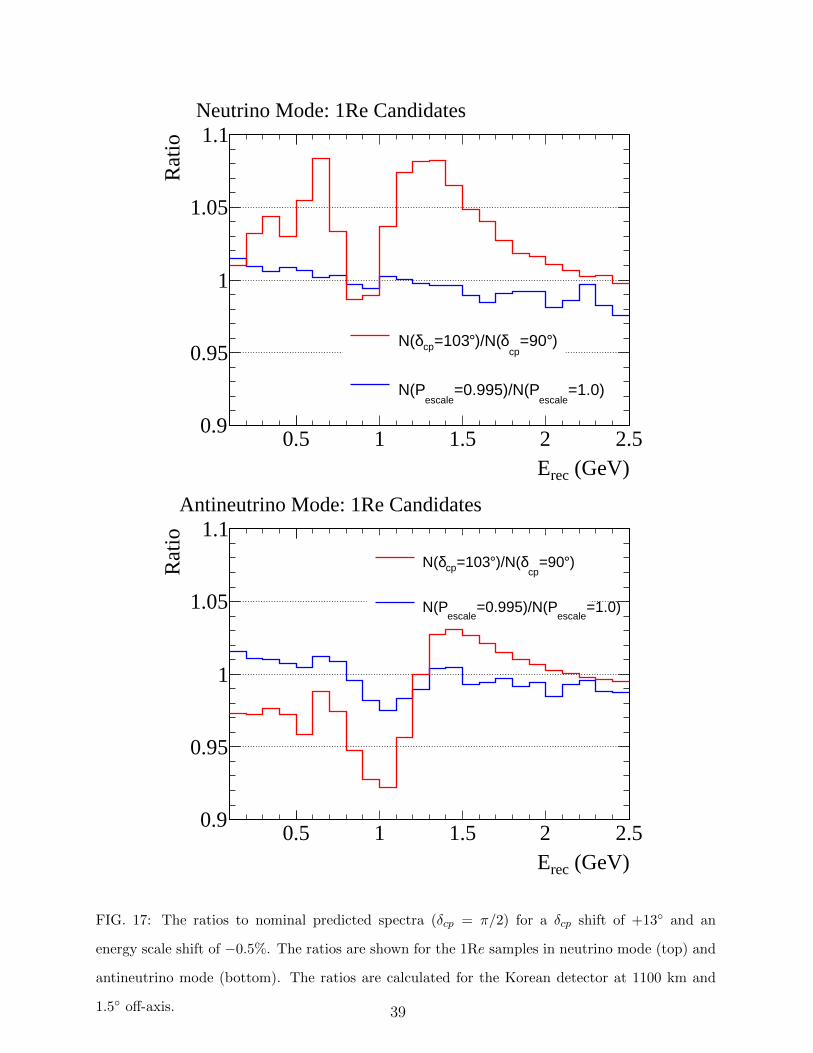
CP-even term can be seen in the increased rate from 1.3 GeV and above for both neutrino
and antineutrino mode. The CP-odd term causes an asymmetry in the normalization of
the neutrino mode and antineutrino mode samples below 1 GeV. These effects can not be
reproduced with a small variation of the energy scale parameter, as is the case for Hyper-K.
This study shows that the constraint on δcp near δcp = π/2, 3π/2 is sensitive to different
systematic errors for Hyper-K and the Korean detector. It also shows that the fractional
change to spectrum from the δcp variation is larger for the detector at a longer baseline,
suggesting that the measurement is less likely to be systematics limited. The full impact of
the Korean detector on the δcp precision will be shown in the following section where the
physics sensitivities are presented.
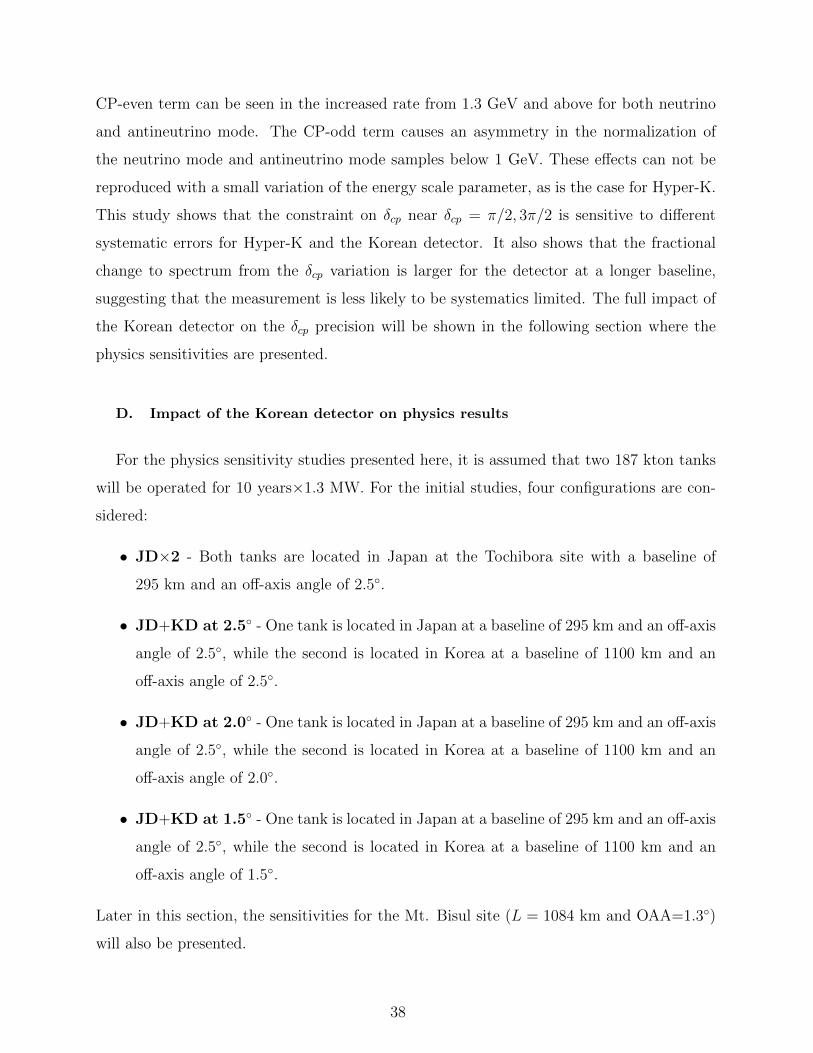
D. Impact of the Korean detector on physics results
For the physics sensitivity studies presented here, it is assumed that two 187 kton tanks
will be operated for 10 years×1.3 MW. For the initial studies, four configurations are con-
sidered:
• JD×2 - Both tanks are located in Japan at the Tochibora site with a baseline of
295 km and an off-axis angle of 2.5◦.
• JD+KD at 2.5◦ - One tank is located in Japan at a baseline of 295 km and an off-axis
angle of 2.5◦, while the second is located in Korea at a baseline of 1100 km and an
off-axis angle of 2.5◦.
• JD+KD at 2.0◦ - One tank is located in Japan at a baseline of 295 km and an off-axis
angle of 2.5◦, while the second is located in Korea at a baseline of 1100 km and an
off-axis angle of 2.0◦.
• JD+KD at 1.5◦ - One tank is located in Japan at a baseline of 295 km and an off-axis
angle of 2.5◦, while the second is located in Korea at a baseline of 1100 km and an
off-axis angle of 1.5◦.
Later in this section, the sensitivities for the Mt. Bisul site (L = 1084 km and OAA=1.3◦)
will also be presented.
38
(GeV)recE0.5 1 1.5 2 2.5
Rat
io
0.9
0.95
1
1.05
1.1
)°=90cp
δ)/N(°=103cpδN(
=1.0)escale
=0.995)/N(Pescale
N(P
Neutrino Mode: 1Re Candidates
(GeV)recE0.5 1 1.5 2 2.5
Rat
io
0.9
0.95
1
1.05
1.1
)°=90cp
δ)/N(°=103cpδN(
=1.0)escale
=0.995)/N(Pescale
N(P
Antineutrino Mode: 1Re Candidates
FIG. 17: The ratios to nominal predicted spectra (δcp = π/2) for a δcp shift of +13◦ and an
energy scale shift of −0.5%. The ratios are shown for the 1Re samples in neutrino mode (top) and
antineutrino mode (bottom). The ratios are calculated for the Korean detector at 1100 km and
1.5◦ off-axis. 39
The initial physics sensitivity studies focus on 3 measurements: the determination of
the mass ordering, the discovery of CP violation through the exclusion of the sin(δcp) = 0
hypothesis, and the precision measurement of δcp. In all cases, the sensitivities are evaluated
on pseudo-data generated with the following true oscillation parameter values:
• |∆m232| = 2.5× 10⁻³ eV2
• sin2 θ23 = 0.5
• sin2 θ13 = 0.0219
• ∆m221 = 7.53× 10⁻⁵ eV2
• sin2 θ12 = 0.304
The pseudo-data are also generated for multiple values of δcp and both mass orderings, and
the sensitivities are presented as a function of the true value of δcp and the mass ordering.
In the fits to the pseudo-data, ∆m232, sin2 θ23 and δcp are free parameters with no prior
constraints. sin2 θ13, sin2 θ12 and ∆m221 also vary in the fits, but they have prior Gaussian
constraints with 1σ uncertainties of 0.0012, 0.041 and 0.18 × 10⁻⁵ eV2 respectively. The
prior uncertainties on these parameters are taken from the 2015 edition of the PDG Review
of Particle Physics. The systematic parameters described in the previous section are also
allowed to vary as nuisance parameters in the fit within their prior constraints. In all cases,
the sensitivities are evaluated on the fit to the so-called Asimov set, i.e. the prediction
for the nominal values of the oscillation parameter and systematic parameters. All four
samples (neutrino mode 1Re, 1Rµ and antineutrino mode 1Re, 1Rµ) are used to construct a
binned likelihood and the product of the pseudo-data likelihood is taken with the Gaussian
priors for constrained oscillation parameters and systematic parameters to construct the full
likelihood, L. To simplify the notation, we write −2log(L) as ∆χ2.
The test statistic used for the mass ordering determination is:
TMH =√
∆χ2WH −∆χ2
CH (3)
Here, ∆χ2WH and ∆χ2
CH are the best-fit −2log(L) for the wrong and correct mass hierarchies
respectively. In the Gaussian limit, the test parameter can be interpreted as the significance
of the mass ordering determination. Here sensitivities are shown for the Hyper-K accelerator
40
neutrinos only and do not account for the additional constraint from Hyper-K atmospheric
neutrinos.
The test statistic used for the CP violation discover potential is:
TCPV =√MIN [∆χ2
BF (δcp = 0),∆χ2BF (δcp = π)]−∆χ2
BF (4)
Here, ∆χ2BF (δcp = 0) and ∆χ2
BF (δcp = π) are the best-fit −2log(L) where δcp is fixed to one
of the CP conserving values. The minimum of these two is used for the test statistic. ∆χ2BF
is the best-fit minimum of −2log(L) where δcp is allowed to vary. Two cases are treated for
the CP violation studies. In the first case, the mass ordering is assumed to be known based
on external measurements and the measurement using the Hyper-K atmospheric neutrinos.
In the second case, the constraints from external measurements and Hyper-K atmospheric
neutrinos are not used, in order to estimate the sensitivity from the accelerator neutrinos
alone. When the mass ordering is determined with Hyper-K accelerator neutrinos alone, the
sign of ∆m232 is allowed to vary in the minimization procedure. The test parameter can be
interpreted as the significance to exclude the CP conserving hypotheses.
For the evaluation of the δcp measurement precision the fitted value of δcp is scanned and
the −2log(L) is minimized at each value of δcp, i.e. the profiling method. The δcp values that
correspond to a 1 unit change in −2log(L) relative to the minimum are taken as the bounds
for the 68% confidence interval. The plotted 1σ error is the width of the 68% confidence
interval divided by two.
The significances to reject the wrong mass ordering are shown in Fig. 18, and the fraction
of δcp values for which a given significance is achieved is shown in Fig. 19. As is expected
based on Fig. 13, the significance is largest for the configuration with the Korean detector at
1.5◦ off-axis since the more on-axis position gives more events in the 1-2 GeV range where
the matter effect is large. For this configuration, the significance to reject the wrong mass
ordering is greater than 6σ for most values of δcp and greater than 5σ for all values of δcp.
The significance of the wrong mass ordering rejection degrades as the Korean detector is
moved to more off-axis locations. However, even the configuration with 2.5◦ off-axis Korean
detector has 3σ rejection sensitivity for most values of δcp and improved sensitivity over the
configuration with both tanks in Japan for most values of δcp. Based on this study, it is clear
that the sensitivity may be improved further by adding events above 1 GeV in reconstructed
energy. This may be achieved by moving to a more on-axis position (see Mt. Bisul) or by
41
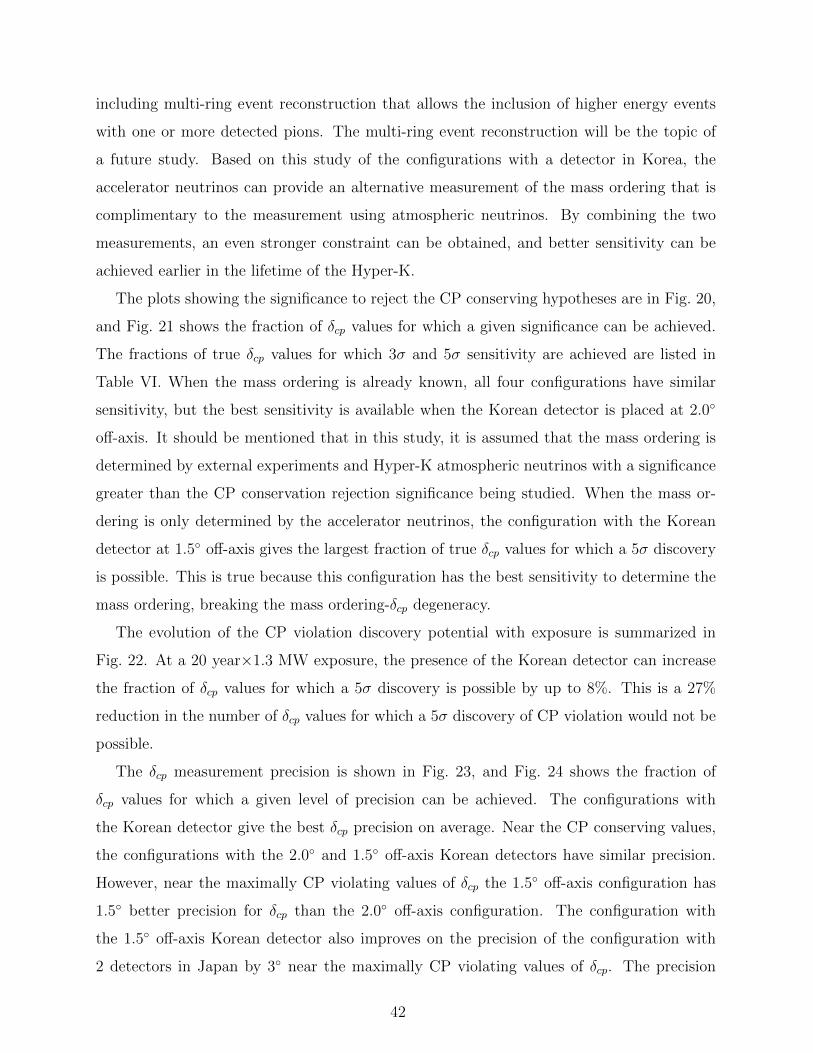
including multi-ring event reconstruction that allows the inclusion of higher energy events
with one or more detected pions. The multi-ring event reconstruction will be the topic of
a future study. Based on this study of the configurations with a detector in Korea, the
accelerator neutrinos can provide an alternative measurement of the mass ordering that is
complimentary to the measurement using atmospheric neutrinos. By combining the two
measurements, an even stronger constraint can be obtained, and better sensitivity can be
achieved earlier in the lifetime of the Hyper-K.
The plots showing the significance to reject the CP conserving hypotheses are in Fig. 20,
and Fig. 21 shows the fraction of δcp values for which a given significance can be achieved.
The fractions of true δcp values for which 3σ and 5σ sensitivity are achieved are listed in
Table VI. When the mass ordering is already known, all four configurations have similar
sensitivity, but the best sensitivity is available when the Korean detector is placed at 2.0◦
off-axis. It should be mentioned that in this study, it is assumed that the mass ordering is
determined by external experiments and Hyper-K atmospheric neutrinos with a significance
greater than the CP conservation rejection significance being studied. When the mass or-
dering is only determined by the accelerator neutrinos, the configuration with the Korean
detector at 1.5◦ off-axis gives the largest fraction of true δcp values for which a 5σ discovery
is possible. This is true because this configuration has the best sensitivity to determine the
mass ordering, breaking the mass ordering-δcp degeneracy.
The evolution of the CP violation discovery potential with exposure is summarized in
Fig. 22. At a 20 year×1.3 MW exposure, the presence of the Korean detector can increase
the fraction of δcp values for which a 5σ discovery is possible by up to 8%. This is a 27%
reduction in the number of δcp values for which a 5σ discovery of CP violation would not be
possible.
The δcp measurement precision is shown in Fig. 23, and Fig. 24 shows the fraction of
δcp values for which a given level of precision can be achieved. The configurations with
the Korean detector give the best δcp precision on average. Near the CP conserving values,
the configurations with the 2.0◦ and 1.5◦ off-axis Korean detectors have similar precision.
However, near the maximally CP violating values of δcp the 1.5◦ off-axis configuration has
1.5◦ better precision for δcp than the 2.0◦ off-axis configuration. The configuration with
the 1.5◦ off-axis Korean detector also improves on the precision of the configuration with
2 detectors in Japan by 3◦ near the maximally CP violating values of δcp. The precision
42
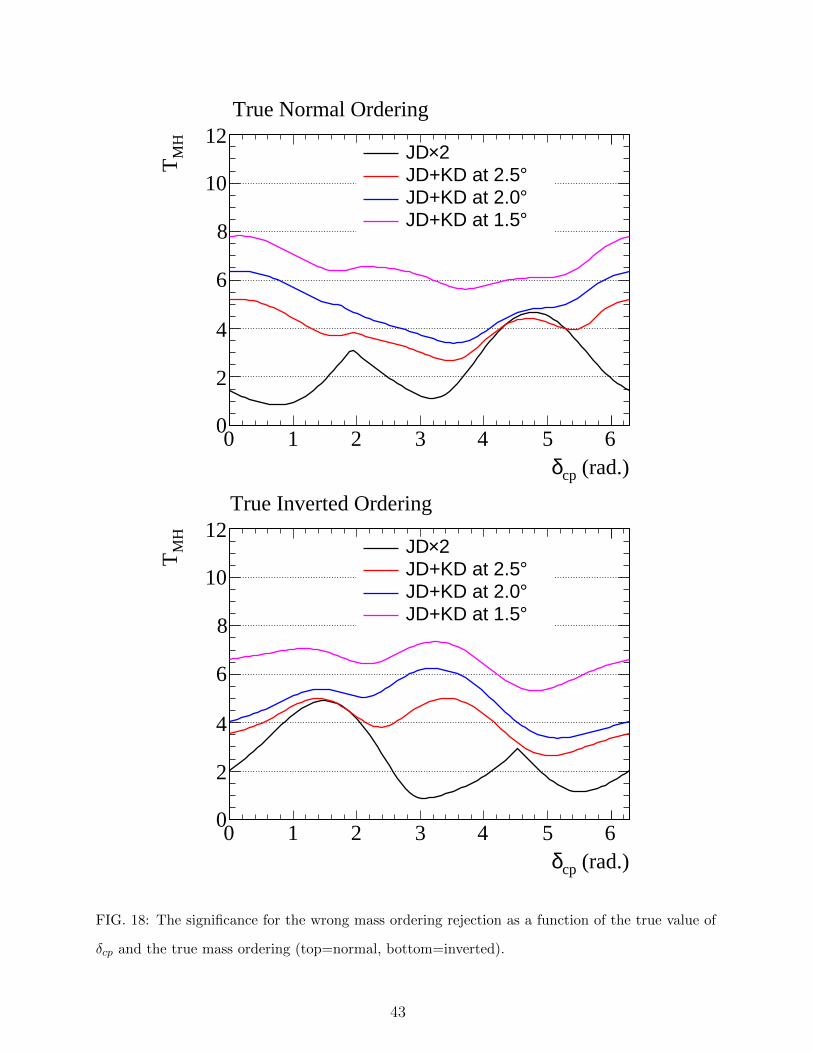
(rad.)cpδ0 1 2 3 4 5 6
MH
T
0
2
4
6
8
10
122×JD
°JD+KD at 2.5°JD+KD at 2.0°JD+KD at 1.5
True Normal Ordering
(rad.)cpδ0 1 2 3 4 5 6
MH
T
0
2
4
6
8
10
122×JD
°JD+KD at 2.5°JD+KD at 2.0°JD+KD at 1.5
True Inverted Ordering
FIG. 18: The significance for the wrong mass ordering rejection as a function of the true value of
δcp and the true mass ordering (top=normal, bottom=inverted).
43
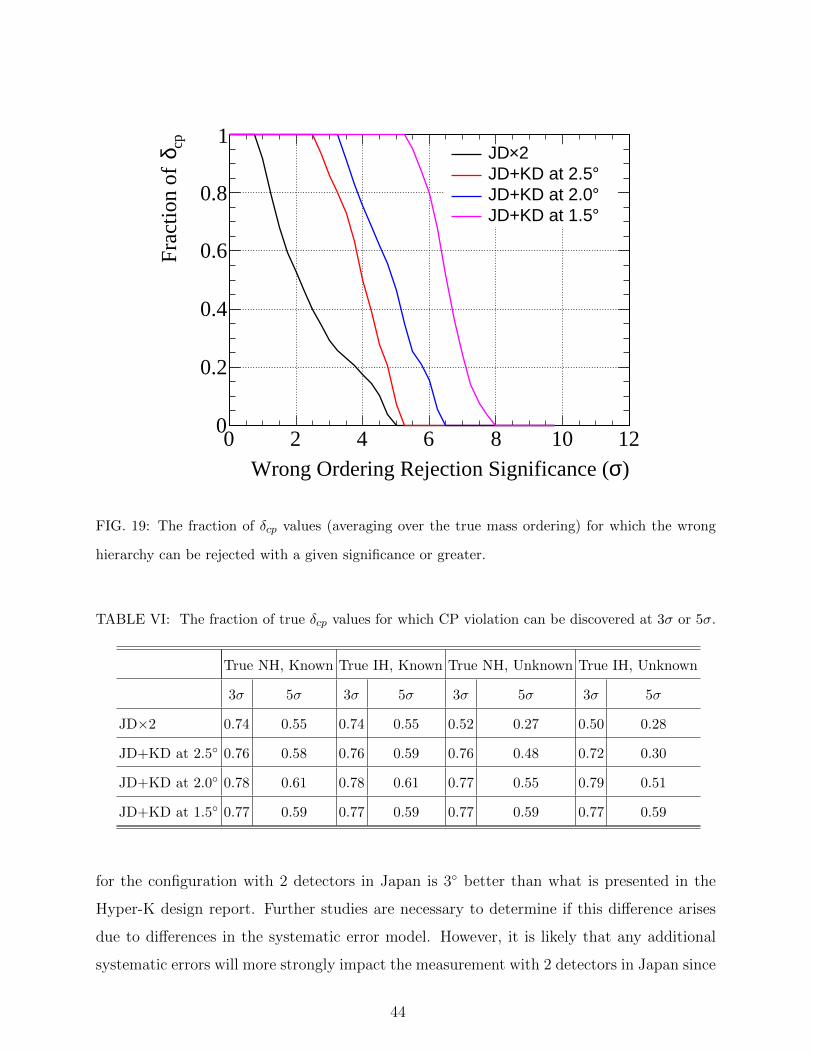
)σWrong Ordering Rejection Significance (0 2 4 6 8 10 12
cpδFr
actio
n of
0
0.2
0.4
0.6
0.8
12×JD
°JD+KD at 2.5°JD+KD at 2.0°JD+KD at 1.5
Ordering Known
FIG. 19: The fraction of δcp values (averaging over the true mass ordering) for which the wrong
hierarchy can be rejected with a given significance or greater.
TABLE VI: The fraction of true δcp values for which CP violation can be discovered at 3σ or 5σ.
True NH, Known True IH, Known True NH, Unknown True IH, Unknown
3σ 5σ 3σ 5σ 3σ 5σ 3σ 5σ
JD×2 0.74 0.55 0.74 0.55 0.52 0.27 0.50 0.28
JD+KD at 2.5◦ 0.76 0.58 0.76 0.59 0.76 0.48 0.72 0.30
JD+KD at 2.0◦ 0.78 0.61 0.78 0.61 0.77 0.55 0.79 0.51
JD+KD at 1.5◦ 0.77 0.59 0.77 0.59 0.77 0.59 0.77 0.59
for the configuration with 2 detectors in Japan is 3◦ better than what is presented in the
Hyper-K design report. Further studies are necessary to determine if this difference arises
due to differences in the systematic error model. However, it is likely that any additional
systematic errors will more strongly impact the measurement with 2 detectors in Japan since
44
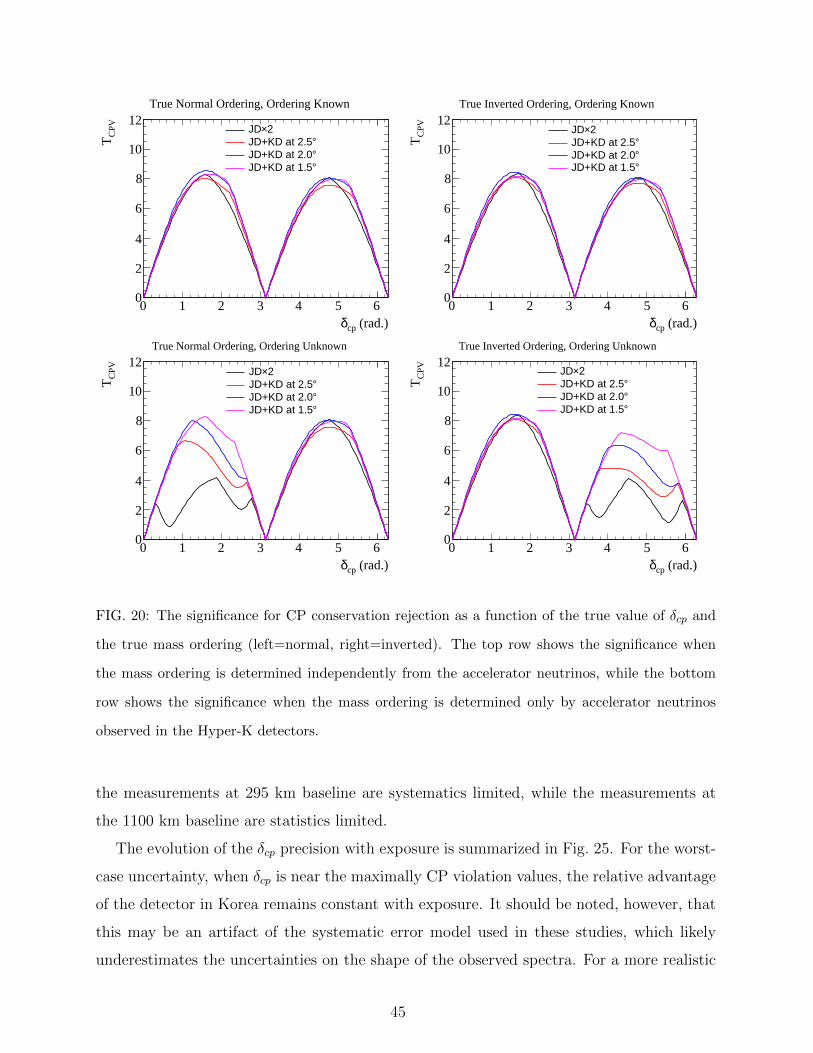
(rad.)cpδ0 1 2 3 4 5 6
CPV
T
0
2
4
6
8
10
122×JD
°JD+KD at 2.5°JD+KD at 2.0°JD+KD at 1.5
True Normal Ordering, Ordering Known
(rad.)cpδ0 1 2 3 4 5 6
CPV
T
0
2
4
6
8
10
122×JD
°JD+KD at 2.5°JD+KD at 2.0°JD+KD at 1.5
True Inverted Ordering, Ordering Known
(rad.)cpδ0 1 2 3 4 5 6
CPV
T
0
2
4
6
8
10
122×JD
°JD+KD at 2.5°JD+KD at 2.0°JD+KD at 1.5
True Normal Ordering, Ordering Unknown
(rad.)cpδ0 1 2 3 4 5 6
CPV
T
0
2
4
6
8
10
122×JD
°JD+KD at 2.5°JD+KD at 2.0°JD+KD at 1.5
True Inverted Ordering, Ordering Unknown
FIG. 20: The significance for CP conservation rejection as a function of the true value of δcp and
the true mass ordering (left=normal, right=inverted). The top row shows the significance when
the mass ordering is determined independently from the accelerator neutrinos, while the bottom
row shows the significance when the mass ordering is determined only by accelerator neutrinos
observed in the Hyper-K detectors.
the measurements at 295 km baseline are systematics limited, while the measurements at
the 1100 km baseline are statistics limited.
The evolution of the δcp precision with exposure is summarized in Fig. 25. For the worst-
case uncertainty, when δcp is near the maximally CP violation values, the relative advantage
of the detector in Korea remains constant with exposure. It should be noted, however, that
this may be an artifact of the systematic error model used in these studies, which likely
underestimates the uncertainties on the shape of the observed spectra. For a more realistic
45
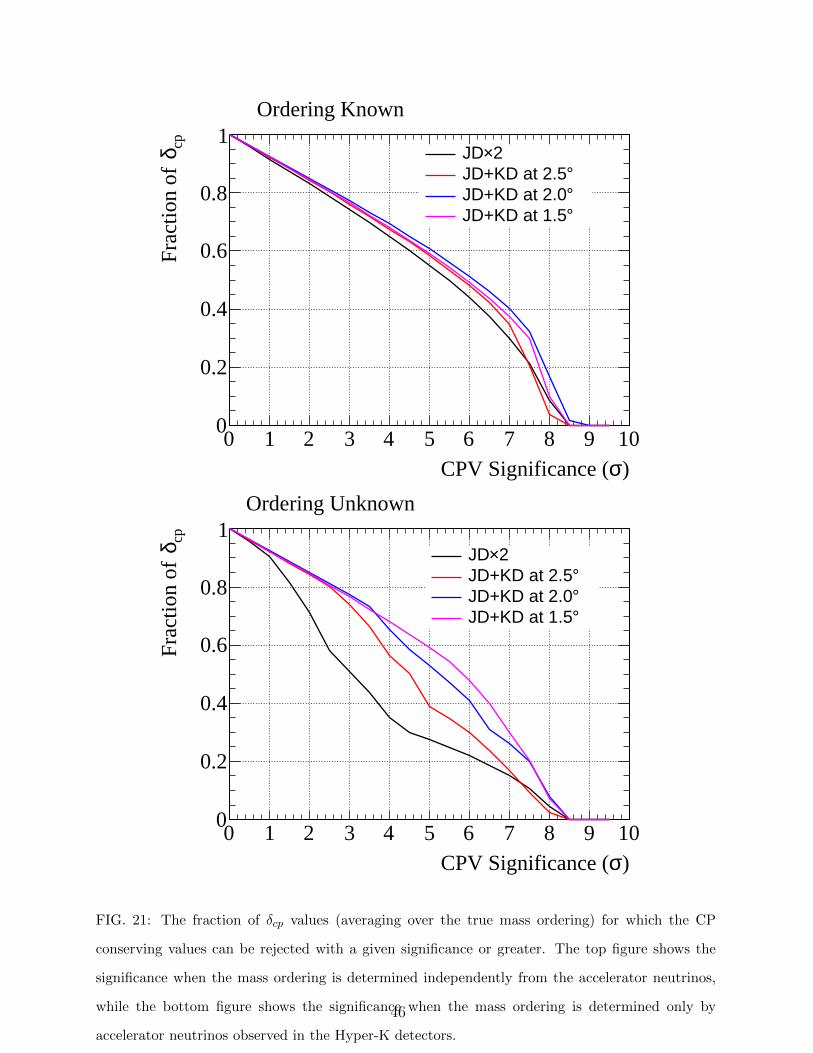
)σCPV Significance (0 1 2 3 4 5 6 7 8 9 10
cpδFr
actio
n of
0
0.2
0.4
0.6
0.8
12×JD
°JD+KD at 2.5°JD+KD at 2.0°JD+KD at 1.5
Ordering Known
)σCPV Significance (0 1 2 3 4 5 6 7 8 9 10
cpδFr
actio
n of
0
0.2
0.4
0.6
0.8
12×JD
°JD+KD at 2.5°JD+KD at 2.0°JD+KD at 1.5
Ordering Unknown
FIG. 21: The fraction of δcp values (averaging over the true mass ordering) for which the CP
conserving values can be rejected with a given significance or greater. The top figure shows the
significance when the mass ordering is determined independently from the accelerator neutrinos,
while the bottom figure shows the significance when the mass ordering is determined only by
accelerator neutrinos observed in the Hyper-K detectors.
46
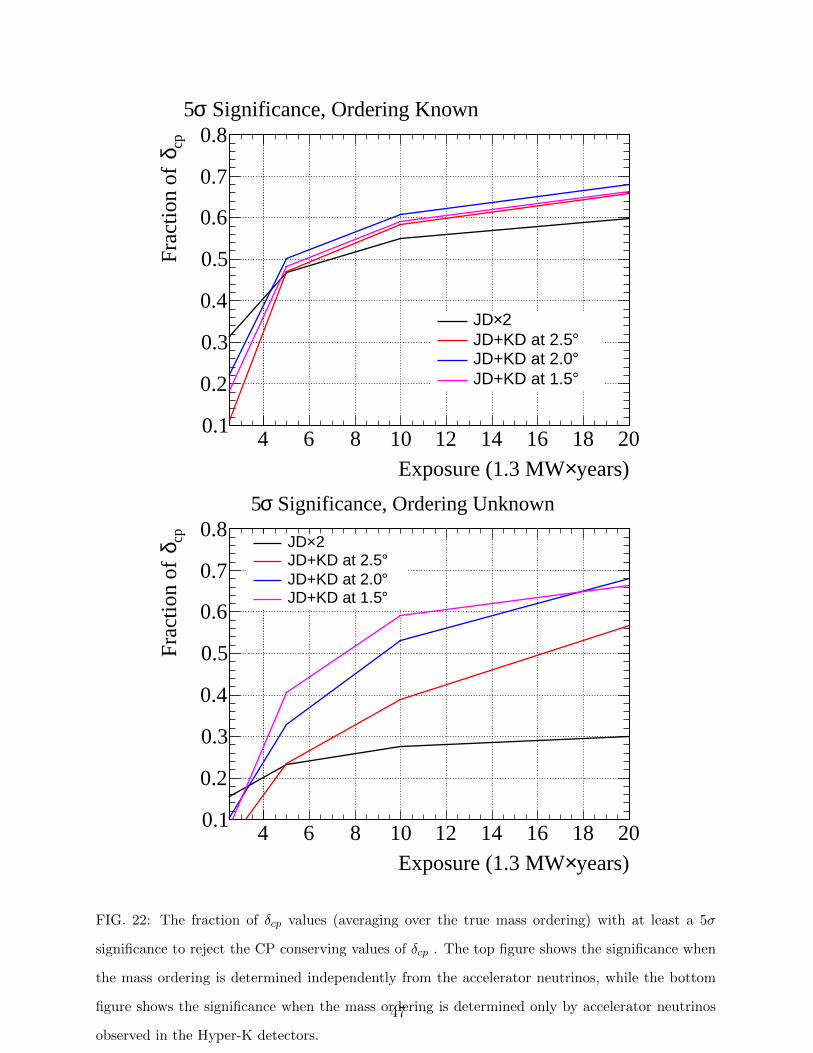
years)×Exposure (1.3 MW4 6 8 10 12 14 16 18 20
cpδFr
actio
n of
0.1
0.2
0.3
0.4
0.5
0.6
0.7
0.8
2×JD°JD+KD at 2.5°JD+KD at 2.0°JD+KD at 1.5
Significance, Ordering Knownσ5
years)×Exposure (1.3 MW4 6 8 10 12 14 16 18 20
cpδFr
actio
n of
0.1
0.2
0.3
0.4
0.5
0.6
0.7
0.82×JD
°JD+KD at 2.5°JD+KD at 2.0°JD+KD at 1.5
Significance, Ordering Unknownσ5
FIG. 22: The fraction of δcp values (averaging over the true mass ordering) with at least a 5σ
significance to reject the CP conserving values of δcp . The top figure shows the significance when
the mass ordering is determined independently from the accelerator neutrinos, while the bottom
figure shows the significance when the mass ordering is determined only by accelerator neutrinos
observed in the Hyper-K detectors.
47
systematic error model, the δcp resolution may be degraded, particularly for the detector in
Japan which is more systematics limited.
1. Sensitivity studies for the Mt. Bisul site
The potential Mt. Bisul site is located at a baseline of 1088 km and an off-axis angle
of 1.3◦. The primary effect of the off-axis angle change from 1.5◦ to 1.3◦ is to decrease the
(anti)neutrino flux at 700 MeV by ∼ 10% while increasing flux above 1.2 GeV by ∼ 50%.
With these flux changes, it is expected that the Mt. Bisul location should provide better
sensitivity to determine the mass ordering, while the CP violation discovery potential may
be slightly degraded. The wrong mass ordering rejection significances including the Mt.
Bisul configuration are shown in Fig. 26. The wrong mass ordering rejection significance is
largest for the Mt. Bisul configuration for all true values of the mass ordering and δcp, and
is above 7σ for almost all values.
The CP conservation rejection significances including the Mt. Bisul configuration are
shown in Fig. 27. There is little change to the fraction of δcp values with 3σ or 5σ rejection
compared to the configuration with the Korean detector at 1.5◦ off-axis. For all cases of the
true mass ordering and prior knowledge of the mass ordering, the fraction of δcp values with
3σ or 5σ significance is reduced by less than 0.01 compared to the 1.5◦ off-axis configuration.
For the scenarios where the mass ordering is determined by the accelerator neutrinos only,
better CP conservation rejection is achieved for some values of δcp where the improved wrong
mass ordering rejection impacts the CP violation measurement.
The δcp precision is shown in Fig. 28. Near the maximally CP violation values, there is
a slight improvement of the precision, indicating that the measurement is in part due to
the spectrum distortion in the > 1 GeV region arising from the cos(δcp) dependent term.
Near the CP conserving values, there is a very small degradation of the precision, but the
Mt. Bisul configuration still provides better precision than the configuration with the 2.5◦
off-axis Korean detector.
48
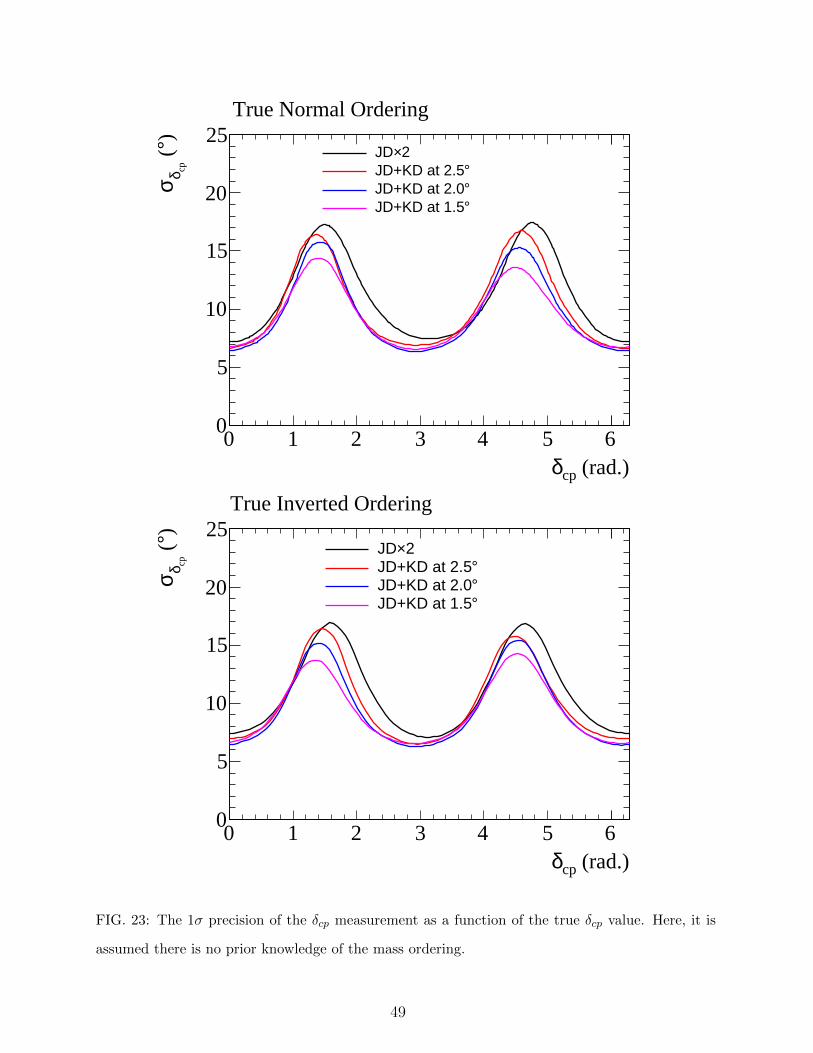
(rad.)cpδ0 1 2 3 4 5 6
)° (
cpδσ
0
5
10
15
20
252×JD
°JD+KD at 2.5°JD+KD at 2.0°JD+KD at 1.5
True Normal Ordering
(rad.)cpδ0 1 2 3 4 5 6
)° (
cpδσ
0
5
10
15
20
252×JD
°JD+KD at 2.5°JD+KD at 2.0°JD+KD at 1.5
True Inverted Ordering
FIG. 23: The 1σ precision of the δcp measurement as a function of the true δcp value. Here, it is
assumed there is no prior knowledge of the mass ordering.
49
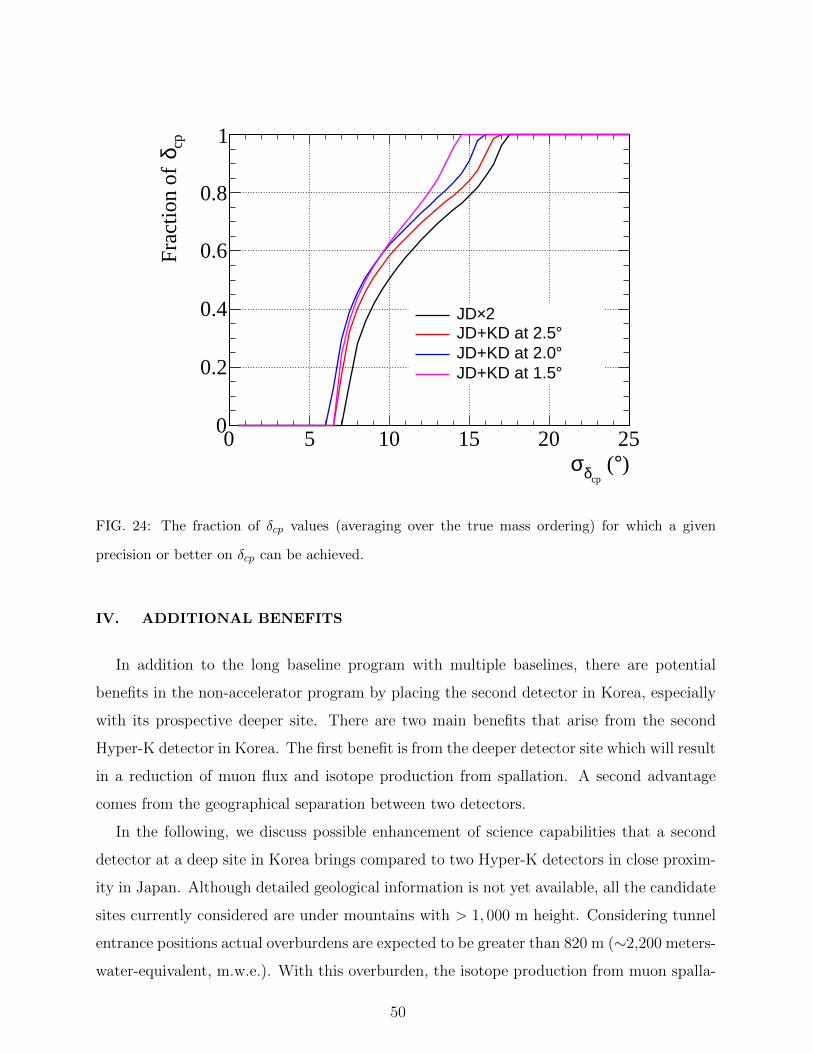
)° (cpδσ
0 5 10 15 20 25
cpδFr
actio
n of
0
0.2
0.4
0.6
0.8
1
2×JD°JD+KD at 2.5°JD+KD at 2.0°JD+KD at 1.5
FIG. 24: The fraction of δcp values (averaging over the true mass ordering) for which a given
precision or better on δcp can be achieved.
IV. ADDITIONAL BENEFITS
In addition to the long baseline program with multiple baselines, there are potential
benefits in the non-accelerator program by placing the second detector in Korea, especially
with its prospective deeper site. There are two main benefits that arise from the second
Hyper-K detector in Korea. The first benefit is from the deeper detector site which will result
in a reduction of muon flux and isotope production from spallation. A second advantage
comes from the geographical separation between two detectors.
In the following, we discuss possible enhancement of science capabilities that a second
detector at a deep site in Korea brings compared to two Hyper-K detectors in close proxim-
ity in Japan. Although detailed geological information is not yet available, all the candidate
sites currently considered are under mountains with > 1, 000 m height. Considering tunnel
entrance positions actual overburdens are expected to be greater than 820 m (∼2,200 meters-
water-equivalent, m.w.e.). With this overburden, the isotope production from muon spalla-
50
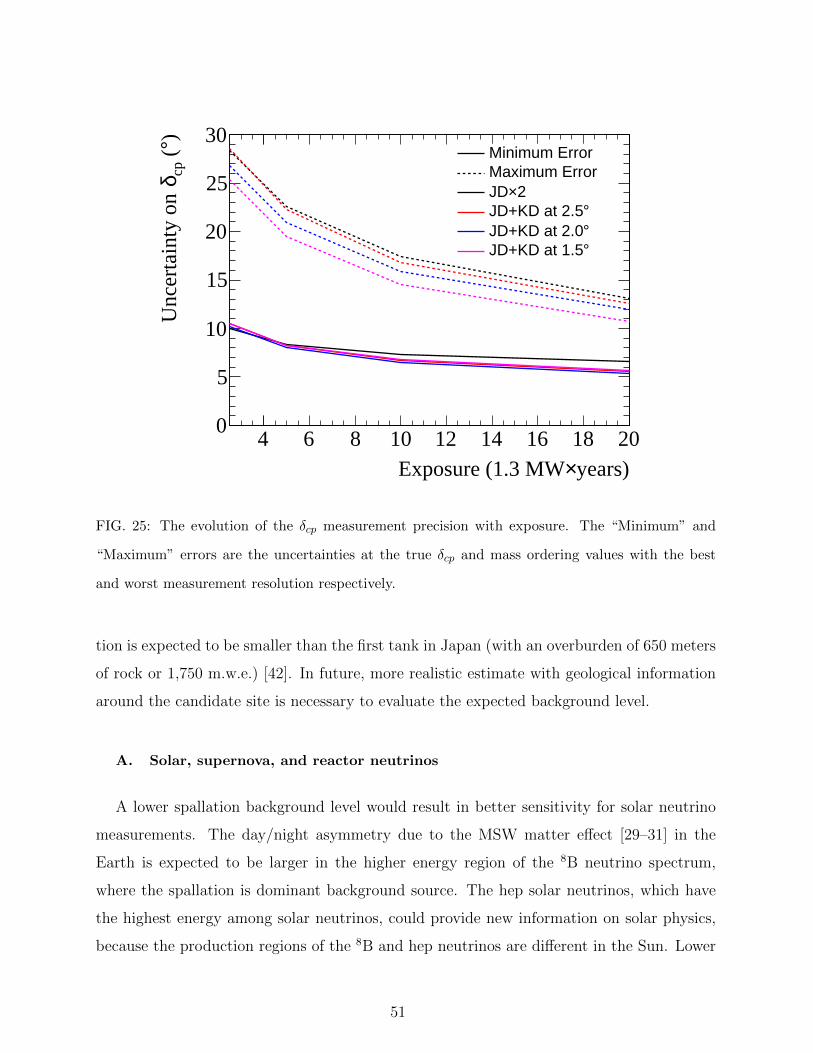
years)×Exposure (1.3 MW4 6 8 10 12 14 16 18 20
)° (
cpδU
ncer
tain
ty o
n
0
5
10
15
20
25
30Minimum ErrorMaximum Error
2×JD°JD+KD at 2.5°JD+KD at 2.0°JD+KD at 1.5
FIG. 25: The evolution of the δcp measurement precision with exposure. The “Minimum” and
“Maximum” errors are the uncertainties at the true δcp and mass ordering values with the best
and worst measurement resolution respectively.
tion is expected to be smaller than the first tank in Japan (with an overburden of 650 meters
of rock or 1,750 m.w.e.) [42]. In future, more realistic estimate with geological information
around the candidate site is necessary to evaluate the expected background level.
A. Solar, supernova, and reactor neutrinos
A lower spallation background level would result in better sensitivity for solar neutrino
measurements. The day/night asymmetry due to the MSW matter effect [29–31] in the
Earth is expected to be larger in the higher energy region of the 8B neutrino spectrum,
where the spallation is dominant background source. The hep solar neutrinos, which have
the highest energy among solar neutrinos, could provide new information on solar physics,
because the production regions of the 8B and hep neutrinos are different in the Sun. Lower
51
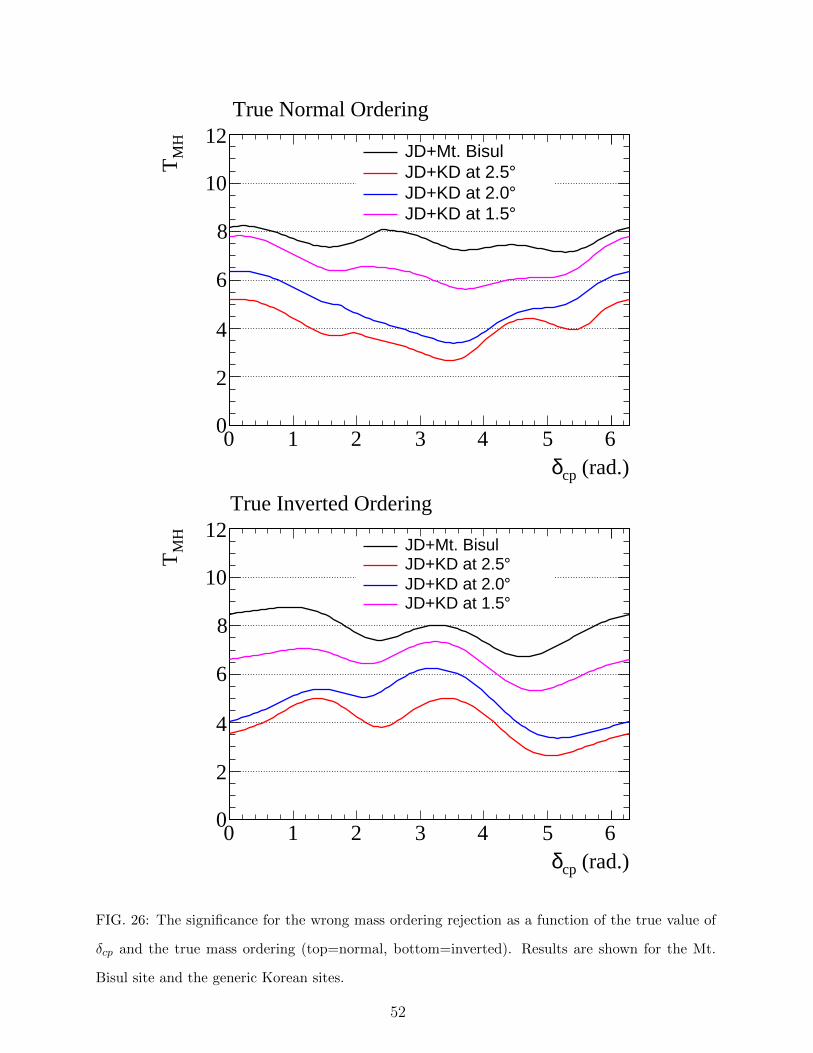
(rad.)cpδ0 1 2 3 4 5 6
MH
T
0
2
4
6
8
10
12JD+Mt. Bisul
°JD+KD at 2.5°JD+KD at 2.0°JD+KD at 1.5
True Normal Ordering
(rad.)cpδ0 1 2 3 4 5 6
MH
T
0
2
4
6
8
10
12JD+Mt. Bisul
°JD+KD at 2.5°JD+KD at 2.0°JD+KD at 1.5
True Inverted Ordering
FIG. 26: The significance for the wrong mass ordering rejection as a function of the true value of
δcp and the true mass ordering (top=normal, bottom=inverted). Results are shown for the Mt.
Bisul site and the generic Korean sites.
52
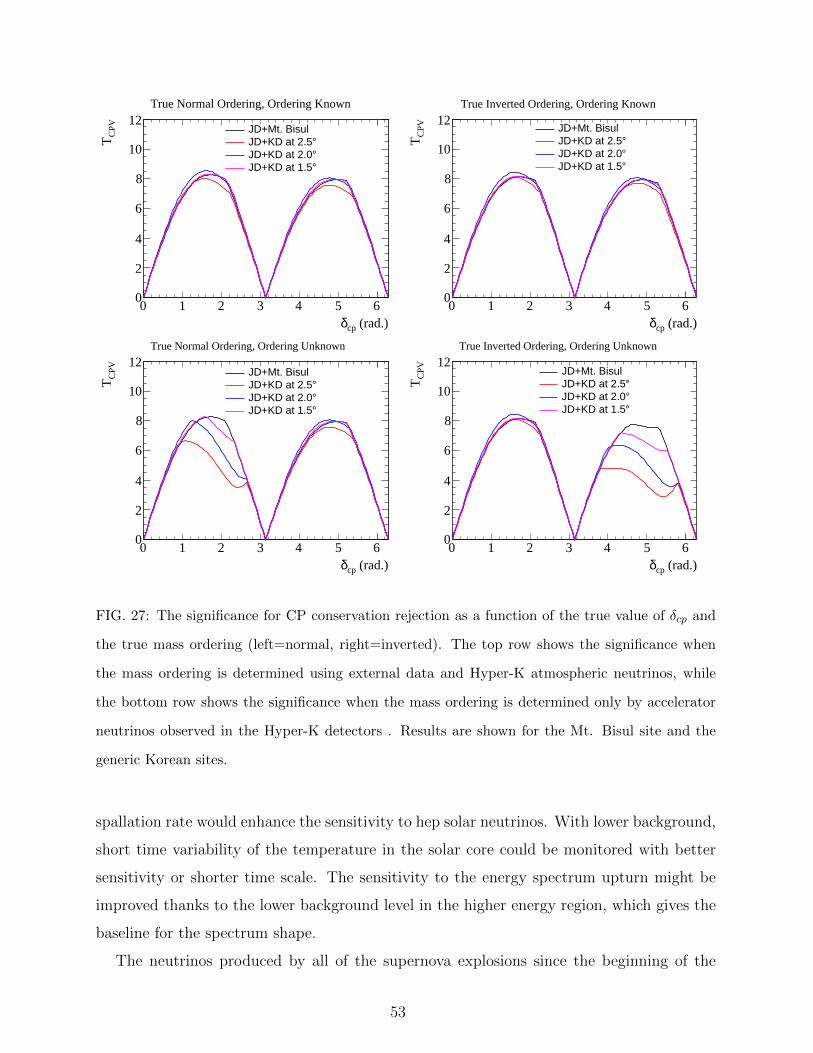
(rad.)cpδ0 1 2 3 4 5 6
CPV
T
0
2
4
6
8
10
12JD+Mt. Bisul
°JD+KD at 2.5°JD+KD at 2.0°JD+KD at 1.5
True Normal Ordering, Ordering Known
(rad.)cpδ0 1 2 3 4 5 6
CPV
T
0
2
4
6
8
10
12JD+Mt. Bisul
°JD+KD at 2.5°JD+KD at 2.0°JD+KD at 1.5
True Inverted Ordering, Ordering Known
(rad.)cpδ0 1 2 3 4 5 6
CPV
T
0
2
4
6
8
10
12JD+Mt. Bisul
°JD+KD at 2.5°JD+KD at 2.0°JD+KD at 1.5
True Normal Ordering, Ordering Unknown
(rad.)cpδ0 1 2 3 4 5 6
CPV
T
0
2
4
6
8
10
12JD+Mt. Bisul
°JD+KD at 2.5°JD+KD at 2.0°JD+KD at 1.5
True Inverted Ordering, Ordering Unknown
FIG. 27: The significance for CP conservation rejection as a function of the true value of δcp and
the true mass ordering (left=normal, right=inverted). The top row shows the significance when
the mass ordering is determined using external data and Hyper-K atmospheric neutrinos, while
the bottom row shows the significance when the mass ordering is determined only by accelerator
neutrinos observed in the Hyper-K detectors . Results are shown for the Mt. Bisul site and the
generic Korean sites.
spallation rate would enhance the sensitivity to hep solar neutrinos. With lower background,
short time variability of the temperature in the solar core could be monitored with better
sensitivity or shorter time scale. The sensitivity to the energy spectrum upturn might be
improved thanks to the lower background level in the higher energy region, which gives the
baseline for the spectrum shape.
The neutrinos produced by all of the supernova explosions since the beginning of the
53
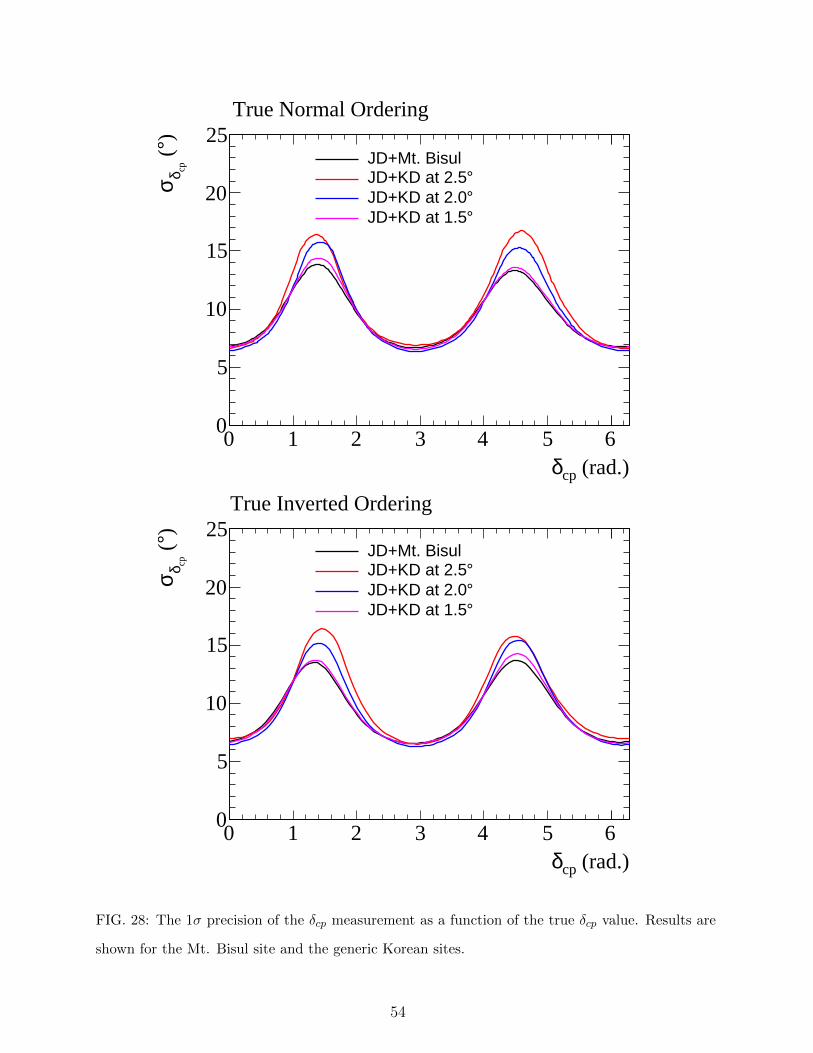
(rad.)cpδ0 1 2 3 4 5 6
)° (
cpδσ
0
5
10
15
20
25JD+Mt. Bisul
°JD+KD at 2.5°JD+KD at 2.0°JD+KD at 1.5
True Normal Ordering
(rad.)cpδ0 1 2 3 4 5 6
)° (
cpδσ
0
5
10
15
20
25JD+Mt. Bisul
°JD+KD at 2.5°JD+KD at 2.0°JD+KD at 1.5
True Inverted Ordering
FIG. 28: The 1σ precision of the δcp measurement as a function of the true δcp value. Results are
shown for the Mt. Bisul site and the generic Korean sites.
54
universe are called supernova relic neutrinos (SRN). A lower spallation background rate will
enhance the SRN detection capability below 20 MeV, which is important for the measure-
ment of SRN energy spectrum and thus study of the history of supernova bursts. With a
capability to tag neutrons, it will be also possible to detect neutrinos from nuclear reactors
in Korea using inverse beta decay.
B. Neutrino geophysics
The inner Earth chemical composition is one of the most important properties of our home
planet. While Earth’s matter density is well known through seismic measurements [41], the
inner chemical composition is much less understood [32]. Neutrino oscillations depend on the
electron density of the medium that is traversed by the neutrinos [29, 30], hence, the electron
density distribution of the Earth can be reconstructed from the neutrino energy spectrum,
and the chemical composition distribution of the Earth can be constrained for a given mass
density distribution [33, 34]. Hyper-K is expected to be the first experiment that could
experimentally confirm an iron Earth core with respect to lead or water at a 3 σ level [19].
The measurement relies on precisely measuring atmospheric muon neutrino disappearance
and electron neutrino appearance in the energy range of 1− 8 GeV as function of the zenith
angle. A Korean detector will bring the benefit of having two detectors at different locations,
which could potentially lead to reduced systematic uncertainties related to the atmospheric
neutrino flux. In the case of a nearby supernova, the different detector locations might also
provide sensitivity to the Earth composition due to the different path of the burst neutrinos
through the Earth. For a single detector it might not be possible to uniquely disentangle
matter effects from supernova burst neutrino properties.
C. Dark matter searches
Hyper-K can search for physics beyond the standard model in the form of self-annihilating
dark matter captured in the Sun, Earth or from the Galactic dark matter halo. Super-K has
demonstrated this physics potential through the world’s best constraints on spin-dependent
scattering of dark matter with matter [35]. Hyper-K can improve upon Super-K’s results
and is expected to provide the best indirect dark matter search sensitivities for masses
55
below 100 GeV. As the background to a neutrino signal from dark matter annihilation in
the Sun comes from atmospheric neutrinos a benefit from a second site could come from
reduced systematic uncertainties associated with atmospheric neutrino fluxes. A neutrino
signal originating from the decays of the dark matter annihilation products in the Sun is
also accompanied by a high multiplicity stopped meson decay low-energy neutrino signal
from hadronic showers of the annihilation products in the center of the Sun [36–38]. The
expected signal consists of neutrinos of a few ten’s of MeV from muon decays at rest in the
Sun as well as neutrino line signals at 29.8 MeV and 235.5 MeV from two-body charged
pion and kaon decays at rest. The possible addition of gadolinium in water [39] would
reduce (invisible muon) backgrounds significantly for this signal, which can very efficiently
be detected through the inverse beta decay reaction [36].
D. Non standard neutrino interactions
T2HKK with the νµ(νµ) disappearance experiments could be also a powerful probe of
nonstandard physics related with neutrinos. In Ref. [40], various types of non-standard
new physics scenarios for neutrinos have been considered: (i) quantum decoherence, (ii)
tiny violation of Lorentz symmetry with/without CPT invariance, and (iii) nonstandard
neutrino interactions with matter. In most cases, the T2HKK setup can make significant
improvements on the bounds on possible new physics effects on neutrino sectors, since two
detector system can measure spectral distortion of neutrino beams more accurately than
one detector systems. See Tables I, II and Fig. 6 in Ref. [40] for more details.
V. SUMMARY AND CONCLUSION
Sensitivity studies have been performed comparing several configurations of T2HKK,
where one detector module is placed at Kamioka 2.5◦ off-axis and 295 km from the J-
PARC neutrino beam and the other is placed in Korea 1◦ − 3◦ off-axis with a baseline of
1100−1300 km. Most of the systematic error estimates used in this study are based on
the current systematic uncertainties used in recent T2K oscillation analyses [27]. There
are several candidate sites for the detector in Korea. Two candidate sites are particularly
attractive for the detector. The site of Mt. Bisul (Mt. Bohyun) with 1084 (1126) m in
56
height is situated at 1.3◦(2.2◦) off-axis and 1088 (1040) km baseline distance. These studies
illustrate that a larger matter effect and the second oscillation maximum occurrence with a
detector in Korea can improve sensitivity for determining the neutrino mass ordering and
leptonic δCP measurements, with respect to the 2nd Hyper-K detector in Kamioka. For
example, the significance of rejecting a wrong mass ordering is greater than 6 σ for all
values of δCP at the Mt. Bisul site. They also illustrate an enhancement coming from the
T2HKK configuration if one combines information from two significantly different baselines.
Searches for non-standard neutrino interactions are also expected to be improved.
The large overburden (> 800 m) of the candidate sites in Korea provides additional
benefits for low energy neutrino physics including the study of solar neutrinos and the
search for supernova neutrinos due to a lower spallation background rate.
Further sensitivity studies with more realistic and smaller systematic uncertainties will
be performed in the near future. They will provide more improved sensitivities for neutrino
mass ordering and the CP violation phase measurement. Additional benefits for low energy
neutrino physics will be estimated in a more quantitative way. Based on the potential
for significant improvements in physics sensitivities, T2HKK shows a viable and attractive
option as an alternative to the default T2HK configuration with two detector modules in
Kamioka.
ACKNOWLEDGEMENTS
This work was supported by MEXT Grant-in-Aid for Scientic Research on Innovative
Areas Number 25105004, titled “Unification and Development of the Neutrino Science
Frontier.” In addition, participation of individual researchers has been further supported
by funds from JSPS, Japan; the European Union ERC-207282, H2020 RISE-GA644294-
JENNIFER and H2020 RISE-GA641540-SKPLUS; NRF grants No. 2009-0083526, NRF-
2015R1A2A1A05001869 and NRF-2016R1D1A3B02010606 funded by the Korean govern-
ment (MSIP); RSF, RFBR and MES, Russia; JSPS and RFBR under the Japan-Russia
Research Cooperative Program; Brazilian National Council for Scientific and Technological
Development (CNPq); STFC, UK.
57
[1] K. Abe et al. (Hyper-Kamiokande Working Group), arXiv:1412.4673 (2015); K. Abe et al.
[Hyper-Kamiokande Proto-Collaboration], PTEP 2015, 053C02 (2015) [arXiv:1502.05199
[hep-ex]].
[2] Y. Fukuda et al. (Super-Kamiokande Collaboration), Phys. Rev. Lett. 81, 1562 (1998).
[3] S. B. Kim, in Proceedings of the KOSEF-JSPS Joint Seminar on New Developments in Neu-
trino Physics, Seoul, Korea, 2000 (Korea Institute for Advanced Study, Seoul, 2000), p. 182.
[4] K. Hagiwara, Nucl. Phys. Proc. Suppl. 137, 84 (2004) [hep-ph/0410229].
[5] M. Ishitsuka, T. Kajita, H. Minakata and H. Nunokawa, Phys. Rev. D 72, 033003 (2005).
[6] T. Kajita, H. Minakata, S. Nakayama, and H. Nunokawa, Phys. Rev. D 75, 013006 (2007).
[7] F. Dufour, T. Kajita, E. Kearns and K. Okumura, Phys. Rev. D 81, 093001 (2010).
[8] K. Hagiwara, N. Okamura, K. Senda, Phys. Lett. B 637, 266 (2006), Erratum: Phys. Lett. B
641, 491 (2006).
[9] K. Hagiwara, N. Okamura, K. Senda, Phys. Rev. D 76, 093002 (2007).
[10] T. Kajita and H. Minakata, ”Highlights in the T2KK Workshops in 2005 and 2006”, http://
www-rccn.icrr.u-tokyo.ac.jp/workshop/T2KK07/proceedings/t2kk-pdf/003-014.pdf;
T. Kajita, S.B. Kim, A. Rubbia, arXiv: 0808.0650 (2008); 3rd International Workshop on a
Far Detector in Korea for the J-PARC Neutrino Beam 30 Sep - 1 Oct 2007. Tokyo, Japan
PROCEEDINGS. Edited by T. Kajita, S.B. Kim. Tokyo, Univ. Acad. Pr., 2008. 173p.
[11] K. Abe et al. [T2K Collaboration], Phys. Rev. Lett. 107, 041801 (2011) [arXiv:1106.2822
[hep-ex]].
[12] Y. Abe et al. (Double Chooz Collaboration), Phys. Rev. Lett. 108, 131801 (2012).
[13] F. P. An et al. (Daya Bay Collaboration), Phys. Rev. Lett. 108, 171803 (2012).
[14] J. K. Ahn et al. (RENO Collaboration), Phys. Rev. Lett. 108, 191802 (2012).
[15] K. Abe et al. [T2K Collaboration], Phys. Rev. Lett. 112, 061802 (2014). [arXiv:1311.4750
[hep-ex]]
[16] Y. Abe et al. (Double Chooz Collaboration), JHEP 1410, 86 (2014).
[17] F. P. An et al. (Daya Bay Collaboration), Phys. Rev. Lett. 115, 111802 (2015).
[18] J. Choi et al. (RENO Collaboration), Phys. Rev. Lett. 116, 211802 (2016).
[19] K. Abe et al. [Hyper-Kamiokande Proto-Collaboration], “Hyper-Kamiokande Design Report”
58
KEK-PREPRINT-2016-21, ICRR-REPORT-701-2016-1.
[20] K. Abe et al. [T2K Collaboration], Nucl. Instrum. Meth. A 659, 106 (2011) [arXiv:1106.1238
[physics.ins-det]].
[21] S. Bhadra et al. [nuPRISM Collaboration], arXiv:1412.3086 [physics.ins-det]; C. Andreopoulos
et al., arXiv:1606.08114 [physics.ins-det].
[22] I. Girardia, S. T. Petcov, and A. V. Titov Nucl. Phys. B 894, 733 (2015).
[23] H. Nunokawa, S. J. Parke and J. W. F. Valle, Prog. Part. Nucl. Phys. 60, 338 (2008)
[arXiv:0710.0554 [hep-ph]].
[24] Y. Hayato, Acta Phys. Polon. B 40, 2477 (2009).
[25] http://www.phy.duke.edu/∼raw22/public/Prob3++/
[26] K. Hagiwara, N. Okamura and K.I. Senda, JHEP 1109, 082 (2011) [arXiv:1107.5857 [hep-ph]].
[27] K. Abe et al. [T2K Collaboration], Phys. Rev. D 91, 072010 (2015) [arXiv:1502.01550 [hep-
ex]].
[28] M. Day and K. S. McFarland, Phys. Rev. D 86, 053003 (2012) [arXiv:1206.6745 [hep-ph]].
[29] L. Wolfenstein, Phys. Rev. D 17, 2369 (1978).
[30] S. P. Mikheev and A. Y. Smirnov, Sov. J. Nucl. Phys. 42, 913 (1985); Yad. Fiz. 42, 1441
(1985).
[31] S. P. Mikheev and A. Y. Smirnov, Nuovo Cim. C 9, 17 (1986).
[32] W. McDonough and S. Sun, Chem. Geol. 120, 223 (1995).
[33] C. Rott, A. Taketa and D. Bose, Scientific Reports 5, Article number: 15225 (2015)
[arXiv:1502.04930 [physics.geo-ph]].
[34] W. Winter, Nucl. Phys. B 908, 250 (2016) [arXiv:1511.05154 [hep-ph]].
[35] K. Choi et al. [Super-Kamiokande Collaboration], Phys. Rev. Lett. 114, 141301 (2015)
[arXiv:1503.04858 [hep-ex]].
[36] C. Rott, J. Siegal-Gaskins and J. F. Beacom, Phys. Rev. D 88, 055005 (2013) [arXiv:1208.0827
[astro-ph.HE]].
[37] N. Bernal, J. Martin-Albo and S. Palomares-Ruiz, JCAP 1308, 011 (2013) [arXiv:1208.0834
[hep-ph]].
[38] C. Rott, S. In, J. Kumar and D. Yaylali, JCAP 1511, 039 (2015) [arXiv:1510.00170 [hep-ph]].
[39] J. F. Beacom and M. R. Vagins, Phys. Rev. Lett. 93, 171101 (2004) [hep-ph/0309300].
[40] N. C. Ribeiro, H. Nunokawa, T. Kajita, S. Nakayama, P. Ko and H. Minakata, Phys. Rev. D
59
77, 073007 (2008) [arXiv:0712.4314 [hep-ph]].
[41] A. M. Dziewonski and D. L. Anderson, Phys. Earth Planet. Interiors 25, 297 (1981).
[42] As a reference, for the Super-K site (1,000 m overburden), the muon spallation background
rate is a factor of four smaller than what is expected for the HK first tank site.
60