Embed Size (px)
Citation preview
Copyright 2006 1
Determination of Sewage Contamination on Personal Belongings or Equipment Following Flooding or Waste System Malfunctions
POPO--109109American Industrial Hygiene Conference and Exposition
May 13-16, 2006
Chicago, Illinois
David Regelbrugge, CIH, CSPGary N. Crawford, CIHFelice Holcomb, MSPHJeff RuhlPH: 847-692-4700E-Mail: [email protected]

2
Introduction
• “Bacterial monitoring is messy”– Physically messy especially in the case of
sewage back-ups/flooding– Monitoring results do not always support
original hypothesis

3
Background
• Sewage contamination due to:– Natural disasters
• Flooding• Hurricanes
– Malfunctions • Pipe breaks• Back-ups in basements

4
Background
• When back-ups occur – Occupants may be exposed to raw sewage– Building materials become contaminated with
sewage
5
Background
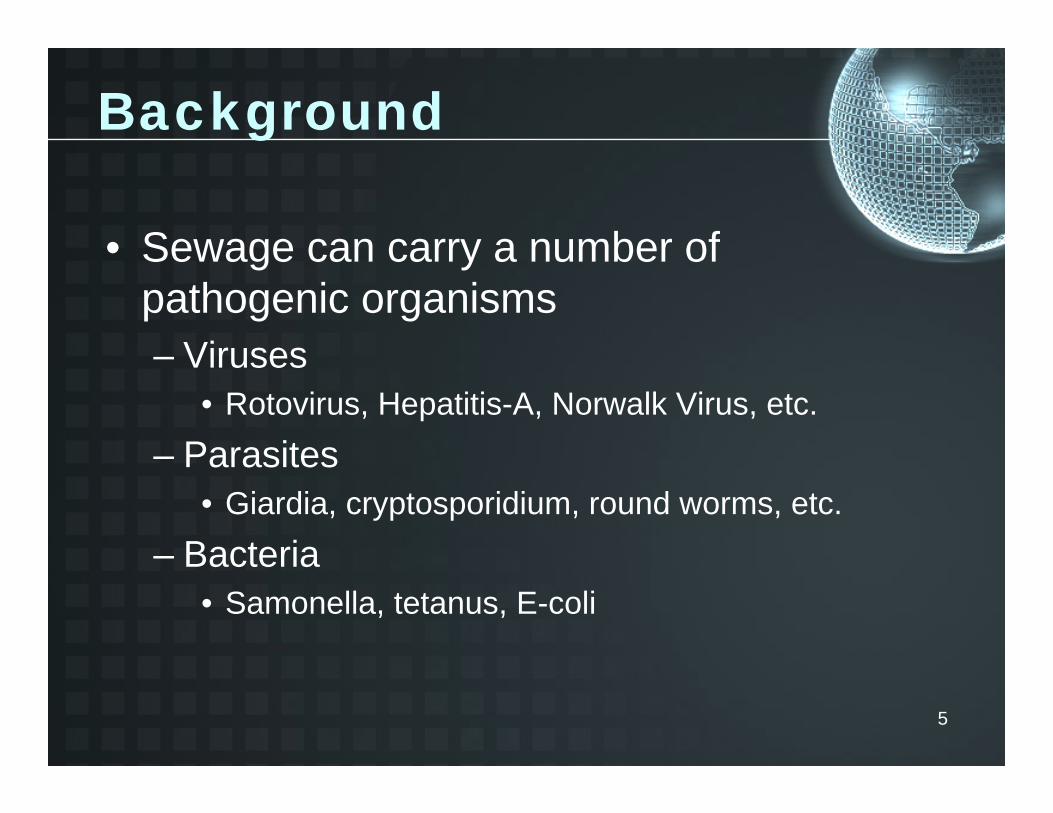
• Sewage can carry a number of pathogenic organisms– Viruses
• Rotovirus, Hepatitis-A, Norwalk Virus, etc.– Parasites
• Giardia, cryptosporidium, round worms, etc.– Bacteria
• Samonella, tetanus, E-coli

6
BackgroundBackground
• Institute of Inspection, Cleaning and Restoration Certification (IICRC) Standard and Reference Guide for Professional Water Damage Restoration S-500.– Classifies sewage incidents as a Category 3-
Black Water event• Black Water contains potential pathogens
– e.g., sewage and/or water from seaways, rivers, streams, etc.

7
Background
• IICRC S-500 – Recommends that all items that had direct
contact with black water be decontaminated or disposed of (disposal up to the discretion of the remediators)
• Consistent with other recommendations and guidelines developed by the EPA, ACGIH, etc.

8
Background
• IICRC S-500 – No guidance as to how to determine if the
areas or remaining items were decontaminated adequately.
– Suggests that an indoor environmental consultant, environmental health specialist or IH evaluate the area prior to re-occupancy.

9
Assessment Strategy
• How is the IH to approach assessing these situations?– Visual inspection combined with moisture
measurements• No samples
• Clients usually wants physical evidence– Want simple yes/no answers– Present or Not Present– Air, bulk or swab samples usually collected

10
Assessment Strategy
• Bacterial samples commonly collected– Air
• Bacterial ID, Gram Positive Bacteria (GPB)/Gram Negative Bacteria (GNB)
– GNB usually associated with moisture/sewage
– Wipe/swab– GPB, GNB, bacterial ID, total coliform, fecal coliform and
E-coli absence/presence
– Dust/bulk– GPB, GNB, bacterial ID, total coliform, fecal coliform and
E-coli absence/presence

11
Case Study 1
Hospital Water Line Break

12
Case Study 1
• Hospital had a break in a chilled water that directly affected an office on the first floor. The water was discolored and had a foul odor. Repairs and remediation were performed but the hospital wanted a visual inspection of the affected areas and collection of air samples for bacteria.

13
Case Study 1
• Assessment Strategy– Ten Culturable Airborne Samples Collected
• NIOSH method 0800– Anderson N-6 Impactor– On tryptic soy agar (TSA)– At 28.3 liters per minute– Collected over a 2 minute period– Sent overnight to an AIHA EMLAP accredited laboratory
• Samples collected in concern and non-concern areas as well as outside

14
Case Study 1
• Results– Limited bacterial ID and the presence of GPB - GNB
• GNB often associated with moisture/sewage– Bacillus and Actinomycetes identified in a few of the
samples– GPB and GNB identified in almost all of the samples – Concentrations of GNB
• Non-detectable to 636 CFU/m3
• Highest concentration in mechanical room used for comparison purposes
• Remaining areas had similar GNB concentrations (Ave. 108 CFU/m3)

15
Case Study 1
Airborne GPB - GNB Concentrations
0100200300400500600700
1st F
loor O
ffice
Outside
Outside
Basem
ent M
echan
ical R
m
6th Fl. W
aiting R
m
3rd Fl. W
aiting
Rm.
1st F
l. Med
icine
Area
7 Fl. M
echa
ninca
l Rm.
6th Fl. N
urses
Stat
ion
3rd Fl. N
urses S
tation
Con
cent
ratio
n (C
FU/m
3)
GPBGNB
16
Case Study 1
• Conclusions– GPB and GNB found both in concern and
non-concern areas as well as outside the building.
• Results difficult to interpret due to prevalence of both GPB and GNB in environment.
17
Case Study 2
Leaky Drain Pipes

18
Case Study 2
• Recently purchased home, copper drain lines throughout the home had deteriorated allowing waste water to contaminate wall cavities, ducts, etc.

19
Case Study 2
1st Floor Bathroom, waste lines leaking above ceiling

20
Case Study 2
1st Floor Bathroom, waste lines leaking above ceiling

21
Case 2
• Damage observed

22
Case Study 2
Brown debris on PVC pipes below waste water lines
23
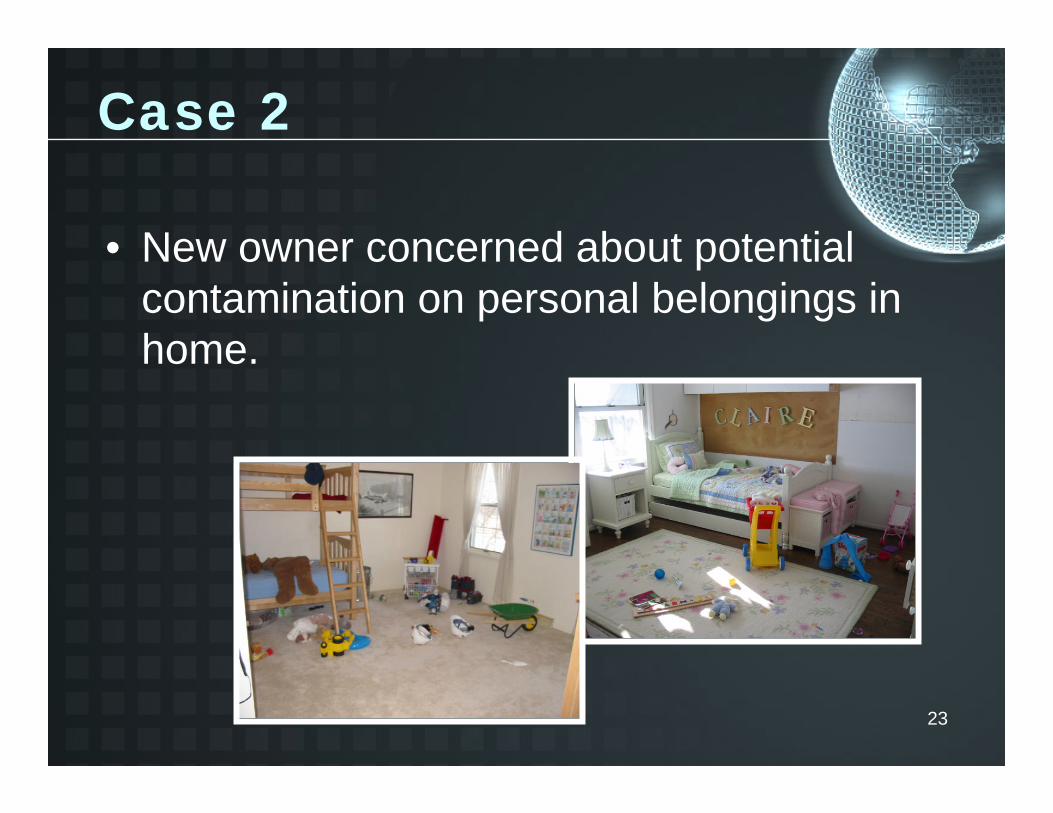
Case 2
• New owner concerned about potential contamination on personal belongings in home.
24
Case 2
• Assessment Strategy – Pre-remediation
• Collect surface dust and swab samples from known contaminated areas as well as personal belongings
• All samples collected using aseptic techniques

25
Case 2
• Pre-Remediation samples – Samples collected
• 3 bulk samples from contaminated areas• 6 dust samples from personal belongings
– Samples analyzed for bacterial ID & presence of GPB and GNB

26
Case 2
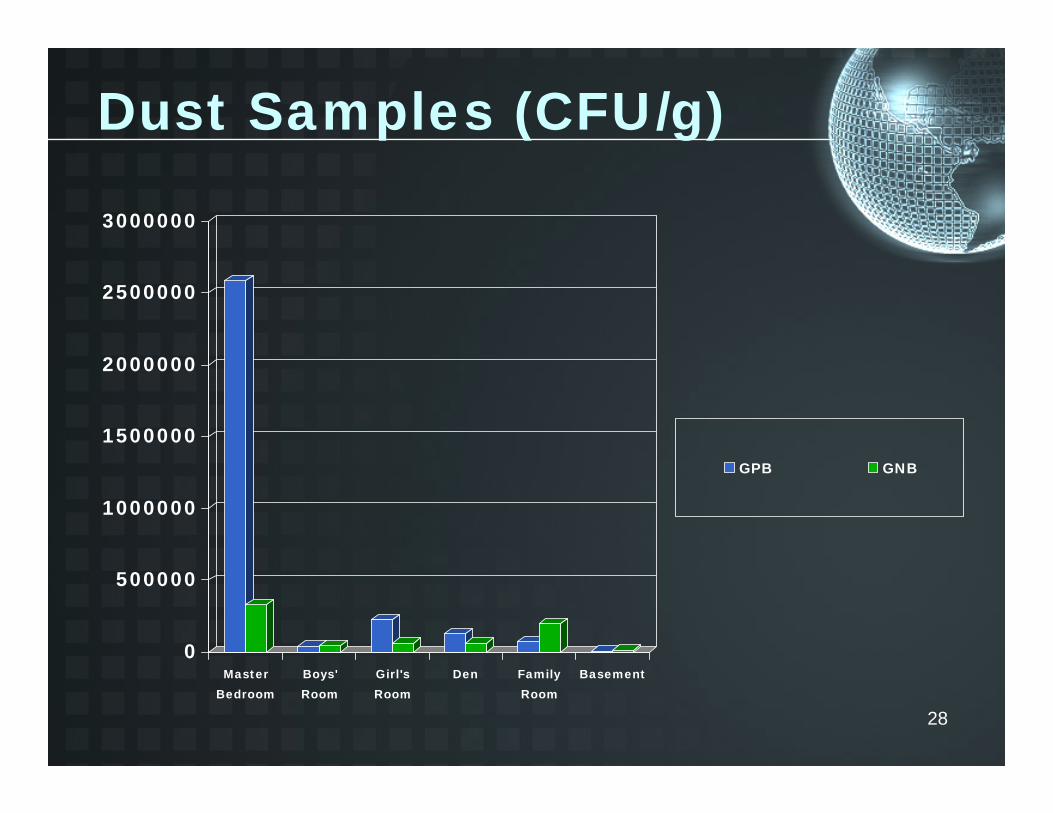
• Results– Pre-remediation dust sample results
• All dust samples analyzed for GPB and GNB– Highest concentrations of GNB found in a contaminated
wall cavity (1,700,000 CFU/g) – Two other samples collected in contaminated areas
indicated “no growth” or no GNB.– GPB and GNB found on personal belongings in similar
concentrations throughout the home.

27
Bulk Samples
0
1000000
2000000
3000000
4000000
5000000
6000000
DenCeiling
BRCeiling
ColumnDen
GPBGNB
Bulk samples of drywall from known contaminated areas (CFU/g)
28
Dust Samples (CFU/g)
0
500000
1000000
1500000
2000000
2500000
3000000
MasterBedroom
Boys'Room
Girl'sRoom
Den FamilyRoom
Basement
GPB GNB

29
Case Study 2
• Pre-remediation swab samples– 10 swab samples collected
• 4 from suspected contaminated areas• 6 from personal belongings
– Analyzed for:• Presence/absence of E-coli• Total coliforms • Fecal coliforms.

30
Case Study 2
• Results– Pre-remediation swab sample results
• E.-coli and fecal coliforms absent from all samples – including known contaminated areas
• Total coliform results mixed– Absent in contaminated areas – Present on the majority of personal belongs tested

31
Case Study 2
• Remediation – Performed throughout the home– Contaminated materials removed

32
Case Study 2
• Post remediation sampling performed– 3 Swab samples collected– Analyzed for fecal coliforms, total coliforms
and E.-coli• All were absent from the final samples
33
Conclusions
• Bacterial sampling is easy, interpretation of the results is difficult.
• Samples do not always support your hypothesis
• GNB and total coliforms are often isolated in normal environmental samples
• Results difficult to interpret
• Presence/absence of fecal coliforms and E-coli in dust/swab samples give a clear answer
• Samples may give false negatives – based on the age/condition of sample.
34
Recommendations
1. If possible avoid sampling- Samples may confuse the situation
2. Visual inspections are generally more useful than sampling
3. To avoid false negatives, sample for fecal coliforms or E.-coli as soon as possible after the incident

35
Speaker Contact Information:
David C. Regelbrugge, CIH, CSPDirector, Environmental Health & Safety
Boelter & Yates, Inc.847/685-9276