Embed Size (px)
Citation preview
Clin Pharmacokinet 2009; 48 (1): 51-62ORIGINAL RESEARCH ARTICLE 0312-5963/09/0001-0051/$49.95/0
© 2009 Adis Data Information BV. All rights reserved.
Population Pharmacokinetic Analysis ofLanreotide Autogel® in Healthy SubjectsEvidence for Injection Interval of Up to 2 Months
Inaki F. Troconiz,1 Josep-Maria Cendros,2 Concepcion Peraire,2 Joaquim Ramis,2 Maria J. Garrido,1
Paolo F. Boscani3 and Rosendo Obach2
1 Department of Pharmacy and Pharmaceutical Technology, School of Pharmacy, University of Navarra, Pamplona, Spain2 Pharmacokinetics and Metabolism Service, Ipsen Pharma S.A., Sant Feliu de Llobregat, Barcelona, Spain3 Ipsen S.p.A., Milan, Italy
Background and objective: Lanreotide is a somatostatin analogue used for the treatment of acromegaly andAbstractneuroendocrine tumours. The objective of this study was to develop a pharmacokinetic model for the sustained-release formulation lanreotide Autogel® after deep subcutaneous administration in healthy subjects, and toexplore the potential effect of covariates, especially sex and dose.
Subjects and methods: This was an open-label, single-centre, randomized, dose-ranging, parallel-group study,with a follow-up period of 4–7 months following drug administration in healthy subjects. Healthy Caucasiansubjects aged 18–45 years were included. Subjects received a rapid intravenous bolus of 7 µg/kg of animmediate-release formulation of lanreotide (lanreotide IRF). After a 3-day washout period, participants wererandomized to receive a single deep subcutaneous injection of lanreotide Autogel® at a dose of 60, 90 or 120 mg.
Pharmacokinetic and statistical analysis: Blood samples for lanreotide determination were obtained duringthe first 12 hours after the intravenous bolus injection and during the 4- to 7-month follow-up period after deepsubcutaneous administration of lanreotide Autogel®. Data after intravenous and subcutaneous administrationwere fitted simultaneously using the population approach in NONMEM® version VI software. The model wasvalidated externally using data from patients with acromegaly.
Results: In total, 50 healthy subjects (24 women and 26 men) received a single intravenous dose of lanreotideIRF. Of these, 38 subjects (18 women and 20 men) received a single subcutaneous dose of lanreotide Autogel®
3 days after intravenous lanreotide IRF. The disposition of lanreotide was described by a three-compartmentopen model. The estimates of the total volume of distribution and serum clearance were 15.1 L and 23.1 L/h,respectively. The estimates of interindividual variability were <40%. To evaluate lanreotide Autogel®
pharmacokinetics, the absorption rate was modelled to decrease exponentially as a function of the naturallogarithm of time. The absolute bioavailability after deep subcutaneous administration of lanreotide Autogel®
was 63%. The rate of absorption and bioavailability of lanreotide Autogel® were independent of the adminis-tered dose in the range from 60 to 120 mg, and no significant effect of covariates (sex, dose, age or bodyweight)was found (p > 0.05).
Conclusions: Population analysis allows a full description of the disposition of lanreotide after rapid intravenousbolus administration of lanreotide IRF (7 µg/kg) and the pharmacokinetics of lanreotide Autogel® after a singledeep subcutaneous injection (60, 90 or 120 mg) in healthy subjects. The model-based simulations providesupport for the feasibility of extending the dosing interval for lanreotide Autogel® to 56 days when given at120 mg. The absorption profile of lanreotide Autogel® was independent of the dose and was not affected by sex.
52 Troconiz et al.
Background meters, the design included a rapid intravenous bolus injection ofan immediate-release formulation of lanreotide (lanreotide IRF).
Lanreotide is a synthetic octapeptide somatostatin analogueStudy Participants and Methodsused to treat acromegaly and neuroendocrine tumours; it binds
preferentially to pituitary somatostatin receptors, inhibits growth This was an open-label, single-centre, randomized, pharmaco-hormone secretion and reduces insulin-like growth factor I kinetic phase I study involving three parallel groups of healthylevels.[1] An earlier extended-release lanreotide formulation based subjects. The study was conducted according to the Declaration ofon microparticles of lactide-glycolide copolymer allowed the re- Helsinki and Good Clinical Practice guidelines. The protocol waslease of the peptide over 7–14 days after intramuscular administra- reviewed and approved by the local ethics committee, and alltion.[2] The development of lanreotide Autogel® (Somatuline participants gave their written informed consent.Autogel®, Beaufour Ipsen, Dreux, France), a supersaturated solu-tion containing only lanreotide and water, for subcutaneous injec- Participantstion, extended the duration of release to a more convenient dosing
Inclusion of 54 healthy subjects was planned. Caucasian meninterval of at least 28 days.[3] This formulation, supplied as aand women fulfilling the following criteria were included: ageready-to-use preparation (of 60, 90 or 120 mg) in pre-filledbetween 18 and 45 years; bodyweight within 10% of the idealpolypropylene syringes, has good effectiveness and is well tolerat-height/frame; normal physical and laboratory test results; womened in patients; the main side-effects, which are of a gastrointestinalwith a negative pregnancy test who were not breastfeeding andnature,[4-6] have been similarly reported with other somatostatinwho were using appropriate contraceptive methods; willingnessanalogues given at therapeutic doses.[7]
and ability to understand and sign an approved informed consentA population model has recently been developed that relates
form.lanreotide serum concentrations at steady state after administration
The exclusion criteria were a history of alcohol (ethanol) orof lanreotide microparticles or lanreotide Autogel® with growth
drug abuse; smoking of >10 cigarettes/day; history of chole-hormone levels, estimating parameters associated with baseline
lithiasis or gastrointestinal, renal, hepatic, pulmonary or cardio-growth hormone levels, hormonal effectiveness and potency, as
vascular disease; history of epilepsy, asthma, diabetes mellitus,well as their corresponding degree of interindividual variability
psychosis or glaucoma; history of an allergic response to lanreo-(IIV).[8] The pharmacodynamic properties of lanreotide were inde-
tide or related drugs; blood donation of ≥250 mL or participationpendent of the formulation. However, a pharmacokinetic model
in a clinical trial in the 3 months before study initiation; practisingrelating the lanreotide serum concentration to the dose and time
vegetarian diet, abnormal diet or substantial changes in eatinghas not been developed; so far, only descriptors such as the
habits within the previous 4 weeks; treatment with any knownmaximum serum concentration (Cmax), minimum serum concen-
enzyme-inhibiting or enzyme-inducing agents in the 4 weekstration (Cmin) and area under the serum concentration-time curve
before study medication; and positive tests for HIV and/or hepati-(AUC) have been reported.[4,9] Such a model, when combined with
tis B and C.the pharmacodynamic model, could be used to explore the rela-tionship between growth hormone levels and time in different
Drug Administration and Sample Collectionclinical scenarios, taking into account the IIV in both pharmaco-
Participants received a single intravenous dose (7 µg/kg) ofkinetic and pharmacodynamic processes. Therefore, the main ob-lanreotide IRF by rapid intravenous bolus injection (less thanjective of the current analysis was to develop a population pharma-10 seconds), followed by 3 days of washout and then randomiza-cokinetic model after a single deep subcutaneous injection oftion to one of three single deep subcutaneous doses of lanreotidelanreotide Autogel®, quantifying the degree of IIV in the pharma-Autogel® (60, 90 or 120 mg) administered to the superior-externalcokinetic parameters. Differences in the pharmacokinetic proper-quadrant of the buttock. Lanreotide was administered in the morn-ties between males and females in the case of the subcutaneousing, and fasting conditions were not required.administration could be expected because of higher subcutaneous
fat levels in women.[10] Therefore, the study of the potential effect Lanreotide IRF was obtained by reconstituting lanreotide ly-of covariates of sex, in addition to the dose level, was also part of ophilisate with diluent (mannitol 40 mg/1 mL water for injections)the main objective of the analysis. To estimate the absolute bio- immediately before administration. The lanreotide Autogel® for-availability of lanreotide Autogel® and serum disposition para- mulation consists of lanreotide acetate and water (lanreotide base,
© 2009 Adis Data Information BV. All rights reserved. Clin Pharmacokinet 2009; 48 (1)
Population PK of Lanreotide Autogel® 53
0.246 mg/mg of solution); the hydration of the peptide leads to the difference in the MOFV of 3.84 and 6.63 points between twoformation of a supersaturated solution. nested models differing by one parameter was considered signif-
icant at the 5% and 1% levels, respectively. Since some ofBlood samples for determining serum lanreotide concentrationsthe models that were compared were not nested, the MOFVwere obtained at the following times after the intravenous boluswas not used directly for comparative purposes, and the valueinjection: at 0, 5, 15 and 30 minutes, then at 1, 1.5, 2, 4, 6, 8 and 12of the Akaike Information Criteria (AIC)[14] computed ashours. After deep subcutaneous administration, samples were tak-MOFV + 2 × Np, where Np is the number of the parameters in theen for at least 6 months at 0, 1, 2, 4, 6, 8 and 12 hours during themodel, was used instead. The model with the lowest value of thefirst day after administration and then on days 2, 3, 4, 5, 7, 14, 21,AIC, given that the precision of the model parameters and data28, 35, 42, 49, 56, 70, 84, 98 and 112, and afterwards if necessary,description was adequate, was selected.until a serum concentration below the lower limit of quantification
was reached. Drug disposition was described with compartmental modelsparameterized in apparent volumes of distribution, and distribu-
Determination of Serum Lanreotide Concentrations tion and elimination clearances. Different absorption models,[15]
including time-dependent absorption rate constants (ka), theA previously validated radioimmunoassay (RIA) procedure
Weibull model[16] and the transit compartment model,[17] werewas used to determine serum lanreotide concentrations.[9] The
tested to describe the absorption process after administration oflower limit of quantification was 0.078 ng/mL, and the overall
lanreotide Autogel®.precision (inter- and intra-assay), expressed as the coefficient of
Demographic characteristics (age, bodyweight, sex) and thevariation (CV), was 2.3–13.6% for concentrations between 0.1 and
dose level were first investigated one by one for any potential10 ng/mL.
effect of covariates on all parameters associated with IIV. Signif-icant covariates were then incorporated (starting with the covariate
Data Analysisleading to the largest drop in the MOFV) one at a time until the fullcovariate model was obtained. If a covariate was added but did notAll analyses were performed under the population approachcause a significant decrease in the MOFV, it was removed. Thisusing the Laplacian numerical estimation method with interactionwas followed by a backward-elimination process, wherebyand the nonparametric option implemented in NONMEM® ver-covariates that were found not to be significant were dropped onesion VI software (Icon Development Solutions, Ellicott City, MD,by one until no more could be eliminated. The levels of signifi-USA).[11]
cance used during the forward inclusion and backward eliminationAll observations were fitted simultaneously; however, in thewere 5% and 1%, respectively.first step, the model describing the disposition characteristics of
Model parameters were expressed as the corresponding esti-lanreotide in serum was developed using only the data obtainedmate with the relative standard error (RSE; i.e. the ratio betweenafter intravenous administration. Then the disposition model para-the standard error provided by NONMEM® and the parametermeters were re-estimated when the intravenous and subcutaneousestimate). The degree of IIV was expressed as the %CV and theobservations were fitted together. In the analyses, the data wereadditive residual variability as the standard deviation.logarithmically transformed. Approximately 10% of the observa-
A predictive check was used to assess the performance of thetions at later times after administration were below the lower limitselected population model by looking at the Cmax of lanreotide andof quantification (BLQ). BLQ observations were kept in thethe AUC from time zero to time of the last measurable concentra-dataset and were treated as censored observations (according totion (AUClast). One thousand studies were simulated with themethod 3 in Beal).[12] The method used to handle BLQ observa-selected pharmacokinetic model, and for each simulated dataset,tions in the current analyses was implemented in NONMEM®
the mean Cmax and AUClast were calculated for each dose levelversion VI based on recent documentation.[13] IIV was modelledand sex. Then the overall mean values of the Cmax and AUClastexponentially, and residual variability was initially modelled withacross the 1000 simulated studies were computed, as well as thea combined error model; if one of the components (additive or2.5th and 97.5th percentiles, and compared with the observedproportional) of the residual error was negligible, it was deletedmean values.from the model.
Model selection was done using the minimum objective func- The final model was further evaluated internally and externallytion value (MOFV), provided by NONMEM®, as a guide. A using the visual predictive check method.[18] For each dose level,
© 2009 Adis Data Information BV. All rights reserved. Clin Pharmacokinet 2009; 48 (1)

54 Troconiz et al.
1000 virtual individuals were generated on the basis of the esti-mates of the fixed- and random-effect parameters obtained fromthe selected model. The intervals including 95% of the simulatedconcentrations and the profile corresponding to the median wereconstructed and represented together with (i) the observed concen-tration values from the healthy subjects (internal validation) and(ii) the serum lanreotide values obtained from a phase II, multicen-tre, double-blind, placebo-controlled, repeated-dose, dose-rangingtrial involving 105 patients with acromegaly (external valida-tion).[19] The schedule corresponding to the fixed dose part of thisphase II study consisted of three phases: (i) washout (weeks –12 to0) – required only for patients who had been treated previously;(ii) double-blind, placebo-controlled (weeks 0–4) – a single deepsubcutaneous injection of placebo or lanreotide Autogel® 60, 90 or120 mg; (iii) single-blind, fixed-dose (weeks 4–20) – four consec-utive deep subcutaneous injections of lanreotide Autogel® 60, 90or 120 mg every 28 days. Blood samples for serum lanreotide
10–1
1
10
0.0 0.1 0.2 0.3 0.4 0.5
IRF 7 µg/kg IV Autogel® 60 mg SC100
10–1
1
10
100
10–1
1
10
100
10–1
1
10
100
0 20 40 60 80 100 120
0 20 40 60 80 100 120
Autogel® 90 mg SC
Ser
um la
nreo
tide
conc
entr
atio
n (n
g/m
L)
0 50 100 150 200
Autogel® 120 mg SC
Time (d)
a b
c d
Fig. 1. Individual serum lanreotide concentrations following a rapid intrave-nous (IV) bolus dose of 7 µg/kg of the immediate-release formulation (IRF)of lanreotide (a) or deep subcutaneous (SC) administration of lanreotideAutogel® at doses of 60 mg (b), 90 mg (c) or 120 mg (d).
determination were taken 4 weeks after the first injection and 1, 2,3 and 4 weeks after the third or fourth lanreotide Autogel® withdrew consent after other subjects described gastrointestinalinjection.[19] AEs). Therefore, 38 subjects were randomized to receive a single
subcutaneous dose of lanreotide Autogel®. As one volunteer sub-sequently withdrew from the study because of a serious AEResults(described in the Safety section), 37 subjects completed the studyaccording to the protocol. Table I lists the demographic and design
Study Participants characteristics of the current study.
Fifty healthy subjects received a single intravenous dose ofDescription of the Data
lanreotide IRF. Twelve subjects withdrew after this dose butbefore lanreotide Autogel® was administered (one withdrew be-
Individual observed lanreotide serum concentration-timecause of adverse events [AEs; nausea, vomiting, diarrhoea and
profiles for a single intravenous bolus of lanreotide IRF 7 µg/kgheadache]; one because of a concurrent illness [tonsillitis]; and ten
(24 women and 26 men) and for a single deep subcutaneousinjection of lanreotide Autogel® (18 women and 20 men; 60 mg,n = 13; 90 mg, n = 13; 120 mg, n = 12) are shown in figure 1.
Safety
More subjects in the lanreotide Autogel® groups had AEs thanin the lanreotide IRF group, but there were no specific dose-relatedtrends across the lanreotide Autogel® groups. Gastrointestinalevents were the most frequent AEs in all groups (lanreotide IRFand lanreotide Autogel®); in particular, nausea in the lanreotideIRF group, and diarrhoea, abdominal pain, abdominal distensionand vomiting in the lanreotide Autogel® groups. One serious AEwas reported, in which biliary colic occurred approximately3 months after the single deep subcutaneous dose of lanreotideAutogel® 60 mg and resolved after cholecystectomy.
Table I. Demographic and study characteristics for healthy subjects andpatients with acromegaly who were included in the study used for theexternal model validation
Parameter Healthy Patients withsubjects acromegaly
Age (y)a 27.6 (5.8) 53.3 (13.8)
Bodyweight (kg)a 67.1 (12.4) 83.8 (17.0)
Sex [n (%)]
female 24 (48) 56 (53)
male 26 (52) 49 (47)
Deep subcutaneous dose [n (%)]
60 mg 13 (34) 34 (32)
90 mg 13 (34) 36 (34)
120 mg 12 (32) 35 (33)
a Values are expressed as mean (SD).
© 2009 Adis Data Information BV. All rights reserved. Clin Pharmacokinet 2009; 48 (1)

Population PK of Lanreotide Autogel® 55
Pharmacokinetic Modelling Once the disposition model for lanreotide was selected, intrave-
nous and subcutaneous data were fitted simultaneously using aA total of 500 serum samples (109 were BLQ observations)
total of 1404 serum samples (143 were BLQ observations). Thefrom 50 subjects were used to initially select the dispositionconcentration-time profiles (figure 1) showed a similar pattern ofpharmacokinetic model of lanreotide after rapid intravenous bolusdrug release for the three dose levels of lanreotide Autogel® and aadministration. The pharmacokinetic profiles from two subjectslimited initial burst effect. The Cmax occurred 7–12 hours afterresembled an extravascular administration and therefore wereinjection. The mean Cmax values were 4.2, 8.4 and 6.8 ng/mL fortreated accordingly.
Lanreotide disposition was best described by a three-compart- the 60, 90 and 120 mg doses, respectively. From day 1 to the endment open model compared with the one- and two-compartment of the study (98, 112 and 112 days for the 60, 90 and 120 mgopen models (p < 0.01). IIV was significant for total serum doses, respectively), lanreotide serum concentrations decreasedclearance (CL) and the apparent volume of distribution of the gradually according to a pseudo first-order elimination profile,shallow peripheral compartment (Vp1; p < 0.01). Table II lists the reflecting prolonged release of the active compound from theresults from the four main models fitted to the intravenous data.
depot.Inclusion of IIV on the rest of the disposition parameters did not
Table II lists the main results obtained during the selection oflead to a significant decrease in the MOFV (p > 0.05). The off-the best absorption model. A zero-order absorption rate modeldiagonal elements of the variance-covariance Ω matrix were foundperformed significantly worse than model 6 in table II. Modelsto be non-significant (p > 0.05). The residual error was modelled
with an additive model. based on two parallel absorption processes, or on sequential zero
Table II. Results from the key models fitted to the data obtained during the development of the population pharmacokinetic model of lanreotide Autogel® inhealthy subjects
Model Model structure ∆MOFV
Disposition models
1 One compartment; ω2CL,Vc
2 Two compartments; ω2CL,Vc –190a
3 Three compartments; ω2CL,Vp1 –350a
4 Three compartments; ω2CL,Vc,Vp1 –350a
Absorption models
5 First-order absorption model; ω2ka,F
6 First-order absorption model, lag time; ω2ka,F –7.3b
7 Weibull model, lag time; ω2α,β,F –277.1b
8 Transit compartment model; ω2N,MTT,ka,F –35.1b
9 First-order absorption model [ka = kb × e–kc × ln(t)], lag time; ω2kb,kc,F –304.1b
Covariate models
10 Model 9; CL related to sex –0.66c
11 Model 9; F related to sex –0.394c
12 Model 9; kb related to sex –3.16c
13 Model 9; F related to dose 0.0c
a Change in MOFV with respect to model 1.
b Change in MOFV with respect to model 5.
c Change in MOFV with respect to model 9.
α = scale parameter in the Weibull model; β = shape parameter in the Weibull model; ∆MOFV = change in the minimum objective function value providedby NONMEM®; ω2 = variance of random effects; CL = total serum clearance; F = total bioavailability; ka = first-order absorption rate constant; kb = first-order absorption rate constant 24 h after administration; kc = first-order rate constant governing the exponential decrease in the kb as a function of ln(t);MTT = mean transit time; N = number of transit compartments; t = time after drug administration; Vc = apparent volume of distribution of the centralcompartment; Vp1 = apparent volume of distribution of the shallow peripheral compartment.
© 2009 Adis Data Information BV. All rights reserved. Clin Pharmacokinet 2009; 48 (1)
56 Troconiz et al.
Models 10–13 in table II list some of the results obtained whencovariates were incorporated into model 9. All of the covariatestested (bodyweight, age, sex and dose level) elicited only verymarginal decreases in the MOFV with respect to model 9(p > 0.05), and therefore none of them were incorporated into themodel.
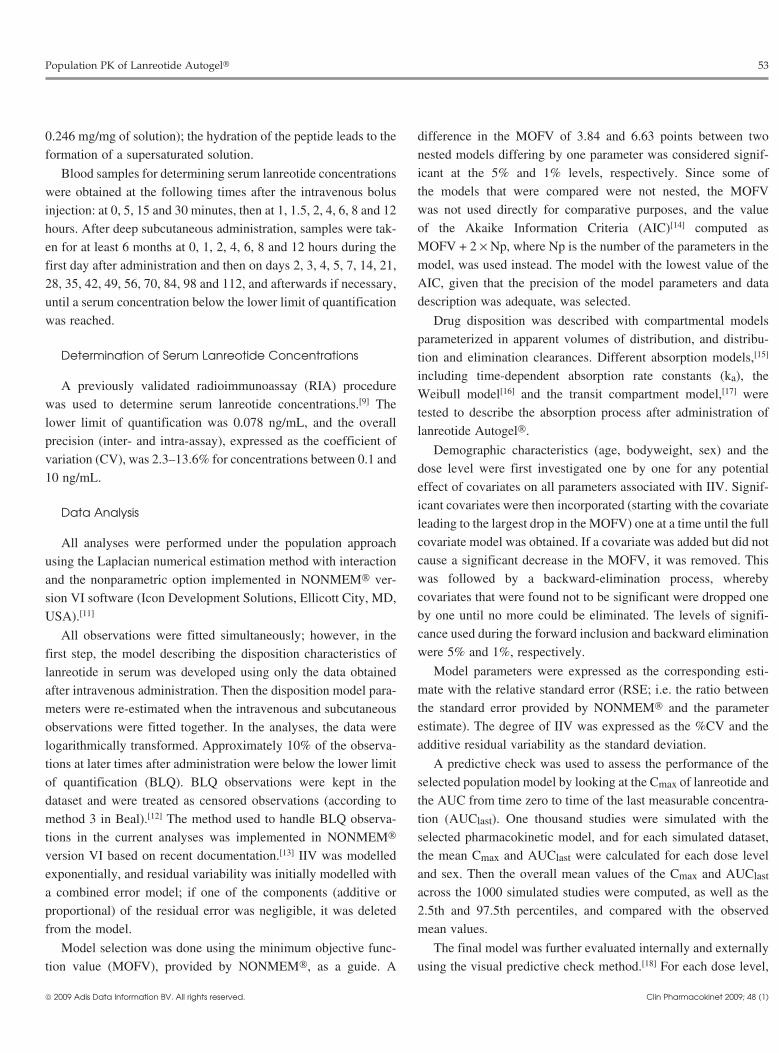
The data supported the estimation of five diagonal elements ofthe Ω matrix. In order to test the presence of covariance betweenthe diagonal elements, the corresponding correlation coefficientswere computed from the full Ω matrix obtained in thenonparametric step. All correlation coefficients were below 0.3,with the exception of the ones corresponding to CL versus F andkb versus kc, with values of 0.52 and 0.53, respectively. Whenthose two off-diagonal elements were tested in NONMEM®, both
Absorption (depot)compartment
Centralcompartment
Vc
ka = kb × e–kc × In(t) Lag time, F
Shallow peripheralcompartment
Vp1
Deep peripheralcompartment
Vp2
CL
Fig. 2. Schematic representation of the model describing serum lanreotidekinetics after intravenous or deep subcutaneous administration. CL = totalserum clearance; F = total bioavailability; ka = first-order rate constant ofabsorption; kb = value of the ka 24 h after administration; kc = first-orderrate constant governing the exponential decrease in the kb as a function ofln(t); t = time after drug administration; Vc = apparent volume of distributionof the central compartment; Vp1 = apparent volume of distribution of theshallow peripheral compartment; Vp2 = apparent volume of distribution ofthe deep peripheral compartment.
were non-significant (p > 0.05).
and first-order absorption processes, did not perform significantly Table III lists the population model parameter estimates of thebetter than model 6 (table II). selected population pharmacokinetic model represented in figure
2. All parameters were estimated with good precision and, whenThree additional absorption models were also tested, and all ofthem fitted the data significantly better than model 6 (first-orderabsorption model). Model 9, where the ka was modelled as afunction of time after administration, represented the best model,with a decrease in the MOFV of 27 and 269 points with respect tothe Weibull model (model 7) and the transit compartment model(model 8), respectively. In model 9, the ka was modelled as anexponential decrease (to prevent the ka from being negative) usingequation 1:
ka = kb × e–kc × 1n(t)
(Eq. 1)
where kb is the value of the ka 24 hours after administration, kc isthe first-order rate constant governing the exponential decrease inthe kb as a function of ln(time) and t represents the time after drugadministration. Model 9 provided a decrease in the MOFV of264.7 points with respect to the model where the ka was modelledas equation 2:
ka = kb × e–kc × t
(Eq. 2)
The inclusion of a lag time and incomplete absolute bioavaila-bility (F) were both significant (p < 0.01). The data supported theincorporation of IIV on F, kb and kc (p < 0.01) in addition to CLand Vp1. A different estimation of the variance in the additiveresidual error between the intravenous and subcutaneous data wasincluded in the model. Figure 2 represents the model structurecorresponding to model 9 in table II and shows all of the estimatedparameters in the model.
Table III. Population pharmacokinetic model parameter estimates of lan-reotide in healthy subjects after rapid bolus intravenous administration ofan immediate-release formulation of lanreotide and after deep subcutane-ous administration of lanreotide Autogel®
Parameter Estimatea IIV [%CV]a
CL [L/d] 554 (0.045) 20 (0.24)
Vc [L] 5.29 (0.12) NE
CLD1 [L/d] 358 (0.14) NE
Vp1 [L] 4.99 (0.19) 38 (0.43)
CLD2 [L/d] 51.4 (0.12) NE
Vp2 [L] 4.86 (0.06) NE
kb [d–1] 0.038 (0.12) 42 (0.32)
kc [d–1] 0.079 (0.30) 96 (0.58)
Lag time [d] 0.036 (0.03) NE
Bioavailability [%] 63 (0.09) 30 (0.27)
Residual error (SD) – intravenous 0.21 (0.053) NA
Residual error (SD) – subcutaneous 0.31 (0.02) NA
a Values in parentheses are relative standard errors.
CL = total serum clearance; CLD1 = distribution clearance between thecentral and shallow peripheral compartments; CLD2 = distributionclearance between the central and deep peripheral compartments; IIV =interindividual variability; kb = first-order rate constant of absorption 24 hafter administration; kc = first-order rate constant governing theexponential decrease in the kb as a function of ln(time); NA = notapplicable; NE = not estimated in the model; SD = standard deviation in logscale; Vc = apparent volume of distribution of the central compartment;Vp1 = apparent volume of distribution of the shallow peripheralcompartment; Vp2 = apparent volume of distribution of the deep peripheralcompartment.
© 2009 Adis Data Information BV. All rights reserved. Clin Pharmacokinet 2009; 48 (1)
Population PK of Lanreotide Autogel® 57
10–1
1
10
0.0 0.1 0.2 0.3 0.4 0.5
IRF 7 µg/kg IV Autogel® 60 mg SC
10–1
1
10
10–1
1
10
10–1
1
10
0
0
50 100 150 200
50 100 150 200
Autogel® 90 mg SC
Ser
um la
nreo
tide
conc
entr
atio
n (n
g/m
L)
0 50 100 150 200
Autogel® 120 mg SC
Time (d)
a b
c d
LLQLLQ
LLQLLQ
MalesFemales
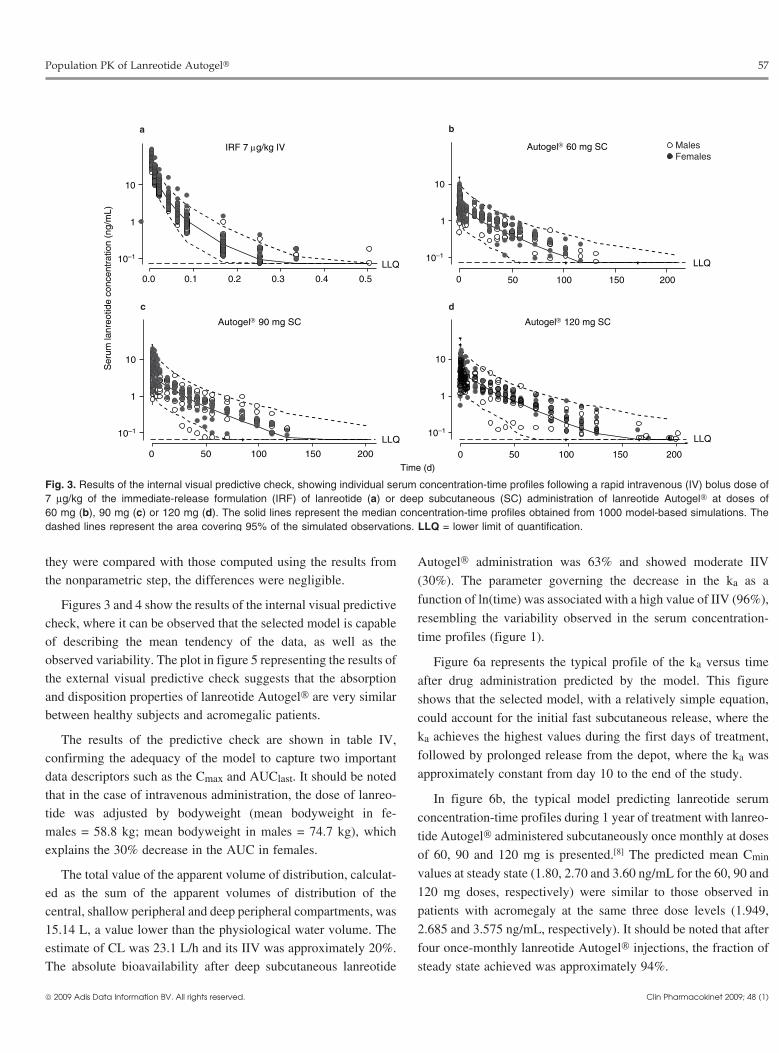
Fig. 3. Results of the internal visual predictive check, showing individual serum concentration-time profiles following a rapid intravenous (IV) bolus dose of7 µg/kg of the immediate-release formulation (IRF) of lanreotide (a) or deep subcutaneous (SC) administration of lanreotide Autogel® at doses of60 mg (b), 90 mg (c) or 120 mg (d). The solid lines represent the median concentration-time profiles obtained from 1000 model-based simulations. Thedashed lines represent the area covering 95% of the simulated observations. LLQ = lower limit of quantification.
they were compared with those computed using the results from Autogel® administration was 63% and showed moderate IIVthe nonparametric step, the differences were negligible. (30%). The parameter governing the decrease in the ka as a
function of ln(time) was associated with a high value of IIV (96%),Figures 3 and 4 show the results of the internal visual predictiveresembling the variability observed in the serum concentration-check, where it can be observed that the selected model is capabletime profiles (figure 1).of describing the mean tendency of the data, as well as the
observed variability. The plot in figure 5 representing the results of Figure 6a represents the typical profile of the ka versus timethe external visual predictive check suggests that the absorption after drug administration predicted by the model. This figureand disposition properties of lanreotide Autogel® are very similar shows that the selected model, with a relatively simple equation,between healthy subjects and acromegalic patients. could account for the initial fast subcutaneous release, where the
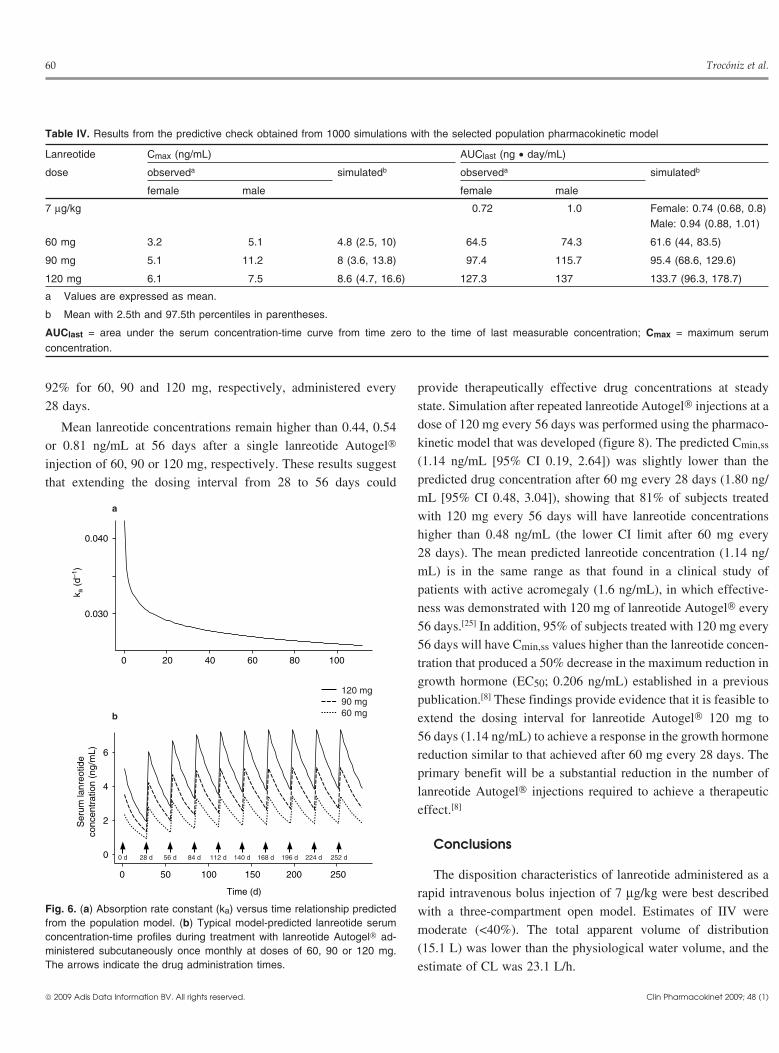
ka achieves the highest values during the first days of treatment,The results of the predictive check are shown in table IV,followed by prolonged release from the depot, where the ka wasconfirming the adequacy of the model to capture two importantapproximately constant from day 10 to the end of the study.data descriptors such as the Cmax and AUClast. It should be noted
that in the case of intravenous administration, the dose of lanreo- In figure 6b, the typical model predicting lanreotide serumtide was adjusted by bodyweight (mean bodyweight in fe- concentration-time profiles during 1 year of treatment with lanreo-males = 58.8 kg; mean bodyweight in males = 74.7 kg), which tide Autogel® administered subcutaneously once monthly at dosesexplains the 30% decrease in the AUC in females. of 60, 90 and 120 mg is presented.[8] The predicted mean Cmin
values at steady state (1.80, 2.70 and 3.60 ng/mL for the 60, 90 andThe total value of the apparent volume of distribution, calculat-120 mg doses, respectively) were similar to those observed ined as the sum of the apparent volumes of distribution of thepatients with acromegaly at the same three dose levels (1.949,central, shallow peripheral and deep peripheral compartments, was2.685 and 3.575 ng/mL, respectively). It should be noted that after15.14 L, a value lower than the physiological water volume. Thefour once-monthly lanreotide Autogel® injections, the fraction ofestimate of CL was 23.1 L/h and its IIV was approximately 20%.
The absolute bioavailability after deep subcutaneous lanreotide steady state achieved was approximately 94%.
© 2009 Adis Data Information BV. All rights reserved. Clin Pharmacokinet 2009; 48 (1)
58 Troconiz et al.
10–1
1
10
IRF 7 µg/kg IV Autogel® 60 mg IV
10–1
1
10
10–1
1
10
10–1
1
10
Autogel® 90 mg SC
Ser
um la
nreo
tide
conc
entr
atio
n (n
g/m
L)
Autogel® 120 mg SC
Time (d)
a b
c d
0.00 0.02 0.04 0.06 0.08 0.10 0 2 4 6
0 2 4 60 2 4 6
LLQLLQ
LLQLLQ
MalesFemales
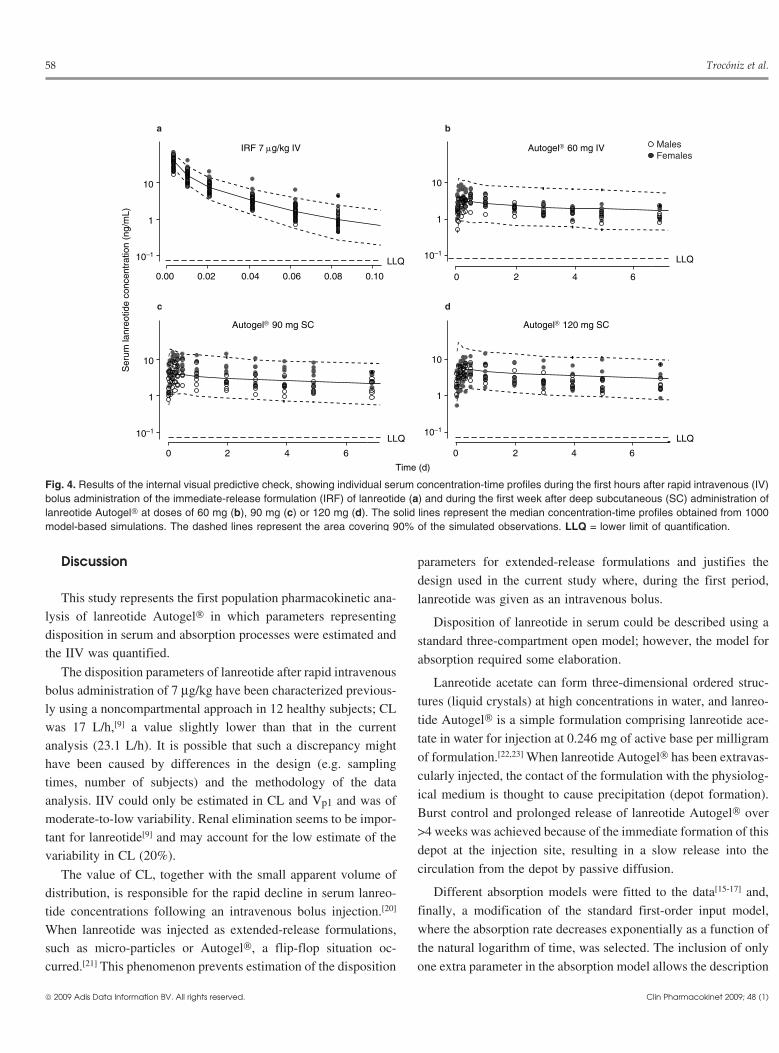
Fig. 4. Results of the internal visual predictive check, showing individual serum concentration-time profiles during the first hours after rapid intravenous (IV)bolus administration of the immediate-release formulation (IRF) of lanreotide (a) and during the first week after deep subcutaneous (SC) administration oflanreotide Autogel® at doses of 60 mg (b), 90 mg (c) or 120 mg (d). The solid lines represent the median concentration-time profiles obtained from 1000model-based simulations. The dashed lines represent the area covering 90% of the simulated observations. LLQ = lower limit of quantification.
Discussion parameters for extended-release formulations and justifies the
design used in the current study where, during the first period,This study represents the first population pharmacokinetic ana- lanreotide was given as an intravenous bolus.
lysis of lanreotide Autogel® in which parameters representing Disposition of lanreotide in serum could be described using adisposition in serum and absorption processes were estimated and standard three-compartment open model; however, the model forthe IIV was quantified. absorption required some elaboration.
The disposition parameters of lanreotide after rapid intravenousLanreotide acetate can form three-dimensional ordered struc-
bolus administration of 7 µg/kg have been characterized previous-tures (liquid crystals) at high concentrations in water, and lanreo-
ly using a noncompartmental approach in 12 healthy subjects; CLtide Autogel® is a simple formulation comprising lanreotide ace-was 17 L/h,[9] a value slightly lower than that in the currenttate in water for injection at 0.246 mg of active base per milligramanalysis (23.1 L/h). It is possible that such a discrepancy mightof formulation.[22,23] When lanreotide Autogel® has been extravas-have been caused by differences in the design (e.g. samplingcularly injected, the contact of the formulation with the physiolog-times, number of subjects) and the methodology of the dataical medium is thought to cause precipitation (depot formation).analysis. IIV could only be estimated in CL and Vp1 and was ofBurst control and prolonged release of lanreotide Autogel® overmoderate-to-low variability. Renal elimination seems to be impor->4 weeks was achieved because of the immediate formation of thistant for lanreotide[9] and may account for the low estimate of thedepot at the injection site, resulting in a slow release into thevariability in CL (20%).circulation from the depot by passive diffusion.The value of CL, together with the small apparent volume of
Different absorption models were fitted to the data[15-17] and,distribution, is responsible for the rapid decline in serum lanreo-finally, a modification of the standard first-order input model,tide concentrations following an intravenous bolus injection.[20]
where the absorption rate decreases exponentially as a function ofWhen lanreotide was injected as extended-release formulations,the natural logarithm of time, was selected. The inclusion of onlysuch as micro-particles or Autogel®, a flip-flop situation oc-
curred.[21] This phenomenon prevents estimation of the disposition one extra parameter in the absorption model allows the description
© 2009 Adis Data Information BV. All rights reserved. Clin Pharmacokinet 2009; 48 (1)

Population PK of Lanreotide Autogel® 59
of the two sequential absorption phases: (i) the initial fast subcuta- from the depot by passive diffusion according to a slow pseudoneous release, in which the drug that had not precipitated was first-order constant rate (see figure 6a). This model resembles theimmediately absorbed into the bloodstream during the first days of physical changes occurring in the lanreotide Autogel® formulationtreatment; and (ii) the prolonged release of the active compound within the depot compartment when it has been subcutaneously
injected. The limited initial burst release and controlled releaseover several weeks after administration at the three dose levels(60, 90 and 120 mg) demonstrated the robustness of the drugrelease from the formulation.
Although one might expect a difference in the bioavailabilityand rate of absorption due to differences in body compositionbetween males and females at the injection site, no clinicallyrelevant covariate effects of sex were found. A similar result wasfound recently after subcutaneous administration of recombinanthuman growth hormone.[24] The lack of involvement of body-weight and sex in the IIV of population pharmacokinetic para-meters of this model supports the use of fixed dosing and confirmsthe appropriateness of the deep subcutaneous route of administra-tion for both sexes.
Our population model has been validated. Usually, because ofthe lack of new data, only internal validation is performed. In thisstudy, an external validation method was also performed. The newdata came from a study in which patients with acromegaly re-ceived the same doses as in the current analysis, but given in amultiple-dosing schedule (once every 4 weeks).[19] The visualinspection of figure 5 confirms that the model that was developedadequately captures the mean tendency as well as the dispersion ofthe data. This result indicates also that the pharmacokinetics oflanreotide Autogel® do not differ between healthy subjects andpatients with acromegaly, and that they are independent of timeafter the start of treatment.
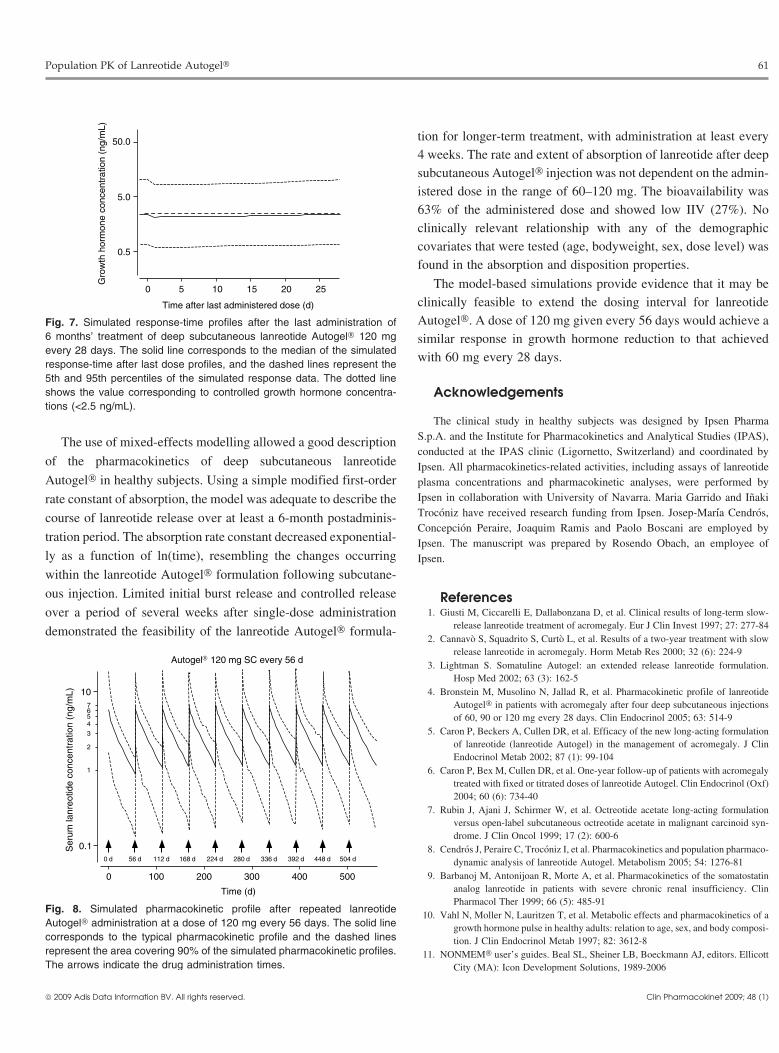
Figure 7 is the result of the combination of the populationpharmacokinetic model selected in the present study and thepopulation pharmacodynamic model established recently,[8] andallows an exploration of the mean and dispersion of steady-stateresponse-time profiles. These model predictions indicate that afteradministration of lanreotide Autogel® (120 mg every 28 days) atthis steady state, approximately 53% of patients with acromegalywill have a controlled growth hormone level (<2.5 ng/mL)throughout the dosing interval. In addition, in the clinical studyperformed in patients with acromegaly,[8] it was established that atypical serum lanreotide concentration of 1.13 ng/mL reducedserum growth hormone levels to <2.5 ng/mL. Taking into accountthe model predictions for the Cmin at steady state (Cmin,ss), thepercentage of subjects who would achieve lanreotide concentra-tions higher than this threshold at steady state are 69%, 86% and
28 d 56 d 84 d
1
2
34
Autogel® 60 mg SC
0 d
10
2
3456
Autogel® 90 mg SC
10
Ser
um la
nreo
tide
conc
entr
atio
n (n
g/m
L)
2
4
68
10
Autogel® 120 mg SC
Time (d)
0 20 40 60 80 100 120
0 20 40 60 80 100 120
0 20 40 60 80 100 120
28 d 56 d 84 d0 d
28 d 56 d 84 d0 d
a
b
c
Fig. 5. Results of the external visual predictive check, showing individualserum concentration-time profiles (depicted as solid circles) after deepsubcutaneous (SC) administration of lanreotide Autogel® at doses of60 mg (a), 90 mg (b) or 120 mg (c). The solid lines represent the medianconcentration-time profile obtained from 1000 model-based simulations.The dashed lines represent the area covering 90% of the simulated obser-vations. The arrows indicate the drug administration times.
© 2009 Adis Data Information BV. All rights reserved. Clin Pharmacokinet 2009; 48 (1)
60 Troconiz et al.
Table IV. Results from the predictive check obtained from 1000 simulations with the selected population pharmacokinetic model
Lanreotide Cmax (ng/mL) AUClast (ng • day/mL)
dose observeda simulatedb observeda simulatedb
female male female male
7 µg/kg 0.72 1.0 Female: 0.74 (0.68, 0.8)Male: 0.94 (0.88, 1.01)
60 mg 3.2 5.1 4.8 (2.5, 10) 64.5 74.3 61.6 (44, 83.5)
90 mg 5.1 11.2 8 (3.6, 13.8) 97.4 115.7 95.4 (68.6, 129.6)
120 mg 6.1 7.5 8.6 (4.7, 16.6) 127.3 137 133.7 (96.3, 178.7)
a Values are expressed as mean.
b Mean with 2.5th and 97.5th percentiles in parentheses.
AUClast = area under the serum concentration-time curve from time zero to the time of last measurable concentration; Cmax = maximum serumconcentration.
92% for 60, 90 and 120 mg, respectively, administered every provide therapeutically effective drug concentrations at steady28 days. state. Simulation after repeated lanreotide Autogel® injections at a
dose of 120 mg every 56 days was performed using the pharmaco-Mean lanreotide concentrations remain higher than 0.44, 0.54kinetic model that was developed (figure 8). The predicted Cmin,ssor 0.81 ng/mL at 56 days after a single lanreotide Autogel®(1.14 ng/mL [95% CI 0.19, 2.64]) was slightly lower than theinjection of 60, 90 or 120 mg, respectively. These results suggestpredicted drug concentration after 60 mg every 28 days (1.80 ng/that extending the dosing interval from 28 to 56 days couldmL [95% CI 0.48, 3.04]), showing that 81% of subjects treatedwith 120 mg every 56 days will have lanreotide concentrationshigher than 0.48 ng/mL (the lower CI limit after 60 mg every28 days). The mean predicted lanreotide concentration (1.14 ng/mL) is in the same range as that found in a clinical study ofpatients with active acromegaly (1.6 ng/mL), in which effective-ness was demonstrated with 120 mg of lanreotide Autogel® every56 days.[25] In addition, 95% of subjects treated with 120 mg every56 days will have Cmin,ss values higher than the lanreotide concen-tration that produced a 50% decrease in the maximum reduction ingrowth hormone (EC50; 0.206 ng/mL) established in a previouspublication.[8] These findings provide evidence that it is feasible toextend the dosing interval for lanreotide Autogel® 120 mg to56 days (1.14 ng/mL) to achieve a response in the growth hormonereduction similar to that achieved after 60 mg every 28 days. Theprimary benefit will be a substantial reduction in the number oflanreotide Autogel® injections required to achieve a therapeuticeffect.[8]
Conclusions
The disposition characteristics of lanreotide administered as arapid intravenous bolus injection of 7 µg/kg were best describedwith a three-compartment open model. Estimates of IIV weremoderate (<40%). The total apparent volume of distribution(15.1 L) was lower than the physiological water volume, and theestimate of CL was 23.1 L/h.
k a (
d–1)
0 20 40 60 80 100
0.030
0.040
Time (d)
Ser
um la
nreo
tide
conc
entr
atio
n (n
g/m
L)
0 50 100 150 200 250
0
2
4
6
a
b
120 mg90 mg60 mg
0 d 28 d 56 d 84 d 112 d 140 d 168 d 196 d 252 d224 d
Fig. 6. (a) Absorption rate constant (ka) versus time relationship predictedfrom the population model. (b) Typical model-predicted lanreotide serumconcentration-time profiles during treatment with lanreotide Autogel® ad-ministered subcutaneously once monthly at doses of 60, 90 or 120 mg.The arrows indicate the drug administration times.
© 2009 Adis Data Information BV. All rights reserved. Clin Pharmacokinet 2009; 48 (1)
Population PK of Lanreotide Autogel® 61
tion for longer-term treatment, with administration at least every4 weeks. The rate and extent of absorption of lanreotide after deepsubcutaneous Autogel® injection was not dependent on the admin-istered dose in the range of 60–120 mg. The bioavailability was63% of the administered dose and showed low IIV (27%). Noclinically relevant relationship with any of the demographiccovariates that were tested (age, bodyweight, sex, dose level) wasfound in the absorption and disposition properties.
The model-based simulations provide evidence that it may beclinically feasible to extend the dosing interval for lanreotideAutogel®. A dose of 120 mg given every 56 days would achieve asimilar response in growth hormone reduction to that achievedwith 60 mg every 28 days.
Acknowledgements
Time after last administered dose (d)
Gro
wth
hor
mon
e co
ncen
trat
ion
(ng/
mL)
0 5 10 15 20 25
0.5
5.0
50.0
Fig. 7. Simulated response-time profiles after the last administration of6 months’ treatment of deep subcutaneous lanreotide Autogel® 120 mgevery 28 days. The solid line corresponds to the median of the simulatedresponse-time after last dose profiles, and the dashed lines represent the5th and 95th percentiles of the simulated response data. The dotted lineshows the value corresponding to controlled growth hormone concentra-tions (<2.5 ng/mL).
The clinical study in healthy subjects was designed by Ipsen PharmaS.p.A. and the Institute for Pharmacokinetics and Analytical Studies (IPAS),The use of mixed-effects modelling allowed a good descriptionconducted at the IPAS clinic (Ligornetto, Switzerland) and coordinated by
of the pharmacokinetics of deep subcutaneous lanreotide Ipsen. All pharmacokinetics-related activities, including assays of lanreotideAutogel® in healthy subjects. Using a simple modified first-order plasma concentrations and pharmacokinetic analyses, were performed by
Ipsen in collaboration with University of Navarra. Maria Garrido and Inakirate constant of absorption, the model was adequate to describe theTroconiz have received research funding from Ipsen. Josep-Maria Cendros,course of lanreotide release over at least a 6-month postadminis-Concepcion Peraire, Joaquim Ramis and Paolo Boscani are employed by
tration period. The absorption rate constant decreased exponential- Ipsen. The manuscript was prepared by Rosendo Obach, an employee ofly as a function of ln(time), resembling the changes occurring Ipsen.
within the lanreotide Autogel® formulation following subcutane-
ous injection. Limited initial burst release and controlled release References1. Giusti M, Ciccarelli E, Dallabonzana D, et al. Clinical results of long-term slow-over a period of several weeks after single-dose administration
release lanreotide treatment of acromegaly. Eur J Clin Invest 1997; 27: 277-84demonstrated the feasibility of the lanreotide Autogel® formula-2. Cannavo S, Squadrito S, Curto L, et al. Results of a two-year treatment with slow
release lanreotide in acromegaly. Horm Metab Res 2000; 32 (6): 224-93. Lightman S. Somatuline Autogel: an extended release lanreotide formulation.
Hosp Med 2002; 63 (3): 162-54. Bronstein M, Musolino N, Jallad R, et al. Pharmacokinetic profile of lanreotide
Autogel® in patients with acromegaly after four deep subcutaneous injectionsof 60, 90 or 120 mg every 28 days. Clin Endocrinol 2005; 63: 514-9
5. Caron P, Beckers A, Cullen DR, et al. Efficacy of the new long-acting formulationof lanreotide (lanreotide Autogel) in the management of acromegaly. J ClinEndocrinol Metab 2002; 87 (1): 99-104
6. Caron P, Bex M, Cullen DR, et al. One-year follow-up of patients with acromegalytreated with fixed or titrated doses of lanreotide Autogel. Clin Endocrinol (Oxf)2004; 60 (6): 734-40
7. Rubin J, Ajani J, Schirmer W, et al. Octreotide acetate long-acting formulationversus open-label subcutaneous octreotide acetate in malignant carcinoid syn-drome. J Clin Oncol 1999; 17 (2): 600-6
8. Cendros J, Peraire C, Troconiz I, et al. Pharmacokinetics and population pharmaco-dynamic analysis of lanreotide Autogel. Metabolism 2005; 54: 1276-81
9. Barbanoj M, Antonijoan R, Morte A, et al. Pharmacokinetics of the somatostatinanalog lanreotide in patients with severe chronic renal insufficiency. ClinPharmacol Ther 1999; 66 (5): 485-91
10. Vahl N, Moller N, Lauritzen T, et al. Metabolic effects and pharmacokinetics of agrowth hormone pulse in healthy adults: relation to age, sex, and body composi-tion. J Clin Endocrinol Metab 1997; 82: 3612-8
11. NONMEM® user’s guides. Beal SL, Sheiner LB, Boeckmann AJ, editors. EllicottCity (MA): Icon Development Solutions, 1989-2006
1
2
34567
0 100 200 300 400 500
Autogel® 120 mg SC every 56 d
0 d 56 d 112 d 168 d 224 d 280 d 336 d 392 d 448 d 504 d
10
0.1
Time (d)
Ser
um la
nreo
tide
conc
entr
atio
n (n
g/m
L)
Fig. 8. Simulated pharmacokinetic profile after repeated lanreotideAutogel® administration at a dose of 120 mg every 56 days. The solid linecorresponds to the typical pharmacokinetic profile and the dashed linesrepresent the area covering 90% of the simulated pharmacokinetic profiles.The arrows indicate the drug administration times.
© 2009 Adis Data Information BV. All rights reserved. Clin Pharmacokinet 2009; 48 (1)
62 Troconiz et al.
12. Beal SL. Ways to fit a PK model with some data below the quantification limit. 20. Antonijoan RM, Barbanoj MJ, Cordero JA, et al. Pharmacokinetics of a newJ Pharmacokinet Pharmacodyn 2001; 28: 481-504 Autogel formulation of the somatostatin analogue lanreotide after a single
subcutaneous dose in healthy volunteers. J Pharm Pharmacol 2004; 56 (4):13. Karlsson MO. Handling data below the limit of quantification (BQL) – including471-6simultaneous modeling of continuous and categorical data [lecture].
NONMEM® VI Workshop; 2008 Mar 17-19; San Francisco (CA) 21. Rowland M, Tozer T. Clinical pharmacokinetics: concepts and applications. 3rd14. Ludden TM, Beal SL, Sheiner LB. Comparison of the Akaike Information Criteri- ed. Philadelphia (PA): Williams & Wilkins, 1995
on, the Schwarz Criterion and the F test as guides to model selection. 22. Valery C, Paternostre M, Robert B, et al. Biomimetic organization: octapeptideJ Pharmacokinet Biopharm 1994; 22: 431-45 self-assembly into nanotubes of viral capsid-like dimension. Proc Natl Acad Sci
15. Holford N, Ambros R, Stoeckel K. Models for describing absorption rate and U S A 2003; 100 (18): 10258-62estimating extent of bioavailability: application to cefetamet pivoxil.
23. Valery C, Artzner F, Robert B, et al. Self-association process of a peptide inJ Pharmacokin Biopharm 1992; 20: 421-42
solution: from beta-sheet filaments to large embedded nanotubes. Biophys J16. Piotrovskii VK. The use of Weibull distribution to describe the in vivo absorption 2004; 86 (4): 2484-501
kinetics. J Pharmacokinet Biopharm 1987; 15: 681-624. Keller A, Wu Z, Kratzsch J, et al. Pharmacokinetics and pharmacodynamics of GH:
17. Savic RM, Jonker DM, Kerbusch T, et al. Implementation of a transit compartmentdependence on route and dosage of administration. Eur J Endocrinol 2007; 156:
model for describing drug absorption in pharmacokinetic studies.647-53
J Pharmacokinet Pharmacodyn 2007; 34: 711-2625. Lucas T, Astorga R. Efficacy of lanreotide Autogel administered every 4-8 weeks18. Holford N. The visual predictive check: superiority to standard diagnostic (Ror-
in patients with acromegaly previously responsive to lanreotide microparticles,schach) plots [abstract no. 738]. 14th Meeting, Population Approach Group in30 mg: a phase III trial. J Clin Endocrinol Metab 2006; 65: 320-6Europe; 2005 Jun 16-17; Pamplona [online]. Available from URL: http://
www.page-meeting.org/default.asp?abstract=738 [Accessed 2008 Oct 6]19. Ramis J, Cendros J-M, Catus F, et al. Pharmacokinetics and pharmacodynamics of
Correspondence: Dr Rosendo Obach, Ipsen Pharma S.A., Carretera Laurealanreotide Autogel® after multiple subcutaneous administration in patients withMiro 395, Sant Feliu de Llobregat 08980, Barcelona, Spain.acromegaly: a 52-week, multi-centre, randomized study [poster]. 12th Interna-
tional Congress of Endocrinology; 2004 Aug 31-Sep 4; Lisbon E-mail: [email protected]
© 2009 Adis Data Information BV. All rights reserved. Clin Pharmacokinet 2009; 48 (1)

![Pharmacokinetic Comparison of Seven Major Bio-Active ... · Pharmacokinetic studieson these components havebeen partly demonstrated [4–6]. However, there arefew reports about the](https://img.pdfslide.tips/doc/110x75/5fd8e9f938a2704453267115/pharmacokinetic-comparison-of-seven-major-bio-active-pharmacokinetic-studieson.jpg)