Embed Size (px)
Citation preview
128 Scientific Journals 18(90)
Scientific Journals Zeszyty Naukowe Maritime University of Szczecin Akademia Morska w Szczecinie
2009, 18(90) pp. 128–135 2009, 18(90) s. 128–135
Models of ship-ship collision. Qualitative assesment
Porównanie jakościowe wybranych modeli kolizji statków
Marcin Przywarty
Akademia Morska w Szczecinie, Wydział Nawigacyjny, Instytut Inżynierii Ruchu Morskiego 70-500 Szczecin, ul. Wały Chrobrego 1–2
Key words: ships collision, ships traffic, stochastic model
Abstract The paper presents the review and the comparison of the existing models of ships–ship collision. It also
presents assumptions and preliminary results of collision model developed in Institute of Marine Traffic
Engineering in Szczecin.
Słowa kluczowe: kolizje statków, ruch statków, model stochastyczny
Abstrakt W artykule przedstawiono przegląd oraz porównanie istniejących modeli kolizyjnych typu statek–statek.
Zaprezentowano założenia oraz wstępne wyniki modelu kolizyjnego opracowanego w Instytucie Inżynierii
Ruchu Morskiego Akademii Morskiej w Szczecinie.
Introduction
Increasing intensity of sea traffic and accom-
panying this increasing risk of sea accidents caused
a development of models of navigational safety
assessment. The collisions between ships are the
one of the most common types of accidents which
have influence on navigational safety (fig. 1).
Fig. 1. Types of accidents in the Baltic Sea [1]
Rys. 1. Typy wypadków morskich na Morzu Bałtyckim [1]
The most popular approach to the assessment of
marine accident probability is based on the models
presented by Macduff [2] and Fujii at al. [3]. It
defines the probability of accident as the product of
geometrical probability depending on distribution
of vessels traffic and the “causation probability”
depending on such factor as visibility, failures,
human errors, etc.
cg PPP (1)
where: P – probability of accident, Pg – geometrical
probability, probability of such situation that
accident will occur if no manoeuvre be made, Pc –
causation probability, probability of failing to avoid
the accident.
In the further part of this paper the typical
models which can be used to calculate the
probability of ship-ship collision are presented. The
probabilities calculated in this models are
undoubtedly exclusive to the relative areas, but it is
symptomatic that obtained results are comparable.
Macduff’s model
The Macduff‟s model is a well known model
using Molecular Collision theory. It assumes that if
all ships are proceeding with the same speed and
Grounding44%
Fire8%
Collision33%
Other9%
Machine damage
6%
Models of ship-ship collision. Qualitative assesment
Zeszyty Naukowe 18(90) 129
one ship is proceeding on course making an angle
with the main shipping lane then Mean Free Path of
the single ship will be of length:
2sin2
18522
L
DF (2)
where: F – Mean Free Path of single ship [Nm], D
– average distance between ships [Nm], measure of
traffic density, L – length of ship [m], θ – angle
between track of the single ship and stream of
ships.
The geometrical probability can be calculated by
following formula:
F
XPg (3)
where: Pg – geometrical probability, X – actual
length of path to be considered for a single ship
[Nm].
Real collision probability can be calculated on
the basis of statistical data.
p
cre
n
nP (4)
where: Pre – real collision probability, nc – number
of collisions in a given time, np – number of ships
passing in a given time.
Knowing the real collision probability (4) and
the geometrical probability (3) the causation
probability can be calculated:
g
rec
P
PP (5)
The results presented in the paper by Macduff
[2] was obtained for the Dover Strait and North Sea
area. The calculations was carried out for the
periods before and after establishing the Traffic
Separation Scheme in given area. Achieved results
are presented in table 1.
Table 1. Causation probabilities – Macduff‟s model [2]
Tabela 1. Prawdopodobieństwa przyczyn – model Macduff‟a
[2]
Type of encounter
situation
Causation
probability Remarks
Head on 0.000518 without TSS
0.000315 with TSS
Crossing 0.000111 without TSS
0.000095 with TSS
Model of Fowler & Sørgård – MARCS
Model presented in paper of Fowler & Sørgård
[4] assumes that marine traffic may be modelled by
shipping lanes that have characteristic lane width,
traffic frequency and lateral distribution. The model
assumes that traffic is uncorrelated. The critical
situation is defined as when two ships come to
close quarters-crossing within half a nautical mile
of each other (encounter situation). The area of
interest is divided into large number of calculation
locations. Encounter frequencies at each calculation
location are evaluated using a pair – wise
summation across all shipping lanes. This enables
the calculation of either total collision rates, or
collision rates involving specific types of vessels.
It then applies a probability of a collision for each
encounter, to give the collision frequency The
collision frequency at a location is given by:
rvcrvgvcgvec pPpPnf ,, (6)
where: fc – collision frequency at a calculation
location, ne – encounter frequency, Pgv – probability
of good visibility, Prv – probability of reduced
visibility, pc,gv – probability of collision in good
visibility, pc,rv – probability of collision in reduced
visibility.
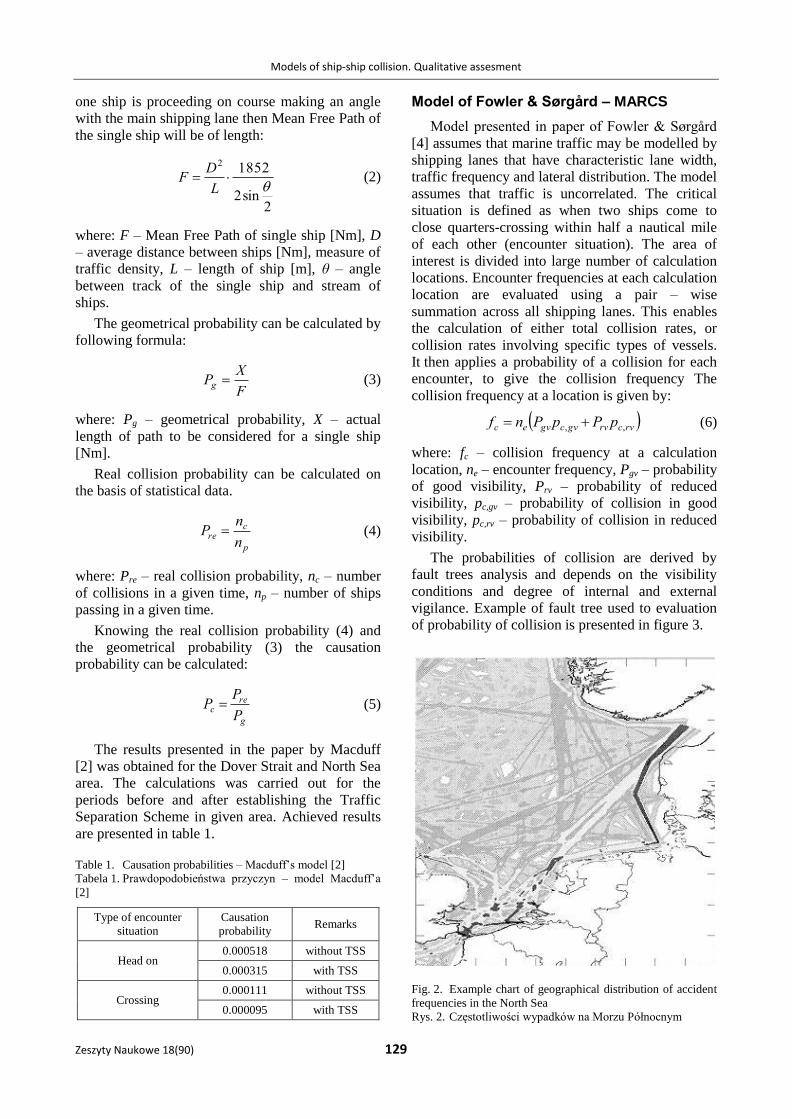
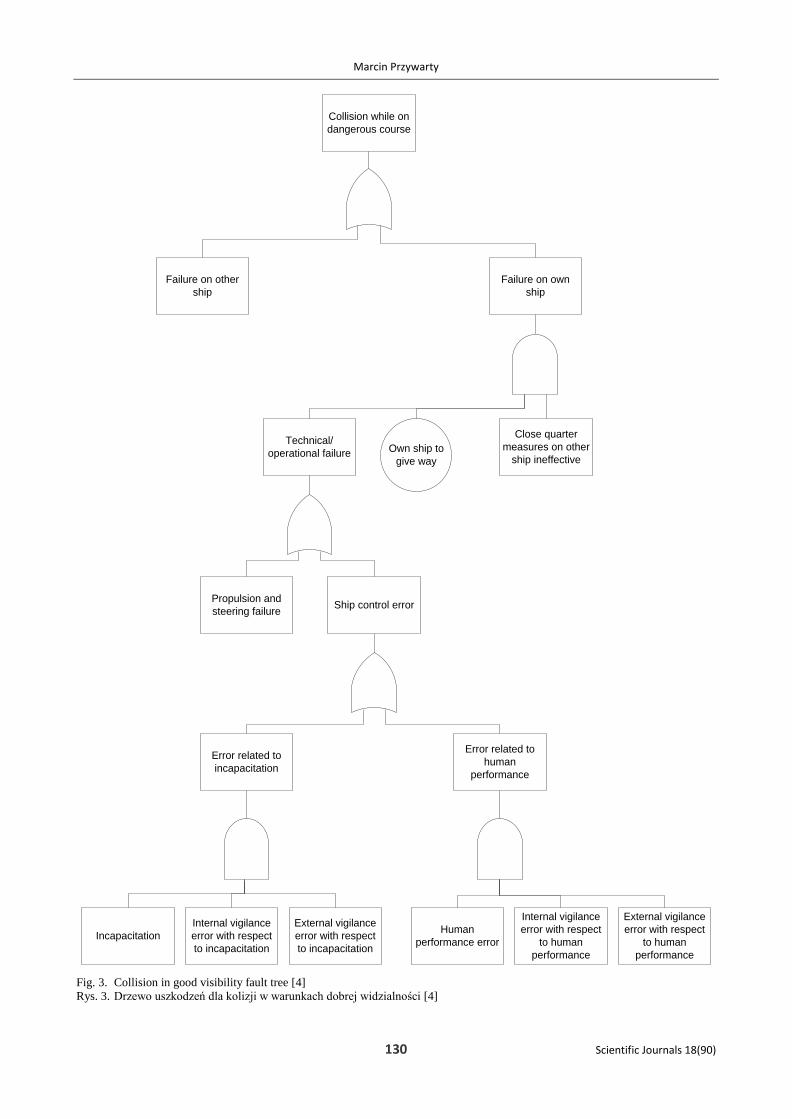
The probabilities of collision are derived by
fault trees analysis and depends on the visibility
conditions and degree of internal and external
vigilance. Example of fault tree used to evaluation
of probability of collision is presented in figure 3.
Fig. 2. Example chart of geographical distribution of accident
frequencies in the North Sea
Rys. 2. Częstotliwości wypadków na Morzu Północnym
Marcin Przywarty
130 Scientific Journals 18(90)
Collision while on
dangerous course
Failure on own
ship
Failure on other
ship
Own ship to
give way
Close quarter
measures on other
ship ineffective
Technical/
operational failure
Propulsion and
steering failureShip control error
Error related to
incapacitation
Error related to
human
performance
External vigilance
error with respect
to human
performance
Internal vigilance
error with respect
to human
performance
Human
performance error
External vigilance
error with respect
to incapacitation
Internal vigilance
error with respect
to incapacitation
Incapacitation
Fig. 3. Collision in good visibility fault tree [4]
Rys. 3. Drzewo uszkodzeń dla kolizji w warunkach dobrej widzialności [4]
Models of ship-ship collision. Qualitative assesment
Zeszyty Naukowe 18(90) 131
The research area corresponds to the North Sea
area (including the Dover Straits). The area is
defined to be within latitudes 50°N and 60°N and
within longitudes 0°E and 10°E. The geographical
distribution of collision frequencies is calculated on
grid-net with a resolution of 1 minute north-south
by 2 minutes east-west (approximately 1 Nm by
1 Nm). The results are presented in table 2.
Table 2. Causation probabilities, Fowler & Sørgård model [4]
Tabela 2. Prawdopodobieństwa przyczyn, model Fowlera i Sor-
garda [4]
Causation probability Remarks
0.0000848 good visibility
0.0000683 good visibility, within VTS zone
0.00058 poor visibility
0.000464 poor visibility, within VTS zone
Model of Otto et al.
Model of collision published by S. Otto et al. [5]
can by an example of the models based on Bayesian
method. This model assumes that factor related to
machinery and steering failure is negligible and the
collisions are attributed to human failure. There-
fore, an analysis of collision rates must be based on
a study of a role of human resolving an encounter
situation. The authors selected a Bayesian Network
to describe the task of the OOW. The network is
a graphical representation of influence factors
(nodes) and explicitly reveals their probabilistic
dependence and the flow of information between
the nodes.
The traffic in presented model is simulated by
traffic streams. Each traffic stream is characterized
by a number, type and size of the ships. The
variability of traffic is modelled by Gaussian
distribution. Three collision scenarios were taken
into account:
crossing waterways,
intersecting waterways,
parallel waterways.
The used network allows to compute the value
of causation factor for each type of encounter
situation. Causation factor is the probability that
actions to prevent the collision are not sufficient or
not taken.
On the basis of statistical data the number of
collision candidates was estimated separately for
each segment of route and for each type and size of
vessel. Knowing the number of collision candidates
and causation factor (estimated by Bayesian
Network) it is possible to calculate number of
collisions in given time.
Exemplary calculations were carried out for Ro-
Ro passenger ferry. The main dimensions of the
reference ship are:
Length between perpendiculars Lpp = 173 m,
Breadth B = 26 m,
Service speed = 27 kn.
As an example route the existing route between
Cadiz and the Canary Island is used. The route
length is 700 nm and the voyage time is assumed
25 h per trip, the number of voyages is assumed
240 per year. The following results were achieved:
Table 3. Causation probabilities – Otto et al. model [5]
Tabela 3. Prawdopodobieństwa przyczyn – model Otto [5]
Type of encounter situation Causation probability
Head on 0.000049
Intersection 0.00013
Crossing 0.00013
Model of Otay and Tan
Model presented by Otay and Tan [6] is a
example of model determining the probability of
collision resulting from course changes due to
hydrodynamics forces acting on the vessel. The
computation of vessel positions and the drift
probabilities are based on probabilistic conside-
rations of physical quantities that affect navigation
including vessel characteristics, randomness of
hydrodynamic forces and vessel arrival times.
Hydrodynamic forces, specifically the distribu-
tion of magnitude and direction of currents at a given
location are used to update the original course of the
vessel resulting in drift probabilities. These proba-
bilities and random arrival of vessels are then incor-
porated into a Markov chain model. By analyzing
the time-dependent probabilities of the Markov
process, performance measures are obtained inclu-
ding the probability of casualty and the expected
number of casualties.
The model output includes risk charts indicating
casualty probabilities across the geometry of the
waterway at a given time and vessel intensity. Fur-
thermore the model can be used to investigate the
relationship between the vessel traffic intensity and
global measures of casualty risk such as the expec-
ted number of casualties per vessel or per time.
The model operates in three building blocks
(fig. 4). The first building block is the hydrodyna-
mic model. The most important forcing mechanism
that affects vessels travelling in a waterway is the
surface current. This model determines the current
velocity at a given location of the waterway
depending on wind, channel geometry, bottom
topography, and boundary conditions. In order to
ensure numerical tractability, a waterway repre-

Marcin Przywarty
132 Scientific Journals 18(90)
sented as a grid consisted of a finite number of
elements. The first building block yields the current
velocity in each of these elements.
Fig. 4. Components of the General Model [6]
Rys. 4. Komponenty modelu ogólnego [6]
The second building block gives the drift
probabilities for a vessel travelling at a given
location of a waterway. Due to the surface current,
the vessel may drift from its original route. This
drift is one of the most important factors for vessel
casualties along a waterway. Important parameters
effecting the course drift are the hydrodynamic
conditions and the vessel characteristics including
size, length, draft, mass, engine thrust, etc. This
building block first determines the distribution of
drift from a vessel‟s original route and then dis-
cretize this distribution to three drift probabilities:
(1) maintain the original course (2) drift to the right
(3) drift to the left. For example, for a north bound
vessel located at a certain grid, this model estimates
the probabilities that there will be no drift, or a drift
to the north-westerly or north-easterly grids during
the next time step depending on the vessel and
current characteristics in this grid.
The third building block is a state-space model
of vessels travelling along a waterway. This model
incorporates the drift probabilities obtained from
the second building block, arrival distribution of the
vessels, and other effect into a Markov chain
model. By analyzing the probability distribution of
vessel positions in the waterway at a given time, the
probabilities that an inter-vessel collision occurs
place at a given location at a given time are derived.
Finally, steady-state probability distributions and
expected number of inter-vessel collisions, and total
casualties are obtained. These results allow to
construct various risk charts.
Model developed in Institute of Marine Traffic Engineering
Collisions and oil spills are modelled with use of
complex stochastic safety model and real statistical
data. Fully developed model presented in figure 5
can assess the navigational risk on large complex
system with consideration of navigators behaviour,
ship dynamics, real traffic streams parameters and
external conditions like wind current visibility etc.
It can be used for assessing risk of the most
common navigational accidents. The model works
in fast time and can simulate large number of
scenarios. The output of the model is number of
accidents, positions, types of vessels and size of oil
spills.
Fig. 5. Fully developed stochastic model of navigation safety
assessment
Rys. 5. Opracowany model stochastyczny szacowania bezpie-
czeństwa nawigacyjnego
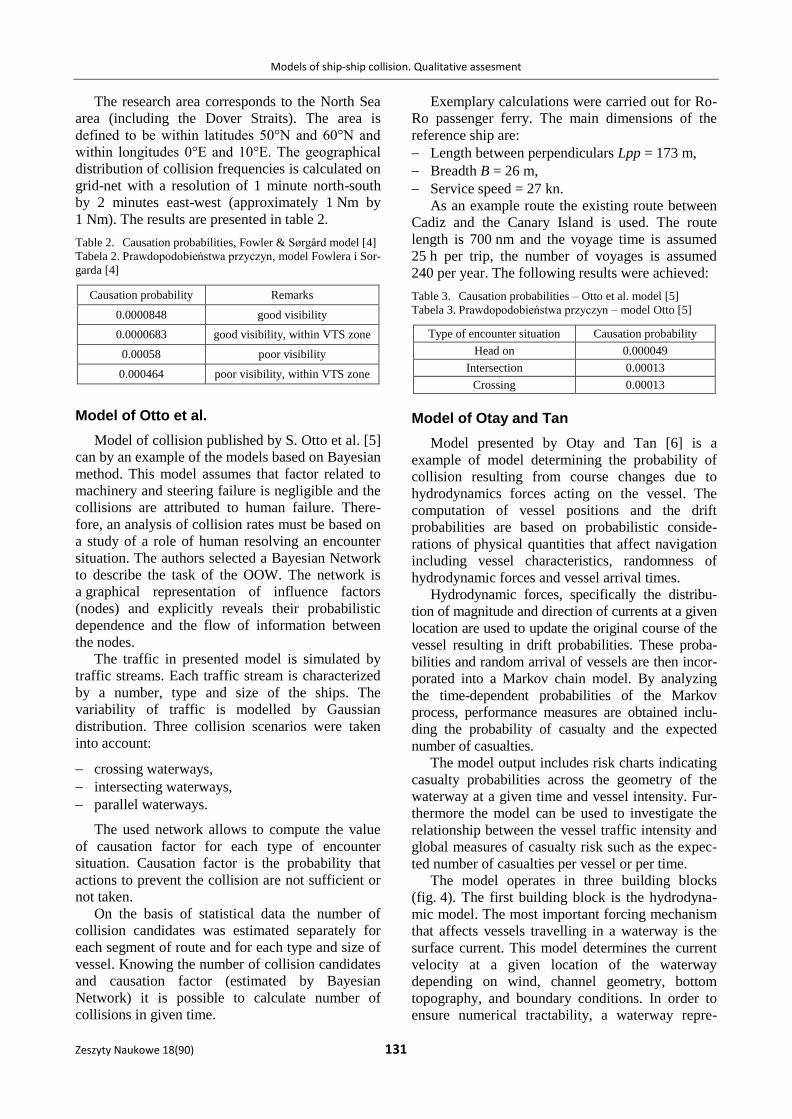
Traffic data
There are several sources of data necessary for
the developing of simulation model. The data of
traffic was obtained on the basis of AIS records
(fig. 6) [1, 7, 8], Polish national AIS network
studies and statistics of ships calls to given ports.
Navigational data was obtained from sea charts,
guides and own seamanship experience.
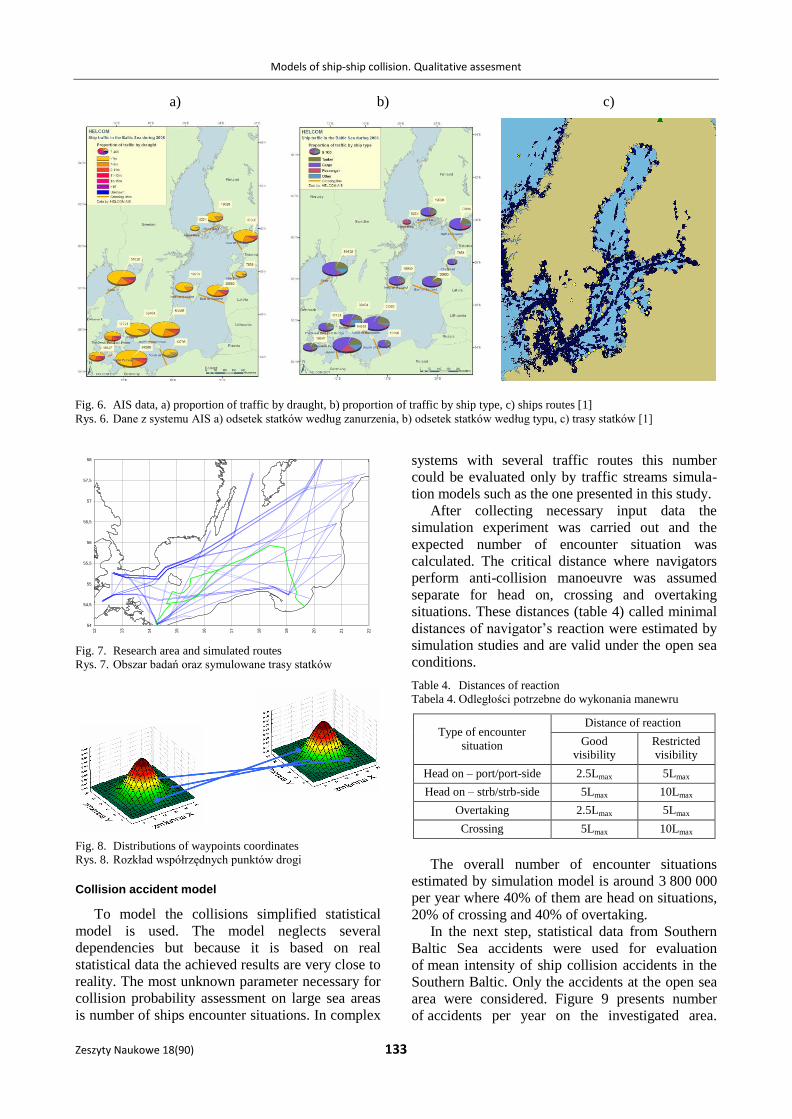
Simulated routes are presented in figure 7.
External conditions model was developed on the
basis of data from Polish meteorological stations
and extrapolated to achieve open sea conditions.
The variability of ships routes is modelled by
two-dimensional normal distribution (fig. 8) which
parameters were estimated by real data from AIS
and expert-navigators opinion.
The traffic of ships is modelled by Poisson
process where actual intensity of traffic is evaluated
on the basis of real AIS data from the Helcom
network which is operated since mid 2005. The
collected AIS data is also used for determination of
type, speed, length and draught distributions.
Model of ships
stream
Modele of
accident
consequences
Model of ships
dynamics (before and after accident)
Model of navigator
behaviour(before and after accident)
Modele of external
conditions(wind, current and waves)
Model of collisioncollision / grounding / striking
ship on the way / drifting
10
0 90 80 70 60
Grounding Striking with fixed
object
Collision
`
Fire
Models of ship-ship collision. Qualitative assesment
Zeszyty Naukowe 18(90) 133
Fig. 7. Research area and simulated routes
Rys. 7. Obszar badań oraz symulowane trasy statków
Fig. 8. Distributions of waypoints coordinates
Rys. 8. Rozkład współrzędnych punktów drogi
Collision accident model
To model the collisions simplified statistical
model is used. The model neglects several
dependencies but because it is based on real
statistical data the achieved results are very close to
reality. The most unknown parameter necessary for
collision probability assessment on large sea areas
is number of ships encounter situations. In complex
systems with several traffic routes this number
could be evaluated only by traffic streams simula-
tion models such as the one presented in this study.
After collecting necessary input data the
simulation experiment was carried out and the
expected number of encounter situation was
calculated. The critical distance where navigators
perform anti-collision manoeuvre was assumed
separate for head on, crossing and overtaking
situations. These distances (table 4) called minimal
distances of navigator‟s reaction were estimated by
simulation studies and are valid under the open sea
conditions.
Table 4. Distances of reaction
Tabela 4. Odległości potrzebne do wykonania manewru
Type of encounter
situation
Distance of reaction
Good visibility
Restricted visibility
Head on – port/port-side 2.5Lmax 5Lmax
Head on – strb/strb-side 5Lmax 10Lmax
Overtaking 2.5Lmax 5Lmax
Crossing 5Lmax 10Lmax
The overall number of encounter situations
estimated by simulation model is around 3 800 000
per year where 40% of them are head on situations,
20% of crossing and 40% of overtaking.
In the next step, statistical data from Southern
Baltic Sea accidents were used for evaluation
of mean intensity of ship collision accidents in the
Southern Baltic. Only the accidents at the open sea
area were considered. Figure 9 presents number
of accidents per year on the investigated area.
54
54,5
55
55,5
56
56,5
57
57,5
58
12
13
14
15
16
17
18
19
20
21
22
a) b) c)
Fig. 6. AIS data, a) proportion of traffic by draught, b) proportion of traffic by ship type, c) ships routes [1]
Rys. 6. Dane z systemu AIS a) odsetek statków według zanurzenia, b) odsetek statków według typu, c) trasy statków [1]

Marcin Przywarty
134 Scientific Journals 18(90)
The mean intensity of collision accidents equals 1.8
per year. Observation of tendency of accidents
shows high correlation of collision accidents of
traffic intensity.
Fig. 9. Number of collision accidents per year located at the
open sea of the Southern Baltic
Rys. 9. Liczba kolizji zarejestrowanych na pełnym morzu na
akwenie Morza Bałtyckiego
Data presented in figure 9 and the number of
ships encounter situations have been used for
estimating the probability of collisions in single
encounter situation. This probability can by
estimated by following formula:
e
ccn
nP (7)
where: Pc – probability of collision in single
encounter situation, nc – number of collisions (real
data), ne – number of encounter situations.
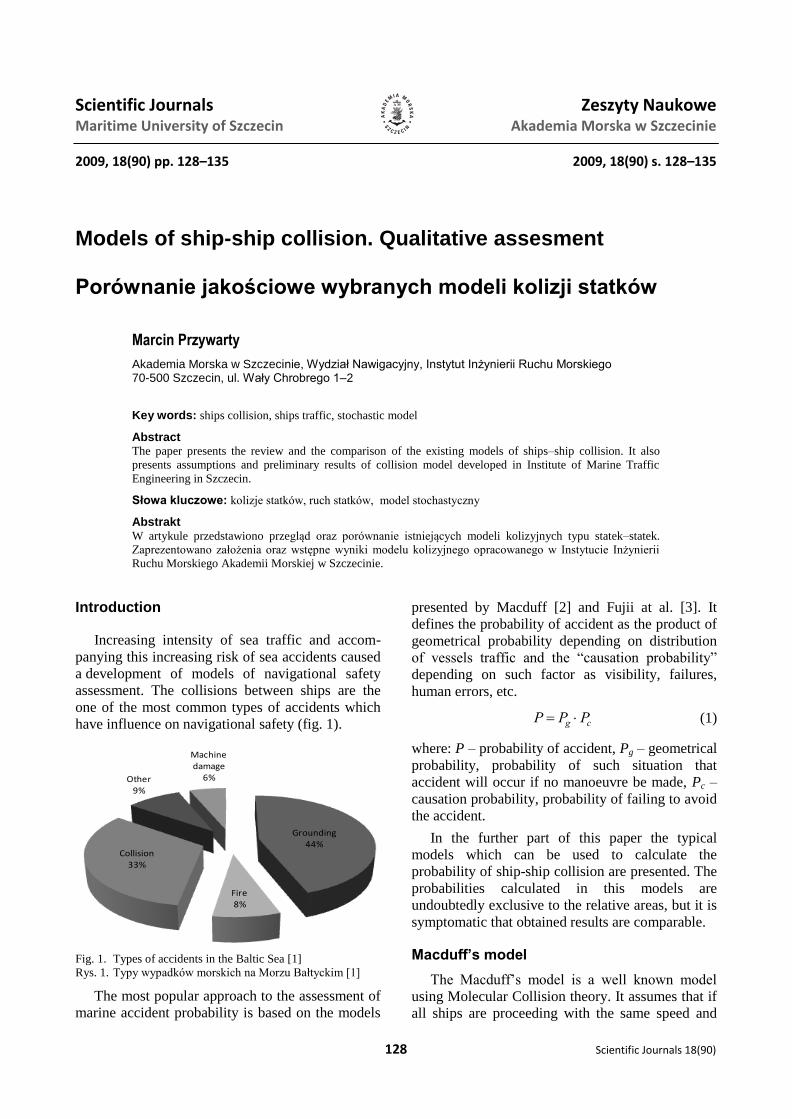
Fig. 10. Probability of collision accident in different encoun-
ter situations
Rys. 10. Prawdopodobieństwo kolizji dla różnych sytuacji
spotkaniowych
The mean calculated probability of collision in
single encounter situation (fig. 10) equals about
5·10–6
which less than the typical value of
probability used in safety of collision assessment.
Oil spill model
The collision can be followed by the oil spills.
The conditional probability is used and finally the
probability of oil spill accident (PS) is calculated as
follows:
OSAAS PPP / (8)
where: PA – probability of accident, PA/OS –
conditional probability of oil spill if accident occur.
Several databases [MEHRA 1999, ITOPF 1998,
MAIB 2005, LMIS 2004, HECSALV 1996, and
IMO 2001] were used to find the conditional
probability of oil spills if given accident occurs.
Figure 11 shows conditional probability of oil
spill. Oil spills due to collision is estimated with the
double bottom tankers with relation to ships size
expressed in DWT.
Fig. 11. Conditional probability of oil spill if given kind of
accident occurs
Rys. 11. Prawdopodobieństwo warunkowe rozlewu olejowego
dla danego typu wypadku
The simplified statistical model is used to
evaluate the size of oil spill after collision. The
model assumes that the size of oil spill depends on
ships size expressed in DWT in tons and type of
accident. The results are presented in figure 12.
Fig. 12. Distribution of oil spill size caused by collision
Rys. 12. Rozkład wielkości rozlewu olejowego będącego
wynikiem kolizji
0
1
2
3
4
5
2000 2001 2002 2003 2004 2005 2006 2007
0
0,000001
0,000002
0,000003
0,000004
0,000005
0,000006
0,000007
0,000008
0,000009
0,00001
overtaking crossing head on
0
0.1
0.2
0.3
0.4
0.5
0.6
0-2000 2000-5000 5000-20000 20000-50000 50000-
BaltMax
Collision
Grounding
Fire
Ships size [DWT]
0
0.1
0.2
0.3
0.4
0.5
0.6
0.7
0-500 500-1000 1000-
10000
10000-
50000
500000-
100000
100000-
BaltMax
0-2000
2000-5000
5000-20000
20000-50000
50000-BaltMax
Tanker size [DWT]
Spill size [tons]
Pro
ba
bility
overtaking crossing head on

Models of ship-ship collision. Qualitative assesment
Zeszyty Naukowe 18(90) 135
Preliminary results
Presented model allows the user to establish the
places of accidents and places of oil spills.
Simulation is carried out in series, each of 5 years
period. This short period makes prediction of traffic
parameters relatively accurate. The results of
simulation are presented in figures 13–14.
Fig. 13. Places of simulated collisions (140 5 years period)
Rys. 13. Miejsca symulowanych kolizji (140 symulacji po 5
lat obliczeniowych każda)
Fig. 14. Places of simulated oil spills caused by collisions
(140 5 years period)
Rys. 14. Miejsca symulowanych rozlewów olejowych spowo-
dowanych kolizjami (140 symulacji po 5 lat obliczeniowych
każda)
Summary
The paper presents models of ship-ship
collision. All of presented models are, in a manner,
based on formula (1). The main difference between
them is the way of establishing of “causation
probability”. Models based on the fault trees are the
most detailed. But therefore they are the most
complicated and they need large number of data.
Model of Otto et al. consider only collisions caused
by human failures. Model of Otay and Tan was
developed for concrete sea area and it can be
difficult to use it in other. Model developed in
Szczecin used in the simulation allows to determine
areas where the probability of collision is highest.
In the next step it is possible to develop the models
of oil spills. The output of the model as the
collision places, ships involved, size of spill and
navigational conditions could be useful for risk
assessment of large sea areas.
References
1. Helcom. Report on shipping accidents in the Baltic Sea
area for the year 2006. Helsinki Commission Baltic Marine
Environment Protection Commission (HELCOM). Draft.
2007.
2. MACDUFF T.: The probability of vessel collisions. Ocean
Industry 1974, 144–148.
3. FUJII Y., YAMANOUCHI H., MIZUKI N.: Some Factors
Affecting the Frequency of Accidents in Marine Traffic. II
– The Probability of Stranding and III – The Effect of
Darkness on the Probability of Collision and Stranding.
Journal of Navigation 27(1974)2, 239–247.
4. FOWLER T.G., SØRGÅRD E.: Modeling Ship Transportation
Risk. Risk Analysis 20(2000)2, 225–244.
5. OTTO S., PEDERSEN P.T., SAMUELIDES M., SAMES P.C.:
Elements of risk analysis for collision and grounding of
a RoRo passenger ferry. Marine Structures 15(2002)4.
6. OTAY E.N., TAN B.: Modelling and analysis of vessel
casualties resulting from oil tanker traffic through narrow
waterways. Naval Research Logistics, Vol: 46 (1999).
7. Helcom. Report on shipping accidents in the Baltic Sea
area for the year 2005. Helsinki Commission Baltic Marine
Environment Protection Commission (HELCOM). Draft.
2006.
8. Helcom. Report on shipping accidents in the Baltic Sea
area for the year 2007. Helsinki Commission Baltic Marine
Environment Protection Commission (HELCOM). Draft.
2008.
Recenzent:
prof. dr hab. inż. Bolesław Mazurkiewicz
Akademia Morska w Szczecinie
5900000
6000000
6100000
6200000
6300000
6400000
6500000
6600000
250000 350000 450000 550000 650000 750000 850000 950000 1050000 1150000
shore line
contour 10m
collisions
5900000
6000000
6100000
6200000
6300000
6400000
6500000
6600000
250000 350000 450000 550000 650000 750000 850000 950000 1050000 1150000
<200 200-500 500-1000 1000-5000 >5000
[tons]