Embed Size (px)
Citation preview

Portal PostmortemUsing Java Thread Dumps to Diagnose
Application Failures
Joseph DaneUniversity of Hawaii
© 2005 University of Hawaii

Overview
• Motivation• Concepts• Examples• Resources

Why? When? Who?
• Why: because you’ve got a flaky application, and you don’t know the cause– This is your only choice (except, perhaps …)
• When: now. Or possibly later.– You do need a running JVM– If you’ve got a dead JVM, you might have a core
• Who: java developers– requires some familiarity with java– threading, locks, etc. in particular– but, no guru level knowledge required

General Principles
• The goal is not to solve problems, but to add to the pool of knowledge about the problem
• Some sysadmin skills required/useful– Finding PIDs, sending signals, munging text
• For some problems (e.g. G.C.), this will all be a complete waste of time– For other (fairly rare) problems, this will immediately
point out the problem, e.g. deadlocks• “Postmortem”, in that we can (must, in fact) wait until a
problem presents

What can we learn?
• Resource contention– network (database, RSS feed, etc.)– java locks– CPU
• Not so good for– memory leaks

Terminology• “thread” -- a single execution path through a program• “method” -- a java function call• “stack” -- the context of the currently called
methods/functions• “frame” -- a single method call, or a single line in a stack• “up/down” -- “up” is toward the TOS, “down” is toward the
start of the program• “TOS” -- “top of stack”, or the currently executing method• “monitor” -- a java lock
– only one thread can hold a given lock at a time

The Stackpublic void A() {
Z();
B();
}
public void B() {
C();
}
public void C() {
…
}
public void Z() {}
C
B
A
In words: A calls Z, then B, which calls C. C is at the TOS, and is the currently executing method.
Z was called previously by A, but is not currently executing, so is no longer on the stack.

The Thread Dump• A snapshot of all activity in the program at a given instant• All JVMs can produce them, in different ways and formats• A text file, in various formats
– All include a stack trace per live thread.– Some include explicit lock information.
• Generating a thread dump– UNIX: send the QUIT signal to the JVM
• Linux: send to the root of the process tree• Mac OS: apparently some flakiness in 1.4 JVM signals• TIP: use -XX:+JavaMonitorsInStackTrace on Sun 1.3.1
– Windows: CTRL-Break• Need to arrange for the service to interact with the desktop.
• Redirect output to a file.• jstack (tiger)
– Not available for windows? Can also show native frames.• Generating the dump is usually safe.

A Stack Trace"tcpConnection-8443-0" daemon prio=5 tid=0x005469d0 nid=0x19b2800 in Object.wait() [f1112000..f1112ac0] at java.lang.Object.wait(Native Method) - waiting on <0x650c01f0> (a java.lang.Object) at com.caucho.server.TcpServer.accept(TcpServer.java:648) - locked <0x650c01f0> (a java.lang.Object) at com.caucho.server.TcpConnection.accept(TcpConnection.java:211) at com.caucho.server.TcpConnection.run(TcpConnection.java:132) at java.lang.Thread.run(Thread.java:552)

The Thread Dump, Pictorially
Time
T1
T2
T3
T4
T5
T6

Deadlock exampleFound one Java-level deadlock:============================="T2": waiting to lock monitor 0x0180ed00 (object 0x2a563978, a java.lang.String), which is held by "T1""T1": waiting to lock monitor 0x0180ecdc (object 0x2a5639a8, a java.lang.String), which is held by "T2"
Java stack information for the threads listed above:==================================================="T2": at hawaii.jasig.DL$Locker.run(DL.java:47) - waiting to lock <0x2a563978> (a java.lang.String) - locked <0x2a5639a8> (a java.lang.String) at java.lang.Thread.run(Thread.java:613)"T1": at hawaii.jasig.DL$Locker.run(DL.java:47) - waiting to lock <0x2a5639a8> (a java.lang.String) - locked <0x2a563978> (a java.lang.String) at java.lang.Thread.run(Thread.java:613)

The tool
• Far too many threads for human consumption.• Written in a good text processing language.• Main concept: group related threads together.
– Simplest definition of “related” lexical identity of stack frame.
• Keep it Simple– Work on the tool ahead of time, verify that it works as
expected.
• Basic process: learn, hypothesize (I.e. guess), test, repeat.

Sample tool output1: at com.pipeline.email.engine.ExternalSessionIMAP4.close(ExternalSessionIMAP4.java:1920)1: at java.lang.Object.clone(Native Method)1: at org.apache.xml.utils.TreeWalker.startNode(TreeWalker.java:274)2: at com.pipeline.email.engine.ExternalSessionIMAP4.close(ExternalSessionIMAP4.java:1914)2: at com.iplanet.server.http.servlet.NSServletSession.writePrivate(Native Method)3: at org.jasig.portal.UserInstance.renderState(UserInstance.java:282)5: at com.pipeline.email.engine.ExternalSessionIMAP4.getPersonalNamespace(ExternalSessionIMAP4.java:243)6: at java.net.PlainSocketImpl.socketAccept(Native Method)14: at com.pipeline.email.engine.ExternalSessionIMAP4.getJMCacheSubfolders(ExternalSessionIMAP4.java:599)21: at java.lang.Thread.sleep(Native Method)47: at java.net.SocketInputStream.socketRead(Native Method)262: at java.lang.Object.wait(Native Method)total of 365 threads
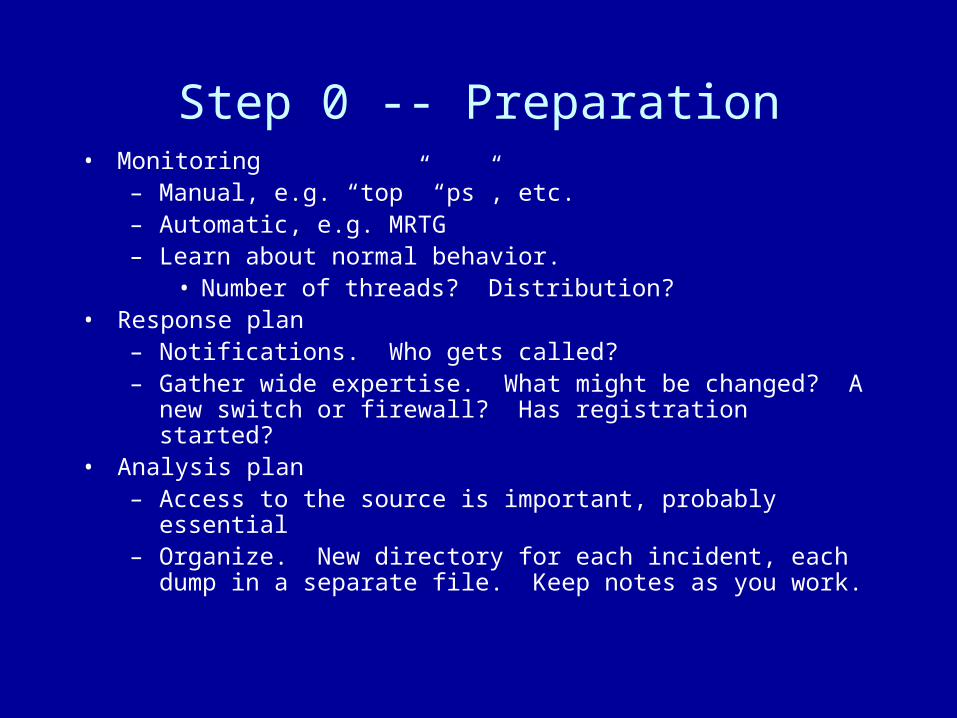
Step 0 -- Preparation• Monitoring
– Manual, e.g. “top” “ps”, etc.– Automatic, e.g. MRTG– Learn about normal behavior.
• Number of threads? Distribution?• Response plan
– Notifications. Who gets called?– Gather wide expertise. What might be changed? A new
switch or firewall? Has registration started?• Analysis plan
– Access to the source is important, probably essential– Organize. New directory for each incident, each dump in a
separate file. Keep notes as you work.


Step 1 -- Something’s Wrong!
• Generate the dump. Maybe a couple of dumps, but one is probably OK for now.
• Maybe clean the dump file.– depends on how smart your tool is
• Check the system’s vital signs.– Running out of memory?– CPU bound? Idle CPU often means a concurrency
problem, or an unavailable resource.

Step 2 -- What’s happening?
• 10/27/2004. production portal becomes non-responsive• First, try looking at the tops of the stacks. See anything
odd?
[EXAMPLE 1] (2004102701)
1: at com.pipeline.grouptools.lib.GTSession.initialize(GTSession.java:203)2: at java.util.HashMap.put(HashMap.java:324)6: at java.net.PlainSocketImpl.socketAccept(Native Method)20: at java.lang.Thread.sleep(Native Method)47: at java.net.SocketInputStream.socketRead(Native Method)133: at java.lang.Object.wait(Native Method)235: at netscape.ldap.util.ConnectionPool.getConnFromPool(ConnectionPool.java:208)total of 444 threads

• Often the tops are not that useful
[EXAMPLE 2] (ex2)3: at java.net.PlainSocketImpl.socketAccept(Native Method)6: at java.lang.Thread.sleep(Native Method)16: at java.net.SocketInputStream.socketRead0(Native Method)33: at java.lang.Object.wait(Native Method)total of 58 threads
• Lots of things call Object.wait. Best to ignore this for now.
• 16 Threads in socketRead0. Try looking down the stack
interesting traces ...16 interesting traces17 frames down ...10: at edu.hawaii.portal.channels.jasig.ReallySlowChannel. setRuntimeData(ReallySlowChannel.java:47)total of 10 threads

edu.hawaii.portal.channels.jasig.ReallySlowChannel.setRuntimeData
Thread 1 Thread 2 Thread 3 Thread 4

Thread 1 Thread 2 Thread 3 Thread 4
edu.hawaii.portal.channels.jasig.ReallySlowChannel.setRuntimeData

Reality is usually more complicated …
[EXAMPLE 3] (2004120101)
6: at java.net.PlainSocketImpl.socketAccept(Native Method)9: at com.example.foo.Bar(Bar.java:559)9: at com.iplanet.server.http.servlet.NSServletSession.ostream_flush(Native Method)9: at org.jasig.portal.UserInstance.renderState(UserInstance.java:267)15: at java.lang.Thread.sleep(Native Method)36: at org.jasig.portal.UserInstanceManager.getUserInstance(UserInstanceManager.java:76)72: at com.example.foo.Foo.setFoo(Foo.java:596)99: at java.net.SocketInputStream.socketRead(Native Method)139: at com.example.foo.Foo.getFoo(Foo.java:534)142: at com.iplanet.server.http.session.IWSHttpSession.removeAllObjects(IWSHttpSession.java:705)232: at java.lang.Object.wait(Native Method)total of 788 threads

When TOS isn’t enough
• Sometimes you need to identify threads which pass through certain methods .– “pass through” meaning “currently executing”
• Call these methods (and threads) “interesting”.
• Some threads may be blocked in the interesting methods. Some may have made it through to other methods.

“interesting” example
public class Example {
private Object aLock = new Object();
public void foo() {
synchronized (aLock) {
bar();
}
}
private void bar() {
// calls other methods …
}
}

Let’s call removeAllObjects “interesting” and see what we get …
interesting traces ...212 interesting tracesinteresting TOS ... 70: at com.example.Foo.setUserFoo(Foo.java:596)142: at com.iplanet.server.http.session.IWSHttpSession.removeAllObjects(IWSHttpSession.java:705)
• 212 threads made it into or past removeAllObjects.
• of these, 142 are blocked inside that method (why? dunno) and 70 have made it past, and are now blocked in setUserFoo
• Time to check the source …

_getUserFoo():
synchronized( aLock ) { … }
getUserFoo():
synchronized( aLock ) {
… }
setUserFoo(): synchronized( aLock ) {
…}
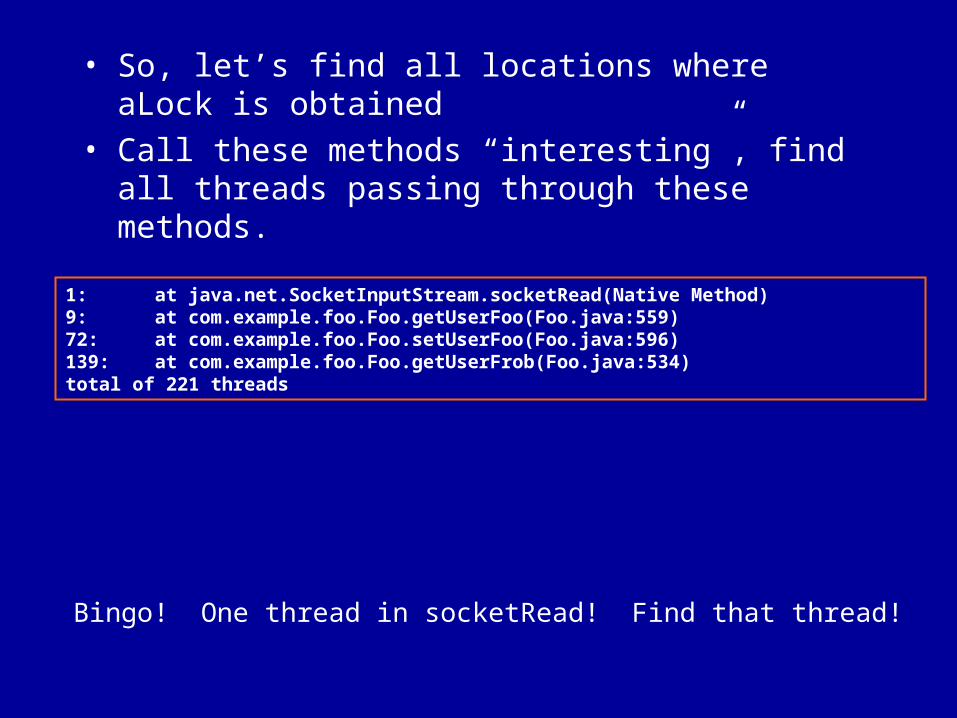
• So, let’s find all locations where aLock is obtained
• Call these methods “interesting”, find all threads passing through these methods.
1: at java.net.SocketInputStream.socketRead(Native Method)9: at com.example.foo.Foo.getUserFoo(Foo.java:559)72: at com.example.foo.Foo.setUserFoo(Foo.java:596)139: at com.example.foo.Foo.getUserFrob(Foo.java:534)total of 221 threads
Bingo! One thread in socketRead! Find that thread!

nid=0xc9 suspended [0x8dc77000..0x8dc79668]
at java.net.SocketInputStream.socketRead(Native Method)at java.net.SocketInputStream.read(SocketInputStream.java:85)at oracle.net.ns.Packet.receive(Unknown Source)at oracle.net.ns.NetInputStream.getNextPacket(Unknown Source)at oracle.net.ns.NetInputStream.read(Unknown Source)at oracle.net.ns.NetInputStream.read(Unknown Source)at oracle.net.ns.NetInputStream.read(Unknown Source)at oracle.jdbc.ttc7.MAREngine.unmarshalUB1(MAREngine.java:726)at oracle.jdbc.ttc7.MAREngine.unmarshalSB1(MAREngine.java:698)at oracle.jdbc.ttc7.Oclose.receive(Oclose.java:105)at oracle.jdbc.ttc7.TTC7Protocol.close(TTC7Protocol.java:533)at
oracle.jdbc.driver.OracleStatement.close(OracleStatement.java:639)…
TIP: Learn to recognize the unexceptional

Resources
• jstack, jconsole• BEA analysis tool.
– uses XSLT to produce graphs, analysis– http://dev.bea.com/products/wlplatform81/articles/thread_dumps.jsp
• sample code– http://www2.hawaii.edu/~jdane/jasig

Finally
• If you haven’t considered this method (as a “real” method), you should.
• Success rate: 20/50/30• don’t neglect QC