Embed Size (px)
Citation preview
1
Predicting high consumer-brand identification and high repurchase:
necessary and sufficient conditions
Pedro Torres
CeBER and Faculty of Economics, University of Coimbra
Av. Dias da Silva, 165
3004-512 Coimbra - Portugal
Phone: +351 239 790584, Fax: +351 239 790514
E-mail: [email protected]
Mário Augusto
Institute of Systems and Robotics, CeBER and Faculty of Economics, University of Coimbra
Av. Dias da Silva, 165
3004-512 Coimbra - Portugal
Phone: +351 239 790544, Fax: +351 239 790514
E-mail: [email protected]
Pedro Godinho
CeBER and Faculty of Economics, University of Coimbra
Av. Dias da Silva, 165
3004-512 Coimbra - Portugal
Phone: +351 239 790571, Fax: +351 239 790514
E-mail: [email protected]
Corresponding author: Pedro Torres
Acknowledgements
The authors gratefully acknowledge the useful comments and suggestions of three anonymous reviewers,
which helped to significantly improve the article.
Funding
This research did not receive any specific grant from funding agencies in the public, commercial, or not-
for-profit sectors.
© 2017. This manuscript version is made available under the CC-BY-NC-ND 4.0 license
http://creativecommons.org/licenses/by-nc-nd/4.0/
This is a post-peer-review, pre-copyedit version of an article published in Expert Systems with
Applications. The final version of the article is available online at:
http://dx.doi.org/10.1016/j.jbusres.2017.05.029
2
Abstract
The objective of this paper is to explore the necessary and sufficient conditions to obtain high
consumer-brand identification (CBI) and high repurchase intentions (Rep). Different from most
business research on CBI and Rep that is based on symmetric thinking, this paper uses
asymmetric analytics and performs fuzzy set qualitative comparative analysis. The findings show
that (1) although it is possible to identify the necessary conditions for very high consumer-brand
identification and very high repurchase intentions, no combination of conditions is sufficient to
achieve these outcomes; (2) affective drivers have more importance than cognitive drivers for
obtaining high CBI; (3) the configuration solutions for high CBI include at least two antecedents;
(4) high CBI is a sufficient but not necessary condition for high Rep; (5) high Rep can also be
achieved if brand-self similarity and brand identity occur; and (6) memorable brand experiences
alone may be enough to obtain high Rep.
Keywords: Consumer-brand identification; Repurchase intent; Memorable brand experiences;
Brand identity; Brand social benefits; Brand-self similarity.
3
1. Introduction
Despite the recent attention that has been devoted to consumer-brand identification (CBI) and the
important insights that have been provided by the past research, it is also recognized that the
knowledge of this phenomenon is still limited (e.g., Stokburger-Sauer, Ratneshwar, & Sen, 2012;
Elbedweihy, Jayawardhena, Elsharnouby, & Elsharnouby, 2016). To advance the knowledge on
CBI, this paper aims to identify the sufficient and necessary conditions that lead to high CBI and
high repurchase intent (Rep), as well as the configurations that result in very high or low values
of CBI and Rep. This configurational approach enables a better understanding of CBI and
provides actionable insights, which leads to more efficient and effective marketing strategies.
CBI corresponds to “a consumer’s psychological state of perceiving, feeling, and valuing
his or her belongingness with a brand” (Lam et al., 2013, p. 235), and it is influenced by
cognitive-based drivers and affective-based drivers. Cognitive-based drivers include brand-self
similarity (BSS) and brand identity (BI), and affective-based drivers include brand social
benefits (BSB) and memorable brand experiences (MBE). The relative importance of each of
these categories is still controversial in the marketing literature. For example, Stokburger-Saur et
al. (2012) suggest that affective drivers have a stronger role, while Bhattacharya and Sen (2003)
indicate a major influence of cognitive drivers.
The previous research has suggested that the extent to which consumers identify with a
brand influences Rep (e.g., Ahearne, Bhattacharya, & Gruen, 2005) and brand loyalty (e.g.,
Bhattacharya & Sen, 2003; Tuškej, Golob, & Podnar, 2013; Yeh, Wang & Yieh, 2016). Thus, in
this paper, we also analyze the conditions that lead to Rep that also reflect brand loyalty.
4
The present study is original and valuable both in theory and in methodology. The current
research on CBI has been using symmetric methods, such as multiple regression analyses and
structural equation modeling (e.g., Stokburger-Sauer et al., 2012; Lam et al., 2013; Wolter et al.,
2016). These methods report the net effects of a set of independent variables on a dependent
variable and focus on linear relationships (Woodside, 2013). In this paper, we resort to a
different approach: we use fuzzy set Qualitative Comparative Analysis (fsQCA). This approach
allows for the identification of the combinations of conditions that lead to a given outcome, and
it also sheds light on the degree of sufficiency and the degree of necessity of those conditions. It
takes into account the possible asymmetric effects of the variables, considering that, in some
configurations, the presence of a given condition may contribute to reaching the outcome and, in
other contexts, it may be its absence that leads to the outcome.
Conceptually, this research considers the cognitive-based and affective-based drivers of
CBI, and it investigates the combinations of cognitive-based and affective-based drivers that may
lead to the outcomes of interest. The conceptual models are presented in Figure 1. First, the
different configurations to achieve high CBI are assessed (step 1). Second, considering both high
CBI and its antecedents, the solutions that lead to high Rep are analyzed (step 2). An analysis of
the high, very high and low values of CBI and Rep is also performed.
(Insert Figure 1 about here)
The rest of this paper is organized as follows. In Section 2, the background on CBI and
Rep is reviewed. In Section 3, the sample, data collection and measures are described, some
aspects of the application of the method are introduced, and preliminary analyses are presented.
5
The main analysis is based on a survey that was administered to a student sample with questions
regarding a beer brand. The preliminary analysis includes contrarian case analysis, calibration,
definition of consistency and frequency thresholds, and an analysis of necessary conditions. In
Section 4, the results are presented, the predictive validity of the configurations is assessed and
an analysis of the generalizability of the results is performed. To test the predictive validity, the
sample was split into two random subsamples, and the models were estimated in a subsample
and applied to the other. The models were also applied to a subset of older students and to a
sample of airline customers to obtain some indications about their generalizability. In all of the
analyses, the models show good performance in data sets that are different from the ones that
were used to estimate them. The results are discussed in Section 5. Finally, in Section 6, the main
conclusions are presented: the importance of affective drivers for CBI is acknowledged; in
addition to the causal effect of CBI on Rep, the findings suggest that the presence of two
cognitive drivers (BSS and BI) or of MBE could also lead to high Rep. The Appendices present
the scale items and Cronbach’s alpha coefficients and a robustness analysis to the calibration,
consistency and frequency thresholds.
2. Background
Brands can be the facilitators of social identity creation and expression (Stokburger-Sauer et al.,
2012), and consumers can identify with a brand that they perceive to match their self-concept
(Wolter et al., 2016). Through this process, consumers satisfy their self-verification needs, which
in turn enhances their attitudes and behavior toward the brand (Elbedweweihy et al., 2016). In
fact, CBI is considered to be an antecedent of brand loyalty (e.g., Bhattacharya & Sen, 2003;
Tuškej, Golob, & Podnar, 2013; Yeh, Wang & Yieh, 2016), which contributes to positive brand
equity (Torres, Augusto, & Lisboa, 2015), creates competitive barriers (Yoo, Donthu, & Lee,
6
2000) and influences consumer preferences and purchase intentions (Cobb-Walgren, Ruble, &
Donthu, 1995).
Based on social identity theory, which includes cognitive, affective, and evaluative
aspects, Lam et al. (2013) consider three key CBI antecedents: perceived quality (which is
generally under the control of brand managers); self-brand congruity (which could be somehow
managed by brand managers through positioning); and consumer innate innovativeness (which
corresponds to an individual trait, beyond the control of brand managers). In fact, consumers
look for a brand whose identity matches their own to fulfill consistency needs; however, they can
also achieve the fulfillment of their self-esteem needs if the consumption of the brand helps them
to form their ideal self-image (He, Li, & Harris, 2012). Stokburger-Sauer et al. (2012) include
the social benefits of a brand as an antecedent of CBI, and the construct is seen primarily as a
cognitive representation with an abundance of emotional associations. Therefore, positive brand
attitudes, which correspond to an individual’s judgment of the goodness of brand (Park,
MacInnis, Priester, Eisingerich, & Iacobucci, 2010), are considered to be conceptually different
than CBI.
Taking into account the key needs that are likely to drive identification in the marketing
context, i.e., self-continuity, self-distinctiveness, and self-enhancement, Stokburger-Sauer et al.
(2012) suggest that identification with a brand results from both cognitive and affective-based
drivers. On the one hand, cognitive drivers result from the extent to which a person perceives a
brand: i) to have a personality that is similar to their own, ii) to be unique or distinctive, and iii)
to be prestigious. On the other hand, affective-based drivers include factors that are related to the
consumption experience itself and address how CBI can be influenced by the extent to which
consumers: i) feel that their interactions with a brand help them connect socially, i.e., result in
7
social benefits, ii) perceive a brand to be warm, and iii) have memorable positive brand
experiences. Stokburger-Sauer et al. (2012) noted that the influence of the affective antecedents
of CBI could be stronger than the influence of cognitive antecedents.
2.1. Drivers of CBI
Lam et al.’s (2013) conceptual framework includes an instrumental driver (perceived quality)
and a symbolic driver (self-brand congruity). Unlike the previous studies that have indicated a
stronger influence of instrumental drivers on CBI (e.g., Kuenzel and Halliday, 2008), Lam et al.
(2013) suggested that the symbolic drivers grow stronger over time, as opposed to the
instrumental driver, which remains stable. Perceived quality could be useful in predicting the
initial level of CBI; however, it may not sustain CBI over time. Therefore, the extent to which a
consumer’s personality overlaps with a brand’s personality could have stronger effects on CBI.
Self-congruity refers to the matching process between the symbolic attributes of brands
and the consumer’s own self-image (Sirgy, 1985). The set of human characteristics that can be
associated with a brand is usually described as brand personality, and the greater the overlap
between a consumer’s self-concept and brand personality, the more likely it is that the consumer
to have a positive attitude towards the brand (Kuenzel & Halliday, 2010). Moreover, consumers
often purchase goods to express their identity (Aaker, 1997). The literature suggests that the
relationship of self-brand congruity and consumer behavior is mediated by CBI (e.g.,
Bhattacharya & Sen, 2003); however, some authors have found that self-congruity with a
sponsorship event could influence brand loyalty (Sirgy, Lee, Johar, & Tidwell, 2008). Brand-self
similarity (BSS) plays an important role in the brand identification approach that leads to brand
loyalty.
8
Brand identity could be defined as the distinctive and relatively enduring characteristics
of a brand (He et al., 2012; Bhattacharya & Sen, 2003), and a brand tends to be more attractive
when the identity is more prestigious and more distinctive (Stokburger-Sauer et al., 2012; He et
al., 2012). In fact, brand prestige and brand distinctiveness are considered to be the two most
salient brand identity characteristics (e.g., So, King, Hudson, & Meng, 2017). However,
Stokburger-Sauer et al. (2012) did not find evidence of a brand prestige predictive role, and
recent studies have reported similar results (e.g., Wolter et al., 2016). In general, prestige
indicates that an organization is well regarded by other people, whose opinions are valued, which
means that it is respected, admired and well known (Bergami & Bagozzi, 2000). If a brand’s
positioning is associated with a relatively higher status, this result could be regarded as brand
prestige (Steenkamp, Batra, & Alden, 2003), and the extent to which consumers perceive a brand
image to be prestigious may influence their levels of self-esteem in identifying with the brand
(Ahearne et al., 2005). Furthermore, consumption of prestige brands may improve consumers’
social standing and self-expression (O’Cass & Frost, 2002). Brand distinctiveness is often
described as the perceived uniqueness of a brand’s identity in relation to its competitors (e.g.,
Stokburger-Sauer et al., 2012). Marketing scholars have suggested that the degree of
identification with a brand will be higher if consumers perceive the brand to be distinctive.
The use of brand prestige and brand distinctiveness as two different constructs implies
that the former satisfies self-enhancement motives and the latter self-differentiation motives
(Bhattacharya & Sen, 2003). However, brand prestige results from a brand’s unique know-how,
specific attribute or overall quality, and the positive effect of brand prestige on purchase
intention can be mediated by perceived quality, information costs saved, and perceived risk
(Baek et al., 2010). Thus, it may be difficult to separate brand prestige from brand
9
distinctiveness. The present study will focus on BI as a driver of CBI, keeping in mind that brand
prestige and brand distinctiveness are two important characteristics of brand identity.
Regarding the more affective drivers of CBI, which consider consumers’ interactions and
encounters with a brand and other brand customers, this study follows the approach of So et al.
(2017). Thus, the present research includes two theoretical constructs, BSB and MBE.
Stokburger-Sauer et al. (2012) defined BSB as the social interaction opportunities that are
provided by a brand and suggested that consumers’ perception that a brand provides brand social
benefits will likely lead to CBI. Brands carry social and cultural meaning, and sometimes
consumers form groups on the basis of a shared commitment to a brand (Thompson, Rindfleisch,
& Arsel, 2006). When positive attitudes toward a brand are generated, consumers tend to behave
in such a way as to sustain those positive attitudes (Raghunathan, Naylor, & Hoyer, 2006).
Brands that offer MBE are more likely to develop CBI (Stokburger-Sauer et al., 2012),
and brands that promote consumer affection toward the brand tend to prompt greater purchase
loyalty (Chaudhuri & Holbrook, 2001). The self-referencing process that is promoted by some
brands through the construction of brand-related stories and narratives produces affect-laden and
easily retrievable memories, which tends to improve the strength of the connections between the
consumer and the brand (Escalas, 2004). In fact, the perception of a brand is increasingly linked
to a consumer’s experience with the brand. Thus, a brand can create incremental value through
brand experiences (Cliffe & Motion, 2005). MBE could involve sensory perceptions, brand
affect, and the participatory experiences that a consumer may seek with a brand (Schmitt, 2012).
Certain brands could leave a strong affective charged mark on the consumer’s consciousness,
even if such brands are infrequently used (Stokburger-Sauer et al., 2012).
10
2.2. Analysis of CBI and Rep
Given the trend of product commoditization that is enabled by the standardization of technology
design and manufacturing processes, the capacity to create meaningful brand associations has
become increasingly more important to differentiate a company’s offering, in particular the
associations that are related to consumers’ self-identity (Chernev, Hamilton, & Gal, 2011). The
recent research on CBI has studied the antecedents and consequences of CBI using an additive
and linear approach (e.g., Stokburger-Sauer et al., 2012). However, the phenomenon of CBI is
complex, and, in spite of the acknowledged power of branding, customer loyalty is one of the
most challenging issues that are faced by companies in a world of intense competition
(Nyadzayo & Khajehzadeh, 2016). In fact, with regard to brand loyalty, the previous marketing
research makes a case for conjunctural causation: it is often noted that only a combination of
conditions would lead to a desired outcome. For example, as reported by Chai, Malhotra, and
Alpert (2015), most loyalty studies indicate that satisfaction alone is not sufficient to bond
customers and, as noted by Nyadzayo and Khajehzadeth (2016), high service quality evaluation
per se is insufficient to drive customer loyalty.
In the application that is made in this paper, we are not interested in the average effects of
the antecedent variables on the outcome. Instead, we want to determine whether there are
necessary conditions for high, very high, and low CBI and Rep intentions, and we want to know
if alternative configurations of conditions are sufficient to achieve the same outcome. We do not
assume that the effects of the antecedents are additive but instead that completely different
combinations of those antecedents may lead to the same outcome. We must note that, in this
application, it is of great interest to identify the sets of causal conditions that lead not only to
high levels of the outcomes but also to very high levels and to low levels of the outcomes.
11
Consumers with very high repurchase intentions are a subset of the set of consumers with high
repurchase intentions whose answers show the most extreme (highest) scores concerning such
intentions; that is, they have an extreme state of commitment to a brand.
An analysis of high, very high and low outcome values is also performed by Fiss (2011),
in the context of company performance. In an asymmetrical analysis such as the one that is
performed in this paper, the conditions that lead to very high outcome levels do not necessarily
imply more extreme values of the variables that lead to high outcome levels. As is shown by Fiss
(2011), very high outcome levels may be achieved by adding conditions to some of the
configurations that are obtained for high levels, or by configurations that are based on different
conditions. It is also possible that no configuration is sufficient to achieve such very high
outcome levels.
2.3. Tenets for predicting CBI and Rep
Despite the relationships among the constructs that have already been tested in the previous
research, the conceptual models and results are not consensual. The possible existence of
different configurations that lead to the same outcome could be an answer to this ambiguity.
Therefore, some tenets were proposed to guide the investigation, as follows.
First, it is to be expected that more than one antecedent of CBI will be present in the
solutions for achieving high CBI. This is justifiable considering the drivers of CBI that have been
established in the previous studies (e.g., So et al., 2017; Stokburger-Sauer et al., 2012) and
building on the marketing literature that suggests that CBI is directly influenced by two
categories of factors: i) one category that includes brand characteristics (such as prestige and
distinctiveness) as is reflected in BI, and ii) another category that results in consumer-brand
12
interactions, which includes social benefits and memorable brand experiences (So et al., 2017).
Our goal here is also to better understand if the different configurations for high CBI include
more cognitive drivers (BSS and BI) or more experiential (i.e., affect-rich) drivers (BSB and
MBE), which is still controversial. Thus, we formulate the following tenet.
T1: The sufficient conditions for achieving CBI require the joint presence of more than one CBI
antecedent (BSS, BI, BSB, and MBE).
Second, although the recent studies have proposed that CBI may result in higher brand loyalty
(e.g., Kuenzel & Halliday, 2010), the previous research has established a solid relationship
between the antecedents of CBI and repurchase intentions. For example, brands can create value
by providing memorable experiences (Cliffe & Motion, 2005) and thereby enhancing greater
purchase loyalty through the affection that they generate in consumers (Chaudhuri & Holbrook,
2001). Moreover, some authors (e.g., Chernev et al., 2011) report the existence of limits to the
benefits of positioning brands as a means of self-expression. Thus, high CBI could be sufficient,
but not necessary, to obtain brand loyalty (hereby assessed through high repurchase intentions).
T2: High CBI is a sufficient, but not necessary, condition for high repurchase intentions.
In a world of intense competition, it is sensible to postulate that CBI per se will not be enough to
achieve very high repurchase intention, which reflects an extreme state of commitment to a
brand. Nevertheless, given the trend of product commoditization, brands increasingly compete
for consumer identification, and the recent marketing research has well documented the
importance of CBI (e.g., He et al., 2012). Thus, we formulate the following tenet.
T3: High CBI is a necessary, but not sufficient, condition for very high repurchase intentions.
13
Finally, taking into consideration the asymmetry that is implicit in the proposed methodology
(fsQCA), it can be expected that the conditions for low, high or very high outcome values will
not be symmetrical.
T4: The conditions for low values of CBI and Rep are not the mirror opposites of the conditions
for high or very high values of these outcomes.
3. Methodology
3.1 Sample, data collection, and measures
The present research focuses on Sagres brand, a market leader in the Portuguese beer market,
which has a market share of approximately 45%. The product category is widely available and
well known, and it complies with the two most important criteria that should be observed when
selecting a product (Buil, Chernatony, & Martínez, 2013). The intense marketing activity of the
chosen brand and its market share ensure that the brand is well known among Portuguese
consumers. Moreover, the positioning of beer brands is often based on a myriad of attributes that
provide consumers with varied identity targets with which to identify (Wolter et al., 2016).
Because the likelihood of beer consumption is strongly linked to the 20-to-30 age
segment of the market (e.g., Atilgan, Aksoy, & Akinci, 2005, p. 241), and young people are the
primary target of this beverage category (e.g., Zawrun, Metzer, & Kunkel, 2006), a sample of
university students is appropriate for this research. In addition, beer is the most commonly
consumed alcoholic drink by university students (19-to-24 years), who are frequent consumers of
this beverage (studies performed by SICAD, the Portuguese observatory of addictive behaviors).
Moreover, the homogeneous nature of a student sample, with regard to both demographics and
14
behavioral characteristics, which are non-theoretical variables, supports its use for theory
application (e.g., Wyllie, Carlson, & Rosenberger, 2014).
An online survey was conducted on undergraduate students who were registered in the
academic year 2014/2015 at the University of Coimbra. The data were gathered between the 31st
of July and the 2nd of September 2015, and 1,173 usable answers were obtained.
The study draws the scales from the literature with some adaptations. Consumer-brand
identification and its antecedents were based on the measures that were proposed by Stokburger-
Sauer et al. (2012) with some exceptions and refinements: i) the measure for brand-self
similarity was based on Lam et al. (2013), which was an adaptation of Aaker’s (1997) brand
personality scale; ii) brand identity was based on the scales that were used for both brand
prestige and brand distinctiveness by Stokburger-Sauer et al. (2012) because they are similar to
the scale that has been used by other authors to measure brand identity (e.g., He el al., 2012); iii)
the Stokburger-Sauer et al. (2012) scale for brand social benefits was used, but one item was
added. For repurchase intent we adapted the scale that was developed by Kuenzel and Halliday
(2008). The measurement instrument was pilot-tested, and the final version is presented on the
Appendix I. The seven-point Likert scale that was used ranges from 1 (“strongly disagree” or
“very little similarity”) to 7 (“strongly agree” or “very similar”). All of the scales show high
reliability (all of the Cronbach’s Alpha coefficients are above 0.88).
Consumer-brand identification (CBI) and repurchase intent (Rep) are the outcomes of
interest, and brand self-similarity (BSS), brand identity (BI), brand social benefits (BSB),
memorable brand experiences (MBE) are the antecedents. However, CBI is both an outcome and
an antecedent of Rep.
15
The questionnaire also included information concerning sex, age, and the regularity of
beer consumption by the respondents (Reg), although there is no indication that they would
affect the outcomes. Still, those conditions were used to perform a necessary conditions analysis
for both CBI and Rep, and they showed low consistency scores as necessary conditions. Thus,
for the sake of parsimony, and to achieve interpretable configurations, they were removed from
the configurational analysis. The score of each respondent in each construct was defined as the
average of the answers to the different questions concerning the construct.
3.2. Method and preliminary analysis
3.2.1. Modeling Causal Configurations
Qualitative comparative analysis (QCA) involves the examination of the relationships between
the outcome of interest and all of the possible combinations of binary states (i.e., presence or
absence) of its predictors, by performing a systematic cross-case analysis that models the
relationships among variables in terms of a set membership using Boolean algebra to identify
configurations that reflect the necessary and sufficient conditions for an outcome of interest
(Ordanini, Parasuraman, & Rubera, 2014). Set-theoretic methods such as fuzzy set QCA do not
use the conventional variable-based approach but rather treat configurations as different types of
cases, and it is the combinations of attributes that give cases their uniqueness (Fiss, 2011).
Recently, it has been increasingly advocated that researchers should craft and test theory using
algorithms and move beyond conventional techniques such as multiple regression analysis (e.g.,
Woodside, 2013), and the use of complexity theory applications and fuzzy set qualitative
comparative analysis (fsQCA) is growing in the sub-disciplines of management (Woodside,
2014). The main reason for this call relies on the fact that other techniques, such as multiple
16
regression analysis, focus on net effects, which may be misleading: in Subsection 3.2.2 we
explain that, in the data that are analyzed in this article, even when a clear main effect is found,
there may be a substantial number of cases that contradict this main effect.
This does not mean that we advocate the complete replacement of regression analysis by
configurational analysis. Regression analysis can provide some information about the
relationship among variables that configurational analysis cannot. Following the reasoning of Vis
(2012), quantitative approaches, such as regression, follow an “effects-of-causes” approach and
attempt to estimate the average effect of the antecedent variables on the outcome. This approach
works well if the effects are symmetrical and if both types of relationships among the variables
and the outcome and the types of interactions between the variables are known. However, when
the effects of the variables are asymmetrical, and the form of interactions among them is
unknown, regression analysis may be inappropriate. In such situations, fsQCA may be able to
provide useful information by identifying the combinations of conditions that lead to a given
outcome. In a way, to use an expression of Vis (2012), fsQCA and regression analysis may
provide “complementary lights” on a given topic. Therefore, as suggested by Schneider and
Eggert (2014, p. 323), the choice of method should be based on the research question and on the
theoretical links that are suspected in the data, i.e., causes-of-effects rather than effects-of-causes
and complex and configurational rather than additive and linear. Although there are some
approaches that may overcome the liabilities of regression in analyzing configurations, they also
face significant shortcomings (Rihoux & Marx, 2013, p.192).
Distinguishing between the degree of sufficiency of a condition and the degree of
necessity of a condition, and determining the various paths that lead to a desired outcome can
result in important actionable insights for practice. Such insights can help managers to focus
17
marketing efforts, thereby improving the effectiveness and efficiency of their campaigns, and
they can better justify their marketing actions (if the mechanisms are nonlinear, the fsQCA
approach may produce a more realistic model; for example, the causes of low Rep are not
necessarily the reverse of those that lead to high or very high Rep).
Thus, following the arguments that were presented by Schneider, Schulze-Bentrop, and
Paunescu (2010), fsQCA is the appropriate method for this analysis because: i) asymmetrical
causality is allowed, ii) combinations of various causal conditions, rather than a single condition,
are considered to be linked to the outcome, iii) multiple causal paths that lead to the same
outcome could be detected, thereby capturing the idea of equifinality (Fiss, 2007), and iv) links
between the various combinations of causal conditions and the outcome are expressed as
necessary and sufficient conditions. Additionally, it is possible to differentiate between causally
core and causally peripheral conditions (e.g., Fiss, 2011).
In this application of fsQCA we address a large number of cases –in the literature this is
often called a “large-N” application. QCA methods were originally used for small numbers of
cases, for which researchers had deep knowledge of individual cases; however, they have been
progressively extended to large numbers of cases (see, for example, Ragin & Fiss, 2008;
Woodside, 2012; or the examples mentioned by Rihoux 2006, p. 698). Rihoux (2006, p. 685)
argues that fuzzy sets, in the context of QCA “… are actually quite well suited to large-N
situations, i.e., to research designs in which the comprehension of each individual case matters
much less.” Large-N applications involve some adjustments in the way in which QCA methods
are applied and in the analysis and interpretation of the results. Greckhamer, Misangyi, and Fiss
(2013) compare the use of QCA methods with a large number of cases with their use with a
small number of cases, and they find that, with a large number of cases, QCA methods can be
18
used for inductive or deductive reasoning and for theory building and testing, larger frequency
thresholds should be used (see Subsection 3.2.4), and the results of necessity and sufficiency
analysis can be interpreted as patterns across many cases without returning to the original cases,
which is of particular interest in the application that is presented in this paper. Emmenegger,
Schraff, and Walter (2014) stress the importance of performing robustness tests in large-N
applications to remedy the shortcomings that are associated with the weaker knowledge of
individual cases, and we perform such robustness analysis in Appendix II. For a deeper
discussion of the adjustments that should be made in large-N situations, we refer the reader to
Emmenegger et al. (2014), Greckhamer et al. (2013) and Vis (2012).
To understand the causal configurations that lead to high consumer-brand identification
and high repurchase intention (outcomes), the analysis of necessary and sufficient conditions was
performed using fsQCA. The preliminary analysis includes contrarian case analysis and analysis
of necessary conditions. In the next subsections, we also explain our calibration strategy and the
definition of the thresholds that necessary for the application of fsQCA.
3.2.2. Contrarian case analysis
Even when there are significant main effects between constructs, there may also be an important
number of cases that contradict such main effects. We tried to ascertain if this would be the case
in the data that we are using by employing quintile cross-tabulations analysis (similarly to
Woodside, 2016). All of the different combinations among the antecedents (A) and outcomes (O)
were considered, and both the percentage of the cases that support the relationship AO and the
percentage of the cases that contradict it (either by indicating ~AO or A~O) were calculated.
Although in all of the cases, the phi (degree of association between two variables) indicates a
19
clear main effect relationship (phi values range from 0.558 to 0.838), it is also clear that many
contrarian cases occur: the percentages of contrarian cases range from 6.5% (for the MBECBI
relationship) to 16.1% (for the BSBRep relationship). This shows that the main effects may
not tell the whole story, thus a configurational analysis may provide important insights on the
data.
3.2.3. Calibration
To apply fsQCA, we must transform the original values of the variables into fuzzy scores (which
are defined in the [0,1] interval but should not be confused with probabilities). When the range of
values of the variables is continuous or the number of possible values is large, the direct method
of calibration is usually used (see Ragin, 2008, chapter 5) – this method maps the original values
into fuzzy scores that belong to the [0,1] interval. This method requires the specification of full
membership and full non-membership thresholds and a crossover point of maximum ambiguity
(Ragin, 2008). Each of these thresholds translates into a specific fuzzy value – it is standard to
use fuzzy values of 0.95, 0.05 and 0.50 for the full membership and non-membership thresholds
and for the crossover point, respectively (see, e.g., Ragin, 2008, chapter 5). Ideally, these
thresholds should be defined in accordance with external standards; however, it is often
impossible to find such standards. In their absence, many researchers use given percentiles of the
distribution of the original values of the variables to define the thresholds. The 90th, 10th and 50th
percentiles of the values of the original distribution are commonly used to define the full
membership and non-membership thresholds and the crossover point, respectively (e.g., Ho,
Plewa, & Lu, 2016, Navarro, Llinares & Garzon, 2016, Ryan & Berbegal-Mirabent, 2016). For
the constructs BSS, BSB, BI and MBE, and for high consumer-brand identification (HCBI) and
20
high repurchase intentions (HRep), we used this exact method with these percentiles. In fact, this
approach – calculating the value of each variable by averaging their components, defined in
Likert scales, and then using the direct calibration method based on the distribution percentiles –
is similar to the approach that is used by Ali, Kan, and Sarstedt (2016).
We acknowledge that there would be other possible ways to calibrate these constructs,
which are fundamental in our analysis. This issue is particularly important because we do not
have external standards to use as thresholds. To determine how sensitive the results are to the
calibration decisions, and following the recommendation of Emmenegger et al. (2014), we
performed a robustness analysis, which we present in Appendix II. This analysis shows that our
results are quite robust to the use of different thresholds.
We also analyze different levels of the outcomes of interest, specifically, low and very
high levels. Thus, we defined fuzzy variables regarding very high repurchase intentions and very
high consumer-brand identification (VHRep and VHCBI, respectively) as well as regarding low
values for these outcomes (LoRep and LoCBI, respectively). The calibration of the very high
outcome levels is based on Fiss (2011). The median of the distribution of the values of the
variables is the threshold for full non-membership (fuzzy value of 0.05) and the threshold for
full-membership that is used to calibrate high outcome values is now used as the indifference
point (that is, the 90th percentile of the variables now corresponds to a fuzzy value of 0.5). As for
the threshold for full membership (fuzzy value of 0.95), Fiss (2011) uses a very high value for
which he does not present a percentile, so we chose a high percentile, the 95th percentile, of the
distribution of values. The calibration of low outcome values (LoRep and LoCBI) also draws on
Fiss (2011). The median is the threshold for full non-membership and a very low value (the 10th
percentile in our case) is used as the threshold for full membership. For the indifference point,
21
Fiss (2011) uses a value that is halfway between the full membership and the full non-
membership thresholds, while we choose a percentile that is halfway between those thresholds,
specifically, the 30th percentile.
In the case of sex, females were codified as 1 and males as 0. For age, the same logic was
applied as with the constructs that are presented above: the 90th percentile (age 34) was used as
the threshold for full membership, the 10th percentile (age 19) was the threshold for full non-
membership, and the median (age 22) was used as the indifference point. Regarding Reg, regular
drinkers (that is, those who drink at least once a week) were codified as 1, and occasional
drinkers (who drink less than once per week) as 0.
3.2.4. Consistency and frequency thresholds
The use of fsQCA requires the definition of two thresholds: a frequency threshold and a
consistency threshold. The frequency threshold establishes the minimum number of cases that
should belong to a given configuration for that configuration to be included in the causal
analysis. When the total number of cases is small, and the researcher has intimate knowledge of
those cases, a low threshold of one or two cases is often used; however, when the total number of
cases is large, and there is little knowledge of individual cases, it is advisable to use a larger
threshold because those low-frequency configurations might represent random forces or
measurement errors (Ragin & Fiss, 2008). To our knowledge, there are no explicit rules for the
selection of a frequency threshold: the choice is based on a trade-off between the potential for
deductive analysis and the inclusion of rare configurations (Emmenegger et al., 2014). In this
application, given the large number of cases and the homogeneity of the sample, we decided to
use a frequency threshold of 6, so that the included configurations would not be “rare,” but we
22
did not leave out possibly relevant information. Given the importance of this threshold, and the
fact that other choices might also be defensible, we performed a robustness analysis concerning
its choice (see Appendix II), and we concluded that different choices did not lead to significant
changes in the results.
The consistency measures how strongly the empirical evidence supports the argument
that a given causal combination is a subset of the outcome, and the consistency threshold is the
minimum consistency that is required to consider that a given configuration leads to the presence
of the outcome in the causal analysis. For the choice of a consistency threshold, several authors
recommend avoiding values that are less than 0.75 and preferably using values of 0.80 or higher
(e.g., Ragin, 2009, p.121). To choose a specific value, the most recommended procedure consists
of identifying substantial gaps in the range of the consistency scores for the combinations to be
used in the causal analysis (e.g., Ragin, 2009, p.121). These criteria led us to use a consistency
threshold of 0.80 for both HRep and HCBI: for HRep, we have a gap between 0.788 and 0.827,
and all of the other gaps above 0.80 are much smaller; for HCBI, we have a gap between 0.788
and 0.818, and the only other sizeable gap above 0.80 left few configurations above the
threshold. Additionally, we also note that a consistency threshold of 0.80 is common in the
literature (e.g., Ragin & Fiss, 2008; Navarro et al., 2016). In spite of having quite strong reasons
for choosing this value, we also performed a robustness analysis of the choice of this threshold
and concluded that alternative values led to different solutions but not significantly (see
Appendix II).
3.2.5. Analysis of necessary conditions
23
According to Schneider and Wagemann (2010) the number of conditions should be reduced, and
the analysis of necessary and sufficient conditions should be done separately, starting with the
analysis of necessary conditions. To evaluate the necessary conditions, Ragin (2008) proposed
two criteria: the consistency and trivialness of the necessity.
The relationship between sex, age, and Reg and HCBI (outcome) was not clearly defined
at the outset. Consequently, for these conditions, both presence and absence were considered to
be possible necessary conditions (the tilde – negation – represents the absence of the condition).
However, for BSS, BSB, BI, and MBE, only their presence was analyzed because it did not seem
to be sensible to assume that their absence might contribute to HCBI. A similar analysis was
performed for VHCBI and LoCBI. In this latter case, the absence of BSS, BSB, BI, and MBE
was also included in the analysis. The same analysis was conducted for the fuzzy variables that
are related to repurchase intentions (HRep, VHRep, LoRep). A summary of the results is
presented in Table 1 and Table 2, respectively.
(Insert Table 1 about here)
(Insert Table 2 about here)
It is usually recommended that the consistency threshold that is used to assess necessary
conditions should be larger than that which is used for sufficient conditions. In this study, we use
a threshold of 0.9 (see, for example, Schneider et al., 2010). Tables 1 and 2 show that, in all
cases, both the presence and the absence of age, sex, and Reg, show consistency levels that are
much lower than this threshold. However, BSS, BSB, BI, and MBE show high consistency levels
for VHCBI, and BSS, BI and HCBI show high consistency levels as necessary conditions for
24
VHRep. For HCBI and LoCBI, no conditions reach the defined necessity threshold. However,
the consistency levels for BSS, BI, BSB and MBE, in the case of HCBI, and for their negation,
in the case of LoCBI, are much higher than those that are related to age, sex and Reg. For HRep,
no conditions reach the defined necessity threshold and, for LoRep, only the absence of HCBI
reaches it. Again, the consistency levels for BSS, BI, BSB, MBE and HCBI, in the case of HRep,
and their negation, in the case of LoRep, are much higher than those that are related to age, sex
and Reg. All of the conditions that were found to be necessary show a non-negligible coverage;
therefore, they are not trivial (see, for example, Schneider et al., 2010).
4. Results
This section reports the results of the configurational analysis for the outcomes of interest (the
different levels of CBI and Rep), and it also addresses the predictive validity of the
configurations. In the context of fsQCA, predictive validity is an important issue: in fact, most of
the studies only report the model’s fit validity (Wu, Yeh, & Woodside, 2014); however, good fit
does not necessarily mean that the models enable good predictions.
The notation that is used in the solution tables follows Fiss (2011): black circles (““)
indicate the presence of a condition; circles with a cross-out (“⨂“) indicate its absence (in fact,
the absence of a causal condition is never a part of any configuration that is obtained in this
research); blank spaces indicate a situation in which the causal condition may be either present or
absent; large circles indicate core conditions, and small circles indicate peripheral conditions.
4.1. Configurational analysis
25
In the configurational analysis, both the parsimonious solution and the intermediate solution,
which includes only theoretically plausible counterfactuals, were considered. In the intermediate
solution, it was defined that only the presence of the antecedents should contribute to the
outcome (not their absence). According to Fiss (2011, p. 403) “core conditions are those that are
part of both parsimonious and intermediate solutions, and peripheral conditions are those that are
eliminated in the parsimonious solution and thus only appear in the intermediate solution.”
Independent analyses were performed for the different outcome levels (high, very high
and low), because different conditions could be sufficient for different outcome levels. However,
in all of the analyses concerning low and very high levels of CBI and Rep, the results for
consistency were always below the predefined consistency cutoff threshold of 0.80. Thus, the
results suggest that there is no combination of conditions that leads to VHCBI, LoCBI, VHRep,
and LoRep, although all of the conditions are considered to be necessary to achieve VHCBI, and
most of them are necessary for VHRep (see Tables 1 and 2). Therefore, the subsequent analysis
is focused on HCBI and HRep. The configurations to achieve HCBI and HRep are presented in
Tables 3 and 4.
(Insert Table 3 about here)
(Insert Table 4 about here)
For HCBI, the results show that all of the conditions are core because the intermediate
and parsimonious solutions are identical. The consistency of the configurations (models) is
always above 0.85, and the raw coverage is above 0.65, which indicates acceptable consistency
and coverage. In terms of overall coverage, the combined models account for approximately
26
87% of membership in the outcome (HCBI). Table 3 shows that the presence of two conditions
could lead to HCBI; however, either BSB or MBE should be part of the solution. In fact, the only
combination that is missing is the one that joins BSS and BI, which suggests that the presence of
cognitive antecedents alone is not sufficient to obtain HCBI, i.e., one affective antecedent should
be necessary to obtain HCBI.
Table 4 shows the possible configurations to achieve HRep. As in the case of HCBI, all
of the conditions are core. The results in the four models exhibit acceptable consistency (>0.80)
and coverage (>0.60). The overall coverage indicates that the combined models account for
approximately 92% of membership in the outcome of interest (HRep). The results indicate the
existence of two distinct configurational groupings to repurchase intent. First, the presence of
HCBI alone is sufficient to achieve HRep, which confirms the importance of HCBI to enhance
repurchase intent. Second, models 2, 3, and 4, indicate combinations of some CBI antecedents
that could also lead to HRep. It is important to highlight solution 2 (BSS*BI HRep). Although
the combined cognitive antecedents of CBI (i.e., BSS and BI) are not sufficient to achieve HCBI,
they could be sufficient to achieve HRep. The third model shows that BI and BSB could lead to
HRep, which is not surprising because they lead to HCBI, and HCBI appears to be sufficient to
achieve HRep. Finally, the fourth model shows that MBE alone could also lead to HRep, which
stresses the importance for brands to generate memorable brand experiences.
4.2. Predictive validity
Model validation with entire samples may suffer from aggregation bias (Yeh, Wang, & Yieh,
2016), which could lead to misleading indications for marketing management. In fact, a good
model fit does not necessarily mean that the model offers good predictions (Wu et al., 2014).
27
To test for predictive validity, the sample was split into a modeling subsample and a holdout
subsample, as has been suggested in the previous research (e.g., Xu, Zheng, Xu, & Wang, 2016).
Additionally, the roles of the subsamples were reversed, and the latter was treated as the
modeling subsample and the former as the holdout subsample. The assignment of the
observations to the subsamples was completely random, and it was performed in such a way that
the two subsamples would have the same number of observations (in fact, subsample 1 has one
observation more than subsample 2, 587 versus 586, because the total number of observations is
odd). The objective of the test is to determine whether the model that is obtained from subsample
1 has high predictive ability for subsample 2, and vice versa. For this purpose, the models that
are obtained from each subsample should perform well in the other subsample, i.e., they should
have similar configurations, high consistency and coverage.
Table 5 shows the configurations to achieve HCBI. The model that is obtained from
subsample 1 leads to consistent results in subsample 2, regarding both levels of consistency and
levels of coverage. The same is true when subsample 2 is used as the modeling subsample and
subsample 1 as the holdout subsample, which shows predictive validity. In addition,
configurations that were determined using subsample 1 are the same ones that were obtained
with the whole sample, and the configurations that were obtained with subsample 2 are quite
similar – there is only one solution missing, which reinforces the predictive validity.
(Insert Table 5 about here)
Table 6 shows the configurations for HRep, which has been determined by using each
subsample, and their consistency and coverage in the other subsample. As in the previous
28
analysis for HCBI, the levels of consistency and levels of coverage do not change much when
the models that are obtained from a subsample are applied to the other subsample. These results
provide support for predictive validity. Additionally, the model that is obtained from subsample
2 leads to the same configuration as the whole sample, and the model that is obtained from
subsample 1 includes a few changes, but they are not significant, which also reinforces the
predictive validity.
In conclusion, the results that are presented in Tables 5 and 6 indicate that models for
subsample 1 have high predictive ability for subsample 2, and vice versa.
(Insert Table 6 about here)
4.3. Application of the obtained models in other datasets
The survey on which this research is based was conducted on undergraduate students. The ages
of most of these students are in the range between 19 and 24 years. This means that some
questions may be raised about whether the model is also applicable to older consumers.
Additionally, the survey concerns only a beer brand, thus questions may also be raised about the
applicability of the model to other types of products.
To obtain some indications about the generalizability of the findings, the models that are
presented in Tables 3 and 4 were applied to two other datasets:
• The subset of students aged 30 years or more, from the initial survey (188 beer
consumers). The results from this subset were intended to provide more information
about whether the results would also hold when the sample was no longer composed of
predominantly young consumers.
29
• A set of 185 of customers from the airline carrier TAP who answered an online survey
that was conducted between the 17th of January and the 14th of February of 2017. A
random sample was obtained with a survey that replicates the questions of the initial
survey; however, they are applied to TAP. The use of this new sample was intended to
provide some indications about the generalizability of the results not only to customers
with a more diverse range of ages but also to other products.
The results that were obtained with the application of the models to these datasets are shown
in Table 7.
(Insert Table 7 about here)
In the application of the HCBI model, we can see that the consistency values that were
obtained for individual configurations are in the range 0.877-0.943 for the subset of older
students and in the range 0.840-0.890 for the airline customer dataset. Thus, a high consistency is
obtained in the new datasets for all of the original configurations. The overall consistency and
coverage are similar to the original values (see Table 3) for the subset of older students. In the
case of the airline customers, the consistency is slightly lower (0.777) than it was in the original
analysis; however, it is still acceptable (in fact, it is higher than the consistency of 0.753 that we
obtained for HRep in the original analysis). The overall coverage is larger for TAP airline
customers than in the original analysis (0.903 in the former dataset, 0.873 in the original
analysis). To summarize, all of the results indicate that the model that is shown in Table 3 is also
applicable to both the subset of older clients and to the new set of results from the customers of
TAP airline.
30
For the HRep model, the consistency values that were obtained for the individual
configurations are generally larger in the subset of older students than in the original analysis,
and they are quite similar in the case of the survey to customers of TAP airline. the overall
consistency and coverage are very similar to the original values for the customers of TAP airline.
In the case of the subset of older students, the consistency is slightly higher (0.787) than in the
original analysis (0.753). The overall coverage is a little lower in the subset of older students
than in the original analysis (0.929 in the former subset, 0.918 in the original analysis). Once
again, all of the results indicate that the original model is also applicable to both the subset of
older clients and the new set of results from the customers of TAP airline.
To summarize, the results that are presented in Table 7 indicate that the original models
can be applied to both the subset of students aged 30 or more and to a sample of TAP customers.
5. Discussion of the results
Complexity theory recognizes that several combinations may cause the outcome of interest, and
both theory and method are asymmetric in focus. The analysis of necessary conditions shows
that neither the presence nor the absence of age, sex, and Reg are relevant for CBI and Rep,
which focused the analysis on the chosen constructs. However, BSS, BSB, BI, and MBE (or their
absence, in the case of LoCBI and LoRep) show high consistency levels (although they
sometimes are below the defined necessity threshold).
The four antecedents of CBI (BSS, BI, BSB, MBE) are necessary for VHCBI (showing
consistency levels above 0.94); however, no combination of them is sufficient to achieve the
outcome of interest. Similarly, for VHRep, BSS, BI and CBI are necessary conditions, and BSB
and MBE are almost necessary conditions; however, there is no configuration that consistently
31
leads to this outcome. Thus, the results suggest that something more is needed to achieve a very
high state of consumer identification and commitment to a brand, i.e., one that is on the right tail
of the outcome distributions.
Regarding HCBI, five different configurations of sufficient conditions were found. All
five solutions imply the joint presence of two conditions and thereby corroborate the first tenet.
The raw coverage values that range from 0.65 to 0.73 (see Table 3) indicate that all of the causal
configurations are more or less equally represented, and near 87% of the outcomes are explained
by the presented configurations. Considering the unique coverage, the most important
configuration is configuration 5 (BSB*MBE). These two conditions (BSB and MBE) are the
most frequent, and this has qualitative significance, indicating that affective drivers have more
importance than cognitive drivers for obtaining HCBI. In fact, the mainly cognitive drivers of
CBI, i.e., BSS and BI, only lead to HCBI in conjunction with a more affective driver (BSB or
MBE); however, the reverse does not occur. This result is consistent with Stokburger-Sauer et al.
(2012) who suggest a stronger role of affective antecedents; however, this is in contrast with the
findings of Bhattacharya and Sen (2003) who show a major influence of cognitive drivers. These
findings show different possible paths to HCBI, thereby enabling brand managers to make better
decisions on marketing investment allocation.
Regarding HRep, four different configurations were found. First, HCBI alone is sufficient
to achieve HRep, which thereby corroborates the predictive power of CBI on consumers’
willingness to expend additional effort to preserve and support a brand, which is recognized by
the marketing literature (e.g., Bhattacharya & Sen, 2003; He, Li & Harris, 2012; Tuškej et al.,
2013). However, HCBI is sufficient but not necessary for HRep. Thus, the second tenet is also
supported.
32
In fact, somewhat surprisingly, the most important solution is the combination of the BSS
and BI conditions, with a unique coverage of 0.04 (see Table 4). This solution leads to high
repurchase intentions without the presence of any affect-based driver of CBI. Thus, a brand can
achieve high repurchase without establishing HCBI if brand-self similarity and brand identity
simultaneously occur, i.e., for HRep a combination of only cognitive-based factors could be
sufficient.
Another important finding is that MBE alone is a sufficient condition for HRep, which
implies that a brand can create value through experiences (Cliffe & Motion, 2005) and that
brands can achieve greater purchase loyalty by appealing to consumers’ fondness for the brand
(Chaudhuri & Holbrook, 2001) and creating memorable experiences that emotionally connect
consumers to the brand (Schmitt, 2012). The construction of brand-related narratives and greater
self-referencing could be associated with the consumption of certain brands, as has been noted
by Stokburger-Sauer et al. (2012). In fact, narratives that are based on memorable brand
experiences could generate affectively charged memories and build stronger connections
between the consumer and the brand (Escalas, 2004).
As reported above, because HCBI is a necessary, but not sufficient, condition for VHRep,
the third tenet is also supported. The results show that although HCBI is sufficient for obtaining
HRep, it is not sufficient for VHRep. This is an interesting a new insight with practical
implications. A growing number of brands are repositioning themselves to fit into the
consumer’s lifestyle; however, the results show that there are limits to the benefits of positioning
brands as a means of self-expression. Therefore, brand managers could better allocate their
resources with the knowledge that additional investments in CBI, when they already achieve
high repurchase intentions, may not result in VHRep, i.e., the effect of CBI is not linear. In fact,
33
no solutions were found for low Rep and low CBI, which contrasts with the results that were
obtained for HRep and HCBI, i.e., the conditions for low values are not the mirror opposites of
the conditions for high values of the outcomes of interest. Thus, the last tenet is also supported,
which also validates the use of a fsQCA methodology in the marketing context.
6. Conclusion and managerial implications
Unlike most business research on CBI and Rep, which is based on symmetric thinking, this paper
uses asymmetric analytics and contributes to complexity theory. The main fsQCA results
indicate highly consistent configurational models that are sufficient for predicting high levels of
CBI and Rep. The results suggest that not only are there different combinations of conditions that
lead to the same outcomes but there are also some conditions that are not necessary to obtain
them, which has important implications for marketing managers. Thus, the application of set-
theoretic methods, such as fsQCA, which treat configurations as different types of cases, rather
than the conventional variable-based approach methods, constitutes an opportunity to advance
research contributions for theory building and practice.
The obtained results contribute to advancing brand identification theory in several ways.
First, different configurations of CBI drivers could be used to achieve high CBI, which indicates
that the presence of all of the antecedents that have been suggested in the literature are not
essential to achieve the outcome of interest. Second, affective-based drivers must be present to
achieve high CBI, which reinforces the importance of this category. Third, high CBI is a
sufficient condition for high Rep, but it is not necessary; in fact, either the combination of the
two cognitive-based drivers (BSS*BI) or the existence of memorable brand experiences are
sufficient to obtain high Rep.
34
Building on these insights, some managerial implications should be highlighted. Brand
managers can choose different paths to high CBI or high Rep and thereby focus their investments
and improve their efficiency and effectiveness. The consumer-brand interactions assume an
important role in CBI formation, and opportunities for socialization among consumers should be
promoted to enable positive emotional links between the consumer and the brand. In fact,
experiences are an increasingly important part of consumers’ identities and, MBE per se may be
sufficient to achieve high repurchase intentions. Thus, brands should create superior
consumption experiences and invest in developing brand communities to enhance both CBI and
Rep. Nevertheless, the joint presence of BI and BSS also leads to the same outcome. Thus, an
investment in communications that build both distinctiveness and prestige, and thereby enhance
brand identity and create a brand personality that matches consumers’ self-concept and fulfills
consumers need for consistency, could be sufficient to achieve high repurchase intentions. This
requires a deep understanding of the targeted customers’ lifestyles and preferences to
communicate and project adequate elements of identity.
We must acknowledge that this research is not without limitations. For practical reasons,
this study resorts to a cross-sectional survey that is based on answers that use a 7-point scale. As
noted by Woodside (2016), the use of 7-point scales leads to weaknesses in the quality of data, as
well as a lack of a dynamic assessment of the behavior of the respondents. The main analysis is
conducted on a single product (beer) and brand (Sagres), and it was performed on a student
sample from a single country (Portugal). The analysis of the behavior of the obtained models in a
subset of older students and in a sample of airline customers gives us some confidence regarding
the generalizability of the results; however, we acknowledge that a more diverse set of products
35
and brands, and a broader sample of respondents that would include other countries, would
provide additional robustness to the results.
To overcome some of these limitations, we suggest that future research should consider a
more diverse set of products and brands, and a broader sample of respondents. Moreover, we
strongly recommend a dynamic study that is based on interviewing a limited sample of
respondents over a period of time to capture not only intentions but also the actual behavior.
36
References
Aaker, J. L. (1997). Dimensions of brand personality. Journal of Marketing Research,
34 , 347-356.
Ahearne, M., Bhattacharya, C. B., & Gruen, T. (2005). Antecedents and consequences
of customer-company identification: Expanding the role of relationship
marketing. Journal of Applied Psychology, 90, 574–585.
Ali, M., Kan, K. A. S., & Sarstedt, M. (2016). Direct and configurational paths of
absorptive capacity and organizational innovation to successful organizational
performance. Journal of Business Research, 69, 5317-5323.
Atilgan, E., Aksoy, S., & Akinci, S. (2005). Determinants of the brand equity: A
verification approach in the beverage industry in Turkey. Marketing Intelligence
and Planning, 23, 237-248.
Baek, T. H., Kim, J., & Yu, J. H. (2010). The differential roles of brand credibility and
brand prestige in consumer brand choice. Psychology and Marketing, 27, 662–
678.
Bergami, M., & Bagozzi, R. P. (2000). Self-categorization, affective commitment, and
group self-esteem as distinct aspects of social identity in the organization.
British Journal of Social Psychology, 39, 555-577.
Bhattacharya, C. B. & Sen, S. (2003). Consumer-company identification: A framework
for understanding consumers’ relationships with companies. Journal of
Marketing, 67, 76–88.
Buil, I., Chernatony, L., & Martínez, E. (2013). Examining the role of advertising and
sales promotions in brand equity creation. Journal of Business Research, 66,
115-122.
Chai, J. C. Y., Malhotra, N. K., & Alpert, F. (2015). A two-dimensional model of trust–
value–loyalty in service relationships, Journal of Retailing and Consumer
Services, 26, 23–31.
Chaudhuri, A. & Holbrook, M. B. (2001). The chain of effects from brand trust and
brand affect to brand performance: The role of brand loyalty. Journal of
Marketing, 65, 81–93.
Chernev, A., Hamilton, R., & Gal, D. (2011). Competing for consumer identity: Limits
to self-expression and the perils of lifestyle branding. Journal of Marketing, 75,
66-82.
Cliffe, S. J. & Motion, J. (2005). Building contemporary brands: A sponsorship-based
37
strategy. Journal of Business Research, 58, 1068–1077.
Cobb-Walgren, C. J., Ruble, C. A., & Donthu, N. (1995). Brand equity, brand
preference, and purchase intent. Journal of Advertising, 24, 25-40.
Elbedweihy, A., Jayawardhena, C., Elsharnouby, M. H., & Elsharnouby, T. H. (2016).
Customer relationship building: The role of brand attractiveness and consumer-
brand identification. Journal of Business Research, 69, 2901-2910.
Emmenegger, P., Schraff, D., & Walter, A. (2014). QCA, the truth table analysis and
large-N survey data: The benefits of calibration and the importance of robustness
tests. Compass Working Paper 2014-79, available at
http://www.compasss.org/wpseries/ EmmeneggerSchraffWalter2014.pdf
(Accessed 24.03.2016)
Escalas, J. (2004). Narrative processing: Building consumer connections to brands.
Journal of Consumer Psychology, 14, 168–180.
Fiss, P. C. (2007). A set-theoric approach to organizational configurations. Academy of
Management Review, 32, 1190-1198.
Fiss, P. C. (2011). Building better causal theories: A fuzzy set approach to typologies in
organization research. Academy of Management Journal, 54, 393-420.
Greckhamer, T., Misangyi, V. F., & Fiss, P. C. (2013). The Two QCAs: From a Small-
N to a Large-N Set Theoretic Approach. In P. C. Fiss, B. Cambré, & A. Marx
(Eds.), Configurational Theory and Methods in Organizational Research (pp.
49-75). Emerald Group Publishing Limited.
He, H., Li, Y., & Harris, L. (2012). Social identity perspective on brand loyalty. Journal
of Business Research, 65, 648-657.
Ho, J., Plewa, C., & Lu, V. N. (2016). Examining strategic orientation complementarity
using multiple regression analysis and fuzzy set QCA. Journal of Business
Research, 69, 2199-2205.
Kuenzel, S. & Halliday, S. V (2008). Investigating antecedents and consequences of
brand identification. Journal of Product and Brand Management, 17, 293–304.
Kuenzel, S. & Halliday, S. V. (2010). The chain of effects from reputation and brand
personality congruence to brand loyalty: The role of brand identification.
Journal of Targeting, Measurement and Analysis for Marketing, 18, 167–176.
Lam, S. K., Ahearne, M., Mullins, R., Hayati, B., & Schillewaert, N. (2013). Exploring
the dynamics of antecedents to consumer–brand identification with a new brand.
Journal of the Academy of Marketing Science, 41, 234–252.
38
Mazodier, M. & Merunka, D. (2012). Achieving brand loyalty through sponsorship:
The role of fit and self-congruity. Journal of the Academy of Marketing Science,
40, 807–820.
Navarro, S., Llinares, C., & Garzon, D. (2016). Exploring the relationship between co-
creation and satisfaction using QCA. Journal of Business Research, 69, 1336-
1339.
Nyadzayo, M. & Khajehzadeh, S. (2016). The antecedents of customer loyalty: A
moderated mediation model of customer relationship management quality and
brand image. Journal of Retailing and Consumer and Consumer Services, 30,
262-270.
O’Cass, A. & Frost, H. (2002). Status brands: Examining the effects of non-product-
related brand associations on status and conspicuous consumption. Journal of
Product and Brand Management, 11, 67–88.
Ordanini, A., Parasuraman, A., & Rubera, G. (2014). When the recipe is more important
than the ingredients a Qualitative Comparative Analysis (QCA) of service
innovation configurations. Journal of Service Research, 17, 134-149.
Park, C. W., MacInnis, D. J., Priester, J., Eisingerich, A. B., & Iacobucci, D. (2010).
Brand attachment and brand attitude strength: Conceptual and empirical
differentiation of two critical brand equity drivers. Journal of Marketing, 74, 1-
17.
Raghunathan, R., Naylor, R. W., & Hoyer, W. D. (2006). The unhealthy = tasty
intuition and its effects on taste inferences, enjoyment, and choice of food
products. Journal of Marketing, 70, 170-184.
Ragin, C. C. (2008). Redesigning social inquiry: Fuzzy sets and beyond. Chicago:
University of Chicago Press.
Ragin, C. C. (2009). Qualitative Comparative Analysis Using Fuzzy Sets (fsQCA). In
C. C. Ragin, & B. Rihoux (Eds.), Configurational Comparative Methods:
Qualitative Comparative Analysis (QCA) and Related Techniques (pp. 87-122).
Los Angeles: Sage.
Ragin, C. C., & Fiss, P. C. (2008). Net effects analysis versus configurational analysis:
An empirical demonstration. In C. C. Ragin (Eds.), Redesigning social inquiry:
Fuzzy sets and beyond (pp. 190-212). Chicago: University of Chicago Press.
Rihoux, B. (2006). Qualitative comparative analysis (QCA) and related systematic
comparative methods recent advances and remaining challenges for social
science research. International Sociology, 21, 679-706.
39
Rihoux, B., & Marx, A. (2013). QCA, 25 years after “The Comparative Method”:
Mapping, Challenges, and Innovations – Mini-Symposium. Political Research
Quarterly, 66, 167-235.
Ryan, J. C., & Berbegal-Mirabent, J. (2016). Motivational recipes and research
performance: A fuzzy set analysis of the motivational profile of high performing
research scientists. Journal of Business Research, 69, 5299-5304.
Schmitt, B. (2012). The consumer psychology of brands. Journal of Consumer
Psychology, 22, 7–17.
Schneider, M. R., & Eggert, A. (2014). Embracing complex causality with the QCA
method: An invitation. Journal of Business Market Management, 7, 312-328.
Schneider, M. R., Schulze-Bentrop, C., & Paunescu, M. (2010). Mapping the
institutional capital of high-tech firms: A fuzzy-set analysis of capitalist variety
and export performance. Journal of International Business Studies, 41, 246-266.
Schneider, C. Q., & Wageman, C. (2010). Standards of Good Practice in Qualitative
Comparative Analysis (QCA) and Fuzzy-Sets. Comparative Sociology, 9, 397-
418.
Sirgy, M. J., Lee, D-J., Johar, J. S., & Tidwell, J. (2008). Effect of self-congruity with
sponsorship on brand loyalty. Journal of Business Research, 61, 1091–1097.
Sirgy, M. J. (1985). Using self-congruity and ideal congruity to predict purchase
motivation. Journal of Business Research, 13, 195–206.
Skaaning, S. E. (2011). Assessing the robustness of crisp-set and fuzzy-set QCA results.
Sociological Methods & Research, 40, 391-408.
So, K., King, C., Hudson, S., & Meng, F. (2017). The missing link in building customer
brand identification: The role of brand attractiveness. Tourism Management, 59,
640-651.
Steenkamp, J-B., Batra, R., & Alden, D. L. (2003). How perceived brand globalness
creates brand value. Journal of International Business Studies, 34, 53–65.
Stokburger-Sauer, N., Ratneshwar, S., & Sen, S. (2012). Drivers of consumer–brand
identification. International Journal of Research in Marketing, 29, 406–418.
Thompson, C. J., Rindfleisch, A., & Arsel, Z. (2006). Emotional branding and the
strategic value of the doppelgänger brand image. Journal of Marketing, 70, 50–
64.
40
Torres, P. M., Augusto, M. G., & Lisboa, J. V. (2015). Determining the causal
relationships that affect consumer-based brand equity. Marketing Intelligence
and Planning, 33, 944–956.
Tuškej, U., Golob, U., & Podnar, K. (2013). The role of consumer-brand identification
in building brand relationships. Journal of Business Research, 66, 53-59.
Vis, B. (2012). The comparative advantages of fsQCA and regression analysis for
moderately large-N analyses. Sociological Methods & Research, 41, 168-198.
Wolter, J. S., Brach, S., Cronin Jr., J. J., & Bonn, M. (2016). Symbolic drivers of
consumer-brand identification and disidentification. Journal of Business
Research, 69, 785-793.
Woodside, A. G. (2012). Proposing a new logic for data analysis in marketing and
consumer behavior: Case study research of large-N survey data for estimating
algorithms that accurately profile X (extremely high-use) consumers. Journal of
Global Scholars of Marketing Science, 22, 277-289.
Woodside, A. G. (2013). Moving beyond multiple regression analysis to algorithms:
Calling for the adoption of a paradigm shift from symmetric to asymmetric
thinking in data analysis and crafting theory. Journal of Business Research, 66,
463-472.
Woodside, A. G. (2014). Embrace*perform*model: Complexity theory, contrarian cases
analysis, and multiple realities. Journal of Business Research, 67, 2495-2503.
Woodside, A. G. (2016). The good practices manifesto: Overcoming bad practices
pervasive in current research in business. Journal of Business Research, 69, 365-
381.
Wu, P. L., Yeh, S. S., & Woodside, A. G. (2014). Applying complexity theory to
deepen service dominant logic: Configural analysis of customer experience-and-
outcome assessments of professional services for personal transformations.
Journal of Business Research, 67, 1647-1670.
Wyllie, J., Carlson, J., & Rosenberger, P. (2014). Examining the influence of different
levels of sexual-stimuli intensity by gender on advertising effectiveness. Journal
of Marketing Management, 30, 697–718.
Xu, B., Zheng, H., Xu, Y., & Wang, T. (2016). Configurational paths to sponsor
satisfaction in crowdfunding. Journal of Business Research, 69, 915-927.
Yeh, C-H., Wang, Y-S., & Yieh, K. (2016). Predicting smartphone brand loyalty:
Consumer value and consumer-brand identification perspectives. International
Journal of Information Management, 36, 245-257.
41
Yoo, B., Donthu, N., & Lee, S. (2000). An examination of selected marketing mix
elements and brand equity. Journal of the Academy of Marketing Science, 28,
195-211.
Zawrun, L., Linz, D., Metzger, M., & Kunkel, D. (2006). Effects of showing risk in beer
commercials to young drinkers. Journal of Broadcasting and Electronic Media,
50, 52-77.
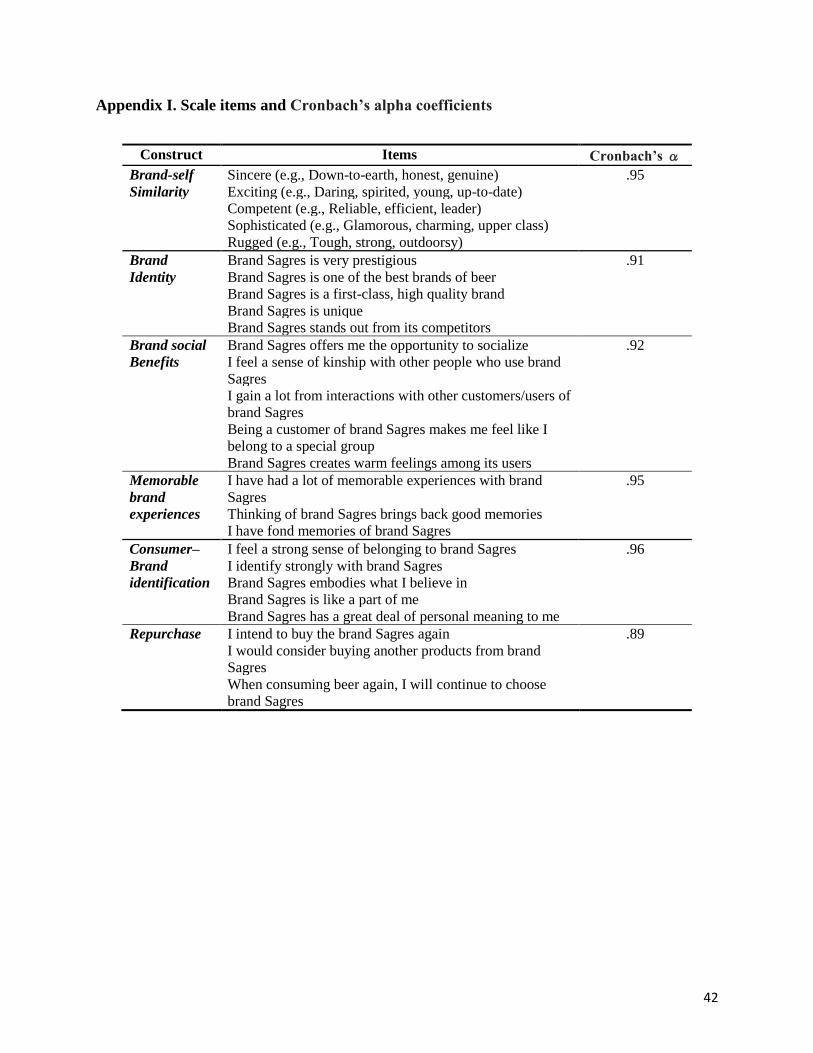
42
Appendix I. Scale items and Cronbach’s alpha coefficients
Construct Items Cronbach’s α
Brand-self Sincere (e.g., Down-to-earth, honest, genuine) .95
Similarity Exciting (e.g., Daring, spirited, young, up-to-date)
Competent (e.g., Reliable, efficient, leader)
Sophisticated (e.g., Glamorous, charming, upper class)
Rugged (e.g., Tough, strong, outdoorsy)
Brand Brand Sagres is very prestigious .91
Identity Brand Sagres is one of the best brands of beer
Brand Sagres is a first-class, high quality brand
Brand Sagres is unique
Brand Sagres stands out from its competitors
Brand social Brand Sagres offers me the opportunity to socialize .92
Benefits I feel a sense of kinship with other people who use brand
Sagres
I gain a lot from interactions with other customers/users of
brand Sagres
Being a customer of brand Sagres makes me feel like I
belong to a special group
Brand Sagres creates warm feelings among its users
Memorable
brand
I have had a lot of memorable experiences with brand
Sagres
.95
experiences Thinking of brand Sagres brings back good memories
I have fond memories of brand Sagres
Consumer– I feel a strong sense of belonging to brand Sagres .96
Brand I identify strongly with brand Sagres
identification Brand Sagres embodies what I believe in
Brand Sagres is like a part of me
Brand Sagres has a great deal of personal meaning to me
Repurchase I intend to buy the brand Sagres again .89
I would consider buying another products from brand
Sagres
When consuming beer again, I will continue to choose
brand Sagres
43
Appendix II. Robustness analysis
The robustness analysis was inspired by Skaaning (2011). We analyze how the configurations
that we obtain are affected by different choices of the calibration thresholds, frequency threshold
and consistency threshold. This robustness analysis was made only to the configurations that
were defined to achieve HRep and HCBI because they are the main models of our study. The
results, which are presented as changes in relation to the original configurations that are shown in
Tables 3 and 4, are summarized in Table II.1.
Changing the calibration thresholds
In Subsection 3.2.3 we explain the original calibration that we used to reach the results that are
presented in Tables 3 and 4: we used the direct calibration method, with the 90th, 10th and 50th
percentiles of the values of the original distribution of each variable being used to define the full
membership threshold, non-membership threshold, and the crossover point, respectively. In our
robustness analysis, we considered different percentiles in the definition of the thresholds:
Full membership threshold Non-membership threshold Cross-over point
Original calibration 90th percentile 10th percentile 50th percentile
Alternative 1 95th percentile 5th percentile 50th percentile
Alternative 2 85th percentile 15th percentile 50th percentile
The idea of these alternative thresholds is to keep the crossover point at the median (it
seems the most reasonable choice), and considering full membership and non-membership
thresholds to be further away from the median than the original ones (alternative 1) and closer to
the median than the original ones (alternative 2).
44
First, we changed the calibration of only one variable at a time. This was done both for
the variable that was being explained and for the antecedent variables, for the models in Tables 3
and 4. In all of the cases the results were unaltered, which means that these alternative
calibrations did not change the results.
Then, we changed all of the variables at the same time according to the thresholds that
corresponded to alternatives 1 and 2. For the HRep model that is presented in Table 4, there was
no change for any of the alternative calibrations. The HCBI model was not altered when the
calibration of all of the variables were changed according to alternative 2; however, it was
altered when changes were made according to alternative 1: the three configurations that involve
MBE were replaced by a single configuration that consisted only of MBE – that is, MBE no
longer needs another antecedent to lead to HCBI, but it alone becomes sufficient to reach HCBI.
We conclude that the results in Tables 3 and 4 are quite robust to changes in calibration
because there is only one case in which there is a change, and the new model that we obtain is
not very different from the original one.
Changing the frequency thresholds
As we explain above, the consistency thresholds were initially set to 6. We started by changing
these thresholds for alternative values that were close to the original: we chose 4 (a lower value
seemed unreasonably small) and 9 (a 50% increase). In the case of the HCBI model, these
alternative thresholds do not change the configurations that were included in the analysis, thus
the results were unchanged. In the case of HRep, the solution changes only for a frequency
threshold of 4, as is shown in Table II.1. However, this change is quite small: a new
45
configuration appears in the model, and the intersection of BSS and BSB is now sufficient for
HRep.
We then tried a more substantial increase in this threshold. In choosing a new value for
this threshold we aimed to strike a balance between a sizeable increase in the threshold and
keeping a reasonable number of configurations with a frequency that was above the threshold.
Some authors define a threshold that captures approximately 80% of the cases (see, for example
Ragin & Fiss, 2008). When it is applied to the HRep model, this rule leads to a threshold of 18,
keeping approximately 79% of the cases and 10 configurations above the threshold. The same
threshold was applied to the HCBI model, keeping approximately 94% of the cases and 12
configurations above the threshold. These new thresholds caused some changes in the results, as
is shown in Table II.1. In the case of HCBI, the core conditions are not altered (the parsimonious
solution is not changed); however, new peripheral conditions appear in four out of the five
configurations. In the case of HRep, one of the original configurations disappears, and new
peripheral conditions appear in two of the other three configurations.
Changing the consistency thresholds
For the consistency threshold, we looked for gaps in the distribution of the consistency values.
For consistency values that were lower than 0.8, we considered only gaps above 0.75: as Ragin
notes, “…values below 0.75 … indicate substantial inconsistency…” (Ragin, 2008, p. 144). We
chose an alternative threshold of 0.77 (gap between 0.762 and 0.788 for HCBI and gap between
0.749 and 0.788 for HRep). For values that were larger than 0.8, we could find no sizeable gaps
for HRep, and, for HCBI, a gap that existed at approximately 0.9 left few configurations above

46
the gap. Thus, we ended up choosing a 0.83 threshold, which corresponds to a small gap (0.818-
0.832 for HCBI and 0.827-0.835 for HRep).
For HCBI, the new configurations that were obtained for the 0.77 and 0.83 thresholds are
not very different from the original: for the 0.77 threshold, the three configurations that involved
MBE were replaced by a single configuration that only consist of MBE; for the 0.83 threshold,
the configuration that involves the intersection of BI and BSB no longer appears.
For HRep, the 0.77 threshold leads to replacing the two configurations that involve BI by
a single one, consists only of BI: BI is now a sufficient condition, and it does not require another
condition to be present. The 0.83 threshold replaces the configuration that consists of MBE by
two new ones: the intersection of MBE and BI and the intersection of MBE and BSB; MBE is no
longer a sufficient condition; however, it requires that either BI or BSB also occur.
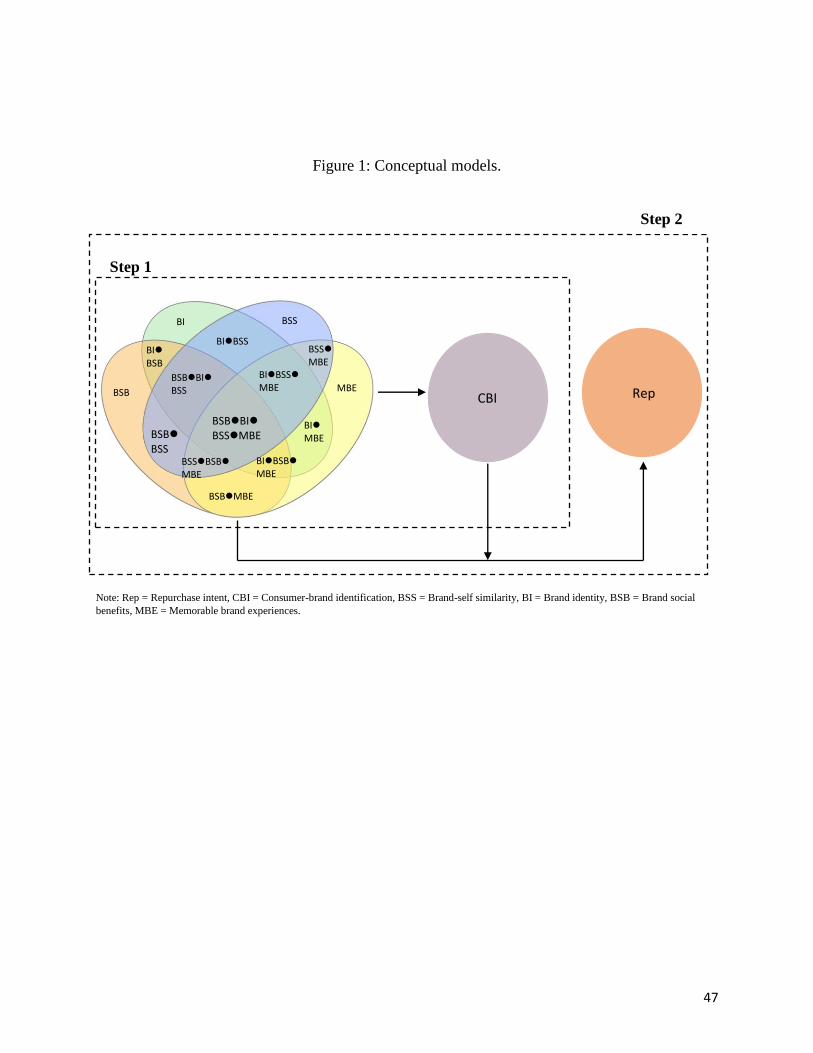
47
Figure 1: Conceptual models.
Note: Rep = Repurchase intent, CBI = Consumer-brand identification, BSS = Brand-self similarity, BI = Brand identity, BSB = Brand social
benefits, MBE = Memorable brand experiences.
Step 1
BSBBI BSSMBE
BSB
BI
BSS
MBE
CBI
BIBSS
BSBMBE
BSBBSS
BSBBI BSS
BIBSS MBE
BSS MBE
BI MBE
BI BSB
BIBSB MBE
BSSBSB MBE
Rep
Step 2
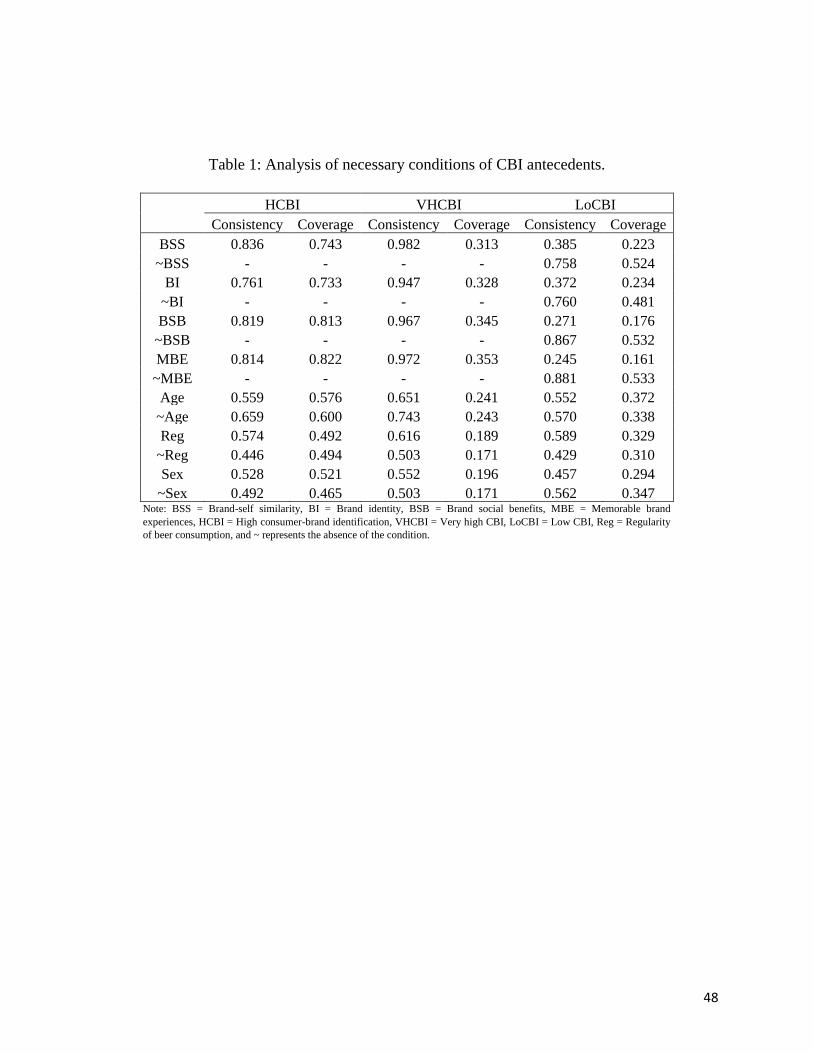
48
Table 1: Analysis of necessary conditions of CBI antecedents.
HCBI VHCBI LoCBI
Consistency Coverage Consistency Coverage Consistency Coverage
BSS 0.836 0.743 0.982 0.313 0.385 0.223
~BSS - - - - 0.758 0.524
BI 0.761 0.733 0.947 0.328 0.372 0.234
~BI - - - - 0.760 0.481
BSB 0.819 0.813 0.967 0.345 0.271 0.176
~BSB - - - - 0.867 0.532
MBE 0.814 0.822 0.972 0.353 0.245 0.161
~MBE - - - - 0.881 0.533
Age 0.559 0.576 0.651 0.241 0.552 0.372
~Age 0.659 0.600 0.743 0.243 0.570 0.338
Reg 0.574 0.492 0.616 0.189 0.589 0.329
~Reg 0.446 0.494 0.503 0.171 0.429 0.310
Sex 0.528 0.521 0.552 0.196 0.457 0.294
~Sex 0.492 0.465 0.503 0.171 0.562 0.347 Note: BSS = Brand-self similarity, BI = Brand identity, BSB = Brand social benefits, MBE = Memorable brand
experiences, HCBI = High consumer-brand identification, VHCBI = Very high CBI, LoCBI = Low CBI, Reg = Regularity
of beer consumption, and ~ represents the absence of the condition.
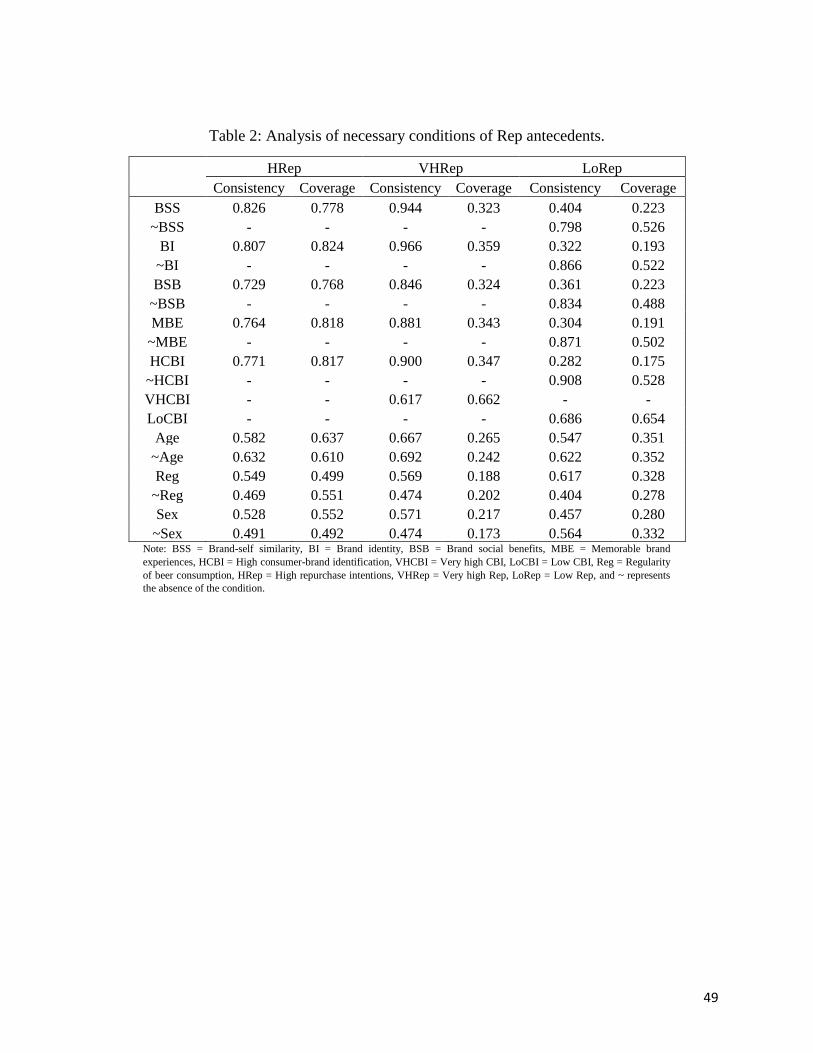
49
Table 2: Analysis of necessary conditions of Rep antecedents.
HRep VHRep LoRep
Consistency Coverage Consistency Coverage Consistency Coverage
BSS 0.826 0.778 0.944 0.323 0.404 0.223
~BSS - - - - 0.798 0.526
BI 0.807 0.824 0.966 0.359 0.322 0.193
~BI - - - - 0.866 0.522
BSB 0.729 0.768 0.846 0.324 0.361 0.223
~BSB - - - - 0.834 0.488
MBE 0.764 0.818 0.881 0.343 0.304 0.191
~MBE - - - - 0.871 0.502
HCBI 0.771 0.817 0.900 0.347 0.282 0.175
~HCBI - - - - 0.908 0.528
VHCBI - - 0.617 0.662 - -
LoCBI - - - - 0.686 0.654
Age 0.582 0.637 0.667 0.265 0.547 0.351
~Age 0.632 0.610 0.692 0.242 0.622 0.352
Reg 0.549 0.499 0.569 0.188 0.617 0.328
~Reg 0.469 0.551 0.474 0.202 0.404 0.278
Sex 0.528 0.552 0.571 0.217 0.457 0.280
~Sex 0.491 0.492 0.474 0.173 0.564 0.332 Note: BSS = Brand-self similarity, BI = Brand identity, BSB = Brand social benefits, MBE = Memorable brand
experiences, HCBI = High consumer-brand identification, VHCBI = Very high CBI, LoCBI = Low CBI, Reg = Regularity
of beer consumption, HRep = High repurchase intentions, VHRep = Very high Rep, LoRep = Low Rep, and ~ represents
the absence of the condition.
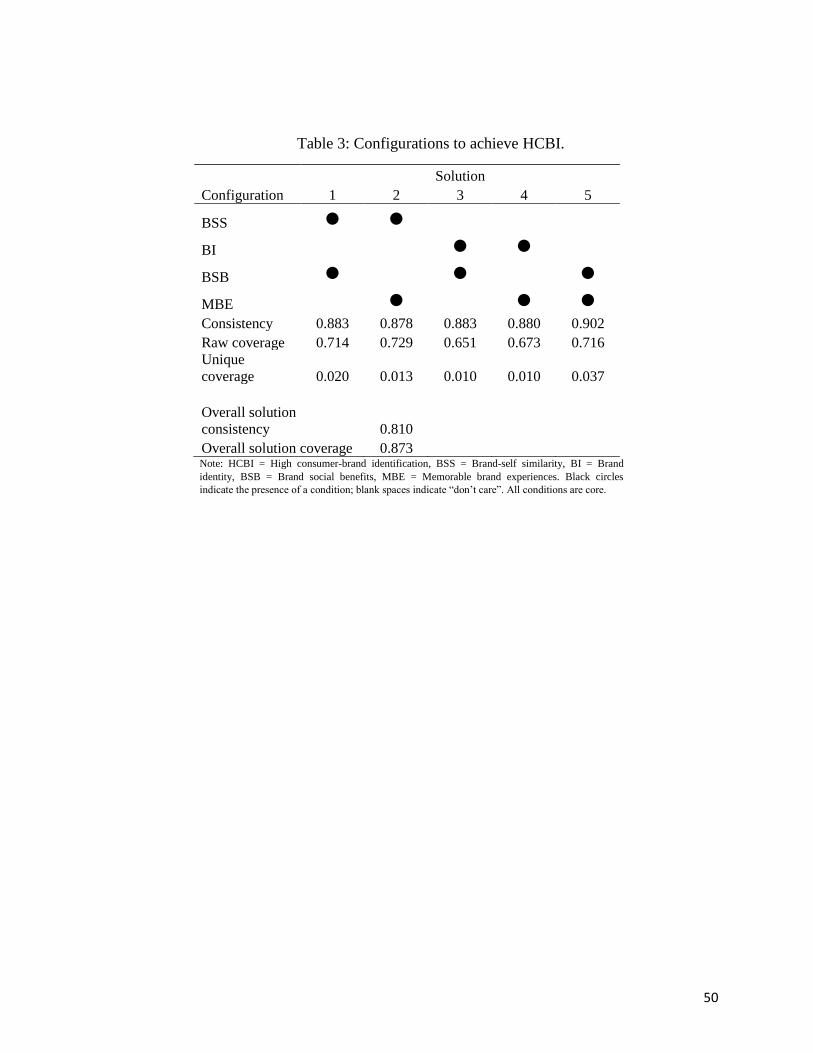
50
Table 3: Configurations to achieve HCBI.
Solution
Configuration 1 2 3 4 5
BSS
BI
BSB
MBE
Consistency 0.883 0.878 0.883 0.880 0.902
Raw coverage 0.714 0.729 0.651 0.673 0.716
Unique
coverage 0.020 0.013 0.010 0.010 0.037
Overall solution
consistency 0.810
Overall solution coverage 0.873
Note: HCBI = High consumer-brand identification, BSS = Brand-self similarity, BI = Brand
identity, BSB = Brand social benefits, MBE = Memorable brand experiences. Black circles
indicate the presence of a condition; blank spaces indicate “don’t care”. All conditions are core.
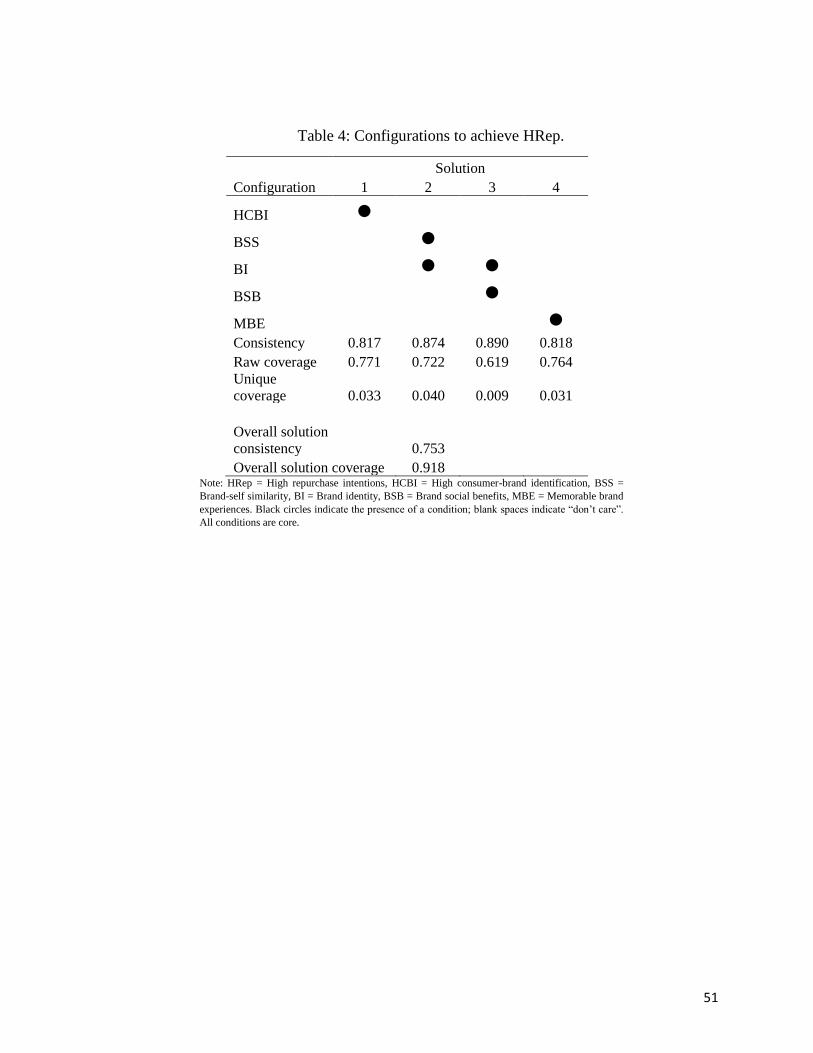
51
Table 4: Configurations to achieve HRep.
Solution
Configuration 1 2 3 4
HCBI
BSS
BI
BSB
MBE
Consistency 0.817 0.874 0.890 0.818
Raw coverage 0.771 0.722 0.619 0.764
Unique
coverage 0.033 0.040 0.009 0.031
Overall solution
consistency 0.753
Overall solution coverage 0.918
Note: HRep = High repurchase intentions, HCBI = High consumer-brand identification, BSS =
Brand-self similarity, BI = Brand identity, BSB = Brand social benefits, MBE = Memorable brand
experiences. Black circles indicate the presence of a condition; blank spaces indicate “don’t care”.
All conditions are core.
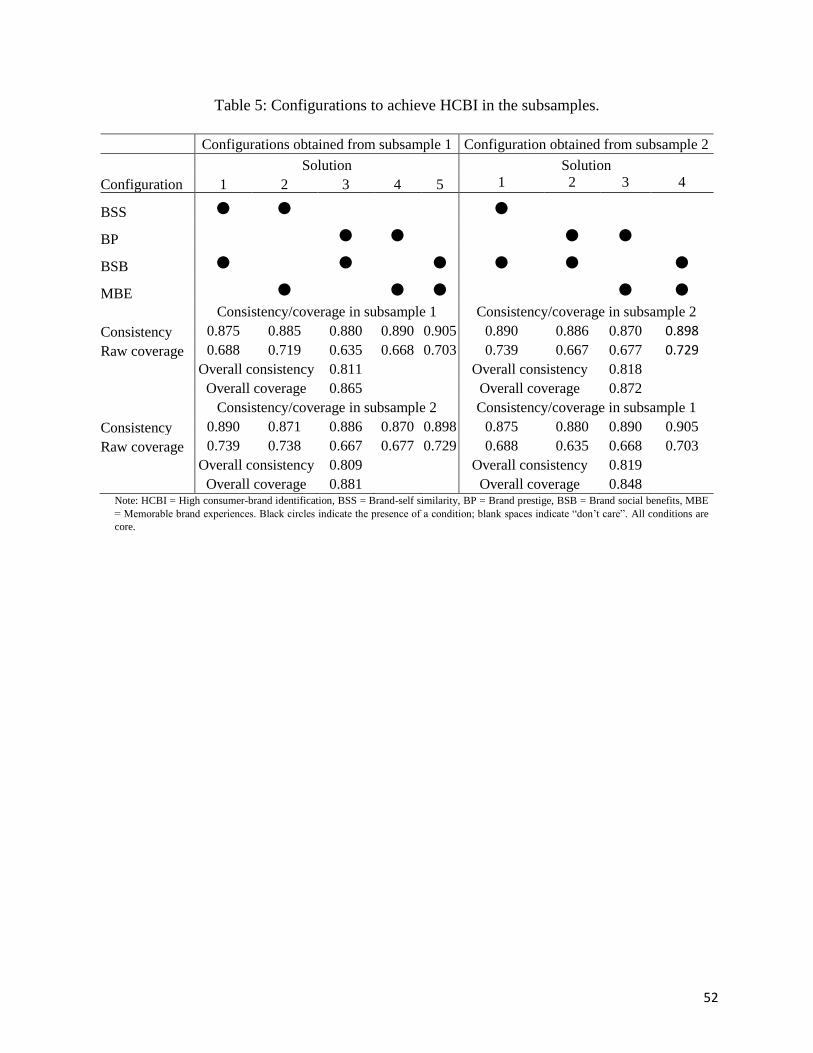
52
Table 5: Configurations to achieve HCBI in the subsamples.
Configurations obtained from subsample 1 Configuration obtained from subsample 2
Solution Solution
Configuration 1 2 3 4 5 1 2 3 4
BSS
BP
BSB
MBE
Consistency/coverage in subsample 1 Consistency/coverage in subsample 2
Consistency 0.875 0.885 0.880 0.890 0.905 0.890 0.886 0.870 0.898
Raw coverage 0.688 0.719 0.635 0.668 0.703 0.739 0.667 0.677 0.729
Overall consistency 0.811 Overall consistency 0.818
Overall coverage 0.865 Overall coverage 0.872
Consistency/coverage in subsample 2 Consistency/coverage in subsample 1
Consistency 0.890 0.871 0.886 0.870 0.898 0.875 0.880 0.890 0.905
Raw coverage 0.739 0.738 0.667 0.677 0.729 0.688 0.635 0.668 0.703
Overall consistency 0.809 Overall consistency 0.819
Overall coverage 0.881 Overall coverage 0.848 Note: HCBI = High consumer-brand identification, BSS = Brand-self similarity, BP = Brand prestige, BSB = Brand social benefits, MBE
= Memorable brand experiences. Black circles indicate the presence of a condition; blank spaces indicate “don’t care”. All conditions are
core.
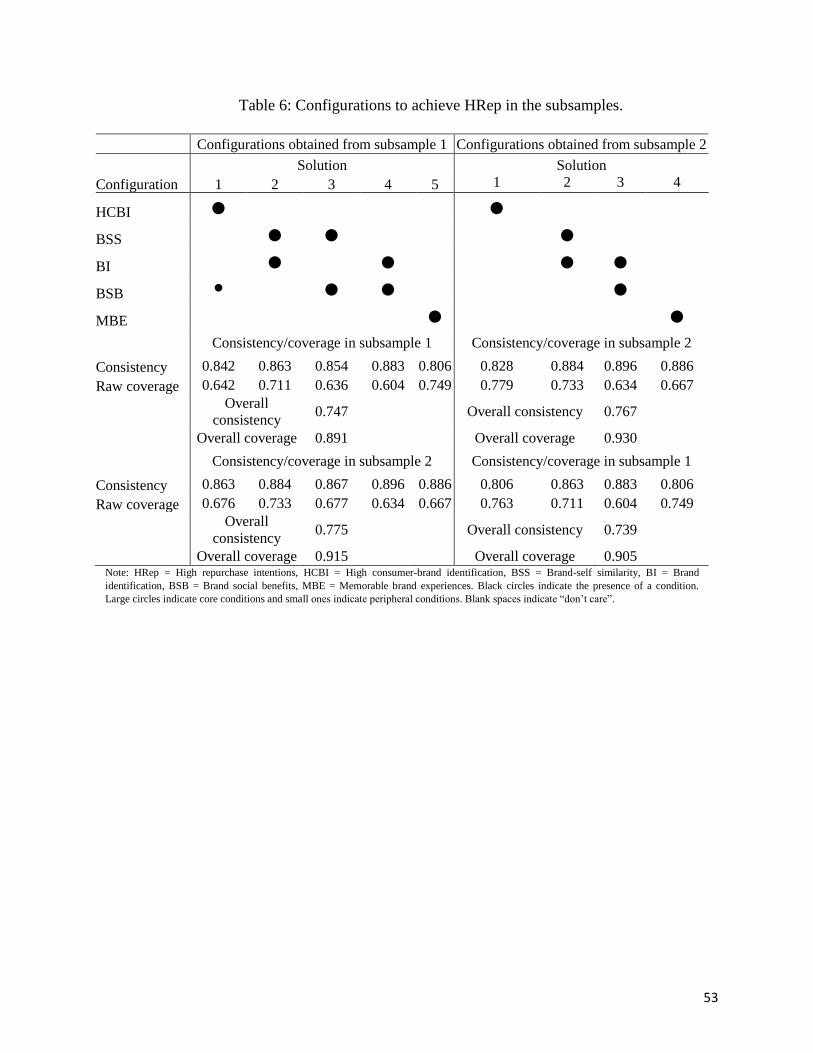
53
Table 6: Configurations to achieve HRep in the subsamples.
Configurations obtained from subsample 1 Configurations obtained from subsample 2
Solution Solution
Configuration 1 2 3 4 5 1 2 3 4
HCBI
BSS
BI
BSB
MBE
Consistency/coverage in subsample 1 Consistency/coverage in subsample 2
Consistency 0.842 0.863 0.854 0.883 0.806 0.828 0.884 0.896 0.886
Raw coverage 0.642 0.711 0.636 0.604 0.749 0.779 0.733 0.634 0.667
Overall
consistency 0.747 Overall consistency 0.767
Overall coverage 0.891 Overall coverage 0.930
Consistency/coverage in subsample 2 Consistency/coverage in subsample 1
Consistency 0.863 0.884 0.867 0.896 0.886 0.806 0.863 0.883 0.806
Raw coverage 0.676 0.733 0.677 0.634 0.667 0.763 0.711 0.604 0.749
Overall
consistency 0.775 Overall consistency 0.739
Overall coverage 0.915 Overall coverage 0.905 Note: HRep = High repurchase intentions, HCBI = High consumer-brand identification, BSS = Brand-self similarity, BI = Brand
identification, BSB = Brand social benefits, MBE = Memorable brand experiences. Black circles indicate the presence of a condition.
Large circles indicate core conditions and small ones indicate peripheral conditions. Blank spaces indicate “don’t care”.
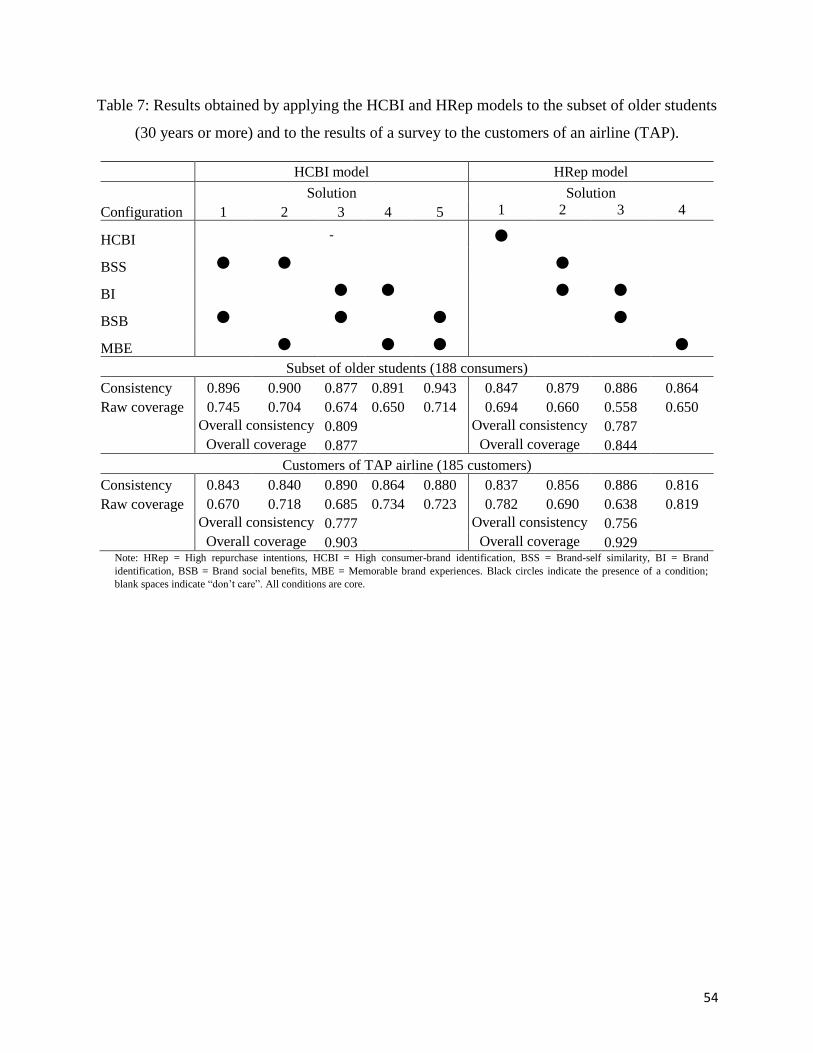
54
Table 7: Results obtained by applying the HCBI and HRep models to the subset of older students
(30 years or more) and to the results of a survey to the customers of an airline (TAP).
HCBI model HRep model
Solution Solution
Configuration 1 2 3 4 5 1 2 3 4
HCBI -
BSS
BI
BSB
MBE
Subset of older students (188 consumers)
Consistency 0.896 0.900 0.877 0.891 0.943 0.847 0.879 0.886 0.864
Raw coverage 0.745 0.704 0.674 0.650 0.714 0.694 0.660 0.558 0.650 Overall consistency 0.809 Overall consistency 0.787
Overall coverage 0.877 Overall coverage 0.844
Customers of TAP airline (185 customers)
Consistency 0.843 0.840 0.890 0.864 0.880 0.837 0.856 0.886 0.816
Raw coverage 0.670 0.718 0.685 0.734 0.723 0.782 0.690 0.638 0.819
Overall consistency 0.777 Overall consistency 0.756
Overall coverage 0.903 Overall coverage 0.929 Note: HRep = High repurchase intentions, HCBI = High consumer-brand identification, BSS = Brand-self similarity, BI = Brand
identification, BSB = Brand social benefits, MBE = Memorable brand experiences. Black circles indicate the presence of a condition;
blank spaces indicate “don’t care”. All conditions are core.
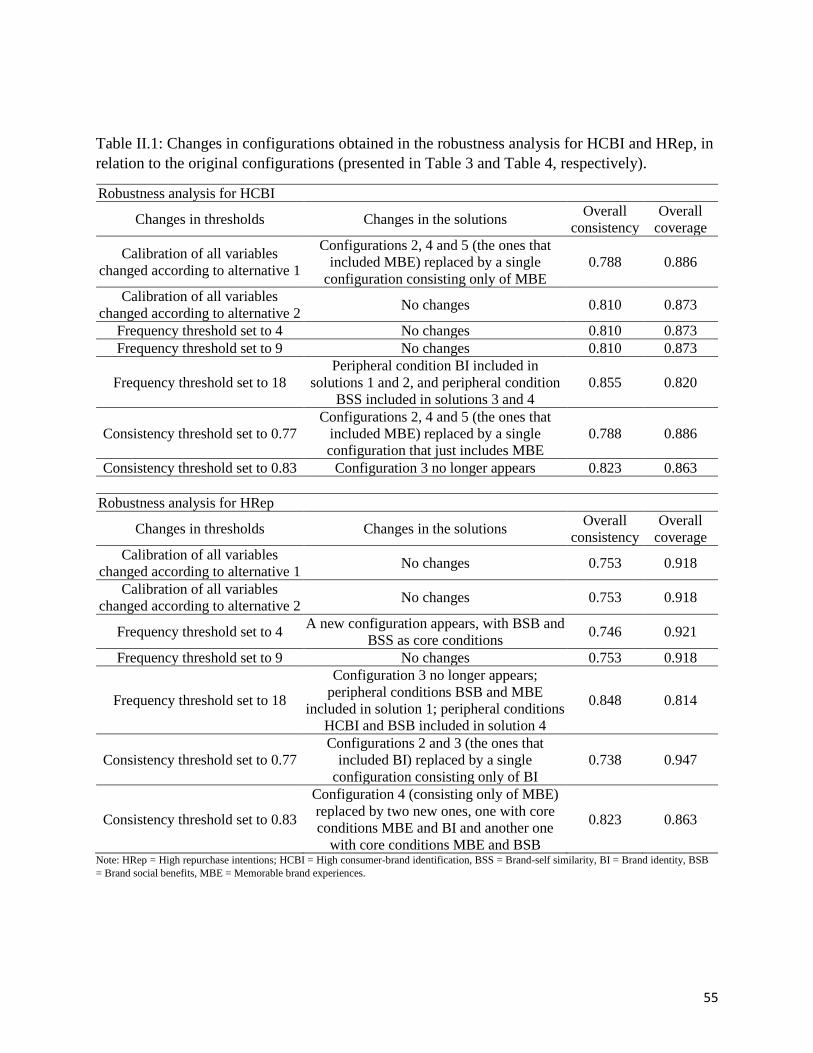
55
Table II.1: Changes in configurations obtained in the robustness analysis for HCBI and HRep, in
relation to the original configurations (presented in Table 3 and Table 4, respectively).
Robustness analysis for HCBI
Changes in thresholds Changes in the solutions Overall
consistency
Overall
coverage
Calibration of all variables
changed according to alternative 1
Configurations 2, 4 and 5 (the ones that
included MBE) replaced by a single
configuration consisting only of MBE
0.788 0.886
Calibration of all variables
changed according to alternative 2 No changes 0.810 0.873
Frequency threshold set to 4 No changes 0.810 0.873
Frequency threshold set to 9 No changes 0.810 0.873
Frequency threshold set to 18
Peripheral condition BI included in
solutions 1 and 2, and peripheral condition
BSS included in solutions 3 and 4
0.855 0.820
Consistency threshold set to 0.77
Configurations 2, 4 and 5 (the ones that
included MBE) replaced by a single
configuration that just includes MBE
0.788 0.886
Consistency threshold set to 0.83 Configuration 3 no longer appears 0.823 0.863
Robustness analysis for HRep
Changes in thresholds Changes in the solutions Overall
consistency
Overall
coverage
Calibration of all variables
changed according to alternative 1 No changes 0.753 0.918
Calibration of all variables
changed according to alternative 2 No changes 0.753 0.918
Frequency threshold set to 4 A new configuration appears, with BSB and
BSS as core conditions 0.746 0.921
Frequency threshold set to 9 No changes 0.753 0.918
Frequency threshold set to 18
Configuration 3 no longer appears;
peripheral conditions BSB and MBE
included in solution 1; peripheral conditions
HCBI and BSB included in solution 4
0.848 0.814
Consistency threshold set to 0.77
Configurations 2 and 3 (the ones that
included BI) replaced by a single
configuration consisting only of BI
0.738 0.947
Consistency threshold set to 0.83
Configuration 4 (consisting only of MBE)
replaced by two new ones, one with core
conditions MBE and BI and another one
with core conditions MBE and BSB
0.823 0.863
Note: HRep = High repurchase intentions; HCBI = High consumer-brand identification, BSS = Brand-self similarity, BI = Brand identity, BSB
= Brand social benefits, MBE = Memorable brand experiences.


![ISO/IEC MPEG-4 High-Definition Scalable Advanced Audio Coding*€¦ · the consumer with a media experience of extremely high fidelity [10], as it is frequently associated with the](https://img.pdfslide.tips/doc/110x75/5f2b68a3865d8f17207e58a9/isoiec-mpeg-4-high-definition-scalable-advanced-audio-coding-the-consumer-with.jpg)